61
The Social Dimension of Rural Statistics Publication prepared in the framework of the Global Strategy to improve Agricultural and Rural Statistics January 2017
The Social Dimension
of Rural Statistics
Publication prepared in the framework of the Global Strategy to improve Agricultural and Rural Statistics
January 2017

The Social Dimension
of Rural Statistics
Table of Contents
Acknowledgements………………………………………………………………………………………………... 4 Introduction................................................................................................................ 5 1. Conceptual aspects................................................................................................. 7 1.1. Theories, definitions and measurements of poverty……………………………………. 7 1.2. The specificities of rural poverty…………………………………………………................. 12 1.3. Lessons learned from the experience of public policies for rural development and poverty reduction……………………………………………………………. 16 1.4. Synthesis ………………………………………………………………………………………............... 21 2. From concepts to practice – indicators, data requirements and sources………….. 22 3. Production, organization and interpretation of data in policymaking – contextual considerations and suggestions........................................................... 46 3.1. The production of data and statistics……………................................................ 46 3.2. Parameters and criteria for comparison……………………………………………........... 47 3.3. Scales of comparison or typologies of social groups and territories…………….. 53 Conclusions................................................................................................................. 58 References.................................................................................................................. 60
4
Acknowledgements This technical report was written by Arilson da Silva Favareto, Full Professor at Federal University of ABC Region (UFABC-Brazil). Susan Offutt (independent consultant coordinating the GSARS work focusing on improving Rural Statistics), Flavio Bolliger (Research Coordinator – GSARS) and Arbab Asfandiyar Khan (Economist - GSARS) peer-reviewed the report and provided input on the structure and text.
Norah de Falco coordinated the design and communication aspects. The document was edited by Sarah Pasetto.
This publication was prepared with the support of the Trust Fund of the Global Strategy, funded by the UK’s Department for International Development (DfID) and the Bill & Melinda Gates Foundation.
5
Introduction Within the framework of the Research Plan of the Global Strategy to Improve Agricultural and Rural Statistics (hereafter, Global Strategy), the topic of “Improving rural statistics” aims to develop a framework and cost-effective methods to help countries produce rural statistics. The research will provide a set of definitions of rural areas, a minimum set of core rural indicators, cost-effective technical solutions to collect data using Global Strategy inputs and produce the recommended set of indicators.
This report focuses on the social dimension of rural statistics, offering ideas and possible solutions to improve information on rural populations that is relevant to the formulation of poverty reduction policies. For this purpose, it is necessary to consider indicators that measure and monitor rural poverty and well-being, which include aspects such as immigration, depopulation and its impact, livelihoods, labour market conditions, income sources, educational attainment and health status.
The following pages are organized in three main parts. Chapter 1 presents the conceptual framework and the relevant literature on indicators, including lessons learned about poverty and rural development. Chapter 2 identifies selected indicators, considering their relevance to decisions on rural development policy. It also contains a discussion on how to transition from concepts to practice, listing the chosen indicators, identifying the variables needed and the underlying data requirements and sources. Chapter 3 is organized around some general contextual considerations on interpreting indicators in policymaking.
This report is complementary to other inputs produced by the “Improving rural statistics” initiative. At the time of press, at least two other relevant publications drafted under this initiative are relevant: Working Paper No. 10 on Conceptual Framework and Territorial Definitions for Improving Rural Statistics1 and Technical Report GO-16-2016 on A Minimum Set of Environmental Indicators for Improving Rural Statistics2, one on the comparative analysis of rural definitions used in the international context, and the other on the formulation of 1 http://gsars.org/wp-content/uploads/2016/12/WP_Conceptual-framework-and-territorial-definitions-for-improving-rur-statistics_rev-Nov16.pdf 2 http://gsars.org/wp-content/uploads/2016/12/TR_Minimum-Set-of-Environmental-Indicators-for-Improving-Rural-Statistics-051216.pdf.

6
proposals to produce statistics on the environmental dimension. In this sense, because the boundaries between the various themes and dimensions are not static, a part of the indicators and procedures proposed here may be redundant in relation to these other reports. An effort to match these inputs will be performed later by the initiative’s technical coordination.
7
1 Conceptual Aspects The conceptual aspects to be considered in the definition of social indicators for rural areas are organized around three issues: what we know about poverty and how to measure it; what we know about the specificities of rural poverty; and what are the main lessons learned from recent policies for rural development and poverty reduction. The key messages for each topic are presented below.
1.1. Theories, definitions and measurements of poverty
Schematically, the international debate on poverty and the ways to measure it can be organized in three different stages. The first is marked by the adoption of unidimensional criteria for defining poverty lines. The second stage commenced when a multidimensional approach arose based on the idea of minimum levels required for well-being, involving several dimensions. The third began when the ways to define poverty began to be considered in relation to contexts, values or certain forms of trade-off between different dimensions of deprivation.
As will be demonstrated, although we are currently in the third stage of this trajectory, the production of statistics is still oriented by the findings produced in the first stage, which sometimes take precedence over aspects emphasized in the second stage. The main consequence of producing indicators is the need to position contemporary efforts within an initiative to update the information systems adopted by the various countries on a more consistent level, coherently with the advances made in the conceptual plan.
First stage: Approaches based on unidimensional aspects and poverty lines
The first generation of ways to define and measure poverty gave rise to the best known and most widely used approach, according to which poverty is defined by the absence of minimum income. Originating in the late nineteenth century (George, 1879; Booth, 1891; Rowntree, 1901) and used mainly in the twentieth century (World Bank, 1990; Ravaillon, 1992), this view has two underlying foundations: the idea that poverty is defined by the absence of a minimum amount necessary to conduct a life with dignity; and, whereas modern societies experience a growing process of monetization, it would be crucial to receive a

8
minimum monetary income. With a minimum income, poor families would be able to escape from the fundamental deprivation afflicting the various spheres of their lives and seek alternatives to the expansion of welfare.
The expression of this conception in terms of statistical indicators was the definition of the so-called poverty lines (World Bank, 1990; 2007), the minimum amount of monetary income below which a person would be considered poor. In some studies, it was argued that these minimum amounts should be calculated on a non-cash basis, for example in terms of the calories consumed. However, over time and with the advance of economistic approaches, income was adopted as the main variable.
From the 1970s and more clearly from the 1990s, this concept was questioned by evidence, theories and authors who have become required reading in the field, such as the Nobel Prize winner in Economic Sciences Amartya Sen. In some of his major works (Sen 1982; 1992; 1999), Sen presents three arguments against the idea of poverty as the absence of minimum income. The first criticized aspect is that not everything may be imputed to income. Among farmers, for example, production for self-consumption is an important factor of food security, and consequently for health. The second aspect is that what could be considered a minimum level varies greatly in space and time, and across different cultures. A few generations ago, the requirements for education were lower than those of today. In some remote regions, the satisfactory level of income to participate in economic life is different from that experienced in metropolitan areas. The third aspect concerns the conflicts between dimensions that people may value, on the basis of different criteria, depending on their trajectories. Often, to achieve better levels of income, individuals abandon the production of their own food and seek better job opportunities, running the risk of sacrificing a health dimension or their autonomy. This is a part of their choices and strategies and in each situation, different options may be prioritized over others.
Second stage: approaches based on multidimensional aspects and the index of unsatisfied basic needs
The alternative approaches, structured from the criticism of the one-dimensional view, argue that poverty is better defined as the “deprivation of the capability to make choices”. The capabilities approach, inspired mainly by Sen’s work, considers that among human beings there is a diversity of conceptions and values of what to strive for as an objective in life and what gives meaning to individuals’ existence. In other words, every human being and
9
every social group may value different types of “achievements”. For example, some may value a long, safe and healthy life, coherently with the traditions of certain peoples; others, the expansion of the material possibilities for their descendants, even if it involves risks and vulnerabilities. Depending on the choices made regarding the desired achievements, certain “functions” are more important than others – to lead a healthy life, living in communion with nature may be necessary among some traditional communities; to expand material possibilities, using artificialized technologies may be required. Finally, certain functions require certain types of “capabilities” – income, better health or a good education. By combining these three concepts – achievements, functions and capabilities – it is possible to obtain a greater adherence to the definitions and measures of poverty coherent with the diversity of humanity.
The contribution of the capabilities approach led to the adoption of what is conventionally called the “multidimensional approach” to poverty. Since then, poverty is seen as something that cannot be considered in absolute terms, but rather in relational ones, connected to the history and context of each individual and social group, and on the conditions and unequal distribution of opportunities that the set of members in a certain society can access. In other words, both context and inequality matter. One of the main responses to the criticism made against the one-dimensional conception of poverty indicators was the adoption of multidimensional indicators. If, on the one hand, each social group or even each individual may appreciate different dimensions of its own existence, on the other, it is possible to identify a number of “substantive and fundamental freedoms” to which all individuals should have access to make their basic choices: having a minimum income, knowing how to read and interpret reality, escaping from early morbidity, and participating in community decisions (Sen, 1999).
The widely known Human Development Index (HDI) (UNDP, 1998) was created consistently with this idea, seeking to synthesize three of these fundamental dimensions: income, education and health. The HDI was recognized as making progress in terms of measuring development compared to the Gross Domestic Product (GDP). However, some problems remained unsolved. Sen’s preface to the first edition of the Human Development Report, contains an alert as to these limits: important dimensions, such as civility, were omitted due to the difficulty of finding good statistics; calculating averages involving different aspects, such as income and education, tends to lead to serious distortions; and synthesizing all these elements into a single ranking could also lead to misunderstandings, when it would rather be advisable to
10
present the different development profiles or typologies, for example by comparing and contrasting the countries’ performance in different dimensions. An improvement in income may be accompanied by satisfactory performance against education and health indicators, which contrasts with situations in which, despite advances in the economic dimension, social problems persist; where the performances of economic and social indicators are equally critical, it is assumed that the requirements of the policy agenda are different in each situation.
Inspired by this debate, some countries and international agencies began to build multidimensional indicators not only to monitor development, but also – and more specifically – to design policies for poverty reduction. One of the best-known expressions of these efforts is the Unsatisfied Basic Needs Index (UBNI; see Feres & Mancero, 2001). Just as the HDI, the UBNI calculates the proportion of the population in a given location that is without access to a set of goods and services in the fundamental dimensions of basic human deprivation.
The great advantage of tools like these, compared to the first generation of indicators, is that they enable operating with a definition of poverty that portrays it as a multidimensional phenomenon. However, it is again necessary to identify the limitations of such tools. The main one is the fact that the ascertainment of whether a given aspect is satisfactory still requires an arbitrary definition. Consequently, poverty ends up being defined in absolute rather than in relative terms. Furthermore, the measurement of poverty takes into account only the final performance indicators, without any mention of the external conditions that are fundamental to overcome the deprivations that characterize poverty (for example, to design policies, it is certainly essential to know what the illiteracy rates are; however, it is equally important to know whether any poor performance on this aspect occur in an environment where schools exist , or indeed whether this type of social infrastructure is not available).
Third stage – approaches based on quality of life and well-being, and insights from the Commission for Measuring Economic Performance and Social Progress
The problems involving the measurement of poverty can also be seen in other areas, such as economic performance and sustainability. Moreover, the available literature on development and well-being has drawn attention to the interdependencies between these dimensions. To provide solutions to such problems, at the beginning of this century, the French government promoted the constitution of the Commission for Measuring Economic Performance and
11
Social Progress (CMEPSP), also known as the Sen-Stiglitz-Fitoussi Commission (CMEPSP, 2012). There are several recommendations gathered in the CMEPSP’s final report. Schematically, and with specific regard to social indicators, the findings and recommendations may be summarized as follows. Together, these recommendations allow us to operate with a relational or interdependent conception of poverty.
• Subjective measures of welfare provide key information on the quality of life. Therefore, the statistical institutions should research the evaluations that people make of their own lives and their priorities.
• Quality of life also depends on objective conditions and opportunities. Therefore, it is necessary to improve and monitor eight key dimensions: health, education, personal activities, political voice, social connections, environmental conditions, social insecurity and economic insecurity.
• Inequalities are relevant and should be evaluated comprehensively for all eight aforementioned dimensions.
• Surveys should be conducted to assess interdependencies and links
between these dimensions for each person, especially for policy design, implementation and coordination in each area.
• The statistical institutions should provide information on aggregating data on the dimensions of quality of life, thus enabling the construction of different compounds/synthetic indices or typologies.
Naturally, all this information must be translated for contexts characterized by conditions that are far from ideal for the purpose of statistics production, which will be done in Chapter 3 of this report. Before this, we must also consider that these statements do not address the specificity of different social groups, such as the group of rural people. That is, in the case of measuring poverty and quality of rural life, we must consider the lessons derived from this field of studies and from the experiences with policies for reducing rural poverty. These are, explored in the next two sections, respectively.

12
1.2. The specificities of rural poverty
Two key aspects distinguish the conditions of rural poor people from those experienced by the inhabitants of urban areas.
First, most of the rural poor population do not participate in markets (labour markets or markets for goods and services). When such participation does occur, it involves what the literature calls incomplete and imperfect markets (Ellis, 1991). Many of these are peasants, family farmers and traditional populations. On the one hand, this entails a certain degree of flexibility and autonomy in the forms of work management and in the use of natural resources. On the other, material constraints are burdensome for this population, thus making the relative freedom and autonomy severely restricted or accompanied by basic and severe deprivation. Consistent with this condition, among the rural population, the main goal of organizing life strategies is the “social reproduction of the family group” (Lamarche, 2003). As the legacy of a peasant ethos, and in contrast with urban populations in industrial societies, the rural population tends to use this relative autonomy to combine all the possibilities available to overcome the limitations of deprivation, isolation and scarcity that mark its history.
The diversity of ways in which these family strategies of social reproduction may follow gave rise to the concept of “rural livelihoods”. According to Ellis (1999), a livelihood is defined as “the activities, the assets, and the access that jointly determine the living gained by an individual or household”. For the same author, rural livelihood diversification is then defined as “the process by which households construct a diverse portfolio of activities and social support capabilities for survival and in order to improve their standard of living”. Likewise, Scoones (1998) argues that the main question concerning sustainable livelihoods is the following: “given a particular context (politics, history, agroecology and socio-economic conditions), what combination of livelihood resources (different types of ‘capital’) result in the ability to follow what combination of livelihood strategies (agricultural intensification/extensification, livelihood diversification and migration) with what outcomes?” In this framework, particular importance is assumed by the institutional processes involving formal and informal institutions and organizations that mediate the ability to carry out these strategies and achieve these outcomes.
This diversity of possible arrangements made by rural households to earn a living and the trade-offs involved lead us to the second point to be emphasized: it is impossible to address the interdependencies between the decisions made by
13
households, as the livelihood concept suggests, if the dynamics responsible for producing deprivation are explained in isolation. In other words, it is necessary to avoid three common dichotomies: that between income sources – farm and off-farm incomes; the dichotomy between monetary and non-monetary incomes; and that between social and ecological systems. Rather, it is necessary to take into account the different possibilities of combining these elements, which part of the literature often deals with separately.
Moreover, rural people, and to an even greater extent, poor rural people, generally live in more disperse settlements and far from urban infrastructure, which often means difficult access to the social facilities needed to overcome their hardships. Many rural regions depend on their links with close or distant urban centres. Therefore, it is necessary not only to consider the individual aspects of poverty, or even those internal to farms or other agricultural units. Rather, it is necessary to adopt a scale that is capable of capturing the links between rural areas and the cities on which they depend to obtain services.
Some authors (among others, see Abramovay, 2003; Berdegué & Schejtman, 2003) consider the “territorial approach” as an important innovation in rural studies for at least three main reasons; indeed, it enables: (1) adoption of a multisector perspective, since rural families increasingly use a mix of incomes from agriculture, industry and service sectors; (2) an emphasis on the complementarity between rural and urban aspects, thus avoiding an artificial dichotomy; and (3) identification of the inevitable interdependency between social and ecological systems, which are usually separated in the specialized literature on biological and social sciences. Likewise, Favareto (2007) claims that the current content of rurality is a new stage in its long-term history, in which, instead of disappearing or inexorable decreasing, the rural areas are increasingly integrated to the broader dynamics of development processes, through both the unification of different markets (of labour, goods and services, but also of symbolic goods) as through the creation of formal institutions that regulate the forms of social use of these spaces. For Favareto, on the basis of the emergence of this new stage, there is a change in the social content and quality of the three defining dimensions of rurality – the rural-urban relations, the proximity to nature and interpersonal ties. The relationship between society and nature, the first distinctive feature of rural life, is undergoing a shift in terms of the social use of natural resources, from privileging the production of primary goods to a multitude of possibilities, among which those related to the appreciation of natural amenities, biodiversity conservation and production of renewable energy sources stand out. The close relationships, the second

14
distinctive feature of rural life, are also subject to a shift: the relative homogeneity that once marked rural communities now gives way to a growing heterogeneity and some fraying of solidarity. The relationship with the cities, the last distinctive feature, is no longer based on the export of primary products. Instead, a complex spatial composition emerges of activities involving the different sectors of the local economy, with particular consequences for the structure of income composition and occupation of workforce. In some places, there is also a change in the demographic flows. Rural exodus is no longer a widespread trend around the world; rather, relatively new phenomena arise such as return migration or rural gentrification. This generates new situations, new conflicts, and new possibilities of insertion or exclusion, which must be understood in terms of each specific territorial configuration of rural-urban linkages.
These changes obviously materialize to very different degrees in distinct regional contexts. However, in general, the sense of these changes undermines the possibilities of treating the rural exclusively as the opposite of the urban, of proclaiming its disappearance, or summarizing it by only one of its current dimensions: the agrarian dimension. Consequently, the key message in this respect is that it is necessary to avoid the dichotomies mentioned above to approach the specificity of rural livelihoods and their potential to reduce poverty and improve the contribution of farmers and rural areas to their countries.
To do so, it is necessary to consider these empirical instances in the following terms:
• Mixing farm and off-farm incomes – The finality is to preserve the minimum autonomy of rural families. This is a social group organized around the intensive use of labour and that is less capital-intensive. On the basis of the idea of rural livelihoods, the monetary dimension of social life among peasants and family farmers – even if increasing – can be relativized. In this sense, indicators must be introduced to capture the broader set of strategies adopted by different social groups. It implies that, concerning sources of income in particular, for example, those derived from agricultural and other similar activities (several primary activities) are as important as those obtained with permanent or temporary migration, from access to forms of social protection such as conditional transfers of income, or from permanent or temporary pluriactivity.

15
• Mixing monetary and non-monetary incomes – In the case of rural
populations, and especially the poorest thereof, low levels of income may not be a sufficient indicator of deprivation. The feeling of deprivation and means to reduce vulnerability will always be related to the ”rural livelihoods” experienced by these populations, which often consider non-monetary aspects as extremely important for their well-being, such as access to ancestral places or other cultural and relational aspects important to the maintenance of social cohesion. Similarly, even when considering only income, the non-monetary dimension is crucial. This is the remarkable case of food production for self-consumption and its impact on food and nutritional security, or of access to land as a place of residence, a set of factors that can reduce the monetary cost of social reproduction for families. In some countries, a certain amount is imputed to household income in the presence of some of these forms of non-monetary factors.
• Interdependence between ecological and social systems – To a greater extent than for urban inhabitants, for rural populations, the interdependence between local social systems and the ecological systems that support them is decisive. The quality and form of use of natural resources are simply fundamental for several reasons. First, to understand the vulnerability of these populations, since the depletion of a given resource may quite simply eliminate the material basis of their forms of subsistence and social interactions. Second, the best ways of using these resources constitute the potential for overcoming conditions of deprivation and for seeking increases in productivity. The production and monitoring of indicators on this theme should permit an evaluation of the state of natural resources and their flow, to enable the preparation of projections on the future situation of this stock, predicting risks and anticipating solutions to reduce vulnerability.
• Interdependencies between rural areas and nearby urban centres – Statistics production traditionally isolates indicators for rural areas, from those for urban areas. However, precisely because of the relatively low population density and, consequently, also due to the distance from major urban centres, rural areas must be understood in relation to cities. Indeed, rural areas often rely on cities to meet a part of their needs, such as access to markets or social infrastructure. In the case of rural spaces situated near to urban centres, this interdependence is even stronger,
16
because rural families tend to merge opportunities to obtain income in both rural and urban labour markets, as mentioned above. Adopting a “territorial approach” is the best answer to this problem, as advocated in the most advanced statistical production centres and throughout the literature on planning and rural development. The same alternative may be sufficient to consider that in rural areas, it is not necessarily the entire population to be poor, and it is not necessarily wholly composed of farmers. However, the interactions between these different social groups is essential to understand the social environment in which the condition of poverty is produced and endures, or to identify opportunities that can be accessed to overcome it. A territorial approach should allow for the organization of information according to the different social groups that make up that space and thus understand their interdependencies.
1.3. Lessons learned from the experience of public policies for rural development and poverty reduction
In recent decades – in many cases, sharply from the 1990s – several countries with a high degree of rural poverty have experienced an important decline in the population living under this condition. Much of the success may be attributed to conditional cash transfer policies. However, it would be a mistake to attribute exclusively to this type of instrument the responsibility for the improvement. We must also consider that different contexts present a reasonable degree of variation and mixed solutions (IFAD, 2016). Briefly, the literature on rural development and poverty reduction shows that at least three major phases, each with corresponding types of instruments, have been adopted in the policies of peripheral countries.
Agricultural modernization
The first step, experienced mainly between the 1950s and 1980s, emphasizes the improvement of production systems. Public policy instruments of agricultural modernization, such as access to credit and intensive use of technology, led to productivity increases involving both large and (in many places) small farmers. Naturally, there was also a strong process of competitive selectivity between farmers. The expectation was that this process of social differentiation would form a class of large and small farmers that would be inserted in markets, and the population that could not achieve this level would be absorbed as employees in the agricultural labour markets or would migrate to the cities to take part in the expanding urban labour markets. However,
17
history shows us that this did not occur; rather, the consequence was the generation of strong social exclusion and a rising inequality (Garcia, 2003).
Integral rural development
Targeting precisely those farmers who have not benefited from modernization policies, the second stage of public policies for rural development and poverty reduction focused on what were often called “integrated rural development policies”. The objective of these initiatives, implemented mainly in the 1980s and 1990s, was to improve the conditions of production and at the same time provide satisfactory conditions of life for farmer families. In this case, two problems led to the failure of these initiatives: (1) the difficulties encountered in mobilizing resources to address historical situations of deprivation in many dimensions of life for these people, and (2) the serious lack of coordination between different government levels and sectors. The result was a relatively limited degree of success of these initiatives, despite their high cost; indeed, the successful experiences were only isolated cases (Garcia, 2003). Although the literature of the time did not mention it, today we are aware of a third important factor that accounts for the failure of this generation of policies: the problems were seen to be located “inside the gate” of farms, when some of the limitations concerned rather the social and institutional environment, such as fragile access to markets. These considerations again point to the need for a territorial approach (Fernandez et al., 2013).
Cash transfers
The third generation of policies opted for greater pragmatism in addressing rural poverty. Successful policies for conditioned cash transfers led to an expansion of the adoption of such instruments in different countries, with a quickly noticeable impact on the conditions of life of these populations (IFAD, 2016). Complementarily, several countries have launched food and nutritional security programs or governmental initiatives to provide access to markets; these usually take the form of public purchasing programs, to supplement or reduce dependence on government transfers. However, the degree of disarticulation of these complementary initiatives is still high and its results are at an incipient stage. Faced with the risk posed by the dependence on transfers, which is particularly serious in times of economic crisis, many countries have identified a need to better integrate social protection policies with productive policies (Maldonado et al., 2016).

18
Rural territorial development programs
Simultaneously with the adoption of the cash transfers policies, several countries have experienced the adoption of territorial development policies for rural areas. The origin of this approach lies in the European experience with the Liaison Entre Actions de Développement de l’Économie Rurale3 (LEADER) program. However, in that context, territorial development policies have emerged to solve two problems: (1) offset the negative effects of lower intensiveness in the use of labour in agriculture, which could lead to an undermining of the social tissue of many regions; and (2) bridge the competitiveness gap between rural areas and dynamic areas in member countries. These objectives would be pursued through regional projects to foster a productive restructuring of these local economies (Saraceno, 2002).
In Latin America, for example, the importation of this approach found a very different context (Berdegué & Schejtman, 2003). The size of the poor population and the physical and social infrastructure deficit are much greater, which meant that the type and size of challenges to be faced were much more complex and structural than those found in Europe. Thus, in many countries, the territorial approach was only partially adopted. Many initiatives continue to be sectoral (restricted to agriculture) and the low degree of integration with urban areas limits its potential effect (Berdegué et al., forthcoming).
One consequence of this weak adoption of the territorial approach in programs and policies is that in many countries, a duality between social and productive policies is established. For rural areas, social and basic infrastructure investments are prioritized. For areas that already enjoy a reasonable degree of competitiveness, policies focusing on credit, technology and participation in markets are implemented. Although this type of option has generated positive results in recent years, it has engendered a high degree of dependency and a risk of discontinuity in adverse political contexts exists. Territorial policies should lead to a reduction in the gap between these two vectors, favouring the internalization of productive advancements within the priority areas for social policies. For this purpose, it would be necessary to differentiate the rural development strategies applicable to areas having different characteristics and to avoid making certain areas objects of social expenditures exclusively. These are not overly dispersive efforts, but rather minimally differentiated strategies coherent with local contexts. Where there are proximity to urban centres, access to land and labour markets, some types of incentives and investment can
3 Links Between Actions for the Development of Rural Economies.
19
facilitate production growth. Where these conditions are not available, other investments with greater weight in establishing connections between rural and urban areas and building infrastructure will be necessary, in combination with cash transfers. The main idea is that local territories matter, even when working with sectoral policies, such as social policies. If a policy cannot generate the same effect in two different contexts, then the territorial characteristics should be considered.
This brief overview allows us to infer at least six aspects that should be considered when producing indicators and statistics. These aspects, listed below, represent a “basic consensus” on the lessons learned from recent generations of policies and programs for rural poverty reduction.
• Food security and sustainable agriculture. Indicators and statistics should enable the monitoring of policies for food security and nutrition security for rural households, as well as the transition to more sustainable forms of production, thereby reducing social and environmental vulnerability.
• Integration between social protection and productive inclusion. The production of indicators should identify how families use financial resources derived from social protection policies (where these exist). This identification aims to map the needs being met as well as opportunities for public and private investments, in order to reduce the importation of goods and services in these regions and to promote the endogeneity of production and accumulation circuits.
• Access to markets. The production of statistics and indicators should allow for the identification of labour market and consumption market structures that can be strengthened or emulated by public and private investments, thereby expanding the opportunities for productive insertion on part of rural populations. This is the essence of the growing use of the territorial approach: considering the possibilities for economic inclusion of rural families not only by improving their production systems (the sectoral perspective), but also by organizing local economies (the perspective of income diversification and expansion of the forms of participation in the economic life of their territory).

20
• Access to social infrastructure and financial services. The social and productive integration of rural poor families depends not only on internal attributes, but also on external conditions such as access to funding, microcredit and other financial services, as well as education and health infrastructure, which reduce their social vulnerability. The statistics should cover the performance of the indicators with regard to the families’ lives, and the availability of services required to attain this improved performance.
• Territorial approach. Using a territorial approach is not only a question of delimiting a scale of data collection. All of the aspects mentioned above reinforce the need to produce statistics that are not limited to agriculture or even to farmers; rather, it is necessary to examine the social, economic and ecological environment in which they are inserted and the rural-urban linkages. In other words, there is a dimension of scale (it is necessary to think in terms of regions, encompassing rural areas and the cities or agglomerations on which they depend). This scale contains a dimension involving empirical units: examining not only the farms’ internal aspects of the farms, but also their interdependencies with the social, economic and ecological systems that, together, make up the territory.
• Forms of coordination. The production of indicators should allow for better coordination between the branches of government, between different levels of government, and between the government and society. If the problems surrounding rural populations have a multidimensional character, it is precisely the ability to articulate and coordinate the efforts undertaken in different areas that poses the biggest challenge in addressing these problems efficiently.
21
1.4. Synthesis
This chapter schematically reviewed the literature on poverty (concepts and forms of measurement thereof), the specificities of rural poverty and the trajectory of policies for poverty reduction and its challenges, to extrapolate criteria and parameters for the selection of indicators aimed at improving the social dimension of statistics for rural areas.
The main message derived from the review of poverty literature is the need to transcend the one-dimensional or even multidimensional indicators based on minimum necessity, to prefer the tools that are consistent with the adoption of a relational approach of poverty, the main parameters of which may be found in the report of the Sen-Stiglitz-Fitoussi Commission. Regarding the knowledge brought to the literature on the specificities of rural poverty, the main conclusion also touches upon the search for a relational approach, avoiding the dichotomies, simplification and reductionism often present in the more traditional approaches. The concept of rural livelihood, the territorial approach proposed and its consequences in terms of the variables and dimensions to be observed synthesize this perspective. Finally, with regard to the current state of policies for the reduction of rural poverty, the main finding consisted in the identification of certain aspects that must be better operationalized to overcome the obstacles to the incorporation of the territorial approach and avoid fragmented initiatives. This basic consensus has been drawn from the lessons learned from recent generations of policies and programs for rural poverty reduction.
Chapter 2 elaborates upon these parameters and criteria to propose a set of selected indicators, organized in a suitable format, for contexts in which the conditions are far from the ideal for the production of rural statistics.
22
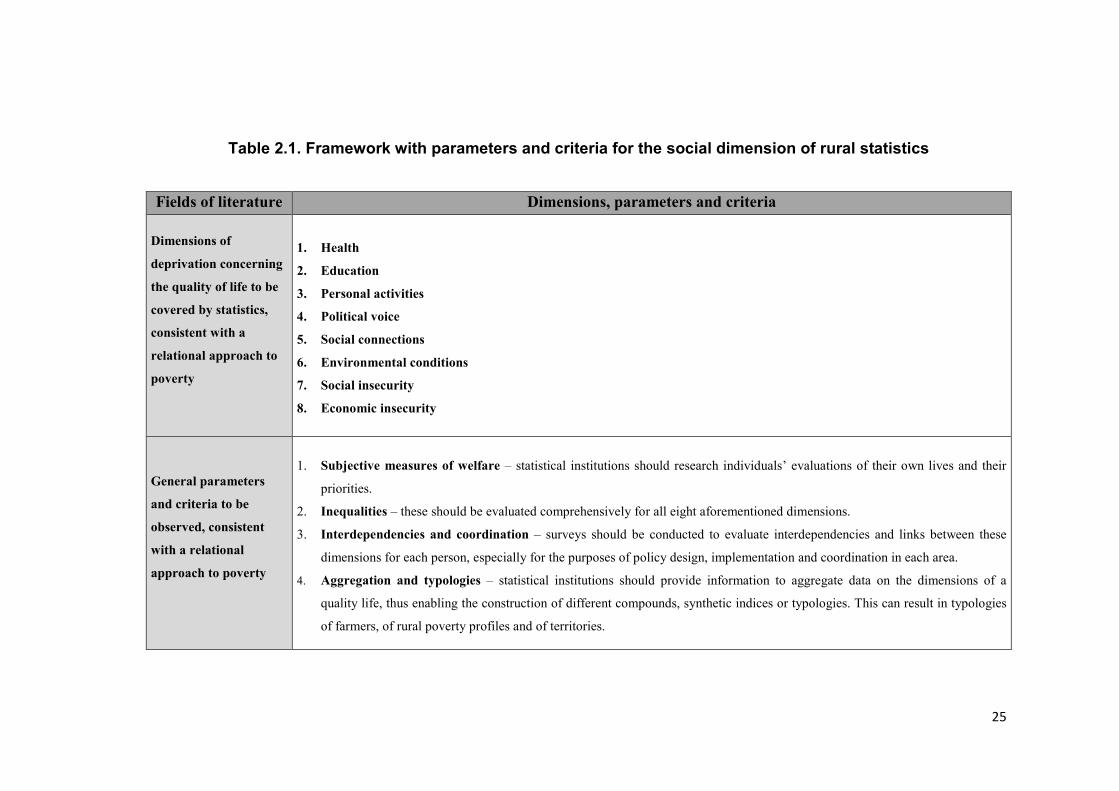
2 From Concepts to Practice Indicators, Data Requirements and Sources This chapter seeks to translate the conceptual discussion in Chapter 1 to procedures for the production of statistics and indicators. In this sense, the content of the following pages acquires a more propositional and less analytical character. The language adopted also takes on a more schematic tone. Proposals will be presented in the form of tables and summary tables.
Table 2.1 summarizes the main parameters and criteria identified in the literature review on poverty, rural poverty and policies for poverty reduction. In the following pages, a set of tables is presented, containing a detailed selection of indicators, the variables related to them and the data to be collected, the types of research instruments and data collection activities required to gather the information selected. For the propositions formulated, four main instruments will be considered for data collection: a) household surveys; b) farm surveys; c) a module on household surveys or a special survey to collect data directly from agricultural workers; and d) national registers. Clearly, the proposals concerning household surveys and farm surveys will have to be harmonized with each country’s existing instruments.
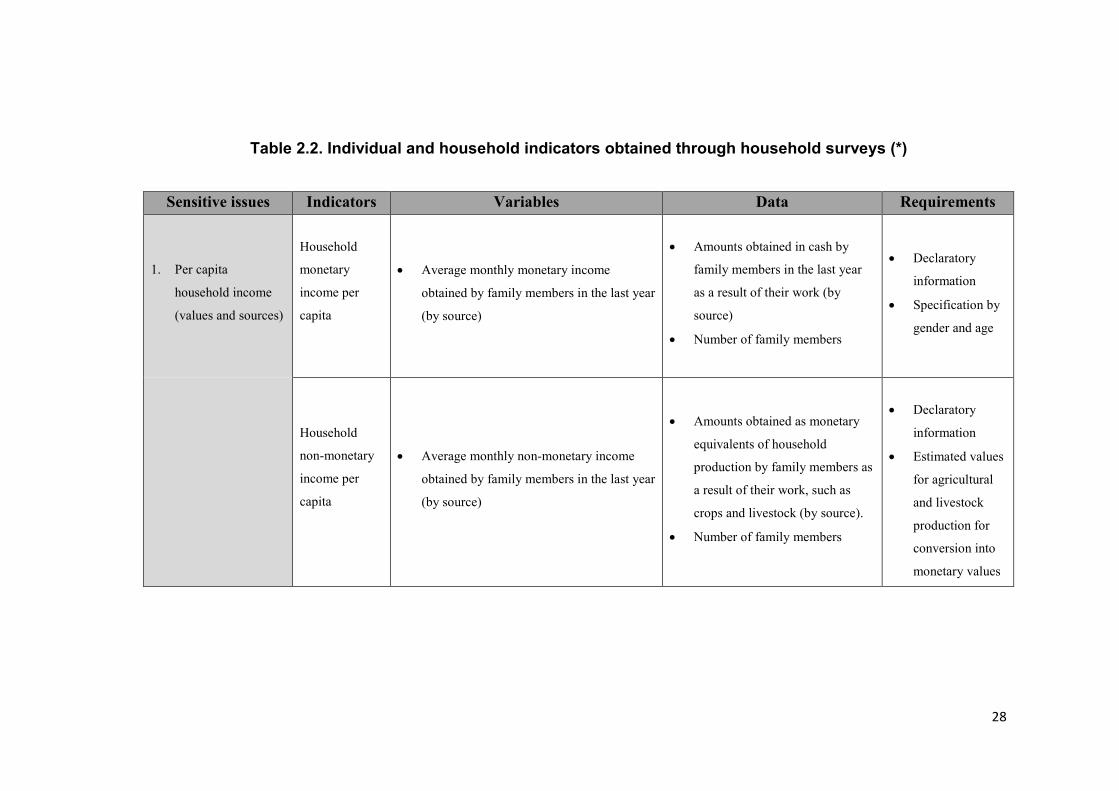
Subsequent tables are organized according to the different types of instruments for data collection mentioned above. Table 2.2 is based on individual and household indicators to be obtained through household surveys. It covers the main elements consistent with the multidimensional approach to poverty, as portrayed in the literature presented in Chapter 1. The indicators suggested take into account the deprivation of individual freedom in decision making. Table 2.3 sets out indicators for productive units (farms) to be obtained through farm surveys. It is organized to cover the most important aspects relating to the structure and productive organization of farms, the results obtained, and certain conditions that affect their performance, such as access to markets and financial services. Table 2.4 presents the indicators to be obtained through examination of national registers. While the previous tables provide information to

23
understand the performance of indicators concerning people and farms in social and productive respects, in this table, the objective is to map the conditions and infrastructure available in the territory where these people and farms are located. In other words, Tables 2.2 and 2.3 cover internal aspects of households and farms, and Table 2.4 covers some aspects relating to the territorial environment. Finally, Table 2.5 suggests indicators of the labour conditions of rural workers, to be obtained by introducing a special module in household or labour surveys. This table was included in light of the traditional precariousness of the labour conditions of this social group, and of the difficulties encountered in shedding the necessary light on the issue through social statistics alone.
For these proposals, the technical indications of several manuals for statistical production published by international agencies were consulted (UN, 2013; World Bank, 2000; World Bank & FAO, 2008), as well as the experiences of specific countries and regions (IBGE, 2006; US, 2013). The general aspects of the technical requirements that should be considered for these proposals and their application are the following: (a) social relevance – the relevance of its production and/or use of data; (b) validity – the ability to reflect the abstract concept that the indicator proposes to operate; (c) reliability – this is a property related to the quality of data; (d) coverage – the representative capacity of the empirical reality under analysis; (e) sensitivity – the indicator’s ability to reflect significant changes; (f) intelligibility – this quality refers to the transparency of the methodology applied in constructing the indicator; (g) communicability – this property is linked to the ease of understanding the indicator; (h) feasibility – the possibility of obtaining the indicator at feasible costs; (i) periodicity – its availability for regular surveys; and (j) aggregation/disaggregation – the possibility of combining the data in different scales of analysis to cover the units that are important for policy design or to understand relevant aspects of social reality.
Two additional observations must be considered in this introduction. First, the information to be obtained by these instruments must be analysed in conjunction with the information on the ecological systems upon which the territory depends.. For the sake of consistency with the conceptual discussion presented in Chapter 1, the information on ecological systems must: (a) allow for an analysis of the degree of risk posed to rural populations, in terms of the status and use of resources; (b) cover the conditions of the stock and flow of natural resources; and (c) enable projections, considering the dynamic nature of ecosystems and possible irreversibility of certain environmental problems. Second, the units of data collection suggested in the tables in this chapter differ

24
depending on the instrument (individual, household, farm or region). The combination of the different units and the joint reading of the information obtained will result in the three key concepts mentioned in Chapter 1: the relational and multidimensional approach to poverty, rural livelihood as the concept to interpret relational differences, and the territorial approach as the scale and set of empirical elements necessary to cover the interdependencies necessary to comprehend the social conditions of this population. For more details on the definition of the territorial limits of data collection, see Conceptual framework and territorial definitions for improving rural statistics, also produced within the Global Strategy’s Research Plan (Offutt, 2016). The data obtained on the basis of these instruments can give rise to a broad set of information. Chapter 3 provides suggestions on how to organize this information and use it to produce reports and analyses.
25
Table 2.1. Framework with parameters and criteria for the social dimension of rural statistics
Fields of literature Dimensions, parameters and criteria
Dimensions of
deprivation concerning
the quality of life to be
covered by statistics,
consistent with a
relational approach to
poverty
1. Health
2. Education
3. Personal activities
4. Political voice
5. Social connections
6. Environmental conditions
7. Social insecurity
8. Economic insecurity
General parameters
and criteria to be
observed, consistent
with a relational
approach to poverty
1. Subjective measures of welfare – statistical institutions should research individuals’ evaluations of their own lives and their
priorities.
2. Inequalities – these should be evaluated comprehensively for all eight aforementioned dimensions.
3. Interdependencies and coordination – surveys should be conducted to evaluate interdependencies and links between these
dimensions for each person, especially for the purposes of policy design, implementation and coordination in each area.
4. Aggregation and typologies – statistical institutions should provide information to aggregate data on the dimensions of a
quality life, thus enabling the construction of different compounds, synthetic indices or typologies. This can result in typologies
of farmers, of rural poverty profiles and of territories.

26
Parameters and criteria
to be observed
concerning specific
conditions of rural
poverty, consistent with
the concept of rural
livelihoods and the
territorial approach of
rural development
1. Mixing farm and off-farm incomes – rural livelihood entails a mix of strategies combining different sources of income.
Statistics should be capable of capturing this flexibility.
2. Mixing monetary and non-monetary incomes – rural livelihood entails a mix of strategies where non-monetary aspects are as
important as monetary values, and should be covered by the production of statistics.
3. Interdependence between ecological and social systems – rural territories are sustained in an inseparable unit involving social
and ecological systems. This supports the specific forms of social life in these territories. Its resilience is an important factor in
reducing social, economic and environmental risks.
4. Interdependencies between rural areas and nearby urban centres – the integration of agricultural and non-agricultural
incomes, access to markets and social infrastructure, migration and increasing mobility are aspects that place rural-urban
linkages at the centre of the possibilities for resolving rural poverty. It is necessary to avoid an artificial separation between the
rural and the urban; rather, one should search for complementarities and interdependencies.

27
Parameters and criteria
to be observed
concerning policy
relevance for poverty
reduction, consistent
with the basic
consensus on the
lessons learnt from the
recent policies for rural
poverty reduction
1. Food security and sustainable agriculture. Indicators and statistics should enable the monitoring of policies for food security
and nutrition security for rural households, and the transition to more sustainable forms of production, reducing social and
environmental vulnerability.
2. Integration between social protection and productive inclusion. The production of indicators should identify the needs that
are being met with policies for social protection, but also opportunities to reinforce economic activities that reduce dependency
on these resources and stimulate local economies.
3. Access to markets. The production of statistics and indicators should enable identification of the structures of labour and
consumption markets that can be strengthened or emulated by public and private investments, thereby expanding the
opportunities for productive insertion of the rural populations.
4. Access to social infrastructure and financial services. The social and productive integration of rural poor families depends not
only on internal attributes, but also on external conditions such as access to funding, microcredit and other financial services, as
well as education and health infrastructure, which serve to reduce their social vulnerability.
5. Territorial approach. All of the aspects mentioned above reinforce the need to produce statistics that are not limited to
agricultural units or even to farmers; it is necessary to consider their social, economic and ecological environment as well as
rural-urban linkages.
6. Forms of coordination. The production of indicators should allow for better coordination between sections of government,
levels of government, and the government and society.
28
Table 2.2. Individual and household indicators obtained through household surveys (*)
Sensitive issues Indicators Variables Data Requirements
1. Per capita
household income
(values and sources)
Household
monetary
income per
capita
• Average monthly monetary income
obtained by family members in the last year
(by source)
• Amounts obtained in cash by
family members in the last year
as a result of their work (by
source)
• Number of family members
• Declaratory
information
• Specification by
gender and age
Household
non-monetary
income per
capita
• Average monthly non-monetary income
obtained by family members in the last year
(by source)
• Amounts obtained as monetary
equivalents of household
production by family members as
a result of their work, such as
crops and livestock (by source).
• Number of family members
• Declaratory
information
• Estimated values
for agricultural
and livestock
production for
conversion into
monetary values
29
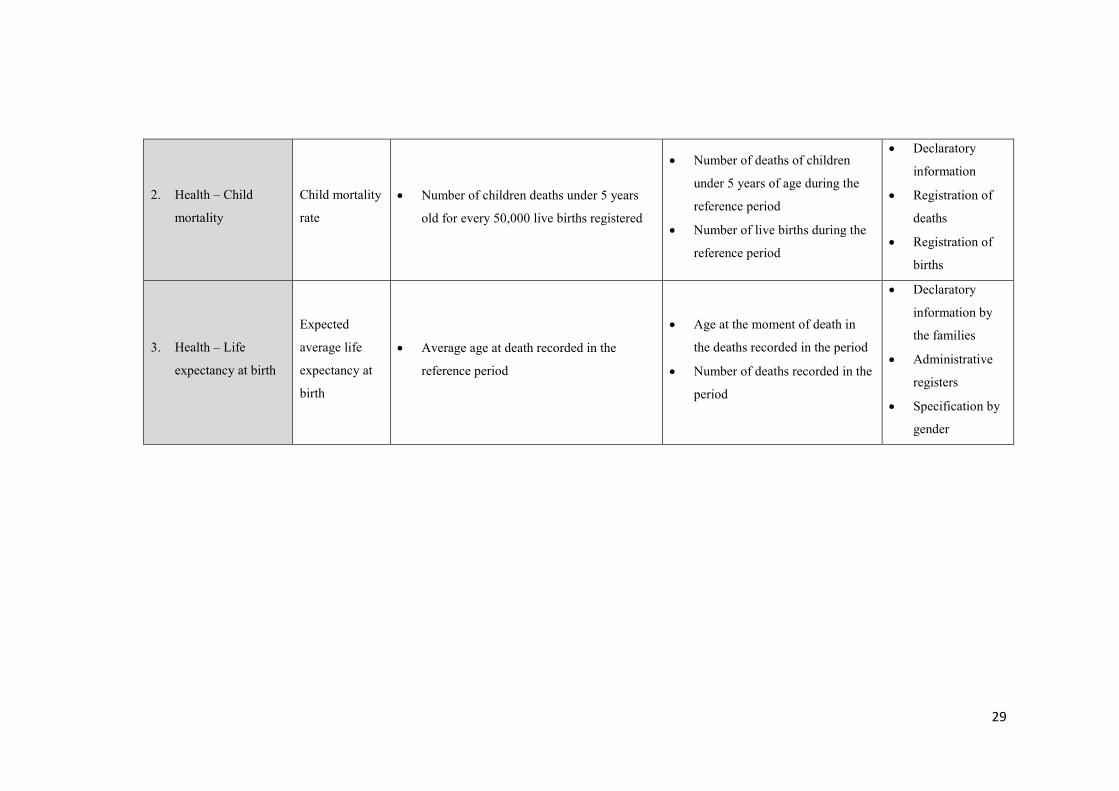
2. Health – Child
mortality
Child mortality
rate
• Number of children deaths under 5 years
old for every 50,000 live births registered
• Number of deaths of children
under 5 years of age during the
reference period
• Number of live births during the
reference period
• Declaratory
information
• Registration of
deaths
• Registration of
births
3. Health – Life
expectancy at birth
Expected
average life
expectancy at
birth
• Average age at death recorded in the
reference period
• Age at the moment of death in
the deaths recorded in the period
• Number of deaths recorded in the
period
• Declaratory
information by
the families
• Administrative
registers
• Specification by
gender

30
4. Health – Access to
improved water
sources (drinking
water)
Percentage of
households
having access
to improved
water sources
• Households connected to regular water
supply networks
• Households without access to supply
networks, but having regular access to
water with health treatment
• Households connected to the
water supply network
• Households without access to
supply networks, but having
regular access to water
(fountains, wells) with health
treatment
• Total number of households
• Declaratory
information
• Registration of
services for
water supply
5. Health – Access to
improved sanitation
sources (adequate
sanitation)
Percentage of
households
having access
to improved
sources of
collection and
treatment of
sanitary waste
• Household having connection to networks
of collection and treatment of sanitary
waste
• Household without access to networks of
collection and treatment of sanitary wastes,
but having access to other forms of
treatment (septic tanks) of sanitary waste
• Household connected to networks
of collection and treatment of
sanitary waste
• Household that only have access
to other forms of treatment
(septic tanks) of sanitary waste
• Total number of households
• Declaratory
information
• Registration of
services for
sanitation

31
6. Health – Access to
food and nutritional
security conditions
Access to food
at levels
consistent with
meeting the
food and
nutritional
needs
(household
budget)
• Families under food and nutritional risk –
families whose members consume less than
the minimum amount of calories required
• Women, children and adults under food and
nutritional risk
• Composition of the food basket
consumed by family members
• Value of the food consumed
• Family monetary income
• Value of the food produced in the
household
• Value of food from sources other
than household production and
purchasing
• Amount of calories required
• Declaratory
information
• Specification by
gender and age
• Food conversion
table on energy
values (calories)
Access to food
at levels
consistent with
meeting food
and nutritional
needs
(individual
food intake)
• Families under food and nutritional risk –
families whose members consume less than
the minimum amount of calories required
• Women, children and adults under food and
nutritional risk
• Types of food eaten regularly
• Regular intake amounts of food
• Calories required
• Declaratory
information
• Specification by
gender and age
• Food conversion
table on energy
values (calories)
32
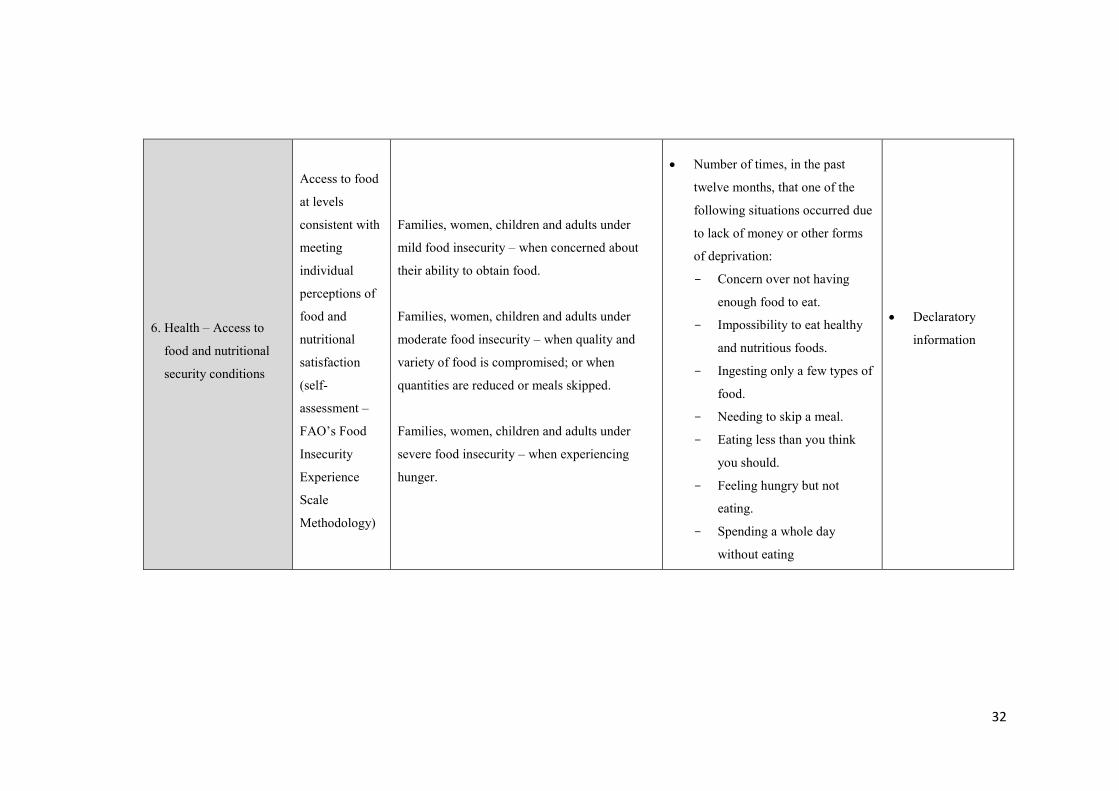
6. Health – Access to
food and nutritional
security conditions
Access to food
at levels
consistent with
meeting
individual
perceptions of
food and
nutritional
satisfaction
(self-
assessment –
FAO’s Food
Insecurity
Experience
Scale
Methodology)
Families, women, children and adults under
mild food insecurity – when concerned about
their ability to obtain food.
Families, women, children and adults under
moderate food insecurity – when quality and
variety of food is compromised; or when
quantities are reduced or meals skipped.
Families, women, children and adults under
severe food insecurity – when experiencing
hunger.
• Number of times, in the past
twelve months, that one of the
following situations occurred due
to lack of money or other forms
of deprivation:
Concern over not having
enough food to eat.
Impossibility to eat healthy
and nutritious foods.
Ingesting only a few types of
food.
Needing to skip a meal.
Eating less than you think
you should.
Feeling hungry but not
eating.
Spending a whole day
without eating
• Declaratory
information
33
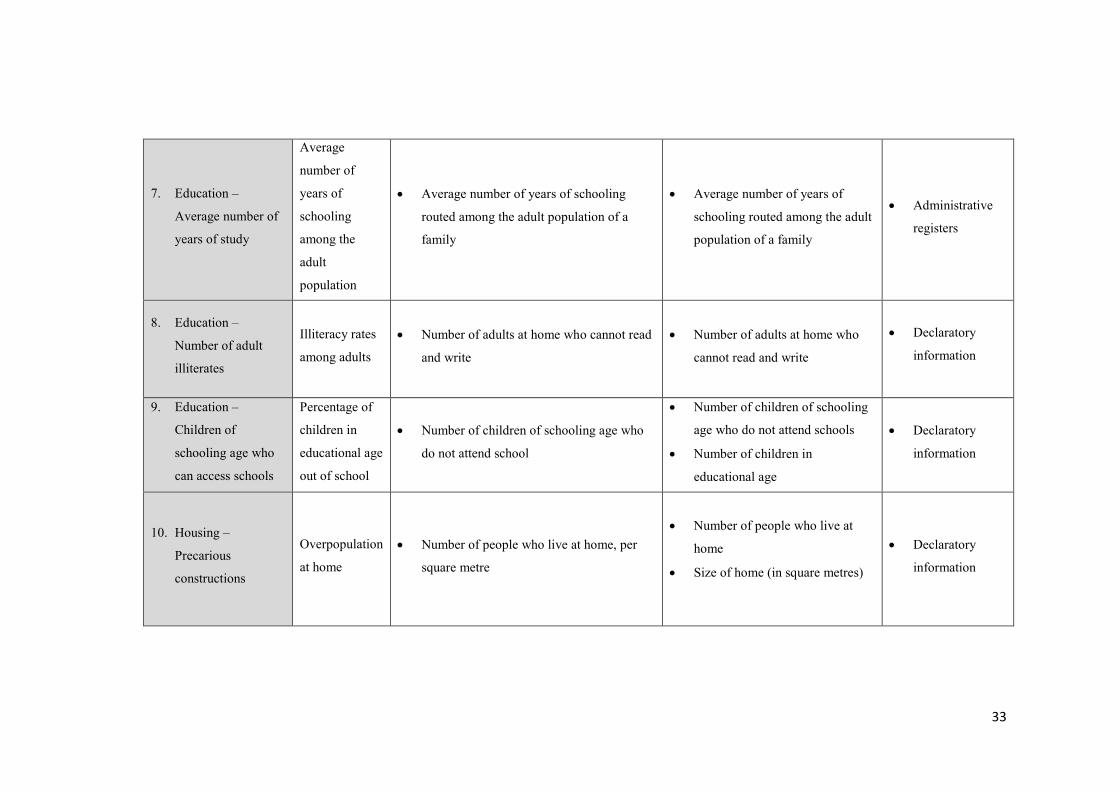
7. Education –
Average number of
years of study
Average
number of
years of
schooling
among the
adult
population
• Average number of years of schooling
routed among the adult population of a
family
• Average number of years of
schooling routed among the adult
population of a family
• Administrative
registers
8. Education –
Number of adult
illiterates
Illiteracy rates
among adults
• Number of adults at home who cannot read
and write
• Number of adults at home who
cannot read and write
• Declaratory
information
9. Education –
Children of
schooling age who
can access schools
Percentage of
children in
educational age
out of school
• Number of children of schooling age who
do not attend school
• Number of children of schooling
age who do not attend schools
• Number of children in
educational age
• Declaratory
information
10. Housing –
Precarious
constructions
Overpopulation
at home
• Number of people who live at home, per
square metre
• Number of people who live at
home
• Size of home (in square metres)
• Declaratory
information
34
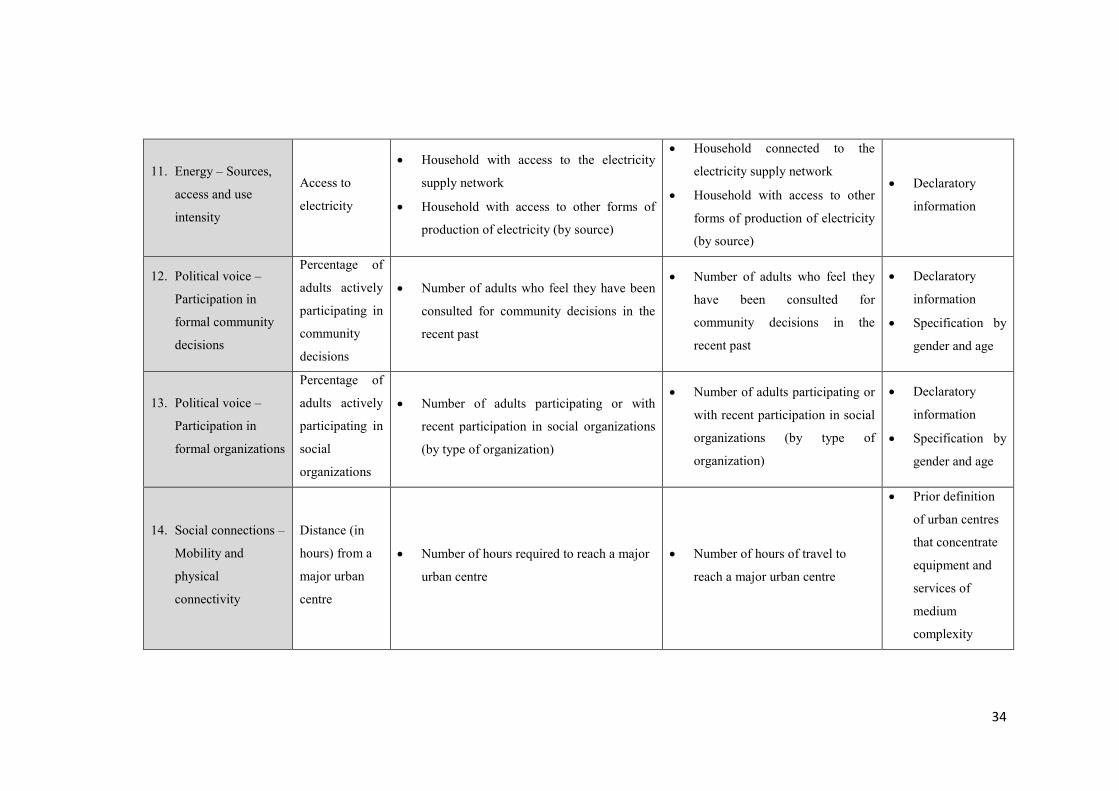
11. Energy – Sources,
access and use
intensity
Access to
electricity
• Household with access to the electricity
supply network
• Household with access to other forms of
production of electricity (by source)
• Household connected to the
electricity supply network
• Household with access to other
forms of production of electricity
(by source)
• Declaratory
information
12. Political voice –
Participation in
formal community
decisions
Percentage of
adults actively
participating in
community
decisions
• Number of adults who feel they have been
consulted for community decisions in the
recent past
• Number of adults who feel they
have been consulted for
community decisions in the
recent past
• Declaratory
information
• Specification by
gender and age
13. Political voice –
Participation in
formal organizations
Percentage of
adults actively
participating in
social
organizations
• Number of adults participating or with
recent participation in social organizations
(by type of organization)
• Number of adults participating or
with recent participation in social
organizations (by type of
organization)
• Declaratory
information
• Specification by
gender and age
14. Social connections –
Mobility and
physical
connectivity
Distance (in
hours) from a
major urban
centre
• Number of hours required to reach a major
urban centre
• Number of hours of travel to
reach a major urban centre
• Prior definition
of urban centres
that concentrate
equipment and
services of
medium
complexity
35
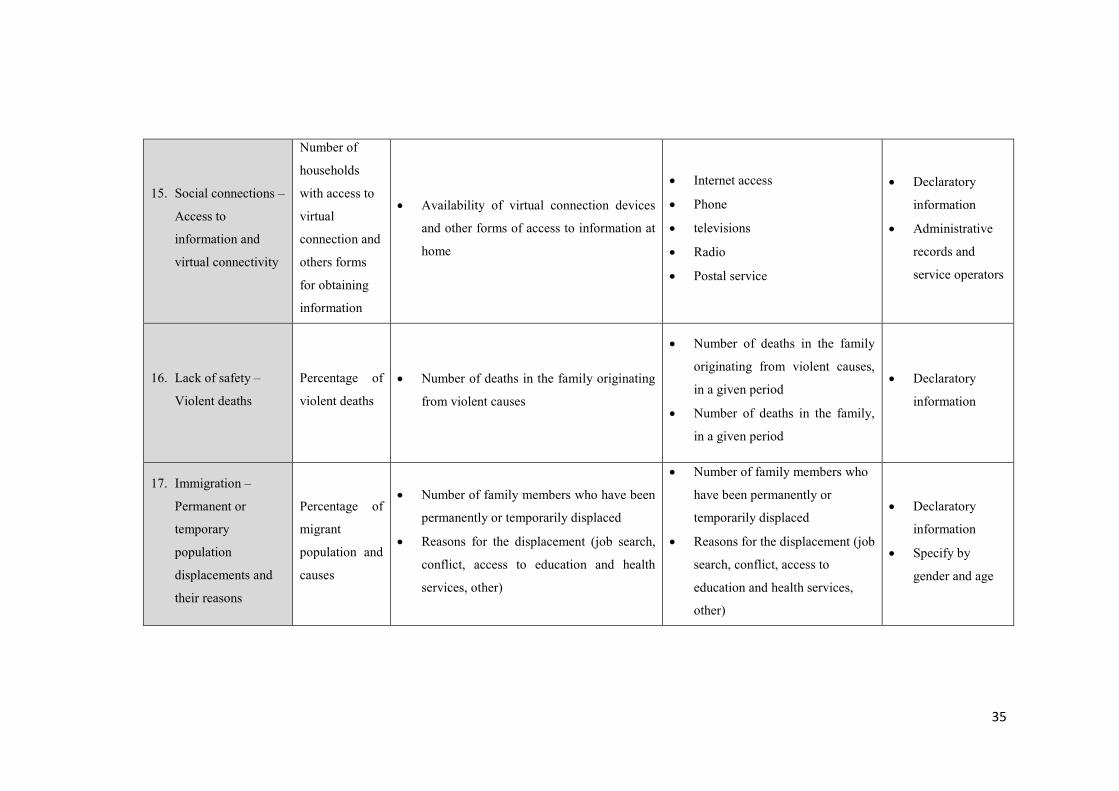
15. Social connections –
Access to
information and
virtual connectivity
Number of
households
with access to
virtual
connection and
others forms
for obtaining
information
• Availability of virtual connection devices
and other forms of access to information at
home
• Internet access
• Phone
• televisions
• Radio
• Postal service
• Declaratory
information
• Administrative
records and
service operators
16. Lack of safety –
Violent deaths
Percentage of
violent deaths
• Number of deaths in the family originating
from violent causes
• Number of deaths in the family
originating from violent causes,
in a given period
• Number of deaths in the family,
in a given period
• Declaratory
information
17. Immigration –
Permanent or
temporary
population
displacements and
their reasons
Percentage of
migrant
population and
causes
• Number of family members who have been
permanently or temporarily displaced
• Reasons for the displacement (job search,
conflict, access to education and health
services, other)
• Number of family members who
have been permanently or
temporarily displaced
• Reasons for the displacement (job
search, conflict, access to
education and health services,
other)
• Declaratory
information
• Specify by
gender and age
36
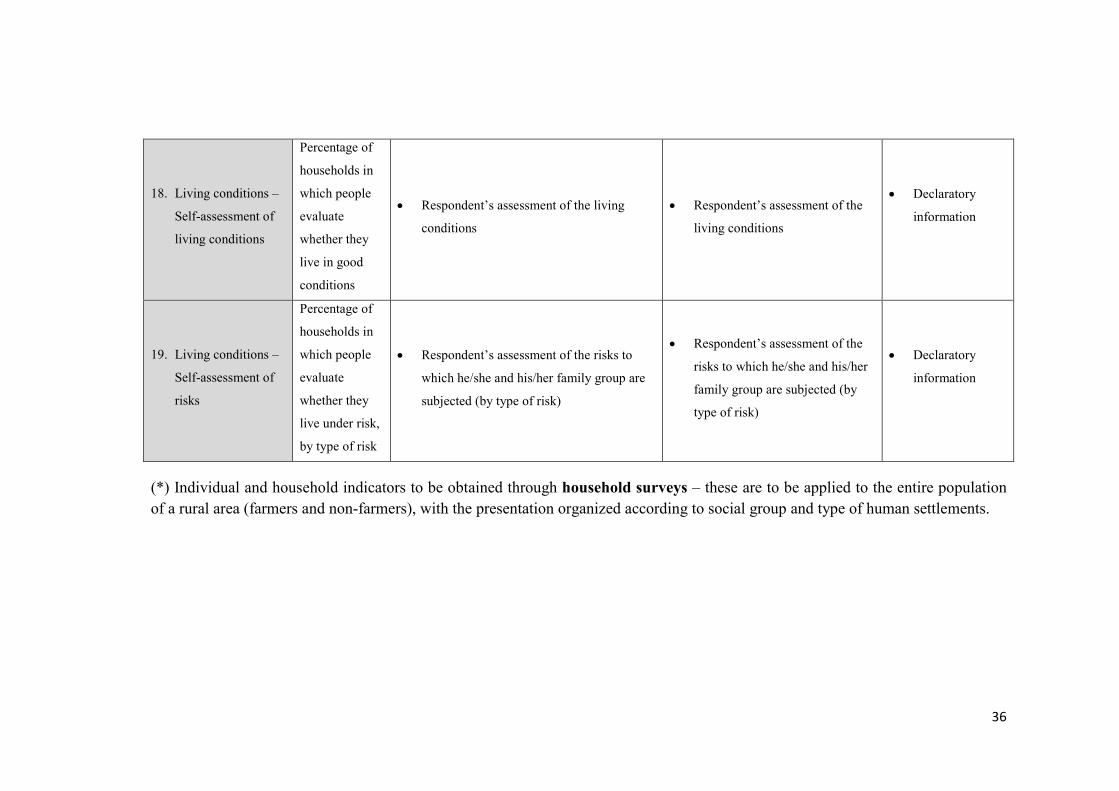
18. Living conditions –
Self-assessment of
living conditions
Percentage of
households in
which people
evaluate
whether they
live in good
conditions
• Respondent’s assessment of the living
conditions
• Respondent’s assessment of the
living conditions
• Declaratory
information
19. Living conditions –
Self-assessment of
risks
Percentage of
households in
which people
evaluate
whether they
live under risk,
by type of risk
• Respondent’s assessment of the risks to
which he/she and his/her family group are
subjected (by type of risk)
• Respondent’s assessment of the
risks to which he/she and his/her
family group are subjected (by
type of risk)
• Declaratory
information
(*) Individual and household indicators to be obtained through household surveys – these are to be applied to the entire population of a rural area (farmers and non-farmers), with the presentation organized according to social group and type of human settlements.
37
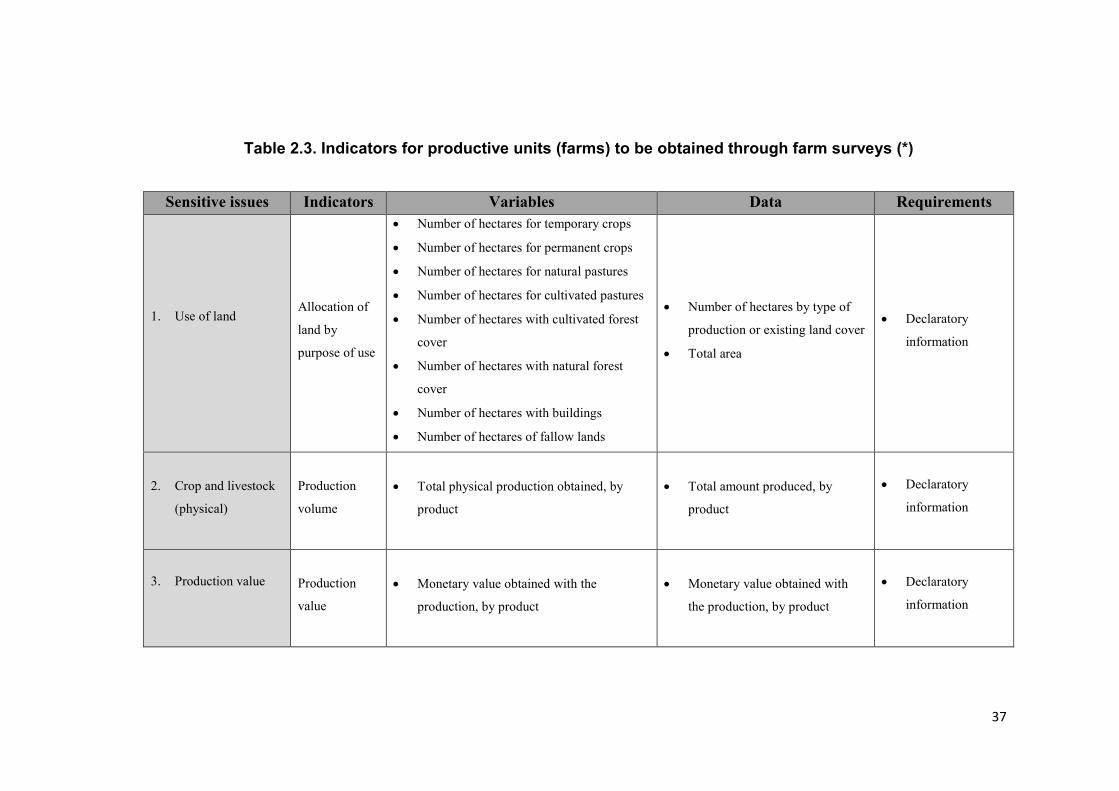
Table 2.3. Indicators for productive units (farms) to be obtained through farm surveys (*)
Sensitive issues Indicators Variables Data Requirements
1. Use of land
Allocation of
land by
purpose of use
• Number of hectares for temporary crops
• Number of hectares for permanent crops
• Number of hectares for natural pastures
• Number of hectares for cultivated pastures
• Number of hectares with cultivated forest
cover
• Number of hectares with natural forest
cover
• Number of hectares with buildings
• Number of hectares of fallow lands
• Number of hectares by type of
production or existing land cover
• Total area
• Declaratory
information
2. Crop and livestock
(physical)
Production
volume
• Total physical production obtained, by
product
• Total amount produced, by
product
• Declaratory
information
3. Production value
Production
value
• Monetary value obtained with the
production, by product
• Monetary value obtained with
the production, by product
• Declaratory
information

38
4. Farm management
Head of the
production
unit (by
gender)
• Family member at the head of the
management, by gender and age
• Gender and age of the family
member appointed as responsible
for management
• Declaratory
information
5. Income received
outside the farm
(values and sources)
Percentage of
income
obtained from
activities off
the farm, by
source of
income
• Monetary income obtained from activities
off the farm, by source
• Monetary income obtained from
activities off the farm, by source
• Declaratory
information
6. Use of workforce
Use of
workforce by
type
• Numbers of family members working
permanently in farming activities
• Number of family members working
partially in farming activities
• Number of employees outside the family
that were hired in the past year
• Frequency of employment contracts
outside the family
• Number of family members
working permanently in farming
activities
• Number of family members
working partially in farming
activities
• Number of employees outside
the family that were hired in the
past year
• Frequency of employment
contracts outside the family
• Declaratory
information

39
7. Access and use of
technology
Use of
technology, by
type
• Use of pesticides and other chemical inputs
• Use of tractors and other machines
• Using farming techniques aimed at the
natural conservation of soil and seeds
• Types of input used
• Types of tractors and machines
used
• Types of environmental
conservation techniques
• Declaratory
information
8. Access to funding
and financial
services
Access to
financial
services
• Credit use by type, values and source
• Use of insurance, by type and values
• Use of other banking services, by type
• Type of credit operations
contracted, amounts and sources
• Type of insurance used
• Type of banking services used
• Declaratory
information
9. Access to technical
agricultural support
Access to
services of
technical
assistance
• Visits by technical or other personnel to
access specialized technical assistance in
the last reference period, by type of service
provider
• Visits by technical or other
personnel to access specialized
technical assistance in the last
reference period, by type of
service provider
• Declaratory
information
10. Access to markets
Access to
markets
• Destination of production, by type of
product and type of destination
• Destination of production, by
type of product and type of
destination
• Declaratory
information
(*) Farm indicators to be obtained through farm surveys – these are to be applied to the entire population of units (family farmers and non-family farmers or other groups recognized in the country), with the presentation organized by social group or type of farming.
40
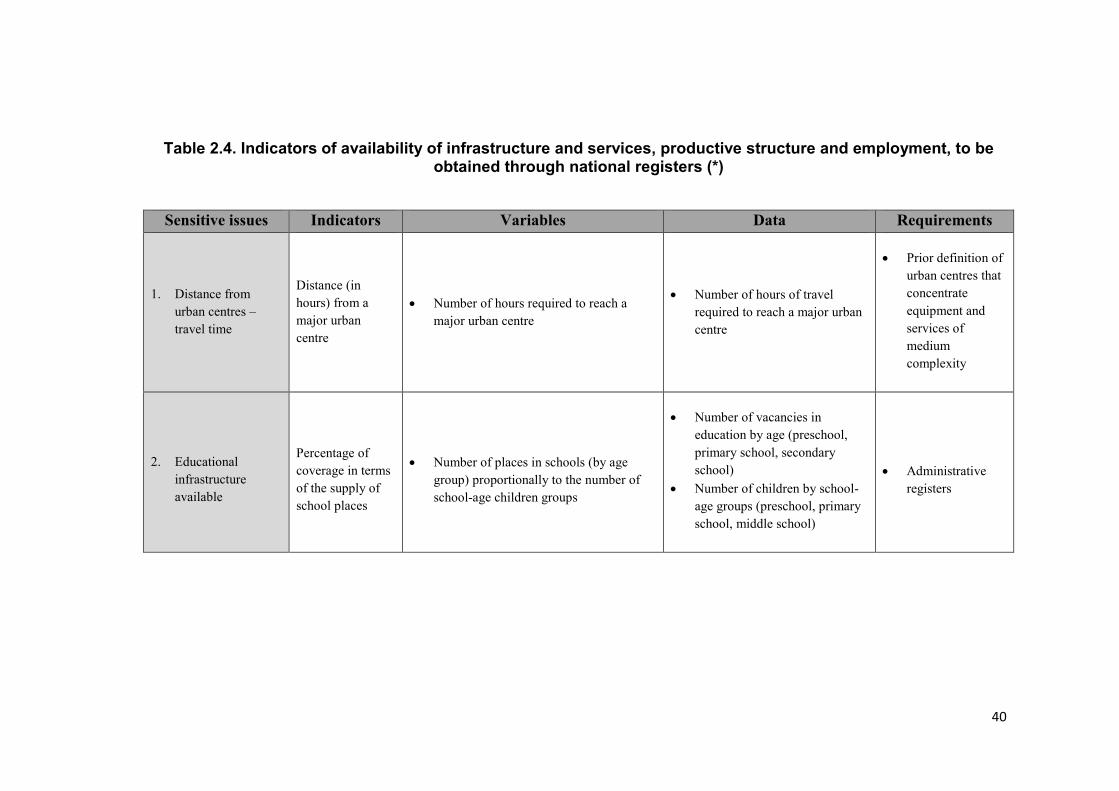
Table 2.4. Indicators of availability of infrastructure and services, productive structure and employment, to be obtained through national registers (*)
Sensitive issues Indicators Variables Data Requirements
1. Distance from urban centres – travel time
Distance (in hours) from a major urban centre
• Number of hours required to reach a major urban centre
• Number of hours of travel required to reach a major urban centre
• Prior definition of urban centres that concentrate equipment and services of medium complexity
2. Educational infrastructure available
Percentage of coverage in terms of the supply of school places
• Number of places in schools (by age group) proportionally to the number of school-age children groups
• Number of vacancies in education by age (preschool, primary school, secondary school)
• Number of children by school-age groups (preschool, primary school, middle school)
• Administrative registers

41
3. Health infrastructure available – Doctors per inhabitants
Availability of doctors per inhabitants
Number of doctors per 1,000 inhabitants • Number of doctors • Total population
• Administrative registers
4. Health infrastructure available – Hospital beds per inhabitants
Percentage of households served by primary health care
• Number of hospital beds per 1,000 inhabitants
• Number of primary care teams per 1,000 inhabitants
• Number of hospital beds • Number of primary care teams • Total population
• Administrative registers
5. Health infrastructure available (medium-level complexity services)
Number of hospitals and clinics of medium complexity in health within 4 hours of travel time
• Number of hospitals and clinics of medium complexity in health within 4 hours of travel time
• Number of hospital and clinics of medium complexity in health
• Administrative registers
6. Agricultural support infrastructure available
Number of agricultural technicians in service for family
• Number of agricultural technicians in
service per 1,000 families
Number of technicians in agricultural service
• Administrative registers

42
7. Financial services available
Number of bank branches/offices, credit unions and alternative financing funds
• Number of bank branches/offices, credit unions and alternative financing funds in the administrative unit
• Number of bank branches/offices, credit unions and alternative financing funds in the administrative unit.
• Administrative and bank registers
8. Intersectoral composition of the local economy
Evolution of the intersectoral composition of the local economy
• Percentage, in the local economy (%GDP), of each economic sector (extractive activities, agriculture and livestock, industry and transformation, trade and services)
• Value of local production (GDP), by economic sector (extractive activities, agriculture and livestock, industry and transformation, trade and services), of local economy
• Value of local production (GDP), by economic sector (extractive activities, agriculture and livestock, industry and transformation, trade and services), of local economy
• Administrative registers
43
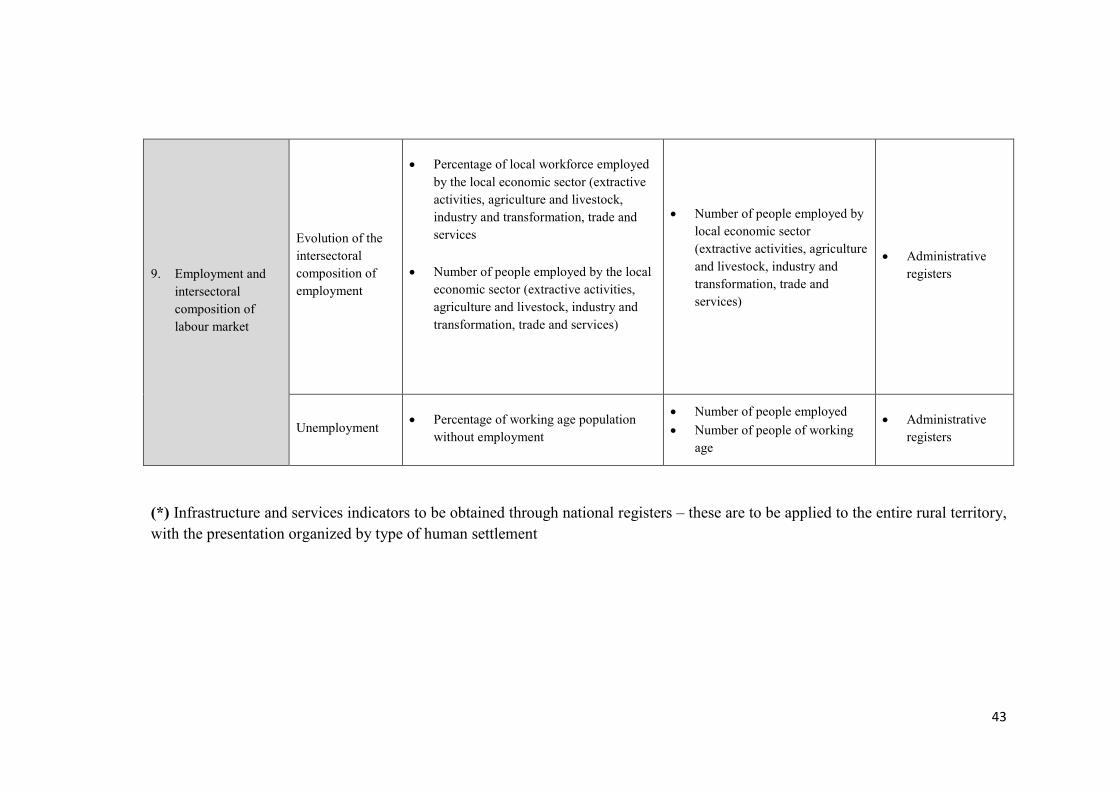
9. Employment and intersectoral composition of labour market
Evolution of the intersectoral composition of employment
• Percentage of local workforce employed by the local economic sector (extractive activities, agriculture and livestock, industry and transformation, trade and services
• Number of people employed by the local economic sector (extractive activities, agriculture and livestock, industry and transformation, trade and services)
• Number of people employed by local economic sector (extractive activities, agriculture and livestock, industry and transformation, trade and services)
• Administrative registers
Unemployment • Percentage of working age population without employment
• Number of people employed • Number of people of working
age
• Administrative registers
(*) Infrastructure and services indicators to be obtained through national registers – these are to be applied to the entire rural territory, with the presentation organized by type of human settlement

44
Table 2.5. Indicators of labour conditions for rural workers (non-farmers) to be obtained by a special module in household surveys or labour surveys (*)
Sensitive issues Indicators Variables Data Requirements
1. Income as employee
Monetary income from work as an employee
• Average monthly income obtained from wage labour
• Value of incomes obtained as an employee
• Declaratory information
2. Other sources of income
Monetary income from sources other than main job
• Average monthly income from sources other than main job
• Value of incomes obtained from sources other than main job
• Declaratory information
3. Conditions of employment (formality, seasonality)
Precarious working conditions
• Contract conditions – formal or informal • Duration of the contract (in days)
• Whether employment contract is formal
• Contract duration (in days)
• Declaratory information
4. Working day
Strenuous working hours
• Average number of hours worked during the current contract or most recent contract
• Average number of hours worked during the current contract or the most recent contract
• Declaratory information
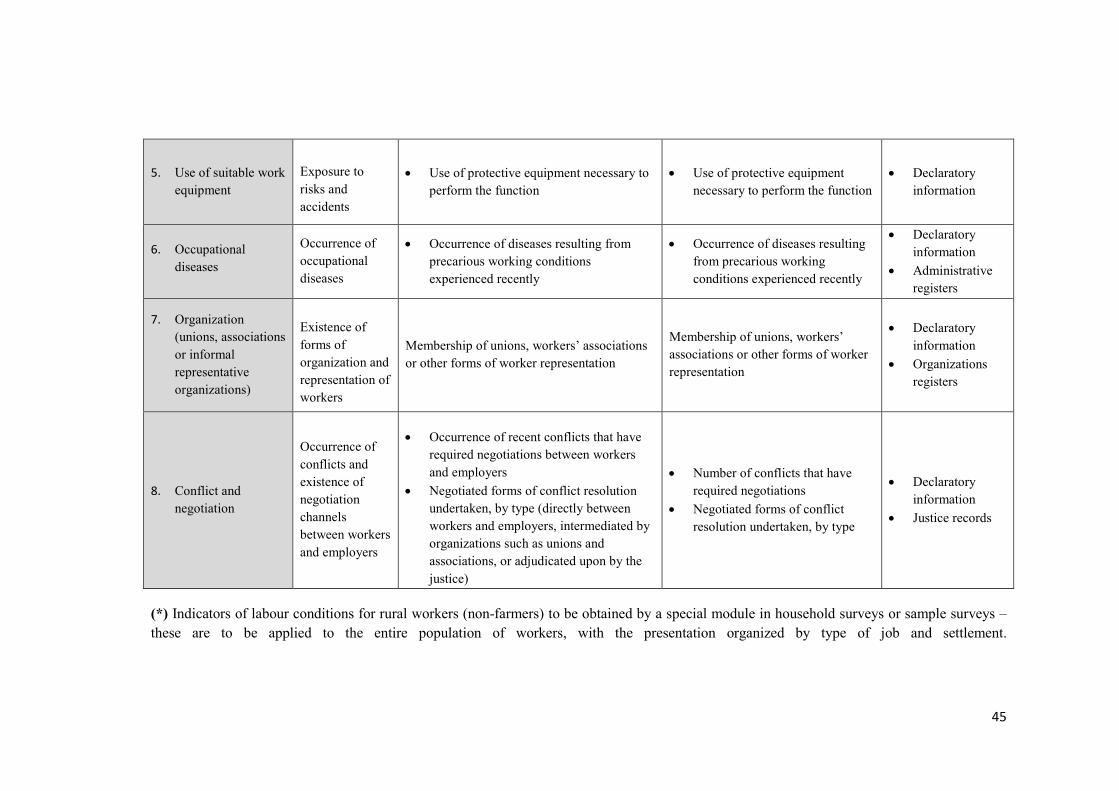
45
5. Use of suitable work equipment
Exposure to risks and accidents
• Use of protective equipment necessary to perform the function
• Use of protective equipment necessary to perform the function
• Declaratory information
6. Occupational diseases
Occurrence of occupational diseases
• Occurrence of diseases resulting from precarious working conditions experienced recently
• Occurrence of diseases resulting from precarious working conditions experienced recently
• Declaratory information
• Administrative registers
7. Organization (unions, associations or informal representative organizations)
Existence of forms of organization and representation of workers
Membership of unions, workers’ associations or other forms of worker representation
Membership of unions, workers’ associations or other forms of worker representation
• Declaratory information
• Organizations registers
8. Conflict and negotiation
Occurrence of conflicts and existence of negotiation channels between workers and employers
• Occurrence of recent conflicts that have required negotiations between workers and employers
• Negotiated forms of conflict resolution undertaken, by type (directly between workers and employers, intermediated by organizations such as unions and associations, or adjudicated upon by the justice)
• Number of conflicts that have required negotiations
• Negotiated forms of conflict resolution undertaken, by type
• Declaratory information
• Justice records
(*) Indicators of labour conditions for rural workers (non-farmers) to be obtained by a special module in household surveys or sample surveys – these are to be applied to the entire population of workers, with the presentation organized by type of job and settlement.
46
3 Production, Organization and Interpretation of Data in Policymaking – Contextual Considerations and Suggestions The indicators and the instruments presented in Chapter 1 generate a wide range of information, the interpretation and analysis of which must be adapted to the context of each country. This chapter will present suggestions on organizing the information obtained. These suggestions also seek to enable a more precise reading, and to facilitate reporting, monitoring systems, and policy formulation. The central idea is to enable a comprehension that goes beyond large-scale aggregations or the mere provision of information.
This chapter is organized around three main topics: (a) considerations on the process of preparing and collecting data, its conduction, and the forms in which the information is made available; (b) considerations on the definition of parameters and criteria for comparison within countries and in the international context, with special attention to the production of social information at the domestic level and the Sustainable Development Goals; (c) considerations on the definition of scales of comparison or typologies of social groups and territories; and (d) considerations on possible topics for in-depth studies or special reports.
3.1. The production of data and statistics
The process of producing data and statistics cannot be seen as a technical activity alone. Indeed, a set of social interests always surrounds these initiatives. The choice of variables, the use of certain types of instruments, the ways of making data available are all aspects that make it necessary to engage in dialogue with the community of experts, the information users and the
47
population that will be affected by the use of this data. The results will have greater legitimacy and, possibly, be of greater use if these interest groups participate in the decisions and if the publicity of the data meets their needs and expectations. The suggestions advanced below tend to adopt this direction.
• Previous discussion with local experts, decision makers and rural organizations or movements. There is a high degree of variation in countries’ capacities to carry out this type of research and data collection. Especially for rural populations, the degree of adaptability of the instruments must be huge. Therefore, it is strongly recommended to organize meetings and other forms of consultation with experts, decision makers and representatives of rural populations, to adapt these proposals to each site, and to improve the closeness of the information proposed to the needs of decision makers and the staff involved in delivering services and administering public policies for the rural populations.
• Open access. It is highly recommended that the data produced be made available to open access platforms. Experience shows that this type of solutions increases the credibility of information and allows for the production of a wide range of analyses and proposals by researchers and civil society. This increases the repertoire of solutions that can be adopted by the government, by organizations and by the private sector, and reinforces the principle of transparency in the production and use of information and statistics.
• Capacity building. For countries suffering from institutional weakness, it is recommended that the process of statistical production be an opportunity for capacity building, adopting initiatives for personnel training, engaging in exchanges with other countries and installing relevant physical infrastructure.
3.2. Parameters and criteria for comparison
At the domestic level, each country should define comparison criteria and outlines for the systematization of statistics that are consistent with its policy planning parameters. Certain governments may have specific targets for certain programs or regions. However, both internally and externally, international references exist and should be adopted to facilitate comparison between countries. This is the case with Agenda 2030 for Sustainable Development Goals (UN, 2015). The Agenda contains targets for seventeen objectives that

48
cover all of the important themes mentioned in the previous chapters of this report, consistent with the latest developments in the international debate on poverty and the social issue.
It is also true that many of the 169 targets set for the 17 SDGs are still formulated in a way that hampers their quantitative measurement, as noted in the Review of Targets for the Sustainable Development Goals (ICSU/ISSC, 2016). According to this document, of 169 targets, 49 (29 per cent) are considered well-developed, 91 targets (54 per cent) could be strengthened by being made more specific, and 29 (17 per cent) require significant work. For this reason, it will be necessary to follow the developments arising in the next few years on the monitoring of SDGs. In addition, each country is likely to set intermediate and progressive targets at certain intervals by 2030. For the purposes of this report, it is most important to highlight which of the indicators suggested in the previous chapter are directly related to SDGs. Table 3.1 illustrates this correlation.
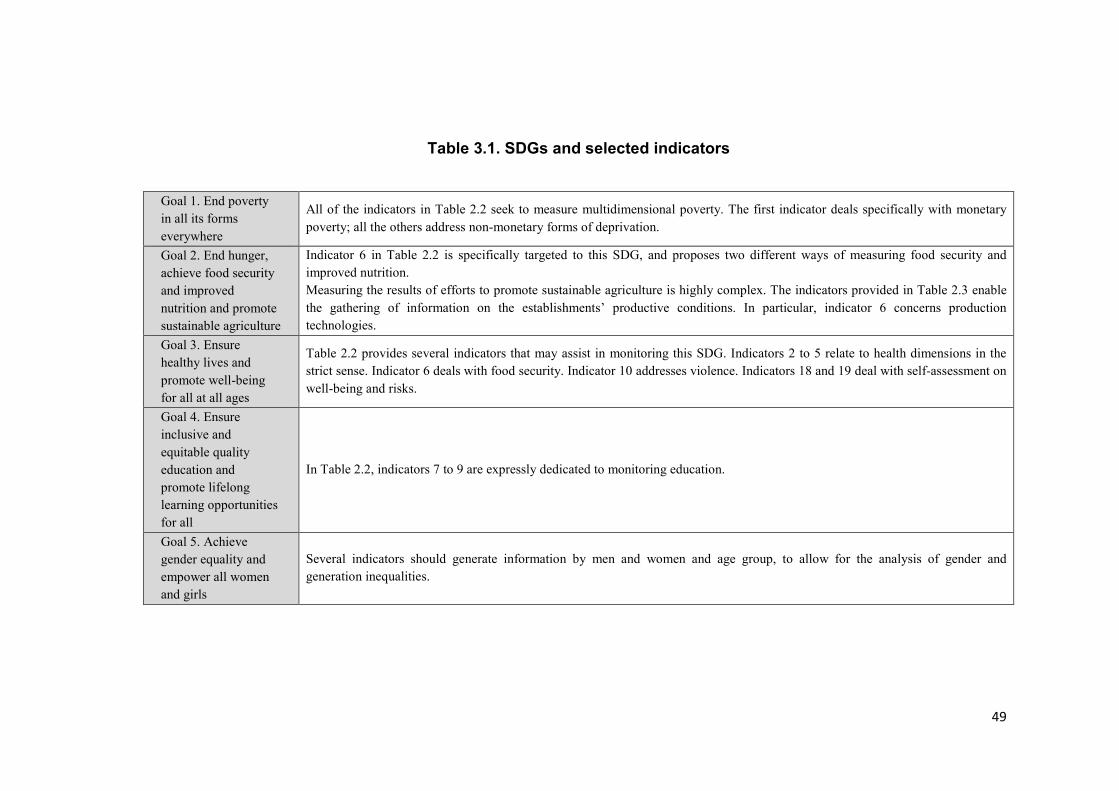
49
Table 3.1. SDGs and selected indicators
Goal 1. End poverty in all its forms everywhere
All of the indicators in Table 2.2 seek to measure multidimensional poverty. The first indicator deals specifically with monetary poverty; all the others address non-monetary forms of deprivation.
Goal 2. End hunger, achieve food security and improved nutrition and promote sustainable agriculture
Indicator 6 in Table 2.2 is specifically targeted to this SDG, and proposes two different ways of measuring food security and improved nutrition. Measuring the results of efforts to promote sustainable agriculture is highly complex. The indicators provided in Table 2.3 enable the gathering of information on the establishments’ productive conditions. In particular, indicator 6 concerns production technologies.
Goal 3. Ensure healthy lives and promote well-being for all at all ages
Table 2.2 provides several indicators that may assist in monitoring this SDG. Indicators 2 to 5 relate to health dimensions in the strict sense. Indicator 6 deals with food security. Indicator 10 addresses violence. Indicators 18 and 19 deal with self-assessment on well-being and risks.
Goal 4. Ensure inclusive and equitable quality education and promote lifelong learning opportunities for all
In Table 2.2, indicators 7 to 9 are expressly dedicated to monitoring education.
Goal 5. Achieve gender equality and empower all women and girls
Several indicators should generate information by men and women and age group, to allow for the analysis of gender and generation inequalities.
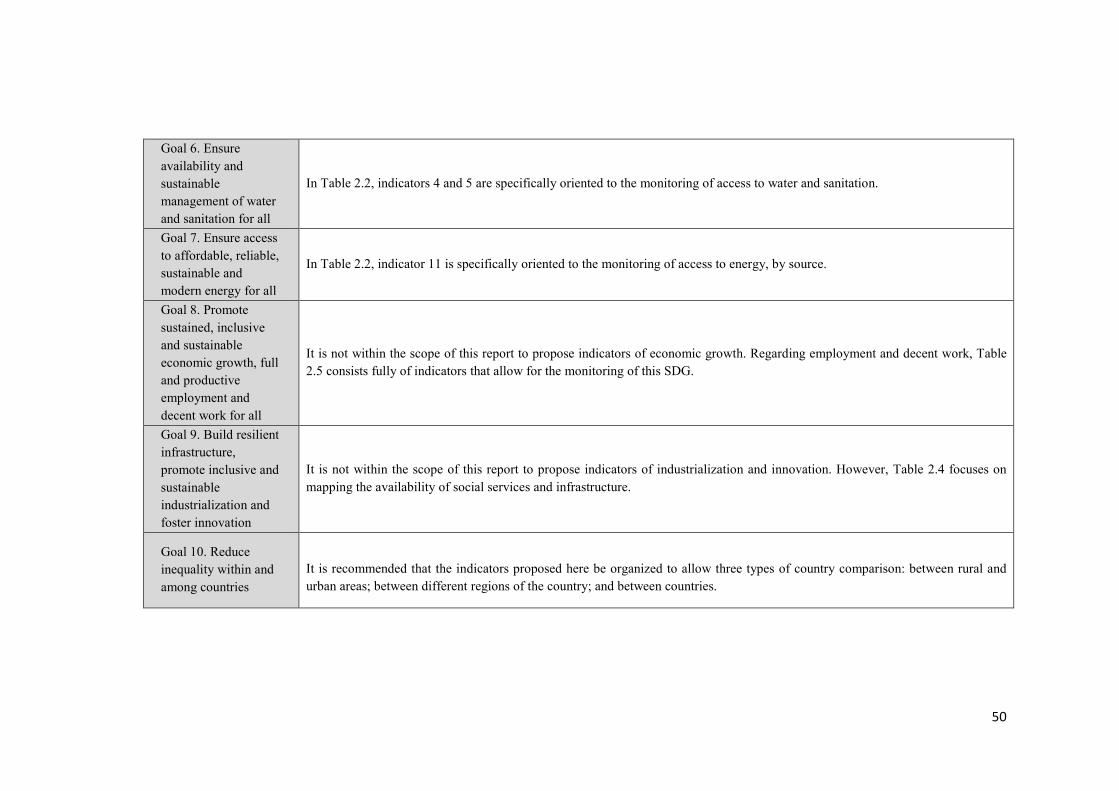
50
Goal 6. Ensure availability and sustainable management of water and sanitation for all
In Table 2.2, indicators 4 and 5 are specifically oriented to the monitoring of access to water and sanitation.
Goal 7. Ensure access to affordable, reliable, sustainable and modern energy for all
In Table 2.2, indicator 11 is specifically oriented to the monitoring of access to energy, by source.
Goal 8. Promote sustained, inclusive and sustainable economic growth, full and productive employment and decent work for all
It is not within the scope of this report to propose indicators of economic growth. Regarding employment and decent work, Table 2.5 consists fully of indicators that allow for the monitoring of this SDG.
Goal 9. Build resilient infrastructure, promote inclusive and sustainable industrialization and foster innovation
It is not within the scope of this report to propose indicators of industrialization and innovation. However, Table 2.4 focuses on mapping the availability of social services and infrastructure.
Goal 10. Reduce inequality within and among countries
It is recommended that the indicators proposed here be organized to allow three types of country comparison: between rural and urban areas; between different regions of the country; and between countries.

51
Goal 11. Make cities and human settlements inclusive, safe, resilient and sustainable
In Table 2.2, indicators 10 (housing), 14 (mobility), 16 (violent deaths), as well as 18 (self-assessment on living conditions) and 19 (self-assessment on risks) are directly related to this SDG.
Goal 12. Ensure sustainable consumption and production patterns
This SDG is more directly related to environmental issues. Among the social indicators proposed here, two should contribute to the monitoring of this SDG: in Table 2.2, indicator 11 on sources and energy intensity; in Table 2.3, indicator 7 on technologies of agricultural production.
Goal 13. Take urgent action to combat climate change and its impacts*
This SDG is more directly related to environmental issues. See the report “A Minimum Set of Environmental Indicators for Improving Rural Statistics (Global Strategy to Improve Agricultural and Rural Statistics, 2016).
Goal 14. Conserve and sustainably use the oceans, seas and marine resources for sustainable development
Does not apply to social indicators, which are the focus of this report. See the same report on the environmental issues mentioned above. .

52
Goal 15. Protect, restore and promote sustainable use of terrestrial ecosystems, sustainably manage forests, combat desertification, and halt and reverse land degradation and halt biodiversity loss
Does not apply to social indicators, which are the focus of this report. However, the indicators in Table 2.3 form part of the monitoring of sustainable uses of territorial ecosystems.
Goal 16. Promote peaceful and inclusive societies for sustainable development, provide access to justice for all and build effective, accountable and inclusive institutions at all levels
In Table 2.2, indicators 12 and 13, which deals with Political voice, are related to this SDG.
Goal 17. Strengthen the means of implementation and revitalize the global partnership for sustainable development
Partnerships to produce better rural statistics, which are the focus of this report and of all the suggestions made here, may contribute to attainment of this SDG.

53
3.3. Scales of comparison or typologies of social groups and territories
There are numerous ways to establish comparisons or elaborate typologies capable of guiding the definition of policies for rural regions. The purpose of this section is to suggest some options within this wide range of possibilities. There are three basic scales of comparison: between rural areas of a country; between rural areas and urban areas of a country; and between rural areas of different countries. The definition of what can be considered “rural” under a territorial perspective is highly controversial, and addressing the literature on this subject is not within the scope of this report; readers are referred to Offutt (2016), also produced under this initiative. Once a definition of the rural area has been adopted, it is proposed to arrange the following cross-analysis.
• Identifying rural areas with satisfactory, precarious, or very high social vulnerability. The basis for this analysis consists of the set of indicators listed in Table 2.2. In this table, 19 key indicators are proposed to cover a basic set of fundamental dimensions that affect a population’s quality of life. Three categories may be established: (a) satisfactory indicators – those that have reached or exceed the level indicated by the SDG target; (b) precarious indicators – those that are have reached a midway point to the level indicated by the SDG target (for example, a percentage equivalent to at least 50 per cent of the SDG target); and (c) indicators of very high vulnerability – those that fall far below the level indicated by the SDG target (e.g. less than 50 per cent of the SDG target). For example, the first target of SDG 1 concerns the eradication of extreme monetary poverty, such that all people have an income of at least US$ 1.24 per day. A certain area that is considered “rural” and where all (at least 95 per cent) of the inhabitants already have a minimum income equivalent to this value would be classified as being in the situation described by case “a” above. Another area in which this target has not been reached, but more than 50 per cent of the population receives a minimum income at this value would be classified as scenario “b”. A third area, in which less than 50 per cent of the population obtains this minimum income would be classified in the “c” situation. This classification could guide efforts and investments, by prioritizing certain areas according to the degree of vulnerability and to the worst performances (since vulnerability may be generalized or concentrated in certain dimensions, such as income, education, health or housing).
54
• Comparing and contrasting performance between rural areas and
urban areas. An important type of comparison is the performance of quality of life indicators verified in rural and urban areas. It should not be assumed that a citizen has a lower life expectancy or can attend school for fewer years because he or she lives in rural areas and not in large urban centres. In addition, if a certain level for an indicator has already been achieved in urban areas, this may mean that it may also be possible to reach the same figures in rural areas. Thus, the basis for this analysis is to contrast the performance obtained for each indicator of Table 2.2 with the average performance obtained in the country’s urban areas. This would make it possible to obtain an indicator of rural-urban territorial inequality. On a scale of 0 to 1, the maximum score would be obtained by those rural areas in which the performance against each indicator has attained the same levels of the mean obtained in urban areas. At the other extreme, the minimum score would be obtained by the worst possible performance against that indicator. Each rural area would be classified along this scale according to the score obtained for that particular indicator. Clearly, there is a possibility that for some indicators, the performance attained in rural areas is higher than that achieved in urban areas, especially in countries where urbanization is precarious. However, this tends to be the exception and the indicators can be adapted to these situations. The analysis conducted here will identify three scenarios: (a) rural areas having a quality of life equal to that of urban areas; (b) rural areas with deficits in the quality of life, compared to urban areas; (c) rural areas presenting a high degree of inequality in the quality of life, compared to urban areas.
• Contrasting quality of life with availability of infrastructure. While Table 2.2 illustrates social indicators, Table 2.4 provides indicators of the availability of infrastructure and services. Comparing the results obtained with the two sets of indicators is fundamental and enables two types of situations to be identified: (a) rural areas with poor indicators of quality of life and insufficient supply of services and infrastructure; (b) rural areas with poor indicators of quality of life despite a reasonable supply of infrastructure and services. In the first case, an investment effort will be required to build and provide the material conditions for the improvement of the indicators. In the second case, the quality of the supply of infrastructure and social services must be improved. To obtain this calculation, it will be necessary to define thresholds to ascertain
55
where the supply of services and infrastructure supply has attained levels that can be considered reasonable according to international experience.
• Comparing performances and availability of infrastructure among areas in which distinct rural livelihoods or forms of farming are prevalent. Table 2.3 illustrates a set of indicators to support the identification of the various livelihoods present in the rural areas of a country. It is extremely difficult and can even be considered conceptually wrong to attempt such identification a priori. Several countries have established typologies of family farming, which is somewhat different. According to these typologies, the category of farmers is divided into family farmers and entrepreneurial farmers. Family farmers are those who employ predominantly the workforce of family members and obtain their income mainly from the farm. By contrast, entrepreneurial farmers are those with a prevalent use of hired workforce. Among family farmers, three groups are usually identified: (a) consolidated family farmers, who have a relatively high monetary income; (b) intermediaries or “transition” family farmers, who earn an average monetary income; and (c) peripherals, whose monetary income is very low or who do not receive monetary income, their production being limited to subsistence. However, even within these classifications, it is possible to find very different situations, depending on cultural patterns, forms of land use, or the distinct social roles of women or young people. Due to these factors, these comparisons are more useful when performed internally within each country. Ethnic groups or types of farmers should be classified on the basis of aspects that are relevant to the local historical context. In this operation, analysing the performance of the indicators set out in Tables 2.2 and 2.4 for areas in which some of these groups predominate or where certain predominant rural livelihoods are found may be important in defining strategies or policy design. For example, it may be important to know whether there is a difference in the performance of indicators in areas where a certain ethnic group predominates. Likewise, it may be useful for governments to understand how the insertion of women and young people into a rural livelihood context affects the performance of the indicators among these groups.
56
• Identifying rural areas with precarious working conditions. Table 2.5 specifically aims to map indicators of working conditions among rural workers. The data obtained with these indicators should allow for the identification of three aspects: (a) differences in working conditions between rural workers and urban workers; (b) differences in working conditions among salaried workers in different areas of the country; (c) differences in working conditions between local rural workers and internationally recommended standards. With regard to the indicators of quality of life, it was suggested to engage in a comparison with the goals linked to the SDGs; here, in the case of the indicators of working conditions, comparison with the standards indicated by the International Labour Organization, the main reference, are recommended.
• Identifying rural areas characterized by specializations and sectoral
dependence, with greater or lesser economic dynamism. The last three indicators set out in Table 2.4 refer to the intersectoral composition of the local economy and employment. They are capable of assessing the degree of specialization (and hence dependency) of agricultural activity, the performance of economic growth for each sector of the local economy, and the evolution of the labour market, also with regard to each sector of economic activity. This is important in monitoring basic aspects of local economic life and thus in identifying possibilities for public and private investment that are capable of stimulating certain sectors and consequently enable a greater diversification of the local economy and of the sources of employment and income for rural families. In this connection, various types of data readings are possible: (a) local economies with a high degree of specialization (over 50 per cent of the economic activity or jobs are concentrated in a single sector) should be the object of policies aimed at economic diversification; (b) local economies witnessing growth in economic activity or jobs at a slower pace than the country’s average rates should be the subject of specific dynamization policies, which could increase the opportunities for poor rural people to work; and (c) local economies experiencing growth in economic activity or jobs at a pace above the country’s average rates could be the object of policies aimed at increasing the participation of the poor rural population.
• Producing in-depth studies or special reports organized by gender
or other issues. The assembly of databases with information obtained from the indicators suggested in the tables set out in this report allows

57
for the tabulation and reprocessing of data to generate oriented statistics and reports. For example, several types of information may be classified on a gender or generational basis, ths providing insights to better understand the manifestation of indicators in the specific universes of women and young people. These reports or complementary studies are essential for formulating policies and strategies that are oriented towards assisting more vulnerable groups.

58
Conclusions UN projections show that, by 2030, the world population will reach approximately 8 billion individuals, of which 40 per cent will be living in rural areas (UN, 2014). Much of the population growth will occur in the poorest countries, where the environmental impact is still relatively small, but where living conditions are also the most precarious. Improving welfare levels through the promotion of sustainable livelihoods is therefore fundamental, and an effort to which the production of better statistics can make a decisive contribution – a conclusion that this report has sought to make clear. Studies and research projects on welfare and the results of recent generations of policies for reducing rural poverty have yielded findings that may form the basis for a new generation of indicators and statistics.
The four concepts presented in Chapter 1 enable the operationalization of a new generation of indicators and statistics: the relational conception of poverty and well-being, rural livelihoods, the territorial approach to rural development and rural policies, and the consensus on the lessons learned from rural policies. Chapter 2 sought to translate these concepts into a set of indicators capable of measuring the quality of life in rural areas. Chapter 3 brought a set of suggestions on how to organize the possible analyses deriving from the use of these indicators.
This report does not seek to be a manual, but rather a map, showing paths that can facilitate the updating of existing tools or the construction of statistical systems in a relatively simple way, even in contexts in which the conditions are far from ideal. All of the information contained herein should be the subject of dialogue and adaptation to local contexts. Indeed, the production of statistics is not a mere technical exercise, but also requires the construction of legitimacy and the establishment of conditions for its use on part of decision makers.
Finally, it is important to recall that this report focuses on the social dimension of rural statistics. Its content should be considered in conjunction with at least two other reports produced under this initiative: Working Paper No. 10 on Conceptual Framework and Territorial Definitions for Improving Rural Statistics and Technical Report GO-16-2016 on A Minimum Set of Environmental Indicators for Improving Rural Statistics.

59
References Abramovay, R. 2003. O futuro das regiões rurais. UFRGS: Porto Alegre, Brazil.
Berdegué, J. & Schejtman, A. 2003. Desarrollo territorial rural. Rimisp: Santiago, Chile.
Booth, C. (1891). Life and labour of the people. Vol.s I and II. London.
CMEPSP. 2012. Report by the Commission on the Measurement of Economic Performance and Social Progress.
Ellis, F. 1991. Peasant economics – farm households and agrarian development. Cambridge University Press: Cambridge, UK.
Favareto, A. 1997. Paradigmas do desenvolvimento rural em questão. Iglu/Fapesp: São Paulo, Brazil.
FAO. 2016. Voices of the hungry: measuring food insecurity through people’s experience – one metric for the world. FAO Publication: Rome. Available at: http://www.fao.org/3/a-i5019e.pdf. Accessed on 13 September 2016.
Feres, J.C. & Mancero, F. (2001). Enfoques para la medición de la pobreza – breve revisión de la literatura. Series on Estudios Estatisdicos y Prospectivos, n. 4. Cepal: Santiago, Chile.
Garcia, A.B. 2003. Desarrollo rural – conceptos, institucionalidad y politicas. IICA: Santiago, Chile.
George, H. 1879. Progress and Poverty: An Inquiry into the Cause of Industrial Depressions and of Increase of Want with Increase of Wealth: The Remedy. New York, USA.
Global Strategy to improve Agricultural and Rural Statistics (GSARS). 2016. A Minimum Set of Environmental Indicators for Improving Rural Statistics. Technical Report Series GO-16-2016. GSARS Technical Report: Rome.
60
Available at http://gsars.org/wp-content/uploads/2016/12/TR_Minimum-Set-of-Environmental-Indicators-for-Improving-Rural-Statistics-051216.pdf. Accessed 20 January 2017.
Instituto Brasileiro de Geografia e Estatística (IBGE). 2006. Censo agropecuário – Brasil. IBGE: Rio de Janeiro, Brazil.
International Council for Science (ICSU) & International Social Science Council (ISSC). 2016. Review of Targets for the Sustainable Development Goals: The Science Perspective. ICSU Publication: Paris.
IFAD. 2016. Rural development report – 2016. IFAD Publication: Rome.
Lamarche, H. 1991. L’Agriculture familiale. Vols 1 and 2. L’Harmattan: Paris.
Maldonado, J. et al. 2016. Proteccíon, produccíon, promoción: explorando sinergias entre protección social y fomento productivo rural em América Latina. Uniandes: Bogotá.
Offutt, S. 2016. Conceptual framework and territorial definition for improving rural statistics. Working Paper n. 10. Global Strategy Working Paper: Rome.
Pesche, D., Losch, B. & Imbernon, J. 2016. Une nouvelle ruralité émergente. Regards croisés sur les transformations rurales africaines. 2nd edition. Joint Cirad & NEPAD Publication: Montpellier.
Ravaillon, M. 1992. Poverty comparisons: a guide to concepts and methods. Living Standards Measurement Studies Working Paper No. 88. World Bank Publication: Washington, D.C.
Rowntree, S. 1901. Poverty: a study of town life. Macmillan and Co.: London.
Saraceno, E. 2002. Rural development policies and the second pillar of the Agricultural Common Policy. Paper presented at the ARL/DATAR Workshop on “Desirable evolution of the CAP: a contribution”, 23 September 2002. Brussels.
Scoones, I. 1998. Sustainable rural livelihoods: A framework for analysis. IDS Working Paper No.72. IDS Publication: Brighton, UK.
61
Sen, A. 1982. Poverty and Famines: An Essay on Entitlement and Deprivation. Clarendon Press: Oxford, UK.
Sen, A. 1992. Inequality Reexamined. Clarendon Press: Oxford, UK.
Sen, A. 1999. Development as Freedom. Oxford University Press: New York, USA.
UNDP. 1998. Human Development Report. New York. Oxford. Oxford University Press.
United Nations. 2013. The Wye Group Handbook: Statistics on Rural Development and Agricultural Household Income. United Nations Publication: New York, USA.
United Nations. 2014. World urbanization prospects – 2014 revision. United Nations Publication: New York, USA.
United Nations. 2015. Transforming our world: the 2030 Agenda for Sustainable Development. United Nations Publication: New York, USA.
World Bank. 1990. World Development Report – Poverty. Oxford University Press: New York, USA.
World Bank. 2000. Rural Development Indicators Handbook. World Bank Publication: Washington, D.C.
World Bank. 2007. World Development Report 2008 – Agriculture for Development. World Bank Publication: Washington, D.C.
World Bank & FAO. 2008. Tracking results in agriculture and rural development in less-than-ideal conditions: A sourcebook of indicators for monitoring and evaluation. Joint publication of the Global Donor Platform for Rural Development, FAO & World Bank.


