Paul Foley National Centre for Vocational Education Research The socio-economic status of vocational education and training students in Australia Informing policy and practice in Australia’s training system research NCVER National Centre for Vocational Education Research
Transcript
Paul FoleyNational Centre for Vocational Education Research
The socio-economic status of vocational education and training students in Australia
Informing policy and practicein Australia’s training system re
sear
ch
NCVER National Centre for Vocational Education Research
NCVER
Paul FoleyNational Centre for Vocational Education Research
The socio-economic status of vocational education and
training students in Australia
Publisher’s note
To find other material of interest, search VOCED (the UNESCO/NCVER international database
<http://www.voced.edu.au>) using the following keywords: socio-economic background; SES;
Foreword This research was undertaken under the National Centre for Vocational Education Research’s (NCVER) internal statistical research program.
In this research, Australian Bureau of Statistics’ Socio-Economic Indicators for Areas (SEIFA) scores were applied to client residential postcodes contained in the National VET Provider Collection to establish a proxy for the socio-economic status of vocational education and training (VET) students in Australia. The research then investigated the relationship between socio-economic status and participation and achievement in the VET sector. It also looked at the extent to which training opportunities provided by the public VET system were taken up by people from different socio-economic backgrounds.
The report is directed at policy-makers and researchers interested in VET participation by people from lower socio-economic backgrounds and different population cohorts. It would also be of interest to people concerned with access and equity issues, young people and regional development.
Tom Karmel
Managing Director, NCVER
4 The socio-economic status of VET students in Australia
Contents Tables and figures 5 Key messages 6 Executive summary 7 Socio-economic status and education 9
Introduction 9 The relationship between socio-economic status and education 9 Calculation of socio-economic status 10
Socio-economic indexes 12 Socio-Economic Indexes for Areas (SEIFA) 12 Some issues about using SEIFA 14
The application of SEIFA to the National VET Provider Collection 16
Purpose of the study 16 Research questions 16 Methodology 16 Selection of SEIFA Index 17 The VET population 18 Comparison of student populations 18 Socio-economic groups 19 VET participation rates 21 Socio-economic status and regions 24 Student achievements 26 Australian Qualifications Framework level and socio-economic status 26 Conclusion and future directions 28
References 29
Tables and figures Tables 1 Participation by socio-economic group, by postcode, 2001 21 2 VET population by region and socio-economic group, 2001 25 3 AQF level by socio-economic group, 2001 27
Figures 1 Age profile of VET students, by gender, 2001 18 2 Comparison of education sectors, by SEIFA Index of
Economic Resources score 19 3 Socio-economic groups in Australia, by postcode, 2001 20 4 VET participation, by gender and age group, 2001 22 5 Age specific VET participation rate by socio-economic group,
2001 23 6 VET participation rate by socio-economic group and
employment status, Australia, 2001 23 7 VET students by region and SEIFA Index of Economic
Resources score 26
NCVER 5
Key messages This report investigates the relationship between socio-economic status and participation and achievement in the vocational education and training (VET) sector. The research examines the extent to which training opportunities provided by the public VET system are taken up by people from different socio-economic backgrounds. The relationship between socio-economic status and VET participation and achievement is determined by applying aggregate area-based Socio-Economic Indexes for Areas (SEIFA) developed by the Australian Bureau of Statistics (ABS) to the 2001 National VET Provider Collection maintained by the National Centre for Vocational Education Research (NCVER).
There is an over-representation of students from low socio-economic areas in the Australian VET sector.
This over-representation is partly driven by the relatively high participation by students in vocational education and training in regions outside the capital cities, which on average tend to be lower socio-economic areas.
People from low socio-economic areas tend to undertake lower-level qualifications.
VET students from lower socio-economic areas complete qualifications at a better-than-average rate.
6 The socio-economic status of VET students in Australia
Executive summary The purpose of this research was to establish the relationship between socio-economic status and participation and achievement in the vocational education and training (VET) sector. The research investigated the extent to which training opportunities provided by the public VET system are taken up by people from different socio-economic backgrounds.
There is a considerable body of Australian and international literature on the relationship between socio-economic status and education, with previous research identifying a strong relationship between socio-economic status and education participation and achievement in both the secondary and higher education sectors. In general, the research has found that students from higher socio-economic backgrounds have greater participation and achievement in these education sectors than students from lower socio-economic backgrounds. However, the limited research on socio-economic status and the VET sector suggests that this is not the case in the VET sector.
To investigate the relationship between socio-economic status and participation and achievement in VET, we applied an aggregate area-based index of socio-economic status produced by the Australian Bureau of Statistics (ABS) to the National VET Provider Collection maintained by the National Centre for Vocational Education Research (NCVER).
Since the 1980s, the ABS has been using data gathered in the censuses to generate indexes that summarise socio-economic status within various geographic areas in Australia. These indexes are known as the Socio-Economic Indexes for Areas (SEIFA). The indexes have gained acceptance as a useful—albeit broad—indicator of socio-economic status and have been used in analysis of the socio-economic status of school and higher education students in various studies. For example, Mukherjee (1999) used these indexes to examine school selection, while Stevenson et al. (2000) examined the relationship between socio-economic characteristics and access to VET and university and participation rates in metropolitan and non-metropolitan regions.
The limited research on socio-economic status and the VET sector has concentrated on sections of the VET population. McIntyre et al. (2000) investigated the application of the Socio-Economic Indexes for Areas to VET in Western Australia, and McIntyre (2000a, 2000b) has undertaken research on VET participation in Melbourne and Sydney. However, no research has examined the relationship between VET participation and socio-economic status using the NCVER national data collection.
The focus of this project was the student population enrolled in the public VET system in Australia in 2001. The statistics included in this publication are derived from the national collection of data from VET providers, in accordance with the Australian Vocational Education and Training Management Information Statistical Standard (AVETMISS) release 3.0. The 2001 national data collection was selected because it was considered most applicable to the 2001 Socio-Economic Indexes for Areas, compiled from the 2001 census. Data from future VET provider collections could be utilised for further research in this area.
NCVER 7
The major aims of this study were to:
compare the overall socio-economic profile of students in the VET system with the working-age population as well as with students in higher education, using the Socio-Economic Indexes for Areas
compare VET participation rates for different segments of the VET population (for example, different age groups)
compare subject completion rates and student satisfaction for different segments of the VET population
determine the socio-economic status for the identified segments of the VET population using the Socio-Economic Indexes for Areas
map the distribution of identified segments of the VET population using CData2001 (software program)
examine participation, achievement and satisfaction of VET students according to socio-economic status
compare the socio-economic profile of VET students in various regions (that is, capital cities, other metropolitan centres, rural and remote).
The basic methodology adopted in this research was to use the 2001 socio-economic indexes to allocate socio-economic scores to VET clients according to their residence (postcode). The 2001 Socio-Economic Indexes for Areas has four different indexes available. However, it was considered appropriate that only one index be applied to the national VET data collection, at least in the first instance. The Index of Economic Resources was selected because it was not biased towards education levels or qualifications of people, and because economic resources play an important role in a person’s ability to undertake VET.
This research found a strong relationship between participation and socio-economic status in the Australian VET sector. VET participation was greatest in low socio-economic areas (12.7 students per 100 population), a figure significantly higher than the national participation rate (10.8%). By contrast, high socio-economic status areas recorded a significantly lower participation rate (8.7%) compared with the national average and other socio-economic regions.
The over-representation of students from low socio-economic areas is partly due to the high participation of students from regions outside the capital cities, which tend to be low socio-economic areas. Students from remote (16.4%) and rural (13.8%) regions have significantly greater VET participation than students from non-capital metropolitan areas (10.6%) and capital cities (9.5%).
Students from low socio-economic areas are more likely to study lower-level qualifications, especially non-award/miscellaneous education (32.5%) and certificate I and II levels (31.8% combined), rather than certificate III and IV levels (28.7% combined) or diploma or higher levels (6.8%).
This research found that students from lower socio-economic areas obtain ‘better than average’ achievements. Students from low socio-economic areas were awarded a higher proportion of qualifications (30.5%) than their share of total enrolments (28.8%).
8 The socio-economic status of VET students in Australia
Socio-economic status and education
Introduction The term ‘socio-economic status’ is used extensively in educational policy and research. Although there was previously some concern expressed by Ainley and Long (1995) that policy-makers and researchers used the expression without adequately defining the term or its method of measurement, Graetz (1995) argues that there is now less concern about this issue, as the term has become more common and widely accepted. Despite the wider acceptance of the term, there remains considerable discussion on the best means to measure socio-economic status.
Generally speaking, socio-economic status is used as a measure of an individual’s or a group’s social position in the community (Mukherjee 1999). However, there is no satisfactory single measure of an individual’s or family’s socio-economic status. As social position cannot be measured directly, it is usually determined by various economic, social and physical characteristics of the environments in which individuals live and work, as well as by demographic and genetic factors (Ainley & Long 1995). According to Mukherjee (1999), different socio-economic indexes can be created—from different combinations of variables—for different uses. Selecting the most appropriate indicators and indexes for a specific analysis can be problematic.
The relationship between socio-economic status and education A considerable body of research—in Australia and other western countries—has identified a strong relationship between socio-economic status and educational participation and achievement (see, for example, Bourdieu & Passeron 1977; Williams et al. 1980; Linke, Oertel & Kelsey 1985, 1988; Shavit & Blossfeld 1993; Graetz 1995; Birrell et al. 2000). In general, these studies have found that students from higher socio-economic backgrounds have superior participation and achievement in school and higher education than those from low socio-economic backgrounds.
Research on socio-economic status and the school sector in Australia has found a strong relationship between socio-economic status and secondary education. For example, Western, McMillan and Durrington (1998) claimed that socio-economic status determines, or at the least significantly influences:
… the school system one gets into, reactions to the school experience, the completion of secondary school to Year 12, aspirations for higher education or other activity on leaving school, and what the individual in fact does at the completion of schooling. (p.11).
There is also considerable evidence of a socio-economic imbalance in the Australian higher education sector. Research has found that students from low socio-economic backgrounds display the lowest access and participation rates in higher education, and remain under-represented in virtually all fields and levels of study (Western, McMillan & Durrington 1998; James 2002). According to Dobson and Birrell (1998), the low socio-economic group is the most under-represented equity group in Australian universities. Furthermore, Birrell et al. (2000, p.60) reported there was ‘no improvement in access for people of low socio-economic background
NCVER 9
during the 1990s’. This is supported by James (2002, p.6), who found that university participation by students from low socio-economic backgrounds increased by only 0.1% (to 14.7%) during the 1990s. The Age newspaper (Alcorn & Rood 2004, p.1) recently claimed that a two-tiered higher education sector had been created, with students from disadvantaged backgrounds increasingly being ‘channelled to less elite institutions and clustered in less prestigious courses, if they get to university at all’.
Most of the research that has investigated socio-economic status and education in Australia has focused on the impact that socio-economic status has exerted on students in the school and higher education sectors. Unfortunately, there has been considerably less focus on the impact of socio-economic status on students in the vocational education and training (VET) sector. These studies have concentrated on participation in technical and further education (TAFE) institutes in Melbourne and Sydney (McIntyre 1999) or Western Australia (McIntyre et al. 2000). The limited research conducted on socio-economic status in the VET sector (for example, McIntyre 1999, 2000a; McIntyre et al. 2000) has found that this sector is distinctively different from other sectors, with TAFE participation highest in more disadvantaged areas.
Calculation of socio-economic status The preferred method for determining socio-economic status is to obtain individual data on educational, occupational and economic attainment, such as income level, educational achievement, occupation status, and employment status. Individual data are generally obtained either directly, by means of participant surveys, or as part of educational registration procedures. These approaches have been criticised by Ainley and Long (1995) as being expensive, complex, intrusive and time-consuming methods that may generate significant confidentiality concerns.
Individual data are not always available, or there are often insufficient resources available to collect them. In these circumstances it is necessary to use alternative methods, such as aggregate data—that is, data for individuals aggregated to the collective population within a certain geographical area (Graetz 1995). The aggregate area approach ‘is based on the assumption that people tend to live in areas of comparable housing quality, amongst others of broadly similar occupational, educational and income attainments’ (Linke, Oertel & Kelsey 1988, p.12). In order for the aggregate data approach to be successful, Linke, Oertel and Kelsey (1988) argued that three conditions need to be met.
Regions must be sufficiently small and homogenous to be able to reflect accurately the socio-economic characteristics of individual constituents.
A valid and reliable measure of socio-economic status must be established for each region.
The regional location of individuals must be accurately identified (Linke, Oertel & Kelsey 1988, p.12).
The application of aggregate data is considered to be a relatively ‘simple and cost effective approach, that is not open to institutional reporting bias and does not rely on intrusive questions on social background’ (Ainley & Long 1995, p.33). Furthermore, this approach can be easily applied to existing data sources, such as enrolment data, where an appropriate location identifier (for example, postcode) has been collected.
Aggregate area analysis has been criticised, particularly at higher levels of geography such as postcode, because of the heterogeneity that exists within spatial areas. Various researchers have criticised the use of aggregate analysis in assigning socio-economic status. For example, it has been argued that:
10 The socio-economic status of VET students in Australia
… assigning a value of socio-economic status to a student on the basis of the area in which they live will introduce a potential error and the magnitude of the area will be greater when the social background of those living in the area is relatively heterogeneous (Ainley & Long 1995, p.33)
McIntyre (1999, p.8) noted that the more homogeneous areas in the Socio-Economic Indexes of Areas (SEIFA) tend to be at the extremes of the scores, with the middle more heterogeneous. He also noted that the higher the level of geography and the larger the area used, the less homogeneous an area is likely to be and consequently, ‘the more general and less useful is the “disadvantage” value’.
Despite these criticisms, aggregate area analysis remains the most appropriate method for analysing socio-economic status in large data collections. It has been widely applied to student data in the school, higher education and, to a limited extent, the VET sectors.
NCVER 11
Socio-economic indexes There have been various attempts to quantify socio-economic status in Australia (Linke, Oertel & Kelsey 1988; Ross 1983, 1984; Ross, Farish & French 1985; Ross, Farish & Plunkett 1988; ABS 2004). The Australian Bureau of Statistics (ABS) first constructed an area-based index of socio-economic disadvantage after the 1971 Census of Population and Housing. Since then it has produced the Socio-Economic Indexes for Areas (SEIFA) from the 1986, 1991, 1996 and 2001 censuses.
Socio-Economic Indexes for Areas (SEIFA) The ABS used Ainley et al’s. (1995) concept of disadvantage as the foundation for SEIFA. This viewed disadvantage as an extension to socio-economic status, which could be measured by education, occupation and income indicators (ABS 2004, p.2). Socio-economic disadvantage was defined as ‘those factors that put someone at a disadvantage compared to someone else’ (ABS 2004, p.2). Examples of these socio-economic factors include wealth, residential conditions, health, access to services, and language.
SEIFA 2001 indexes are based on data collected in the 2001 Census on Population and Housing. The core unit of analysis for both SEIFA 2001 and the census is the collection district, which is the smallest geographic area of both the Australian Standard Geographical Classification and Census Geographic Areas. Collection districts are only defined in a census year, and comprise approximately 220 dwellings in urban areas and slightly fewer in rural areas.
SEIFA 2001 methodology
The ABS undertook a comprehensive review of the methodology for SEIFA 2001 and, as a result, incorporated a new variable selection strategy—based on a theoretical model of disadvantage—into SEIFA 2001. The theoretical model grouped potential variables into three levels:
Level 1: consists of core variables such as education (or qualification), income and occupation, which are always included in SEIFA indexes because they are fundamental to measuring socio-economic status.
Level 2: are direct measures of an aspect of disadvantage that relate to things like wealth (number of motor vehicles, number of rooms in house), living conditions (type of residence; number of bedrooms), employment status (unemployment), language disadvantage (low fluency in English) and access to services (access to the internet).
Level 3: includes variables that reflect—but do not directly measure—disadvantage. For example, Indigenous status may be associated with poor health or living conditions or divorced/separated status may be associated with low income. Some components of the disadvantage may have already been captured by higher level two variables. Level three variables have been included where it appeared that some additional aspect of disadvantage still remained to be measured over and above that from level one and two variables. Level three variables can be thought of as indicators which signal that an area has some
12 The socio-economic status of VET students in Australia
disadvantage. The inclusion of level three variables means that while it may reflect an area’s disadvantage, it is not possible to identify all aspects of disadvantage being represented. Only the Index of Disadvantage has level three variables (ABS 2003, 2004).
The ABS used principal components analysis to summarise selected variables for SEIFA 2001 (see ABS 2004 for details of this methodology). The analysis produced a socio-economic score for each collection district in Australia. These index scores were standardised to have a mean of 1000 and a standard deviation of 100 across all collection districts in Australia. Consequently, approximately 95% of index scores are between 800 and 1200.
SEIFA 2001 consists of four distinctive socio-economic indexes, which use different combinations of variables from the 2001 census. These indexes are:
Index of Disadvantage
This is the most general measure of disadvantage of all four SEIFA indexes. It is the only index that incorporates three levels of variables that either reflect or measure disadvantage. This index is most comparable of all 2001 indexes to its 1996 counterpart as it uses the same method and the same variables as the 1996 Index of Disadvantage.
The lower an Index of Disadvantage score, the more disadvantaged that area is. Low scores occur when areas have high numbers of households on low incomes and large numbers of unskilled people. In contrast, high index scores indicate that areas have few households on low income and few people with little training and in unskilled occupations. High scores denote a lack of disadvantage rather than high advantage.
Index of Advantage/Disadvantage
This index measures and ranks an area in terms of both advantage and disadvantage. The higher the index score, the ‘more advantaged’ an area is considered to be. Areas with high index scores are more likely to have higher proportions of people on high incomes and more skilled workforces than areas with lower scores, which are more likely to have higher proportions of individuals with low incomes (and few people with high incomes) and a relatively unskilled workforce.
Index of Education and Occupation
The educational and occupational structure of a community is reflected in this index. The index only uses level one variables and provides specific rankings based on educational background and type of occupation. For education, variables such as the level of qualification achieved or whether further education is being undertaken are used. Occupation variables use the major groups of the Australian Standard Classification of Occupations (ASCO) and the unemployed.
Areas with low index scores are more likely to have higher proportions of individuals with lower educational levels and a relatively unskilled workforce than areas with high scores, which are more likely to have high proportions of qualified people and more skilled workforces.
Index of Economic Resources
This index summarises the economic resources of families within an area. It only includes variables that measure economic disadvantage, such as income (income specified by family structure, to determine disposable income), expenditure (rent) and wealth (home ownership, dwelling size) of families. High index scores indicate an area has a large proportion of families on high incomes, a small proportion of low-income families, and many households living in large houses, that is, four or more bedrooms. In contrast, a low index score indicates an area has a relatively high proportion of households on low incomes and living in small dwellings.
NCVER 13
SEIFA geography
The core unit of analysis for SEIFA is the collection district, and the indexes can be aggregated up into higher units of analysis. SEIFA 2001 is available at various Australian Standard Geographical Classification areas such as:
♦ ♦ ♦ ♦ ♦
statistical local area (SLA)
statistical subdivision (SSD)
statistical division (SD)
state/territory (S/T)
local government area (LGA).
SEIFA 2001 is also available according to different Census Geographic Areas such as:
postal area (POA)
state suburbs (SSC)
state electoral division (SED)
Commonwealth electoral division (CED).
Importantly, the indexes for these higher-level areas have not been standardised.
Some issues about using SEIFA A total of 1514 of the 37 209 collection districts in Australia were excluded from SEIFA 2001 because of confidentiality concerns, as they had one of the following features:
low population (<=10 people)
low numbers of employed people (<=5 people)
large proportion of non-private dwellings etc.
large proportion (70+%) of collection district population not responding to questions on: family income occupation labour force status type of education institution being attended, or qualifications (ABS 2004, p.7).
The exclusion of postcodes means that some higher-level data from SEIFA 2001 may not be comparable with other ABS statistics.
ABS (2003) emphasised that the SEIFA indexes are ‘ordinal measures’ and not ‘interval measures’. They stated:
The indexes can be used to order areas in terms of disadvantage; but any other arithmetic relationships between index values may not be meaningful. For example, a CD [collection district] with an index value of 1,200 does not have twice the wellbeing of a CD with an index value of 600. Similarly, the socioeconomic difference between two CDs with index values of 800 and 900 is not necessarily the same as the difference between two CDs with index values of 1,050 and 1,150. (ABS 2003, p.14)
SEIFA values are calculated from aggregated data for an area (collection district, postcode, statistical local area etc.). Consequently, they reflect the socio-economic characteristics of that
14 The socio-economic status of VET students in Australia
area, not individuals. It is not appropriate to base inferences about a particular individual on index scores of the area they live in.
SEIFA 2001 indexes are time-specific, being calculated from data collected in the 2001 Census on Population and Housing conducted on 7 August 2001. Therefore, SEIFA indexes only indicate the level of disadvantage at this time. However, areas are not static and there is often movement of people into and out of areas. In some instances, these movements will not result in any significant changes in SEIFA indexes if they were to be recalculated, while in other instances there would be significant changes. A prime example of an area undergoing substantial socio-economic change is the suburb of Ferryden Park in Adelaide (postcode 5010, which also includes the suburbs of Angle Park and Regency Park). In 2001, this postcode area had the lowest SEIFA value of all capital city postcodes in Australia. However, the area is undergoing a staged urban renewal, with many of the previous public housing tenants being relocated from the area. Most of the existing public housing is being demolished and the land being subdivided and sold by private developers, with new housing being built. The application of SEIFA 2001 scores to the redeveloped parts of Ferryden Park is no longer accurate.
As stated previously, McIntyre (2000a, pp.6–7) has identified a number of problems using the SEIFA indexes, in particular, the degree of socio-economic homogeneity within areas and problems with higher levels of geography. He also argued that not all the relevant data for defining disadvantage were collected in the census, and that areas of highest disadvantage had the highest rates of non-response on critical questions such as prior schooling.
NCVER 15
The application of SEIFA to the National VET
Provider Collection
Purpose of the study The objective of this project was to determine the extent of the relationship between participation and achievement in the public VET system, on the one hand, and ‘socio-economic level’ (as defined and measured by ABS), on the other. This was done for the whole student population in the public VET system and for some selected sub-populations.
Research questions The primary aim of this project was to establish the relationship between socio-economic status and VET participation and achievement. The research investigated the extent to which training opportunities provided by the public VET system were taken up by people from different socio-economic backgrounds and the achievements and outcomes for different groups in the VET population.
The major aims of this study were to:
compare the overall socio-economic profile of students in the VET system with the working-age population and also with students in higher education, using SEIFA indexes
compare VET participation rates for different segments of the VET population
compare subject completion rates for different segments of the VET population
determine the socio-economic status for the identified segments of the VET population using SEIFA indexes
map the distribution of identified segments of the VET population using CData2001 (data from the 2001 Census of Population and Housing)
examine participation, achievement and satisfaction of VET students according to socio-economic status
compare the socio-economic profile of VET students in various regions (that is, capital cities, other metropolitan centres, rural and remote).
Methodology This research project utilised the national data collection for VET providers, which collects training activity from training organisations receiving public funding for infrastructure for the delivery of VET programs. The collection is undertaken within the scope of the Australian Vocational Education and Training Management Information Statistical Standard (AVETMISS), in order to obtain a nationally consistent standard for the collection, analysis and reporting of VET information throughout Australia. The national data collection reports on training activity in
16 The socio-economic status of VET students in Australia
a specific calendar year, with the collection period commencing on 1 January and ending on 31 December.
In practice, the scope for the national collection applies to those vocational education and training programs delivered by:
state and territory technical and further education (TAFE) systems
higher education institutions
other public institutions including schools
registered community education providers
other registered training organisations in receipt of government funds.
The 2001 National VET Provider Collection was selected for analysis because it was the most comparable with other data sources, such as SEIFA 2001 and other ABS data held by the National Centre for Vocational Education Research (NCVER). The 2001 collection contains data for nearly 1.7 million VET students.
Postcode was adopted as the spatial unit of analysis for this study, as client residential postcode is collected as part of the Australian Vocational Education and Training Management Information Statistical Standard. Furthermore, SEIFA indexes can be calculated at this unit. The SEIFA database calculated—and exported—scores for postcodes in Australia. It is necessary to mention that the SEIFA database does not include all postcodes in Australia, with post office boxes and large volume receivers not indexed. However, SEIFA 2001 provides scores for more than 2400 postcodes in Australia.
Various variables and cross-tabulations of aggregate VET client data were extracted at the postcode level from the 2001 National VET Provider Collection and mapped to SEIFA indexes by postcode. Data that did not correspond to SEIFA postcodes were deleted from the analysis, causing a slight under-reporting of most rates. In addition, some postcodes were missing and therefore the data were excluded. However, analysis of the 2001 National VET Provider Collection provides extensive information on more than 1.69 million students.
McIntyre (2000a, p.9) argued that postcodes were more applicable as a unit of analysis for vocational education and training in urban areas than in rural or remote areas because they were smaller areas.
Selection of SEIFA Index Any of the four SEIFA indexes can be applied to the National VET Provider Collection. However, it was considered most effective—in the first instance at least—to use only one socio-economic index. The Index of Economic Resources was selected as the most appropriate index because it reflects the economic resources of a household, which strongly influence an individual’s ability to undertake vocational education and training. In addition, unlike the other indexes that place considerable emphasis on education and qualifications, the Index of Economic Resources is not influenced by the education and qualifications of residents within an area. This would appear relevant when applying SEIFA in the VET sector. A final factor taken into consideration was that other research projects have also used the Index of Economic Resources.
McIntyre (2000a, p.5) considered the Index of Economic Resources a better measure for examining low VET participation and achievement than the Index of Education and Occupation because it captured factors, such as low income and poor housing, that depress VET participation. He argued that the education and occupation index was ‘less likely to predict low
NCVER 17
VET participation because of the strong correlation of TAFE participation and measures such as the percentage of the adult population who hold a basic or skilled qualification’ (McIntyre 2000a, p.5).
The VET population Age and gender
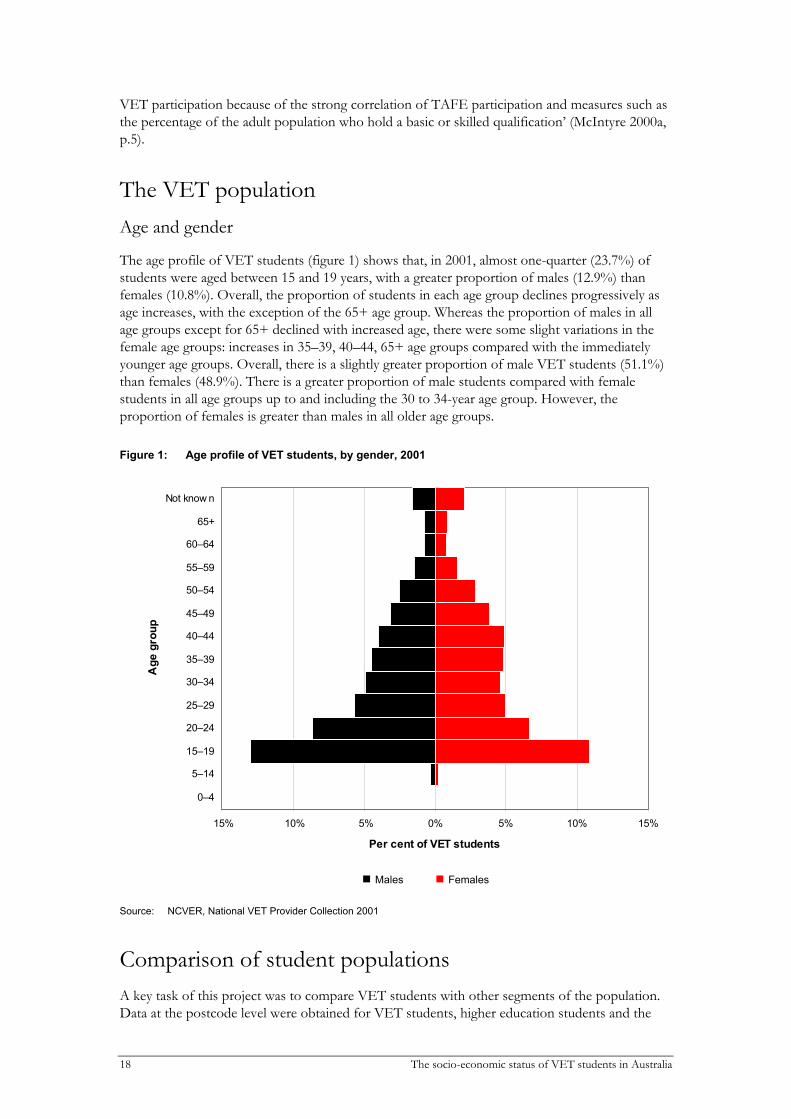
The age profile of VET students (figure 1) shows that, in 2001, almost one-quarter (23.7%) of students were aged between 15 and 19 years, with a greater proportion of males (12.9%) than females (10.8%). Overall, the proportion of students in each age group declines progressively as age increases, with the exception of the 65+ age group. Whereas the proportion of males in all age groups except for 65+ declined with increased age, there were some slight variations in the female age groups: increases in 35–39, 40–44, 65+ age groups compared with the immediately younger age groups. Overall, there is a slightly greater proportion of male VET students (51.1%) than females (48.9%). There is a greater proportion of male students compared with female students in all age groups up to and including the 30 to 34-year age group. However, the proportion of females is greater than males in all older age groups.
Figure 1: Age profile of VET students, by gender, 2001
15% 10% 5% 0% 5% 10% 15%
0–4
5–14
15–19
20–24
25–29
30–34
35–39
40–44
45–49
50–54
55–59
60–64
65+
Not know n
Age
gro
up
Per cent of VET students
Males FemalesMales Females
Source: NCVER, National VET Provider Collection 2001
Comparison of student populations A key task of this project was to compare VET students with other segments of the population. Data at the postcode level were obtained for VET students, higher education students and the
18 The socio-economic status of VET students in Australia
working-age population (estimated at population aged 15–64 years) and matched against SEIFA 2001 Index of Economic Resources. Data for the three populations were ranked according to the Index of Economic Resources postcode score, and the proportion of each population was calculated at each postcode and then cumulated. Figure 2 shows the cumulative proportion of each of the three populations living in postcodes at or below specific SEIFA scores. The comparison of socio-economic levels shows that higher education students have notably higher socio-economic levels than the working-age population, which in turn is higher than the VET student population.
Figure 2: Comparison of education sectors, by SEIFA Index of Economic Resources score
0%
10%
20%
30%
40%
50%
60%
70%
80%
90%
100%
700
740
780
820
860
900
940
980
1020
1060
1100
1140
1180
1220
1260
1300
SEIFA Index of Economic Resources
Cum
ulat
ive
prop
ortio
n of
pop
ulat
ion
Higher education population Working-age population VET population VET population Working-age population Higher education population
Sources: NCVER, National VET Provider Collection 2001; ABS, Population by Age and Sex, Australia, June 2001, cat.no.3235.1.55.001; Department of Education, Science and Training, unpublished statistics; ABS, SEIFA 2001
Socio-economic groups Calculation of socio-economic groups
The large number of SEIFA scores creates some difficulties when analysing the National VET Provider Collection data. Therefore it is beneficial to examine the data according to three broad socio-economic bands: high, middle and low socio-economic status. A number of different options were available for determining these socio-economic bands. The first option was to simply divide the range of SEIFA values into four equal groups. For example, where SEIFA values ranged from 601 to 1200, the groups would be 601–750, 751–900, 901–1050 and 1051–1200. A second option was to use SEIFA quartiles; these postcodes are ranked according to SEIFA scores and then divided into quartiles. However, neither of these two options takes into consideration the population in the bands or postcodes. The third option—and the one adopted for this project—was to calculate socio-economic classes as a proportion of the total Australian population. Postcode data were ranked according to SEIFA 2001 scores (for example, Index of Economic Resources scores ranked in ascending order). The population of each postcode was
NCVER 19
determined as a proportion of the total population and cumulated. The list was then divided into four equal groups according to population in the postcodes. The low socio-economic group represents those postcodes with the lowest SEIFA values in which one-quarter of the Australian population live. By contrast, the high socio-economic class consists of postcodes with the highest SEIFA values for one-quarter of the population. The second and third quartiles were amalgamated to form the middle socio-economic group. The three socio-economic groups at the postcode level are shown in figure 3.
Figure 3: Socio-economic groups in Australia, by postcode, 2001
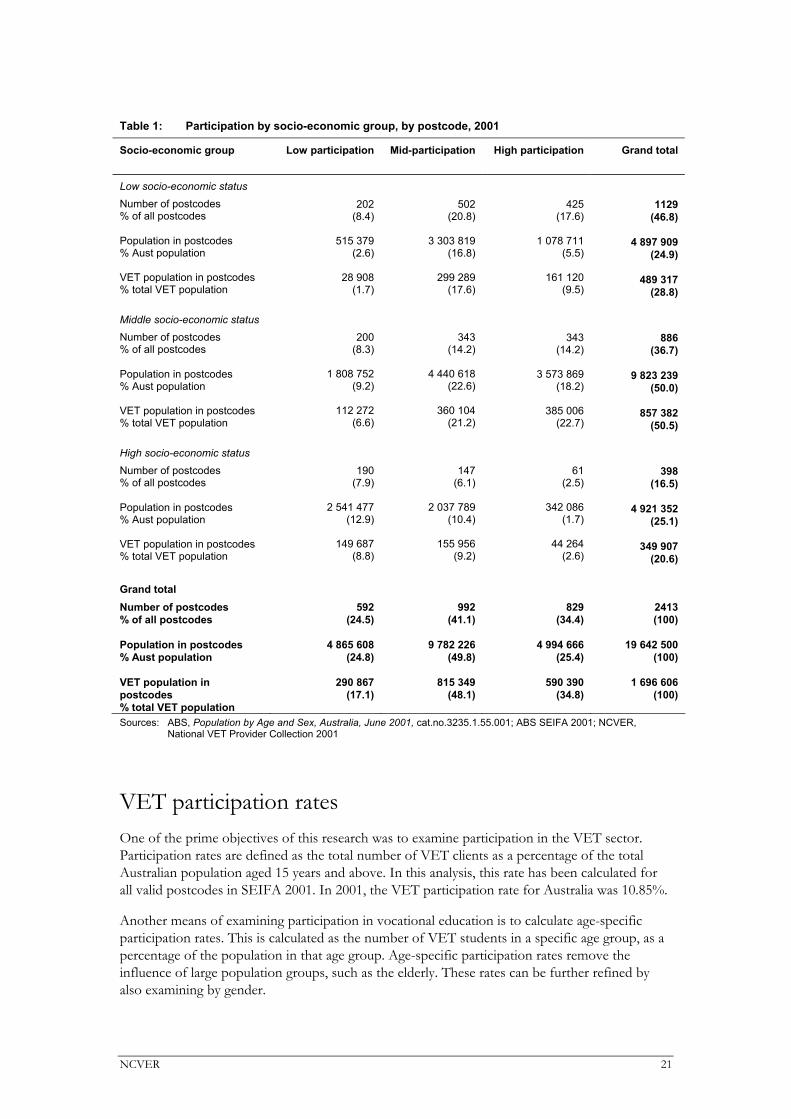
The grouping of postcodes into socio-economic groups resulted in 1129 postcodes within the low socio-economic band (table 1). In 2001 these 1129 postcodes contained 4 897 909 people—or 24.9% of the total Australian population—and 489 317 VET clients—or 28.8% of the total VET population. At the other end of the scale, there were 398 postcodes in the high socio-economic group. Although these postcodes contained 25% of the total Australian population, they contained only 20.6% of the total VET population. The residual mid-socio-economic group contained 886 postcodes and 9 823 239 people (50.0% of total Australian population) and 857 382 (50.5%) of total VET clients.
20 The socio-economic status of VET students in Australia
Table 1: Participation by socio-economic group, by postcode, 2001
Socio-economic group Low participation Mid-participation High participation
Grand total
Low socio-economic status Number of postcodes % of all postcodes Population in postcodes % Aust population VET population in postcodes % total VET population
202
(8.4)
515 379(2.6)
28 908(1.7)
502
(20.8)
3 303 819(16.8)
299 289(17.6)
425
(17.6)
1 078 711 (5.5)
161 120
(9.5)
1129
(46.8)
4 897 909(24.9)
489 317(28.8)
Middle socio-economic status Number of postcodes % of all postcodes Population in postcodes % Aust population VET population in postcodes % total VET population
200
(8.3)
1 808 752(9.2)
112 272(6.6)
343
(14.2)
4 440 618(22.6)
360 104(21.2)
343
(14.2)
3 573 869 (18.2)
385 006
(22.7)
886
(36.7)
9 823 239(50.0)
857 382(50.5)
High socio-economic status Number of postcodes % of all postcodes Population in postcodes % Aust population VET population in postcodes % total VET population
190
(7.9)
2 541 477(12.9)
149 687(8.8)
147
(6.1)
2 037 789(10.4)
155 956(9.2)
61
(2.5)
342 086 (1.7)
44 264
(2.6)
398
(16.5)
4 921 352(25.1)
349 907(20.6)
Grand total Number of postcodes % of all postcodes Population in postcodes % Aust population VET population in postcodes % total VET population
592
(24.5)
4 865 608(24.8)
290 867(17.1)
992
(41.1)
9 782 226(49.8)
815 349(48.1)
829
(34.4)
4 994 666 (25.4)
590 390
(34.8)
2413(100)
19 642 500(100)
1 696 606(100)
Sources: ABS, Population by Age and Sex, Australia, June 2001, cat.no.3235.1.55.001; ABS SEIFA 2001; NCVER, National VET Provider Collection 2001
VET participation rates One of the prime objectives of this research was to examine participation in the VET sector. Participation rates are defined as the total number of VET clients as a percentage of the total Australian population aged 15 years and above. In this analysis, this rate has been calculated for all valid postcodes in SEIFA 2001. In 2001, the VET participation rate for Australia was 10.85%.
Another means of examining participation in vocational education is to calculate age-specific participation rates. This is calculated as the number of VET students in a specific age group, as a percentage of the population in that age group. Age-specific participation rates remove the influence of large population groups, such as the elderly. These rates can be further refined by also examining by gender.
NCVER 21
As expected, VET participation is highest in the 15 to 19-year age group for both males (32.4 per 100 students) and females (28.4 per 100). As illustrated in figure 4, participation rates for males decline steeply for the 20 to 24 and 25 to 29-year age groups, and then decline further for all other age groups. By contrast, the female participation rates decline steeply for the 20 to 24-year age group, then less steeply for the 25 to 29 and 30 to 34-year age groups. Interestingly, female participation rates then increase for the 35 to 39 and 40 to 44-year age groups, before commencing a steady decline.
VET participation rates are higher for males than females in all age groups up to and including the 30 to 34-year age group. Thereafter, female participation rates are greater until the 65+ year age groups, when male participation is slightly higher.
Figure 4: VET participation, by gender and age group, 2001
0%
5%
10%
15%
20%
25%
30%
35%
1–14
15–1
9
20–2
4
25–2
9
30–3
4
35–3
9
40–4
4
45–4
9
50–5
4
55–5
9
60–6
4
65+
Age group (years)
Part
icip
atio
n ra
te p
er 1
00 c
lient
s
Males Females
Source: NCVER, National VET Provider Collection 2001
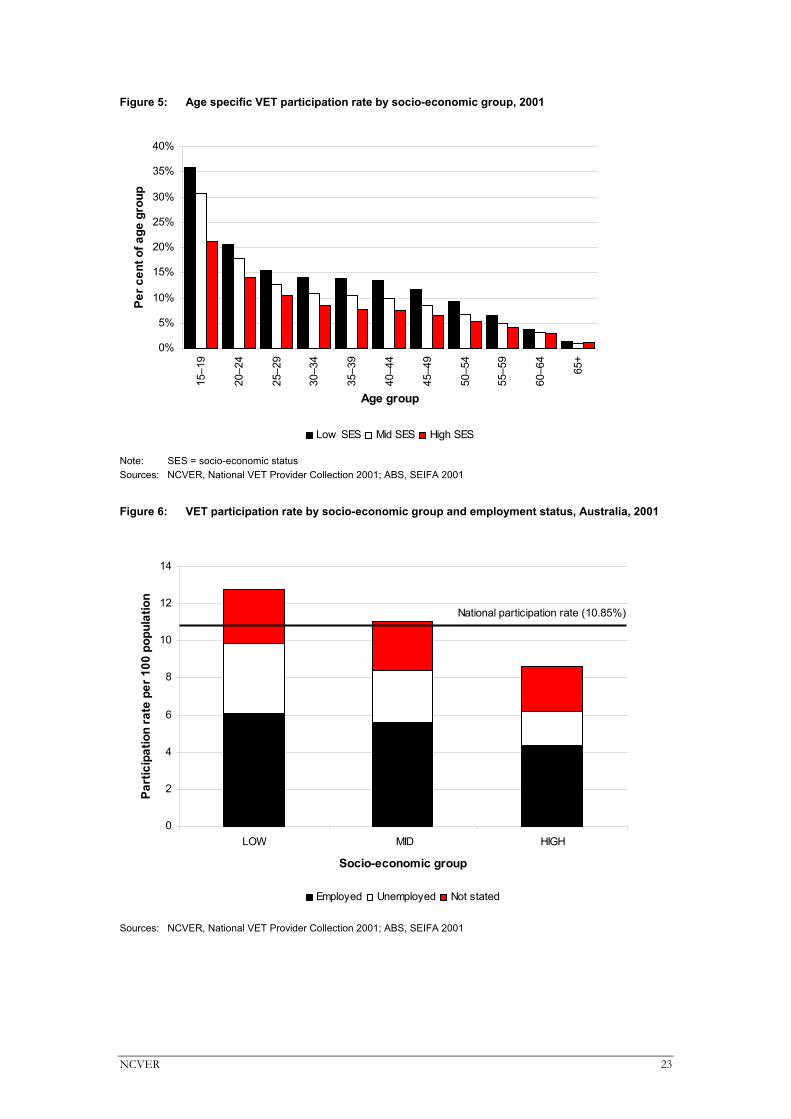
The participation of VET students for postcodes was also examined according to their socio-economic status. Figure 5 illustrates that VET participation was highest for students living in low socio-economic areas for all age groups, while participation for students living in high socio-economic areas was lowest for all age groups. Variation in participation rates between low and high socio-economic groups is greatest in the 15 to 19-year age group, no doubt due to participation of students in this age group in higher education.
Participation in vocational education and training was also examined by employment status and socio-economic group (figure 6). Participation was higher among the employed than the non-employed. Overall, participation was higher for students residing in low socio-economic postcodes (12.7%) than for those in middle socio-economic postcodes (11.0%) and high socio-economic postcodes (8.7%).
22 The socio-economic status of VET students in Australia
Figure 5: Age specific VET participation rate by socio-economic group, 2001
0%
5%
10%
15%
20%
25%
30%
35%
40%
15–1
9
20–2
4
25–2
9
30–3
4
35–3
9
40–4
4
45–4
9
50–5
4
55–5
9
60–6
4
65+
Age group
Per c
ent o
f age
gro
up
Low SES Mid SES High SES
Note: SES = socio-economic status Sources: NCVER, National VET Provider Collection 2001; ABS, SEIFA 2001
Figure 6: VET participation rate by socio-economic group and employment status, Australia, 2001
0
2
4
6
8
10
12
14
LOW MID HIGH
Socio-economic group
Part
icip
atio
n ra
te p
er 1
00 p
opul
atio
n
Employed Unemployed Not stated
National participation rate (10.85%)
Sources: NCVER, National VET Provider Collection 2001; ABS, SEIFA 2001
NCVER 23
Socio-economic status and regions The 2001 National VET Provider Collection distinguished client location according to four regions: capital cities; other metropolitan areas; rural areas; and remote areas. In addition, the collection also included overseas location and not stated.
An examination of Australian postcodes with valid SEIFA scores found that the overwhelming majority of VET students (56.8%) lived in the capital cities, with a further 7.5% in other metropolitan areas, 31.8% in rural areas and 3.9% in remote areas.
The socio-economic status of VET clients in the four regions was determined according to client postcode and the SEIFA Index for Economic Resources. The population-weighted average of the Index of Economic Resources for those postcodes with VET students in capital cities is 1041.29, compared with 982.44 for other metropolitan areas, 940.63 for rural areas and 986.45 for remote areas.
Table 2 illustrates that, in 2001, there were higher proportions of VET students from rural and remote areas than their proportions of the total population. Interestingly, in these regions the proportion of the VET population was higher than the proportion of the total population for all socio-economic bands, except for the high socio-economic group in rural areas. Table 2 also indicates that there is considerable variation in VET participation rates, particularly between rural and remote regions on the one hand, and capital city regions and, to a lesser extent, other metropolitan regions on the other. Students from remote and rural regions have the greatest VET participation rates in Australia (16.4% and 13.8%, respectively), with rates well above the Australian average (10.8%). By contrast, VET participation rates are lowest in the capital cities (9.5% overall).
The remote areas of Australia comprised 266 remote postcodes with 65 577 VET students residing in them in 2001 (table 2). The SEIFA Index of Economic Resources scores for these areas ranged from 761.77 for 5601 (Iron Knob, South Australia) to 1182.03 for 6437 (Leinster and Sir Samuel, Western Australia). Overall, VET participation (16.4%) in the remote areas is the highest in Australia. There is little variation in participation rates between the three socio-economic status regions, with participation greatest in the middle socio-economic status region (16.4%), followed by high socio-economic status (16.2%), and smallest in the low socio-economic status region (15.6%).
There were 540 219 VET students residing in the 1112 rural postcodes, where the Index of Economic Resources scores ranged from 772.42 for 3520 (Kinypanial, South Kinypanial, and Korong Vale, Victoria) to 1161.06 for 4803 (Hamilton Island, Queensland). VET participation (13.8%) in rural regions is the second highest of the four regions. Again there is very little variation in VET participation in the three socio-economic status bands, with participation greatest in the middle socio-economic status band (14.0%) followed by low socio-economic status (13.7%) with high socio-economic status only marginally lower (13.6%).
A total of 962 808 VET students lived in 931 capital city postcodes in 2001. Index of Economic Resources scores for these postcodes ranged from 821.42 for postcode 5010 (the South Australian suburbs of Ferryden Park, Angle Park and Regency Park) to 1282.27 for postcode 2061 (for the New South Wales suburbs of Kirribilli and Milson’s Point). Overall, the VET participation rate for capital cities (9.5%) is the lowest of the four regions, and well below the national average of 10.8%. VET participation in the capital cities is greatest in low socio-economic status regions (10.4%), followed by middle socio-economic status (10.0%) and high socio-economic status (8.6%) regions. VET participation is lowest in capital cities for each of the three socio-economic regions.
24 The socio-economic status of VET students in Australia
Table 2: VET population by region and socio-economic group, 2001
Region Postcodes in region
VET population
Per cent of national
VET population
Total population
Per cent of total
population
VET participation
rate
Capital cities 931 962 808 56.8 11 940 681 63.8 9.5 Low socio-economic status
116 128 067 7.5 1 436 488 7.7 10.4
Middle socio-economic status
458 510 142 30.1 6 078 900 32.5 10.0
High socio-economic status
357 324 599 19.1 4 425 293 23.6 8.6
Other metropolitan 104 128 031 7.5 1 452 857 7.8 10.6 Low socio-economic status
Australia 2 413 1 696 635 100.0 18 726 897a 100.0 10.8 Note: (a) The total population represents the population living in valid SEIFA postcodes. Populations living in those
postcodes which were excluded from SEIFA are not included. Sources: NCVER, National VET Provider Collection 2001; ABS, Population by Age and Sex, Australia, June 2001,
cat.no.3235.1.55.001; ABS, SEIFA 2001
The ‘other metropolitan’ region was comprised of 104 postcodes in which 128 031 VET students resided. SEIFA Index of Economic Resources scores for this region ranged from 794.77 for 2306 (Windale, New South Wales) to 1169.45 for 2619 (Jerrabomberra, New South Wales). The VET participation rate for other metropolitan areas (10.6%) is slightly higher than that for capital cities (9.5%), but lower than rural (13.8%) and remote (16.4%) regions. Within other metropolitan areas, VET participation is greatest in high socio-economic status areas (12.3%), followed by low (10.9%) and middle (10.4%) socio-economic status areas.
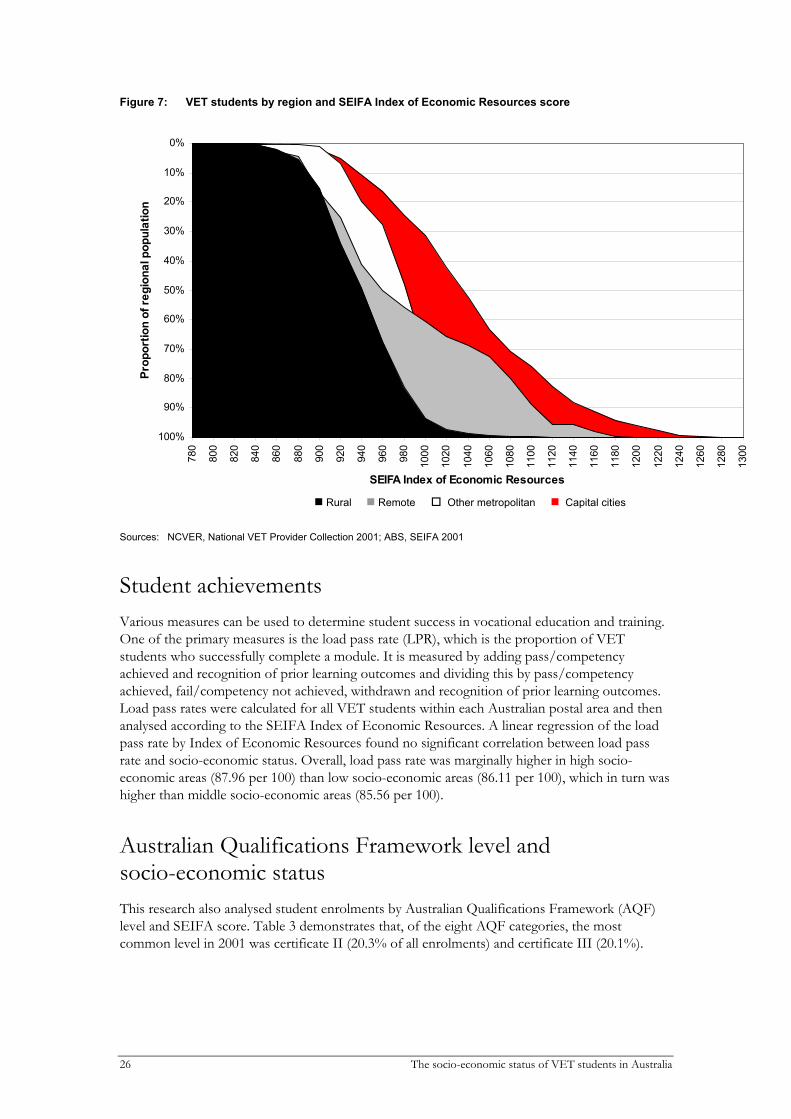
Figure 7 shows the cumulative proportion of the VET population according to their SEIFA Index of Economic Resources score for their place of residence for each of the four region types (capital cities, other metropolitan, rural and remote). The comparison of the VET population in each of the regions according to their SEIFA Index of Economic Resources score for their place of residence illustrates that, generally speaking, students in capital cities reside in postcodes with higher SEIFA scores than students from other regions. Figure 7 also shows that there was a higher proportion of students living in ‘other metropolitan’ postcodes with SEIFA scores below 1000, than students living in rural and remote areas with scores below 1000. However, there were higher proportions of students from remote postcodes with high scores (1000 and above) than either other metropolitan or rural postcodes.
NCVER 25
Figure 7: VET students by region and SEIFA Index of Economic Resources score
0%
10%
20%
30%
40%
50%
60%
70%
80%
90%
100%
780
800
820
840
860
880
900
920
940
960
980
1000
1020
1040
1060
1080
1100
1120
1140
1160
1180
1200
1220
1240
1260
1280
1300
SEIFA Index of Economic Resources
Prop
ortio
n of
regi
onal
pop
ulat
ion
Capital cities Other metropolitan Remote Rural Rural Remote Other metropolitan Capital cities
Sources: NCVER, National VET Provider Collection 2001; ABS, SEIFA 2001
Student achievements Various measures can be used to determine student success in vocational education and training. One of the primary measures is the load pass rate (LPR), which is the proportion of VET students who successfully complete a module. It is measured by adding pass/competency achieved and recognition of prior learning outcomes and dividing this by pass/competency achieved, fail/competency not achieved, withdrawn and recognition of prior learning outcomes. Load pass rates were calculated for all VET students within each Australian postal area and then analysed according to the SEIFA Index of Economic Resources. A linear regression of the load pass rate by Index of Economic Resources found no significant correlation between load pass rate and socio-economic status. Overall, load pass rate was marginally higher in high socio-economic areas (87.96 per 100) than low socio-economic areas (86.11 per 100), which in turn was higher than middle socio-economic areas (85.56 per 100).
Australian Qualifications Framework level and socio-economic status This research also analysed student enrolments by Australian Qualifications Framework (AQF) level and SEIFA score. Table 3 demonstrates that, of the eight AQF categories, the most common level in 2001 was certificate II (20.3% of all enrolments) and certificate III (20.1%).
26 The socio-economic status of VET students in Australia
Total 29.2 100.0 50.7 100.0 20.1 100.0 100.0 Sources: NCVER, National VET Provider Collection 2001; ABS, SEIFA 2001
When examining the AQF levels of students from low socio-economic regions (table 3), it is noticeable that more than three out of every ten students (31.8%) were studying at either certificate I or II level. This is well above the proportions for students in the other socio-economic regions, and for Australia as a whole. By contrast, the proportions of students from low socio-economic regions studying at certificate III and IV levels (28.7%) and diploma or higher levels (6.8%) were all lower than the proportions of students from other socio-economic regions, and for Australia as a whole. Although almost one-third (32.5%) of students in low socio-economic regions were studying either non-award or miscellaneous education, this is only slightly higher than the percentage for the total population (31.0%) and similar to that recorded in other socio-economic regions.
Students from high socio-economic regions recorded the lowest proportion of students undertaking certificate I and II studies (21.9% combined), a figure significantly lower than the national average (28.0%). By contrast, the proportion of students from high socio-economic regions undertaking diploma or higher qualifications (13.9%) was well above the national average (10.3%) and more than twice the proportion recorded in low socio-economic regions (6.8%). Unexpectedly, there was also a slightly greater proportion of students from high socio-economic regions undertaking non-award and miscellaneous education than students from both other socio-economic regions.
An examination of the qualifications awarded by socio-economic group reveals that the low socio-economic group received 30.5% of qualifications awarded, while representing only 28.8% of total enrolments. Both the middle (49.4%) and high (20.1%) socio-economic groups received lower shares of qualifications awarded than their share of enrolments (50.5% and 20.6%, respectively). This indicates that students living in low socio-economic areas not only have high participation in the VET sector, but also achieve ‘better than average’ results.
NCVER 27
Conclusion and future directions This research has found that people from lower socio-economic areas participate very strongly in Australia’s VET sector and achieve results at least comparable with students from other socio-economic groups.
It is evident from this research that there is considerable variation in VET participation across Australia. As anticipated, it was found that there is a strong relationship between VET participation and socio-economic status. VET participation rate is greatest in low socio-economic areas (12.7 students per 100 population), which is significantly higher than the national participation rate (10.8%). In contrast, high socio-economic areas recorded a significantly lower participation rate (8.7%) by comparison with the national average and other socio-economic regions.
This research also identified considerable variation in VET participation across regions, with remote (16.4%) and rural (13.8%) regions having considerably greater VET participation than non-capital metropolitan areas (10.6%) and capital cities (9.5%). Furthermore, it was evident that the range of VET participation rates across socio-economic bands is much narrower within both remote and rural regions than in the metropolitan regions. For example, participation ranged from 15.6% (low socio-economic status) to 16.5% (middle socio-economic status) in remote areas and between 13.6% (high socio-economic status) to 14.0% (middle socio-economic status) in rural areas. By contrast, participation in capital cities ranged from 8.6% (high socio-economic status) to 10.4% (low socio-economic status), while in other metropolitan areas it varied from 10.4% (middle socio-economic status) to 12.3% (high socio-economic status).
An examination of AQF levels by socio-economic level shows a higher proportion (29.2%) of AQF enrolments by students living in low socio-economic areas than the 25% share of the population on which the socio-economic band was calculated. Conversely, there were fewer AQF enrolments (20.1%) from high socio-economic areas than the 25% of the population on which that socio-economic band was calculated. The research also identified there was a slightly greater tendency for students from low socio-economic areas to study certificate I and II levels (31.8% combined) rather than certificate III and IV levels (28.7% combined) or diploma or higher levels (6.8%). Although almost one-third (32.5%) of students in low socio-economic regions were studying either non-award or miscellaneous education, this is only slightly higher than the percentage for the total population (31.0%) and similar to that recorded in other socio-economic regions.
This research found that students living in low socio-economic areas not only have high participation in the VET sector, but also achieve ‘better than average’ results. Students from low socio-economic areas achieved a higher proportion of qualifications issued (30.5%) than their share of total enrolments (28.8%).
Future developments will see SEIFA indicators applied to the NCVER database to enable more detailed socio-economic analysis.
28 The socio-economic status of VET students in Australia
References Ainley, J & Long, M 1995, ‘Measuring student socioeconomic status’, in Socioeconomic status and school
education, eds J Ainley, B Graetz, M Long & M Batten, AGPS, Canberra. Ainley, J, Graetz, B, Long, M & Batten, M 1995, Socioeconomic status and school education, AGPS, Canberra. Alcorn, G & Rood, D 2004, ‘Poorer students losing the race to uni’, The Age, 5 July 2004, viewed 5 July
2004, <www.theage.com.au/articles/2004/07/04/1088879374776.html>. ABS (Australian Bureau of Statistics) 2001, Socio-Economic Indicators for Areas (SEIFA), ABS, Canberra. ——2003, ‘Information paper’, Census of Population and Housing, Socio-Economic Indexes for Areas, Australia,
2001, ABS, Canberra, viewed 9 December 2003, <http://www.abs.gov.au/AUSSTATS/abs@nsf/DetailsPage/2039.0.55.0012001?OpenDocument>.
—— 2004, ‘Technical paper’, Census of Population and Housing, Socio-Economic Indexes for Areas (SEIFA)—Australia 2001, ABS, Canberra, viewed 12 May 2004, <http://www.abs.gov.au/Ausstats/free.nsf/log?openagent&2039055001%5F2001%2Epdf&2039%2E0%2E55%2E001&Publication&A5561C69BF600637CA256E20007B5DF1&0&2001&20%2E01%2E2004&Latest>.
Birrell, B, Calderon, A, Dobson, I, & Smith, T 2000, ‘Equity in access to higher education revisited’, People and Place, vol.8, no.1, pp.50–61.
Bourdieu, P & Passeron, J 1977, Reproduction in education, society and culture, Sage, London. Dobson, I & Birrell, B 1998, ‘Equity and university entrance, a 1997 update’, People and Place, vol.6, no.3,
viewed 3 February 2004, <http://elecpress.monash.edu.au/pnp/free/pnpv6n3/dobson2.html>. Graetz, B 1995, ‘Socio-economic status in education research and policy’, in Socioeconomic status and school
Education, eds J Ainley, J, Graetz, B, Long, M & Batten, AGPS, Canberra. James, R 2002, Background and higher education participation: An analysis of school students’ aspirations and
expectations, Centre for the Study of Higher Education, University of Melbourne, Melbourne, viewed 19 May 2004, http://www..dest.gov.au/archive/highered/eippubs/eip02_5/eip02_5.pdf.
Linke, R, Oertel, L & Kelsey, N 1985, ‘Participation and equity in higher education: A preliminary report on the socioeconomic profile of higher education students in South Australia’, Australian Bureau of Labour, vol 11, pp.124–141.
—— 1988, Regional analysis of socio-economic trends in educational participation, Departmental monograph no.7, Department of Sociology, Australian National University, Canberra.
Marks, G, McMillan, J & Hillman, K 2001, Tertiary entrance performance: The role of student background and school factors, Research report no. 22, Australian Council for Educational Research, Melbourne.
Marks, G, Fleming, N, Long, M & McMillan, J 2000, Patterns of participation in Year 12 and higher education in Australia: Trends and issues, Australian Council for Education Research, Melbourne.
Martin, L 1994, Equity and general performance indicators in higher education, AGPS, Canberra. McIntyre, J 1999, ‘Local equity analysis: Findings of a Sydney TAFE postcode participation study’, in
Quality and diversity in VET research, proceedings of the second annual conference of the Australian Vocational Education and Training Research Association, AVETRA, Sydney.
——2000a, Applying SEIFA disadvantage indexes to VET participation, Working paper 00-31, UTS Research Centre for Vocational Education and Training, Sydney.
——2000b, Urban disadvantage and VET participation and achievement, Working paper 00-32, UTS Research Centre for Vocational Education and Training, Sydney.
——2000c, ‘Equity and local participation in VET: Policy critique and research directions’, Australian Journal of Vocational Education Research, vol. 8, no.1, pp.31–51.
——2000d, ‘A further local participation study: TAFE and ACE in Melbourne postcodes in 1996’, in Future research, research futures: proceedings of the third national conference of the Australian Vocational Education and Training Research Association (AVETRA), pp.239–49.
McIntyre, J, Ball, K, Freeland, B & Phan, O 2000, ‘An index of socio-economic status for application to VET in Western Australia’, WA Department of Training and Employment, Perth.
NCVER 29
Mukherjee, D 1999, Socio-economic status and school system enrolments, Australian Centre for Equity through Education, Sydney, viewed 3 February 2004, <http://members.ozemail.com.au/~devm/socioeconomic status.HTML>.
Ross, K 1983, Social area indicators of educational need, ACER research monograph no. 20, Australian Council for Education Research, Melbourne.
——1984, The development of the 1984 ‘Indicator of Disadvantage’ and its application to resource allocation decisions for the disadvantaged schools program in Australia, Deakin University, Geelong.
Ross, K, Farish, S & French, K 1985, The development and application of indicators of educational disadvantage based on census descriptions of the neighbourhoods associated with Australian schools, Deakin University, Geelong.
Ross, K, Farish, S & Plunkett, M 1988, Indicators of socioeconomic disadvantage for Australian schools, Deakin Institute for Studies in Education, Deakin University, Geelong.
Shavit, Y & Blossfeld, H 1993, Persistent inequality: Changing educational attainment in thirteen countries, Westview, Boulder.
Skuja, E 1995, ‘Performance of the Australian university sector in access and equity’, in Towards excellence in diversity: Educational equity in the Australian higher education sector in 1995: Status, trends and future directions, eds G Postle, J Clarke, E Skuja, D Bull, K Batorowicz and H McCann, USQ Press, Toowoomba.
Sinclair, S, Doughney, J & Palermo, J 2002, Equity indicators: Measures of socio-economic status at Victoria University, Working paper series 2/2001, Victoria University, Melbourne, viewed 3 February 2004, http://www.business.vu.edu.au/MgtContent/Working%20Paper.pdfs/WorkingPaperJamieD2-2001.pdf.
Stevenson, S, Evans, C, Maclachlan, M, Karmel, T & Blakers, R 2000, Access: Effect of campus proximity and socioeconomic status on university participation rates in regions, Occasional paper series 00/D, Department of Education, Training and Youth Affairs, Canberra, viewed 12 May 2004, <www.detya.gov.au/highered/occpaper/00d/00d.pdf >.
Western, J, McMillan, J, & Durrington, D 1988, Differential access to higher education: The measurement of socioeconomic status, rurality and isolation, Department of Employment, Education, Training and Youth Affairs, Canberra, viewed 19 May 2004, <http://www.dest.gov.au/archive/highered/eippubs/eip98-14/eip98-14.pdf >.
Williams, T, Clancy, J, Batter, M & Girling-Butcher, S 1980, School, work and career: 17 year olds in Australia, Australian Council for Education Research, Melbourne.
Williams, T, Long, M, Carpenter, P & Hayden, M 1993, Entering higher education in the 1980s, AGPS, Canberra.
30 The socio-economic status of VET students in Australia
The National Centre for Vocational Education Research (NCVER) is an independent body responsible for collecting, managing and analysing, evaluating and communicating research and statistics about vocational education and training (VET).
National Centre for Vocational Education Research Ltd