_ 1 _ Poverty trends since the transition Poverty trends since the transition The sources of comparative advantage in tourism LEON DU TOIT, JOHAN FOURIE AND DEVON TREW Stellenbosch Economic Working Papers: 01/10 KEYWORDS: TOURISM, COMPARATIVE ADVANTAGE, TRADE IN SERVICES JEL: F11 LEON DU TOIT BUREAU FOR ECONOMIC RESEARCH UNIVERSITY OF STELLENBOSCH PRIVATE BAG X1, 7602 MATIELAND, SOUTH AFRICA E-MAIL:[email protected]JOHAN FOURIE DEPARTMENT OF ECONOMICS UNIVERSITY OF STELLENBOSCH PRIVATE BAG X1, 7602 MATIELAND, SOUTH AFRICA E-MAIL: [email protected]DEVON TREW DEPARTMENT OF ECONOMICS UNIVERSITY OF STELLENBOSCH PRIVATE BAG X1, 7602 MATIELAND, SOUTH AFRICA E-MAIL: [email protected]A WORKING PAPER OF THE DEPARTMENT OF ECONOMICS AND THE BUREAU FOR ECONOMIC RESEARCH AT THE UNIVERSITY OF STELLENBOSCH
Transcript
_ 1 _ Poverty trends since the transition Poverty trends since the transition
The sources of comparative advantage in tourism
LEON DU TOIT, JOHAN FOURIE AND DEVON TREW
Stellenbosch Economic Working Papers: 01/10
KEYWORDS: TOURISM, COMPARATIVE ADVANTAGE, TRADE IN SERVICES JEL: F11
Travel service exports is one of the fastest growing industries in the global economy. The rise of
tourism is usually explained through demand-side factors such as income growth in developed
economies and changes in the preferences of visitors. While these models explain empirical
observations relatively well and are often used in forecasting tourist arrivals, little theoretical
justification is provided to explain why certain countries perform better than others.
Conversely, trade models abound that attempt to explain why some countries export certain
commodities, and others not. While trade has occurred since the dawn of civilisation, it is only more
recently that economists have tried to identify why and what countries (should) trade, and with
whom. Adam Smith’s absolute advantage and David Ricardo’s theory of comparative advantage
paved the way, but it was only in the twentieth century that the Heckscher-Ohlin theory was
posited to explain that countries will export those goods produced with the abundant factor of
production. Yet, these theories did not explain global trade fully, and by the 1970s economists often
viewed the ability of theories to predict trade flows with suspicion. New trade theories, relaxing
some of the strong assumptions of Heckscher-Ohlin and incorporating increasing returns to scale
and transport costs, paved the way for a more nuanced understanding of trade and, tentatively,
better policy prescriptions.
While these theories helped to explain the rapid rise in global trade, the services sector has
witnessed even greater growth performance. The improvements in communication technology,
notably the development of the internet and cellular technology, have allowed for specialisation,
and therefore, trade in what previously was considered ‘untradable’ or ‘in-house’ services. The
signing of the General Agreement on Trade-in-Services (GATS) in 1995 signifies its rapid growth.
Yet, there remains little understanding as to why some countries specialise in service exports (and
in some service export categories), while others may not. Are the existing trade theories accurate in
explaining the comparative advantage some countries enjoy in service exports?
Using an UNCTAD dataset containing 146 countries’ services trade data, this paper identifies which
countries have a comparative advantage in the export of travel services, acting as a proxy for
tourism expenditure. Consequently, the paper seeks to identify the sources of this comparative
advantage. We include the standard explanatory variables (factors of production, including natural
environment) for Ricardian comparative advantage, plus measures of infrastructure, health, safety
and security, tourism prioritization, and various dummy variables. We also develop and test new
variables, including a neighbourhood variable which measures the benefits obtained from regional
tourism clusters. Our results have important policy implications; it is clear that the natural
environment has a large positive and significant impact on a country’s revealed comparative
advantage, as do transport endowments (a measure of relative accessibility) and the
neighbourhood variable. These findings correspond to the predictions of the neoclassical trade
theories (namely Heckscher-Ohlin) and to some extent the new trade theories (Krugman).
3
TRAVEL SERVICES AND HECKSCHER-OHLIN
Service exports consist of a diverse range of items. The fifth edition of the International Monetary
Fund Balance of Payments Manual proposes that service trade statistics be collected for 11 sectors:
transportation; travel; communication services; construction services; insurance services; financial
services; computer and information services; royalties and licence fees; other business services2;
personal, cultural and recreational services; and government services (WTO 2006:10).
Unlike other traded service industries, travel services are defined by the user of the service and not
the type of good or service sold: The consumer (user or traveller) moves to a different country to
obtain goods and services.3 Travel services entail all goods and services that are acquired by
travellers in an economy during visits of less than one year (except patients and students who may
exceed the one-year limit) (UN 2002). These services exclude transportation services provided by
carriers not resident in the particular economy being visited, as well as international carriage of
travellers, both of which are included under passenger services in the transportation service
industry (UN 2002). Also excluded are purchases of goods for resale in the traveller’s home
economy or elsewhere.
Table 1 provides the breakdown of total service exports by type. Transport, travel and other
business services cover more than 75% of total service exports, with travel service exports the
largest contributor with 28%.4
2 The category ‘other business services’ includes merchanting and other trade-related services, operational leasing
services, and miscellaneous business, professional and technical services (UNCTAD, 2008). 3 Tourism, often thought to be a synonym, is not equivalent to travel services. Travel services includes tourism –
which only consists of Mode 2 trade – but also trade in the other three modes. Tourism (Mode 2) is, however, often
used as a proxy for travel service exports, and vice versa. For a comprehensive definition of travel services, consult
the United Nations Manual on Statistics of International Trade in Services (2002:37–39). 4 In the dataset that we use, these categories are also the most reported per country and therefore the most reliable
estimates, with 145 countries for transport, 146 for travel and 134 for other business services.
4
TABLE 1: Size of Service Exports by Sector, 2005 Service sector Obs Exports
(US$) % of exports Country
average (US$)
% of country average
Transport 146 561980.2 23% 3849.179 21%
Travel 147 675373.6 28% 4594.378 24%
Communications 127 57439.2 2% 452.2772 2%
Construction 88 49485.8 2% 562.3386 3%
Insurance 130 49733.8 2% 382.5677 2%
Financial services 105 163505.4 7% 1557.194 8%
Computer and information 101 108259.1 4% 1071.872 6%
Royalties and licence fees 91 129057.1 5% 1418.21 8%
Other business services 136 619259.9 25% 4553.382 24%
Personal, cultural and recreational 91 29641.3 1% 325.7286 2%
Total services 2443735 18767.13
SOURCE: UNCTAD (2008), own calculations.
The growth of the service industry over the last three decades is one of the striking trends in
international trade. While merchandise trade has grown by 7% per annum since 1980, the services
industry has achieved close to 8% per annum growth (UNCTAD 2008). Both merchandise and
service trade has exceeded growth of 10% per annum in the last decade. Because of its contribution
to total service exports, travel service exports has played a vital role in explaining these high
growth rates. Using the number of tourists travelling abroad as proxy for travel service exports,
worldwide tourists have increased from 536 million to 924 million between 1995 and 2008, an
average increase of 4.28% per annum.5 Expenditure figures, which are less reliable, exhibit roughly
similar trends.
While not all countries have benefited from this growth, poorer countries have not been left behind.
Asian and African countries, in particular, have achieved growth rates above the world average
(Fourie 2009). A growing body of research shows that the travel service industry is an important
catalyst in both developed and developing countries growth and development strategies (Balaguer
and Contavella-Jordá 2002; Kima et al. 2006; World Bank 2006; Nowak et al. 2007; Lee and Chang
2008; Sequeira and Nunes 2008). So understanding the determinants of travel service exports, or
rather, the sources that give rise to a country’s comparative advantage in travel service exports,
may yield important policy insights.
There have been few attempts to gain insight into these determinants. The tourism literature – in
contrast to the trade literature – follows, with few exceptions, a demand-side approach (Lim 1997),
primarily to forecast tourism flows. This bias has been pointed out recently by Zhang and Jensen
(2007). In a seminal contribution, they follow a supply-side approach to explain tourism flows,
finding strong support that existing (merchandise) trade theories can explain tourism. According to
5 The worldwide recession of 2009 has however impacted the tourism industry which is not yet reflected in the data.
See UNWTO (2009) and Blanke and Chiesa (2009)
5
Zhang and Jensen (2007), key supply-side determinants to explain tourism flows include natural
endowments, technology and infrastructure.6
The international trade literature, too, is cautious in its treatment of trade theories in explaining
services trade. Deardorff (1984; 1985) and Hindley and Smith (1984) were the first to argue that
substituting services for goods in the standard Heckscher-Ohlin-type models did not invalidate the
comparative advantage proposition that a country will expert those goods (services) for which the
factors of production are relatively abundant locally. Since then, few papers have attempted to test
these hypotheses, with most work restricted to evaluating the performance of service sectors, most
notably the high-tech service sectors such as IT, insurance and financial services (Seyoum 2007). In
tourism, or travel services, a same trend emerges (Peterson 1988), with few attempts to
understand the determinants of a tourism comparative advantage. The exception is a recent
contribution by Sahli (2006). He includes a measure of comparative advantage – the revealed
comparative advantage, first derived by Balassa (1965) – as dependent variable, with supply- and
demand-side variables as possible causes. Sahli’s (2006) findings show that “tourism remains to a
large extent governed by the existence of natural resources”. He also finds evidence to support the
influence of other factors, including technology, the level of domestic demand and the transport
infrastructure.
These results seem to support the notion that international trade theories can – at least partially –
explain why some countries export travel services and others not, i.e. why some countries exhibit a
comparative advantage in travel service exports. The rest of this study proceeds to untangle the
determinants of such exports.
COMPARATIVE ADVANTAGE IN TOURISM
The theory of comparative advantage is derived from David Ricardo’s insight into the fact that trade
benefits countries that specialise in the production of goods and services with the lowest
opportunity costs. Empirically, comparative advantage is revealed through the Balassa index
(Balassa 1965):
(1)
where Xij represents exports of sector i from country j. While various alternative measures have
been proposed in the literature (Vollrath 1991; Laursen 1998; Hoen and Oosterhaven 2006), the
Balassa index remains the most popular (Cai and Leung, 2008). In a more recent paper, however,
Yu, Cai and Leung (2009) develop a measure that allows for more precise and consistent
comparisons across time, countries and commodities. It is this measure, the normalized revealed
comparative advantage (NRCA), which is used as dependent variable in the analysis:
6 A similar argument is made using resource-based theories (within the field of strategic management) to explain the
competitiveness of tourism destinations. See, for example, Melián-González and García-Falcón (2003).
6
(2)
We calculate the 2005 NRCA for all 146 countries in the UNCTAD Handbook of Statistics 2006-07
(UNCTAD 2008). Countries are ranked by this measure in Appendix A.7 Figure 1 highlights those
countries that exhibit a revealed comparative advantage in travel service exports in 2005. What is
clear from the map is the dark band of countries of the Mediterranean (and others enjoying a
Mediterranean climate) that reveal a strong comparative advantage. The USA, Spain, Turkey and
France are the only countries that fall within the “Very Strong” category. They are followed by a
larger group of countries revealing a “Strong” comparative advantage for travel service exports, a
list that includes a diverse range of countries – from developed economies like Italy, Australia and
Switzerland, larger developing economies like Egypt, South Africa and Thailand, to island
economies such as Macau SAR, Cyprus and the Bahamas. The full list of countries and their NRCA
score appear in Table 3 in the appendix.
Figure 1: The NRCA performance of countries
7 For a number of developing countries – especially in Africa – travel service export data is not available. This is
unfortunate as Fourie (2009) points out that African countries tend to reveal a high comparative advantage in travel
service exports. To some extent this is validated in Figure 1 by the strong NRCA of South Africa, Egypt, Tunisia
and Morocco, and the moderate NRCA of a number of small (and poor) African countries, including Uganda,
Rwanda, Tanzania, Mali and the Gambia.
7
THE SOURCE OF COMPARATIVE ADVANTAGE
Let us return to the original question: why would a country have a comparative advantage in
exporting travel services? The traditional trade theories posit that a country would attain a
comparative advantage in a good because of its greater productivity in manufacturing the good
(Ricardian) or because the country is relatively well-endowed with the factors of production that
are used most-intensively in the production of the good (Heckscher-Ohlin). Applying this to
services, countries would specialise in a specific service export given cross-country differences in
technology or endowments, usually referring to capital and labour. Strict assumptions characterize
these theories; Deardorff (2005) provides a succinct overview of the limitations of comparative
advantage analysis. Finding insufficient empirical support for these theories (i.e. the Leontief
paradox), the new trade theories provide alternative explanations for the growth in trade,
emphasising economic geography and the love-of-variety, incorporating increasing returns to scale
and transport costs, and examining the role of multinational corporations and industry clusters to
explain a country’s comparative advantage (Krugman 1979). In addition, Linder (1961) had
suggested that domestic preferences may determine a country’s export bundle.
Which of these theories is relevant for the travel services industry? Zhang and Jensen (2007) note
that, in theory, all may have some relevance: price competition between countries (Ricardian
comparative advantage), the natural environment such as sun, sea and sand (Heckscher-Ohlin),
international hotel chains (multinational corporations), tourism clusters (agglomeration) are all
factors that may drive a country’s comparative advantage in the travel service industry. One may
want to add to this list. Why do countries export tourist services relative to other exports (thus
attaining a comparative advantage)? Geography, business regulations, transportation costs, climate,
history and culture, macroeconomic variables, government policies, and a host of other factors may
be applicable. This paper attempts to answer empirically which of these determinants explain a
country’s comparative advantage.
To pin down the economic determinants of comparative advantage in a 2x2x2 model, the
Heckscher-Ohlin theory states that comparative advantage, under certain strong conditions, will
arise in a commodity if resource endowments used in the production of that commodity are
relatively abundant in that country compared to the other country. To test this theory for travel
service exports we model cross-county differences in revealed comparative advantage as a function
of relative resource endowments, while controlling for other factors. In general then, the Hecksher-
Ohlin theory proposes an explanatory framework where a country’s comparative advantage is a
function of its resource endowments. Equation (3) formalises this idea where for country i, its
comparative advantage in good j is determined by capital, labour, natural environment and
a collection of vectors of other possible sources.
(3)
In the light of the exploratory nature of this analysis, this section analyses equation (3) as a simple
linear relationship (4).
8
(4)
Because the data is subject to random variation, the models proposed above should be treated
stochastically. The data in model (4) gives rise to a stochastic disturbance, the information of which
is contained in . Given the stochastic nature of the data, the relationships between explanatory
variables on the right-hand side and NRCA on the left-hand side of (4) have to be estimated with the
nature and characteristics of the data in mind. Translating the former consideration of the data into
a statistically adequate econometric model will ensure that the results reliably show the relative
importance of the different economic drivers of cross-country differences in NRCA.
Because national economies differ widely in size and structure, the nature of the randomness
associated with the set of observations obtained from each country is most likely not identical
across all countries. In models (4) this means that although the disturbance might be independently
distributed between countries, it is probably not identical. In matrix notation these models take the
general form . We assume that the disturbance is independently
distributed and that regressors are uncorrelated with the disturbances in these models. If no pair
vectors of explanatory variables are perfectly correlated, that is if the data matrix has full rank, and
if disturbances are identically distributed then OLS is unbiased, consistent and the most efficient
estimator for the class of models. But as indicated, the disturbances in our model are most likely not
identically distributed and our estimation procedure will control for this departure from the Guass-
Markov assumptions to produce parameter estimates that are the best possible given our statistical
assumptions.
OLS parameter estimates and the resulting estimates of their variance can be used for inference
when disturbances are not identically distributed or heteroskedastic in an unknown way, if we
estimate the variance-covariance matrix in a way that takes the nature of the disturbances into
account. Inferences about parameters are based on the fact that the vector has zero mean and
covariance matrix (5) where ,
. (5)
Based on earlier statistical work (Eicker 1963; Eicker 1967; Hinkley 1977), White (1980) shows
that by assuming that disturbances are not identically distributed , and constructing an
estimate based on error terms from the OLS regression, and replacing it
with in (5) we can estimate the variance-covariance matrix consistently. This yields so-called
robust standard errors and hence will prevent the researcher from being overconfident in the
accuracy of the results. Although this gives the right answer as the sample size grows to infinity, the
estimates of the variance may be underestimated in finite samples. Also, this procedure does not
correct for the fact that OLS errors or residuals tend to be too small (MacKinnon & White, 1985). To
control for these problems we employ another well defined statistically robust method of
estimating (5), namely the ‘jackknife’ (Efron 1979; Efron 1981; Efron and Stein 1981). Athough
both of these methods give the same answer asymptotically, theoretical work by Cheser (1989) and
9
simulations by Long and Ervin (2000) suggests that using the jackknife performs better than other
estimators in samples smaller than 250.
Jackknife standard errors are computed differently based on an alternative way of thinking about
randomness in the world and how to deal with it in our statistical model. White’s robust standard
errors are calculated by supposing the world to play itself out again and again always with the same
systematic information in the data, but each time with a different random component. The jackknife
recomputes model estimates as many times as there are observations and uses the variability of the
recomputed estimates as an estimate of the variability of the original estimator (MacKinnon and
White 1985). In this way, the world is supposed to emerge with all of its randomness, and our
method supposes that each time the world emerges in the same way as it did before, but omitting
one country. We can do this because the disturbances are independent between countries. So, in
the context of our assumptions, armed with these model specifications and robust estimation
methods in an attempt to deal with model and parameter uncertainty, we approach the data.
The world development indicators dataset forms the backbone of our dataset. A complete list of the
variables used is included in Appendix B.
10
TABLE 2: The determinants of revealed comparative advantage in tourism
Table 4: Regression results for travel service exports using White robust standard errors. Source: Own calculations using Stata 10 and the UNCTAD Handbook of Statistics 2007 (2008) *** Significance at 1%
White, H. (1980). "A heteroscedasticity-consistent covariance matrix estimator and a direct test
for heteroscedasticity." Econometica 48(4): 817 - 838.
World Bank (2006). Tourism: an opportunity to unleash shared growth in Africa. Washington
DC, Africa Private Sector Development Note 16.
WTO (2006). Measuring Trade in Services. Geneva.
Yu, R., J. Cai, et al. (2009). "The normalized revealed comparative advantage index." The
Annals of Regional Science 43(1): 267-282.
Zhang, J. and C. Jensen (2007). "Comparative Advantage: Explaining Tourism Flows." Annals
of Tourism Research 34(1): 223-243.
15
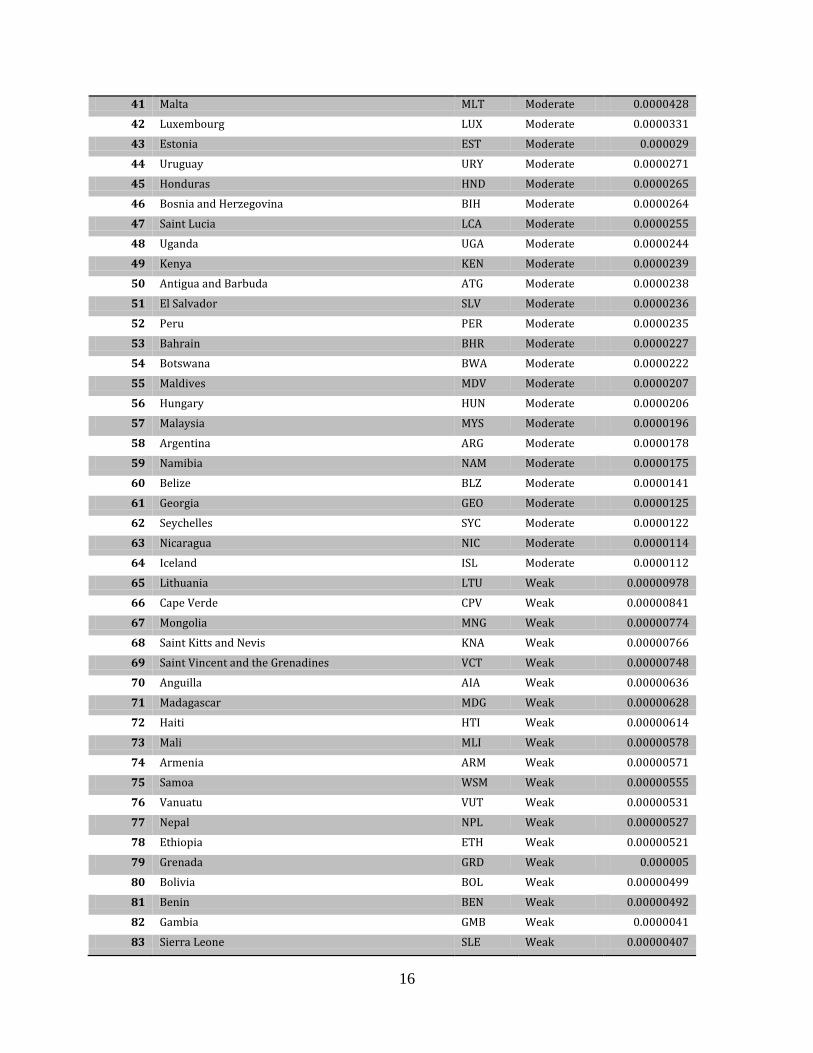
Appendix A: Countries and their comparative advantage Ranking Country Code Comparative
advantage NRCA
1 United States of America USA Very strong 0.0026102
2 Spain ESP Very strong 0.0025692
3 Turkey TUR Very strong 0.0010212
4 France FRA Very strong 0.0010083
5 Greece GRC Strong 0.0008405
6 Italy ITA Strong 0.0008342
7 Australia AUS Strong 0.0007564
8 China, Macao SAR MAC Strong 0.0005861
9 Croatia HRV Strong 0.0005053
10 Austria AUT Strong 0.0004746
11 Egypt EGY Strong 0.000436
12 Lebanon LBN Strong 0.0003828
13 Portugal PRT Strong 0.000382
14 South Africa ZAF Strong 0.0003151
15 Morocco MAR Strong 0.0002865
16 New Zealand NZL Strong 0.0002589
17 Dominican Republic DOM Strong 0.0002364
18 Thailand THA Strong 0.0002056
19 Bahamas BHS Strong 0.0001514
20 Cyprus CYP Strong 0.0001508
21 Switzerland CHE Strong 0.000142
22 Syrian Arab Republic SYR Strong 0.0001314
23 Bulgaria BGR Strong 0.0001227
24 Tunisia TUN Strong 0.0001069
25 Jamaica JAM Strong 0.0001063
26 Costa Rica CRI Moderate 0.0000916
27 Jordan JOR Moderate 0.0000861
28 Aruba ABW Moderate 0.0000666
29 Barbados BRB Moderate 0.0000634
30 Ukraine UKR Moderate 0.0000626
31 Netherlands Antilles ANT Moderate 0.000061
32 Albania ALB Moderate 0.00006
33 Mauritius MUS Moderate 0.0000532
34 United Republic of Tanzania TZA Moderate 0.0000528
35 Cambodia KHM Moderate 0.0000495
36 Slovenia SVN Moderate 0.0000494
37 Poland POL Moderate 0.0000489
38 Guatemala GTM Moderate 0.0000471
39 Ghana GHA Moderate 0.0000467
40 Panama PAN Moderate 0.0000442
16
41 Malta MLT Moderate 0.0000428
42 Luxembourg LUX Moderate 0.0000331
43 Estonia EST Moderate 0.000029
44 Uruguay URY Moderate 0.0000271
45 Honduras HND Moderate 0.0000265
46 Bosnia and Herzegovina BIH Moderate 0.0000264
47 Saint Lucia LCA Moderate 0.0000255
48 Uganda UGA Moderate 0.0000244
49 Kenya KEN Moderate 0.0000239
50 Antigua and Barbuda ATG Moderate 0.0000238
51 El Salvador SLV Moderate 0.0000236
52 Peru PER Moderate 0.0000235
53 Bahrain BHR Moderate 0.0000227
54 Botswana BWA Moderate 0.0000222
55 Maldives MDV Moderate 0.0000207
56 Hungary HUN Moderate 0.0000206
57 Malaysia MYS Moderate 0.0000196
58 Argentina ARG Moderate 0.0000178
59 Namibia NAM Moderate 0.0000175
60 Belize BLZ Moderate 0.0000141
61 Georgia GEO Moderate 0.0000125
62 Seychelles SYC Moderate 0.0000122
63 Nicaragua NIC Moderate 0.0000114
64 Iceland ISL Moderate 0.0000112
65 Lithuania LTU Weak 0.00000978
66 Cape Verde CPV Weak 0.00000841
67 Mongolia MNG Weak 0.00000774
68 Saint Kitts and Nevis KNA Weak 0.00000766
69 Saint Vincent and the Grenadines VCT Weak 0.00000748
70 Anguilla AIA Weak 0.00000636
71 Madagascar MDG Weak 0.00000628
72 Haiti HTI Weak 0.00000614
73 Mali MLI Weak 0.00000578
74 Armenia ARM Weak 0.00000571
75 Samoa WSM Weak 0.00000555
76 Vanuatu VUT Weak 0.00000531
77 Nepal NPL Weak 0.00000527
78 Ethiopia ETH Weak 0.00000521
79 Grenada GRD Weak 0.000005
80 Bolivia BOL Weak 0.00000499
81 Benin BEN Weak 0.00000492
82 Gambia GMB Weak 0.0000041
83 Sierra Leone SLE Weak 0.00000407
17
84 Dominica DMA Weak 0.0000039
85 Rwanda RWA Weak 0.00000279
86 Moldova MDA Weak 0.00000211
87 Kyrgyzstan KGZ Weak 0.00000185
88 Suriname SUR Weak 0.00000154
89 Mozambique MOZ Weak 0.00000141
90 Tonga TON Weak 0.000000981
91 Montserrat MSR Weak 0.000000647
92 Sri Lanka LKA Weak 0.000000508
93 Guyana GUY No -0.000000192
94 Burundi BDI No -0.000000271
95 Lesotho LSO No -0.0000006
96 Djibouti DJI No -0.000000663
97 Togo TGO No -0.00000175
98 Latvia LVA No -0.00000385
99 Paraguay PRY No -0.00000388
100 The former Yugoslav Republic of Macedonia MKD No -0.00000403
101 Swaziland SWZ No -0.00000427
102 Tajikistan TJK No -0.00000436
103 Colombia COL No -0.00000462
104 Ecuador ECU No -0.00000871
105 Philippines PHL No -0.00000911
106 Czech Republic CZE No -0.0000119
107 Sudan SDN No -0.0000139
108 Yemen YEM No -0.0000145
109 Papua New Guinea PNG No -0.0000149
110 Azerbaijan AZE No -0.0000152
111 Congo COG No -0.0000187
112 Côte d'Ivoire CIV No -0.0000287
113 Israel ISR No -0.0000299
114 Bangladesh BGD No -0.0000393
115 Mexico MEX No -0.0000416
116 Oman OMN No -0.0000448
117 Romania ROU No -0.0000561
118 Belarus BLR No -0.0000562
119 Indonesia IDN No -0.0000626
120 India IND No -0.0000655
121 Pakistan PAK No -0.0000695
122 Kazakhstan KAZ No -0.0000723
123 Angola AGO No -0.0000963
124 United Kingdom of Great Britain and Northern Ireland GBR No -0.000102
125 Libyan Arab Jamahiriya LBY No -0.0001053
126 Chile CHL No -0.0001175
18
127 Denmark DNK No -0.0001295
128 Sweden SWE No -0.0001515
129 Finland FIN No -0.0001805
130 Venezuela (Bolivarian Republic of) VEN No -0.0001901
131 Kuwait KWT No -0.0001984
132 Nigeria NGA No -0.0002225
133 Brazil BRA No -0.0002661
134 Norway NOR No -0.0002938
135 Ireland IRL No -0.0003423
136 China, Taiwan Province of TWN No -0.000556
137 Canada CAN No -0.0006713
138 Russian Federation RUS No -0.0006763
139 China, Hong Kong SAR HKG No -0.0006847
140 Singapore SGP No -0.0007397
141 Belgium BEL No -0.0008808
142 Republic of Korea KOR No -0.0009408
143 China CHN No -0.0012322
144 Netherlands NLD No -0.0012423
145 Japan JPN No -0.0020124
146 Germany DEU No -0.0024941
Appendix B: Variables used in the regression analysis
Symbol Description Expected Impact Source
GPC Nominal Gross Domestic Product per Capita Variable acts as a proxy to indicate whether or not a country's wealth matters for trade in services. Expected sign: unsure.
UNCTAD Handbook of Statistics (2008)
GFCF Gross fixed capital formation (1000 current US dollars). It includes land improvements (fences, ditches, drains, and so on); plant, machinery, and equipment purchases; and the construction of roads, railways, and the like, including schools, offices, hospitals, private residential dwellings, and commercial and industrial buildings.
Variable will indicate whether service and goods exports are capital intensive or not. Expected sign: negative.
World Development Indicators (2006) database retrieved from Nationmaster
Population Population Variable will indicate whether goods exports are labour intensive. Expected sign: positive.
World Development Indicators (World Bank, 2006c)
Employed Employed labour (general level in thousands) Variable will indicate whether service exports are labour intensive. An alternative measure to population. Expected sign: positive.
International Labour Organisation, LABORSTA Labour Statistics Database (2009)
19
intensity_empl Ratio of GFCF over employed Variable acts as a measure of relative intensity between capital and employed labour.
Created
intensity_pop Ratio of GFCF over population Variable acts as a measure of relative intensity between capital and the population.
Created
TB deaths Deaths due to tuberculosis among HIV-negative people (per 100 000 population)
Variable acts as 1 of 5 proxies of health to indicate whether or not a country's travel services exports depends on health concerns. Expected sign: negative if significant.
World Health Organisation (2009)
TB incidence Incidence of tuberculosis (per 100 000 population per year)
Variable acts as 1 of 5 proxies of health to indicate whether or not a country's travel services exports depends on health concerns. Expected sign: negative if significant.
World Health Organisation (2009)
TB prevalence Prevalence of tuberculosis (per 100 000 population)
Variable acts as 1 of 5 proxies of health to indicate whether or not a country's travel services exports depends on health concerns. Expected sign: negative if significant.
World Health Organisation (2009)
HIV prevalence Prevalence of HIV among adults aged >=15 years (per 100 000 population)
Variable acts as 1 of 5 proxies of health to indicate whether or not a country's travel services exports depends on health concerns. Expected sign: negative if significant.
World Health Organisation (2009)
Immunization Children 1 year old immunized against measles, percentage
Variable acts as 1 of 5 proxies of health to indicate whether or not a country's travel services exports depends on health concerns. Expected sign: negative if significant.
World Health Organisation (2009)
20
Primary completion
Primary completion rate Variable acts as a measure of basic schooling. Expected sign: positive if significant.
Millennium Goals Development Report (2009)
Human capital A measure of Human Capital Variable acts as a measure of the level of human capital development within a country. Expected sign: positive if significant.
The Travel & Tourism Competitiveness Report (Blanke and Chiesa 2009)
Pollution (CO2) Carbon dioxide emissions (CO2), thousand metric tons of CO2 (CDIAC)
Variable measures the degree of pollution in each country. Expected sign: negative.
Millennium Goals Development Report (2009)
Natural heritage
Number of Natural World Heritage sites for each country
Variable will indicate whether travel service exports are natural resource intensive. Expected sign: positive.
The Travel & Tourism Competitiveness Report (Blanke and Chiesa 2009)
Cultural heritage
Number of Cultural World Heritage sites for each country
Variable will indicate whether travel service exports depend on cultural resources. Expected sign: positive.
The Travel & Tourism Competitiveness Report (Blanke and Chiesa 2009)
Warm water A measure of whether or not the country experiences a warm current ocean.
Variable acts as a proxy for the natural environment. Expected sign: positive.
Created
Technology Variable is an index created by normalising and adding: Telephone lines per 100 population, Mobile cellular telephone subscriptions per 100 population, Internet users per 100 population, and Personal computers per 100 population.
Variable acts as a proxy for technology. Expected sign: positive if significant.
Millennium Goals Development Report (2009)
Democracy Democracy index. Index Ranging from 7 (High Levels of Liberties) to 1 (Low levels).
A measure of civil and political liberties within a country. Variable acts as 1 of 2 proxies for social order. Expected sign: positive if significant.
Freedom House, Freedom in the World 2000-2001, New York: Freedom House, 2001 retrieved from Nationmaster
Corruption Corruption index. A CPI Score relates to perceptions of the degree of corruption as seen by business people and country analysts and ranges between 10 (highly clean) and 0 (highly corrupt). Includes police corruption, business corruption, political corruption, etc.
Variable acts as1 of 2 proxies for social order. Expected sign: negative
Transparency International retrieved from Nationmaster
21
Crime Intentional Homicides per 100,000 People, 2000-2004. Because of differences in the legal definition of offences, data are not strictly comparable across countries. Data refer to a year from 2000 to 2004, and reported in 2007, but in some cases from a different year if otherwise not available. In some cases the intentional homicide rate differs from the standard definition or refers to only part of a country.
Variable acts as a relatively poor proxy for crime in each country considered, and how crime effects travel service exports. Expected sign: negative if significant.
International Center for Policy Studies (2007)
Coast Coastline in kilometers A measure of the proportion of boundary between the land (including islands) and the sea. An additional measure of natural environment. Expected sign: positive.
CIA World Factbook retrieved from Nationmaster
Transport capacity
An index for the transport capacity for each country in 2004. It created by dividing the number of airports by the number of ports and terminals. A value of 0.5 has been used where there are no ports. Total number of airports with paved runways (concrete or asphalt surfaces). Major ports and terminals refer to the amount of cargo tonnage shipped through the facilities on an annual basis. In some instances, the number of containers handled or ship visits were also considered.
A measure of transportation facilities and capacity. This variable will be used for travel and tourism services. Expected sign: positive.
CIA World Factbooks retrieved from Nationmaster
PPP Purchasing power parity conversion factor, 2005, is the number of units of a country's currency required to buy the same amount of goods and services in the domestic market as a U.S. dollar would buy in the United States.
A measure of the ability of individuals to spend in a foreign country. Also provides a measure of relative importing and exporting power. Expected sign: unsure.
World Development Indicators (2006) database retrieved from Nationmaster
Exchange rate Official exchange rate, 2005, refers to the exchange rate determined by national authorities or to the rate determined in the legally sanctioned exchange market. It is calculated as an annual average based on monthly averages (local currency units relative to the U.S. dollar).
A measure of the ability of individuals to spend in a foreign country. Also provides a measure of relative importing and exporting power. Expected sign: negative.
World Development Indicators (2006) database retrieved from Nationmaster
Land area Land area in square kilometres A measure of the size of each country considered within the sample. Expected sign: positive.
World Heritage data (1999).
Island Island dummy (1=yes, 0=no) An indication of whether or not the country is an island. Expected sign: positive.
Created
22
Affinity for travel
Affinity for Travel and Tourism. Tourism expenditure and receipts as a percentage of GDP.
A variable that stands in proxy for domestic demand as an explanation of a country’s comparative advantage (Linder, 1961). Expected sign: positive.
The Travel & Tourism Competitiveness Report (Blanke and Chiesa 2009)
Africa African dummy (1=yes, 0=no) A dummy variable indicating whether or not the country is located in Sub-Saharan Africa or not
Created
Tropical Tropical climate dummy (1=yes, 0=no) A dummy variable indicating whether or not the country is in a tropical climate
Created
Mediterranean Mediterranean dummy (1=yes, 0=no) A dummy variable indicating whether or not the country is located in the Mediterranean