Evidence for cosmic ray modulation in temperature records fromthe South Atlantic Magnetic Anomaly region
E. Frigo1,2, I. G. Pacca1, A. J. Pereira-Filho3, P. H. Rampelloto4, and N. R. Rigozo5
1Departamento de Geofísica, Instituto de Astronomia, Geofísica e Ciências Atmosféricas, Universidade de São Paulo,São Paulo, Brazil2Universidade Federal do Pampa, Campus Caçapava do Sul, Caçapava do Sul, Brazil3Departamento de Ciências Atmosféricas, Instituto de Astronomia, Geofísica e Ciências Atmosféricas,Universidade de São Paulo, São Paulo, Brazil4Universidade Federal do Pampa, Campus São Gabriel, São Gabriel, Brazil5Divisão de Geofísica Espacial, Instituto Nacional de Pesquisas Espaciais, São José dos Campos, Brazil
Received: 5 July 2012 – Revised: 23 August 2013 – Accepted: 10 September 2013 – Published: 29 October 2013
Abstract. Possible direct or indirect climatic effects re-lated to solar variability and El Niño–Southern Oscillation(ENSO) were investigated in the southern Brazil region bymeans of the annual mean temperatures from four weatherstations 2 degrees of latitude apart over the South AtlanticMagnetic Anomaly (SAMA) region. Four maximum temper-ature peaks are evident at all stations in 1940, 1958, 1977and 2002. A spectral analysis indicates the occurrence of pe-riodicities between 2 and 7 yr, most likely associated withENSO, and periodicities of approximately 11 and 22 yr, nor-mally associated with solar variability. Cross-wavelet anal-ysis indicated that the signal associated with the 22 yr solarmagnetic cycle was more persistent in the last decades, whilethe 11 yr sunspot cycle and ENSO periodicities were inter-mittent. Phase-angle analysis revealed that temperature vari-ations and the 22 yr solar cycle were in anti-phase near theSAMA center. Results show an indirect indication of possi-ble relationships between the variability of galactic cosmicrays and climate change on a regional scale.
Keywords. History of geophysics (solar–planetary relation-ships)
1 Introduction
Global warming and other climatic effects caused by an-thropic action have been a subject of concern among investi-gators in the area of environmental sciences. However, geo-
scientists who study the evolution of the Earth know thatin, its giga-year history, the planet has gone through severalcatastrophic episodes that brought drastic changes to the en-vironment and affected all types of existing life. Therefore, itis certainly important that natural processes that may affectthe climate are also investigated so that their effects can beevaluated.
This investigation studies the effects of solar activityas one of the possible natural climatic forcings. A possi-ble correlation between sunspots and climatic variables hasbeen proposed by several authors for over a century (seereview article by Gray et al., 2010). However, this rela-tion between solar activity and climate has been difficultto determine because the solar energy flux variation dur-ing a solar cycle is very small and insufficient to give riseto significant climate variations (Dickinson, 1975). Never-theless, there were observational results that would favorthe solar activity–climate correlation (e.g., Wilcox, 1975;Lassen and Friis-Christensen, 1995). An alternative and con-sistent explanation was proposed by Svensmark and Friis-Christensen (1997) and Svensmark (2007) by introducing theintermediate action of galactic cosmic rays (GCRs).
Solar activity variation has been historically associatedwith sunspot numbers, but other solar properties, such asthe heliomagnetic field, also vary during solar cycles. Thehigh solar magnetic field during solar maxima reduces theincidence of GCRs on the Earth to a minimum, whereasthe maximum incidence would correspond to solar minima.
Published by Copernicus Publications on behalf of the European Geosciences Union.
1834 E. Frigo et al.: Evidence for cosmic ray modulation in temperature records
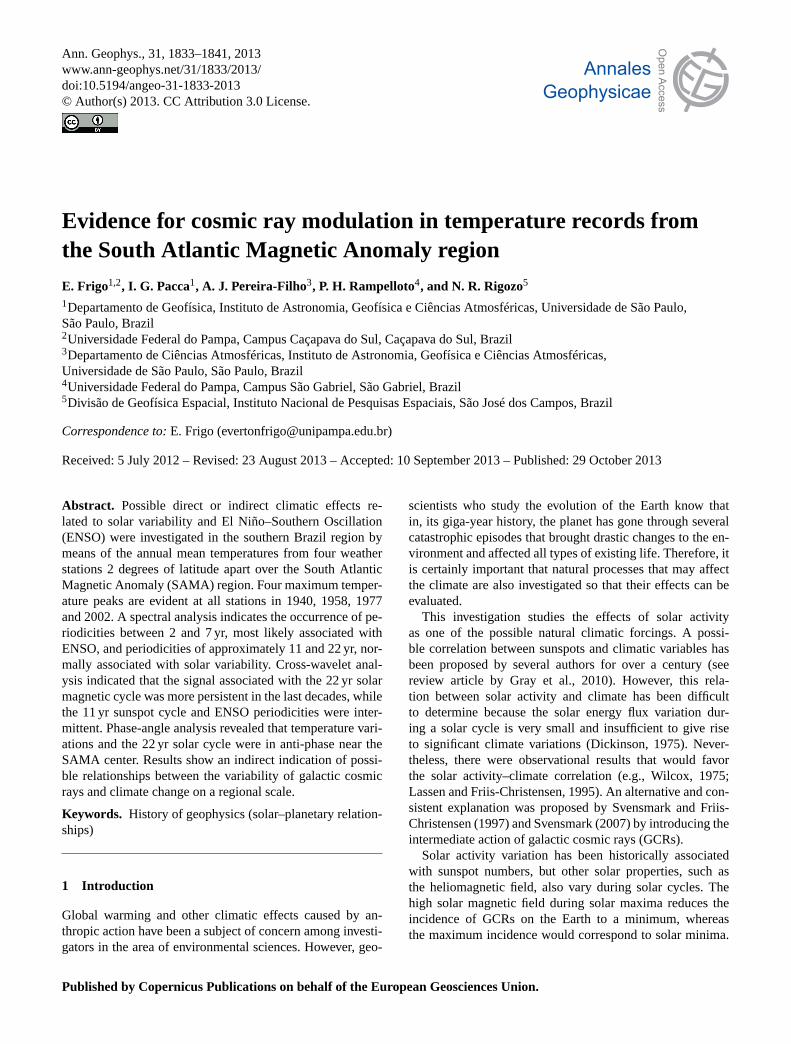
Fig. 1. (A) Global geomagnetic field intensity map computed fromIGRF data for 2005. The study area is bounded by the white rectan-gle.(B) Enlarged map of the study area showing the locations of theweather stations (SPO, CUR, FLO and POA) and the SAMA centerdrift from 1905 to 2005 (black stars), computed every 5 yr.
Through multiple interactions, GCR high-energy particlescreate a large number of ions that, when associated withaerosols, can favor condensation and the formation of low-altitude clouds. Therefore, cloud formation and their conse-quence on climatic variables can depend on the Sun’s mag-netic field, but the Earth’s magnetic field is also variable andcan reduce the GCR incidence. The simultaneous action ofthe heliomagnetic and the geomagnetic fields has been oneof the difficulties in determining clear evidence of the effectof solar activity on climate variation (Dorman, 2012; Lock-wood, 2012). Furthermore, there are many studies based onclimatic and proxy data analysis that are in agreement withthe GCR–climate relationship (e.g., Miyahara et al., 2008;Souza Echer et al., 2012; Svensmark, 2012) and other stud-ies that disagree with this relationship (e.g., Wagner et al.,2001; Overholt et al., 2009; Erlykin and Wolfendale, 2011).Experimental results indicate that GCRs may play an impor-tant role in climate modulation (Enghoff et al., 2011; Kirkbyet al., 2011; Pedersen et al., 2012).
In this research, we investigated the effect of solar activityon climate variation in the South Atlantic Magnetic Anomaly(SAMA) region where the geomagnetic field is exceptionallylow and, therefore, where the influence of Earth’s magneticfield on the GCR flux is much smaller and continuously de-creasing (Smart and Shea, 2009). The SAMA time evolutionhas been investigated by Hartman and Pacca (2009) over the
Table 1. Information on the weather stations in this study.
Station Code Coordinates Altitude
SPO 83 781 23.5◦ S, 46.6◦ W 792 mCUR 83 842 25.4◦ S, 49.3◦ W 924 mFLO 83 897 27.6◦ S, 48.5◦ W 2 mPOA 83 967 30◦ S, 51.2◦ W 47 m
past few centuries, and they show that the anomaly centerapproached Rio de Janeiro near 1900 and then drifted south-west until reaching the coast of the state of Paraná near 1945,when the trajectory changed again to a westward drift. Dur-ing the past century, the SAMA center has passed close toseveral Brazilian weather stations. Analyses of temperaturetime series from four Brazilian weather stations when theSAMA center was close to them will be shown.
2 Study area, data sets and methodology of analysis
Some authors relate cosmic rays to climate at specific re-gions of the planet (e.g., Pudovkin et al., 1997; Vieira and daSilva, 2006; Harrison and Ambaum, 2009). Spatially, GCRflux varies according to the geomagnetic field direction andintensity, with higher fluxes in the polar regions and lowerfluxes at the Equator. Moreover, regions with weak geo-magnetic intensities, such as the South Atlantic MagneticAnomaly (SAMA), enable higher fluxes of particles (Königet al., 1978; Smart and Shea, 2009). Currently, the SAMAcovers part of the South Atlantic Ocean and the South Amer-ican continent. The region has been strongly influenced bythe SAMA since the early twentieth century. This geomag-netic anomaly (< 25 000 nT) now covers half of South Amer-ica and part of the South Atlantic (Fig. 1a). Its center movedfrom the Atlantic Ocean to Paraguay between 1905 and 2005,as shown in Fig. 1b, which also shows the locations of thefour weather stations. Three stations (CUR, FLO and POA)are maintained by the Brazilian National Institute of Mete-orology and one (SPO) by the University of São Paulo. Thedetails of these stations are presented in Table 1.
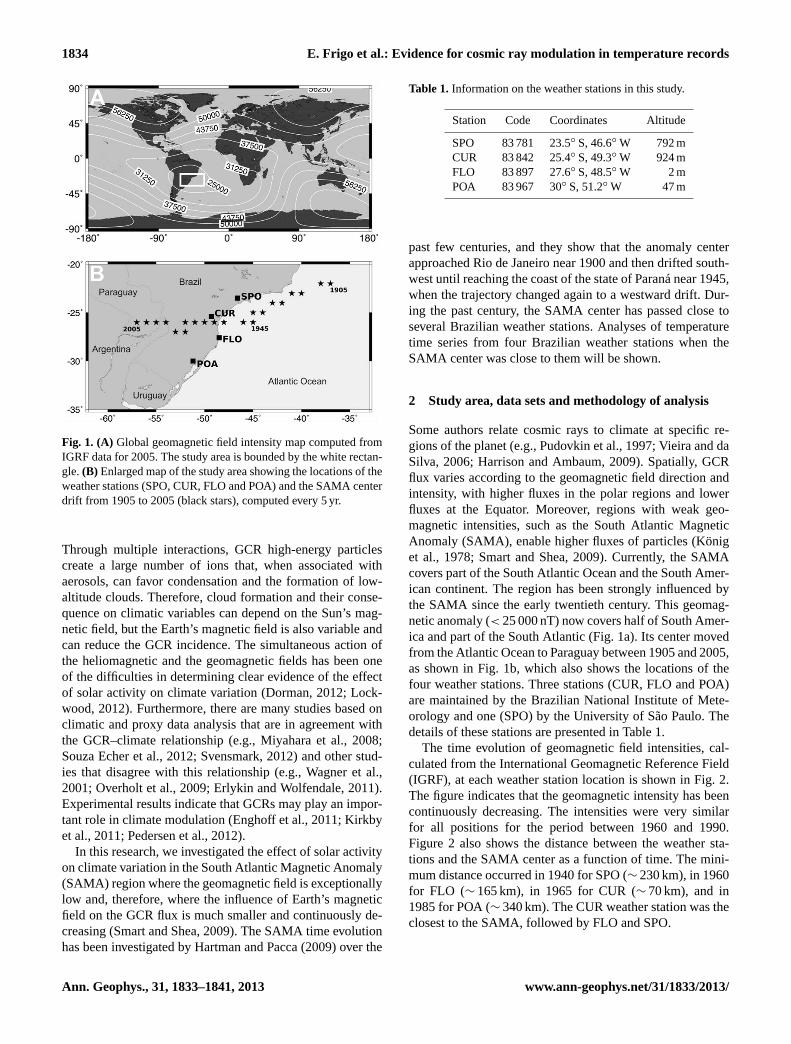
The time evolution of geomagnetic field intensities, cal-culated from the International Geomagnetic Reference Field(IGRF), at each weather station location is shown in Fig. 2.The figure indicates that the geomagnetic intensity has beencontinuously decreasing. The intensities were very similarfor all positions for the period between 1960 and 1990.Figure 2 also shows the distance between the weather sta-tions and the SAMA center as a function of time. The mini-mum distance occurred in 1940 for SPO (∼ 230 km), in 1960for FLO (∼ 165 km), in 1965 for CUR (∼ 70 km), and in1985 for POA (∼ 340 km). The CUR weather station was theclosest to the SAMA, followed by FLO and SPO.
Ann. Geophys., 31, 1833–1841, 2013 www.ann-geophys.net/31/1833/2013/
E. Frigo et al.: Evidence for cosmic ray modulation in temperature records 1835
Fig. 2. (A) Time evolution of the geomagnetic field intensity at 5 yrresolution for the meteorological station positions and the SAMAcenter from 1900 to 2010.(B) Distance between each station andthe SAMA center between 1900 and 2010.
Southern Brazil has a subtropical climate, with tempera-ture and rainfall strongly affected by El Niño–Southern Os-cillation (ENSO; Grimm et al., 2000; Barros et al., 2002).At longer timescales, solar activity variability can also affecttemperature and rainfall patterns. A possible climatic modu-lation by solar activity at these timescales was suggested byGusev et al. (2004) and Souza Echer et al. (2008). Spectralanalysis of tree growth rings over the last centuries indicatedclimatic variations associated with ENSO on an interannualtimescale and with solar activity on decadal to multidecadaltimescales (Rigozo et al., 2003, 2004; Prestes et al., 2011).However, this external forcing has not been studied on theregional scale.
The time series of the annual average temperature rel-ative to the 1961–1990 mean are shown in Fig. 3. Meanvalues for the 1961–1990 interval were 18.7◦C for SPO,16.8◦C for CUR, 20.4◦C for FLO and 19.5◦C for POA.The time series of suggested climate forcings are shown inFig. 4. The Southern Oscillation Index (SOI) (Fig. 4a) wasobtained from the University of East Anglia website (http://www.cru.uea.ac.uk/). The SOI estimates the ENSO ampli-tude. Negative (positive) values are related to El Niño (LaNiña) events. The sunspot number time series (Fig. 4b), rep-resented in terms of Rz (Hoyt and Schatten, 1997), was ob-tained from the Solar Influences Data Analysis Center web-site (http://sidc.oma.be/). Neutron counts (Fig. 4c), an indi-cator of the GCR flux, were measured at the Climax Neu-tron Monitor. These data are available on the website of theNeutron Monitor Datasets of the University of New Hamp-shire for between 1953 and 2006. The Hale cycle (or “doublesunspot cycle”) (Fig. 4d) is the sunspot number multiplied by
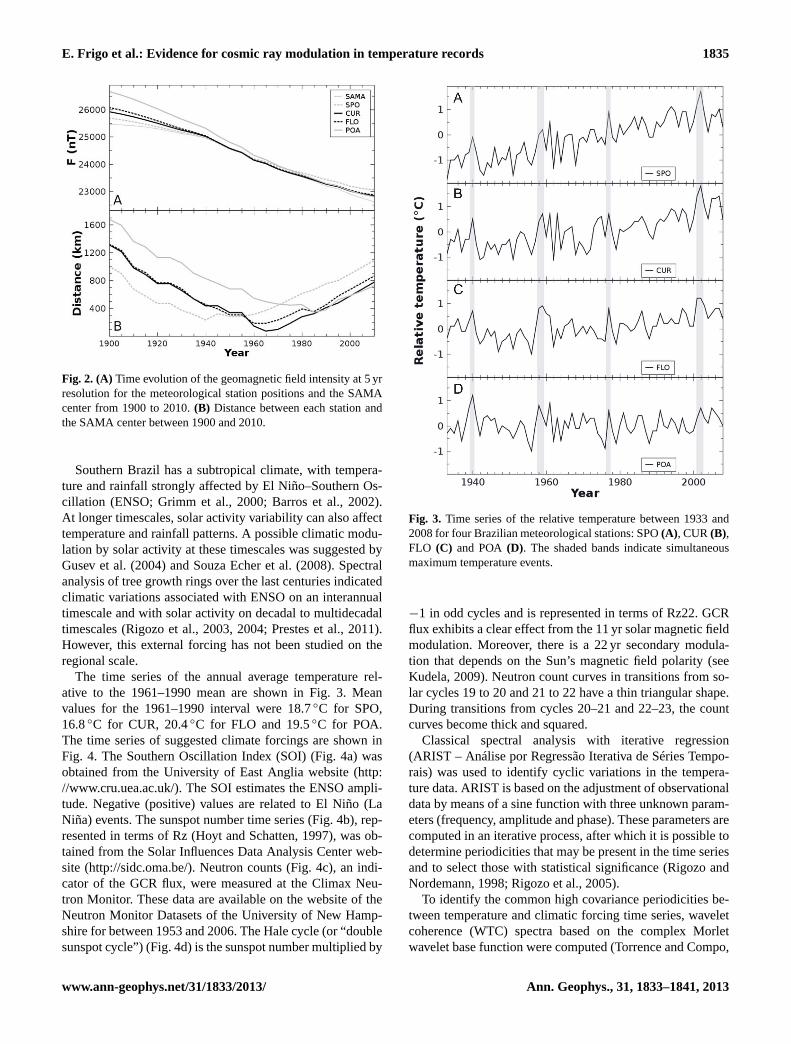
Fig. 3. Time series of the relative temperature between 1933 and2008 for four Brazilian meteorological stations: SPO(A), CUR(B),FLO (C) and POA(D). The shaded bands indicate simultaneousmaximum temperature events.
−1 in odd cycles and is represented in terms of Rz22. GCRflux exhibits a clear effect from the 11 yr solar magnetic fieldmodulation. Moreover, there is a 22 yr secondary modula-tion that depends on the Sun’s magnetic field polarity (seeKudela, 2009). Neutron count curves in transitions from so-lar cycles 19 to 20 and 21 to 22 have a thin triangular shape.During transitions from cycles 20–21 and 22–23, the countcurves become thick and squared.
Classical spectral analysis with iterative regression(ARIST – Análise por Regressão Iterativa de Séries Tempo-rais) was used to identify cyclic variations in the tempera-ture data. ARIST is based on the adjustment of observationaldata by means of a sine function with three unknown param-eters (frequency, amplitude and phase). These parameters arecomputed in an iterative process, after which it is possible todetermine periodicities that may be present in the time seriesand to select those with statistical significance (Rigozo andNordemann, 1998; Rigozo et al., 2005).
To identify the common high covariance periodicities be-tween temperature and climatic forcing time series, waveletcoherence (WTC) spectra based on the complex Morletwavelet base function were computed (Torrence and Compo,
www.ann-geophys.net/31/1833/2013/ Ann. Geophys., 31, 1833–1841, 2013
1836 E. Frigo et al.: Evidence for cosmic ray modulation in temperature records
Fig. 4. Time evolution of the annual mean SOI index(A), Rz timeseries(B), neutron counts registered at the Climax Observatory(C),and Rz22 time series(D). The sunspot cycle number and the globalsolar magnetic field polarity are shown in(B). The gray arrows(black arrows) in(C) indicate transitions from odd to even (even toodd) cycles. The shaded bands indicate the maxima of odd sunspotcycles.
1998). The WTC is quantified by a number between 0 and 1,which indicates the cross-correlation between analyzed timeseries in different spectral bands. For WTC spectra, the coneof influence (COI), the 95 % significance level and the rel-ative phase angles were calculated according to the methodof Grinsted et al. (2004). The COI is the limit of the spec-tral region where edge effects may be statistically important.The 95 % significance level region is a spectral area wherethe WTC values are not affected by a red noise process. Thisspectral region is calculated from a first-order autoregressive(AR1) process. The phase angles give indications about thelinearity of a possible relationship between the two time se-ries. Phase angles around 0◦ or around 180◦ indicate, for alinear relationship with the former, an in-phase relationshipand the latter an anti-phase relationship. Other phase-angleconfigurations indicate a non-linear relationship.
3 Results
The temperature time series shown in Fig. 3 indicate a posi-tive temperature trend for three of the four weather stations:0.030 degrees yr−1 for SPO, 0.021 degrees yr−1 for CUR,and 0.011 degrees yr−1 for FLO. No significant trend hasbeen observed for POA. However, strong interannual vari-
ability and four temperature maxima at SPO, CUR, FLO andPOA in 1940, 1958–1959, 1977 and 2002 are indicated bythe shaded bands in Fig. 3. The average time interval be-tween these peaks is approximately 21 yr, which is very closeto the Hale cycle. Furthermore, the mean annual tempera-ture peaks occurred close to the maxima of odd solar cyclesof positive (negative) polarity at the North (South) Pole in1937, 1957, 1979 and 2000 (Fig. 4). The figure also showsthat mean annual temperature maxima were nearly simulta-neous to the cosmic ray minima that correspond to solar oddcycle maxima activity for 1958, 1982 and 2000–2003.
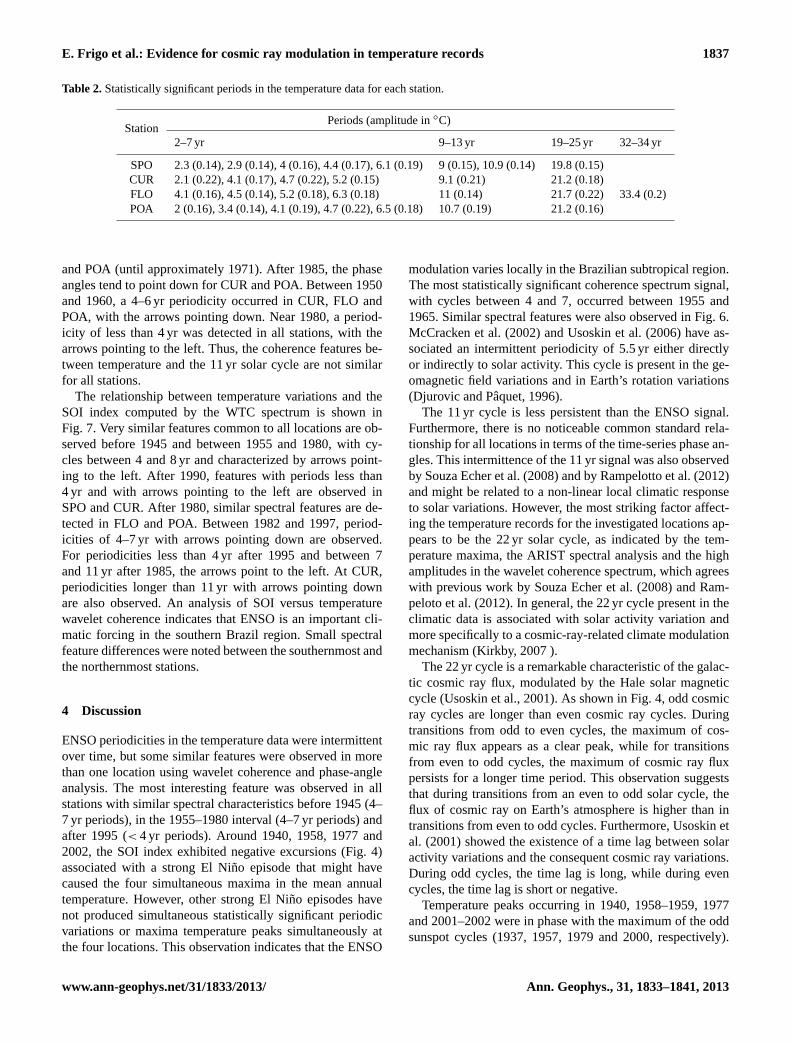
After removing the temperature trends, an iterative regres-sion analysis was used to search for periodicities, and af-ter 200 iterations, periodicities at interannual and decadaltimescales were found over the 95 % confidence level (Ta-ble 2). Periodicities between 19 and 25 yr, 9 and 13 yr, and2 and 7 yr are indications of the Hale, Schwabe and ENSOcycle influence, observed at all stations. The nearly 33 yr pe-riodicity at FLO might be related to the Brückner solar cycle(Brückner, 1890; Prestes et al., 2011). The wavelet coherencepower spectrum and the relative phase angles were calcu-lated to investigate the time evolution of statistically signif-icant periodic variations and the phase relationship betweentemperature and natural climatic forcing.
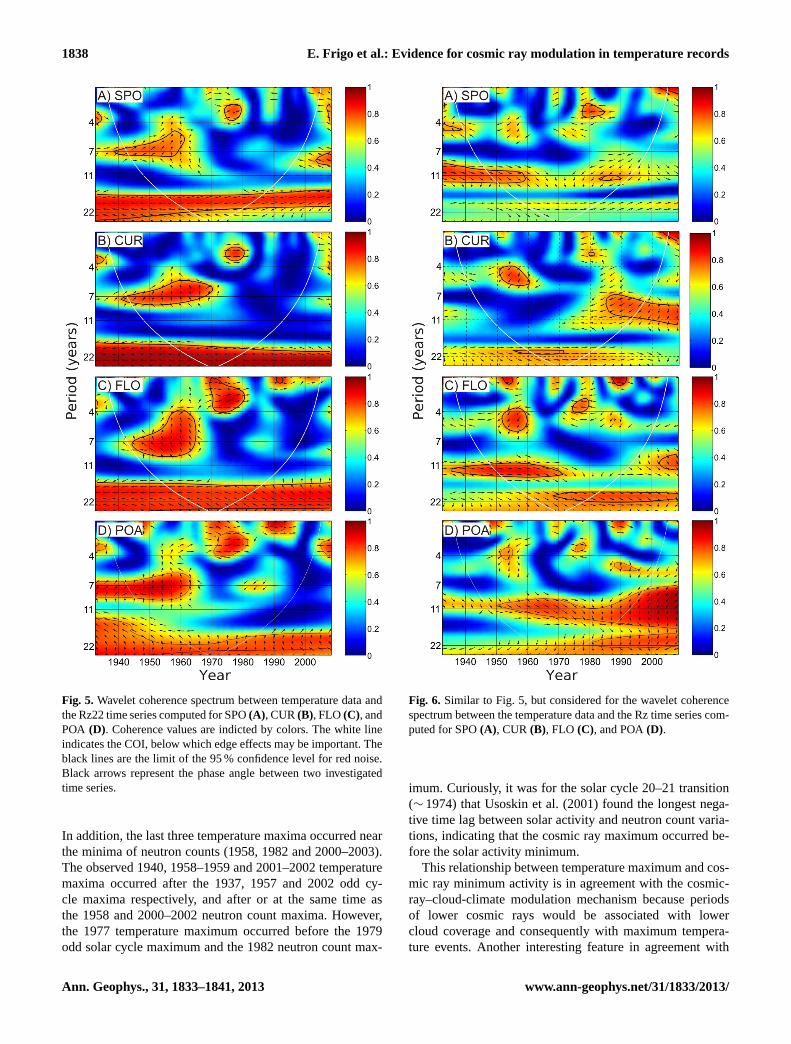
The WTC between the temperature time series and Rz22 isshown in Fig. 5. High and persistent coherence (higher than0.8) was observed for approximately 22 yr periodicities at allfour locations. Part of the signal is outside of the COI. Otherintermittent and statistically low coherent periodicities, be-tween 4 and 8 yr, are also apparent. They occurred at SPObetween 1942 and 1960, at CUR between 1942 and 1970,at FLO between 1943 and 1965, and at POA between 1942and 1962. Other intermittent features with periods less than4 years are apparent between 1970 and 1980 (at all stations)and near 1990 (for FLO and POA). Black arrows in Fig. 5indicate the phase angles between the time series. For peri-odicities of approximately 22 yr, the arrows tend to point tothe left for SPO, CUR and FLO, indicating a possible lin-ear (anti-phase) relationship between the Hale cycle and thetemperature variations. However, for POA, the arrows pointup, indicating a non-linear relationship. For the intermittentperiodicities (4–8 yr), the arrows point up, suggesting a non-linear relationship. For significant periodicities of less than4 yr, the arrows tend to point to the right, indicating a lin-ear relationship. Similar out-of-phase phase-angle relations,at different stations and at the same time, can be an indica-tion of a similar non-linear relationship. Notably, the waveletcoherence spectral features are very similar for all weatherstations.
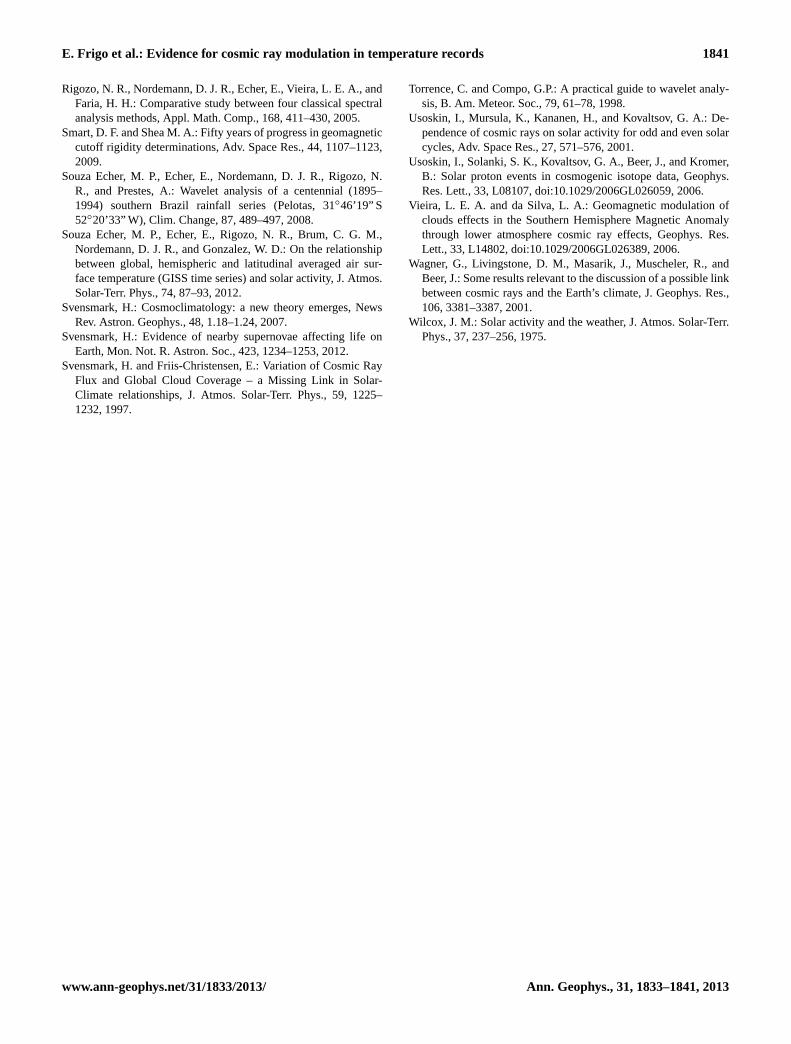
Figure 6 shows the wavelet coherence spectrum betweentemperature and Rz. The 11 yr cycle signal was statisticallysignificant until 1960 for SPO, after 1985 for CUR, until1971 for FLO, and after 1950 for POA. The phase-angleanalysis indicates a linear relationship between the Schwabecycle and temperature in SPO (until 1960), FLO (until 1971)
Ann. Geophys., 31, 1833–1841, 2013 www.ann-geophys.net/31/1833/2013/
E. Frigo et al.: Evidence for cosmic ray modulation in temperature records 1837
Table 2.Statistically significant periods in the temperature data for each station.
and POA (until approximately 1971). After 1985, the phaseangles tend to point down for CUR and POA. Between 1950and 1960, a 4–6 yr periodicity occurred in CUR, FLO andPOA, with the arrows pointing down. Near 1980, a period-icity of less than 4 yr was detected in all stations, with thearrows pointing to the left. Thus, the coherence features be-tween temperature and the 11 yr solar cycle are not similarfor all stations.
The relationship between temperature variations and theSOI index computed by the WTC spectrum is shown inFig. 7. Very similar features common to all locations are ob-served before 1945 and between 1955 and 1980, with cy-cles between 4 and 8 yr and characterized by arrows point-ing to the left. After 1990, features with periods less than4 yr and with arrows pointing to the left are observed inSPO and CUR. After 1980, similar spectral features are de-tected in FLO and POA. Between 1982 and 1997, period-icities of 4–7 yr with arrows pointing down are observed.For periodicities less than 4 yr after 1995 and between 7and 11 yr after 1985, the arrows point to the left. At CUR,periodicities longer than 11 yr with arrows pointing downare also observed. An analysis of SOI versus temperaturewavelet coherence indicates that ENSO is an important cli-matic forcing in the southern Brazil region. Small spectralfeature differences were noted between the southernmost andthe northernmost stations.
4 Discussion
ENSO periodicities in the temperature data were intermittentover time, but some similar features were observed in morethan one location using wavelet coherence and phase-angleanalysis. The most interesting feature was observed in allstations with similar spectral characteristics before 1945 (4–7 yr periods), in the 1955–1980 interval (4–7 yr periods) andafter 1995 (< 4 yr periods). Around 1940, 1958, 1977 and2002, the SOI index exhibited negative excursions (Fig. 4)associated with a strong El Niño episode that might havecaused the four simultaneous maxima in the mean annualtemperature. However, other strong El Niño episodes havenot produced simultaneous statistically significant periodicvariations or maxima temperature peaks simultaneously atthe four locations. This observation indicates that the ENSO
modulation varies locally in the Brazilian subtropical region.The most statistically significant coherence spectrum signal,with cycles between 4 and 7, occurred between 1955 and1965. Similar spectral features were also observed in Fig. 6.McCracken et al. (2002) and Usoskin et al. (2006) have as-sociated an intermittent periodicity of 5.5 yr either directlyor indirectly to solar activity. This cycle is present in the ge-omagnetic field variations and in Earth’s rotation variations(Djurovic and Pâquet, 1996).
The 11 yr cycle is less persistent than the ENSO signal.Furthermore, there is no noticeable common standard rela-tionship for all locations in terms of the time-series phase an-gles. This intermittence of the 11 yr signal was also observedby Souza Echer et al. (2008) and by Rampelotto et al. (2012)and might be related to a non-linear local climatic responseto solar variations. However, the most striking factor affect-ing the temperature records for the investigated locations ap-pears to be the 22 yr solar cycle, as indicated by the tem-perature maxima, the ARIST spectral analysis and the highamplitudes in the wavelet coherence spectrum, which agreeswith previous work by Souza Echer et al. (2008) and Ram-peloto et al. (2012). In general, the 22 yr cycle present in theclimatic data is associated with solar activity variation andmore specifically to a cosmic-ray-related climate modulationmechanism (Kirkby, 2007 ).
The 22 yr cycle is a remarkable characteristic of the galac-tic cosmic ray flux, modulated by the Hale solar magneticcycle (Usoskin et al., 2001). As shown in Fig. 4, odd cosmicray cycles are longer than even cosmic ray cycles. Duringtransitions from odd to even cycles, the maximum of cos-mic ray flux appears as a clear peak, while for transitionsfrom even to odd cycles, the maximum of cosmic ray fluxpersists for a longer time period. This observation suggeststhat during transitions from an even to odd solar cycle, theflux of cosmic ray on Earth’s atmosphere is higher than intransitions from even to odd cycles. Furthermore, Usoskin etal. (2001) showed the existence of a time lag between solaractivity variations and the consequent cosmic ray variations.During odd cycles, the time lag is long, while during evencycles, the time lag is short or negative.
Temperature peaks occurring in 1940, 1958–1959, 1977and 2001–2002 were in phase with the maximum of the oddsunspot cycles (1937, 1957, 1979 and 2000, respectively).
www.ann-geophys.net/31/1833/2013/ Ann. Geophys., 31, 1833–1841, 2013
1838 E. Frigo et al.: Evidence for cosmic ray modulation in temperature records
Fig. 5. Wavelet coherence spectrum between temperature data andthe Rz22 time series computed for SPO(A), CUR(B), FLO (C), andPOA (D). Coherence values are indicted by colors. The white lineindicates the COI, below which edge effects may be important. Theblack lines are the limit of the 95 % confidence level for red noise.Black arrows represent the phase angle between two investigatedtime series.
In addition, the last three temperature maxima occurred nearthe minima of neutron counts (1958, 1982 and 2000–2003).The observed 1940, 1958–1959 and 2001–2002 temperaturemaxima occurred after the 1937, 1957 and 2002 odd cy-cle maxima respectively, and after or at the same time asthe 1958 and 2000–2002 neutron count maxima. However,the 1977 temperature maximum occurred before the 1979odd solar cycle maximum and the 1982 neutron count max-
Fig. 6. Similar to Fig. 5, but considered for the wavelet coherencespectrum between the temperature data and the Rz time series com-puted for SPO(A), CUR (B), FLO (C), and POA(D).
imum. Curiously, it was for the solar cycle 20–21 transition(∼ 1974) that Usoskin et al. (2001) found the longest nega-tive time lag between solar activity and neutron count varia-tions, indicating that the cosmic ray maximum occurred be-fore the solar activity minimum.
This relationship between temperature maximum and cos-mic ray minimum activity is in agreement with the cosmic-ray–cloud-climate modulation mechanism because periodsof lower cosmic rays would be associated with lowercloud coverage and consequently with maximum tempera-ture events. Another interesting feature in agreement with
Ann. Geophys., 31, 1833–1841, 2013 www.ann-geophys.net/31/1833/2013/
E. Frigo et al.: Evidence for cosmic ray modulation in temperature records 1839
Fig. 7. Similar to Fig. 5, but considered for the wavelet coherencespectrum between the temperature data and the SOI index time se-ries computed for SPO(A), CUR (B), FLO (C), and POA(D).
the cosmic-ray–climate relationship is that the phase-anglerelations between temperature and the 22 yr solar cycle aresimilar for SPO, CUR an FLO, although it is different forPOA. Figure 2 shows that the SAMA was closer to SPO,CUR and FLO positions compared to POA. The 22 yr solarmagnetic cycle is also present in POA’s temperature data, butwith a phase difference between the time series. A possibleexplanation for this phase difference is that a geomagneticfield being closer to the SAMA center results in a weakerfield and higher precipitation of electrically charged parti-cles. Therefore, the Hale cycle modulation is strongly evi-
denced in the region that surrounds the locations of Earth’slowest magnetic field intensity.
5 Conclusions
The regional impact of natural climatic forcings (solar vari-ability, galactic cosmic rays and ENSO) on temperature vari-ations has been discussed for the Brazilian subtropical re-gion with a SAMA-heavy influence since the beginning ofthe twentieth century. Spectral analysis results indicate thatthe influences of ENSO and the Schwabe solar cycle are in-termittent in time and exhibit different characteristics for dif-ferent locations in southern Brazil. Modulation of the ENSOand the Schwabe solar cycle signals can appear with differentcharacteristics in distinct locations and under distinct meteo-rological variables (Grimm et al., 2000; Barros et al., 2002;Haigh, 2007; Gray et al., 2010).
The Hale solar magnetic cycle signal was persistent duringthe entire period for all analyzed locations, in agreement withSouza Echer et al. (2008) and Rampelotto et al. (2012), whoused data from a single location. The four temperature max-ima in the time interval between 1933 and 2008 occurred si-multaneously at all weather stations, which are separated by2 degrees of latitude. The time of occurrence of these max-ima nearly coincides with the maxima of solar odd cycles andconsequently with the minima of the galactic cosmic ray oddcycles.
Results of the present work are an indirect statistical in-dication for a possible cosmic-ray–climate mechanism at aregional scale. This conclusion is supported by the influenceof SAMA, as possibly indicated by the phase-angle analysis,which allows for easier entry of electrically charged parti-cles (König et al., 1978; Vieira and da Silva, 2006). Futurework will continue this line of study with additional datafrom other climatic variables and from other weather stationsinstalled in this region. Furthermore, displacement of fewyears between some cosmic ray minima in odd cycles andtemperature maxima should be investigated in more detail infuture work.
Acknowledgements.The authors thank the Brazilian National In-stitute of Meteorology for providing the temperature data for theCuritiba, Florianópolis and Porto Alegre weather stations as wellas the following Brazilian financial support agencies: E. Frigo –CAPES; N. R. Rigozo – CNPq (APQ 470605/2012-0, and researchproductivity, 303368/2012-8). Authors also thank the National Sci-ence Foundation (Grant ATM-0339527) for the neutron count data.Special thanks to Karel Kudela and to an anonymous reviewer fortheir important contribution to the improvement of the paper.
Topical Editor P. M. Ruti thanks two anonymous referees fortheir help in evaluating this paper.
www.ann-geophys.net/31/1833/2013/ Ann. Geophys., 31, 1833–1841, 2013
1840 E. Frigo et al.: Evidence for cosmic ray modulation in temperature records
References
Barros, V. R., Grimm, A. M., and Doyle, M. E.: Relationship be-tween temperature and circulation in Southeastern South Amer-ica and its influence from El Niño and La Niña events, J. Meteo-rol. Soc. Jpn., 80-1, 33–44, 2002.
Brückner, E.: Klimaschwankungen seit 1700, Geograph. Abhand.,14, 325, 1890.
Dickinson, R. E.: Solar variability and the lower atmosphere, B.Am. Meteor. Soc., 56, 1240–1248, 1975.
Djurovic, D. and Pâquet, P.: The common oscillations of solar ac-tivity, the geomagnetic field, and the Earth’s rotation, Sol. Phys.,167, 427–439, 1996.
Dorman, L. I.: Cosmic rays and space weather: effects on global cli-mate change, Ann. Geophys., 30, 9–19, doi:10.5194/angeo-30-9-2012, 2012.
Enghoff, M. B., Pedersen, J. O. P., Uggerhøj, U. I., Paling,S. M., and Svensmark, H.: Aerosol nucleation induced by ahigh energy particle beam, Geophys. Res. Lett., 38, L09805,doi:10.1029/2011GL047036, 2011.
Erlykin, A. D. and Wolfendale, A. W.: Cosmic ray effects on cloudcover and their relevance to climate change, J. Atmos. Solar-Terr.Phys., 73, 1681–1686, 2011.
Gray, L. J., Beer, J., Geller, M., Haigh, J. D., Lockwood, M.,Matthes, K., Cubasch, U., Fleitmann, D., Harrison, G., Hood,L., Luterbacher, J., Meehl, G. A., Shindell, D., Van Geel, B.,and White, W.: Solar influence on climate, Rev. Geophys., 48,RG4001, doi:10.1029/2009RG000282, 2010.
Grimm, A., Barros, V., and Doyle, M.: Climate variability in south-ern South America associated with El Niño La Niña events, J.Climate, 13, 35–58, 2000.
Grinsted, A., Moore, J. C., and Jevrejeva, S.: Application of thecross wavelet transform and wavelet coherence to geophysicaltime series, Nonlinear Proc. Geoph., 11, 561–566, 2004.
Gusev, A. A., Martin, I. M., Mello, M. G. S., Pankov, V., Pugacheva,G., Schuch, N. J., and Spjeldvik, W. N.: Bidecadal cycles in liq-uid precipitations in Brazil, Adv. Space Res., 34, 370–375, 2004.
Haigh, J. D.: The Sun and The Earth’s Climate, Living Reviews inSolar Physics, 4, 2007.
Harrison, R. G. and Ambaum, M. H. P.: Observed atmosphericelectricity effect on Clouds, Environ. Res. Lett., 4, 014003,doi:10.1088/1748-9326/4/1/014003, 2009.
Hartmann, G. A. and Pacca, I. G.: Time evolution of the South At-lantic Magnetic Anomaly, Ann. Brazilian Acad, Sciences, 81,243–255, 2009.
Hoyt, D. V. and Schatten, K. H.: The role of the sun in climatechange, Oxford University Press, New York, 1997.
Kirkby, J.: Cosmic Rays and Climate, Surv. Geophys., 28, 333–375,2007.
Kirkby, J., Curtius, J., Almeida, J., Dunne, E., Duplissy, J., Ehrhart,S., Franchin, A., Gagné, S., Ickes, L., Kürten, A., Kupc, A., Met-zger, A., Riccobono, F., Rondo, L., Schobesberger, S., Tsagkoge-orgas, G., Wimmer, D., Amorim, A., Bianchi, F., Breitenlechner,M., David, A., Dommen, J., Downard, A., Ehn, M., Flagan, R. C.,Haider, S., Hansel, A., Hauser, D., Jud, W., Junninen, H., Kreissl,F., Kvashin, A., Laaksonen, A., Lehtipalo, K., Lima, J., Love-joy, E. R., Makhmutov, V., Mathot, S., Mikkilä, J., Minginette,P., Mogo, S., Nieminen, T., Onnela, A., Pereira, P., Petäjä, T.,Schnitzhofer, R., Seinfeld, J. H., Sipilä, M., Stozhkov, Y., Strat-mann, F., Tomé, A., Vanhanen, J., Viisanen, Y., Vrtala, A., Wag-
ner, P. E., Walther, H., Weingartner, E., Wex, H., Winkler, P. M.,Carslaw, K. S., Worsnop, D. R., Baltensperger, U., and Kulmala,M.: Role of sulphuric acid, ammonia and galactic cosmic rays inatmospheric aerosol nucleation, Nature, 476, 429–433, 2011.
König, P. J., Walt, A. J. V. D., Stoker, P. H., Raubenheimer, B. C.,Shea, M. A., and Smart, D. F.: Vertical cutoff rigidity and theintensity distribution of cosmic rays near Cape Town, in: Inter-national Cosmic Ray Conference, 15th, Plovdiv, Bulgaria, 13–26 August 1977, Conference Papers, Vol. 4, A79-37301 15–93,Sofia, Bulgarian Academy of Sciences, 173–177, 1978.
Kudela, K.: On energetic particles in space, Acta Phys. Slovaca, 59,537–652, 2009.
Lassen, K. and Friis-Christensen, E.: Variability of solar cyclelength during the past five centuries and the apparent associationwith terrestrial climate, J. Atmos. Solar-Terr. Phys., 57, 835–845,1995.
Lockwood, M.: Solar influence on global and regional climates,Surv. Geophys., 33, 503–534, 2012.
McCracken, K. G., J. Beer, and McDonald, F. B.: A five-yearvariability in the modulation of the galactic cosmic radiationover epochs of low solar activity, Geophys. Res. Lett, 29, 2161,doi:10.1029/2002GL015786, 2002.
Miyahara, H., Yokoyama, Y., and Masuda, K.: Possible link be-tween multi-decadal climate cycles and periodic reversals of so-lar magnetic field polarity, Earth Planet. Sci. Let., 272, 290–295,2008.
Overholt, A. C., Melott, A. L., and Pohl, M.: Testing the link be-tween terrestrial climate change and galactic spiral arm transit,Astrophys. J., 705, L101–L103, 2009.
Pedersen, J. O. P., Enghoff, M. B., Paling, S. M., and Svensmark,H.: Aerosol nucleation in an ultra-low ion density environment,J. Aerosol Sci., 50, 75–85, 2012.
Prestes, A., Rigozo, N. R., Nordemann, D. J. R., Wrasse, C.M., Souza Echer, M. P., Echer, E., da Rosa, and M. B.,and Rampelotto, P. H.: Sun–earth relationship inferred bytree growth rings in conifers from Severiano De Almeida,Southern Brazil, J. Atmos. Solar-Terr. Phys., 73, 1587–1593,doi:10.1016/j.jastp.2010.12.014, 2011.
Pudovkin, M. I., Veretenenko, S. V., Pellinen, R., and Kyrö, E.: Me-teorological characteristic changes in the high-latitudinal atmo-sphere associated with Forbush decreases of the galactic cosmicrays, Adv. Space Res., 20, 1169–1172, 1997.
Rampelotto, P. H., Rigozo, N. R., da Rosa, M. B., Prestes, A.,Frigo, E., Souza Echer, M. P., and Nordemann, D. J. R.: Vari-ability of Rainfall and Temperature (1912–2008) from SantaMaria (29◦41’ S, 53◦48’ W) and its Connection with Natural In-fluences, J. Atmos. Solar-Terr. Phys., 77, 152–160, 2012.
Rigozo, N. R. and Nordemann, D. J. R.: Iterative Regression Anal-ysis of Periodicities in Geophysical Record Time Series, Rev.Bras. Geofis., 16, 149–158, 1998.
Rigozo, N. R., Vieira, L. E. A., Echer, E., and Nordemann, D. J.R.: Wavelet Analysis of Solar-ENSO Imprints in Tree Ring Datafrom Southern Brazil in the Last Century, Clim. Change, 60,329–340, 2003.
Rigozo, N. R., Nordemann, D. J. R., Echer, E., and Vieira, L. E. A.:Search for solar periodicities in tree-ring widths from Concórdia(S.C., Brazil), Pure Appl. Geophys., 161, 221–233, 2004.
Ann. Geophys., 31, 1833–1841, 2013 www.ann-geophys.net/31/1833/2013/
E. Frigo et al.: Evidence for cosmic ray modulation in temperature records 1841
Rigozo, N. R., Nordemann, D. J. R., Echer, E., Vieira, L. E. A., andFaria, H. H.: Comparative study between four classical spectralanalysis methods, Appl. Math. Comp., 168, 411–430, 2005.
Smart, D. F. and Shea M. A.: Fifty years of progress in geomagneticcutoff rigidity determinations, Adv. Space Res., 44, 1107–1123,2009.
Souza Echer, M. P., Echer, E., Nordemann, D. J. R., Rigozo, N.R., and Prestes, A.: Wavelet analysis of a centennial (1895–1994) southern Brazil rainfall series (Pelotas, 31◦46’19” S52◦20’33” W), Clim. Change, 87, 489–497, 2008.
Souza Echer, M. P., Echer, E., Rigozo, N. R., Brum, C. G. M.,Nordemann, D. J. R., and Gonzalez, W. D.: On the relationshipbetween global, hemispheric and latitudinal averaged air sur-face temperature (GISS time series) and solar activity, J. Atmos.Solar-Terr. Phys., 74, 87–93, 2012.
Svensmark, H.: Cosmoclimatology: a new theory emerges, NewsRev. Astron. Geophys., 48, 1.18–1.24, 2007.
Svensmark, H.: Evidence of nearby supernovae affecting life onEarth, Mon. Not. R. Astron. Soc., 423, 1234–1253, 2012.
Svensmark, H. and Friis-Christensen, E.: Variation of Cosmic RayFlux and Global Cloud Coverage – a Missing Link in Solar-Climate relationships, J. Atmos. Solar-Terr. Phys., 59, 1225–1232, 1997.
Torrence, C. and Compo, G.P.: A practical guide to wavelet analy-sis, B. Am. Meteor. Soc., 79, 61–78, 1998.
Usoskin, I., Mursula, K., Kananen, H., and Kovaltsov, G. A.: De-pendence of cosmic rays on solar activity for odd and even solarcycles, Adv. Space Res., 27, 571–576, 2001.
Usoskin, I., Solanki, S. K., Kovaltsov, G. A., Beer, J., and Kromer,B.: Solar proton events in cosmogenic isotope data, Geophys.Res. Lett., 33, L08107, doi:10.1029/2006GL026059, 2006.
Vieira, L. E. A. and da Silva, L. A.: Geomagnetic modulation ofclouds effects in the Southern Hemisphere Magnetic Anomalythrough lower atmosphere cosmic ray effects, Geophys. Res.Lett., 33, L14802, doi:10.1029/2006GL026389, 2006.
Wagner, G., Livingstone, D. M., Masarik, J., Muscheler, R., andBeer, J.: Some results relevant to the discussion of a possible linkbetween cosmic rays and the Earth’s climate, J. Geophys. Res.,106, 3381–3387, 2001.
Wilcox, J. M.: Solar activity and the weather, J. Atmos. Solar-Terr.Phys., 37, 237–256, 1975.
www.ann-geophys.net/31/1833/2013/ Ann. Geophys., 31, 1833–1841, 2013