+ All Categories
Home > Documents > The Spatial and Social Network Dimensions of Mobile ... · 2 The Spatial and Social Network...

The Spatial and Social Network Dimensions of Mobile ... · 2 The Spatial and Social Network...

Date post: 30-Aug-2018
Category:
Upload: letuong
View: 216 times
Download: 0 times
Share this document with a friend
41
1 The Spatial and Social Network Dimensions of Mobile Communication: A Test of the Social Stratification and Social Diversification Hypotheses Yossef Arie Gustavo S. Mesch (*) Department of Sociology University of Haifa, Israel (*)Direct all correspondence to Gustavo S. Mesch, Department of Sociology & Anthropology, University of Haifa, Har Hacarmel 31905, Israel. Email:[email protected] Acknowledgments: The authors wish to thank Ephraim Yaar, Yochanan Peres, Yasmin Alkaly and Wenhong Chen for their useful comments and insights. We are thankful to the helpful suggestions of three anonymous reviewers and the Editor of Communication Research.
Transcript

1

The Spatial and Social Network Dimensions of Mobile Communication:

A Test of the Social Stratification and Social Diversification Hypotheses

Yossef Arie

Gustavo S. Mesch (*)

Department of Sociology

University of Haifa, Israel

(*)Direct all correspondence to Gustavo S. Mesch, Department of Sociology & Anthropology, University of Haifa, Har Hacarmel 31905, Israel. Email:[email protected]

Acknowledgments:

The authors wish to thank Ephraim Yaar, Yochanan Peres, Yasmin Alkaly and

Wenhong Chen for their useful comments and insights. We are thankful to the helpful

suggestions of three anonymous reviewers and the Editor of Communication

Research.

2

The Spatial and Social Network Dimensions of Mobile Communication:

A Test of the Social Stratification and Social Diversification Hypotheses

Abstract

Studies have shown that ethnic segregation is conducive to social segregation. With

the advent of information and communication technologies, mobile communication

can support non-local social interactions and reconfigure the network composition of

ethnic groups. This study focused on the similarities and differences between ethno-

national groups in the structure of their cell phone communications. Data for this

study includes a sample of 9,099 business customers' mobile phone calls from an

Israeli mobile operator and tested two theoretical explanations. The social

stratification approach predicts that mobile communication will reflect the patterns of

spatial and social stratification that exist in society. On the other hand, the social

diversification hypothesis expects that residentially and socially segregated minority

groups will take advantage of mobile communication to diversify their social contacts

and to engage in mobile communications with non-local and out-group ties. The

findings suggest that in the information society both structural conditions (the

stratification approach) and social incentives (the diversification approach) are

relevant for the understanding of inter-ethnic mobile communication and structural

conditions reduced inter-group mobile communication patterns. The Arab Israeli

minority was more likely than the Jewish Israeli majority to engage in mobile

communication with non-local ties and out-group members. Yet, structural conditions

reduced inter-group mobile communication patterns. The theoretical implications of

the findings for inter-group mobile communication are discussed.

Keywords: mobile communication, ethnic social segregation, minority status

and ICT, network diversification

3

The Spatial and Social Network Dimensions of Mobile Communication:

A Test of the Social Stratification and Social Diversification Hypotheses

Sociological studies have shown that in multicultural societies, ethnic origin,

ethnic inequality and spatial segregation intertwine with each other and create social

networks with a high level of ethnic similarity (Massey, 2007; Massey & Eggers,

1990; Musterd & Winter, 1998; Portes & Bach, 1985; Sampson, 2012). Network

similarity may inhibit the ability of minority groups to access information and

ultimately reduce their social capital (James, 2000; Marsden, 1987; McPherson,

Smith-Lovin & Cook 2001). However, with the advent of information and

communication technologies (I.C.T.), social interactions are no longer restricted to

face-to-face interactions, and new forms of technologically based communication

have emerged (Castells et al., 2007; Katz & Aakhus, 2002; Ling, 2008). Mobile

communication can support social interactions even when individuals are not in

physical proximity (Ling, 2008). Therefore, mobile communication can re-configure

the social network composition of ethnic groups and diversify its composition

(Dutton, 2005; Mesch & Talmud, 2006, 2010; Wellman, 2001, 2002).

During the last decade, the use of mobile phones for communication purposes

has increased worldwide, changing social interactions and supporting new forms of

coordination and social connections (Campbell & Kwak, 2010). Scholars describe the

use of mobile phones as an example of micro-coordination, a term used to denote

real-time changes of plans that were already underway (Ling & Yttri, 2002). Mobile

communications create perpetual contact and the personalization of social networks

(Campbell & Park, 2008; Katz & Aakhus, 2002). Perpetual contact implies that

communication is conducted all the time, everywhere. Perpetual connection is likely

4

to support personal relationships and in-group communication at the expense of out-

group communication (Campbell & Kwak, 2010; Ling, 2008).

In multicultural societies, ethnic social and spatial segregation their negative

implications for access to social opportunities have been central topics of research.

Mobile communication provides a fresh opportunity to investigate the extent to which

cell phone use reflects or provides a potential venue for overcoming the spatial and

social dimensions of segregation. In this article, we use a large and unique data set of

actual patterns of cell phone communications that identifies the ethnic origin of the

communicators. The data set is from Israel, a multicultural society characterized by a

high level of social and residential segregation between the two major ethnic groups

(Jews and Arabs), making it an appropriate setting for the study.

Therefore, this study asks, does mobile communication reflect spatial and

social segregation or integration among ethnic groups? In doing this we make a

number of contributions to the existing literature. First, to test this question we rely on

the social stratification and social diversification perspectives that present conflicting

expectations about the role of I.C.T. on patterns of inter-ethnic communication.

Testing in a single study these perspectives contributes to the understanding of their

relative contribution to the explanation of inter-ethnic mobile communication in the

information society. Second, to investigate this question, we compare the actual

patterns of mobile communication between a majority group (Jewish Israelis) and a

minority group (Arab Israelis) in the business sector. The use of actual patterns of

communication (metered data) gives us an important corrective to the more common

use of self–reported data (Boase & Ling, 2011). In sum, this study contributes to the

understanding of the role of mobile communication among social networks in deeply

divided, ethnically diverse societies.

5

Mobile communication and social stratification

The stratification hypothesis argues that the adoption of information and

communication technologies reflects patterns of existing inequalities in the society

(Anderson & Kennedy, 2002; Norris, 2001; Van Dijk & Hacker, 2003; Warren,

2007). According to this approach, varying levels of I.C.T use mirror differences in

social inequality and social capital. The majority group with higher socio-economic

status and more economic resources seeks to maintain its social capital. Thus, its use

of I.C.T will be directed toward strengthening associations and bonds within the

ethnic group. By using this strategy, its preserves its high levels of social capital,

access to information and social relations within the majority group. Furthermore, as

the ethnic enclave theory posits, intra-ethnic relationships may increase as a

minority's reaction to social exclusion. Minorities often respond to social

discrimination by expanding their in-group ties and reducing their out-group ties

(Portes & Bach, 1985). There is some disagreement with this conclusion ( Junco,

Merson & Salter, 2010; Hampton, Lee & Her, 2011). We will elaborate on alternative

arguments later on, when we present the diversification perspective and some recent

evidence about the role of mobile phones in social network diversification.

Studies conducted on I.C.T. communication have found that individuals’

social associations tend to be with others who share similar characteristics with them

such as age, gender, marital status, ethnicity and nationality (McPherson et al., 2001;

Mesch & Talmud, 2006). Studies about the formation of social relationships have also

emphasized the importance of homophily, which maintains that contacts and

friendships are formed between similar individuals more often than between

dissimilar individuals (McPherson et al., 2001). As a result, residential and social

6

segregation prevents members of minority groups from interacting with members of

other ethnic and status groups (Mesch, 2012).

This rationale has been validated in research about networks mediated by the

use of mobile phones. The literature claims that mobile phone communication

reflects patterns of communication within a given geographical area. This approach

argues that mobile communication is not only portable, but is also used more and

more frequently to communicate with those nearby who live in close proximity to us

(Fortunati, 2005). Consistent with this view, a study conducted in ethnic minority

neighborhoods found that the Internet was more integrated into the communication

infrastructure of white neighborhoods (the ethnic majority) than ethnic minority

neighborhoods. Communication infrastructure refers to the various forms of media

(both mediated and interpersonal) available to residents that are conducive to

residents perception of neighborhood attachment. The study suggests the possibility

that in ethnic minority neighborhoods, only those people who already have

connections to the communication resources benefit from the addition of I.C.T.

communication (Matei & Ball-Rokeach, 2003).

Thus, the stratification approach implies that both majority and minority

groups use mobile phones to enhance their local and in-group ties, so mobile phone

use reflects the residential and social segregation of these ethnic groups. Why would

we expect that the use of mobile communication would be directed toward

strengthening local associations and bonds within the ethnic group, as the

stratification hypothesis implies? A potential answer lies in the structural theory of

heterogeneity and inequality (Blau, 1977). Structural conditions that provide

opportunities for social relationships and patterns of mobile communication might be

affected by the variation in opportunities for in-group and out-group communication.

7

Blau’s theory is concerned with the implications of the social structure for social

integration. Its basic assumption is that social associations depend on the

opportunities for social contact. Thus, the greater the opportunity for these contacts,

the greater the likelihood that meaningful relationships will be established.

One structural condition is the size of the group. The probability of social

contacts between any two different social groups depends on the availability of

members of an out-group to connect with in-group members. Of course, the larger the

size of the out-group, the better the likelihood of some of them establishing

relationships with members of the in-group (Blau & Blau, 1982; Marsden, 1987;

Mayhew & Levinger, 1976; South & Messner, 1986). However, the theory also

emphasizes that group size as a condition for social association is constrained by

social heterogeneity and inequality. Heterogeneity reflects the distribution of the

members of the population across social groups. Heterogeneity is directly related to

the probability of intergroup relationships because it reflects the likelihood of random

contacts and the establishment of associations. The degree of heterogeneity will be

positively related to the likelihood of intergroup relationships (Blau, 1977). In

addition, Smith (1985) found that ethnic heterogeneity increases the chance of

economic transactions between members of different ethnic groups. Nee (1994) added

that the greater the level of ethnic heterogeneity in an advanced industrial society, the

greater the probability of intergroup contact, the larger the size of the mixed economy,

and the more porous the social boundaries of the ethnic groups participating in it (Nee

et al., 1994).

Another dimension of Blau's theory is inequality, namely, the differences

between groups in terms of income, wealth and prestige. When membership in

different groups is associated with differences in social status, opportunities for

8

contact are likely to be infrequent. Most relevant for our study is the dimension of

segregation, which is related to ethnic inequality (Massey, 2007; McPherson et al.,

2001). Opportunities for contact clearly vary along with the location of people in

physical space. Individuals who are physically separated from one another will be less

likely to have opportunities for making social connections. Consequently, we expect

that

H1: The greater the spatial segregation between ethnic groups, the smaller the

percentage of non-local ties.

H2: The greater the spatial segregation between ethnic groups, the smaller the

percentage of out-group ties.

Mobile communication and social diversification

A different expectation derives from the concept of the networked society. In

this view, mobile communication redefines the geographical space and does not

necessarily reflect it (Castells et al., 2007). According to this view, mobile phones

create new social arrangements between the "time-space" arenas including flexible

"time-place" arenas crossing a given geographical space (Castells et al., 2007; Green,

2002). Castells (2007) used the expression "the mobile network society" in order to

highlight the proliferation of mobile communications in every aspect of our lives. In

the mobile network society, mobile communication enhances the autonomy of

individuals, allowing them to bypass the limitations of space and build new

communication and association ties. Castells (2007) explains that the dimension of

place does not disappear in mobile communications. Instead, such communication

redefines the meaning of the space that the individual chooses to call, even if the

places are home or work. Mobile phones reduce the need to meet face-to-face in order

to create and maintain social bonds (Ling, 2008).

9

Nevertheless, some empirical studies seem to contradict this argument. Cell

phone communication appears to be more common for communication with nearby

contacts, implying that the total duration of cell phone calls and the number of calls

decline with distance (Calabrese et al., 2011; Mok et al., 2010; Quan-Haase, 2007).

However, these studies did not consider ethnic residential segregation and the

communication patterns between ethnic groups in segregated societies. A recent study

in South East Asia based on cell phone data found that while the distribution of spatial

segregation is bimodal, the distribution of cell phone communication indicates a

disproportionate likelihood of the ethnic minority and ethnic majority communicating

with the majority group (Blumenstock & Fratamico, 2013). This study suggests that

mobile communication is likely to facilitate inter-group communication.

Consistent with the network society view, the diversification hypothesis

underscores the unique uses of I.C.T among minority groups and assumes that this

group will use I.C.T to diversify its social network to overcome geographical and

social barriers (Mesch & Talmud, 2010). The need for the diversification of social ties

emerges from the nature of ethnic segregation in multicultural societies (Lin, 2001).

In societies that reward individuals differentially according to income, prestige and

power, stratification systems result in the varying ability of individuals to gain access

to residential locations (Massey, 2007; Semyonov & Glikman, 2009). Spatial

segregation implies that the association choices available to minorities are limited to

the ones that exist in their residential locations (Britton, 2011; Massey, 2007).

According to the diversification hypothesis (Mesch, 2007, 2012) information and

communication technologies provide a platform for overcoming the limited

opportunities for inter-ethnic interaction that result from residential segregation.

Therefore, the diversification perspective maintains that disadvantaged groups will

10

use information and communication technologies to diversify their sources of

information and social networks. At the same time, majority groups will use

information and communication technologies more to maintain their existing contacts

and associations (Mesch, 2007, 2012).

Diversification is a concept that can be linked to social capital. Although there

are several accepted definitions and operationalizations of this concept, it is agreed

that social capital refers to network ties that provide mutual support, a shared

language and norms, social trust, and a sense of mutual obligation from which people

can derive value (Huysman & Wulf, 2004). Based on these qualities, networks

provide differential access to resources that include opportunities, skills, information,

social support and sociability. In the diversification perspective, I.C.T is conceived as

a social arena of shared activities for achieving differential "bridging" and "bonding"

social capital (Mesch, 2012). We can explain the use of I.C.T. to diversify out-group

ties as an attempt to increase bridging social capital. In contrast, we can assume that

the use of I.C.T. to maintain in-group ties arises from the desire to retain and increase

social capital (Putman, 2000; Rainie & Wellman, 2012).

Consistent with the diversification perspective, studies have reported that

disadvantaged groups tend to use I.C.T. to expand their business and occupational

contacts, whereas members of the majority group are more motivated to use I.C.T. to

maintain existing family and friendships ties (Mesch, 2012). As for the role of mobile

phones in the structure of social ties, recent studies support the view that mobile

phones expand the size of the users’ core networks of discussion and have a positive

effect on their diversity (Hampton et al., 2009; Hampton, Lee & Her, 2011). A study

of American college students found that mobile phone use and texting is higher

among African Americans than whites (Junco, Merson & Salter, 2010). Using data

11

from a representative national sample of the US population, Hampton et al. (2011)

found that the association between mobile phone use and network diversity is

mediated through visits to semi-public spaces, religious institutions and voluntary

associations. Thus, individuals who do not own a mobile phone have a less diverse

network than those who do (Hampton et al., 2011).

Therefore, based on the diversification approach, we expect that:

H3: Arab Israelis (the minority group) will use mobile phones more frequently

for non-local calls than Jewish Israelis.

H4: Arab Israelis (the minority group) will use mobile phones more frequently

than Jewish Israelis to communicate with members of the out-group (Jewish Israelis).

We test the expectations that arise from both the stratification and

diversification theories using data from the inter-ethnic mobile communications of

business market customers. In the last two decades, the minority labor market has

changed in developed countries, with a shift away from employment in firms to self-

employment (Barrett et al., 1996, 2001). In light of these trends studies are focusing

on local opportunity structures for ethnic entrepreneurs (Li 1998, Light & Bonacich,

1988; Portes 1987). Mobile phone companies distinguish between private and

business customers. However, they indicate the customer’s language only in the case

of business customers. The data on language together with the place of residence

provides an ethnic identifier and a unique opportunity to test the expectations that

arise from the stratification and diversification theories.

Other Factors Explaining Mobile Communications

Other variables that may explain differences in mobile communications

include city, industrial and mobile operator characteristics.

12

City characteristics. The population size, density and socio-economic status

of the cities in which people live may affect their mobile communications. Durkheim

(1933) emphasized that the large "volume" of people and their "material density" lead

to "dynamic density." Growing urbanization and the concentration of large numbers

of individuals in one place lead to high rates of social association. Therefore, Blau

(1977) argued that the opportunities for association increase with population size and

density. In Israel, cities with a Jewish majority have larger populations and

businesses, and are more densely populated than those of Arab Israelis (Ali, 2006; see

Table 1). Thus, following this argument, we would expect Jewish Israeli business

groups to associate with local businesses more than with Arab Israeli businesses (see

H3).

A city’s socio-economic status may also be related to patterns of mobile

communication. Previous studies have found that higher socio-economic status

explained access to I.C.T (Kim, Jung & Ball-Rokeach, 2007) and its use (Ono & Tsai,

2008). Arab Israeli communities have a lower level of socio-economic status than

Jewish Israeli towns (Mesch & Talmud 2010; Semyonov, 1988; Smooha & Kraus,

1985). As the effect of city socio-economic status is unclear, we control for this

variable in our analysis.

Industry characteristics. Given that the Arab Israeli minority group is

generally employed in blue-collar industries such as construction and transportation

(Lewin- Epstein & Semyonov, 1992; Mesch & Talmud, 2010; Schnell et al., 1999;

Semyonov, 1988) and that these businesses work mostly outside the cities in which

the Arab Israelis live, we expect that the Arab Israeli minority group would be more

likely than the Jewish Israeli majority group to diversify their ties outside their cities

(see H3).

13

The characteristics of the customers and the mobile operators. Factors

associated with the customers and mobile operators both affect mobile

communication patterns. Corrocher and Zirulia (2009) determined that people choose

a mobile operator based on three factors: the quality of their call connections, the size

of the company and the pricing bundles they offer. Other research has emphasized the

link between type of handset and usage patterns. The new handsets, especially 3G

phones, increase usage (Lee et al., 2002). We expect that cheaper airtime prices and

new handsets will increase mobile usage patterns, and extend the size and

composition of a business’ social network. In addition, a larger number of customers

in a city will increase local ties.

The Israeli Setting

Israel is a multicultural society (Peres, 1971; Yaar & Shavit, 2003) in which

there is an ethno-national division between Jewish Israelis (the majority group) and

Arab Israelis (the minority group). About 21 percent of Israel’s residents are Arab

Israelis (Central Bureau of Statistics, 2010). Both groups differ in terms of their

language, religion and culture (Smooha, 1997). Since the establishment of the state of

Israel, Jewish Israelis and Arab Israelis have generally lived in separate cities (Ali,

2006; Falah, 1999). The ethno-national split is also reflected in socio-economic

differences. Arab Israelis have lower levels of education and income, and generally

hold blue-collar jobs (Haberfeld & Cohen, 2007; Mesch & Talmud, 2010). Most of

the Arab Israeli population resides in small cities located in the periphery of the

country in which they are the majority of the population and in mixed cities in which

residential segregation is high (Ali, 2006; Semyonov & Lewin-Epstein, 1993). Before

the Internet age, several studies demonstrated that Arab Israeli entrepreneurs tend to

search for inter-ethnic economic networks (Semyonov & Lewin-Epstein, 1993;

14

Schnell et al., 1995). Previous studies about Internet use found that Arab Israelis who

reside in their own villages and cities and are spatially isolated from the majority have

a strong motivation for using the Internet to diversify their existing social networks

(Mesch, 2012). In light of this level of residential and social segregation, it is

interesting to study the patterns of mobile phone use and to explore the extent to

which they reflect these spatial and social dimensions or reconfigure them.

The penetration of the Internet and mobile phones has been very rapid in Israel,

with the penetration of the latter coming at a much faster rate than the Internet. The

number of mobile phones increased from 4.2 million at the beginning of 2000 to 9.9

million in 2010, this in a country with a population of less than 8 million. While in

1999, 45.5 percent of the population had a mobile phone, in 2010 that number rose to

91.3 percent. However, the penetration of mobile phones differs according to ethno-

national origin. While 93 percent of Jewish Israeli households report owning a mobile

phone, only 72 percent of Arab Israeli households have one (CBS, 2010).

There are about 490,000 businesses in Israel that employ 2.9 million

individuals. Half of the market is made up of sole proprietorships, a third employ up

to 5 workers, 7 percent employ between 6 and 10 employees, and 8 percent have more

than 10 employees. In fact, small businesses employing up to five employees

represent 85 percent of the business sector in Israel. Arab Israeli entrepreneurs

account for only 11 percent of the businesses, which is an underrepresentation if one

takes into account that this group comprises 21 percent of the population of Israel

(Central Bureau of Statistics, 2010).

Methodology and data

The data for this study are based on two sources. The first data set is the

aggregation of social ties mediated by mobile communications among business

15

customers as measured by one of Israel’s mobile phone operators in April 2010. The

database includes 9,099 Israeli business customers, divided into 3,018 businesses

from the Arab Israeli sector and 6,081 businesses from the Jewish Israeli sector. In

addition, we created a data set about the social and geographical characteristics of 103

Israeli cities from the published statistics of the Central Bureau of Statistics. Both data

sets were merged according to the place of residence of each customer.

Measures

We estimated the social ties of business customers by the frequency of their

mobile connections with other business customers. Social ties were calculated as the

aggregated number of calls out from one business user to another business user during

a given month. After this calculation, we restricted the network size to the 10 phone

numbers that were most frequently called by the mobile phone user.

We also calculated the composition of the subscribers’ mobile social ties and

aggregated them at the customer level. We created the aggregation because the unit of

the analysis was the business, and many businesses have more than one user. As some

customers have more than one user, we averaged all of the calculations of the ties by

the number of users within the business customer.

Non-local ties (%): The rate of non-local ties is the percentage of overall

connections per customer made outside his or her own city.

Out-group ties (%). The rate of out-group ties is the percentage of overall

connections per customer made to users outside his or her own ethnic group.

Ethnic group’s relative size. We calculated this number as Pai, where Pai is the

proportion of Arab Israeli (a) businesses in a given city i.

Ethno-national heterogeneity index. We followed Blau’s approach (Blau, 1977;

Messner & South, 1986) and defined this index as 1 – (Pai2 + Pji

2), where Pai is the

16

total proportion of Arab Israeli businesses in a given city, and Pji is the total

proportion of Jewish Israeli businesses in a given city. When a population is divided

into dichotomous categories, the heterogeneity index can range from .00, when one

group constitutes the entire population, to .50, when each group constitutes exactly

half of the total population in a given city.

Ethno-national dissimilarity index. We computed this index using the following

equation:

K

D = 1/2 ∑| ai/ A – ji/J | i=1

where ai = the number of Arab Israeli businesses in a given city and ji = the number of

Jewish Israeli businesses in a given city; A = total Arab Israeli businesses and J =

total Jewish Israeli businesses in the study. K denotes the total number of cities in the

study (Cortese et al., 1976; Duncan & Duncan, 1955; Van Valey et al., 1977). The

index can range from .00, indicating totally integrated cities, to 1.00, indicating totally

segregated cities.

Despite its widespread use, the index of dissimilarity as a measure of

residential segregation has been the subject of considerable debate. It does not provide

information about the residential clusters (neighborhoods) of different groups in the

city, nor does it include blocs of cities (Cortese, Falk & Cohen, 1976; Falk, Cortese &

Cohen, 1978; Lieberson, 1981; Lieberson & Carter, 1982; Massey, 1978; Massey &

Denton, 1988). However, given that we are interested in summary measures of

residential segregation rather than neighborhoods and regions, the index appears to be

appropriate for our purposes (Van Valey et al., 1977). Furthermore, following South

and Messner (1986), while we do not claim that it is the only appropriate measure of

segregation, there is no agreement on an alternative to the index of dissimilarity.

17

Business size. The total number of businesses in a given city.1

Business density. The number of businesses per square kilometer in the city

(CBS, 2010).

Number of customers. The total number of mobile phone company customers

in a given city.

City’s socio-economic standing. We used the standard socio-economic status

of each city calculated by the Israeli Central Bureau of Statistics. The index is

calculated based on the city’s average income, percentage of large families and

population density (CBS, 2010).

Customer size. The number of subscribers per business customer.

Industry. When businesses sign up with a mobile operator service, they

indicate the industry in which the company operates. We introduced a control for the

type of industry using a dummy variable indicating the extent to which the customer

operates in blue-collar industries - the car industry, transportation and construction.

These industries were coded 1, and all other industries were coded 0.

Airtime price (effective price). The total revenue generated from airtime use

divided by total minutes of use in a given month.

Percentage of new handsets. The percentage of handsets that a given business

customer has that are less than 18 months old.

Length of use. We calculated this number by subtracting the year of the data

collection from the year when the business customer signed up with the cell phone

company. The price of airtime, the type of the handset and the length of time of being

a customer can influence usage patterns. Less expensive airtime, newer handsets and

longtime patronage will probably increase mobile usage patterns and extend the size

1 Data from Dun and Bradstreet and the Yellow Pages.

18

and the composition of the social network of a given business customer. Therefore,

we also controlled for these factors.

Customer’s ethnicity. A dummy variable that was coded 1 for Arab Israeli

business customers and 0 for Jewish Israeli business customers. The source of this

indicator is based on the records of the mobile phone operator. The mobile operator's

records the "mother tongue" spoken in order to improve the quality of service by

adjusting the customer’s service language to the customer's native language.

Results

Table 1 presents the descriptive statistics of the Jewish and Arab Israeli

populations, and the population as a whole. From it we learn that the Jewish

population is located in larger cities than the Arab population and has more businesses

than the cities of the Arab Israeli sector. In addition, Jewish Israeli businesses are

more likely than Arab Israeli businesses to be located in cities with higher business

densities. Jewish cities also have higher socio-economic status than Arab cities. On

average 87 percent of Arab Israeli businesses are located in Arab cities, and 94

percent of Jewish Israeli businesses are located in Jewish cities. Actually, 13 percent

of Arab Israeli businesses and only 6 percent of Jewish Israeli businesses are located

outside their cities. In addition, Jewish Israeli businesses are more likely than Arab

Israeli businesses to be located in heterogeneous cities. However, the Arab Israeli

sector is more likely than the Jewish Israeli sector to be spatially segregated. The

overall dissimilarity index that measures spatial segregation is 0.85. This index

indicates that there is a high level of spatial segregation between Arab Israeli

businesses and Jewish Israeli businesses.

[INSERT TABLE 1 ABOUT HERE]

19

As for the characteristics of the business customers, on average, Jewish Israeli

businesses have slightly more handsets than Arab Israeli businesses; 4.0 in the Jewish

sector compared to 3.8 in the Arab Israeli sector. Blue-collar industries (the car

industry, transportation and construction) represent a small portion of the entire

business organizations in both sectors: 8.6 percent of the Arab Israeli businesses

compared to 16.5 percent of the Jewish Israeli businesses. About half of the

businesses had newer handsets, but the length of use within the Jewish Israeli sector is

higher than that within the Arab Israeli sector. Finally, the airtime price per minute in

the Jewish sector is 0.06 NIS (about 2 cents) more than that in the Arab sector.

In terms of the dependent variables of the study, we found no differences

between Arab Israeli customers and Jewish Israeli customers with regard to their non-

local ties (66 percent within both groups). However, Arab Israeli customers had a

higher percentage of out-group ties than Jewish Israeli customers (20 percent and 12

percent, respectively).

[INSERT TABLE 2 ABOUT HERE]

Thus, it appears that Arab Israeli customers are more likely than Jewish Israeli

customers to use mobile communications to maintain relationships with out-group

ties. This finding appears to be consistent with the diversification hypothesis.

However, we found no differences between Arab Israeli customers and Jewish Israeli

customers with regard to their use of mobile phones to create and maintain

relationships with non-local ties. At this point, the picture is not clear, because other

indicators such as the extent of heterogeneity and dissimilarity may influence the

spatial and social compositions.

Table 3 presents the bivariate Pearson correlation coefficients between the

customer’s ethnicity, the indexes of heterogeneity and dissimilarity, and spatial and

20

social composition (non-local and out-group ties)2. We found a negative correlation

between heterogeneity and dissimilarity (spatial segregation). In addition, we found a

positive correlation between ethnic-national heterogeneity and percentage of out-

group ties. Dissimilarity also has an opposite effect on the percentage of out-group

ties. Furthermore, from the findings, we learn that there is a positive connection

between non-local ties and out-group ties.

[INSERT TABLE 3 ABOUT HERE]

In the light of these findings, we computed regression equations in order to

investigate the net effect of the differences between ethnic groups and structural

factors on the differences in the percentage of non-local ties, while controlling for city

and customer characteristics. Table 4 presents the results of a multivariate analysis for

the percentage of non-local ties, when controlling additively for customer’s ethnicity,

city and customer characteristics, and structural factors (heterogeneity and

dissimilarity). Adding customer’s ethnicity, city and customer characteristics, and

Blau’s structural factors one at a time resulted in three models.

[INSERT TABLE 4 ABOUT HERE]

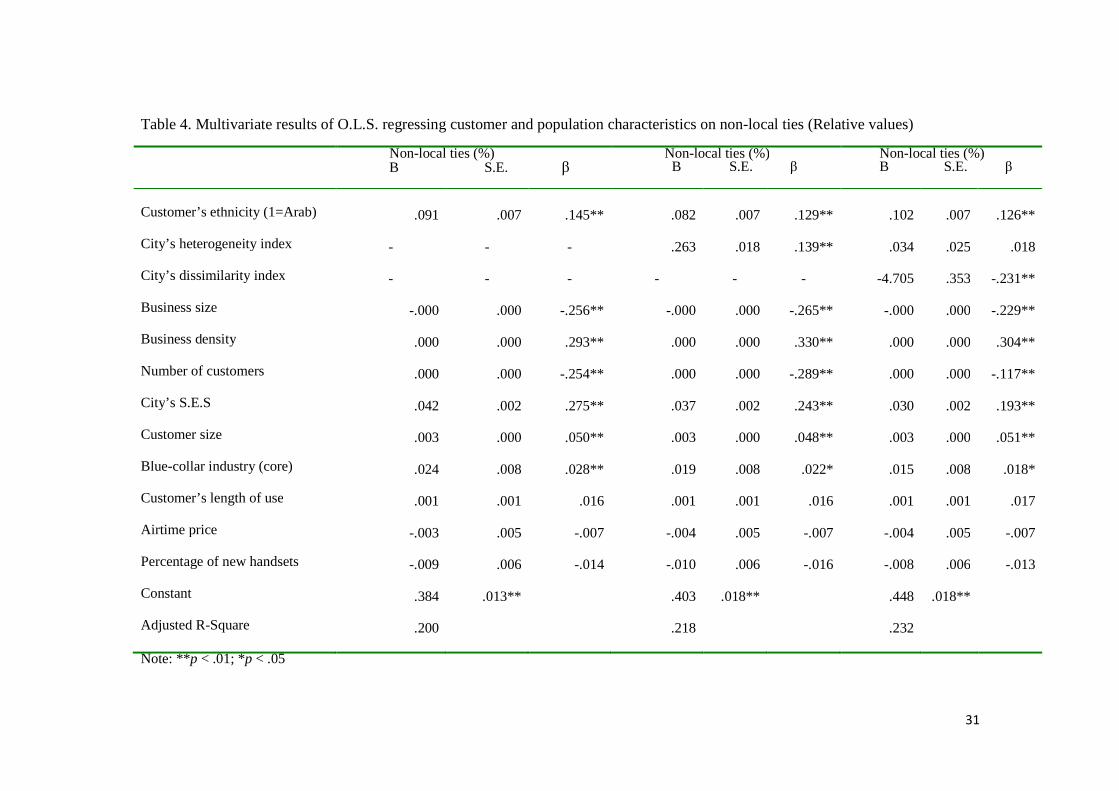
Model 1 presents the results of an OLS regression predicting non-local ties (in

relative values) as a function of the customer’s ethnicity (1= Arab Israelis, 0= Jewish

Israelis), city characteristics, business size and density in a given city, the city’s socio-

economic status, and customer characteristics - customer size, blue-collar industry,

customer’s length of use, airtime cost and percentage of new handsets. The results

indicate that Arab Israeli business customers have a larger percentage of non-local ties

than Jewish Israeli business customers. In addition, the larger the business and the

2 Given the overlap between customer ethnicity (1= Arab) and the relative size of Arab businesses in the city (r=.90), we excluded the latter from the model.

21

more customers in the city, the smaller the percentage of non-local ties. However, the

higher the business density in the city, the higher the percentage of non-local ties.

Actually, the larger the number of businesses in the city, the higher the rate of local

ties.

Furthermore, the city’s socio-economic status is important as well. The higher

the city’s socio-economic status, the higher the percentage of non-local ties. These

findings support those in previous studies, which found that higher socio-economic

status explained access to and uses of I.C.T (Kim, Jung & Ball-Rokeach, 2007; Ono

& Tsai, 2008). In addition, blue-collar industries have a larger percentage of non-local

ties than other industries. Finally, the larger the customer size, the higher the

percentage of non-local ties. These city and customer characteristics and the

customer’s ethnicity explain 20.0 percent of the variance in the percentage of non-

local ties.

Model 2 investigates non-local ties (in relative values) as a function of the

customer’s ethnicity, city and customer characteristics, and the city’s heterogeneity

index. From this model we learn that Arab Israeli customers have a larger percentage

of non-local ties than Jewish customers. In addition, as Blau's approach predicted,

ethnic-national heterogeneity is associated with the percentage of non-local ties.

Including the city’s heterogeneity in the model improves the explanation of the

variance in the percentage of non-local ties by 1.8 percent.

Finally, in the next step (model 3), we also included the city’s dissimilarity in

the model. H1 expected that the greater the spatial segregation, the smaller the

proportion of non-local ties. Our findings support this hypothesis. However, we found

no statistically significant differences between a city’s heterogeneity and the

percentage of non-local ties. Spatial segregation is more likely than a city’s

22

heterogeneity to affect the percentage of cell-phone supported non-local ties. H3

expected that Arab Israeli customers would have a larger percentage of non-local ties

than Jewish Israelis. The findings in model 3 support the hypothesis. Arab Israeli

customers have a larger percentage of non-local ties than Jewish Israeli customers.

These findings are consistent with the diversification approach. Whereas the Arab

Israeli minority group diversifies its non-local ties, the Jewish Israeli majority group

expands its local ties.

Table 5 presents the results of a multivariate analysis for out-group ties, in

relative values, when controlling additively for the customer’s ethnicity, city and

customer characteristics, and the structural factors of heterogeneity and dissimilarity.

Once again, adding these categories successively to the analysis resulted in three

models.

Model 1 presents the results of an OLS regression predicting out-group ties (in

relative values) as a function of the customer’s ethnicity (1= Arab Israelis, 0= Jewish

Israelis) and city and customer characteristics. The results also indicate that Arab

Israeli customers have a larger percentage of out-group ties than Jewish Israeli

customers. In addition, the larger the business size, the higher the percentage of out-

group ties. However, the higher the business density in the city and the higher the

number of customers in the city, the lower the percentage of out-group ties. The

larger the number of businesses in one place, the higher the rate of in-group ties.

Furthermore, the larger the customer size and the longer the length of use, the higher

the percentage of out-group ties. These city and customer characteristics, and the

customer’s ethnicity explain 4.4 percent of the variance in the percentage of out-group

ties.

23

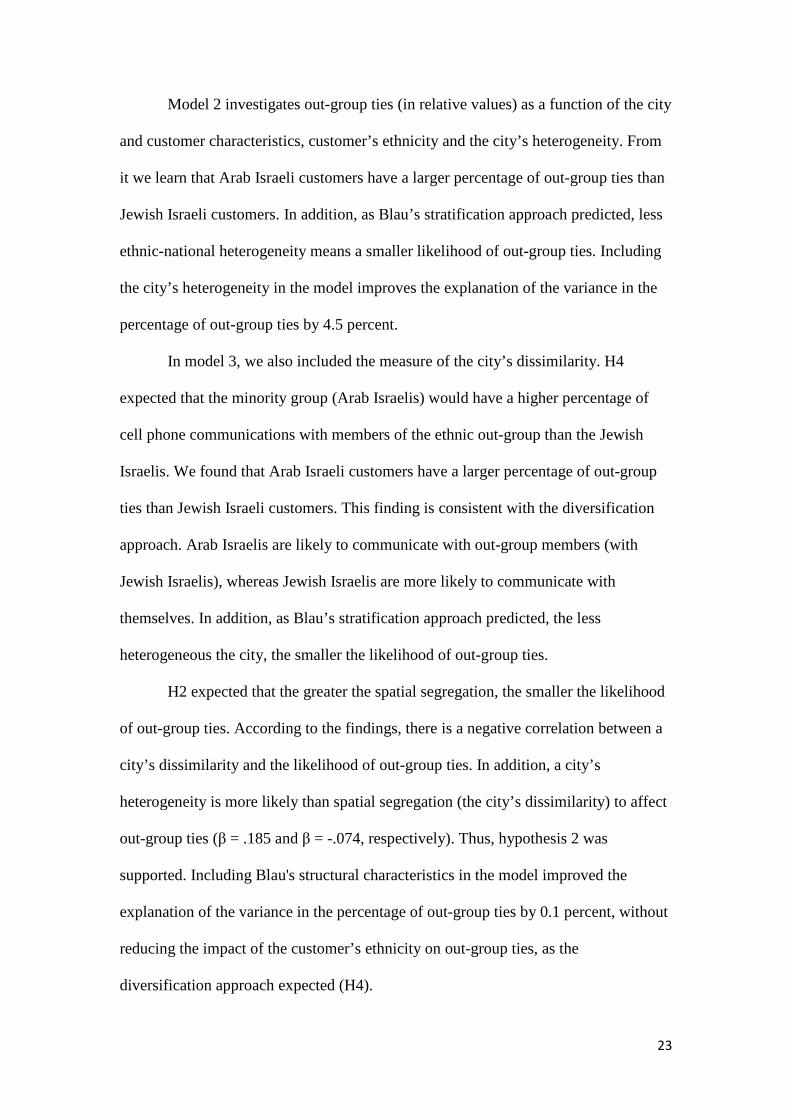
Model 2 investigates out-group ties (in relative values) as a function of the city

and customer characteristics, customer’s ethnicity and the city’s heterogeneity. From

it we learn that Arab Israeli customers have a larger percentage of out-group ties than

Jewish Israeli customers. In addition, as Blau’s stratification approach predicted, less

ethnic-national heterogeneity means a smaller likelihood of out-group ties. Including

the city’s heterogeneity in the model improves the explanation of the variance in the

percentage of out-group ties by 4.5 percent.

In model 3, we also included the measure of the city’s dissimilarity. H4

expected that the minority group (Arab Israelis) would have a higher percentage of

cell phone communications with members of the ethnic out-group than the Jewish

Israelis. We found that Arab Israeli customers have a larger percentage of out-group

ties than Jewish Israeli customers. This finding is consistent with the diversification

approach. Arab Israelis are likely to communicate with out-group members (with

Jewish Israelis), whereas Jewish Israelis are more likely to communicate with

themselves. In addition, as Blau’s stratification approach predicted, the less

heterogeneous the city, the smaller the likelihood of out-group ties.

H2 expected that the greater the spatial segregation, the smaller the likelihood

of out-group ties. According to the findings, there is a negative correlation between a

city’s dissimilarity and the likelihood of out-group ties. In addition, a city’s

heterogeneity is more likely than spatial segregation (the city’s dissimilarity) to affect

out-group ties (β = .185 and β = -.074, respectively). Thus, hypothesis 2 was

supported. Including Blau's structural characteristics in the model improved the

explanation of the variance in the percentage of out-group ties by 0.1 percent, without

reducing the impact of the customer’s ethnicity on out-group ties, as the

diversification approach expected (H4).

24

[INSERT TABLE 5 ABOUT HERE]

Discussion

This research focused on the similarities and differences between ethno-

national groups in the structure of their social networks based on communications

conducted in the Israeli business arena via mobile phones. Taking advantage of the

specific characteristics of the Israeli society, we investigated the composition of both

local and non-local mobile phone ties as well as ethnic in-group and out-group mobile

phone ties. The study tested two theoretical explanations for these patterns: the social

stratification hypothesis and the social diversification hypothesis. The social

stratification approach expects that mobile communication will reflect the patterns of

spatial and social stratification that exist in society, so communication will be

conducted within the limits of local and in-group ties. On the other hand, the social

diversification hypothesis expects that residentially and socially segregated minority

groups will take advantage of mobile communication to diversify their social contacts

and will be more likely than the majority group to engage in mobile communications

with non-local and out-group ties.

Our findings indicate the need for a more nuanced approach that perceives non

local and inter-ethnic mobile communication as dependent on both structural

opportunities and constrains and mobile phone affordances and group motivations.

Space still matters and the structural conditions that are conducive to social

segregation have some effect on mobile communication patterns. As the stratification

approach predicted, the less ethnically heterogeneous the population, the smaller the

likelihood of intergroup ties. In addition, the greater the degree of spatial segregation,

the smaller the likelihood of intergroup ties.

25

In addition, the findings indicate that despite the contextual constraints, even

when controlling for structural conditions, mobile communication facilitates both

non-local and inter-group communication. As the diversification approach predicted,

the Arab Israeli minority was more likely than the Jewish Israeli majority to engage in

mobile communication with non-local ties. Furthermore, regardless of their place of

residence, Arab Israelis were likely to communicate with out-group members (with

Jewish Israelis), whereas Jewish Israelis were more likely to communicate with

members of their own group.

By analyzing social ties via the mobile communication patterns of distinct

ethnic groups, we learn that these social ties reflect existing patterns of social and

spatial segregation. We also learn that mobile communication provides an avenue for

inter-group communication. Moreover, the disadvantaged minority is more likely than

the majority group to engage in inter-ethnic communication. Thus, it seems that social

inequality and residential segregation are an incentive for the disadvantaged minority

to expand and diversify its social ties. In addition to overcoming distance, Arab

Israelis are more likely to communicate with Jewish Israelis, using mobile technology

to diversify the ethnic composition of their contacts.

Ethnic residential segregation is viewed as a major structural feature of most

Western societies. Many studies have been conducted on the extent and consequences

of spatial segregation in the US (Massey & Eggers, 1990; Sampson, 2012). The

massive influx of immigrants into European countries that has changed the ethnic

composition of many countries has prompted similar studies there (Semyonov &

Glikman, 2009). Spatial segregation in multicultural societies has consequences for

differential access to social services, medical facilities and social networks. As in

Israel, in ethnically heterogeneous countries, spatial segregation has significant

26

consequences for the development of inter-ethnic interactions, ties and contacts. In

this study we found that as the stratification approach suggests, spatial segregation

reduces opportunities for interaction between members of minority populations and

members of the majority group population.

Our study contributes to the study of inter-ethnic relationships in that it shows

that this pattern is not replicated entirely in mobile communication ties. In particular,

our study demonstrates that in multicultural societies, mobile communication supports

inter-ethnic communication, but in a very specific way, one that is consistent with the

diversification hypothesis rather than the stratification hypothesis. While previous

studies indicated that mobile phone owners in the population tend to have more

diverse networks (Hampton et al., 2011), our study shows that ethnic minorities are

more likely than the ethnic majority to diversify the composition of their social

networks. Such diversification of ties has important implications for the living

conditions of ethnic minorities. Inter-ethnic contacts are likely to reduce prejudicial

views of minorities, facilitate access to sources of social capital and support their

social integration in society.

Our study also contributes to the emerging research field of mobile

communication studies. Research into mobile communication has reported that,

despite its affordability, mobile communication is likely to be used locally (Campbell

& Kwak, 2010; Fortunati, 2005). Our study indicates the need to introduce the

variables of ethnicity and race into mobile communication studies and to investigate

the differential use of the technology by various social groups.

:One other question that remains unresolved is does mobile communication

provide a new avenue for inter-group communication, or did the types of interactions

existed previously and are just reflected in the mobile communication data? Given the

27

data we have, we cannot answer this question. Future research needs to collect the

appropriate data to deal with this question of causality.

In sum, in the information society structural conditions (the stratification

approach) as well as social incentives (the diversification approach) are at the heart of

inter-group social relationships. Future studies should combine both the stratification

and diversification approaches in order to improve our understanding of inter-group

social relationships. In this context, this study should be extended to investigate the

effect of ethnically mixed and homogenous cities on the patterns of inter-group

mobile communication. Such studies would improve our understanding of the extent

to which mobile communication provides a venue for the acquisition of social capital

for ethnically disadvantaged groups.

28

Table 1 Descriptive variables: Structural variables and Customer’s Characteristics (Jewish sector, Arab Israeli sector, total population) Total Population

N=9,099 Mean S.D.

Arab Sector N=3,018

Mean S.D.

Jewish Sector N=6,081

Mean S.D.

F

Two-tailed t-test

(sig (.

City’s Characteristics

Population size 126,583

161,092

48,337

61,231

162,833

190,441

1,332

.000

Business size 6,544

10,564

2,129

4,455

8,516

11,716

1,069

.000

Business density 185.7

212.8

90.8

86.6

278.0

235.6

1,510 .000

Number of customers 241

204

184.9

151.9

272.5

221.4

895

.000

City’s S.E.S 4.81

1.8

3.14

1.31

5.5

1.57

622

.000

Structural Characteristics Arab Israeli businesses in the city (%)

32%

42%

87%

27%

6%

12%

2,216 .000

City’s heterogeneity index

.083 .152 .079 .17 .085 .141 198 .112

City’s dissimilarity index

.016

.014

.019 .015 .015 .013 131 .000

Customer’s Characteristics

Customer size 3.89

5.5

3.8

4.8

4.0

6.0

53

.030

Blue-collar industry (core) =1 13%

34%

8.6%

28%

16.5%

37.1%

481

.000

Percentage of new handsets 45%

45% 44% 45% 44% 44% 11

.779

Customer’s length of use 5.23 3.90 4.6 3.8 5.6 3.9 9.8

.000

Airtime price .79

.61

.72

.55

.78

.60

19.7

.000

29

Table 2. Percentage of non-local and out-group ties

Total Population

Arab Sector

Jewish Sector

F Two-Tailed t-test

Average total percentage of non-local ties 66%

66%

66%

398

.154

Average percentage of out-group ties 15%

20%

12%

92

.000

N 9,009 3,018 6,081

30

Table 3. Correlation between customer’s ethnicity, Blau's structural characteristics, and spatial and social ties

Customer ethnicity (1=Arab Israelis)

City’s dissimilarity

index

City’s heterogeneity

index

Non-local ties (%)

Out-group ties (%)

Customer’s ethnicity (1=Arab) 1

City’s dissimilarity index .122**

1

City’s heterogeneity index -.017**

-.346**

1

Non-local ties (%) .015

-.380**

.053**

1

Out-group ties (%) .150**

-.161**

.212**

.277**

1

Note: **p < .01; *p < .05

31

Table 4. Multivariate results of O.L.S. regressing customer and population characteristics on non-local ties (Relative values)

Non-local ties (%) B S.E. β

Non-local ties (%) B S.E. β

Non-local ties (%) B S.E. β

Customer’s ethnicity (1=Arab) .091 .007 .145** .082 .007 .129** .102 .007 .126**

City’s heterogeneity index - - - .263 .018 .139** .034 .025 .018

City’s dissimilarity index - - - - - - -4.705 .353 -.231**

Business size -.000 .000 -.256** -.000 .000 -.265** -.000 .000 -.229**

Business density .000 .000 .293** .000 .000 .330** .000 .000 .304**

Number of customers .000 .000 -.254** .000 .000 -.289** .000 .000 -.117**

City’s S.E.S .042 .002 .275** .037 .002 .243** .030 .002 .193**

Customer size .003 .000 .050** .003 .000 .048** .003 .000 .051**

Blue-collar industry (core)

.024 .008 .028** .019 .008 .022* .015 .008 .018*

Customer’s length of use .001 .001 .016 .001 .001 .016 .001 .001 .017

Airtime price -.003 .005 -.007 -.004 .005 -.007 -.004 .005 -.007

Percentage of new handsets -.009 .006 -.014 -.010 .006 -.016 -.008 .006 -.013

Constant .384 .013** .403 .018** .448 .018**

Adjusted R-Square .200 .218 .232

Note: **p < .01; *p < .05

32

Table 5. Multivariate results of O.L.S. regressing customer and population characteristics on out-group ties (Relative values)

Out-group ties (%) B S.E. β

Out-group ties (%) B S.E. β

Out-group ties (%) B S.E. β

Customer’s ethnicity (1=Arab) .112 .006 .217** .100 .0076 .192** .105 .006 .203**

City’s heterogeneity index - - - .347 .016 .224** .286 .022 .185**

City’s dissimilarity index - - - - - - -1.243 .316 -.074**

Business size .000 .000 .041* .000 .000 .026 .000 .000 .038*

Business density -.000 .000 -.072** -.000 .000 -.013 -.000 .002 -.021

Number of customers -.000 .000 -.060** .000 .000 -.116** -.000 .000 -.061**

City’s S.E.S .018 .002 .140** .011 .002 .090** .009 .002 .074**

Customer size .003 .000 .081** .003 .000 .078** .003 .000 .079**

Blue-collar industry (core)

.009 .007 .013 .002 .007 .003 .001 .007 .002

Customer’s length of use .002 .001 .024** .001 .001 .024* .002 .001 .024*

Airtime price .003 .004 .007 .003 .004 .007 .003 .004 .007

Percentage of new handsets .001 .005 .008 -.000 .005 -.001 .000 .005 .000

Constant -.088 .016** -.062 .016 .050 .016**

Adjusted R-Square .044 .089 .090

Note: **p < .01; *p < .05

33

References

Ali, N. (2006). The unpredicted status of Palestinian woman in Israel: Actual versus

desirable. Religion, Gender and Politics: An International Dialogue. The van-Leer

Institute, Jerusalem, Israel.

Anderson, B. & Kennedy, T. (2002). Digital living: impact (or otherwise) of the internet

on everyday British life. Wellman, B. and Haythornthwaite, C. (Eds.), The Internet

In Everyday Life Oxford: Blackwell Publishing Ltd.139-163.

Barrette, G.A., Jones, T.P. & McEvoy, D. (1996). Ethnic minority business: theoretical

discourse in Britain and North America, Urban Studies, 33 (4-5): 783-809.

Barrette, G.A., Jones, T.P. & McEvoy, D. (2001). Socio-economic and policy dimensions

of the mixed embeddedness of ethnic minority business in Britain. Journal of Ethnic

and Migration Studies 27:2, 241-258

Blau, P. M. (1977). Inequality and Heterogeneity. A Primitive Theory of Social Structure.

The Free Press. New York

Blau, J. R. & Blau, P. M. (1982). "The cost of inequality: Metropolitan structure and

Violent crime". American Sociological Review, 47, (February) 114-29.

Blumenstock, J. & Fratamico, L. 2013. Social and spatial ethnic segregation. Paper

presented at the DEV-4 ACM Conference, Cape Town, South Africa.

Boase, J. & Ling R. (2011) Measuring mobile phone use: Self-report versus log data.

International Communication Association, Boston, MA.

Britton, M.L. (2011). Close Together but Worlds Apart? Residential Integration and

Interethnic Friendship in Houston. City & Community, 10(2), 182-204.

34

Calabrese, F., Smoreda, Z. Blondel, V & Ratti, C. (2011). Interplay between

telecommunications and face-to-face interactions: A study of mobile phone data.

PLoS ONE, 6, e20814.

Campbell, S. & Kwak, N. (2010). Mobile communication and social capital: An analysis

of geographically differentiated usage patterns. New Media & Society, 12 (3), 435–

451.

Campbell, S. & Park, Y. S. (2008). Social implication of mobile Telephony: The rise of

personal communication society. Sociology Compass, 2/2, 371–387.

Castells, M . Fernandez-Ardevol, M. Linchuan, J. & Sey, A. (2007). Mobile

Communication and Society, A Global Perspective. The MIT Press Cambridge,

Massachusetts, London, England.

Corrocher, N. & Zirulia, L. (2009). Me and you and everyone we know: An empirical

analysis of local network effects in mobile communication. Telecommunication

Policy, 33, 68-79.

Cortese, C. F. Falk, F. & Cohen, K. J. (1976): Further considerations on the

methodological analysis of segregation indices. American Sociological Review, 41,

630-637.

Duncan, O. D. & Duncan, B. (1955). A methodological analysis of segregation indices.

American Sociological Review, 20, 210-217.

Durkheim, E. (1933). The Division Of Labor In Society. Translated by George Simpson.

New York. Free Press.

35

Dutton, W. H. (2005). The Internet and social transformation: reconfiguring access, in

Dutton, W. H., Kahin, B., O’Callaghan R. & Wycoff, A. (Eds). Transforming

Enterprise. MIT Press, Cambridge, MA. 375–397.

Falah, G. (1996). Living Together Apart: Residential Segregation in mixed Arab-Jewish

Cities in Israel. Urban Studies, 33 (6), 823-857.

Falk, R. F. Charles, F. C. and Cohen, J. (1978). Utilizing standardized indices of

residential segregation. Comment on winship. Social Forces, 57 (December), 713-

716.

Fortunati, L. (2005). The mobile phone between local and global: Nyiri, K. (Ed.) A Sense

of Place. The Global and The Local Mobile Communication. Vienna. Passagen

Verlag. 61-70

Green, N. (2002) On the move: Technology, mobility, and mediation of social time and

place. The Information Society, 18, 281-292.

Haberfeld, I. & Cohen, Y. (2007). Development of gender, Ethnic, and national earnings

gaps in Israel: The role of rising inequality. Social Science Research, 36, 654-672.

Hampton, K., Sessions, L. F., Her, E.J., & Rainie, L. (2009). Social isolation and new

technology: How the Internet and mobile phones impact Americans’ social network.

Pew Internet & American Life Project. Retrieved November 1, 2011 from

pewinternet.org/Reports/2009/18--Social-Isolation-and-New-Technology.aspx.

Hampton, K.N., Lee, C. & Her, E.J. (2011). How media affords network diversity: Direct

and mediated access to social capital through participation in local social settings.

New Media and Society, 13, 1031-1049.

36

Huysman, M. & Wulf, W. (2004). Social Capital and Information Technology.

Cambridge, MA: MIT Press.

James, E. H. (2000) Race-Related Differences in Promotions and Support: Underlying

Effects of Human and Social Capital. Organization Science, 11 (5, September–

October), 493–508.

Junco, R., Merson, D. & Salter, D. (2010). The effect of gender, ethnicity and income on

college students’ use of communication technologies. Cyberpsychology, Behavior

and Social Networking. 13(6): 619-627.

Katz, J. E. & Aakhus, M. A. (2002). Perpetual Contact: Mobile Communication. Private

Talk. Public Performance. Cambridge. Cambridge University Press.

Kim, Y. C. Jung, J. Y. & Ball-Rokeach, S. J. (2007). Ethnicity, place and communication

technology. Information, Technology & People, 20, 282-393.

Lee Y., Lee I., Kim J., & Kim H. (2002). A cross-cultural study on the value structure of

mobile internet usage: Comparison between Korea and Japan. Journal of Electronic

Commerce Research, 3 (4), 2002.

Leiberson, S. (1981). An asymmetrical approach to segregation. Peach, C. Robinson, V.

and Smith, S. (Eds.) Ethnic segregation in cities. London. Croom Helm. 61-82.

Leiberson, S. & Carter, D. K. (1982). Temporal changes and urban differences in

residential segregation: A reconsideration. American Journal of Sociology, 88, 296-

310.

Lewin- Epstein, N. & Semyonov, M. (1992). Local labor markets, ethnic segregation

and inequality. Social Forces, 70 (4), 1104-111.

37

Li, W. (1998). Anatomy of a new ethnic settlement: the Chinese ethnoburb in Los

Angeles, Urban Studies, 35 (3): 479-501.

Ligth, I. & Bonacich, E. (1988). Immigrant entrepreneurs. Koreans in Los Angeles 1965-

1982. Berkeley: University of California Press.

Lin, N. (2001). A Theory of Social Structure and Action. Cambridge, UK. Cambridge

University Press.

Ling, R. (2008). "New Tech, New Ties: How Mobile Communication Is Reshaping Social

Cohesion". The MIT Press, Cambridge, Masachusetts, London, England.

Ling, R. & Yttri, B. (2002). Hyper-coordination via Mobile Phones in Norway. In Katz,

J. E. & Aakhus, M. A. (Eds.) Perpetual Contact: Mobile Communication. Private

Talk. Public Performance. Cambridge: Cambridge University Press. 139-169.

Marsden, P. V. (1987). Core discussion networks of Americans. American Sociological

Review, 52, 122- 313.

Massey, D. S. (1978). On the measurement of segregation as a random variable.

American Sociological Review, 43, 587-590.

Massey, D. S. (2007). Categorically Unequal. The American Stratification System. New

York, NY: Russell Sage.

Massey, D. S. & Denton, N. A. (1988). The dimensions of residential segregation. Social

Forces, 67 (2), 281- 315.

Massey, D. S. & Eggers, M. L. (1990). The Ecology of Inequality: Minorities and the

Concentration of Poverty, 1970-1980. The American Journal of Sociology, 95

(5), 1153-1188.

38

Matei, S., & Ball-Rokeach, S. J. (2003). The Internet in the Communication

Infrastructure of Urban Residential Communities: Macro or Mesolinkage? Journal of

Communication, 53(4), 642-657. doi: 10.1093/joc/53.4.642

Mayhew, B. H. & Levinger, R, L. (1976). Size and Density of interaction in Human

Aggregates. American Journal of Sociology, 82 (July), 86-110.

McPherson, M, Smith-Lovin, L & Cook, J, M (2001). Birds of a feather: Homophily in

social networks. Annual Review of Sociology, 27, 415-444.

Mesch, G. (2007). Social diversification: A perspective for the study of social networks

of adolescents offline and online. In Kutscher, & Otto, H. U. (Eds.), Grenzenlose

Cyberwell? Heidelberg Germany. Verlag fur Sozial wiseenschften. 105-121

Mesch, G. S. (2012). Minority status and the use of computer-mediated communication:

A test of the social Diversification hypothesis. Communication Research, 39, 317-

337.

Mesch, G. S. & Talmud, I. (2006). The quality of online and offline relationships, the role

of multiplexity and duration. Information Society, 22 (3), 137-148

Mesch, G. S. & Talmud, I. (2010). The Wired Youth. The Social World of Youth In The

Information Age. Oxford, UK: Routledge.

Mok, D., Wellman, B. & Carrasco, J. (2010). Does distance matter in the age of the

Internet? Urban Studies, 47: 2747-2783.

Musterd, S. & Winter, M. D. (1998) Conditions for spatial segregation: some European

perspectives, International Journal of Urban and Regional Research, 22, 665–673.

39

Nee, V. Sanders M, J. & Sernau, S. (1994): Job Transitions in an immigrant metropolis:

Ethnic boundaries and the mixed economy. American Sociological Review, 59

(December), 849-872.

Norris, P. (2001). The digital divide. Civic engagement, information poverty and the

internet worldwide. In Howard, P. & Jones, S. (Eds.) Social Online. Thousand Oaks,

CA: SAGE. 31-43.

Ono, H. & Tsai, H. J. (2008) Race, parental socio-economic status and computer time

outside of school among young American children, 1997-2003. Journal of Family

Issues, 29, 1650-1672.

Peres, Y. (1971): Ethnic relations in Israel. American Journal of Sociology, 76 (6, May),

1021-1047.

Portes, A. (1987). The social origins of Cuban enclave economy of Miami, Sociological

Perspectives, 30 (4) 240-272

Portes, A. & Bach, R. L. (1985). Latin Journey: Cuban and Mexican Immigrants In The

United States. Berkeley, CA: University of California Press.

Putnam, R. D. (2000). Bowling alone: The collapse and revival of American community.

New York: Simon & Schuster.

Quan-Haase, A. (2007) University Students' Local And Distant Social Ties: Using and

integrating modes of communication on campus, Information, Communication &

Society, 10:5, 671-693,

Rainie, L. & Wellman, B. (2012): Networked. The MIT Press. Cambridge,

Massachusetts, London, England.

Sampson, J. R. (2012). Great American City: Chicago and the Enduring

40

Neighborhood Effect. University of Chicago Press

Schnell, I. Benenson, I. & Sofer, M. (1999). The spatial pattern of Arab Industrial

Markets in Israel. Annals of Association of American Geographers, 89 (2), P, 312-

337.

Schnell, I. Sofer, M. & Drori, I. (1995). Arab industrialization in Israel. Westport, CT:

Praeger.

Semyonov, M. (1988). Bi-Ethnic Labor Markets, Mono-Ethnic Labor Markets, and

Socioeconomic Inequality. American Sociological Review, 53 (2, Apr.), 256-266.

Semyonov, M. & Lewin-Epstein, N. (1993). The Arab Minority In Israel's Economy.

Patterns of ethnic inequality. Boulder, CO: Westview Press.

Semyonov, M. & Glickman, A. (2009). Ethnic Residential Segregation, Social Contacts,

and anti-Minority Attitudes in European Societies. European Sociological Review,

25(6), 693-708.

Smith, A. (1985). The Wealth of Nations. London, England. Penguin Books.

Smooha, S. (1997). Ethnic democracy: Israel as Archetype. Israel Studies, 2, 198-241

Smooha, S. & Kraus, V. (1985). Ethnicity as a factor in status attainment in Israel.

Research in Social Stratification and Mobility, 4, 151-175.

South, S. J. & Messner S. F. (1986). Structural determinants of ingroup association:

interracial marriage and crime. American Journal of Sociology, 91 (6 May), 1409-

1430.

Van Dijk, J. & Hacker, K. (2003). The digital divide as a complex and dynamic

phenomenon. Information Society, 19(4), 315–326.

41

Van Valey, T. L., Roof, W. C. & Wilcox, J. E. (1977). Trends in residential segregation:

1960-1970. American Journal of Sociology, 82 (January), 826-844.

Warren, M. (2007). The digital vicious cycle: Links between social disadvantage and

digital exclusion in rural areas. Telecommunications Policy, 31, 374–388.

Wellman, B. (2001). "Physical Place and Cyber-Place: Changing Portals and the Rise of

Networked Individualism." International Journal for Urban and Regional Research,

25, 227-52.

Wellman, B. (2002). "Little Boxes, Glocalization, and Networked Individualism."

Tanabe, M. Van den Besselaar, P. & Ishida, T. (Eds.): Digital Cities, LNCS 2362, pp.

10-25. Springer-Verlag Berlin Heidelberg

Yaar, A. & Shavit, Z. (2003): Processes and trends in the collective identity. Trends in

The Israeli Society, 2, (in Hebrew). Open University.


Recommended