Page 1
Primary funding is provided by
The SPE Foundation through member donations
and a contribution from Offshore Europe
The Society is grateful to those companies that allow their
professionals to serve as lecturers
Additional support provided by AIME
Society of Petroleum Engineers
Distinguished Lecturer Program www.spe.org/dl 1
Page 2
Society of Petroleum Engineers
Distinguished Lecturer Program www.spe.org/dl
2
Optimized Shale Resource Development using proper
placement of Wells and Hydraulic Fracture Stages
Usman Ahmed
Baker Hughes Incorporated [email protected]
1
Page 3
Outline
• Illustration of the Prize
• Present trend in Unconventional Reservoir Modeling and it’s
impact on production
• Challenges the industry face to enhance recovery factor while
reducing cost per unit of hydrocarbon recovered
• Where should the future engineers focus?
– What technologies are there and what are needed in the near
future to optimally place wells for the enhanced recovery
– What technologies are there and what the industry needs in the
near future to decide the optimum placement of the hydraulic
fracture stages
• Illustrative field examples and the recommended way forward
Copyright 2012 Baker Hughes Incorporated. All rights reserved. 3 2
Page 4
© 2012 Baker Hughes Incorporated. All
Rights Reserved. 3
Unconventional Gas Resource: A Global Phenomenon
Source: Baker Hughes, EIA, SPE 68755,
Kawata & Fujita from Rogner
9,162
8,197
2,015
1,278 5,767
5,560
1,220
6,669
2,556
1,050
795
Over 44,300 TCF
Gas in place resources
Pie size to scale
Page 5
Unconventional Oil Resources 2-3 Trillion Barrels
Russia
Bazhenov Shale
WSB 1,600 BBO
Permian,
Mississippian
9 BBO
Utica, Eagle
Ford, Barnett,
15 BBO China
Australia MENA
Argentina Neuquén
Basin
23 BBO
Canada
Cardium
South
Africa
Bakken 24 BBO,
Niobrara 3 BBO
Europe
100 BBO
4
Page 6
0
50,000
100,000
150,000
200,000
250,000
300,000
350,000
400,000
Jan-81 Jan-83 Jan-85 Jan-87 Jan-89 Jan-91 Jan-93 Jan-95 Jan-97 Jan-99 Jan-01 Jan-03 Jan-05 Jan-07 Jan-09 Jan-11 Jan-13
Ma
xim
um
ga
s 6
mo
. p
rod
uctio
n (
MC
F)
Date
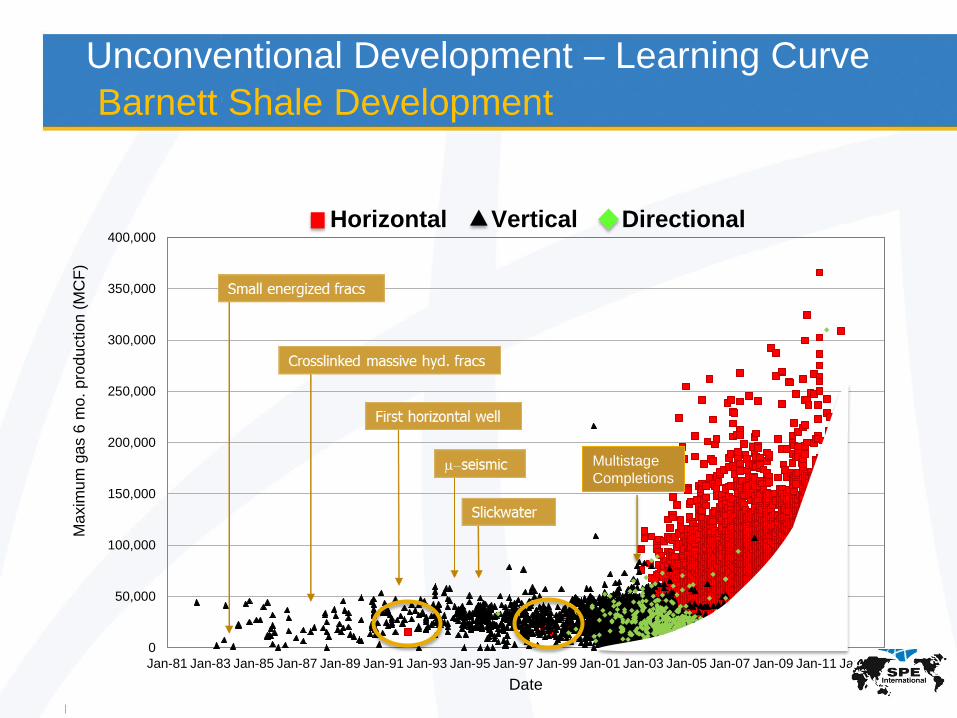
Horizontal Vertical Directional
Multistage
Completions
Unconventional Development – Learning Curve
Barnett Shale Development
Page 7
0
50,000
100,000
150,000
200,000
250,000
300,000
350,000
400,000
Jan-81 Jan-83 Jan-85 Jan-87 Jan-89 Jan-91 Jan-93 Jan-95 Jan-97 Jan-99 Jan-01 Jan-03 Jan-05 Jan-07 Jan-09 Jan-11 Jan-13
Ma
xim
um
ga
s 6
mo
. p
rod
uctio
n (
MC
F)
Date
Horizontal Vertical Directional
Multistage
Completions
Unconventional Development – Learning Curve
Barnett Shale Development
Page 8
A Closer Look at the “Shale Revolution”
of unconventional wells in the U.S.
do not reach their production targets*
of all fracture stages are ineffective**
of operators say they do not know
enough about the subsurface*
70%
60%
73%
Efficiency and Effectiveness are key for Proper
Placement of Well and Frac Stage in Sweet Spots
*Source: Welling & Company, 2012 **Source: Hart’s E&P, 2012
Page 9
© 2011 Baker Hughes Incorporated. All Rights Reserved. 9
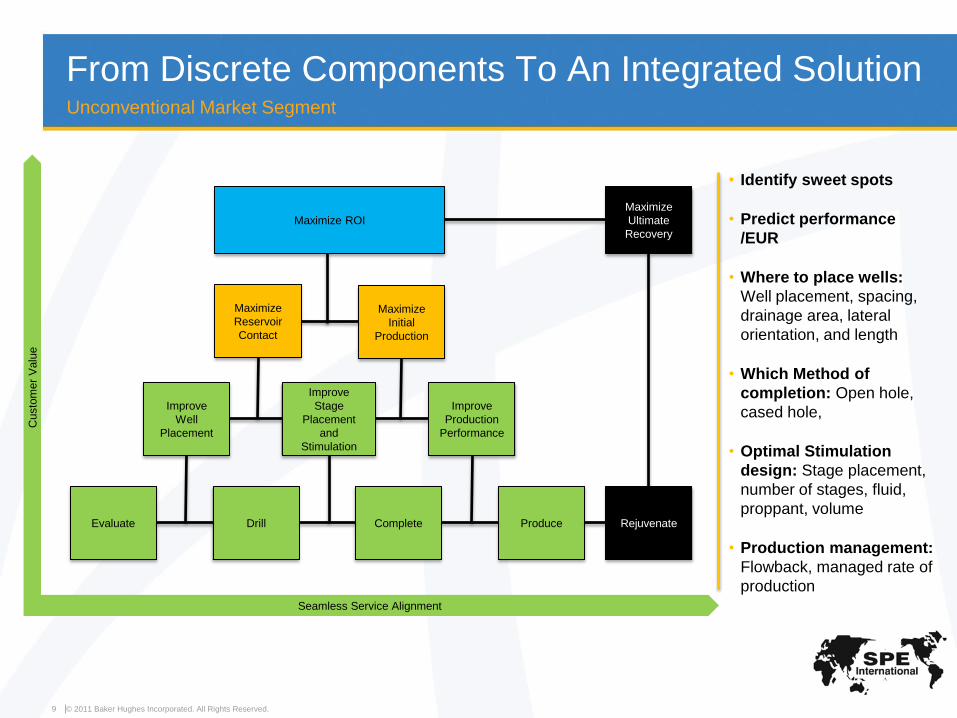
• Identify sweet spots
• Predict performance
/EUR
• Where to place wells:
Well placement, spacing,
drainage area, lateral
orientation, and length
• Which Method of
completion: Open hole,
cased hole,
• Optimal Stimulation
design: Stage placement,
number of stages, fluid,
proppant, volume
• Production management:
Flowback, managed rate of
production
From Discrete Components To An Integrated Solution Unconventional Market Segment
Custo
mer
Valu
e
Seamless Service Alignment
Drill Complete Evaluate Produce
Improve
Well
Placement
Improve
Stage
Placement
and
Stimulation
Improve
Production
Performance
Maximize
Reservoir
Contact
Maximize
Initial
Production
Maximize
Ultimate
Recovery
Maximize ROI
Rejuvenate
Page 10
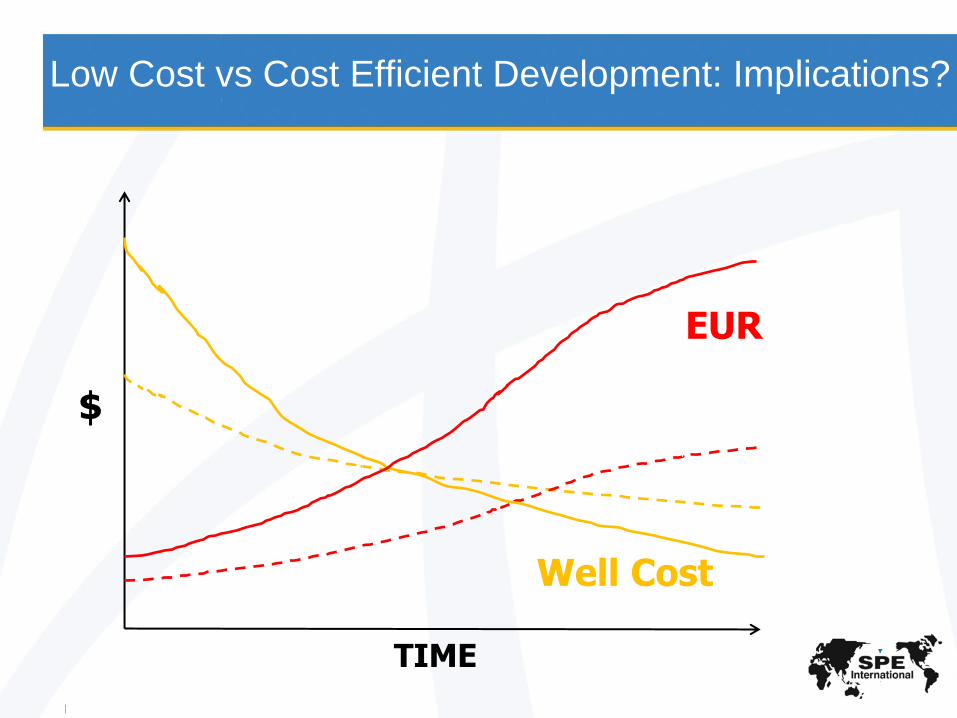
Low Cost vs Cost Efficient Development: Implications?
$
TIME
EUR
Well Cost
Page 11
Unconventional Workflow: How is it Different?
© 2011 Baker Hughes Incorporated. All Rights Reserved. 12
8
Page 12
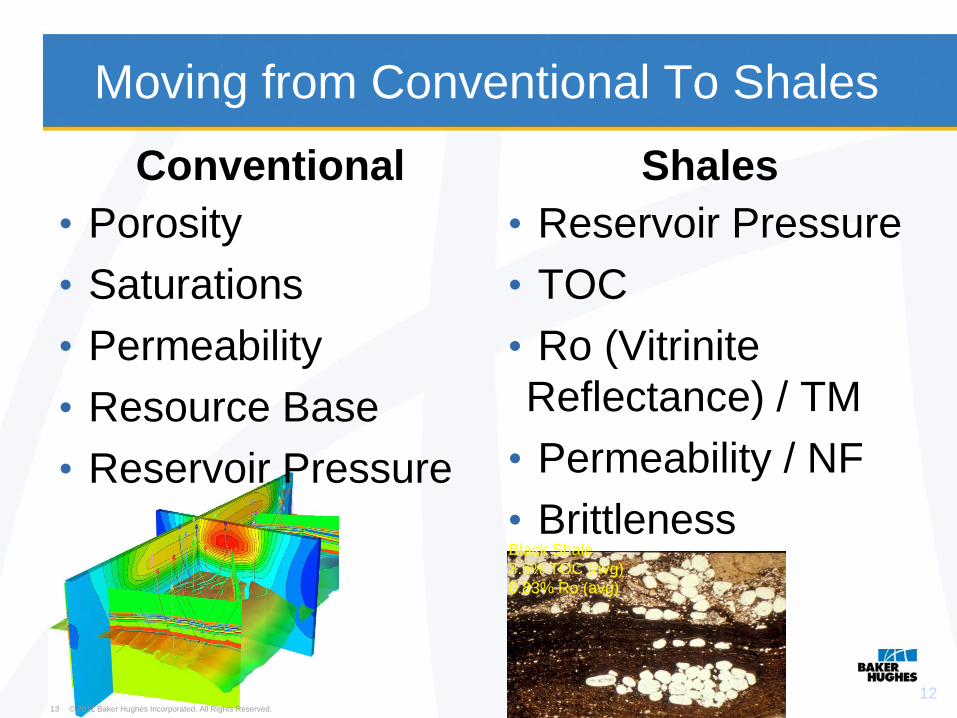
Moving from Conventional To Shales
Conventional
• Porosity
• Saturations
• Permeability
• Resource Base
• Reservoir Pressure
Shales
• Reservoir Pressure
• TOC
• Ro (Vitrinite
Reflectance) / TM
• Permeability / NF
• Brittleness
© 2011 Baker Hughes Incorporated. All Rights Reserved. 13
12
Black Shale
3.5% TOC (avg)
0.83% Ro (avg)
Page 13
Technology Evolution and Production Selected Unconventional Gas Basins, Onshore U.S.
Source: BHI, HPDI, IHS, Company data
0
500
1,000
1,500
2,000
2,500
3,000
3,500
4,000
4,500
5,000
0
5
10
15
20
25
2007 2008 2009 2010 2011
Avg L
ate
ral L
en
gth
(ft
)
Sta
ge
s P
er
We
ll
Horizontal Gas Stages Per Well and Average Lateral Length.
Average Per Well Stages Per Well
Average Lateral length
0
500
1000
1500
2000
2500
3000
3500
4000
0 10 20 30
Ga
s p
er
We
ll, M
CF
PD
Months
Horizontal Gas Well Average
2006 2007 2008
2009 2010 2011
Source: HPDI
Page 14
Hydraulic Fracture
Model
Reservoir Fracture
Grids
Reservoir Flow
Model
Single well treatment
Fracture grid
representation
Geometries and
properties
Multiple wells and
stages
Fracture refinement
Various scenarios
Fit-for-purpose flow
simulator
Dec curves
Drainage Scenarios
STIMULATION PERFORMANCE: REDUCE THE SHARP PRODUCTION DECLINE
Three Key Elements To Avoid
Sharp Production Decline
Page 15
Shale Reservoir Analysis
• Conventional reservoir modeling &
analyses not effective for shale
• Shale reservoirs require new
approaches to Analysis & Forecast
• An integrated “shale engineering”
approach is required to plan wells,
stimulate & forecast long-term
production for economic
evaluations
• SWEET SPOTS: Well and Frac Stage Locations
16 © 2011 Baker Hughes Incorporated. All Rights Reserved.
12
Black Shale
3.5% TOC (avg)
0.83% Ro (avg)
Page 16
What is a “Sweet Spot”?
• The “Sweet Spot” is where the
maximum power is generated with
the least amount of effort and
vibration .
• The Sweet Spot is important in these
sports because we don’t all have
perfect swings.
• What does this have to do with
unconventional resources?
17 © 2012 Baker Hughes Incorporated. All Rights Reserved.
Sweet Spot
Page 17
Geological
Geochemical Geomechanical
Sweet Spot
Unconventional Resources Sweet Spot Characteristics
18 © 2012 Baker Hughes Incorporated. All Rights Reserved.
Depth
Thickness
Lithology/Mineralogy
Porosity
Pressure
(Continued Producibility)
Anisotropy
Stress Regime
Fractures
Faulting
Brittleness
(Fracturability)
TOC
Kerogen Type
Fluid
Thermal Maturity
Depositional
Environment
(Litho-facies)
A “Sweet Spot” or “Core” represents the concurrence of
several favorable parameters such as:
Sweet Spots are not
Contiguous
Page 18
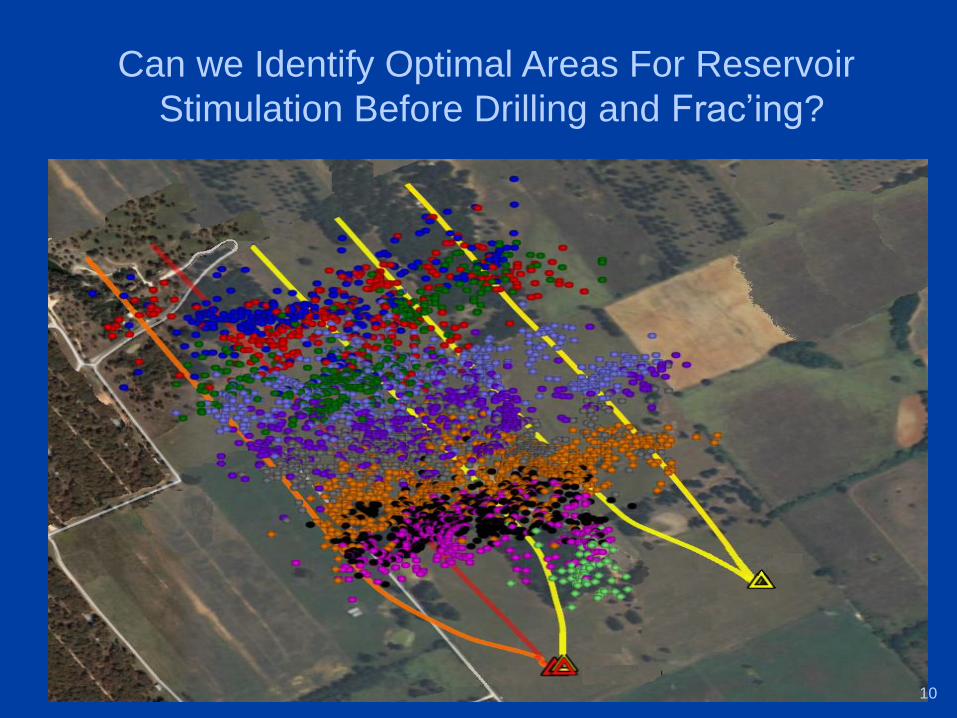
Can we Identify Optimal Areas For Reservoir
Stimulation Before Drilling and Frac’ing?
10
Page 19
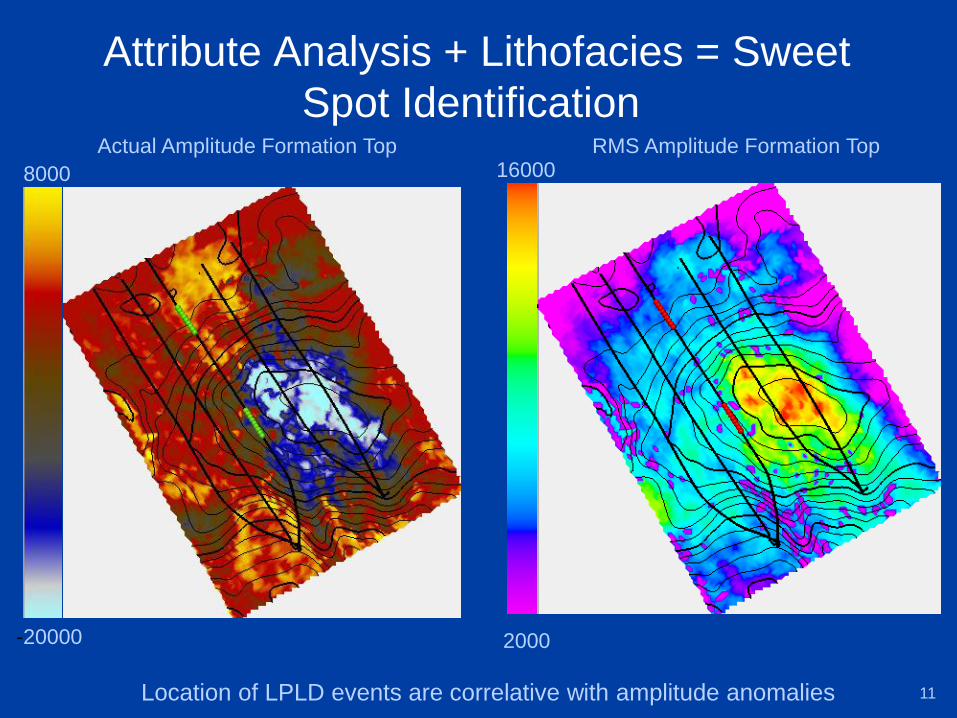
Attribute Analysis + Lithofacies = Sweet
Spot Identification RMS Amplitude Formation Top
16000
2000
Actual Amplitude Formation Top
8000
-20000
Location of LPLD events are correlative with amplitude anomalies 11
Page 20
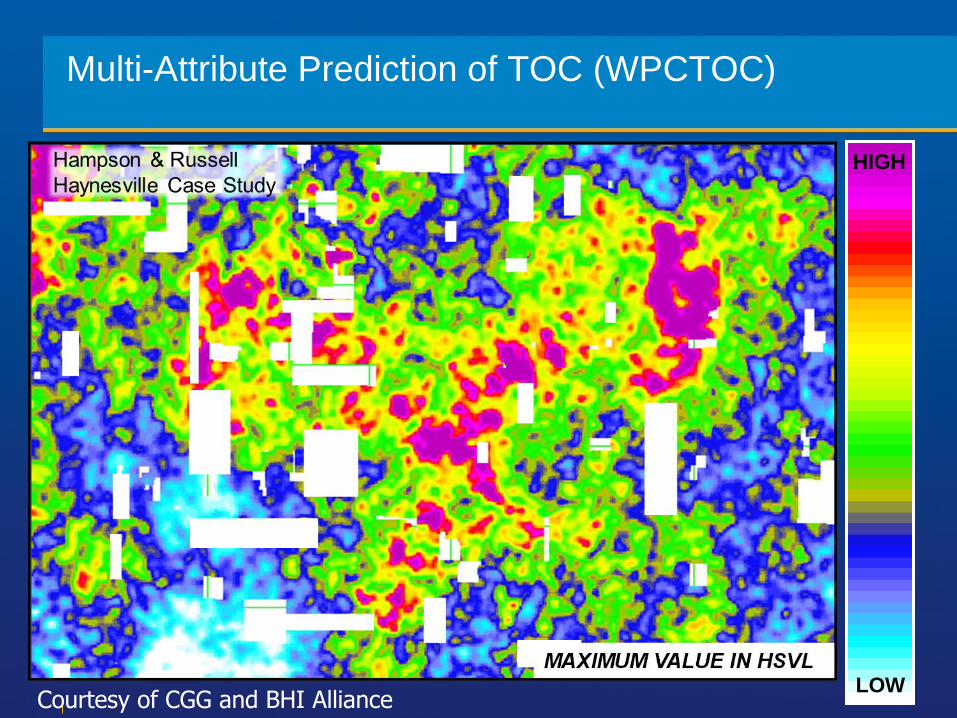
Multi-Attribute Prediction of TOC (WPCTOC)
HIGH
LOW Courtesy of CGG and BHI Alliance
Page 21
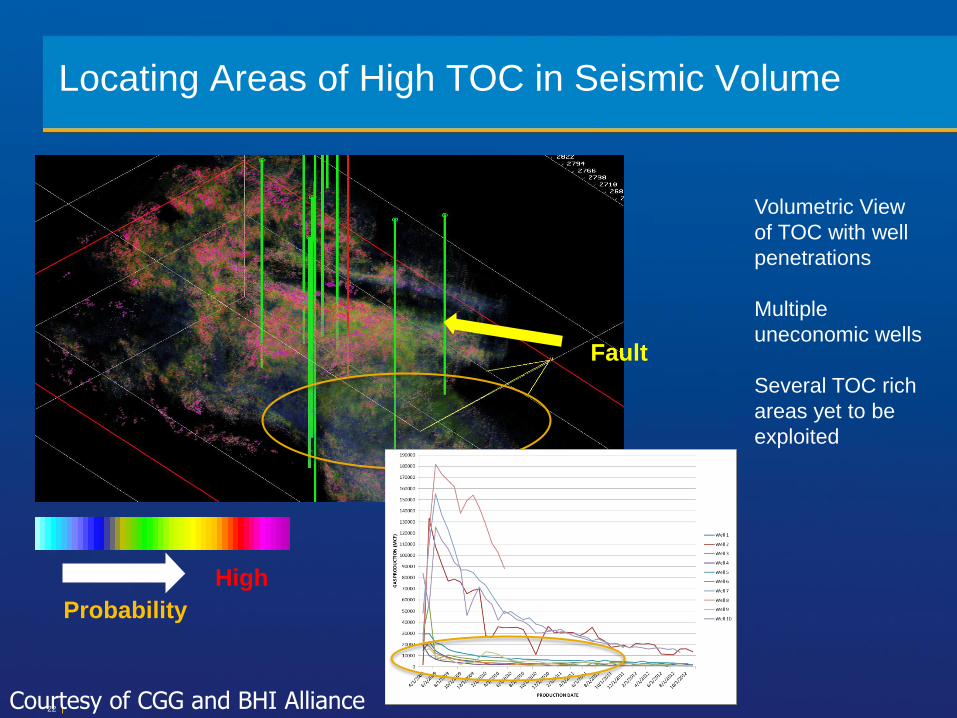
Locating Areas of High TOC in Seismic Volume
22
Fault
Probability
High
Volumetric View
of TOC with well
penetrations
Multiple
uneconomic wells
Several TOC rich
areas yet to be
exploited
Courtesy of CGG and BHI Alliance
Page 22
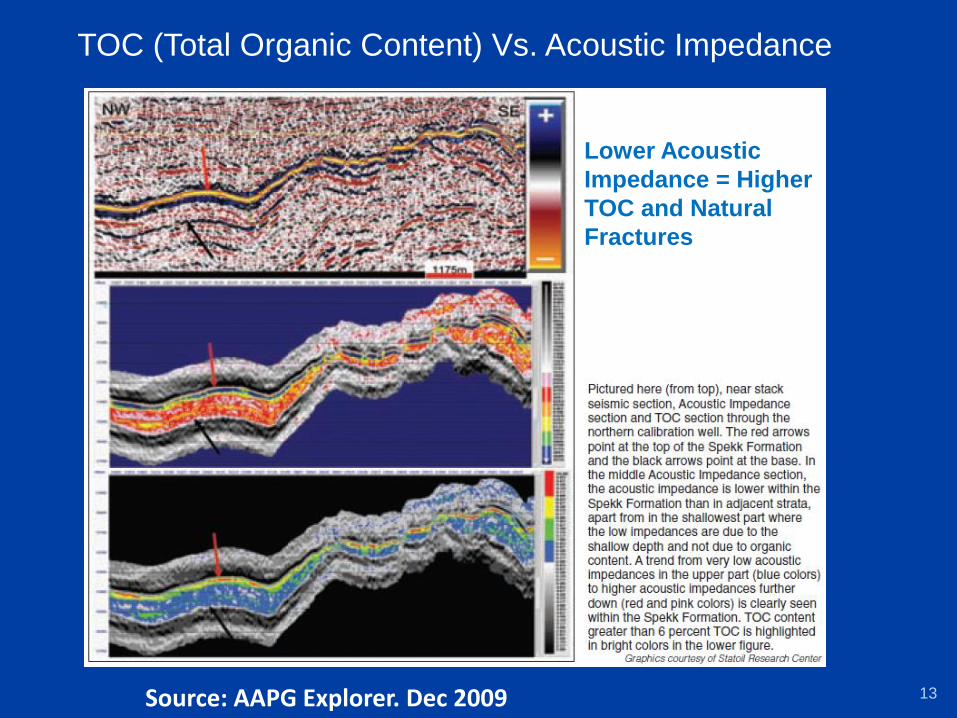
TOC (Total Organic Content) Vs. Acoustic Impedance
Source: AAPG Explorer. Dec 2009
Lower Acoustic
Impedance = Higher
TOC and Natural
Fractures
13
Page 23
© 2010 Baker Hughes Incorporated. All Rights Reserved. 24
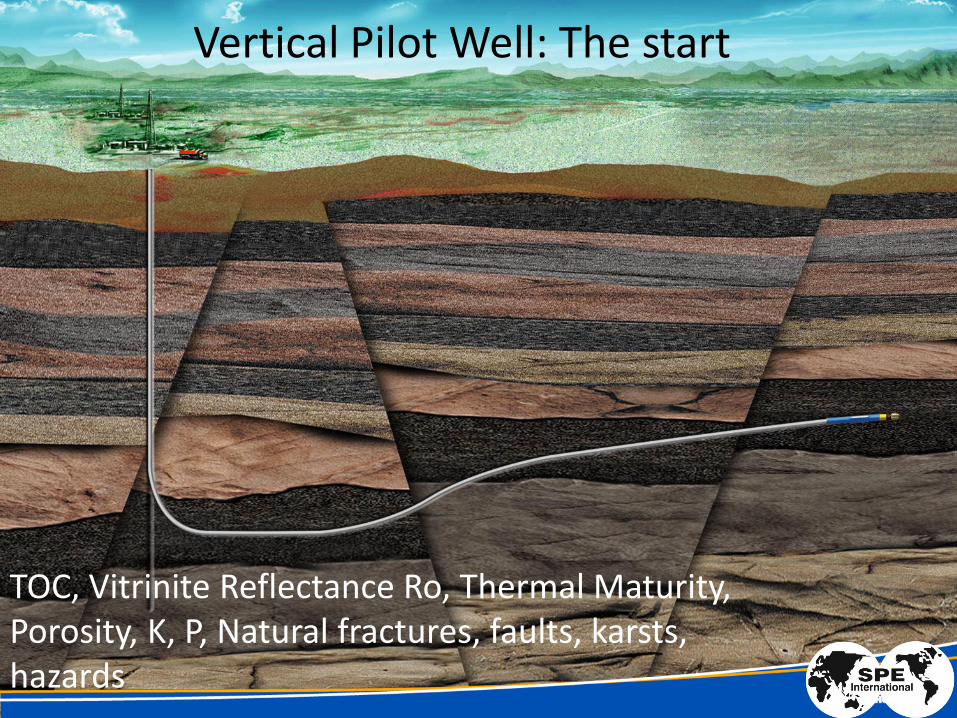
Vertical Pilot Well: The start
TOC, Vitrinite Reflectance Ro, Thermal Maturity, Porosity, K, P, Natural fractures, faults, karsts, hazards
Page 24
© 2010 Baker Hughes Incorporated. All Rights Reserved. 25
© 2010 Baker Hughes Incorporated. All Rights Reserved.
Reservoir Navigation Services - RNS
(Azimuthal Resistivity & Gamma Images) Armstrong Co., Pennsylvania – Marcellus Case History
Target for Lateral
High TOC = only 15ft Thick
Well Trajectory Planned
• Seismic
• Shale Analysis
• Offset Well Data
Monitored LWD GR
• Up and Down
• To determine if well
approaching formation
top or bottom / correct
Follow the high TOC, Ro, BI and Pp path 14
Moving from Pilot wells to development wells
Page 25
Evaluating the Resource and Production Potential
© 2011 Baker Hughes Incorporated. All Rights Reserved. 26
• 20
Resistivity / Density /Neutron
Formation
Lithology Spectroscopy
Micro-
seismic Imaging
Large
Diameter
Coring
Deep Reading
Shear Acoustic
Nuclear
Magnetic
Resonance
• Geochemistry
• Lithology
• Mineralogy
• Total organic
carbon
• Lithology
• Mineralogy
• Th/U for
Carbon
classification
Image
correlation
with
lithology
and facies
Fracture
detection
Core
analyses
• Geomechanical
properties from
Wellbore and
away from
wellbore
• Porosity
• Indepen-
dent
measure
of total
organic
carbon
Logging and Core analyses can identify: o Fomation with producible source rock hydrocarbon
o Optimum formations to drill horizontal laterals
o Optimall placement of frac stages
o Potential barriers for frac containment
o Mineralogy key component integrated with Geomechanics 15
Page 26
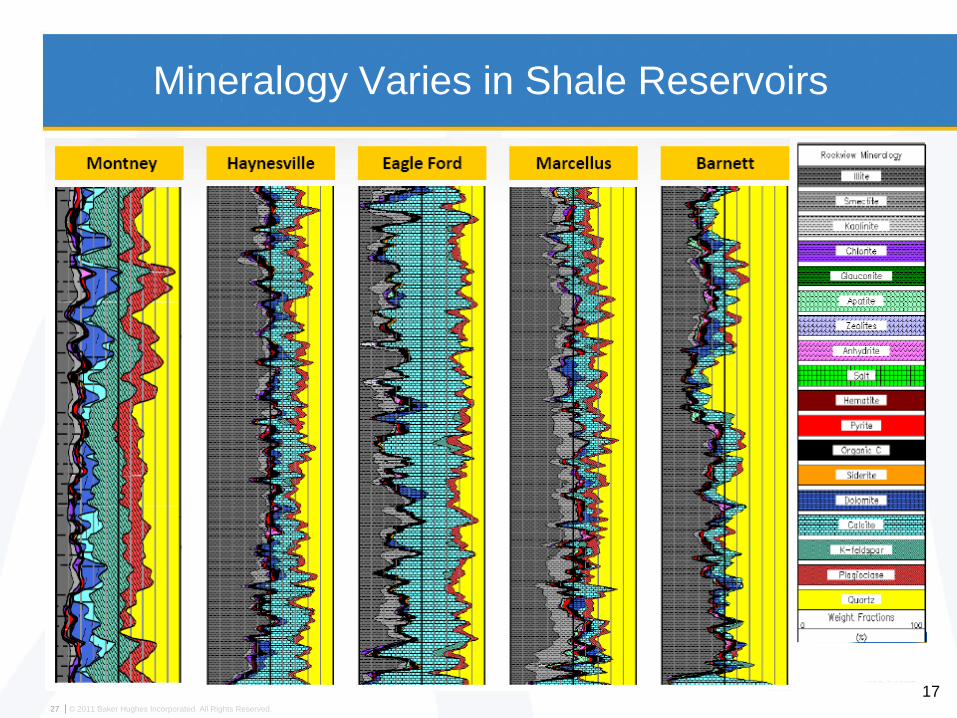
Mineralogy Varies in Shale Reservoirs
© 2011 Baker Hughes Incorporated. All Rights Reserved. 27
17
Page 27
Wellbore Imaging: Fractures, Faults & Geohazards
19
WBM
OBM
Page 28
Avoiding fault zone: don’t frac into water below target horizon
Targeting natural fracture swarms maximizes impact of the frac energy
High-definition LWD Imaging to Optimize Completions
Eliminate nonproductive stages
Avoiding fracture swarms from adjacent wells frac job
X X
© 2012 Baker Hughes
Incorporated. All Rights
Reserved.
29
Targeting natural fracture swarms maximizes impact of the frac energy
Case Histories Show Production Increases above 20 %
and above 10% in EUR
Page 29
©
201
1
Bak
er
Hug
hes
Inco
rpor
ated
. All
Righ
ts
Res
erve
d.
30
Deep Shear Wave Imaging (up to 70m away)
• Methodology
– Filtering direct waves
– Reflected wave stacking
– Reflector strike inversion
– Fullwave data migration
• Benefits
– Illuminate natural fractures
up to 70 m away.
– Identify mechanical strata
– Placing laterals
Imaging fractures that
do not intersect the well Imaging fractures that
intersect the well
Page 30
The Next 5-10 Years
~100,000 Wells, 1-2 Million Hydrofracs
© 2010 Baker Hughes Incorporated. All Rights Reserved. 31
Palo Duro
Woodford
Avalon
Barnett
24-252 Tcf
Haynesville
(Shreveport/Louisiana)
29-39 Tcf
Fayetteville
20 Tcf
Floyd/ Conasauga
Niobrara/Mowry
Cane Creek Monterey
Michigan Basin
Utica Shale
Horton Bluff Formation
New Albany
86-160 Tcf
Marcellus
225-520 Tcf
Antrim
35-160 Tcf
Lewis/Mancos
97 Tcf
Green River
1.3-2 Trillion Bbl Gammon
Colorado Group
>300 Tcf
Bakken
3.65 Billion Bbl
Montney Deep Basin
>250 Tcf
Horn River Basin/
Cordova Embayment
>700 Tcf
0 600
MILES
Eagle Ford
25-100+ Tcfe
OIL SHALE PLAY
GAS SHALE PLAY
How Do We Optimize Resource Development? 21
Page 31
Outside North America?: The Next 5-10 Years?
Wells, ? Hydraulic fracs
© 2010 Baker Hughes Incorporated. All Rights Reserved. 32
How Do We Optimize Resource Development? 22
Eastern Hm
UK
Poland
Russia
Turkey
Saudi Arabia
Kuwait
India
China
Indonesia
Australia
Croatia
Western Hm
Argentina
Mexico,
Colombia
Venezuela
Ecuador
Brazil
Page 32
Production from Nano-Darcy Rocks?
oShale Resource has typically permeability in the nano-Darcy
range
oGas / hydrocarbon may move in order of few feet in a year!!
oWhat mechanism is there then to produce hydrocarbon from
such low permeability rocks?
oCreation of a stimulated reservoir volume that has both
longitudinal and shear fractures
© 2010 Baker Hughes Incorporated. All Rights Reserved. 33
Longitudinal bi-wing fracture
Shear fracture envelope 24
Page 33
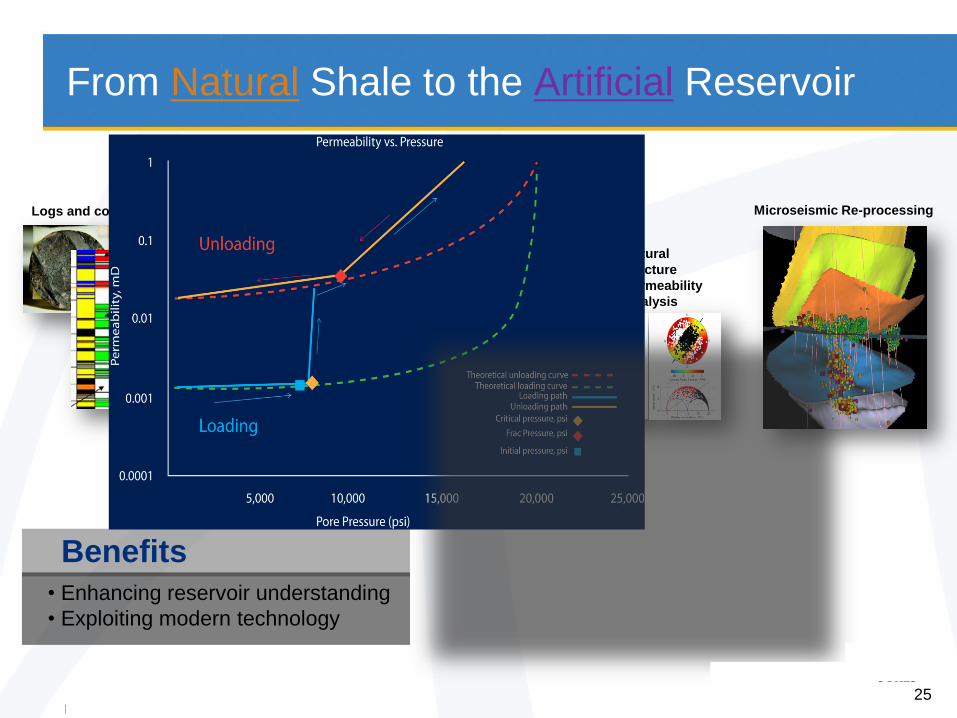
Confidential
Logs and core In situ stress
determination
Natural
Fracture
Permeability
Analysis
Microseismic Re-processing
Benefits
• Enhancing reservoir understanding
• Exploiting modern technology
From Natural Shale to the Artificial Reservoir
25
Page 34
Confidential
Shale Engineering Predictive Model Matched production history and production logging
Pressure Drop, psi
Frac stage contribution
match
Proppant placement match
Well History match
Narrow Uncertainty
27
Page 35
32
NPV Vs. Transverse Fractures N
PV
= D
WR
– C
F (
10^6$)
NP
V =
D
WR
– C
F (
10
^6$)
Number of Transverse Fractures Number of Transverse Fractures
Page 36
Ball Activated Sleeve Open / Close Completion System
© 2009 Baker Hughes Incorporated. All Rights Reserved. 33
Varying Ball Sizes
Frac Sleeve in Closed Position
Ball with Frac Sleeve Open
28
Lighter than AL / Stronger than Steel
Page 37
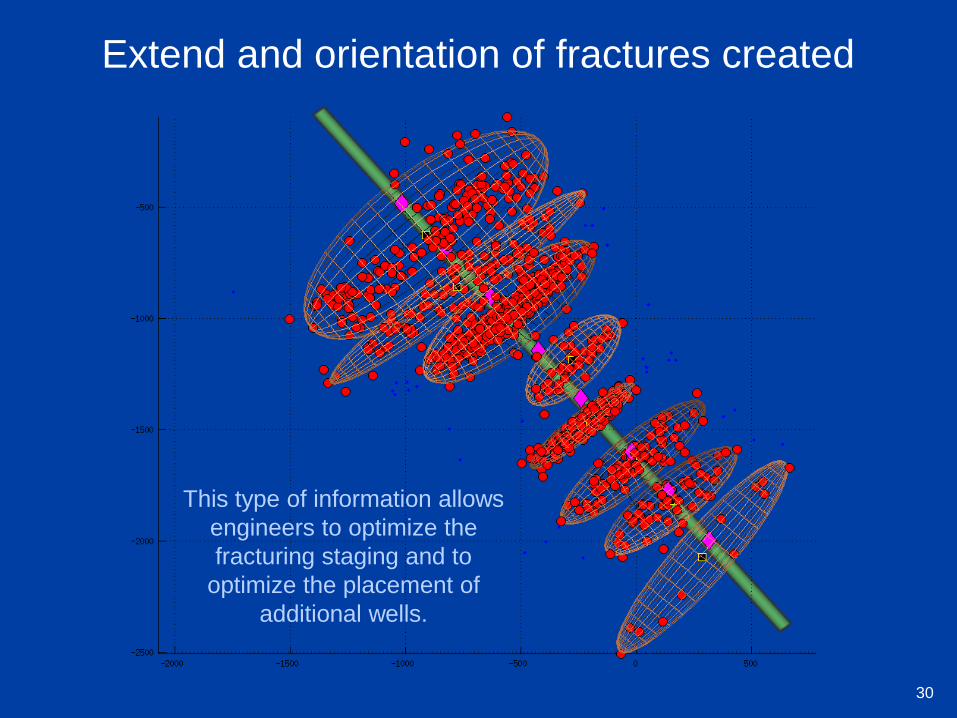
Extend and orientation of fractures created
This type of information allows
engineers to optimize the
fracturing staging and to
optimize the placement of
additional wells.
30
Page 38
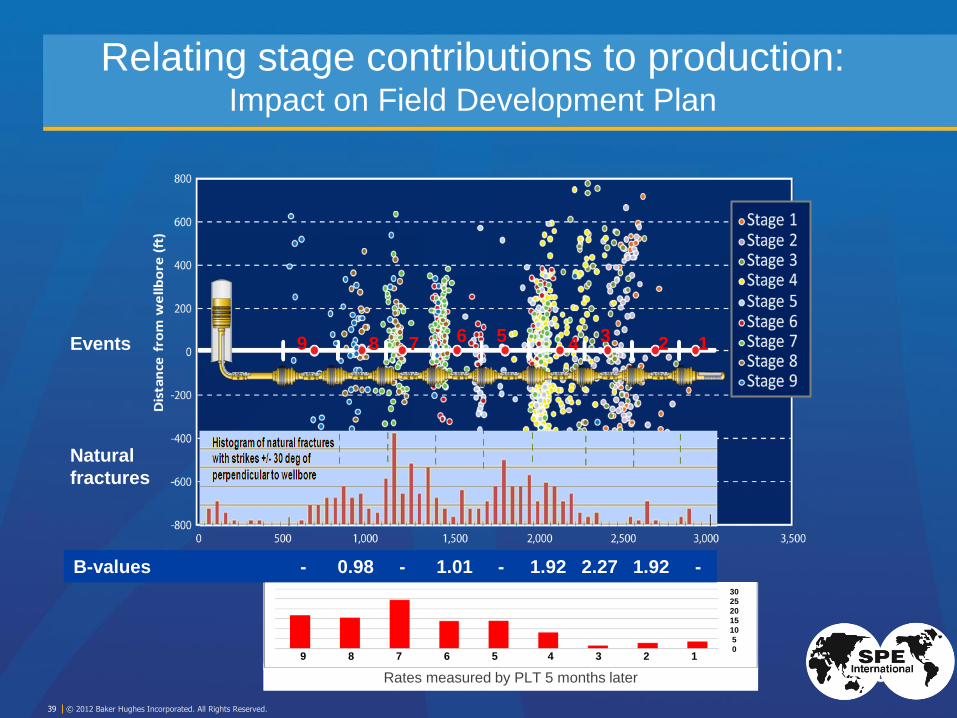
Relating stage contributions to production: Impact on Field Development Plan
© 2012 Baker Hughes Incorporated. All Rights Reserved. 39
Rates measured by PLT 5 months later
7 6 5 4 3 2 1 8 9
30
25
20
15
10
5
0
B-values - 0.98 - 1.01 - 1.92 2.27 1.92 -
1 3 2 4 7 5 6 8 9
Natural
fractures
Events
Page 39
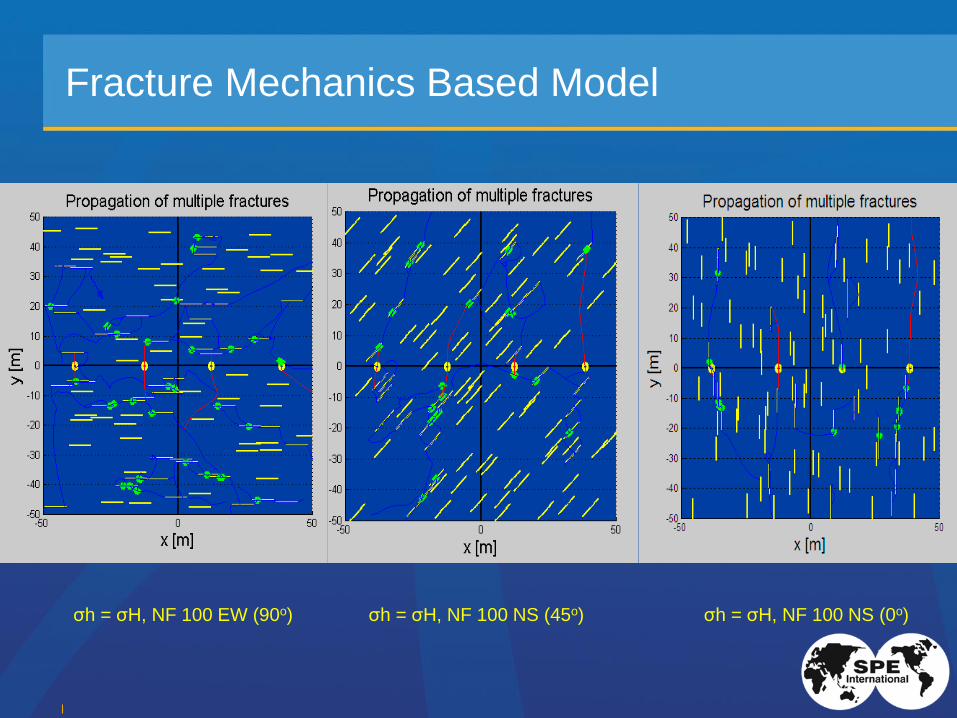
Fracture Mechanics Based Model
σh = σH, NF 100 EW (90o) σh = σH, NF 100 NS (0o) σh = σH, NF 100 NS (45o)
Page 40
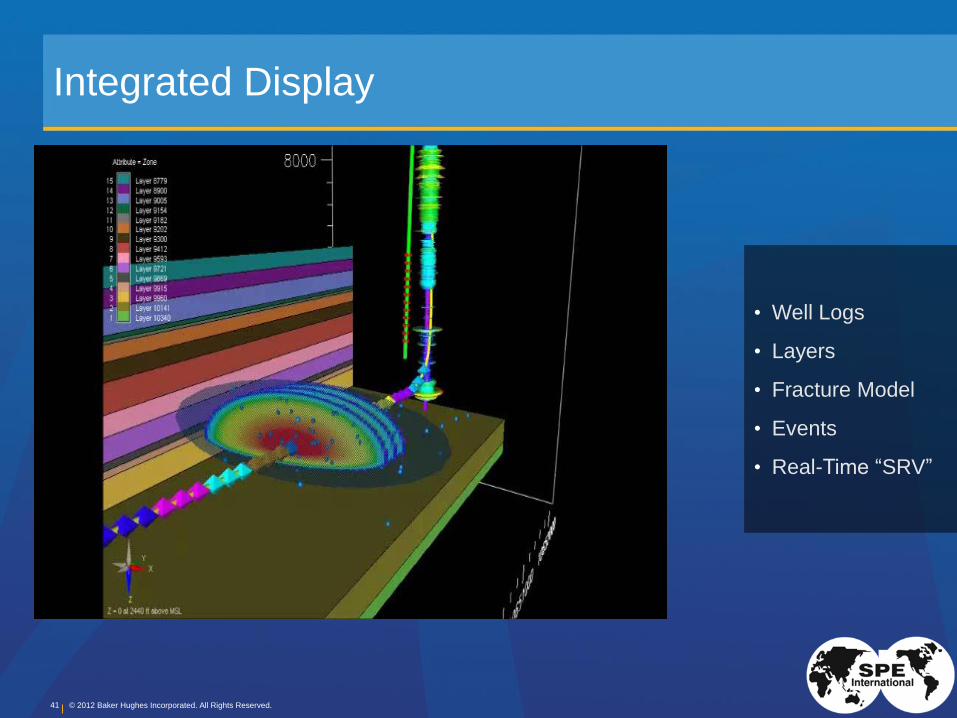
Integrated Display
© 2012 Baker Hughes Incorporated. All Rights Reserved. 41
• Well Logs
• Layers
• Fracture Model
• Events
• Real-Time “SRV”
Page 41
Concluding Remarks
• Shale resource is not contiguous and no two
Shale basins are the same
–Sweet spot identification is going to be critical
(seismic attribute + Lithofacies) for well placement
–Different shales will require different set of attributes
and the associated lithofacies
• Geometric placement of hydraulic fracture stages
needs to be replaced by shale productivity based
parameters
–Capitalize on the presence of natural fractures at the
well bore as well as away from the wellbore
–Avoid faults and geohazards
© 2010 Baker Hughes Incorporated. All Rights Reserved. 42 34
Page 42
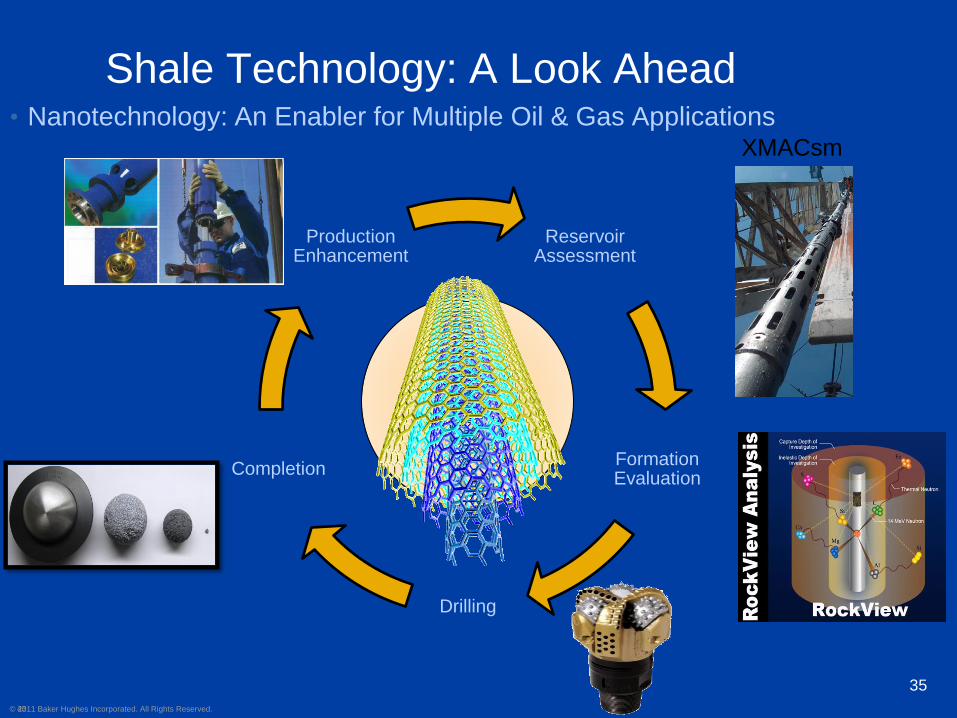
Reservoir Assessment
Formation Evaluation
Drilling
Completion
Production Enhancement
Shale Technology: A Look Ahead • Nanotechnology: An Enabler for Multiple Oil & Gas Applications
© 2011 Baker Hughes Incorporated. All Rights Reserved. 43
XMACsm
35
Page 43
Society of Petroleum Engineers
Distinguished Lecturer Program www.spe.org/dl 44
Your Feedback is Important
Enter your section in the DL Evaluation Contest by
completing the evaluation form for this presentation
http://www.spe.org/dl/