127
AMWAC 1999.5 i Australian Medical Workforce Advisory Committee THE SPECIALIST CARDIOLOGY WORKFORCE IN AUSTRALIA SUPPLY AND REQUIREMENTS 1998 - 2009 AMWAC Report 1999.5 August 1999

AMWAC 1999.5 i
Australian Medical Workforce Advisory Committee
THE SPECIALIST CARDIOLOGY WORKFORCE IN AUSTRALIA
SUPPLY AND REQUIREMENTS
1998 - 2009
AMWAC Report 1999.5
August 1999

AMWAC 1999.5 ii
© Australian Medical Workforce Advisory Committee 1999 ISBN 0 7347 3113 2 This work is copyright. It may be reproduced in whole or part for study or training purposes subject to the inclusion of an acknowledgement of the source. Reproduction for purposes other than those indicated above requires the written permission of the Australian Medical Workforce Advisory Committee. Enquiries concerning this report and its reproduction should be directed to: Executive Officer Australian Medical Workforce Advisory Committee c/- New South Wales Department of Health Locked Mail Bag 961 NORTH SYDNEY NSW 2059 Telephone: (02) 9391 9933 E-mail: [email protected] Internet: http://amwac.health.nsw.gov.au Suggested citation: Australian Medical Workforce Advisory Committee (1999), The Cardiology Workforce In Australia, AMWAC Report 1999.5, Sydney Publication and design by Australian Medical Workforce Advisory Committee. Cover design and printing by Copybook, Sydney. CONTENTS

AMWAC 1999.5 iii
Abbreviations v List of Tables and List of Figures vii Terms of Reference of AMWAC and the AMWAC Cardiology Workforce Working Party x Membership of AMWAC xi Membership of the AMWAC Cardiology Workforce Working Party xii Introduction, Guiding Principles and Methodology 1 Summary of Findings and Recommendations 4 Description of the Current Cardiology Workforce 14
The Number of Practising Cardiology Specialists in Australia 14 Growth in the Cardiology Workforce 15 Distribution of the Cardiology Workforce 16 Age Profile 19 Gender Profile 20 Hours Worked 20 Type of Practice 23 Services Provided 23 Training Arrangements 35 Summary of Main Characteristics of the Specialist Cardiology Workforce 38
Adequacy of the Current Cardiology Workforce 39
Cardiology Specialist: Population Ratio 39 Sustainable Cardiology Practice 40 Consultation Waiting Times 43 Public Hospital Vacancies 46 Professional Satisfaction 46 Conclusions on Adequacy of the Current Workforce 46
Projections of Requirements 47
Population 47 Cardiovascular Health 47 Forecast Cardiology Service Trends 51 The Impact of Technology 56 Specialists= Perceptions on Factors Affecting Workforce Requirements 58 Summary of Cardiology Service Trends and Forecasts 58
Projections of Supply 61 Additions to the Cardiology Workforce 61
AMWAC 1999.5 iv
Retirements 61 Female Participation in the Workforce 61 Provision of Services in Rural and Remote Areas 62
Balancing Supply Against Requirements 64
Requirement Trends 64 Supply Trends 65 Projected Balance 66
Recommendations 74 Appendices 75 A: Rural, Remote Metropolitan Areas Classification 75 B: AMWAC/RACP Survey of Cardiology Workforce 77 C: Summary of Cardiology Data In AIHW Medical Labour Force Survey 107 References 113

AMWAC 1999.5 v
ABBREVIATIONS ABS Australian Bureau of Statistics ACT Australian Capital Territory AHMAC Australian Health Ministers' Advisory Council AIHW Australian Institute of Health and Welfare AMI Acute myocardial infarction AMWAC Australian Medical Workforce Advisory Committee Aust Australia CCU Coronary Care Unit CHD Coronary heart disease CSANZ Cardiac Society for Australia and New Zealand CVD Cardiovascular disease DHAC Department of Health and Aged Care (Commonwealth) ECG Electro cardiogram FRACP Fellow of the Royal Australasian College of Physicians FTE Full time equivalent GP General Practitioner ICD-9 International Classification of Diseases - Ninth Revision MBS Medicare Benefits Schedule MONICA Multinational Monitoring of Trends and Determinants of
Cardiovascular Disease NSW New South Wales NT Northern Territory

AMWAC 1999.5 vi
Pop Population Qld Queensland RACP Royal Australasian College of Physicians RRMA Rural, Remote and Metropolitan Areas classification SA South Australia Spec Specialist SPR Specialist: Population ratio Tas Tasmania Terr Territory TRD Temporary Resident Doctor Vic Victoria VMO Visiting Medical Officer WA Western Australia

AMWAC 1999.5 vii
LIST OF TABLES 1. Cardiology specialists, by State/Territory and gender, 1999 2. Cardiologists (Medicare data), by State/Territory, 1991-92 and 1995-96 3 Cardiology specialists to population and cardiologists per 100,000 population
(RACP, Medicare and AIHW data), by State/Territory, selected years 1996 and 1999
4. Distribution of cardiology specialists (RACP data), by State/Territory and geographic location, 1999
5. Age profile of the cardiology workforce, by State/Territory and major age category, 1999
6. Age profile of the cardiology workforce, by State/Territory and gender, 1999 7. Cardiology specialists average hours provided per week, annual labour supply
hours and hours worked per 100,000 population in cardiology, hours on call back worked and hours on call not worked, by State/Territory, 1998
8. Cardiology specialists average working hours and average age, by region of main job, 1998
9. Cardiology specialists average hours and annual hours worked, by gender and age, 1998
10. Separations from Australian hospitals with a principal diagnosis of cardiac disease, 1994-95 to 1996-97
11. Separations from Australian hospitals with principal diagnosis mainly treated by cardiologists,1994-95 and 1996-97
12. Cardiology procedures performed more than 10,000 times during 1994-95 to 1996-97
13. Cardiology related procedures with increases of more than 10,000 cases between 1993-94 and 1996-97
14. Estimated cardiology procedures (ICD-9-CM) per 100,000 persons by geographical location of patient, 1996-97
15. Estimated cardiology diagnoses (ICD-9-CM) per 100,000 persons by geographical location of patient, 1996-97
16. Top 20 Medicare services provided by cardiology specialists ,1992-93 to 1997-98 17. Medicare services per cardiologists for item numbers 110, 116, and all items with
100 or more services, 1992-93 to 1997-98 18. Number of new patients, repeat patients and total patients by financial year for
item numbers 110 and 116, 1986-87 to 1997-98 19. Number of Medicare services, item numbers 110 and 116, by age group, 1985-
86 to 1997-98 20. Cardiology Medicare services with 5,000 or more services during 1995-96, by
provider and State/Territory, 1995-96 (%) 21. Full-time cardiology advanced trainees, by gender, age, and State/Territory 1998 22. Cardiology advanced trainees, by gender and State/Territory, 1993 - 1997 23. Cardiology specialist to population ratio, by State/Territory, 1999 24. Paediatric cardiology specialist to population ratio, by State/Territory, 1999 25. Cardiology specialists to population ratio, by State/Territory and geographic

AMWAC 1999.5 viii
location, 1999 26. Population catchment required for a viable specialist service in cardiology 27. Infrastructure requirements for a sustainable resident specialist service in
cardiology 28. Specialist adult cardiology average waiting time (days) for a standard first
consultation and a clinically urgent condition, by private rooms/public outpatients department and State/Territory, 1998
29. Specialist paediatric cardiology average waiting time (days) for a standard first consultation and a clinically urgent condition, by private rooms/public outpatients department and State/Territory, 1998
30. Rates of non-fatal heart attacks and all coronary events, 1993-94 to 1995-96 (per 100,000 population)
31. Projected increases the male and female populations, 1998 to 2018 32. Projected increases in cardiology related diagnosis for males and females, 1998
to 2018 33. Projected increases in cardiology-related procedures for males and females,
1998 to 2018 34. Summary of cardiology requirement trends 35. Projected requirements for cardiology services (in full time equivalent hours per
week) for selected indicators, 1999 to 2009a 36. Projected supply of cardiology services, high, low and average retirement rates,
by FTE hours worked per week, 1999, 2004 and 2009 37. Projected adult cardiology supply and requirements (FTE hours), 2.8% growth
per year, 1999 to 2001a 38. Estimated cardiology graduate output required to move projected supply into
balance with projected requirements, 2.8% growth per year, (in FTE hours), by selected graduate outputs, 1999 to 2009
39. Adult cardiology graduate output needed to move projected supply into balance with projected requirements, 2.8% growth per year, (in FTE hours), 1998 to 2009
40. Distribution of cardiology first year advanced trainees, by State/Territory, 1999 to 2002
LIST OF FIGURES 1. Cardiology specialists supply (average attrition rates) and demand projections
based on working a 60 hour maintaining an intake of 24 advanced 2. Scenario 1 - A working week of 55 hours beginning in 1999. Cardiology
specialists supply (average attrition rates) and demand projections based on working a 55 hour and incorporating an intake of 24 advanced trainees to the year 2003 and 20 thereafter.
3. Scenario 2 - An increase of 30% female advanced trainees beginning in 1999.
Cardiology specialists supply (average attrition rates) and demand projections

AMWAC 1999.5 ix
based on working a 60 hour and incorporating an intake of 24 advanced trainees to the year 2003 and 20 thereafter.
4. Scenario 3 - Cardiology demand requirements growing at 5% per annum. Cardiology specialists supply (average attrition rates) and demand projections based on working a 60 hour and incorporating an intake of 24 advanced trainees to the year 2003 and 20 thereafter.
AMWAC 1999.5 x
TERMS OF REFERENCE OF AMWAC AND THE AMWAC CARDIOLOGY WORKFORCE WORKING PARTY The Australian Health Ministers' Advisory Council (AHMAC) established the Australian Medical Workforce Advisory Committee (AMWAC) to advise on national medical workforce matters, including workforce supply, distribution and future requirements. AMWAC held its first meeting in April 1995. AMWAC Terms of Reference 1. To provide advice to AHMAC on a range of medical workforce matters, including:
- the structure, balance and geographic distribution of the medical workforce in Australia;
- the present and required education and training needs as suggested by population health status and practice developments;
- medical workforce supply and demand; - medical workforce financing; and - models for describing and predicting future medical workforce
requirements. 2. To develop tools for describing and managing medical workforce supply and
demand which can be used by employing and workforce controlling bodies including Governments, Learned Colleges and Tertiary Institutions.
3. To oversee the establishment and development of data collections concerned
with the medical workforce and analyse and report on those data to assist workforce planning.
Cardiology Workforce Working Party Terms of Reference The AMWAC Cardiology Workforce Working Party was established as a sub-committee of AMWAC and was asked to provide a report to AMWAC on the optimal supply and appropriate distribution of cardiology specialists across Australia, including projections for future requirements. The Working Party held its first meeting on 23 October 1997 and presented its report to the AMWAC meeting of August 1999. The report was accepted by AHMAC at its October 1999 meeting.
AMWAC 1999.5 xi
MEMBERSHIP OF AMWAC Independent Chairman Professor John Horvath Physician, Sydney Members Mr Alan Bansemer Commissioner, Health Department of Western Australia Mr Eric Brookbanks Assistant Secretary, Business and Temporary Entry
Branch, Commonwealth Department of Immigration and Multicultural Affairs
Ms Meredith Carter Director, Health Issues Centre Mr Michael Gallagher First Assistant Secretary, Higher Education Division,
Commonwealth Department of Employment, Education, Training and Youth Affairs
Assoc. Prof. Jane Hall Director, Centre For Health Economics, Research and
Evaluation, University of Sydney Dr Richard Madden Director, Australian Institute of Health and Welfare Dr Mary Mahoney State Director, Queensland Training Program, Royal
Australian College of General Practitioners Professor Nick Saunders Dean, Faculty of Medicine, Monash University, Melbourne Dr Robert Stable Director General, Queensland Department of Health Dr David Theile Surgeon, Brisbane (former President, Royal Australasian
College of Surgeons) Dr Lloyd Toft President, Medical Board of Queensland Mr Robert Wells First Assistant Secretary, Office of the National Health and
Medical Research Council, Commonwealth Department of Health and Aged Care

AMWAC 1999.5 xii
MEMBERSHIP OF THE AMWAC CARDIOLOGY WORKFORCE WORKING PARTY Chairman Dr John Sparrow Chief Medical Officer, Tasmanian Department of Health and Human Services
Members Dr Alex Bune Clinical School, Royal North Shore Hospital, Sydney Professor Phil Harris Director of Cardiology, Royal Prince Alfred Hospital, Sydney Dr Thelma Hunter Consumer representative, Canberra Dr Michael Jelinek President, Cardiac Society of Australia Mr Phil Sheedy District Manager, Prince Charles Hospital and District
Health Service, Brisbane Dr Ian Smee Cardiologist, Wagga Wagga Ms Anastasia Ioannou Senior Policy Officer, AMWAC
The Working Party would also like to acknowledge the helpful comments provided by Professor John Horvath and Mr Paul Gavel (AMWAC) and Dr Owen Dent; Mr John Harding and Ms Ann Leverton (AIHW), Mr Gary Disher and Mr Tai Rotem (RACP), and Mr Martin Butler (Health Insurance Commission) for assistance with data collection.

AMWAC 1999.5 1
INTRODUCTION, GUIDING PRINCIPLES AND METHODOLOGY Introduction In preparing this report, the main objective of the Working Party has been to promote an optimal supply and appropriate distribution of cardiology specialists, including projections of future supply and requirements to the year 2009. Guiding Principles In compiling this report, the Working Party adopted the following guiding principles: • the Australian community should have available an adequate number of trained
cardiology specialists, appropriately distributed to provide the cardiology services it requires;
• the community is best served when cardiology specialists have high standards of qualification and work with a high level of ongoing experience;
• the best assurance of standards is a high quality requirement for entry to practice; • all Australian residents should have access to a good standard of cardiology
services, irrespective of geography and economic status. In achieving this, convenience to the patient must be balanced against the quality of services that can be distributed to meet that convenience; and
• both public and private sectors should provide an adequate level of high quality cardiology services.
The Working Party defined a cardiology specialist as:
A qualified specialist who is conducting, either exclusively or principally, cardiology consultations, cardiology assessments/procedures and medico legal consultations on cardiology medicine or is in a full time or part time academic position relating to cardiology medicine.
The definition includes salaried positions and private practice. The definition does not include other practitioners who, for one reason or another, undertake cardiology work as part of their practice; nor does it include the training registrars who hold positions in hospitals or the service registrars who work in cardiology medicine but are not recognised as being in training positions.
Methodology In estimating workforce numbers, establishing a profile of the workforce and assessing its adequacy, the main sources of data were: 1 Royal Australasian College of Physicians (RACP) The RACP keeps a variety of data, principally on the number, age, gender and location of Fellows, and data on trainees. However, to supplement this data, with information on hours worked, practice patterns
AMWAC 1999.5 2
and consultation waiting times, as well as some qualitative information; the RACP and AMWAC conducted a survey of Fellows known to practise principally in cardiology. This survey had a 51.2% response rate, and whilst it is acknowledged the response rate could have been better, the Working Party considered the respondents to be broadly representative of the workforce as a whole. The results of the survey are summarised in Appendix B. 2. Cardiac Society for Australia and New Zealand (CSANZ) The CSANZ also keeps a variety of data, principally on number of members and training posts and age and gender information of both members and trainees. 3. Australian Institute of Health and Welfare (AIHW) National Medical Labour Force
Survey The AIHW annual Medical Labour Force Survey presents national labour force statistics for registered medical practitioners, principally through a survey collected as part of the annual renewal of registration. The survey data used in this report is for 1997. 4. Department of Health and Aged Care (DHAC) Medicare provider database Medicare provider statistics define medical practitioners according to the predominant services billed to Medicare. The Medicare statistics include all practitioners who have billed Medicare for at least one cardiology service during a financial year. The major deficiency with the use of Medicare data for workforce planning purposes is that it does not provide data on practitioners who are salaried cardiology specialists/sub-specialists in the public hospital system and who do not render services on a fee for service basis. Medicare data thus excludes services rendered free of charge to public hospital patients, to Veterans' Affairs patients and to compensation cases. 5. National Hospital Morbidity Data The AIHW National Hospital Morbidity database (ICD-9-CM groupings) has been used as a key source of data on service trends. The data is sourced from the AIHW Australian hospital morbidity database for all patients in public and private hospitals in Australia from 1993-94 to 1996-97 and is the best measure to date. The data has been particularly useful in projecting cardiology service trends. The data for cardiology is quite lengthy and so has not been attached as an appendix to this report but is available on request from AMWAC. 6. Australian Bureau of Statistics

AMWAC 1999.5 3
The Australian Bureau of Statistics (ABS) population data and projections are used as the sole source on population data. In making its population projections ABS uses four different series. The population projections in this report are based on Series A/B, where constant fertility and low overseas migration are assumed (ABS 1998). Generally throughout the report the population data used is for the population over 25 years unless otherwise stated. 7. Rural, Remote and Metropolitan Areas classification Wherever possible, distributional data has been interpreted using the rural, remote and metropolitan areas classification (RRMA) developed by the Commonwealth Departments of Health and Family Services and Primary Industries and Energy (DPIE & DHSH 1994). A summary of the RRMA classification is provided in Appendix A: Rural, Remote and Metropolitan Areas Classification. Key Assumptions The Working Party emphasises that the projections on supply and requirements are based on the existing national health structure. If there is a change to the national health structure the Working Party recommends the supply requirements and projections be reviewed. In conducting the projection analysis, the Working Party has assumed that the current length of the cardiology training program will remain unchanged and that the majority of candidates will complete the program within this time frame. In addition, the Working Party has assumed that the pattern of workforce participation and service delivery of the current workforce provides a suitable basis on which to project future workforce requirements. These assumptions are necessary in the absence of any definitive data to the contrary. However, several different scenarios have been included in the projection analysis to indicate the likely outcome if these assumptions prove not to hold true. It should also be noted that AMWAC favours, as a general course of action, adjustment to trainee intake as the best long term solution to any anticipated imbalances between expected supply and estimated requirements. Hence the conclusions and recommendations are framed in this context.

AMWAC 1999.5 4
SUMMARY OF FINDINGS AND RECOMMENDATIONS This report describes the current specialist cardiology workforce, assesses the adequacy of that workforce, and projects cardiology workforce supply and requirements to the year 2009. The report concludes that the workforce is meeting current requirements and that no significant change is required in the number of trainees currently entering the advanced cardiology training program. Accordingly, it is recommended that first year advanced cardiology training numbers be maintained within the range of 24 to 28 per year for the period up to 2003. To put this in context, there were 25 first year advanced cardiology trainees in 1997 and 24 in 1998. Cardiology requirements have been estimated to increase by an average of 2.8% per annum; although with the ageing of the population, and the number of people aged over 45 years being the predominant users of cardiology services, there is the possibility that the actual requirements trend may prove to be higher. On the supply side, the cardiology workforce is dominated by two key characteristics: the age gender breakdown and the hours worked. The cardiology workforce is a comparatively young workforce of predominantly males; 65.8% (404) of the workforce aged under 50 years, only 8.3% (51) of the workforce aged over 60 years, and women comprise only 6.5% of the current workforce and 10.2% of trainees. The workforce is also characterised by comparatively high average hours worked, estimated at 60 hours per week. Description of the Current Cardiology Medicine Workforce Number of Practising Specialists in Cardiology • The Working Party estimated that in 1999 the current size of the practising
cardiology workforce is 614. Of the 614 there are 46 who are not Fellows of the RACP but who are practising cardiology and are members of the CSANZ.
Distribution • The national specialist cardiologists to population ratio (SPR) is 1:19,454.
Comparison of State/Territory SPRs shows that the Australian Capital Territory, New South Wales and Victoria, are marginally more generously populated with cardiologists than the national average. Queensland, South Australia and Tasmania fall a little below the average in their cardiologists and the Northern Territory and Western Australia have the lowest SPR.
• All urban populations have the appropriate SPR. However, for all rural populations
there is an undersupply of cardiologists, which appears to be most marked in South Australia and Western Australia.

AMWAC 1999.5 5
• Overall, it is estimated that in 1998, 81.3% of cardiologists had their primary practice in a capital city (62.8% of the total population), 7.0% in metropolitan areas (7.6% of the total population) and the remaining 11.7% in rural and remote areas (29.6% of the total population).
• The majority of the workforce is located in New South Wales (40.9%) and Victoria
(26.7%). Gender Profile • In 1998, women comprised 6.5% of the workforce. This compares to women
comprising 14.0% of the specialist workforce as a whole. Age Profile • The RACP and CSANZ data indicated that the average age of cardiology specialists
was 47.4 years in 1998. • This workforce has a young age profile compared to other specialist workforces, with
65.8% (404) aged under 50 years and only 8.3% aged 60 years and over. • 90% of the female cardiology workforce are aged under 50 years, compared to 64%
of males. • The largest five year age groups were the 36 to 40 year age group (17.6%) and the
under 35 years (17.3%) • The State/Territory with the highest proportion of those aged over 60 years is New
South Wales (45.1%, 23) followed by Victoria (25.5%, 13). The State/Territory with the highest proportion aged under 50 years is Queensland representing 78.4% (76).
Hours Worked • On average, the total full time cardiology workforce worked an estimated 60.5 hours
per week in 1998 (mode 60 hours; standard deviation 11.2), 60.6 hours for males and 56.9 hours for females. Those cardiologists under 55 years of age averaged around 60.2 hours per week; this declined to 59.9 hours for 56 to 65 years olds and 36.3 hours for 66 to 70 year olds.
• It is estimated that specialist cardiologists worked a total of 1,708,762 hours in 1998.
This equates to 9,222 hours per 100,000 population. The provision of hours worked per 100,000 population is noticeably above the average for the Australian Capital Territory because of its higher local and regional catchment population and significantly below the average for the Northern Territory.
• 77.9% of cardiologists reported being on call for after hours work. The number of
hours on call rose with distance away from a metropolitan area, with other rural area cardiologists reporting 5.3 hours on call compared to 4.3 hours for those working in

AMWAC 1999.5 6
capital cities. • The average hours worked varied by region with the average hours worked in major
urban areas at 60.4 hours a week compared to 63.3 hours a week in other rural areas.
• There was no significant difference in hours worked by full time adult and paediatric
cardiologists. Adult cardiologists worked 60.5 hours per week, of which 4.2 hours were on call worked. Paediatric cardiologists worked 59.4 hours per week, with 6.5 hours worked on call per week.
Training Arrangements • In December 1998 there were 49 advanced trainees in cardiology in years 1 and 2,
with women representing 10.2% of current trainees. • The bulk of the advanced trainees are located in New South Wales (19/38.8%) and
Victoria (14/28.6%). • The 1998 third year trainees have been incorporated into the current 1999
workforce, as the RACP has indicated that they graduated in December 1998. There were 21 graduates for 1998 (13 males and 8 females).
• There has been a 33.9% increase in the number of trainees during the period 1993
to 1997. Female trainees increased by 175% during the same period. Services Provided • Cardiology services in Australia are provided through Medicare and other insurance
arrangements in fee for service practice and through the government funded public hospital system.
• It is important to note that there are data limitations in determining the number of
services provided by specialists in cardiology. This is due in part to the substitution of services by other providers, particularly GPs and other specialists with an interest in cardiology and in this respect there is no definitive national data set available to separate the number of services contributed by each provider. In addition, Medicare data only covers private practice billing activity, that is, Medicare data largely omits cardiology service provision to inpatients and outpatients treated in public hospitals.
• For the period 1994-95 to 1996-97, the number of hospital inpatients with a principal
diagnosis of a cardiac disease increased from 247,987 to 267,280 or 3.9% per annum and of these, those who would have been treated mainly by a cardiologist increased from 165,578 to 184,794 or 5.6% per annum.
• The bulk of cardiology related diagnoses (92%) and procedures (87%) relate to
people aged 45 years and over.
AMWAC 1999.5 7
• Cardiology related procedures per 100,000 population were highest in the States
with relatively older populations - South Australia (2,951), Tasmania (2,957) and Victoria (2,923). The Territories, which have the youngest populations, have the lowest rates (Northern Territory 862 and Australian Capital Territory 1,791).
• Generally, the cardiology related procedure rates were high in urban areas and low
in remote areas, although in Queensland the rate in remote centres (2,905 per 100,000 population) was higher than all other areas of that State.
• Cardiology related diagnoses per 100,000 population were highest in the States with
relatively older populations - South Australia (11,689), New South Wales (11,017) and Victoria (10,184). The Territories, which have the youngest populations, have the lowest rates (Northern Territory 4,209 and Australian Capital Territory 4,948).
• The top 20 Medicare services provided by cardiologists over the period 1992-93 to
1997-98 increased by 47.5% or 8.1% per annum. In the same period the number of cardiologists increased by 34.5% or 6.2% per annum.
• Of the Medicare items, the two items that the Working Party believed reflected the
demand for cardiology services were 110 and 116. Item number 110 - consultant physician referred consultation - surgery, hospital or nursing home (initial attendance in a single course of treatment) increased by 35.5% or 6.3% per annum in the period 1992-93 to 1997-98.
• The combined consultation trend for item numbers 110 and 116 indicates an
increase of 41.3% or 7.1% per annum in the period 1992-93 to 1997-98. This level of service growth is similar to the growth in the top 20 items.
• Medicare services per cardiologist have grown by 1.8% in the period 1986-87 to
1997-98. • The Medicare data also highlights a change in practice patterns between 1986-87
and 1997-98, with a sharp rise in the proportion of patient services undertaken as repeat services. In 1986-87, only one third of consulting room services were repeat patients. By 1997-98, this had risen to two thirds.
• One of the features of cardiology is the scope for non-specialist providers to provide
at least some of the services. There are no definitive data sources that enable the level of substitution to be assessed. However Medicare data does provide an indication of the number of services provided by specialists and non specialists. This data shows that there is a predominant role taken by other specialists and GPs in providing cardiology services in some of the less populous States/Territories, much of which is likely to be in provincial and rural/remote areas.

AMWAC 1999.5 8
Adequacy of the Current Cardiology Workforce Overall, the Working Party concluded that the current workforce is adequately meeting requirements. Specialists to Population Ratio • The Working Party concluded, after examination of the available literature, that no
clear-cut SPR benchmark for cardiology has been defined. The Working Party believes that the value of the cardiology SPRs lies in their use as tools of comparison between States/Territories and for comparisons over time.
• The SPR data showed that the urban areas of most States/Territories are currently
well supplied with cardiology specialists, with the exception of the Northern Territory and Western Australia. In rural areas South Australia and Western Australia remain below the national rural SPR.
• There may be a distributional shortage of cardiologists as there is a significantly
lower provision in Western Australia and the Northern Territory and a significantly lower coverage of the rural population receiving specialists cardiology services.
Sustainable Cardiology Practice • The total population catchment required for a viable full time specialist service in
cardiology in an urban practice is 40,000 to 60,000. A similar population catchment is necessary for a rural practice. This population catchment range should be regarded as a minimum, without which cardiology practice is probably not sustainable on a full time basis.
Public Hospital Vacancies • The 1997 AMWAC public hospital vacancy survey recorded nine cardiology
vacancies, which represents just 1.5% of the total workforce. Waiting Times • The average waiting time for a standard first consultation with a specialist in adult
cardiology in his/her rooms is 18.3 days (mode 14, standard deviation 15.2) while hospital outpatients wait twice as long, an average of 35.7 days (mode 28, standard deviation 28.8). These waiting times are not benchmarks but are self reported.
• The average consultation waiting time for a clinically urgent condition with a
specialist in adult cardiology in his/her rooms is 2.4 days (mode 1, standard deviation 3.1) while hospital outpatients wait longer, an average of 7.7 days (mode 7, standard deviation 12.4).
Projections of Requirements Population • Australia has a growing and an ageing population. The age structure of the
population will change noticeably by 2051 with a heavier concentration in the ages

AMWAC 1999.5 9
50 years and over. • The structure of the population aged 15 to 64 years is projected to change
considerably, with the greatest growth occurring in the population aged 45 to 64 years. This age group is projected to rise from 4.0 million in 1997 to between 6.1 million and 6.5 million in 2051.
• Over the period, 1997-2011, ABS has projected population growth for over 45 years
to be 2.6% per annum, 45 to 64 years 2.8% per annum and over 65 years 2.3% per annum.
• Given that the bulk of cardiology services are provided to people in the older age
groups, these population growth rates would suggest that on population and ageing trends alone the demand for cardiology services over the next decade will increase.
Cardiovascular Health • Cardiovascular disease is a major health and economic burden for Australia. The
risk of developing the disease is associated with factors such as smoking, high blood cholesterol, high blood pressure, physical inactivity, obesity and excess alcohol use.
• Heart, stroke and vascular disease are the leading causes of death among
Australians, accounting for 53,989 deaths (26,559 males; 27,439 females) or 42% of all deaths in 1996. Although death rates from heart, stroke and vascular disease are a much smaller proportion of all deaths among males (39%) than among females (45%), males are more likely to die prematurely from heart, stroke and vascular disease. The male death rates are higher in most age groups, but the differential between the sexes declines with increasing age.
• Cardiovascular mortality and morbidity is also higher and more problematic among
Indigenous Australians, in remote areas of the country and among socio-economically disadvantaged groups. Indigenous people suffer extremely high heart, stroke and vascular disease rates, at approximately twice the rate of the total Australian population.

AMWAC 1999.5 10
ABS National Health Survey 1995 • In 1995, an estimated 2.8 million people or 16% of the population reported
experiencing a recent and/or long-term cardiovascular condition. Hypertension was the most common cardiovascular condition, reported by 10% males and 11% of females. A comparison of the 1989-90 and 1995 National Health Surveys suggests an overall increase in the prevalence of cardiovascular conditions.
Future Trends in Cardiology Procedures and Diagnoses • Cardiology related diagnoses are projected to increase between 1998 and 2008 by
27.1% for males or by 2.6% per annum compared to a 10.2% male population increase in the same period. For females the population is projected to increase by 10.5% between 1998 and 2008, with cardiology related diagnoses projected to increase by 22.6% or by 2.3% per annum.
• Cardiology related procedures for males are projected to increase by 25% or by
2.5% per annum during the period 1998 and 2008. For females, cardiology related procedures are projected to increase by 21.6% or by 2.2% per annum.
• The projections suggest that in general the demand for cardiology services over the
next 20 years will increase. The data also shows that the bulk of cardiology diagnoses and procedures relate to people aged 45 years and over. Cardiology diagnoses and procedures are projected to increase most in the 55 years and over age groupings.
Summary of Projected Requirements • In summary, services trends and forecasts indicate that:
- cardiovascular mortality continues to decline among both males and females;
- there has been an overall increase in the prevalence of cardiovascular conditions;
- cardiology patients are predominantly post-middle age and this age group is increasing 2.5 times faster than the growth of the total population;
- Australia has a growing and an ageing population and the age structure of the population will change noticeably by 2051 with a heavier concentration in the ages 50 years and over;
- the projected increases in the National Hospital Morbidity Data (ICD-9-CM) for cardiology related procedures and diagnoses reflect a growth of 2.2% to 2.6% per annum growth in cardiology services;
- projections on cardiology diagnoses and procedures based on the national hospital morbidity data (ICD-9-CM) and population growth, suggest that in general the demand for cardiology over the next 20 years will increase with the bulk of cardiology related diagnoses and procedures relating to people aged 45 years and over, with the largest projected increases expected for the age groups 45 to 64 years and 65 years and over.

AMWAC 1999.5 11
• In addition, with the advance of new medical technology there will probably be development of the specialty to provide broader and more sophisticated services.
• Therefore future demand for cardiology services needs to be assessed against a
balance between continuing decline in cardiovascular disease and relatively rapid growth in the numbers of people in age groups most likely to experience this disease.
Projections of Supply • The average number of new Fellows trained in cardiology admitted to the Royal
Australasian College of Physicians over the last four years has been 25. The RACP has indicated that there were 21 graduates in 1998. In 1999 it is expected that there will be 25 graduates and 24 graduates in 2000.
• The average expected age of retirement is 64.8 years. • If the retirement age to the total workforce is extrapolated, it is estimated that in the
next five years (by 2003), 51 specialists (8.3%) will have retired from the workforce. By the year 2008, it is estimated that 80 (13%) cardiologists will have retired from the workforce.
• It is expected that the proportion of women in the workforce will increase; given the
continuing increase in the number of female trainees. Women represent 6.5% of the current total workforce, but 10.2% of trainees. Since 1993 there has been a 175% increase in female trainees. In addition, of the 210 specialists aged 50 years and over, only four are female.
• The expected lifetime hours worked by a female cardiology specialist is estimated at
74.1% of that of a male. In conducting the projection analysis, the expected supply has been adjusted to account for increasing female participation and for the expected lower lifetime workforce contribution.
Balancing Supply Against Requirements • The Working Party assessed various indicators of future cardiology requirements.
These included: population growth; trends in cardiology related procedures and diagnoses using National Hospital Morbidity Data (ICD-9-CM) and population growth, and Medicare services.
• These indicators show an average growth of around 2.8% per annum and this
estimate has been used in the projection analysis. • Balancing the requirement growth indicators are several key supply characteristics,
particularly the fact that two thirds (65.8%) of the current workforce are aged 50 years and under and that women represent only 6.5% of the workforce and only 10.2% of current trainees.

AMWAC 1999.5 12
• Advanced trainee intakes of 20, 22, 24, 26 and 28 per year were examined and all
were found to meet the projected requirements of 2.8% growth per annum with no significant notional shortages anticipated to develop in the workforce over the ten year projection period.
• The Working Party concluded that a balance in supply to match a continued growth
rate in the requirement indicators of 2.8% per annum can be achieved by ensuring that the number of graduates in the advanced training three year program, is maintained at around 24 per year to 2005.
• However, the Working Party recommended that as a guide first year advanced
cardiology training placements be maintained in the range of 24 to 28 per year to the year 2003. This flexible approach to trainee intake recognises that the RACP has a non interventional approach to the regulation of training numbers; and also reflects concerns within the Working Party about the impact on the workforce of:
- any trend towards lower average hours worked per week; - a more dramatic increase in female participation than currently expected;
and - an increase in cardiology requirements above the expected growth of
2.8% per annum. • In addition, the projection analysis assumes that the length of the RACP advanced
training program will continue to be three years and that all candidates will complete the program within this time frame. This assumption has been necessary in the absence of detailed data on average training program completion times, although there is some evidence that only about half of advanced trainees complete the training program in the minimum three years.
• Given the sensitivity of the assumptions in the projection modelling, the Working
Party also considers it important that cardiology requirements and supply projections be monitored regularly so that they can be amended if new trends emerge. The Working Party recommends that an update of this review of the cardiology workforce be undertaken in 2003.
• The geographic maldistribution of the workforce was also of concern to the Working
Party. It is recognised that at present many provincial/rural centres do not have the appropriate infrastructure to address the maldistribution concerns, however it would seem useful if State/Territory health departments, the RACP and the CSANZ could work together to consider innovative solutions that may help reduce the maldistribution within the workforce. In this respect one useful avenue may be through the RACPs Rural Workforce Advanced Training Program.
RECOMMENDATIONS

AMWAC 1999.5 13
The following recommendations should be considered the minimum outcome for the workforce. The Working Party considers this to be important given the potential impact on the workforce of: - any trend towards lower average hours worked below 60 per week; - a more dramatic increase in female participation than anticipated; and - an increase in cardiology requirements above the expected growth of 2.8% per
annum assumed in the modelling. It also recognises that the current intake of trainees into the workforce appears to match projected needs and is consistent with the non interventional approach of the Royal Australasian College of Physicians (RACP) towards regulation of the workforce through training numbers. The Working Party recommends: 1. That the RACP, in consultation with State/Territory health departments, maintain
its current flexible approach to cardiology trainee intake, ensuring as a guide first year advanced trainee placements are in the range of 24 to 28 per year to the year 2003. (There were 25 first year advanced cardiology trainees in 1997 and 24 in 1998)
The aim of maintaining first year advanced trainee numbers within this range is to match workforce supply with an expected future growth in cardiology requirements of 2.8% per annum.
2. That if necessary, the co-ordination of these cardiology trainee placements be
overseen by State/Territory based cardiology working groups, comprising representatives from the RACP, the Cardiac Society of Australia and New Zealand and State/Territory health departments.
3. That cardiology requirements and supply projections be monitored regularly so
they can be amended if new trends emerge, this monitoring be coordinated by RACP and AMWAC and the results incorporated into the AMWAC annual report to AHMAC. AMWAC will provide all necessary support.
Aspects of the workforce expected to require monitoring include the age and gender profile, distribution, hours worked, services provided (especially initial referred consultations), incidence of cardiac disease, evidence of unmet demand, and general practitioner views on the adequacy of the workforce.
4. That a full update of this review of the cardiology workforce be undertaken in 2003.
AMWAC 1999.5
14
DESCRIPTION OF THE CURRENT CARDIOLOGY WORKFORCE As discussed in the introduction, there are a variety of data sources on the numbers, attributes and distribution of cardiology specialists in Australia. While each of these data collections has some deficiencies, it is possible to piece together a reasonably accurate and up-to-date profile of the workforce. In establishing the profile of the current cardiology workforce the Working Party defined: • the number of practising cardiology specialists; • their distribution by State/Territory and geographic location; • the age and gender profiles of the workforce; • the hours worked; and • the services provided. The Number of Practising Cardiology Specialists in Australia The data sources used are the records of the RACP, CSANZ and the AIHW medical labour force survey. The Working Party estimated that in 1999 the current size of the practising cardiology workforce is 614. Of the 614 practising cardiology specialists, there are 46 who are not Fellows of the RACP (FRACP) but who are practising cardiology and are members of the CSANZ. In addition, of the FRACP practising in cardiology, 543 practise in adult cardiology and 25 practise in paediatric cardiology. The 1997 AIHW Medical Labour Force Survey identified 612 specialist with a qualification in cardiology, but only 551 specialists whose main specialty of practice is cardiology. The AIHW survey provides information on practitioners who report that they were specialists with a principal qualification in cardiology and that they conducted direct patient care in this area. The Working Party considers that the RACP data best reflect the total effective adult and paediatric cardiology workforce. The RACP data is summarised in Table 1.

AMWAC 1999.5
15
Table 1: Cardiology specialists, by State/Territory and gender, 1999 State/Terr.
NSW
Vic
Qld
WA
SA
Tas
NT
ACT
Aust
Total cardiology workforce
Males
222
151
89
38
44
14
2
14
574
Females
13
13
8
1
3
0
0
2
40
Total
235 164
97
39
47
14
2
16
614 % Female
5.5
7.9
8.2
2.6
6.4
0.0
0.0
12.5
6.5
Adult cardiologists
Males
204
135
77
30
39
12
0
13
510
Females
11
11
5
1
3
0
0
2
33
Total
215
146
82
31
42
12
0
15
543
% Female
5.1
7.5
6.1
3.2
7.1
0.0
0.0
13.3
6.1
Paediatric cardiologists
Males
4
8
4
4
2
0
2
0
24
Females
0
0
1
0
0
0
0
0
1
Total
4
8
5
4
2
0
2
0
25
% Female
0.0
0.0
20.0
0.0
0.0
0.0
0.0
0.0
4.0
Non-FRACP cardiologists
Males
14
8
9
4
3
2
0
1
41
Females
2
2
1
0
0
0
0
0
5
Total
16
10
10
4
3
2
0
1
46
% Female
12.5
20.0
10.0
0.0
0.0
0.0
0.0
0.0
10.9
Source: RACP and CSANZ 1999 Growth in the Cardiology Medicine Workforce Some idea of the growth in the cardiology medicine workforce nationally and across States and Territories can be gained from Table 2, using Medicare data. Medicare data do not reveal the complete workforce, but the inclusion criteria are constant and therefore provide an indication of the magnitude of the growth in the workforce. Since 1991-92 the cardiology workforce has increased by 32.3%. Total population growth during this same period was 5.9%. In most States the growth in the workforce has exceeded population growth over the past few years; the largest increase in the number of cardiologists has been in Queensland (68.1%).

AMWAC 1999.5
16
Table 2: Cardiologists (Medicare data), by State/Territory, 1991-92 and 1995-96 Year
NSW
Vic
Qld
WA
SA
Tas
NT
ACT
Aust
1991-92
152
94
47
30
35
10
2
10
378
1995-96
193
129
79
31
44
12
2
10
500
% increase
26.9
37.2
68.1
3.3
31.4
20.0
0.0
0.0
32.3
% total pop change
5.2
3.4
12.3
8.5
1.6
0.8
11.3
5.1
5.9
Source: DHAC and ABS Distribution of the Cardiology Workforce The number of cardiology specialists by State/Territory is shown in Table 3, using the three main data sources (RACP, AIHW and Medicare). The AIHW 1997 data indicated 612 specialists with a qualification in cardiology, but only 551 specialists whose main specialty of practice is cardiology and this latter figure is presented in Table 3. Comparison of State/Territory specialist cardiologists to population ratios (SPRs) for the three data sets shows that the Australian Capital Territory, New South Wales and Victoria are marginally more generously populated with cardiologists than the national average. Queensland and Tasmania are a little below the national average and the SPR in the Northern Territory and Western Australia are noticeably below the national average. Table 4 shows the distribution of cardiologists by geographic location using 1999 RACP data. Overall, 81.3% of cardiologists had their primary practice in a capital city (62.8% of the total population), 7.0% in metropolitan areas (7.6% of the total population) and the remaining 11.7% in rural and remote areas (29.6% of the total population). By way of comparison the AIHW medical labour force survey found that in 1997, 92.6% (430) of cardiologists were located in a capital city or other metropolitan urban area.

AMWAC 1999.5
17
Table 3: Cardiology specialists to population and cardiologists per 100,000 population (RACP, Medicare and AIHW data), by State/Territory, selected years 1996 and 1999a
State/Terr.
Number of
Cardiologists
% of total
cardiologists
% Australian
population over 25 years
SPR (1:)
Cardiologists
per 100,000 population
RACP 1999
NSW
235
38.3
33.9
17,357
5.8
Victoria
164
26.7
24.9
18,287
5.5
Queensland
97
15.8
18.5
22,175
4.5
West Aust.
39
6.4
9.7
29,121
3.4
South Aust.
47
7.7
8.0
20,866
4.8
Tasmania
14
2.3
2.4
21,714
4.6
ACT
16
2.6
1.6
11,850
8.4
North. Terr.
2
0.3
0.9
52,800
1.9
Australia
614
100.0
100.0
19,454
5.1
Medicare 1995-96
NSW
193
38.6
34.0
20,761
4.8
Victoria
129
25.8
24.6
22,871
4.4
Queensland
79
15.8
18.5
26,520
3.8
West Aust.
31
6.2
9.5
35,719
2.8
South Aust.
44
8.8
8.2
22,078
4.5
Tasmania
12
2.4
2.6
25,169
4.0
ACT
10
2.0
1.6
18,685
5.4
North Terr.
2
0.4
1.0
50,889
2.0
Australia
500
100.0
100.0
23,447
4.3
AIHW 1997
NSW
246
44.6
34.1
16,581
6.0
Victoria
137
24.9
26.3
21,891
4.6
Queensland
74
13.4
18.0
29,068
3.4
West Aust.
30
5.4
9.5
37,857
2.6
South Aust.
44
8.0
8.2
22,289
4.5
Tasmania
14
2.5
2.5
21,714
4.6
ACT
6
1.1
1.6
31,600
3.2
North Terr.
0
0.0
0.9
0
0.0
Australia
551
100.0
100.0
21,678
4.6
a- the population figures used are for 1997 and 1995-96 Source: RACP, CSANZ, AIHW, DHAC and ABS Table 4: Distribution of cardiology specialists (RACP data), by State/Territory and geographic
AMWAC 1999.5
18
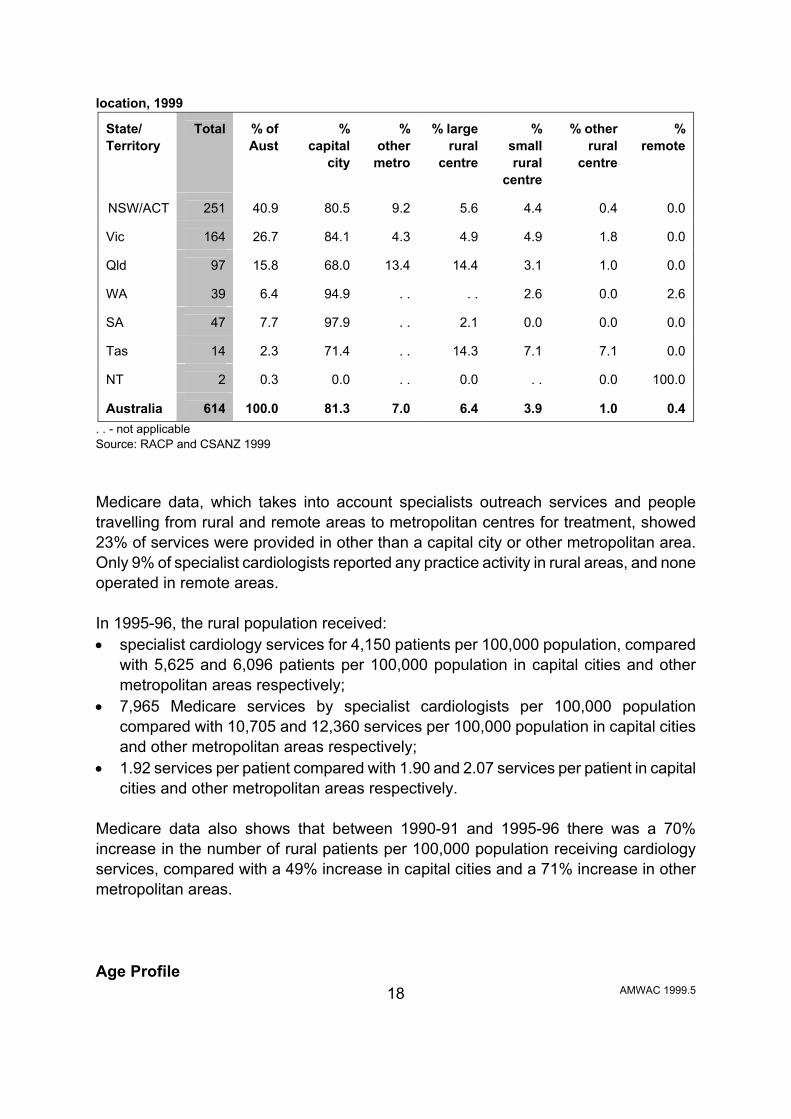
location, 1999 State/ Territory
Total
% of Aust
%
capital city
%
other metro
% large
rural centre
%
small rural
centre
% other
rural centre
%
remote
NSW/ACT
251
40.9
80.5
9.2
5.6
4.4
0.4
0.0
Vic
164
26.7
84.1
4.3
4.9
4.9
1.8
0.0
Qld
97
15.8
68.0
13.4
14.4
3.1
1.0
0.0
WA
39
6.4
94.9
. .
. .
2.6
0.0
2.6
SA
47
7.7
97.9
. .
2.1
0.0
0.0
0.0
Tas
14
2.3
71.4
. .
14.3
7.1
7.1
0.0
NT
2
0.3
0.0
. .
0.0
. .
0.0
100.0
Australia
614
100.0
81.3
7.0
6.4
3.9
1.0
0.4
. . - not applicable Source: RACP and CSANZ 1999 Medicare data, which takes into account specialists outreach services and people travelling from rural and remote areas to metropolitan centres for treatment, showed 23% of services were provided in other than a capital city or other metropolitan area. Only 9% of specialist cardiologists reported any practice activity in rural areas, and none operated in remote areas. In 1995-96, the rural population received: • specialist cardiology services for 4,150 patients per 100,000 population, compared
with 5,625 and 6,096 patients per 100,000 population in capital cities and other metropolitan areas respectively;
• 7,965 Medicare services by specialist cardiologists per 100,000 population compared with 10,705 and 12,360 services per 100,000 population in capital cities and other metropolitan areas respectively;
• 1.92 services per patient compared with 1.90 and 2.07 services per patient in capital cities and other metropolitan areas respectively.
Medicare data also shows that between 1990-91 and 1995-96 there was a 70% increase in the number of rural patients per 100,000 population receiving cardiology services, compared with a 49% increase in capital cities and a 71% increase in other metropolitan areas. Age Profile

AMWAC 1999.5
19
The RACP and CSANZ data indicated that the average age of the total cardiology workforce was 47.4 years in 1999 (the mean for females was 41 years and males 47 years), with the youngest specialist aged 31 years and the oldest 69 years. This workforce has a youngish age profile with two-thirds of the workforce, 65.8% (404), aged under 50 years and only 17.4% (107) aged 55 years and over. The largest five year age groups were the 36 to 40 year age group (17.5%) and the 35 years and under (17.3%). 2.6% (16) of the workforce were aged over 65 years of age. The RACP and CSANZ data indicated that the average age of adult cardiology specialist consultants was 47.8 years and the average age of paediatric cardiology specialist consultants was 45.4 years. The States with the highest proportion of the workforce aged over 50 years were Tasmania (57.1%, 8), Victoria (39.6%, 65) and New South Wales (34.9%, 82). The State/Territory with the highest proportion aged under 50 years was Queensland (78.4%, 76). Table 5: Age profile of the cardiology workforce, by State/Territory and major age category, 1999
State/Terr
Gender
NSW
Vic
Qld
SA
WA
Tas
ACT
NT
Aust
under 50 years
M
141
88
69
29
27
6
6
2
368
F
12
11
7
3
1
0
2
0
36
51- 60 years
M
58
51
15
13
7
6
6
0
156
F
1
1
1
0
0
0
0
0
3
over 60 years
M
23
12
5
2
4
2
2
0
50
F
0
1
0
0
0
0
0
0
1
Total
235
164
97
47
39
14
16
2
614
Source: RACP 1999

AMWAC 1999.5
20
Table 6: Age profile of the cardiology workforce, by State/Territory and gender, 1999a State/Territory
Gender
under 35 yrs
36-40
yrs
41-45
yrs
46-50
yrs
51-55
yrs
56-60
yrs
61-65
yrs
65
yrs +
Total
NSW
M
32
32
35
42
39
19
15
8
222
F
6
4
1
1
1
0
0
0
13 Victoria
M
16
34
19
19
32
19
7
6
151
F
6
2
3
0
1
1
0
0
13
Queensland M
17
21
18
13
10
5
4
1
89
F
5
2
0
0
1
0
0
0
8
South Australia M
10
6
7
6
7
6
1
1
44
F
2
0
1
0
0
0
0
0
3 Western Australia
M
6
6
7
8
2
5
4
0
38
F
0
0
1
0
0
0
0
0
1 Tasmania
M
3
1
1
1
6
0
2
0
14
F
0
0
0
0
0
0
0
0
0
Northern Territory M
0
0
2
0
0
0
0
0
2
F
0
0
0
0
0
0
0
0
0
Australian Capital Terr. M
2
0
1
3
4
2
1
1
14
F
1
0
1
0
0
0
0
0
2
Australia M
86
100
90
92
100
56
34
17
574
F
20
8
7
1
3
1
0
0
40
Total
106
108
97
93
103
57
34
17
614 % of females
18.9
7.4
7.2
1.1
2.9
1.8
0.0
0.0
6.5
a - The age profile of the total cardiology workforce has been presented as the differentiation between adult and cardiology age profiles will hinder confidentiality. Source: RACP and CSANZ 1999 Gender Profile Women make up 6.5% (40) of the workforce. This compares to women comprising 14.0% of all specialists. The largest proportion of female cardiology specialists is in the under 35 years age group (50%). Table 5 shows that 90% of the female cardiology workforce is aged under 50 years, and that most female specialists are located in New South Wales and Victoria. Hours Worked The 1998 AMWAC/RACP survey of specialists cardiologists found that on average, the total full time cardiology workforce worked 60.5 hours per week (mode 60 hours; standard deviation 11.2). There was no significant difference in hours worked by full time adult and paediatric cardiologists. Adult cardiologists worked 60.5 hours per week (mode 60; standard deviation 11.2), and 4.2 hours worked on call back per week (mode 2; standard

AMWAC 1999.5
21
deviation 8.9). Paediatric cardiologists worked 59.4 hours per week (mode 60; standard deviation 11.5), and 6.5 hours worked on call back per week (mode 5; standard deviation 5.2). In the following tables the total cardiology workforce is examined. Table 7: Cardiology specialists average hours provided per week, annual labour supply hours and hours worked per 100,000 population in cardiology, hours on call back worked and hours on call not worked, by State/Territory, 1998 State/Terr.
NSW
Vic
Qld
SA
WA
Tas
ACT
NT
Total
Total hours worked
Average
60.8
62.3
59.2
59.1
57.8
58.6
60.0
60.5
60.5
(hours >000)*
657.2
469.9
264.1
127.7
103.7
37.7
44.2
5.6
1,708.8
Hours worked per 100,000 population
10,475.0
10,205.9
7,766.4
8,634.6
5,767.8
7,970.1
14,254.4
2,974.9
9,222.1
Hours on call back worked
Average
3.3
2.9
7.1
6.5
3.6
6.8
3.3
4.3
4.3
(hours >000)*
35.6
21.9
31.7
14.0
6.5
4.4
2.4
0.4
121.4
Hours worked per 100,000 population
568.5
475.1
931.4
949.7
359.2
924.9
783.9
211.4
655.5
Hours on call not worked
Average
28.4
38.1
38.9
47.3
24.9
35.3
86.0
35.1
35.1
(hours >000)*
307.0
287.4
173.6
102.3
44.7
22.7
63.3
3.2
991.4
Hours worked per 100,000 population
4892.9
6241.5
5103.3
6910.6
2484.3
4801.1
20431.2
1725.9
5350.3
Pop (>000)
6274.4
4605.1
3401.2
1479.8
1798.1
473.5
309.8
187.1
18529.2
*Calculated as average weekly hours multiplied by persons multiplied by 46 weeks per year Source: AMWAC/RACP Survey 1998 and ABS It is estimated that specialist cardiologists worked a total of 1,708,762 hours in 1998. This equates to 9,222 hours per 100,000 population, with the provision of hours worked per 100,000 population significantly above the average for the Australian Capital Territory because of its higher local and regional catchment population and higher workforce provision, and below the average with 2,975 for the Northern Territory. 77.9% of cardiologists reported being on call for after hours work. The number of hours on call back rose with distance away from a metropolitan area, with other rural area cardiologists reporting 5.3 hours on call back compared to 4.3 hours for those working in capital cities.

AMWAC 1999.5
22
The average hours worked varied by region with the average hours worked in major urban areas at 60.4 hours a week compared to 63.3 hours a week in other rural areas. Table 8: Cardiology specialists average working hours and average age, by region of main job, 1998
Region of main job
Capital
city
Other
metropolitan
Provincial
city
Small rural
centre
Other rural area
Total
Total hours worked
60.4
59.7
62.3
57.6
63.3
60.5
Hours on call back worked
4.3
2.6
5.7
4.0
5.3
4.3
Hours on call not worked
34.1
33.4
45.7
41.6
49.7
35.1
Per cent practitioners on call
82.6
83.3
66.7
38.5
60.0
79.9
Average age (years)
46.9
42.9
47.3
45.2
47.3
46.6
Source: AMWAC/RACP Survey, 1998 Table 9 details the average hours provided by cardiology specialists by gender and age. In 1998 cardiology specialists worked on average 60.5 hours per week, 60.6 for males and 56.9 for females. However, those under 55 years of age averaged around 60.2 hours per week; this declined to 59.9 hours for 56 to 65 years olds and 36.3 hours for 66 to 70 year olds. Based on 1997 data from AIHW medical labour force survey, the total average hours per week was 53.4 hours with male cardiology specialists averaging 53.9 hours and for females 45.1 hours. Cardiology specialists worked an average of 47.4 hours per week in the direct care of patients, with male cardiology specialists averaging 47.8 hours and for females 40.5 hours. Hours on call not worked for those averaged 44 hours per week. Those under 55 years of age averaged 56.7 hours per week; this declined to 55.4 hours for 55 to 64 year olds and 31.1 hours for 65 to 74 year olds. The highest average hours worked per week were 57.8 hours by males aged 45 to 54 years. The AIHW estimated that 104 cardiologists (18.8%) worked less than 35 hours per week, while 138 (25%) worked 65 hours per week or more. Table 9: Cardiology specialists average hours and annual hours worked, by gender and age, 1998

AMWAC 1999.5
23
Gender
<36
years
36-45 years
46-55 years
56-65 years
65
years +
Total
Total hours worked
Male
57.6
61.5
61.9
59.9
36.3
60.6
Female
58.0
55.8
57.7
-
-
56.9
Total
57.7
61.3
61.7
59.9
36.3
60.5
Annual hours worked (>000)*
281,345
578,059
556,287
250,741
26,717
1,708,762
Total hours on call back worked
Male
3.5
4.4
5.1
3.3
1.3
4.3
Female
2.5
3.8
3.7
-
-
3.4
Total
3.4
4.4
5.0
3.3
1.3
4.3
Annual hours worked (>000)*
16,578
41,492
45,080
13,814
957
121,449
* Calculated as average weekly hours multiplied by persons by 46 weeks per year. Source: AMWAC/RACP 1998 Type of Practice Respondents to the AMWAC/RACP survey were asked to indicate the proportion of time that they spent in a salaried position and in private practice. 195 (64.1%) indicated they practised in both a salaried position and in private practice. 21 (6.9%) indicated they practised 100% in a salaried position. Of these respondents 18 (85.7%) were male and 3 (14.3%) were female. The majority (70.5%, 55) were located in urban areas. 78 (25.7%) indicated they worked 100% in private practice. Of these respondents 76 (97.4%) were male and 2 (2.6%) were female. The majority (90.5%, 69) were located in urban areas. Services Provided Cardiology services in Australia are provided through Medicare and other insurance arrangements in fee for service practice and through the government funded public hospital system. Detailed service specific data on medical services which attract Medicare benefits is available from 1985. Public and private hospital casemix activity data is only available for the last few years. It is important to note that there are data limitations in determining the number of services provided by specialists in cardiology. In part this is due to the substitution of services by other providers, particularly GPs and other specialists with an interest in cardiology (see later discussion on substitution of services); and in this respect there is
AMWAC 1999.5
24
no definitive national data set available to separate the number of services contributed by each provider. In addition, Medicare data only covers private practice billing activity. It has previously been estimated that the Medicare database provides information for approximately 75% of medical services in Australia; consequently the Medicare data needs to be interpreted with this shortcoming in mind (Deeble 1991). One advantage of the Medicare data, however, is that it can be separated into services provided by specialists and those provided by non-specialists, (see Table 18). Medicare data also enables some broad conclusions to be drawn about the average number of sources being provided per provider. For hospital data, the key source is the AIHWs National Hospital Morbidity database (ICD-9-CM) for cardiology procedures and diagnosis. The collection is based on admitted patient episodes and includes data for both public and private hospitals. The Medicare and hospital morbidity databases cannot be aggregated to provide a picture of national activity because both record different sets of data. In addition, it is acknowledged that both databases have some shortcomings (as outlined in the Introduction and in Waters, Armstrong and Senes-Ferrari 1998). However, these points aside, the two databases are a useful indication of the level of cardiological activity and the trends in service provision over time (which is important for the consideration of the likely trend in requirements). National Hospital Morbidity Data For the period 1994-95 to 1996-97: • the number of hospital inpatients with a principal diagnosis of a cardiac disease
increased from 247,987 to 267,280 or 3.9% per annum (Table 10); and • of these, those who would have been treated mainly by a cardiologist increased from
165,578 to 184,794 or 5.6% per annum.

AMWAC 1999.5
25
Table 10: Separations from Australian hospitals with a principal diagnosis of cardiac disease, 1994-95 to 1996-97
Principal diagnosis
1994-95
1995-96
1996-97
% change
per annum Rhematic fever with heart involvement 142 100 115 -10.0 Rheumatic chorea 29 27 27 -3.5 Chronic rhematic pericarditis - - 3 - Diseases of mitral valve 844 710 632 -13.5 Diseases of aortic valves 156 160 143 -4.3 Diseases of mitral and aortic valves 652 627 682 627 Diseases of other endocarial structures 40 41 61 23.5 Other rhematic heart disease 112 118 104 -3.6 Essential hypertension 6,323 6,640 6,032 -2.3 Hypertensive heart disease 635 574 488 -12.3 Acute myocardial infarction 31,628 33,001 32,810 1.9 Other acute/subacute Ischaemic heart disease 36,849 51,292 55,956 23.2 Old myocardial infarction 25 22 26 2.0 Angina pactoris 19,075 34,306 37,395 40.0 Other chronic ischaemic heart disease 57,613 34,115 29,788 -28.1
Acute pulmonary heart disease 4,848 5,427 6,078 12.0 Chronic pulmonary heart disease 689 581 651 -2.8 Other diseases of pulmonary circulation 25 41 35 18.3 Acute pericarditis 846 945 869 1.4 Acute and subacute endocarditis 853 861 836 -1.0 Acute myocarditis 100 111 90 -5.1 Other diseases of pericardium 1,158 1,348 1,282 5.2 Other diseases of endocardium 6,127 6,326 6,324 1.6 Cardiomyopathy 2,390 2,502 2,267 -2.6 Conduction disorders 4,346 4,638 4,408 0.7 Cardia dysrhythmias 31,967 34,312 37,328 8.1 Heart failure 39,770 40,710 40,970 1.5 Ill-defined, complications of heart disease 745 777 703 -2.9 Total 247,987 260,312 267,280 3.8
Source: AIHW National Hospital Morbidity Database

AMWAC 1999.5
26
Table 11: Separations from Australian hospitals with principal diagnoses mainly treated by cardiologists, 1994-95 to 1996-97
Primary diagnosis
1994-95
1996-97
% change
% change
pa 4019 Essential hypertension unspecified 5,686
5,140
-9.6 -4.9
42731 Cardiac dysrhythmias/artial fibrillation 16,172
19,625
21.4 10.2
4149 Other forms of chronic ischaemic heart disaease chronic unspecified
6,879
2,707
-60.6 -37.3
4280 Heart failure: congesive heart failure
25,118
25,269
0.6 0.3
4140 Other forms of chronic ischaemic heart disease/coronary atherosclerosis of native coronary artery
43,289
24,427
-43.6 -24.9
4139 Angina pectoris 18,862 37,226 97.4 40.5
4111 Other acute and sub-acute forms of ischaemic heart disease/intermediate coronary syndrome
35,613
54,932
54.2 24.2
4281 Heart/failure: left heart failure
13,643
14,879
9.1 4.4
4011 Essential hypertension: benign
316
589
86.4 36.5
Total
165,578
184,794
11.8
5.6
Source: AIHW National Hospital Morbidity Database Table 12 shows that the main cardiology procedures increased by 53.7% during the period, 1994-95 to 1996-97 or 24.0% per annum. Table 12: Cardiology procedures performed more than 10,000 times during 1994-95 to 1996-97 Code
Procedure
1994-95
1996-97
%
change
%
pa. 8856
Coronary arteriography using two catheters
45,051
62,465
38.7
17.8
3722
Left heart cardiac catheterisation
46,497
61,504
32.3
15.0
8853
Angiocardiography of left heart structures
33,985
54,643
60.8
26.8
3893
Venous catheterisation, n.e.c.
13,841
23,959
73.1
31.6
8872
Diagnostic ultrasound of heart
15,060
23,285
54.6
24.3
3961
Extracorporeal circulation auxiliary to open heart surgery
18,936
21,161
11.8
5.7
8848
Arteriography of femoral and other lower arteries
11,829
13,126
11.0
5.3
3615
Single internal mammaryΒcoronary artery byΒpass
10,746
13,108
22.0
10.4
Total of the above cardiology procedures
195,945
273,251
39.5
18.1
All Cardiology procedures performed 1994-95 to 1996-97
322,267
495,192
53.7
24.0

AMWAC 1999.5
27
Source: AIHW National Hospital Morbidity Database Table 13: Cardiology related procedures with increases of more than 20,000 cases between 1993-94 and 1996-97 Procedure code
Procedure
Number of procedures
8853
Angiocardiography of left heart structures
32,458
3722
Left heart cardiac catheterisation
34,905
8856
Coronary arteriography using two catheters
24,773
Source: AIHW National Hospital Morbidity Database The bulk of cardiology related diagnoses (92%) and procedures (87%) relate to people aged 45 years and over. In 1996-97, over 70% of cardiology related diagnoses related to public patients, while over 60% of cardiology procedures related to public patients. Cardiology related procedures per 100,000 population were highest in the States with relatively older populations - South Australia (2,951), Tasmania (2,957) and Victoria (2,923). The Territories, which have the youngest population profiles, had the lowest rates - Northern Territory 862 and Australian Capital Territory 1,791 (Table 14). Generally, the cardiology related procedure rates were high in urban areas and low in remote areas, although in Queensland the rate in remote centres (2,905 per 100,000 population) was higher than all other areas of that State. Like cardiology procedures, cardiology related diagnosis per 100,000 population were also highest in the States with relatively older populations - South Australia (11,689), New South Wales (11,017), Victoria (10,184); and lowest in the Northern Territory (4,209) and the Australian Capital Territory (4,948) (Table 15). It is interesting to note that small rural centres in the majority of States had a higher rate of cardiology related diagnosis than other geographical locations.

AMWAC 1999.5
28
Table 14: Estimated cardiology procedures (ICD-9-CM) per 100,000 persons, by geographic location of patient, 1996Β97 Location
NSW
Vic
Qld
SA
WA
Tas
NT
ACT
Aust.
Capital city
2,855
2,897
2,726
3,160
2,277
3,774
(a)
1,783
2,787 Other metropolitan
2,798
3,307
2,788
. .
. .
. .
. .
. .
2,851
Large rural centre
2,375
2,638
2,565
2,105
. .
1,881
. .
. .
2,463
Small rural centre
2,379
3,188
2,682
2,352
2,285
2,698
. .
. .
2,614
Other rural
2,274
2,985
2,239
2,496
1,734
2,558
(a)
(b)
2,440
Large remote
. .
. .
2,905
. .
1,190
. .
(a)
. .
1,854 Other remote
2,371
1,287
2,030
1,583
1,635
1,486
(a)
. .
1,759
Total
2,718
2,923
2,616
2,951
2,140
2,947
862
1,791
2,685Notes: . . - not applicable a - procedures for which location is unknown have been proratad. Less than 3.5% of diagnoses are from unknown locations in each State/Territory except for Northern Territory which has 67.9%. Northern Territory estimates are therefore not given. b - not available because of the small population. Source: AIHW, derived from ABS population data and AIHW National Hospital Morbidity Database Table 15: Estimated cardiology diagnoses (ICD-9-CM) per 100,000 persons, by geographic location of patient, 1996Β97 Location
NSW
Vic
Qld
SA
WA
Tas
NT
ACT
Aust.
Capital city
11,192
9,456
9,631
11,787
8,559
8,830
3,511
4,926
10,002 Other metro.
10,990
10,183
8,486
. .
. .
. .
. .
. .
10,105
Large rural
10,468
11,234
10,876
13,486
. .
8,115
. .
. .
10,677 Small rural
10,960
12,821
12,839
12,196
10,594
9,810
. .
. .
11,678
Other rural
10,415
12,531
8,960
11,317
8,153
8,183
2,547
. .
10,408 Large remote
. .
. .
8,360
. .
4,787
. .
4,876
. .
6,320
Other remote
10,403
9,593
9,578
8,274
7,150
9,139
5,379
. .
8,388 Total
11,017
10,184
9,698
11,689
8,406
8,638
4,209
4,948
10,140
Notes: . . - not applicable Source: AIHW National Hospital Morbidity Database.

AMWAC 1999.5
29
Services Attracting Medicare Benefits The Working Party analysed the top 20 cardiology Medicare services for the period 1992-93 to 1997-98. These items represented 96.6% of all cardiology services attracting Medicare benefits (Table 16). Table 16 shows that the top 20 services provided by cardiologists over the period 1992-93 to 1997-98 increased by 47.5% or 8.1% per annum. In the same period the number of cardiologists increased by 34.5% or 6.2% per annum. Of the Medicare items, the two items that the Working Party believed reflected the demand for cardiology services were 110 and 116. Item number 110 - consultant physician referred consultation - surgery, hospital or nursing home (initial attendance in a single course of treatment) increased by 35.5% or 6.3% per annum in the period 1992-93 to 1997-98, Table 16. Item number 116 - consultant physician referred consultation - surgery, hospital or nursing home - (each minor attendance subsequent to the first in a single course of treatment) increased by 43.4% or 7.5% per annum in the period 1992-93 to 1997-98, Table 16. The combined consultation trend for item numbers 110 and 116 indicates an increase of 41.3% or 7.1% per annum in the period 1992-93 to 1997-98. This level of service growth is similar to the growth in the top 20 items. During the period 1992-93 to 1997-98 was a steady increase in the demand for cardiology services; however, this has been supported by a fairly similar increase in the cardiology specialist workforce during the same period. For all Medicare items numbers with 100 or more services performed by cardiologists there was a growth of 8.3% in the period 1992-93 to 1997-98 or 1.6% per annum per cardiologist. Per cardiologist, item number 110 has represented a growth of 0.7% in the period 1992-93 to 1997-98 or 0.1% per annum. Item number 116 has indicated a growth of 6.6% in the period 1992-93 to 1997-98 or 1.3% per annum per cardiologist (Table 17). The combined consultation item numbers (110 and 116) indicate a growth of 5.0% in the period 1992-93 to 1997-98 or 1.0% per annum per cardiologist.

AMWAC 1999.5
30
Table 16: Top 20 Medicare services by cardiology specialists 1992-93 to 1997-98 Item no.
Item description
1992-93
1994-95
1997-98
% annual
change 116
Consultant physician referred cons- surgery, hosp or NH-subsequent
513341
615678
736052
7.5
11700
Twelve lead electrocardiography-tracing & report
279588
311461
372381
5.9
110 Consultant physician referred cons-surgery, hosp or NH-initial
188965
226300
256023
6.3
55112
M-mode & 2 dimensional real time echocardiographic exam
52920
143128
206947
31.4
11712
Electrocardiographic monitoring
99067
125691
151253
8.8
11709 Continuous ECG monitoring (Holter)
28058
34188
39558
7.1
38218 Selective coronary arteriography, with catheterisation
25706
28782
36858
7.5
119
Consult physician referred cons- surgery, hosp or NH-subsequent
29149
28902
21584
-5.8
59912
Selective coronary arteriography
19177
20629
36470
13.7
59903 Serial angiocardiography (single plain)
6280
20186
31186
37.8
11721 Implanted Pacemaker testing-atrioventricular
1664
6792
15885
57.0
11701 ECG - 12 Lead, report
#
5815
10133
20.3*
11506 Measure respiratory function-bronchodilator
9766
9825
5820
-9.8
55102 ECG - blood flow (r((2 dim, real time, m-mode)
55707
9629
4570
-394
11718 Implanted Pacemaker testing
1317
5937
6137
36.0
55105 M-mode & 2 dimensional real time echocardiographic exam
4178
6350
4299
0.6
11702
ECG - 12 Lead, Tracing
#
2432
5884
34.2*
55201 Duplex scan, carotid vessels etc (intra thoracic etc)
3328
4804
1743
-12.1
55118 Heart, 2 dimensional real time transoesophageal exam
1134
4290
4170
29.7
105
Specialist referred consultation-surgery, hosp or NH-subsequent
2786
4010
3816
6.5
Total of above items
1322131
1614829
1950769
8.1
Total of all cardiology items
1385812
1669129
2018735
7.8
Representation of top 20 percentage
95.4
96.8
96.6
-Note: # less than 100 services, * % change 1993-94 to 1997-98 Source: DHAC

AMWAC 1999.5
31
Table 17: Medicare services per cardiologists for item numbers 110, 116, and all items with 100 or more services, 1992-93 to 1997-98 Item description
1992-93
1994-95
1997-98
% change
1992-97
% annual
change Medicare cardiology specialists
411
471
553
34.5
6.1
Referred consultation - initial (item 110)
460
480
463
0.7
0.1 Referred consultation - subsequent (item 116)
1,249
1,307
1,331
6.6
1.3
Combined consultations
1,708
1,788
1,794
5.0
1.0 All Medicare cardiologist services
3,372
3,544
3,651
8.3
1.6
Source: DHAC Overall, all Medicare services per cardiologists have grown at around 1.6% per annum in the period 1992-93 to 1997-98. In the same period the number of cardiologists increased by 34.5% or 6.2% per annum. The tables 18 and 19 further examine item numbers 110 and 116 by new and repeat patients and services and by age range, and indicate that Medicare services per cardiologists have grown by 1.7% in the period 1986-87 to 1997-98. This is similar to all Medicare services per cardiologists as indicated above (1.6% per annum for the period 1992-93 to 1997-98). Table 18 shows a substantial change in practice patterns between 1986-87 and 1997-98, with a sharp rise in the proportion of patient services undertaken as repeat services. In 1986-87, only one third of consulting room services were repeat patients. By 1997-98, this had risen to two thirds. This increase in repeat services has been accompanied by rapid growth in the cardiology workforce, and there are several possible explanations for this: • increased demand for ongoing specialist monitoring, which would in part be due to
demand for on-going specialist monitoring from survivors of heart attacks, and in part due to increased awareness of the symptoms of cardiac disease amongst the population; it would also reflect the impact of the ageing of the population, with a higher incidence of heart failure, artial fibrillation and ischaemic heart disease requiring specialist monitoring;
• better symptomatic outcomes with improved technology for patients with angina and arrhythmia;
• the workforce in the mid 1980s and before may have been inadequate, so that the service priority then was for new patients with acute conditions; but as the workforce has increased, the patient needs for screening and on-going repeat monitoring are being encompassed.

AMWAC 1999.5
32
Table 18: Number of new patients, repeat patients and total patients by financial year for item numbers 110 and 116, 1986-87 to 1997-98 Financial Year
Number of
cardiologists
New
patients
New patients
per cardiologist
Repeat
patients
Repeat
patients per cardiologist
Total
patients
Total patients
per cardiologist
1986-87
253
99840
394.6
47690
188.5
147530
583.1 1987-88
271
102150
376.9
64740
238.9
166890
615.8
1988-89
291
113900
391.4
75650
259.9
189550
651.4 1989-90
330
118600
359.4
93690
283.9
212290
643.3
1990-91
351
123270
351.2
112310
319.9
235580
671.2 1991-92
378
126580
334.8
129910
343.7
256490
678.5
1992-93
411
135360
329.3
148350
360.9
283710
690.3 1993-94
441
140950
319.6
170390
386.4
311340
705.9
1994-95
471
153370
325.6
191180
405.9
344550
731.5 1995-96
500
149050
298.1
214140
428.3
363190
726.4
1996-97
524
146230
279.1
232490
443.7
378720
722.8 1997-98
553
146170
264.3
250590
453.2
396760
717.5
% increase pa. 7.4 1986 to 1998
3.5
-3.6
16.3
8.3
9.4
1.9
Number of new patients services, repeat patient services and total patient services for item numbers 110 and 116, 1986-87 to 1997-98 Financial year
Number of
cardiologists
New
patient Services
New patient services per cardiologist
Repeat patient
services
Repeat patient
services per cardiologist
Total
services
Total services
Per cardiologist
1986-87
253
254440
1005.7
134310
530.9
388750
1536.6 1987-88
271
223430
824.5
153860
567.7
377290
1392.2
1988-89
291
263960
907.1
197310
678.0
461270
1585.1 1989-90
330
290790
881.2
255320
773.7
546110
1654.9
1990-91
351
297250
846.8
309210
880.9
606460
1727.8 1991-92
378
313590
829.6
363510
961.7
677100
1791.3
1992-93
411
332720
809.5
409220
995.7
741940
1805.2 1993-94
441
346810
786.4
466060
1056.8
812870
1843.2
1994-95
471
372860
791.6
509740
1082.2
882600
1873.9 1995-96
500
360650
721.3
568950
1137.9
929600
1859.2
1996-97
524
345270
658.9
622610
1188.2
967880
1847.1 1997-98
553
347380
628.2
673760
1218.4
1021140
1846.6
% increase pa. 7.4 1986 to 1998
2.9
-4.2
15.8
7.8
9.2
1.7
Source: DHAC
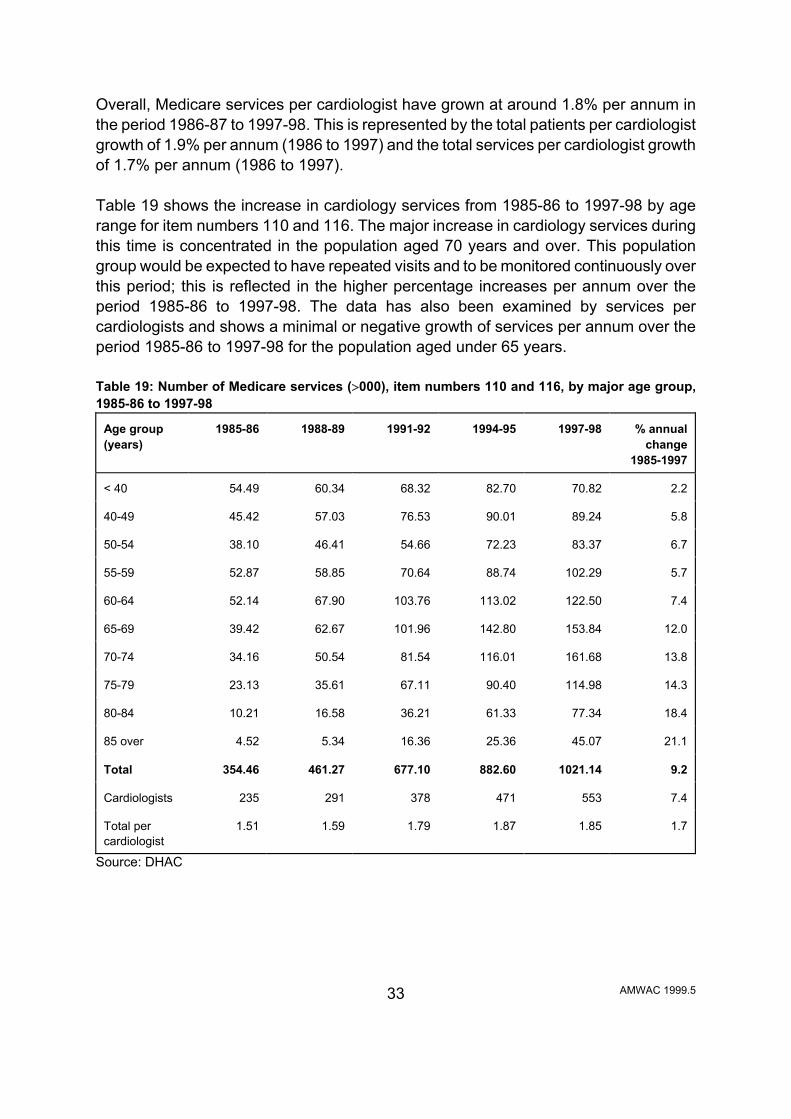
AMWAC 1999.5
33
Overall, Medicare services per cardiologist have grown at around 1.8% per annum in the period 1986-87 to 1997-98. This is represented by the total patients per cardiologist growth of 1.9% per annum (1986 to 1997) and the total services per cardiologist growth of 1.7% per annum (1986 to 1997). Table 19 shows the increase in cardiology services from 1985-86 to 1997-98 by age range for item numbers 110 and 116. The major increase in cardiology services during this time is concentrated in the population aged 70 years and over. This population group would be expected to have repeated visits and to be monitored continuously over this period; this is reflected in the higher percentage increases per annum over the period 1985-86 to 1997-98. The data has also been examined by services per cardiologists and shows a minimal or negative growth of services per annum over the period 1985-86 to 1997-98 for the population aged under 65 years. Table 19: Number of Medicare services (>000), item numbers 110 and 116, by major age group, 1985-86 to 1997-98
Age group (years)
1985-86
1988-89
1991-92
1994-95
1997-98
% annual
change 1985-1997
< 40
54.49
60.34
68.32
82.70
70.82
2.2
40-49
45.42
57.03
76.53
90.01
89.24
5.8
50-54
38.10
46.41
54.66
72.23
83.37
6.7
55-59
52.87
58.85
70.64
88.74
102.29
5.7
60-64
52.14
67.90
103.76
113.02
122.50
7.4
65-69
39.42
62.67
101.96
142.80
153.84
12.0
70-74
34.16
50.54
81.54
116.01
161.68
13.8
75-79
23.13
35.61
67.11
90.40
114.98
14.3
80-84
10.21
16.58
36.21
61.33
77.34
18.4
85 over
4.52
5.34
16.36
25.36
45.07
21.1
Total
354.46
461.27
677.10
882.60
1021.14
9.2
Cardiologists
235
291
378
471
553
7.4
Total per cardiologist
1.51
1.59
1.79
1.87
1.85
1.7
Source: DHAC

AMWAC 1999.5
34
Service Contribution of Non-specialist Providers One of the features of cardiology is the scope for non-specialist providers to provide at least some of the services. There are no definitive data sources that enable the level of substitution to be assessed; however Medicare data does provide an indication of the number of services provided by specialists and non specialists. Table 20 indicates the numbers of services attracting Medicare benefits provided by other specialists and GPs compared to cardiology specialists for selected cardiology items. These figures indicate that there is a predominant role taken by other specialists and GPs in providing cardiology services in some of the less populous States/Territories, much of which is likely to be in provincial and rural/remote areas. Table 20: Cardiology Medicare services with 5,000 or more services during 1995-96, by provider and State/Territory, 1995-96 (%) Provider
NSW
Vic
Qld
SA
WA
Tas
ACT
NT
Total
Twelve lead electrocardiography-tracing & report 11700
% Spec.
34
21
19
30
38
23
5
5
28
% Other spec.
19
46
9
6
19
9
9
5
23
% GP
47
33
71
64
42
68
40
91
49
Number
502,822
301,340
197,470
75,415
90,404
21,494
12,333
2,662
1,203,940
ECG - 12 Lead, report 117001
% Spec.
40
22
64
65
42
-
12
-
37
% Other spec.
40
72
-
20
57
-
88
-
52
% GP
16
6
36
16
1
-
-
-
11
Number
13,460
7,916
61
682
1,862
-
294
-
24,275
ECG - 12 Lead, tracing 117002
% Spec.
3
30
-
9
-
-
-
-
14
% Other spec.
72
29
1
93
26
-
88
-
43
% GP
25
41
99
4
74
100
12
100
43
Number
10,666
16,414
6,102
2,751
205
34
917
101
37,190
Continuous ECG monitoring (Holter) 117009
% Spec.
53
50
68
98
96
89
78
-
59
% Other spec.
20
46
25
-
4
11
22
-
25
% GP
27
4
7
2
-
-
-
100
15

AMWAC 1999.5
35
Number 30,863 16,108 6,463 2,915 3,573 949 575 26 61,472
Electrocardiography - tracing & report 11712 % Spec.
66
70
57
77
92
87
85
36
69
% Other spec.
17
24
33
4
7
10
14
55
18
% GP
17
6
11
19
1
3
1
9
13
Number
102,438
36,188
25,519
19,250
13,114
2,603
2,686
356
202,154
Implanted Pacemaker testing 11718
% Spec.
91
94
82
100
100
-
100
-
94
% Other spec.
9
3
18
-
-
-
-
-
5
% GP
-
3
-
-
-
-
-
-
1
Number
1,480
3,216
358
171
836
-
37
-
6,008
Implanted Pacemaker testing - atrioventricular 11721
% Spec.
87
98
89
99
100
100
100
-
95
% Other spec.
13
2
11
1
-
-
-
-
5
% GP
-
-
-
-
-
-
-
-
-
Number
2,287
4,661
1,045
368
1,015
22
121
-
9,519
Selective coronary arteriography, with catheterisation 38218
% Spec.
98
100
100
100
100
100
100
-
99
% Other spec.
2
-
-
-
-
-
-
-
1
% GP
-
-
-
-
-
-
-
-
-
Number
9,986
10,308
3,830
3,635
2,839
668
245
-
31,511
Note: - denotes less than ten services Source: DHAC Training Arrangements The RACP administers the training program for new cardiology specialists and a program of continuing education and continuing certification for Fellows. The training program is currently three years basic training followed by three years of advanced training in cardiology. The aim of the cardiology training program is to produce competent physicians trained in clinical cardiology who are capable of recognising a patient=s essential problem and able either to address that problem themselves or to direct the patient to another

AMWAC 1999.5
36
appropriate person. Successful completion of this broad prescription allows a diverse approach to the award of the FRACP and is not intended to guarantee competence as an independent operator across the range of specialised procedures. Advanced trainee numbers by age, gender and State/Territory are detailed in Table 21. The number given in each age and gender bracket comprises trainees in each year of advanced training for 1998 (ie., 1, 2). There are no part time advanced trainees. Table 21: Full-time cardiology advanced trainees, by gender, age, and State/Territory 1998*
State/Terr.
Gender
under 30
years
31-35 years
36-40 years
41 to 45
years
Total
New South Wales
M
6
10
1
0
17
F
2
0
0
0
2
Victoria
M
6
6
0
1
13
F
1
0
0
0
1
Queensland
M
4
1
0
0
5
F
1
0
0
1
2
South Australia
M
5
1
0
0
5
F
0
0
0
0
0
Western Australia
M
0
1
0
0
1
Tasmania
M
1
0
0
0
1
ACT
M
0
1
0
0
1
Australia
M
22
20
1
1
44
F
4
0
0
1
5
Total
26
20
1
2
49
% total
53.1
40.8
2.0
4.1
100
% female
F
15.4
0
0
100
10.2
*The number given in each age and gender bracket comprises trainees in each year of advanced training for 1998 (ie., 1, 2 year) Source: RACP 1998

AMWAC 1999.5
37
In 1998, 10.2% of trainees were female. Increasing numbers of women specialising in cardiology has implications for the available workforce in the future as females average shorter hours worked and have a lower labour force participation than males, and newly qualified females tend to be replacing aged males who are retiring from the workforce. The expected lifetime hours worked by a female cardiology specialist has been calculated at 74.1% of that of a male (AMWAC & AIHW 1996.7). Table 22 summarises the advanced trainee growth since 1993, and shows that there has been a 33.9% growth in trainees in the period 1993 to 1997 and a 175% increase in female trainees. Table 22: Cardiology advanced trainees, by gender and State/Territory, 1993 - 1997*
State/Territory
Gender
1997
1996
1995
1994
1993
New South Wales
M
26
24
20
21
16
F
4
6
4
3
0
Victoria
M
15
12
15
13
13
F
4
4
2
2
1
Queensland
M
7
10
11
14
11
F
2
3
1
1
3
South Australia
M
6
7
8
7
7
F
1
1
0
0
0
Western Australia
M
5
8
5
4
2
F
0
0
0
0
0
Tasmania
M
1
1
1
1
0
F
0
0
0
0
0
ACT
M
0
3
1
0
0
F
0
0
0
0
0
Australia
M
60
65
61
60
49
F
11
14
7
6
4
Total
71
79
68
66
53
% female
F
15.5
17.7
10.3
9.1
7.5
Overseas
M
2
4
7
0
6
F
1
2
2
0
0
*The number given in each age and gender bracket comprises trainees in each year of advanced training for 1997 (ie., 1, 2 and 3 year) Source: RACP 1998

AMWAC 1999.5
38
Graduations from the training program over the past five years have been 14 in 1993; 23 in 1994; 25 in 1995; 25 in 1996; 26 in 1997 and 21 in 1998. The RACP has indicated that the expected supply of graduates in 1999 based on the trainees in either their second or first year of advanced training will be 25 and in the year 2000 will be 24. The AIHW medical labour force survey figures for 1997 indicate that specialists in training in cardiology worked on average a total of 58.6 hours per week, 59.3 for males and 57.3 hours for females. Summary of Main Characteristics of the Specialist Cardiology Workforce The key supply features of the cardiology workforce are that it is a young workforce of predominantly male practitioners. The Working Party estimates there are currently 614 practising cardiology specialists in Australia. This represents 5.1 specialists per 100,000 population (aged over 25 years) and an estimated SPR of 1:19,454 (population aged over 25 years). Specialist cardiologists practise mainly in capital cities and metropolitan areas (88.3% of the workforce); with only 11.7% of specialists located in rural areas (29.6% of the population). The workforce is unevenly spread between States/Territories, with the Northern Territory and Western Australia having an SPR noticeably above the national SPR. In 1997, 65.8% (404) of the workforce was aged under 50 years and only 8.3% (51) of the workforce was aged 60 years and over. Women make up 6.5% (40) of the workforce and only 10.2% of trainees. The Working Party estimated that full time cardiology specialists work on average 60.5 hours per week.

AMWAC 1999.5
39
ADEQUACY OF THE CURRENT CARDIOLOGY WORKFORCE There are a number of indicators of the adequacy of a medical workforce. No single measure can provide a definitive assessment; however by examining each it is possible to gain an indication of whether a workforce is adequately meeting current demand or if there is a significant shortfall or oversupply. The indicators chosen by the Working Party were: SPR; public hospital vacancies; perceptions of the adequacy of the current workforce. Cardiology Specialist: Population Ratio After examination of the available literature, the Working Party concluded that no definitive benchmark for cardiology has been defined. The Working Party believes that the value of the cardiology SPRs lies in their use as tools of comparison between States/Territories and for comparisons over time. Tables 23 to 25 calculated SPRs using RACP data. The total cardiology SPR for Australia is estimated at 1:19,450 and ranges from 1:11,850 in the Australian Capital Territory to 1:52,800 in the Northern Territory (Table 23). Note these estimates are based on the population aged 25 years and over. The SPR for the Australian population as a whole is estimated at 1:30,180. For the population aged over 25 years the number of specialists per 100,000 population range from 1.9 in the Northern Territory to 7.4. The national average is 5.0 specialists per 100,000 population.

AMWAC 1999.5
40
Table 23: Cardiology specialist to population ratio, by State/Territory, 1999
NSW
Vic
Qld
SA
WA
Tas
ACT
NT
Total
Cardiology specialist workforce
Number
235
164
97
47
39
14
16
2
614
Population aged over 25 years (x 1,000)
4,079
2,999
2,151
980.7
1,135.7
304
189.6
105.6
11,944.6
SPR:1
17,357
18,286
22,175
20,866
29,121
21,714
11,850
52,800
19,454
Number per 100,000 population
5.6
5.3
4.4
4.6
3.3
4.6
7.4
1.9
5.0
Adult cardiology specialist workforce
Number
231
156
92
45
35
14
16
0
589
SPR:1
17,658
19,224
23,380
21,793
32,449
21,714
11,850
0
20,280
Number per 100,000 population
5.37
5.2
4.3
4.6
3.1
4.6
8.4
0
4.9
Source: RACP and ABS 1998
Table 24: Paediatric cardiology specialist to population ratio, by State/Territory, 1999 State
NSW
Vic
Qld
SA
WA
Tas
ACT
NT
Aust.
Number
4
8
5
2
4
0
0
2
25
Population aged 0 to 17 years (>000)
1,533.5
1,108.4
869.6
351.5
460.3
124.9
81.5
56.1
4,587.9
SPR:1
383,375
138,550
173,920
175,750
115,075
0
0
28,05
0
183,516
No. per 100,000
0.3
0.7
0.6
0.6
0.9
0
0
3.6
0.5
Source: AMWAC and ABS 1999 Sustainable Cardiology Practice The CSANZ provided AMWAC with information regarding the necessary population catchment required for a viable specialist service in cardiology. It defined an acceptable specialist service in cardiology as: the provision of: acute coronary care facilities for assessment and treatment of acute cardiological problems including acute myocardial infarct, unstable angina and arrhythmias; ECG; chest x-ray;

AMWAC 1999.5
41
echocardiography with Doppler Imaging and stress testing. An optimum specialist cardiology service also provides ambulatory ECG monitoring; electrophysiology and pacing; nuclear cardiac imaging; cardiac catheterisation including interventional procedures; cardiothoracic surgery. The total population catchment required for a viable specialist service in cardiology is shown in Table 26. The figures for both the urban and rural areas in Table 26 are regarded as minimum ones and without them cardiology practice is probably not sustainable on a full time basis. Table 26: Population catchment required for a viable specialist service in cardiology
Resident service Full-time specialist cardiologist urban practice: 40,000-60,000 rural practice close to urban centre: 40,000-60,000 rural practice remote from an urban centre: 40,000-60,000 General physician whose work includes 40% cardiology rural area remote from major urban centre 20,000-30,000 Regular outreach service close to an urban centre: 10,000-15,000 major rural centre remote from major urban centre 10,000-15,000 remote from an urban centre: 5,000-10,000
Source: AMWAC 1998.7 Some factors increasing population requirements include: large numbers of general physicians with some cardiology practice; centres of excellence in cardiology and super-specialty areas (eg., electrophysiology, interventional cardiology). Factors decreasing population requirements include: the elderly population; an ethnic mix - a high proportion of high risk groups (eg., Aboriginals, migrants from the Middle-East) and comparatively few GPs and general physicians in the catchment area.
In addition, for a sustainable resident specialist service in cardiology there are certain infrastructure requirements and these have been listed in Table 27 below. CSANZ advised AMWAC that the vast majority of their members practised in the capital cities or their urban environments or in large provincial centres. Even in the relatively large provincial cities most members do not practice solely cardiology; while the majority of their patients may have cardiac problems, they also see patients with non cardiac problems and perhaps even more importantly cover general physicians and other specialty medical practice out of hours and at weekends. The only known instance

AMWAC 1999.5
42
where there is a full time cardiac specialty practice in provincial cities applies to those cities with a cardiac catheterisation laboratory; Geelong, Newcastle and Townsville are examples. In these cities three or more cardiologists practice together and provide 24 hour a day seven day a week cardiology coverage. Thus it would seem that a hospital based cardiac catheterisation laboratory is a necessary requirement for full-time cardiology cover as described above. In most of the rural areas (and in some urban areas serviced by a district hospital), cardiology problems are handled by general physicians some of whom may have a particular interest in cardiology and some of whom may have a predominant practice in cardiology. A good example would be the Central Gippsland area of Victoria involving the towns of Morwell, Traralgon, Moe and Warragul (total population of 75,000). There are nine physicians in total, all of whom practice cardiology to varying degrees and all of whom provide emergency cardiac cover. There are two coronary intensive care units in the area. Cardiology services provided include electrocardiography, exercise testing, ambulatory monitoring, nuclear cardiology and echocardiography (AMWAC 1998.7). Table 27: Infrastructure requirements for a sustainable resident specialist service in cardiology
Hospital facilities and services - urban practice - CCU providing hardwire and telemetry ECG monitoring, haemodynamic monitoring, temporary pacing facilities (ie., access to imaging intensifier) - electrophysiology laboratory including permanent pacemaker service - stress testing - treadmill, ECG, echocardiographic or nuclear - echo/Doppler including transoesophageal echo - ambulatory ECG monitoring - cardiac catheterisation laboratory Hospital facilities and services - rural practice Essential requirements include: - CCU providing hardwire and telemetry ECG monitoring, haemodynamic monitoring, temporary pacing facilities (ie., access to imaging intensifier) - stress testing (ECG) - echo/Doppler - cardiac catheterisation laboratory in major rural centres Desirable hospital facilities and services include: - permanent pacemaker - echo or nuclear stress testing - transoesophageal echo - ambulatory ECG monitoring Skilled nursing/allied health and ancillary staff requirements - urban and rural practice - trained CCU nursing staff and trained cardiac technicians in ECG and echocardiography - physiotherapist with cardiac rehabilitation training, occupational therapist, dietitian, social worker - secretary/receptionist

AMWAC 1999.5
43
Other services essential in close proximity - radiology, pathology and an emergency department Other services desirable in close proximity - vascular ultrasound and arteriography, nuclear medicine and library facilities Surgery/office facilities - depending on proximity and availability of facilities in the local hospital - electrocardiography and stress testing (ECG, +/- echo) - echo/Doppler - secretarial/reception area, consulting suite, procedural suite and data storage facilities Infrastructure requirements for a sustainable outreach service in cardiology - within the hospital - a consulting suite, ECG and chest x-ray, pathology (haematology and biochemistry) - support staff requirements include receptionist
Source: AMWAC and CSANZ (AMWAC 1998.7) Consultation Waiting Times Table 28 summarises the average waiting time for a standard first consultation with a specialist in adult cardiology in his/her rooms as 18.3 days (mode 14, standard deviation 15.2) while patients seen as hospital outpatients wait twice as long, an average of 35.7 days (mode 28, standard deviation 28.8). These waiting times are not benchmarks but are self reported. The average consultation waiting time for a clinically urgent condition with a specialist in adult cardiology in his/her rooms is 2.4 days (mode 1, standard deviation 3.1) while patients seen as hospital outpatients wait longer, an average of 7.7 days (mode 7, standard deviation 12.4).

AMWAC 1999.5
44
Table 28: Specialist adult cardiology average waiting time (days) for a standard first consultation and a clinically urgent condition, by rooms or hospital outpatients and State/Territory State/Territory
Standard consultation
Clinically urgent condition
Rooms
NSW
19.0 ± 18.7 (14)
2.8 ± 3.7 (1)
Victoria
20.4 ± 13.9 (7)
2.0 ± 2.2 (1)
Queensland
15.6 ± 11.6 (14)
2.2 ± 3.1 (1)
Western Australia
19.0 ± 9.3 (28)
3.0 ± 3.9 (1)
South Australia
15.0 ± 10.6 (14)
3.0 ± 3.2 (1)
Tasmania
12.1 ± 9.7 (14)
0.8 ± 0.4 (1)
Northern Territory
-
-
ACT
28.0 ± 20.4 (7)
2.8 ± 2.7 (3)
Total
18.3 ± 15.2 (14)
2.4 ± 3.1 (1)
Hospital outpatients
NSW
30.0 ± 27.3 (7)
6.7 ± 13.7 (1)
Victoria
29.7 ± 19.7 (28)
5.7 ± 5.9 (7)
Queensland
57.3 ± 34.8 (42)
10.2 ± 12.4 (7)
Western Australia
56.6 ± 36.4 (28)
18.6 ± 26.8 (14)
South Australia
24.2 ± 10.5 (21)
7.9 ± 6.4 (7)
Tasmania
11.0 ± 9.5 (7)
0.8 ± 0.8 (0)
Northern Territory
-
-
ACT
39.7 ± 39.8 (7)
2.0 ± 3.4 (0)
Total
35.7 ± 28.8 (28)
7.7 ± 12.4 (7)
Source: AMWAC/RACP Survey The mode may be a better indicator to examine rather than the average waiting times due to the sample variation in responses from each State/Territory. The mode times show that for standard consultation times for private patients in Western Australia (28 days) and public patients in Queensland (42 days) exceed the national mode waiting time. For a clinically urgent condition, private patients in the ACT (3 days) and public patients in Western Australia (14 days) exceeded the national mode waiting time.

AMWAC 1999.5
45
For Western Australia, Queensland and the Australian Capital Territory these waiting times may reflect factors such as maldistribution. Certainly for Western Australia and Queensland SPRs were lower than the national average indicating a possible undersupply of cardiologists. Table 29 summarise the average waiting time for a standard first consultation with a specialist in paediatric cardiology and shows that the waiting time in his/her rooms is less than that of adult cardiologists: 14.4 days (mode 7, standard deviation 15.3. Public patients wait twice as long, an average of 30.8 days (mode 28, standard deviation 18.7). Similarly, the average consultation waiting time for a clinically urgent condition with a specialist in paediatric cardiology in his/her rooms is less than the waiting time for adult cardiologists: 1.6 days (mode 1, standard deviation 0.9). Patients seen as hospital outpatients wait twice as long, an average of 3.1 days (mode 1, standard deviation 2.8). These waiting times are not benchmarks but are self reported. Table 29: Specialist paediatric cardiology average waiting time (days) for a standard first consultation and a clinically urgent condition, by rooms or hospital outpatients department and State/Territory, 1998
State/Territory
Standard consultation
Clinically urgent condition
Rooms
NSW
11.7 ± 8.1 (7)
2.0 ± 1.0 (1)
Victoria
31.5 ± 34.6 (7)
3.0 ± 0 (3)
Queensland
9.5 ± 6.4 (5)
1.0 ± 1.0 (1)
Western Australia
6.7 ± 6.4 (3)
1.0 ± 0 (1)
South Australia
21.0 ± 0 (21)
1.0 ± 0 (1)
Total
14.4 ± 15.3 (7)
1.6 ± 0.9 (1)
Hospital outpatients
NSW
31.5 ± 34.6 (7)
1.5 ± 0.7 (1)
Victoria
35.0 ± 29.7 (14)
5.0 ± 2.8 (3)
Queensland
21.0 ± 9.9 (14)
4.0 ± 4.2 (1)
Western Australia
24.5 ± 4.9 (21)
4.0 ± 4.2 (1)
South Australia
56.0 ± 0 (56)
1.0 ± 0 (1)
Total
30.8 ± 18.7 (28)
3.1 ± 2.8 (1)
Source: AMWAC/RACP Survey Public Hospital Vacancies

AMWAC 1999.5
46
The AMWAC survey of public hospital specialist vacancies conducted in 1997 found there were nine cardiology vacancies, representing 1.5% of the workforce. Professional Satisfaction Responses to the AMWAC Survey made by adult and paediatric cardiologists were examined and found to be similar. Overall, 86.5% (263) of respondents were satisfied with their work. Aspects of their work with which they were most satisfied were sufficient work to maintain competence, opportunity to use your abilities, and availability of other specialists (Table B23). Aspects of their work with which they were most dissatisfied were hours of work, amount of work and availability of allied health professionals. Metropolitan and rural specialists indicated that they were most satisfied with the opportunity to use their abilities as well as sufficient work to maintain competence; however, rural specialists indicated that they were most dissatisfied with the availability of similar specialists. Both metropolitan and rural specialists indicated that they were most dissatisfied with the hours of work followed by the amount of work (Table B25). Conclusions on the Adequacy of the Current Cardiology Workforce Overall, the Working Party concluded that the current cardiology workforce was adequately meeting demand. SPRs which are used as tools of comparison between States/Territories and for comparisons over time were also close to the suggested sustainable service benchmarks. There were very few public hospital vacancies and waiting times for urgent consultations were appropriately low. Consultation waiting times for non urgent conditions were of some concern; however this may be due to other factors, such as maldistribution and funding, rather than being indicative of any overall workforce shortages.

AMWAC 1999.5
47
PROJECTIONS OF REQUIREMENTS Population Australia has a growing and an ageing population. In 1998 Australia's population was 18.7 million. The ABS estimates that population will reach 19.3 million by 2001 and 20.3 million by 2006. Between now and 2008 there is a projected 1.0% per annum growth in population. The 1997 median age of 34.3 years is projected to increase to between 40.1 and 41.1 years in 2021. The age structure of the population will change noticeably by 2051 with a heavier concentration in the ages 50 years and over. ABS projections are for the population aged 65 years and over to rise from 2.2 million in 1997 to about 4.0 million in 2021 and around 6.0 million in 2051. As a proportion of the population, this represents increases from 12% in 1997 to about 18% in 2021 and 24% in 2051. The age structure of the population aged 15 to 64 years is also projected to change considerably, with the greatest growth occurring in the population aged 45 to 64 years. This age group is projected to rise from 4.0 million in 1997 to between 6.1 million and 6.5 million in 2051 (ABS 1998) Over the next decade this age group is expected to increase by 2.8% per annum. Accordingly, whilst the total population is expected to increase by 1.0% per annum over the next decade, it is expected to grow at a faster rate in the older age groups, ranging from an estimated 2.3% per annum growth for the over 65 years age group to an estimated 5.0% per annum for the over 85 years age group. Given that the bulk of cardiology services are provided to people in the older age groups, these growth rates would suggest that on population and ageing trends alone, the demand for cardiology services over the next decade will increase and that the bulk of this growth is likely to be for the older age groups, which also happen to be the fastest growing sections of the population. Population growth was used as the key projection requirement by Dr Owen Dent and Dr Kerry Goulston for the physician workforce in their recent paper Trends in the specialist workforce in internal medicine in Australia 1998 to 1995 (Dent and Goulston, 1999). Cardiovascular Health Whilst population growth across different age groups may provide a good indication of possible requirement trends, the trends in the incidence of cardiovascular conditions are also worthy of consideration and here several recent studies are of use.

AMWAC 1999.5
48
Australian Institute of Health and Welfare Cardiovascular Studies Cardiovascular disease (CVD) is a major health and economic burden for Australia. The risk of developing the disease is associated with factors such as smoking, high blood cholesterol, high blood pressure, physical inactivity, obesity and excess alcohol use. A recent report by the AIHW provides a summary of trends in the cardiovascular health Waters A-M, Armstrong T, Senes-Ferrari S (1998). Heart, stroke and vascular disease is the leading cause of death among Australians, accounting for 53,989 deaths (26,559 males; 27,439 females), or 42% of all deaths in 1996. Although death rates from heart, stroke and vascular disease are a much smaller proportion of all deaths among males (39%) than among females (45%), males are more likely to die from heart, stroke and vascular disease prematurely. The male death rates are higher in most age groups, but the differential between the sexes declines with increasing age (Mathur & Gajanayake 1998). Cardiovascular mortality continues to decline among both males and females, and more rapidly than for total mortality. Between 1984 and 1996, CVD mortality is estimated to have been declining at 3.7% for males and 3.6% for females. CHD mortality is estimated to be declining at 4.0% among males per year and 3.6% among females. Mortality from heart attacks, the major contributor to coronary heart disease mortality, is declining at an annual rate of 5.5% among males and 4.7% among females. Mortality from stroke is currently declining at 3.4% per year among males and 3.8% among females, and is occurring in all age groups. In both sexes premature mortality (between ages 25 and 74 years) is declining at a faster rate than at older ages (Department of Health and Family Services (1998), National Health Priority Areas Report, Cardiovascular health, unpublished report). Indigenous people suffer extremely high heart, stroke and vascular disease rates, at approximately twice the rate of the total Australian population. Over the period 1994-96 cardiovascular diseases accounted for 28% of all deaths of Indigenous people, a significantly lower proportion than that evident among non-Indigenous population (42%). However, the age standardised cardiovascular disease death rates for Indigenous people in 1994-96 were two times greater than non-Indigenous rates. This ratio was greater among adults of working age (25 to 64 years), for whom Indigenous people had six and nine times the cardiovascular death rate for non-Indigenous males and females respectively (Mathur & Gajanayake 1998). Ischaemic heart disease remained the leading contributor to mortality from cardiovascular disease for Indigenous people, 55% among males and 41% among females in 1994-96. Death rates from ischaemic heart disease for the Indigenous population in 1994-96 were 1.6 times greater than for other Australians (Mathur & Gajanayake 1998).

AMWAC 1999.5
49
Cardiovascular mortality or disease burdens are higher or more problematic among Indigenous Australians, in remote areas of the country and among socio-economically disadvantaged groups. There is considerable overlap between theses groups , and they share some factors that contribute to their greater risk, such as higher rates of smoking and some other risk factors, reduced access to prevention programs, and use of treatment services that is not as high as it should be given the level of disease. For these populations it is particularly important to tackle the underlying causes of inequalities in health, through intersectoral action and changes in public policy (Department of Health and Family Services (1998), National Health Priority Areas Report, Cardiovascular health, unpublished report). ABS National Health Survey 1995 The national population health surveys conducted by the ABS also provide a picture of the prevalence of cardiovascular conditions in Australia. The most recent survey results are for 1995. In 1995, an estimated 2.8 million people or 16% of the population reported experiencing a recent and/or long-term cardiovascular condition. Hypertension was the most common cardiovascular condition, reported by 10% males and 11% of females. Overall, prevalence was higher among males than females for heart disease, stroke and atherosclerosis. However, proportionately more females than males reported hypertension, ill-defined heart conditions and >other circulatory disease=. For both males and females, the prevalence of each cardiovascular condition tended to increase with age (Water et.al. 1998) A comparison of the 1989-90 and 1995 national health surveys suggests an overall increase in the prevalence of cardiovascular conditions, although care should be taken in interpreting trends as changes in survey methodology may have affected comparability between surveys. There was little change in the rates of reported hypertension, heart diseases, stroke or atherosclerosis. However, the age-standardised reported prevalence of >other circulatory disease= (which includes aortic aneurysm and other peripheral vascular disease) increased from 1.7% to 3.1% in men and from 1.7% to 4.5% in women. Incidence of Coronary Heart Disease - the MONICA Project Trends in the rates of heart attacks (fatal and non-fatal) were monitored in Newcastle and Perth from 1984 to 1994 as part of the World Health Organisation=s Multinational Monitoring of Trends and Determinants in Cardiovascular Disease (MONICA) project. The internationally accepted MONICA diagnosis uses data on symptoms, enzymes, electrocardiographs, past medical history and post-mortem findings. However, funding did not permit events among the population over 65 years to monitored, despite this age group having the most CVD.

AMWAC 1999.5
50
The MONICA project found that rates of non fatal heart attacks among people aged 35 to 64 years fell significantly in the two Australian centres over the ten years. In Newcastle, the estimated average annual fall in the rate of non-fatal heart attacks was 3.7% among men and 3.5% among women. In Perth, the estimated average falls were 3.4% per year for men and 2.5% per year for women. The rate of first heart attacks, fatal or non-fatal, also fell, indicating a declining incidence of heart attacks. A consortium at the Universities of Newcastle and Western Australia and the Queensland Department of Health has developed a method to estimate the rate of non-fatal heart attacks and all coronary events - fatal or non-fatal - using routinely collected data and adjustment factors from the MONICA project. National estimates using this method show that among men, non-fatal heart attacks are three times more common than among women during 35 to 69 years and rise sharply with age. Unlike estimates for Newcastle and Perth, the national estimates are based on data for three years only, and therefore do not show a clear trend over time. Non-fatal heart attacks accounted for just over 60% of total coronary events during the three year period ending June 1996 (Table 30). Table 30: Rates of non-fatal heart attacks and all coronary events, 1993-94 to 1995-96 (per 100,000 population) Age (years)
Non-fatal heart attacks
Fatal and non-fatal coronary events
1993-94
1994-95
1995-96
1993-94
1994-95
1995-96
Males
35-54
137
137
144
187
186
192
55-64
497
487
484
804
771
755
65-69
735
733
704
1,422
1,373
1,292
35-69a
273
271
272
441
428
421
Females
35-54
26
26
28
28
37
29
55-64
173
165
162
275
256
247
65-69
352
360
365
605
596
580
35-69a
90
89
90
144
139
137
Note: a - rates standardised to the Australian population 35-69 years at December 1993. Sources: AIHW National Hospital Morbidity Database Forecast Cardiology Service Trends
AMWAC 1999.5
51
In respect of growth in demand for specialist cardiology services, patients are predominantly post-middle age and this age group is increasing 2.5 times faster than the growth of the total population. Trends in the rates of major non-fatal and fatal coronary events have been declining significantly, with 60% decline in mortality in Australia in the last 25 years and similar declines in nonfatal cardiovascular disease. As mortality has declined, more people are staying alive with heart conditions which may increase the need for cardiology services. Future demand for cardiology services therefore needs to be assessed against a balance between continuing decline in cardiovascular disease and relatively rapid growth in the numbers of people in the age groups most likely to experience this disease (that is over 45 years). Forecasts of future cardiology procedures and diagnoses have been calculated by applying projections of the population to the hospital age utilisation data for 1996-97. Of hospital in patients in 1996-97 with a diagnoses indicating a cardiology condition, 90% were aged 45 years or more. Assuming that percentage continues, and as this age group is projected to increase at a much faster rate than other age groups in the population between 1998 and 2018, the number of cardiology separations would increase by approximately 50% over that period compared with a 20% increase in the population. It should be noted that this approach assumes that population change and ageing of the population are the only factors affecting the demand for cardiology procedures. The projections ignore, for example, the impacts of new technology and change in medical practice, which are extremely difficult to assess let alone quantify. In a sense, this is the minimum growth that can be expected in cardiology services. While the male population is projected to increase by 10.2% between 1998 and 2008, cardiology related diagnoses are projected to increase between 1998 and 2008 by 27.1% for males or by 2.6% per annum. For females the population is projected to increase by 10.5% between 1998 and 2008, with cardiology related diagnoses projected to increase by 22.6% or by 2.3% per annum (Table 31 and 32). Cardiology related procedures for males are projected to increase by 25% or by 2.5% per annum between 1998 and 2008. For females, cardiology related procedures are projected to increase by 21.6% or by 2.2% per annum in the same period (Table 33 and 35). Tables 34 and 35 also include projections from 1998 to 2018. The projected increases in the National Hospital Morbidity Data (ICD-9-CM) for

AMWAC 1999.5
52
cardiology related procedures and diagnosis reflect a 2.2 to 2.6% per annum growth in cardiology services. These projections suggest that in general the demand for cardiology over the next 20 years will increase. The data also shows that the bulk of cardiology diagnosis and procedures relate to people aged 45 years and over. Cardiology diagnosis and procedures are projected to increase most in the 55 years and over age groupings.

AMWAC 1999.5
53
Table 31: Projected increases the male and female populations (a), 1998 to 2018 Projected increases in the male population
Age (years)
Year
0−14
15−24
25−34
35-44
45-54
55-64
65-74
75+
Total
Actual male population 1996Β97
2,008,626
1,359,432
1,436,618
1,415,554
1,189,974
783,389
614,728
353,999
9,162,320
Projected male population June 1998
2,021,658
1,360,385
1,462,182
1,434,542
1,247,629
816,648
617,404
377,618
9,338,066
June 2008 2,087,841
1,416,649
1,423,963
1,504,825
1,431,871
1,198,806
709,596
517,624
10,291,175
June 2018 2,099,505
1,475,736
1,481,460
1,468,865
1,503,667
1,380,990
1,050,983
640,157
11,101,363
% Increases - male population % increase 1998Β2008
3.3
4.1
-2.6
4.9
14.8
46.8
14.9
37.1
10.2
% increase 1998Β2018
3.9
8.5
1.3
2.4
20.5
69.1
70.2
69.5
18.9
% Increase per annum - male population % increase pa. 1998Β2008
0.3
0.4
-0.3
0.5
1.5
4.7
1.5
3.7
1.0
% increase pa. 1998Β2018
0.2
0.4
0.1
0.1
1.0
3.5
3.5
3.5
0.9
Projected increases in the female population
Age (years)
Year
0−14
15−24
25−34
35-44
45-54
55-64
65-74
75+
Total
Actual female population 1996Β97
1,909,308
1,307,392
1,438,027
1,421,873
1,157,303
773,726
680,366
572,380
9,260,375
Projected female population June 1998
1,921,330
1,298,799
1,455,691
1,444,970
1,223,172
800,255
677,122
604,266
9,425,605
June 2008 1,982,743
1,354,475
1,400,360
1,520,893
1,453,411
1,200,337
745,118
760,473
10,417,810
June 2018 1,992,804
1,409,417
1,456,720
1,466,979
1,530,796
1,427,175
1,117,264
892,450
11,293,605
% Increases - female population % increase 1998Β2008
3.2
4.3
-3.8
5.3
18.8
50.0
10.0
25.9
10.5
% increase 1998Β2018
3.7
8.5
0.1
1.5
25.1
78.3
65.0
47.7
19.8
% Increase per annum - female population % increase pa. 1998Β2008
0.3
0.4
-0.4
0.5
1.9
5.0
1.0
2.6
1.1
% increase pa. 1998Β2018
0.2
0.4
0.01
0.07
1.3
3.9
3.3
2.4
1.0
Sources: ABS population projection series A.

AMWAC 1999.5
54
Table 32: Projected increases in cardiology related diagnosis for males and females, 1998 to 2018 Cardiology-related diagnoses for males
Age (years)
Year
0−14
15−24
25−34
35-44
45-54
55-64
65-74
75+
Total
Actual cardiology-related diagnoses for males 1996Β97
32,272
4,909
11,121
32,893
94,174
174,649
314,339
318,904
983,261
Projected cardiology-related diagnoses for males June 1998
32,481
4,912
11,319
33,334
98,737
182,064
315,707
340,181
1,018,736
June 2008 33,545
5,116
11,023
34,967
113,318
267,262
362,849
466,307
1,294,387
June 2018 33,732
5,329
11,468
34,132
119,000
307,878
537,416
576,693
1,625,648
% Increases - cardiology-related diagnoses for males % increase 1998Β2008
3.3
4.1
-2.6
4.9
14.8
46.8
14.9
37.1
27.1
% increase 1998Β2018
3.9
8.5
1.3
2.4
20.5
69.1
70.2
69.5
59.6
% Increase per annum - cardiology-related diagnoses for males % increase pa. 1998Β2008
0.3
0.4
-0.3
0.5
1.5
4.8
0.5
4.3
2.6
% increase pa. 1998Β2018
0.2
0.4
0.01
0.1
1.0
3.5
3.5
3.5
2.9
Cardiology-related diagnoses for females
Age (years)
Year
0−14
15−24
25−34
35-44
45-54
55-64
65-74
75+
Total
Actual cardiology-related diagnoses for females 1996Β97
28,519
4,910
11,071
23,500
55,677
108,019
230,870
416,264
878,830
Projected cardiology-related diagnoses for females June 1998
28,699
4,878
11,207
23,882
58,846
111,723
229,769
439,453
908,456
June 2008 29,616
5,087
10,781
25,137
69,923
167,578
252,842
553,055
1,114,018
June 2018 29,766
5,293
11,215
24,245
73,645
199,246
379,124
649,035
1,371,570
% Increases - cardiology-related diagnoses for females % increase 1998Β2008
3.2
4.3
-3.8
5.3
18.8
50.0
10.0
25.9
22.6
% increase 1998Β2018
3.7
8.5
0.1
1.5
25.1
78.3
65.0
47.7
51.0
% Increase per annum - cardiology-related diagnoses for females % increase pa. 1998Β2008
0.3
0.4
-0.4
0.5
1.9
5.0
1.0
2.6
2.3
% increase pa. 1998Β2018
0.2
0.4
0.01
0.07
1.2
3.9
3.3
2.4
2.6
Sources: ABS population projection series A; AIHW National Hospital Morbidity Database

AMWAC 1999.5
55
Table 33: Projected increases in cardiology-related procedures for males and females, 1998 - 2018 Procedures for males relating to cardiology
Age (years)
Year
0−14
15−24
25−34
35-44
45-54
55-64
65-74
75+
Total
Actual procedures for males relating to cardiology 1996Β97
10,587
3,657
5,862
18,438
51,844
79,895
103,647
49,986
323,916
Projected procedures for males relating to cardiology June 1998
10,656
3,660
5,966
18,685
54,356
83,287
104,098
53,321
334,029
June 2008 11,005
3,811
5,810
19,601
62,383
122,262
119,642
73,090
417,604
June 2018 11,066
3,970
6,045
19,132
65,511
140,842
177,202
90,393
514,161
% Increases - procedures for males relating to cardiology % increase 1998Β2008
3.3
4.1
-2.6
4.9
14.8
46.8
14.9
37.1
25.0
% increase 1998Β2018
3.9
8.5
1.3
2.4
20.5
69.1
70.2
69.5
53.9
% Increase per annum - procedures for males relating to cardiology % increase pa. 1998Β2008
0.3
0.4
-0.3
0.5
1.5
4.7
1.5
3.7
2.5
% increase pa. 1998Β2018
0.2
0.4
0.06
0.1
1.0
3.5
3.5
3.5
2.7
Procedures for females relating to cardiology
Age (years)
Year
0−14
15−24
25−34
35-44
45-54
55-64
65-74
75+
Total
Actual procedures for females relating to cardiology 1996Β97
8,697
2,573
4,251
8,478
19,787
32,840
54,515
40,129
171,270
Projected procedures for females relating to cardiology June 1998
8,752
2,556
4,303
8,616
20,913
33,966
54,255
42,364
175,726
June 2008
9,032
2,666
4,140
9,068
24,850
50,947
59,703
53,316
213,721 June 2018
9,077
2,774
4,306
8,747
26,173
60,575
89,522
62,569
263,743
% Increases - procedures for females relating to cardiology % increase 1998Β2008
3.2
4.3
-3.8
5.3
18.8
50.0
10.0
25.9
21.6
% increase 1998Β2018
3.7
8.5
0.1
1.5
25.1
78.3
65.0
47.7
50.1
% Increase per annum - procedures for females relating to cardiology % increase pa. 1998Β2008
0.3
0.4
-0.4
0.5
1.9
5.0
1.0
2.6
2.2
% increase pa. 1998Β2018
0.2
0.4
0.01
0.07
1.3
3.9
3.3
2.4
2.5
Sources: ABS population projection series A; AIHW National Hospital Morbidity Database.

AMWAC 1999.5
56
The Impact of Technology Technological advance will have an impact on the utilisation of cardiology services. The impact is however difficult to quantify. Generally, it is considered technology has two long term impacts - boosting practitioner productivity and broadening the types, and sophistication, of procedures and treatments that are available to the public. New technology may also allow other specialties, GPs and other health professions to be able to perform some of the tasks which are currently referred to cardiology specialists. Recognition of the difficulty of quantifying this impact in advance is one of the reasons the AMWAC process includes regular updating of the data and conclusions contained in the original reports, as this enables the prompt inclusion of new trends bought about by technological advance. Some recent advances are described below: Coronary Angiography and Cardiac Catheterisation and Interventional Cardiology: There is evidence of increasing decentralisation and almost certain performance of angioplasty/stenting at the time of diagnostic angiography at sites without cardiac surgery. Counter balancing this will be the increased use of magnetic resonance angiography. This is currently not the state of the art in diagnostic coronary angiography. In 1995 and again in 1998, 28% of the patients who underwent coronary angiography at St. Vincent's Melbourne had minimal or no coronary artery disease. Many of these patients are suspected of being normal at the time and magnetic resonance angiography might render diagnostic angiography unnecessary in such patients. However most patients with obstructive lesions seen by magnetic resonance angiography are likely to require diagnostic angiography/intervention in the foreseeable future. Interventional Arrhythmia Management: A renaissance of electrophysiology has taken place in the last few years. Increasing use of ablation has occurred. There is a recognition that a backlog of re-entry tachycardias will be worked through and the incidence of patients requiring intervention for current indications normally "supraventricular tachycardia" - will be low. Arterial fibrillation is the common troublesome arrhythmia requiring treatment and it appears that interventional electrophysiology is likely to have a major place in this. It is too early to say what proportion of atrial fibrillation will come under the electropysiology umbrella but this is a potential market. The Management of Heart Failure. With an ageing population there has been a significant increase in the number of patients with heart failure in the community despite the falling death rates overall from heart disease. There is great likelihood that specialised clinics will manage heart failure patients with the use of nurse practitioners visiting the patients' homes, supervising the taking of tablets and measuring the patients daily weight in order to decide on appropriate diuretic therapy. This may well be a

AMWAC 1999.5
57
shared care program with general practice. Cardiac Imaging: Currently more and more ultrasound is being used and accessed from general practice. Whilst this could result in fewer referrals to cardiologists it is more likely that ultrasound will uncover additional pathology for which cardiological services will be sought. There is a likelihood of an increasing use of Transoesophageal Echocardiography and stress echocardiography. The extent and use of magnetic resonance angiography and other cardiac imaging is less in Australia than the United States of America. The potential for such cardiac imaging is high, particularly in the determination of left ventricular hypertrophy and the treatment of high blood pressure. The Centre for Health Program Evaluation, Monash University (Robertson, I., Richardson J., Hobbs M.) has examined the impact of new technology on the treatment and cost of acute myocardial infarction (AMI) in Australia. The study found there has been a rapid rise in the use of high technology treatments in the management of patients following AMI, with the highest rates of treatment occurring in patients treated in private hospitals. Findings indicated that the level of intervention in public patients may be closer to that which is optimal, in which case, the data may be demonstrating evidence of over treatment in private hospital. This might arise when in private hospitals the cardiologist appropriately selects the group of patients who need coronary angiography in additional patients who do not fulfil the normal inclusion criteria. Once the angiography has been performed, the cardiologist might treat the coronary anatomy based on the univariate risk of future coronary events and mortality according to the position of significant obstruction in the coronary arterial tree, rather than making a judgment concerning the anatomical obstructions in relation to the physiological functioning of the heart at rest and under stress. Furthermore, some cardiologists may have come to regard coronary angiography as the first line screening test for patients following AMI, thus widening the criteria for the use of such investigations and leading to a substantially increased rate or coronary revascularisation procedures, particularly amongst patients with relatively low absolute risks of further coronary events. Again these arguments are speculative, but they might explain the rapid changes in intervention rates that have been observed in the last ten years (Robertson et al, 1998). Conservative assessments from two articles (Lange RS et. al., Use and Overuse of Angiography and Revascularisation for Acute Coronary Syndromes, New England

AMWAC 1999.5
58
Journal of Medicine 1998; 338:1838-9, Deedwania PC et. al., Evidence-Based, Cost-effective Risk Stratification and management After Myocardial Infarction, Archives of Internal Medicine 1997; 157:273-280) have also suggested that the selection of patients for investigations and coronary artery revascularisation should be guided by the presence of ongoing symptomatic or asymptomatic myocardial ischaemia: ie. after the immediate recovery period, the patient has pain or other distress provoked by activity, or is shown by exercise stress testing to have ECG changes of myocardial ischaemia, despite adequate drug therapy to suppress that ischaemia. Specialists’ Perceptions on Factors Affecting Workforce Requirements Respondents to the AMWAC/RACP survey were asked to indicate whether they believed particular factors would increase workforce requirements, decrease workforce requirements or whether requirements would stay the same. Among the important issues that adult cardiologists perceived would increase workforce requirements included: ageing of the population, patients' expectations, growth in consumer demand and more defensive medicine. Factors perceived as most likely to decrease workforce requirements were: lifestyle changes that improve population health, cost containment strategies and substitution of specialist services by other providers (Table B27). It should also be noted that respondents to the survey were not asked to balance the factors increasing or decreasing requirements or make any overall quantification of the likely impact of the factors on service utilisation. The perceptions of paediatric cardiologists showed differences, with the majority indicating that patients' expectations, growth in consumer demand, more defensive medicine and the need for improved geographic distribution of specialists would increase workforce requirements (Table B28). Summary of Cardiology Service Trends and Forecasts In summary, trends and forecasts indicate that: • cardiovascular mortality continues to decline among both males and females, and
more rapidly than for total mortality; • there has been an overall increase in the prevalence of cardiovascular conditions; • the age-standardised reported prevalence of >other circulatory disease has
increased for both males and females; • cardiology patients are predominantly post-middle age and this age group is
increasing 2.5 times faster than the growth of the total population; • Australia has a growing and an ageing population and the age structure of the
population will change noticeably by 2051 with a heavier concentration in the ages 50 years and over;

AMWAC 1999.5
59
• Medicare services per cardiologists have grown at around 1.8% per annum in the period 1986-87 to 1997-98.
• the projected increases in the National Hospital Morbidity Data (ICD-9-CM) for cardiology related procedures and diagnoses reflect a 2.2 to 2.6% per annum growth in cardiology services.
• for the Medicare services per provider and the projected increases in the National Hospital Morbidity Data (ICD-9-CM) for cardiology related procedures and diagnoses, the data has reflected a growth range between 2.2 to 2.6% per annum growth in cardiology services. These two sets of data can be used to reflect future cardiology service requirements; and,
• projections on cardiology diagnoses and procedures based on the National Hospital Morbidity Data (ICD-9-CM) and population growth, suggest that in general the demand for cardiology over the next 20 years will increase with the bulk of cardiology related diagnoses and procedures relating to people aged 45 years and over, with the largest projection increases expected for the age groups 45 to 64 years and 65 years and over; and,
• with the advance of new medical technology there will be development of the specialty to provide broader and more sophisticated services, which may also allow other specialties, GPs and other health professions to be able to perform some of the tasks which are currently referred to cardiology specialists.
These trends are summarised in Table 34.
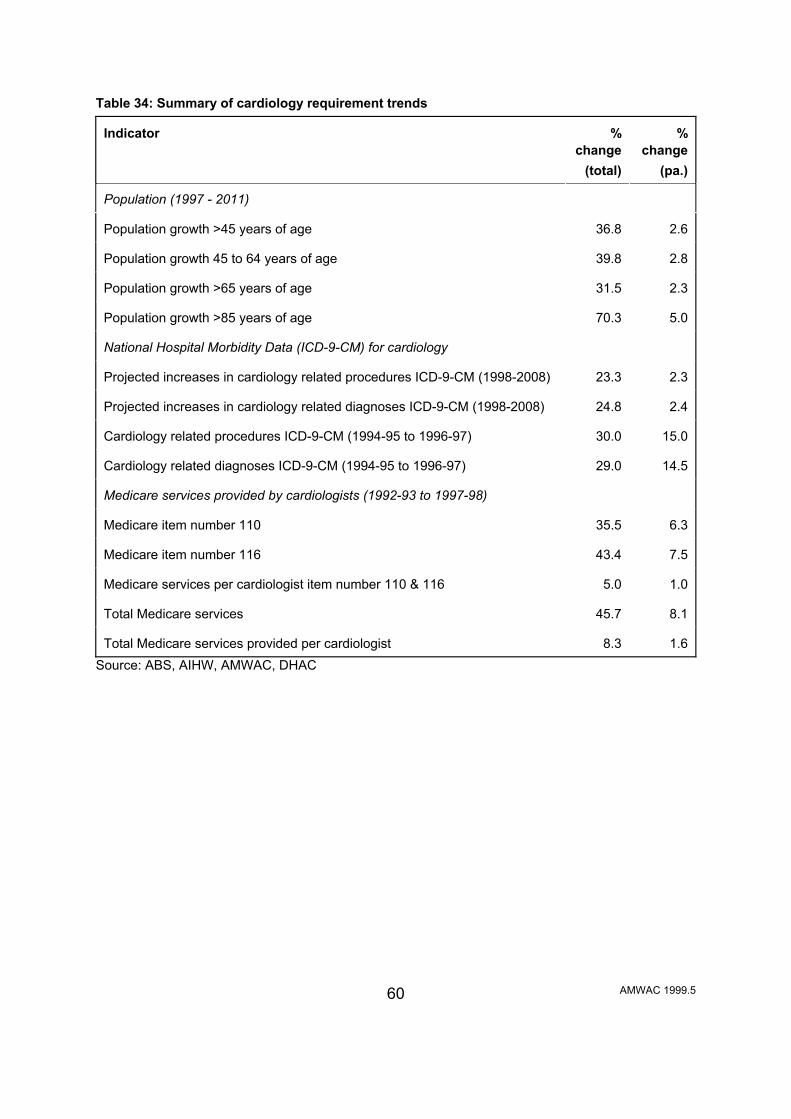
AMWAC 1999.5
60
Table 34: Summary of cardiology requirement trends Indicator
%
change (total)
%
change (pa.)
Population (1997 - 2011)
Population growth >45 years of age
36.8
2.6
Population growth 45 to 64 years of age
39.8
2.8
Population growth >65 years of age
31.5
2.3
Population growth >85 years of age
70.3
5.0
National Hospital Morbidity Data (ICD-9-CM) for cardiology
Projected increases in cardiology related procedures ICD-9-CM (1998-2008)
23.3
2.3
Projected increases in cardiology related diagnoses ICD-9-CM (1998-2008)
24.8
2.4
Cardiology related procedures ICD-9-CM (1994-95 to 1996-97)
30.0
15.0
Cardiology related diagnoses ICD-9-CM (1994-95 to 1996-97)
29.0
14.5
Medicare services provided by cardiologists (1992-93 to 1997-98)
Medicare item number 110
35.5
6.3
Medicare item number 116
43.4
7.5
Medicare services per cardiologist item number 110 & 116
5.0
1.0
Total Medicare services
45.7
8.1
Total Medicare services provided per cardiologist
8.3
1.6
Source: ABS, AIHW, AMWAC, DHAC

AMWAC 1999.5
61
PROJECTIONS OF SUPPLY Whilst the trend in requirements is important to any projection modelling, the trend in supply is of no less importance and in fact several previous AMWAC workforce reviews have found supply trends to be the more dominating feature of the workforce. For the cardiology workforce the key factors influencing future supply are that the workforce is relatively young workforce and there are very few female practitioners. Retirements are expected to be comparatively low and the dominant young male workforce is likely to sustain a high number of hours worked and productivity over the next decade. Additions to the Cardiology Workforce The average number of cardiology Fellows admitted to the College each year over the last four years has been approximately 25. The RACP has indicated that the graduates in 1998 were 21, and that the expected supply of graduates in 1999 is 25 and in 2000 a graduation of 24. Retirement 91.8% (279) of respondents to the AMWAC/RACP survey provided details of their retirement intentions. Both adult and paediatric cardiologists indicated similar retirement intentions. The average expected age of retirement from the workforce was 64.8 years (range 45 to 80; mode 65; standard deviation 4.6). The AMWAC/RACP survey found that 11.1% (34) of respondents intend retiring by the year 2004 and approximately 25.3% (77) intend retiring by the year 2009. If these retirement intentions are extrapolated to the total workforce it is estimated that in the next five years, 51 (8.3%) will have retired and by the year 2008 approximately 80 cardiology specialists (13%) in total, will have retired from the workforce. Female Participation in the Workforce It is anticipated that the proportion of women in the workforce will increase slightly; driven by the increase in the number of female trainees and the retirement of older male specialists. Women represent 6.5% of the current workforce but 10.2% of the current trainees. The number of female trainees can be expected to increase steadily over the decade given the general growth in female numbers entering medical schools, but because the proportion of women in cardiology is so low to begin with, the impact of an increased proportion of women graduating from the cardiology training program is not expected to be as great as in some other workforces such as paediatric medicine or general practice.

AMWAC 1999.5
62
The expected lifetime hours worked by a female cardiology specialists has been estimated at 74.1% of that of a male (AMWAC/AIHW 1996). In conducting the projection analysis, the expected supply has been adjusted to account for increasing female participation and for lower workforce contribution. Provision of Services in Rural and Remote Areas Provision of specialist services outside capital cities and major urban areas will continue to be of concern, as there appears to be little incentive to practice in provincial/rural areas. Traditional cardiology services in rural areas can be expected to continue to need to be provided by visiting cardiology specialists, general practitioners and general medicine specialists resident in rural/remote areas. The AMWAC/RACP survey found that only 39 respondents (12.8%) out of 306, indicated that they lived and worked outside a major urban centre, two of which were paediatric cardiologists. The AMWAC/RACP survey also found that 58 out of 304 (19.1%) metropolitan specialist cardiologists provided services to rural areas. Rural cardiology specialists who responded to the AMWAC/RACP survey indicated that they would decrease the amount of hours worked in the next three years, with an average 20% reduction in total hours. The major reasons why they anticipated a reduction in the hours worked is retirement, family considerations and changed patient numbers. The majority of those aged under 50 years of age (32.6%, n=193) indicated an expected increase in their hours worked by an average of 25%. Those aged 51 to 60 (n=78) indicated that they did not plan to change the hours they worked. 51.5% (17) of those aged over 60 years of age (n=33) indicated that they intended to decrease their hours by an average of 15 to 20%. Respondents from the AMWAC/RACP survey indicated that the basic requirements for providing a sustainable rural outreach cardiology service and/or a resident rural practice do not exist in many locations or are only partially provided. In addition, respondents noted problems with: • inadequate local hospital facilities/equipment, such as appropriate consulting
facilities and surgical equipment; • limited or absent numbers of allied health professionals and ancillary staff such as
nurses, physiotherapists and dieticians; • limited or absent number of specialist services such as neurologists,
endocrinologists, geriatricians, rehabilitation specialists, psychiatrists, gastroenterologists, thoracic specialist, cardiology nurses, allied health professionals such as physiotherapists, dietitians and cardiac technologists.
• a lack of interest and support of local GPs; • good transport to the area for both patients and specialist; and

AMWAC 1999.5
63
• the absence of local accommodation for patients to attend clinics particularly in the case of the Northern Territory for the Indigenous population.
Other considerations that need to be taken into account to provide an incentive to work in a provincial/rural area have been well documented previously and include: spouse satisfaction with lifestyle and ability to find employment; income parity with city specialists; good schools for children; holiday/study leave cover and access to locum services (AMWAC 1996.8).

AMWAC 1999.5
64
BALANCING SUPPLY AGAINST REQUIREMENTS The standard AMWAC specialist medical workforce projection model has been used to project cardiology supply and requirements to 2009. On the supply side the model takes into account expected entrants to the workforce and those leaving, converts the number of specialists to a full time equivalent (FTE) figure using the average hours worked per week by age and gender, and factors in the expected average lower lifetime workforce contribution of female specialists. On the requirements side the likely trend in demand for cardiology services is included, based on the Working Party=s assessment of the expected trend in requirements. This assessment has been based on trends in cardiology service provision over recent years and the Working Party=s expectations for utilisation over the next decade (Theile et al, 1998). This type of workforce planning is needs based and moves beyond incorporating adjustments based on population trends alone to include a consideration of the trends in the requirement for cardiology services. Requirement Trends The Working Party assessed various indicators of future cardiology requirements. These included: population growth; trends in cardiology related procedures and diagnoses using National Hospital Morbidity Data (ICD-9-CM); and trends in Medicare services. The trends in these indicators are summarised in Table 34. The Working Party concluded that the best indicators of likely future cardiology service requirements include Medicare services per cardiologist, National Hospital Morbidity Data (ICD-9-CM) for cardiology related procedures and the population growth of the ages ranges 45 to 64 years and 65 years and over. These indicators show an average growth of approximately 2.8% per annum and this estimate has been used in the projection analysis. Each of the indicators have been projected over the period 1999 to 2009 and the results are outlined in Table 35. The projections have been converted to full time equivalent hours (FTE) per week using the average hours worked figure of 60 hours per week. Conversion of the data to hours of service allows comparisons to be made with projected supply data, which has been similarly converted. It is also recognised that a ten year projection period is a long time frame for assumptions to remain valid. However, this time frame was chosen because five years was considered to be too short for any impact on training numbers to move through, given that the training program is six years in duration.

AMWAC 1999.5
65
Table 35: Projected requirements for cardiology services (in full time equivalent hours per week) for selected indicators , 1999 to 2009a Year
Pop.
Growth 45-64 years
Pop.
growth >65
years
Pop.
growth >85
years
Cardiology
related procedures
ICD-9-CM
Cardiology
related diagnosis ICD-9-CM
Medicare
services per cardiologist
(all items)
Medicare
services per cardiologist
(item 110 &116) 1999
35,308
35,153
35,808
35,178
35,230
35,023
34,809
2000
36,164
35,848
37,197
35,900
36,006
35,584
35,149
2002
37,939
37,279
40,137
37,387
37,608
36,733
35,840
2004
39,802
38,767
43,311
38,937
39,282
37,918
36,545
2006
41,756
40,315
46,735
40,550
41,030
39,142
37,263
2008
43,806
41,925
50,429
42,230
42,856
40,406
37,995
2009
44,868
42,754
52,385
43,096
43,799
41,503
38,367
Note: a - assumes an average of 60 hours worked per week Source: AMWAC Supply Trends The supply of adult cardiology specialists was projected by ageing the RACP specialist numbers through each year of age, subtracting expected retirements and attrition due to deaths and specialists leaving the workforce and adding expected new graduates. The number of adult cardiology specialists was converted to hours per week by applying the average number of hours worked to headcounts in each major age cohort. In doing so the Working Party assumed that the pattern of workforce participation of the current workforce provides a suitable basis on which to project future workforce requirements. Increasing female participation and the average lower lifetime workforce contribution of female specialists has also been assumed. The supply projections show that supply will increase from the estimated 1998 level of approximately 34,472 FTE hours per week to an estimated 43,096 FTE hours per week in 2009, assuming average retirements; with an upper and lower projection range of 42,754 FTE hours and 44,868 FTE hours per week respectively (Table 36).

AMWAC 1999.5
66
Table 36: Projected supply of cardiology services, high, low and average retirement rates, by FTE hours worked per week, 1999, 2004 and 2009
Year
Low retirement rate
Average retirement rate
High retirement rate
1999
35,153
35,178
35,308
2004
38,767
38,937
39,802
2009
42,754
43,096
44,868
Source: AMWAC Using average retirement rates, current workforce supply, average hours worked per week and graduate output, future supply projections indicate that the workforce will be above the estimated cardiology service requirements level growth of 2.8% per annum, representing a slight oversupply, estimated 2.1% by the year 2001 (Table 37). Table 37: Projected adult cardiology supply and requirements (FTE hours), 2.8% growth per year, 1999 to 2001a
Year
Projected supply
Projected requirements
% oversupply
1998
34,472
34,472
0.0
1999
35,485
35,308
0.5
2000
36,699
36,164
1.5
2001
37,836
37,041
2.1
Note: a - based on average retirement rates, a working week of 60 hours and the current intake of advanced trainees per annum (1998:21; 1999:25; 2000:24;2001:24) Source: AMWAC Projected Balance To balance the future cardiology requirement growth indicator of 2.8% per annum, advanced trainee intakes of 20, 22, 24, 26 and 28 per year were examined for the period up to 2009. All of these intakes meet the projected requirements of 2.8% growth per annum with no significant notional shortages in the workforce. Table 38 summarises each of the intake scenarios.

AMWAC 1999.5
67
Table 38: Estimated cardiology graduate output required to move projected supply into balance with projected requirements, 2.8% growth per year, (in FTE hours), by selected graduate outputs, 1999 to 2009
Year 2002
2004
2006
2008
2009
Projected FTE requirements based on 2.8% per annum growth
37,939
39,802
41,756
43,806
44,868 Projected supply for 20 graduates per year, beginning in 1999 and graduating end of 2001
38,941
40,582
42,048
43,350
43,945 Balance FTE (oversupply/shortage)
1,002 (2.6%)
780 (1.9%)
293 (0.7%)
-456 (-1.1%)
-924 (-2.1%) Projected supply for 22 graduates per year, beginning in 1999 and graduating end of 2001
38,941
40,806
42,498
44,031
44,743 Balance FTE (oversupply/shortage)
1,002 (2.6%)
1,004 (2.5%)
743 (1.7%)
225 (0.5%)
-125 (-0.3%) Projected supply for 24 graduates per year, beginning in 1999 and graduating end of 2001
38,941
41,030
42,948
44,712
45,542 Balance FTE (oversupply/shortage)
1,002 (2.6%)
1,228 (3.0%)
1,193 (2.8%)
906 (2.0%)
674 (1.5%) Projected supply for 26 graduates per year, beginning in 1999 and graduating end of 2001
38,941
41,254
43,398
45,393
46,341 Balance FTE (oversupply/shortage)
1,002 (2.6%)
1,452 (3.5%)
1,643 (3.8%)
1,587 (3.5%)
1,473 (3.2%) Projected supply for 28 graduates per year, beginning in 1999 and graduating end of 2001
38,941
41,477
43,848
46,073
47,140 Balance FTE (oversupply/shortage)
1,002 (2.6%)
1,676 (4.0%)
2,093 (4.8%)
2,268 (4.9%)
2,272 (4.8%) Source: AMWAC The Working Party concluded that a balance in supply to match a continued growth rate in the requirements of 2.8% per annum can be achieved by ensuring that the number of cardiology graduates in the advanced training is maintained at 24 until 2005. Beyond this period, current indicators show that a slight fall in the number of graduates to around 20 per year for the period 2006 to 2009 may be sufficient to ensure no notional

AMWAC 1999.5
68
shortages occur, however, it is too early to be definitive about this outcome (Table 39). As indicated in the Introduction to this report, this scenario assumes that the length of the RACP advanced training program would continue to be three years and that all candidates will complete the program within this time frame. This assumption has been necessary in the absence of data from RACP on average training program completion times, although there is some evidence emerging that up to about half of the advanced trainees may not be completing the advanced training program within three years. Table 39: Adult cardiology graduate output needed to move projected supply into balance with projected requirements, 2.8%growth per year, (in FTE hours), 1998 to 2009
Graduating year Intake year Number of graduates
Projected
supply
Projected
requirements
Balance
(oversupply)
%
oversupply Current advanced trainee numbers within the RACP program 1998
1996
21
34,472
34,472
base year
1999
1997
25
35,485
35,308
178
0.5
2000
1998
24
36,699
36,164
535
1.5
Recommended advanced trainees - beginning in 1999 2001
1999**
24
37,836
37,041
796
2.1
2002
2000
24
38,941
37,939
1,002
2.6
2003
2001
24
40,007
38,859
1,147
2.9
2004
2002
24
41,030
39,802
1,228
3.0
2005
2003
24
42,010
40,767
1,243
3.0
2006
2004
20
42,948
41,756
1,193
2.8
2007
2005
20
43,625
42,769
856
2.0
2008
2006
20
44,264
43,806
458
1.0
2009
2007
20
44,869
44,868
1
0.0
** Advanced trainee intake beginning 1999 and completing/graduating at the end of 2001. Source: AMWAC
Table 39 is shown graphically in figure 1. Figure 1 includes all demand indicators: population growth 45 to 64 years of age, greater than 65 and greater than 85 years of age, projected trends in ICD-9-CM for cardiology related procedures and diagnoses and trends in services attracting Medicare benefits plotted against the workforce supply using graduating advanced trainee figures (Table 40) in FTE demand hours per week to the year 2009.

AMWAC 1999.5
69
Figure 1: Cardiology specialists supply (average attrition rates) and demand projections based on a 60 hour week, maintaining an intake of 24 advanced trainees to the year 2003 and 20 thereafter.
-
5,000
10,000
15,000
20,000
25,000
30,000
35,000
40,000
45,000
50,000
55,000
60,000
1998 1999 2000 2001 2002 2003 2004 2005 2006 2007 2008 2009
Year
FTE
hour
s pe
r wee
k
ConstantPopulation growth (1997-2011)Medicare services per cardiologists (all items) 92/93-97/98Medicare services per cardiologists item 110 &116 92/93-97/98Cardiology-related diagnosis ICD-9-CM projected growth (1997-2008)Cardiology-related procedures ICD-9-CM projected growth (1997-2008)Population growth 45 - 64 years (1997-2011)Population growth 65 years and over (1997-2011)Population growth 85 years and over (1997-2011)Workforce (FTEs hrs/week)

AMWAC 1999.5
70
Given the sensitivity of the assumptions in the projection modelling, the Working Party felt it was important to consider a number of alternative situations. In particular the impact of a fall in the average number of hours worked per week by cardiologists, a greater than expected increase in female participation, and a higher than anticipated growth in requirements. The outcomes of these simulations are shown in figures 2 to 4, which summarise the impact of a fall in the average hours worked per week to 55 hours (figure 2), female trainee intake rising immediately to 30% (figure 3) and requirements growing at 5% per annum (figure 4). Figure 2: Scenario 1 - a working week of 55 hours beginning 1999 Cardiology specialists supply (average attrition rates) and demand projections based on a 55 hour week, incorporating an intake of 24 advanced trainees to the year 2003 and 20 thereafter
0
5000
10000
15000
20000
25000
30000
35000
40000
45000
50000
1998 1999 2000 2001 2002 2003 2004 2005 2006 2007 2008 2009Year
FTE
hour
s pe
r wee
k
Workforce (FTEs hrs/week) Requirements (FTEs hrs/week)

AMWAC 1999.5
71
Figure 3 – An increase of 30% female advanced trainees beginning in 1999. Cardiology specialists supply (average attrition rates) and demand projections based on working a 60 hour and incorporating an intake of 24 advanced trainees to the year 2003 and 20 thereafter.
Figure 4 – Cardiology demand requirements growing at 5% per annum. Cardiology specialists supply (average attrition rates) and demand projections based on working a 60 hours and incorporating an intake of 24 advanced trainees to the year 2003 and 20 thereafter.
-5 , 0 0 0
1 0 , 0 0 0
1 5 , 0 0 0
2 0 , 0 0 0
2 5 , 0 0 0
3 0 , 0 0 0
3 5 , 0 0 0
4 0 , 0 0 0
4 5 , 0 0 05 0 , 0 0 0
1 9 9 8 1 9 9 9 2 0 0 0 2 0 0 1 2 0 0 2 2 0 0 3 2 0 0 4 2 0 0 5 2 0 0 6 2 0 0 7 2 0 0 8 2 0 0 9
Y e a r
FTE
hou
rs p
er w
eek
W o r k f o r c e ( F T E s h r s / w e e k ) R e q u i r e m e n t s ( F T E s h r s / w e e k )
0
10000
20000
30000
40000
50000
60000
1998 1999 2000 2001 2002 2003 2004 2005 2006 2007 2008 2009
Year
FTE
hour
s pe
r wee
k
W orkforce (FTEs hrs/week) Requirem ents (FTEs hrs/week)

AMWAC 1999.5
72
These simulations show that of most significance would be a greater than expected increase in the intake of female trainees and/or a more dramatic increase in the expected requirements trend. Both scenarios would require an advanced trainee intake above 24 per year to ‘balance’ expected supply with requirements. As a result, the Working Party considers it will be important for AMWAC, the RACP and the CSANZ, to regularly monitoir the cardiology requirements and supply projections so that they can be amended if new trends emerge. Aspects of the workforce expected to require monitoring include the age and gender profile, distribution, hours worked, services provided (especially initial referred consultations), incidence of cardiac disease, evidence of unmet demand, and general practitioner views on the adequacy of the workforce. It will also be important to continue to monitor the trend in the numbers of non specialist providers and overseas trained specialists. The Working Party also recommends that a full update of this review of the cardiology workforce be undertaken in 2003. In addition, to ensure that sufficient flexibility is maintained in trainee intake, the Working Party recommends that as a guide first year advanced cardiology training placements be maintained in the range of 24 to 28 per years to the year 2003. This flexible approach to trainee intake is consistent with the noninterventional approach of the RACP to regulation of the workforce through trainee numbers; and also reflects concerns within the Working Party about the impact on the workforce of:
- any trend towards lower average hours worked per week; - a more dramatic increase in female participation than currently expected;
and - an increase in cardiology requirements above the expected growth of
2.8% per annum. In terms of any specific distribution of advanced trainees between States/Territories it was considered to difficult and restrictive to specify this. However, the distribution of first year advanced trainees in the past two years could serve as a possible guide, but nothing more (Table 40).

AMWAC 1999.5
73
Table 40: Distribution of cardiology first year advanced trainees, by State/Territory, 1997 and 1998 State/Territory
1997
1998
NSW/ACT
12
8
Victoria
7
7
Queensland
1
6
South Australia
4
2
Western Australia
1
0
Tasmania
0
1
Northern Territory
0
0
Australia
25
24
Source: RACP Finally, the Working Party would like to note its concern about the geographic maldistribution of the workforce. In this respect, whilst it is recognised that provincial/rural centres require a minimum level of appropriate infrastructure and population catchment to sustain a cardiology service, it would seem useful if State/Territory health departments, the RACP and the CSANZ could work together to consider innovative solutions that may help reduce the maldistribution within the workforce. In this respect one useful avenue may be through the RACPs Rural Workforce Advanced Training Program.

AMWAC 1999.5
74
RECOMMENDATIONS The following recommendations should be considered the minimum outcome for the workforce. The Working Party considers this to be important given the potential impact on the workforce of: - any trend towards lower average hours worked below 60 per week; - a more dramatic increase in female participation than anticipated; and - an increase in cardiology requirements above the expected growth of 2.8% per
annum assumed in the modelling. It also recognises that the current intake of trainees into the workforce appears to match projected needs and is consistent with the non interventional approach of the RACP towards regulation of the workforce through training numbers. The Working Party recommends: 1. That the RACP, in consultation with State/Territory health departments, maintain
its current flexible approach to cardiology trainee intake, ensuring as a guide first year advanced trainee placements are in the range of 24 to 28 per year to the year 2003. (There were 25 first year advanced cardiology trainees in 1997 and 24 in 1998)
The aim of maintaining first year advanced trainee numbers within this range is to match workforce supply with an expected future growth in cardiology requirements of 2.8% per annum.
2. That if necessary, the co-ordination of these cardiology trainee placements be
overseen by State/Territory based cardiology working groups, comprising representatives from the RACP, the Cardiac Society of Australia and New Zealand and State/Territory health departments.
3. That cardiology requirements and supply projections be monitored regularly so
they can be amended if new trends emerge; this monitoring be coordinated by RACP and AMWAC and the results incorporated into the AMWAC annual report to AHMAC. AMWAC will provide all necessary support.
Aspects of the workforce expected to require monitoring include the age and gender profile, distribution, hours worked, services provided (especially initial referred consultations), incidence of cardiac disease, evidence of unmet demand, and general practitioner views on the adequacy of the workforce.
4. That a full update of this review of the cardiology workforce be undertaken in 2003.

AMWAC 1999.5 75
APPENDIX A: RURAL, REMOTE AND METROPOLITAN AREAS CLASSIFICATION The Commonwealth Departments of Health and Family Services and Primary Industries and Energy, Rural Remote and Metropolitan Areas classification, has been used to classify the geographic location of the population and of medical practitioners in the following seven categories (DHFS & DPIE, 1997). Metropolitan areas: 1. Capital cities consist of the State and Territory capital cities of Sydney,
Melbourne, Brisbane, Perth, Adelaide, Hobart, Darwin and Canberra. 2. Other metropolitan centres consist of one or more statistical subdivisions which
have an urban centre of population of 100,000 or more in size. These centres are: Newcastle, Wollongong, Queanbeyan (part of Canberra-Queanbeyan), Geelong, Gold Coast-Tweed Heads, Townsville-Thuringowa.
Rural zones: 3. Provincial centres/large rural centres are statistical local areas where most of the
population reside in urban centres of population of 25,000 to 99,999. These centres are: Albury-Wodonga, Dubbo, Lismore, Orange, Port Macquarie, Tamworth, Wagga Wagga (NSW); Ballarat, Bendigo, Shepparton-Mooroopna (Vic); Bundaberg, Cairns, Mackay, Maroochydore-Mooloolaba, Rockhampton, Toowoomba (Qld), Whyalla (SA); and Launceston (Tas).
4. Small rural centres are statistical local areas in rural zones containing urban
centres of population between 10,000 and 24,999. These centres are: Armidale, Ballina, Bathurst, Broken Hill, Casino, Coffs Harbour, Forster-Tuncurry, Goulburn, Grafton, Griffith, Lithgow, Moree Plains, Muswellbrook, Nowra-Bombaderry, Singleton, Taree (NSW); Bairnsdale, Colac, Echuca-Moama, Horsham, Mildura, Moe-Yallourn, Morwell, Ocean Grove-Barwon Heads, Portland, Sale, Traralgon, Wangaratta, Warrnambool (Vic); Caloundra, Gladstone, Gympie, Hervey Bay, Maryborough, Tewantin-Noosa, Warwick (Qld); Mount Gambier, Murray Bridge, Port Augusta, Port Lincoln, Port Pirie (SA); Albany, Bunbury, Geraldton, Mandurah (WA); Burnie-Somerset, Devonport (Tas).
5. Other rural areas/remote areas are the remaining statistical areas within the rural
zone. Examples are Cowra Shire, Temora Shire, Guyra Shire (NSW); Ararat Shire, Cobram Shire (Vic); Cardwell Shire, Whitsunday Shire (Qld); Barossa, Pinnaroo (SA); Moora Shire, York Shire (WA); George Town, Ross (Tas); Coomalie, Litchfield (NT).

AMWAC 1999.5 76
Remote zones: These are generally less densely populated than rural statistical local areas and hundreds of kilometres from a major urban centre. 6. Remote centres are statistical local areas in the remote zone containing urban
centres of population of 5,000 or more. These centres are: Blackwater, Bowen, Emerald, Mareeba, Moranbah, Mount Isa, Roma (Qld); Broome, Carnarvon, East Pilbara, Esperance, Kalgoorlie/Boulder, Port Hedland, Karratha (WA); Alice Springs, Katherine (NT).
7. Other remote areas are the remaining areas within the remote zone. Examples
are: Balranald, Bourke, Cobar, Lord Howe Island (NSW); French Island, Orbost, Walpeup (Vic); Aurukun, Longreach, Quilpie (Qld); Coober Pedy, Murat Bay, Roxby Downs (SA); Coolgardie, Exmouth, Laverton, Shark Bay (WA); King Island, Strahan (Tas); Daly, Jabiru, Nhulunbuy (NT).
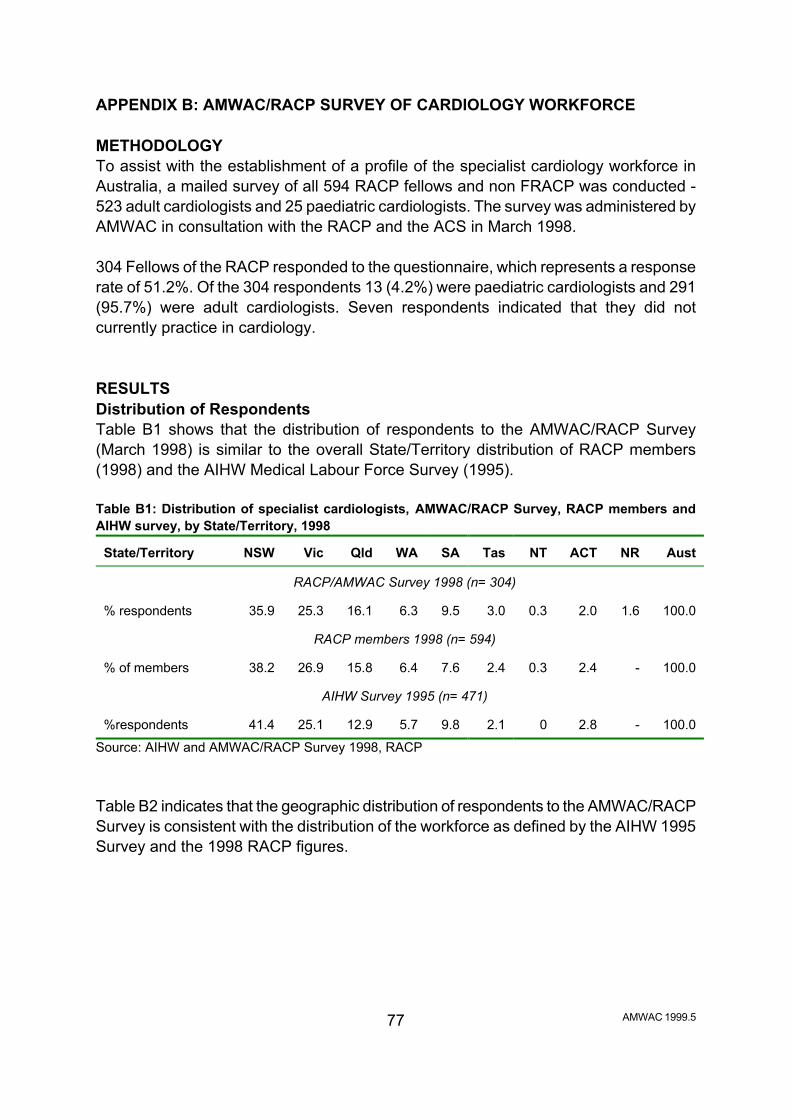
AMWAC 1999.5 77
APPENDIX B: AMWAC/RACP SURVEY OF CARDIOLOGY WORKFORCE METHODOLOGY To assist with the establishment of a profile of the specialist cardiology workforce in Australia, a mailed survey of all 594 RACP fellows and non FRACP was conducted - 523 adult cardiologists and 25 paediatric cardiologists. The survey was administered by AMWAC in consultation with the RACP and the ACS in March 1998. 304 Fellows of the RACP responded to the questionnaire, which represents a response rate of 51.2%. Of the 304 respondents 13 (4.2%) were paediatric cardiologists and 291 (95.7%) were adult cardiologists. Seven respondents indicated that they did not currently practice in cardiology. RESULTS Distribution of Respondents Table B1 shows that the distribution of respondents to the AMWAC/RACP Survey (March 1998) is similar to the overall State/Territory distribution of RACP members (1998) and the AIHW Medical Labour Force Survey (1995). Table B1: Distribution of specialist cardiologists, AMWAC/RACP Survey, RACP members and AIHW survey, by State/Territory, 1998
State/Territory
NSW
Vic
Qld
WA
SA
Tas
NT
ACT
NR
Aust
RACP/AMWAC Survey 1998 (n= 304)
% respondents
35.9
25.3
16.1
6.3
9.5
3.0
0.3
2.0
1.6
100.0
RACP members 1998 (n= 594)
% of members
38.2
26.9
15.8
6.4
7.6
2.4
0.3
2.4
-
100.0
AIHW Survey 1995 (n= 471)
%respondents
41.4
25.1
12.9
5.7
9.8
2.1
0
2.8
-
100.0
Source: AIHW and AMWAC/RACP Survey 1998, RACP Table B2 indicates that the geographic distribution of respondents to the AMWAC/RACP Survey is consistent with the distribution of the workforce as defined by the AIHW 1995 Survey and the 1998 RACP figures.

AMWAC 1999.5 78
Table B2: Specialist cardiologists, by geographic location, 1995 and 1998
Major urban
centre
Rural area
No response
Aust
AMWAC/RACP Survey 1998 (n= 304)
% respondents
83.6
14.1
2.3
100.0
RACP 1998 (n= 594)
% workforce
87.8
12.2
-
100.0
AIHW Survey 1995 (n= 471)
% workforce
90.0
10.0
-
100.0
Source: AIHW and AMWAC/RACP Survey 1998, RACP The Working Party concluded that a response rate of 51.2% was reasonable and that the distribution of respondents was sufficiently consistent with the distribution of the workforce to provide representative data. Current Employment Status Table B3 shows that of the 304 respondents practising in cardiology, 77.9% (237) worked full time and 19.7% (60) worked part time, 2.3% (7) indicated that they did not currently practice in cardiology. Of the 60 part time respondents 13.3% (8) were female compared to 86.7% (52) of male respondents. Of the seven respondents who indicated that they did not currently practice in cardiology five were males and two were female. One female was on maternity leave and the other female was a consultant in general medicine with a major specialty interest in geriatrics and minor specialty interest in cardiology. The five males included: two academics; a consultant in general medicine with a minor specialty interest in cardiology; and a retired consultant with a specialty in cardiology; a consultant in general medicine with a specialty interest in gastroenterology. Table B3: Employment status, by gender, 1998 Employment status
Male
Female
Total
Full time
228
9
237
% Full time
96.2
3.8
100.0
Part time
52
8
60
% Part time
86.7
13.3
100.0
Not currently practising in cardiology
5
2
7
Total
285
19
304
Source: AMWAC/RACP Survey 1998
AMWAC 1999.5 79
Of the 60 part time cardiologists, the majority were located in New South Wales (33.3%) and Victoria (33.3%). 66.7% (40) of part time cardiologists were located in major urban areas with 13.3% (8) located in provincial cities, 13.3% (8) located in small rural cities and 6.7% (4) in other rural areas. Table B4 shows that the majority of the eight part time females fall in the age range 31 to 35 years (50%, 4). Males working part time (52) were more evenly spread across age groups, although a significant proportion, 73.1% (38) were aged under 51 to 55 years. Table B4: Employment status, by gender and age, 1998 Age (yrs)
Male
Female
Total
Full time
Part time
Total
Full time
Part time
Total
31-35
19
6
25
2
4
6
31
36-40
54
6
60
1
1
2
62
41-45
39
8
47
3
1
4
51
46-50
37
6
43
2
0
2
45
51-55
39
12
51
1
0
1
52
56-60
21
2
23
0
1
1
24
61-65
15
7
22
0
1
1
23
66-70
4
5
9
0
0
0
9
Total
228
52
280
9
8
17
297
Source: AMWAC/RACP Survey 1998 Of the cardiologists working full time the average age was 46.5 years (standard deviation 8.8) and the range 31 to 69 years. The average age of males was 46.7 years (standard deviation 8.8) and females 42.4 (standard deviation 6.8). For part time cardiologists the average age was 48.7 years (standard deviation 10.9) and the range 33 to 69 years. The average age of males was 49.7 years (standard deviation 10.6) and females 42.0 (standard deviation 11.1). Gender Profile 6.3% (19) of respondents to the AMWAC/RACP Survey were female cardiologists, 93.8% (285) were males. RACP March 1998 figures indicate that 5.4% (32) of females are currently in the cardiology workforce (n=594). In rural and remote areas the majority of specialist cardiologists are males as is shown in Table B5. Provincial areas are represented by 95.8% (23) males, in small rural centres males represent 84.5% (11) and in large remote centres males represent 100% of the cardiology workforce.

AMWAC 1999.5 80
Table B5: Specialist cardiologists, by geographic location and gender, 1998
Location
Male
Female
Total
%
Capital city
223
13
236
77.6
Other metropolitan
16
2
18
5.9
Provincial centre
23
1
24
7.9
Small rural centre
11
2
13
4.3
Other rural centre
5
0
5
1.6
Large remote centre
1
0
1
0.3
No response
6
1
7
2.3
Total
285
19
294
100.0
Source: AMWAC/RACP Survey 1998 Of the thirteen respondents that indicated that they practised in paediatric cardiology all were located in a capital city. Clinical Practice Table B6 represents the area of cardiology practice for both RACP figures and responses to the survey. The responses to the survey are consistent with that of RACP. Table B6: Main area of clinical practice (%), 1998 Clinical practice
AMWAC/RACP Survey
(n=304)
RACP
(n=596) Unknown Consultant – Adult
4.6
7.7
Consultant in general medicine - Adult
1.5
1.5
Consultant in general medicine with a specialty interest - Adult
9.8
10.1
Consultant in specialty field – Adult
72.4
66.5
Consultant in specialty field with general responsibilities - Adult
6.1
8.4
Specialist unreferred – Adult
1.3
1.4
Consultant Paediatrician with a specialty field
3.2
3.4
Consultant Paediatrician with a specialty field with general responsibilities
0.7
0.5
Paediatric specialty interest
0.4
0.5
Total
100
100
Source: AMWAC/RACP Survey 1998, RACP
AMWAC 1999.5 81
There were 13 (4.2%) respondents who indicated they were paediatric cardiologists. All were male, and all were situated in capital cities. New South Wales, Queensland and Western Australia had three each, two were situated in Victoria and one in both South Australia and the Northern Territory. The average age of the 13 paediatric cardiologists was 47.5 years (standard deviation 8.8) with an age range of 37 to 65 years. The average hours worked per week by paediatric cardiologists was 59.4 years (standard deviation 11.2) and 6.5 hours (standard deviation 5.2) on call back. There were 291 (95.7%) respondents who indicated that they were adult cardiologists, which includes five who indicated that they did not currently practice in cardiology (three males and two females). Of those currently practising in cardiology 267 (93.3%) were males and 19 (6.6%) were females, the average age for males was 47.3 years (standard deviation 9.3) with an age range of 31 to 69 years and for females 42.3 years (standard deviation 9.2) with an age range of 31 to 61 years . Table B7 summarises the geographic distribution of the adult cardiologists by gender and full time or part time employment. The majority (52.6%) of female cardiologists worked part time. Table B7: Adult cardiologists by geographic location, gender and full time or part time employment, 1998 Location
Males
Females
Total
Full time
Part time
Full time
Part time
Capital city
178
33
7
6
224
Other metropolitan
14
2
1
1
18
Provincial city
16
7
0
1
24
Small rural city
5
5
0
2
12
Other rural area
3
2
0
0
5
No response
1
1
1
0
3
Total
217
50
9
10
286
Source: AMWAC/RACP Survey 1998, RACP Respondents were asked to identify whether they were a physician with a major or minor interest in cardiology and what percentage of their time per week was spent in cardiology. Currently RACP and ACS has listed 46 non-FRACP cardiologists who have either a major or minor interest in cardiology, this survey had 43 respondents. There was 38 who indicated they had a major interest in cardiology and spent an average of 64.5% of their time per week in cardiology. Five physicians indicated that they had a
AMWAC 1999.5 82
minor interest in cardiology spending an average of 26.7% of their time per week in cardiology. Age Profile From the AMWAC/RACP Survey, the age range of respondents was from 31 years to 69 years with an average age of 47.0 years (standard deviation 9.4). The largest group of respondents was the 36 to 45 year age group (37.5%, 114), 3.3% of respondents were aged 66 years and over (Table B8). Compared to the 1995 AIHW Survey, cardiologists over 66 years are under reported in the AMWAC/RACP Survey and RACP data, this could be a result of retirees since 1995. The age profile of the AMWAC/RACP Survey is consistent with both RACP and AIHW data as is shown in Table B8. Table B9 summarises the age profile of the AMWAC/RACP Survey by State/Territory. Table B8: Age profile of specialist cardiologists, AMWAC/RACP survey, RACP membership and AIHW survey
<35 yrs
36-45 yrs
46-55 yrs
56-65yrs
66-75 yrs
75+yrs
AMWAC/RACP Survey 1998 (n=304)
% respondents
10.8
37.5
32.6
15.8
3.3
0.0
RACP 1998 (n=594)
% specialists
14.5
34.4
32.9
15.3
2.9
0.0
AIHW Survey 1995 (n= 471)
% respondents
8.5
32.3
34.0
14.0
9.9
1.3
Source: AIHW and AMWAC/RACP Survey, RACP Table B9: Age profile of specialist cardiologists, by State/Territory, 1998
State/Terr.
<36 yrs
36-45 yrs
46-55 yrs
56-65yrs
66-70 yrs
Total
NSW
14
42
34
15
4
109
Vic
6
29
25
13
4
77
Qld
6
23
14
6
0
49
WA
0
7
6
6
0
19
SA
6
9
9
4
1
29
Tas
0
1
6
2
0
9
NT
0
1
0
0
0
1
ACT
0
1
4
1
0
6
No response
1
1
1
1
1
5
Australia
33
114
99
48
10
304
Source: AMWAC/RACP Survey 1998
AMWAC 1999.5 83
The age profile of the adult and paediatric cardiologists is summarised in Table B10 and is consistent with RACP data. Table B10: Age profile of specialist cardiologists, by gender, AMWAC/RACP survey, RACP membership, 1998
Gender
<36 yrs
36-45 yrs
46-55 yrs
56-65yrs
66-70 yrs
Total
Adult Cardiologists AMWAC/RACP Survey (n=286)
Males
25
100
90
43
9
267
Females
7
6
4
2
0
19
Total
32
106
94
45
9
286
%Males
78.1
94.3
95.7
95.6
100.0
93.4
%Females
21.9
5.7
4.3
4.4
0.0
6.6
Paediatric Cardiologists AMWAC/RACP Survey (n=13)
Males
0
7
4
2
0
13
% Males
0.0
53.8
30.8
15.4
0.0
100.0
Adult Cardiologists RACP March 1998 (n=569)
Males
74
176
187
84
17
538
Females
12
15
3
1
0
31
Total
86
191
190
85
17
569
%Males
86.0
92.1
98.4
98.8
100.0
94.6
%Females
14.0
7.9
1.6
1.2
0.0
5.4
Paediatric Cardiologists RACP March 1998 (n=25)
Males
0
13
5
6
0
24
Females
0
0
1
0
0
1
Total
0
13
6
6
0
25
%Males
0.0
100.0
83.3
100.0
0.0
96.0
%Females
0.0
0.0
16.7
0.0
0.0
4.0
Total Cardiology Workforce March RACP 1998 (n=596)
Males
74
189
192
90
17
562
Females
12
15
4
1
0
32
Total
86
204
196
91
17
594
Source: AIHW and AMWAC/RACP Survey, RACP

AMWAC 1999.5 84
Specialist Qualification All respondents indicated that they held the Fellow of the Royal Australasian College of Physicians (FRACP). Table B11 summarises where the respondents received their advanced training by age range and indicates that the majority of all Fellows (50.7%) received their training under the auspices of the Specialist Advisory Committee. Table B11: Place of advanced training by age range, 1998 Advanced training
under 50
years
51 to 60
years
over 60
years
Total
Under the auspices of the Specialist Advisory Committee
143
9
2
154
Under the auspices of another Specialist Advisory Committee
25
8
1
34
Under the auspices of the Specialist Advisory Committee and under the auspices of another Specialist Advisory Committee
7
0
0
7
Prior to the establishment of a Specialist Advisory Committee.
7
56
27
90
Other
2
4
1
7
No response
9
1
2
12
Total
193
78
33
304
Source: AMWAC/RACP Survey 1998 Members of the CSANZ totalled 269 (88.5%) out of 304, there were 35 (11.5%) respondents who were not members. Those with full membership represented 73.2% (197) and those with associate membership 22.3% (60), 4.5% (12) did not specify type of membership. The majority (44.9%, 121) of respondents with membership to the CSANZ were aged under 50 years and 86.7% (233) were located in urban areas. Respondents were asked to specify what is their other major specialist qualification in addition to FRACP of which 12.2% (37) responded, Table B12. The majority (56.8%) of respondents indicated General Medicine as the other major specialist qualification.

AMWAC 1999.5 85
Table B12: Other specialist qualifications by metropolitan and country locations, 1998 Other Specialty
Metropolitan
Country
No response
Total
Clinical Pharmacology
1
0
0
1
General Medicine
13
7
1
21
Intensive Care
2
0
0
2
Internal Medicine
2
1
0
3
Nuclear Medicine
3
0
0
3
Paediatrics
3
1
0
4
Thoracic Medicine
0
3
0
3
Total
24
12
1
37
Source: AMWAC/RACP Survey 1998 Type of Practice Respondents were asked to indicate the proportion of time that they spent in a salaried position and in private practice. 195 (64.1%) indicated they practised in both a salaried position and in private practice. No response was given by 10 (3.3%) respondents. 21 (6.9%) indicated they practised 100% in a salaried position. The average age was 48.1 years (standard deviation 10.3) and the age range was 34 to 63 years. Of these respondents 18 (85.7%) were male and 3 (14.3%) were female. The majority (70.5%, 55) were located in urban areas. 78 (25.7%) indicated they worked 100% in private practice. The average age was 49.2 years (standard deviation 9.2) and the age range 33 to 68 years. Of these respondents 76 (97.4%) were male and 2 (2.6%) were female. The majority (90.5%, 19) were located in urban areas. Source of salary The source of salary was requested from respondents. Table B13 summarises the source of salary by those respondents in a salaried position and indicates that the majority are in public hospitals (48.7%) and are located in urban areas. The majority (52.6%, 10) of females are in a full time salaried position in a public hospital as are the majority (55.8%, 159) of males.

AMWAC 1999.5 86
Table B13: Salaried position by source of salary and geographic location, 1998
Urban areas
Rural areas
No response
Total
Public hospital
148
20
1
169
Private hospital
1
0
0
1
University
11
0
0
11
Research/Institute
7
0
0
7
Other
2
1
0
3
Public and Private hospital
4
0
0
4
Public hospital & University
9
0
1
10
Public hospital & Research/Institute
10
0
0
10
No response
62
22
5
89
Total
254
43
7
304
Source: AMWAC/RACP Survey 1998 Table B14 summarises the source of salary by those respondents in private practice. Table B14: Private practice position by source of salary and geographic location, 1998
Urban areas
Rural areas
No response
Total
Public hospital appointment - paid
146
33
1
180
Public hospital appointment - unpaid
14
2
0
16
Public & private hospital appointment
10
3
0
13
Private hospital appointment only
29
2
0
31
No hospital appointment
4
1
0
5
No response
51
2
6
59
Total
254
43
7
304
Source: AMWAC/RACP Survey 1998

AMWAC 1999.5 87
Hours Worked The AMWAC/RACP Survey asked respondents to indicate the hours worked in a typical week. The definitions used are listed below. Total hours worked in a typical week The total hours spent in patient care, including hours on call back worked and time spent on non patient care activities such as administration, continuing medical education, teaching and research. Hours worked excluded time spent on travel between work locations (except travel to calls out) and unpaid professional and/or voluntary activities. Total hours on call back worked in a typical week Once called to duty, the time spent on duty, including travel time. Total hours on call not worked in a typical week The average hours per week for which the practitioner was on standby for a call to duty but were not worked. Once called to duty, the time spent on duty including travel time is counted in total hours worked and should have been indicated in the total hours on call back worked in a typical week. On average, the total full time cardiology workforce worked 60.5 hours per week (mode 60 hours; standard deviation 11.2). There was no significant difference in hours worked by full time adult and paediatric cardiologists. Adult cardiologists worked 60.5 hours per week (mode 60; standard deviation 11.2), and 4.2 hours worked on call back per week (mode 2; standard deviation 8.9). Paediatric cardiologists worked 59.4 hours per week (mode 60; standard deviation 11.5), and 6.5 hours worked on call back per week (mode 5; standard deviation 5.2). In the following tables the total cardiology workforce is examined. The AMWAC/RACP Survey (n=304) indicated that there were 4.3% (13) of cardiology specialists who worked less than 35 hours per week and 5.6% (17) who reported working 80 hours per week or more, more than double the proportion of other specialties, Table B15. For the 60 respondents who indicated that they were in part time employment, all but thirteen, worked over 35 hours per week.

AMWAC 1999.5 88
Table B15: Total hours worked by specialist cardiologists, by gender, 1998 Total hours worked
Males
Females
% total worked
1 to 19 hours
1
2
1.0
20 to 34 hours
7
3
3.3
35 to 49 hours
21
1
7.2
50 to 64 hours
151
9
52.6
65 to 79 hours
82
3
28.0
80 hours and over
17
0
5.6
No response
6
1
2.3
Total
285
19
100
Source: AMWAC/RACP Survey The majority of the respondents (73.0%) indicated that they worked 55 hours or more. A significant difference was observed between the total hours worked by males and females, with 31.5% (6) of women working less than 45 hours per week compared with 7% (20) of men and 47.4% (9) of women working 55 hours or more per week compared with 74.7% (213) of men. Table B16: Total hours worked by specialist cardiologists, by gender, 1998 Total hours worked
Males
Females
% total worked
less than 45 hours
20
6
8.6
45 to 54 hours
46
3
16.1
55 hours or more
213
9
73.0
No response
6
1
2.3
Total
285
19
100
Source: AMWAC/RACP Survey 79.9% (n=304) of cardiology specialists in the AMWAC/RACP survey reported being on call for after hours worked. The average time worked on-call back was 4.0 hours per week (median 2; mode 2; standard deviation 8.1). For males the average time worked on-call back was 4.2 hours per week (median 2; mode 2; standard deviation 8.3) and for females average time worked on-call back was 2.5 hours per week (median 2; mode 2; standard deviation 2.5).

AMWAC 1999.5 89
The average hours worked varied by region with the average hours worked in major urban areas at 60.4 hours a week compared to 63.3 hours a week in other rural areas. The number of hours on call back rose with distance away from a metropolitan area, with other rural areas cardiologists reporting 5.3 hours on call back compared to 4.3 hours for those working in capital cities. Adult cardiologists working in a public hospital indicated that they spent between 1 and 100% (mean 32.9%, mode 10%) of their time in patient care activities. For non patient care activities adult cardiologists spent between 1 and 95% (mean 19.4%, mode 5%) of their total time. Adult cardiologists working in a private hospital indicated that they spent between 1 and 95% (mean 14.9%, mode 10%) of their time in patient care activities. For non patient care activities adult cardiologists spent between 1 and 70% (mean 6.3%, mode 5%) of their total time. Adult cardiologists working in private rooms indicated that they spent between 5 and 90% (mean 43.7%, mode 10%) of their time in patient care activities. For non patient care activities adult cardiologists spent between 1 and 37% (mean 10.3%, mode 10%) of their total time. Paediatric cardiologists working in a public hospital indicated that they spent between 10 and 85% (mean 55.0%, mode 50%) of their time in patient care activities. For non patient care activities paediatric cardiologists spent between 10 and 50% (mean 21.5%, mode 10%) of their total time. Paediatric cardiologists working in a private hospital indicated that they spent between 5 and 10% (mean 6.3%, mode 5%) of their time in patient care activities. Paediatric cardiologists working in private rooms indicated that they spent between 8 and 100% (mean 46.1%, mode 50%) of their time in patient care activities. For non patient care activities paediatric cardiologists spent between 2 and 10% (mean 6.4%, mode 10%) of their total time. Practice Profile The survey asked respondents to indicate the approximate number of procedures performed per year in private and public facilities. The tables below summarise the procedures by public and private and by adult and paediatric cardiologists. Table B17 summarises the number of procedures performed per year in private and public facilities by adult cardiologists and indicates a wide variation.

AMWAC 1999.5 90
Table B17: Number of procedures performed per year in private and public facilities by adult cardiologists, 1998 (mean ± standard deviation (mode) (range)) Procedure type
Approximate number of procedures per
year
Public
Private
1) Resting ECGs
1,238 ± 1,658
(500) (6-11,000)
902 ± 1,013 (500)
(5-6,000) 2) Ambulatory ECGs (Holter monitors)
108 ± 137
(50) (2-500)
182 ± 298
(100) (2-3,000) 3) Exercise stress testing (non nuclear)
168 ± 155
(50) (2-700)
344 ± 364
(200) (2-2,000) 4) Trans thoracic echo cardiograms including stress echo cardiograms
456 ± 644
(200) (3-4,000)
479 ± 442
(100) (3-2,000) 5) Trans oesophagical echo cardiograms
150 ± 595
(100) (1-5,050)
58 ± 68
(50) (2-375) 6) Diagnostic cardiac catheterisations
212 ± 154
(200) (2-1,000)
145 ± 173
(100) (1-1,609) 7) Interventional paediatric catheter procedures
7 ± 3
(5) (5-10)
5 ± 0
8) Diagnostic invasive electrophysiology procedures
45 ± 44
(50) (5-200)
351 ± 1312
(50) (2-6,060) 9) Radio frequency ablations and other interventional electrophysiology procedures
41 ± 35
(50) (1-125)
50 ± 53
(30) (1-200) 10) Interventional coronary and valvular procedures in
adults
131 ± 88
(150) (2-300)
87 ± 79
(100) (1-350) 11) Implantation of temporary pacemakers
9 ± 11
(5) (1-75)
10 ± 29
(5) (1-250) 12) Implantation of permanent pacemakers
47 ± 51
(20) (5-200)
66 ± 103
(20) (1-450) 13) Implantation and testing of implantable defibrillators (AICD)
12 ± 10
(10) (1-30)
12 ± 12
(5) (2-50) 14) Nuclear cardiology procedures (if you are a licensed nuclear physician)
482 ± 571
(350) (5-2,000)
620 ± 593
(1,000)(1-1,400)
Source: AMWAC/RACP Survey Table B18 shows the number of procedures performed per year (presented as a percentage) by the total cardiology workforce in public and private facilities.

AMWAC 1999.5 91
Table B18: Number of procedures performed per year in private and public facilities by all cardiologists, 1998 (n=304) Number of procedures performed per year
0
<50
51-100
101-400
401-1000
1001-5000
>5000
Number of procedures
Percentage (%) performed
1) Resting ECGs
17.4
4.6
3.3
12.8
27.3
31.3
3.3
2) Ambulatory ECGs (Holter monitors)
31.3
20.7
13.8
24.7
8.9
0.7
0
3) Exercise stress testing (non nuclear)
23.7
13.5
8.2
30.9
20.4
3.3
0
4) Trans thoracic echo cardiograms incl stress echo cardiograms
40.8
4.9
4.3
17.1
20.4
12.5
0
5) Trans oesophagical echo cardiograms
66.1
17.1
7.9
8.2
0.3
0.3
0
6) Diagnostic cardiac catheterisations
43.1
8.2
5.3
33.2
9.5
0.7
0
7) Interventional paediatric catheter procedures
96.4
3.6
0
0
0
0
0
8) Diagnostic invasive electrophysiology procedures
89.8
5.6
2.6
1.3
0.3
0
0.3
9) Radio frequency ablations and other interventional electrophysiology procedures
90.1
5.3
3.3
1.3
0
0
0
10) Interventional coronary & valvular procedures in adults
74.3
6.3
4.3
14.5
0.7
0
0
11) Implantation of temporary pacemakers
53.9
45.1
0.3
0.7
0
0
0
12) Implantation of permanent pacemakers
80.9
12.8
1.3
4.6
0.3
0
0
13) Implantation & testing of implantable defibrillators (AICD)
92.1
7.9
0
0
0
0
0
14) Nuclear cardiology procedures
96.1
0.3
0
2.0
0.7
1.0
0
Source: AMWAC/RACP Survey Consultation Waiting Times Table B19 summarise the average waiting time for a standard first consultation with a specialist in adult cardiology in his/her private rooms is 18.3 days (mode 14, standard deviation 15.2) while public patients wait twice as long, an average of 35.7 days (mode 28, standard deviation 28.8). These waiting times are not benchmarks but are self reported.

AMWAC 1999.5 92
Table B19: Specialist adult cardiology average waiting time (days) for a standard first consultation and a clinically urgent procedure, by private rooms/public outpatients department and State/Territory, 1998 (mean ± standard deviation (mode)) State/Territory
Standard consultation
Clinically urgent condition
Private patients
NSW
19.0 ± 18.7 (14)
2.8 ± 3.7 (1)
Victoria
20.4 ± 13.9 (7)
2.0 ± 2.2 (1)
Queensland
15.6 ± 11.6 (14)
2.2 ± 3.1 (1)
Western Australia
19.0 ± 9.3 (28)
3.0 ± 3.9 (1)
South Australia
15.0 ± 10.6 (14)
3.0 ± 3.2 (1)
Tasmania
12.1 ± 9.7 (14)
0.8 ± 0.4 (1)
Northern Territory
-
-
ACT
28.0 ± 20.4 (7)
2.8 ± 2.7 (3)
Total
18.3 ± 15.2 (14)
2.4 ± 3.1 (1)
Public patients
NSW
30.0 ± 27.3 (7)
6.7 ± 13.7 (1)
Victoria
29.7 ± 19.7 (28)
5.7 ± 5.9 (7)
Queensland
57.3 ± 34.8 (42)
10.2 ± 12.4 (7)
Western Australia
56.6 ± 36.4 (28)
18.6 ± 26.8 (14)
South Australia
24.2 ± 10.5 (21)
7.9 ± 6.4 (7)
Tasmania
11.0 ± 9.5 (7)
0.8 ± 0.8 (0)
Northern Territory
-
-
ACT
39.7 ± 39.8 (7)
2.0 ± 3.4 (0)
Total
35.7 ± 28.8 (28)
7.7 ± 12.4 (7)
Source: AMWAC/RACP Survey The average consultation waiting time for a clinically urgent condition with a specialist in adult cardiology in his/her private rooms is 2.4 days (mode 1, standard deviation 3.1) while public patients wait longer an average of 7.7 days (mode 7, standard deviation 12.4). Private patients The waiting times for private patients for a standard first consultation are higher in Australian Capital Territory, Victoria and New South Wales than the self reported national average (18.3 ± 15.2). For a clinically urgent condition the Australian Capital

AMWAC 1999.5 93
Territory, South Australia, New South Wales and Western Australia are higher than the self reported national average (2.4 ± 3.1). Public patients For a standard first consultation, public patient waiting times in Queensland (57.3 ± 34.8), Western Australia (56.6 ± 36.4) and the Australian Capital Territory (39.7 ± 39.8) are higher than the self reported national average (35.7 ± 28.8). For a clinically urgent condition, public patient waiting times in Western Australia (18.6 ± 26.8), Queensland (10.2 ± 12.4) and South Australia (7.9 ± 6.4) await well above the self reported national average (7.7 ± 12.4). Table B21 summarise the average waiting time for a standard first consultation with a specialist in paediatric cardiology in his/her private rooms is less than that of a adult cardiologists: 14.4 days (mode 7, standard deviation 15.3). Public patients wait twice as long, an average of 30.8 days (mode 28, standard deviation 18.7). Similarly, the average consultation waiting time for a clinically urgent condition with a specialist in paediatric cardiology in his/her private rooms is less than the adult cardiologists waiting time: 1.6 days (mode 1, standard deviation 0.9). Public patients wait twice as long: an average of 3.1 days (mode 1, standard deviation 2.8). These waiting times are not benchmarks but are self reported. Private patients The waiting times for private patients for a standard first consultation are higher in South Australia and Victoria than the self reported national average (14.4 ± 15.3). For a clinically urgent condition the New South Wales and Victoria are higher than the self reported national average (1.6 ± 0.9). Public patients For a standard first consultation, public patient waiting times in South Australia, Victoria and New South Wales are higher than the self reported national average (30.8 ± 18.7). For a clinically urgent condition, public patient waiting times in Victoria, Western Australia and Queensland await well above the self reported national average (3.1 ± 2.8).

AMWAC 1999.5 94
Table B20: Specialist paediatric cardiology average waiting time (days) for a standard first consultation and an urgent procedure, by private rooms/public outpatients department and State/Territory, 1998 (mean ± standard deviation (mode))
State/Territory
Standard consultation
Clinically urgent condition
Private patients
NSW
11.7 ± 8.1 (7)
2.0 ± 1.0 (1)
Victoria
31.5 ± 34.6 (7)
3.0 ± 0 (3)
Queensland
9.5 ± 6.4 (5)
1.0 ± 1.0 (1)
Western Australia
6.7 ± 6.4 (3)
1.0 ± 0 (1)
South Australia
21.0 ± 0 (21)
1.0 ± 0 (1)
Total
14.4 ± 15.3 (7)
1.6 ± 0.9 (1)
Public patients
NSW
31.5 ± 34.6 (7)
1.5 ± 0.7 (1)
Victoria
35.0 ± 29.7 (14)
5.0 ± 2.8 (3)
Queensland
21.0 ± 9.9 (14)
4.0 ± 4.2 (1)
Western Australia
24.5 ± 4.9 (21)
4.0 ± 4.2 (1)
South Australia
56.0 ± 0 (56)
1.0 ± 0 (1)
Total
30.8 ± 18.7 (28)
3.1 ± 2.8 (1)
Source: AMWAC/RACP Survey Table B21 shows that the average waiting times in metropolitan and country areas for the cardiology workforce. Country waiting times for a standard first consultation and a clinically urgent condition are lower than those in metropolitan areas and the self reported national average, with the exception of a private patient standard first consultation which has a higher waiting time. Table B21: Specialist cardiology average waiting times (days), by geographic locations, 1998
Metropolitan
Rural
Australia
Standard first consultation public outpatient
36.9 ± 28.9
(28)
26.9 ± 21.7 (7)
35.5 ± 28.2 (28)
Standard first consultation private consultation
17.1 ± 14.0
(14)
24.8 ± 20.2 (7)
18.3 ± 15.2 (14)
Clinically urgent condition public outpatient
8.1 ± 12.7 (7)
3.4 ± 4.4 (1)
7.4 ± 12.0 (1)
Clinically urgent condition private consultation
2.5 ± 3.1 (1)
2.0 ± 3.0 (1)
2.4 ± 3.1 (1 )
Source: AMWAC/RACP Survey These results can be further analysed by rural remote and metropolitan areas. In

AMWAC 1999.5 95
general patients in capital cities and other metropolitan areas wait longer for a clinically urgent appointment than patients in rural and remote areas, Table B22. Table B22: Average waiting times (days), geographic location, 1998 Location
Standard first
consultation public outpatient
Standard first
consultation private
consultation
Clinically urgent condition public
outpatient
Clinically urgent
condition private
consultation Capital city
35.6 ± 27.4 (28)
16.3 ± 12.9 (14)
8.2 ± 13.0 (7)
2.4 ± 3.1 (1)
Other metro
56.0 ± 43.0 (7)
26.4 ± 22.2 (14)
6.6 ± 5.2 (5)
3.1 ± 3.5 (1)
Provincial city
26.8 ± 18.9 (21)
24.4 ± 19.0 (21)
5.0 ± 5.2 (1)
2.7 ± 3.8 (1)
Small rural
39.7 ± 39.8 (7)
28.3 ± 24.3 (5)
1.0 ± 0 (1)
1.2 ± 1.2 (1)
Other rural
14.0 ± 12.1 (7)
18.4 ± 16.6 (1)
1.0 ± 0 (1)
1.3 ± 0.7 (1)
Large remote
28.0 ± 0 (28)
-
1.0 ± 0 (1)
-
Australia
35.5 ± 28.2 (28)
18.3 ± 15.2 (14)
7.4 ± 12.0 (1)
2.4 ± 3.1 (1)
Source: AMWAC/RACP Survey Professional Satisfaction Responses regarding professional satisfaction made by adult and paediatric cardiologists were examined and found to be similar. Overall, 86.5% (263) of respondents were satisfied with their work. Aspects of their work with which they were most satisfied were sufficient work to maintain competence, opportunity to use your abilities, and availability of other specialists, Table B23. Aspects of their work with which they were most dissatisfied (in order of percentage of people expressing dissatisfaction) were hours of work, amount of work and availability of allied health professionals.
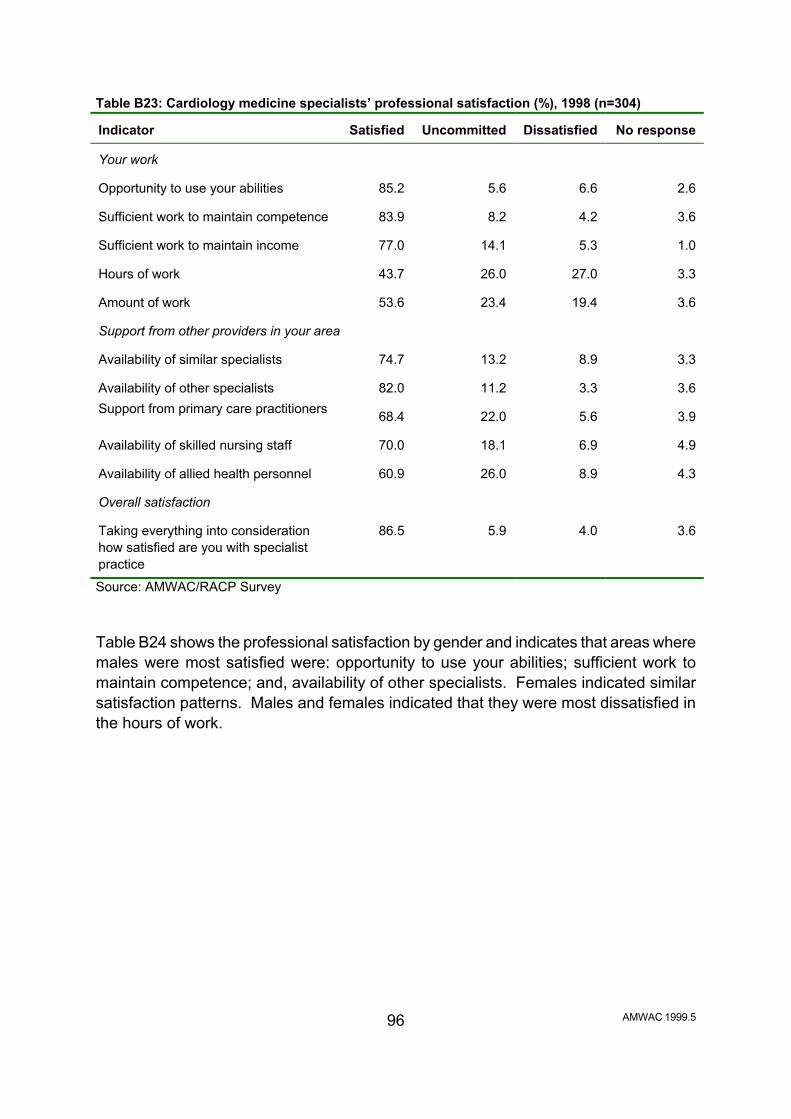
AMWAC 1999.5 96
Table B23: Cardiology medicine specialists’ professional satisfaction (%), 1998 (n=304) Indicator
Satisfied
Uncommitted
Dissatisfied
No response
Your work
Opportunity to use your abilities
85.2
5.6
6.6
2.6
Sufficient work to maintain competence
83.9
8.2
4.2
3.6
Sufficient work to maintain income
77.0
14.1
5.3
1.0
Hours of work
43.7
26.0
27.0
3.3
Amount of work
53.6
23.4
19.4
3.6
Support from other providers in your area Availability of similar specialists
74.7
13.2
8.9
3.3
Availability of other specialists
82.0
11.2
3.3
3.6
Support from primary care practitioners 68.4
22.0
5.6
3.9
Availability of skilled nursing staff
70.0
18.1
6.9
4.9
Availability of allied health personnel
60.9
26.0
8.9
4.3
Overall satisfaction Taking everything into consideration how satisfied are you with specialist practice
86.5
5.9
4.0
3.6
Source: AMWAC/RACP Survey Table B24 shows the professional satisfaction by gender and indicates that areas where males were most satisfied were: opportunity to use your abilities; sufficient work to maintain competence; and, availability of other specialists. Females indicated similar satisfaction patterns. Males and females indicated that they were most dissatisfied in the hours of work.
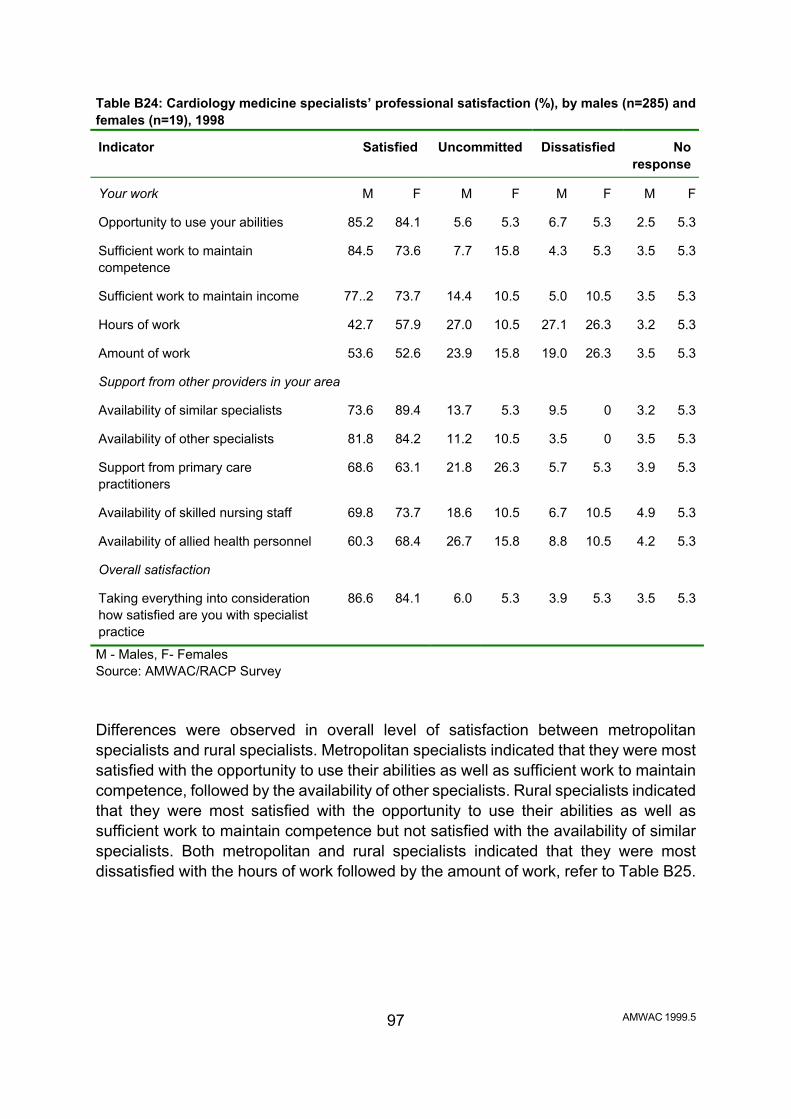
AMWAC 1999.5 97
Table B24: Cardiology medicine specialists’ professional satisfaction (%), by males (n=285) and females (n=19), 1998 Indicator
Satisfied
Uncommitted
Dissatisfied
No
response Your work
M
F
M
F
M
F
M
F
Opportunity to use your abilities
85.2
84.1
5.6
5.3
6.7
5.3
2.5
5.3
Sufficient work to maintain competence
84.5
73.6
7.7
15.8
4.3
5.3
3.5
5.3
Sufficient work to maintain income
77..2
73.7
14.4
10.5
5.0
10.5
3.5
5.3
Hours of work
42.7
57.9
27.0
10.5
27.1
26.3
3.2
5.3
Amount of work
53.6
52.6
23.9
15.8
19.0
26.3
3.5
5.3
Support from other providers in your area Availability of similar specialists
73.6
89.4
13.7
5.3
9.5
0
3.2
5.3
Availability of other specialists
81.8
84.2
11.2
10.5
3.5
0
3.5
5.3
Support from primary care practitioners
68.6
63.1
21.8
26.3
5.7
5.3
3.9
5.3
Availability of skilled nursing staff
69.8
73.7
18.6
10.5
6.7
10.5
4.9
5.3
Availability of allied health personnel
60.3
68.4
26.7
15.8
8.8
10.5
4.2
5.3
Overall satisfaction Taking everything into consideration how satisfied are you with specialist practice
86.6
84.1
6.0
5.3
3.9
5.3
3.5
5.3
M - Males, F- Females Source: AMWAC/RACP Survey Differences were observed in overall level of satisfaction between metropolitan specialists and rural specialists. Metropolitan specialists indicated that they were most satisfied with the opportunity to use their abilities as well as sufficient work to maintain competence, followed by the availability of other specialists. Rural specialists indicated that they were most satisfied with the opportunity to use their abilities as well as sufficient work to maintain competence but not satisfied with the availability of similar specialists. Both metropolitan and rural specialists indicated that they were most dissatisfied with the hours of work followed by the amount of work, refer to Table B25.
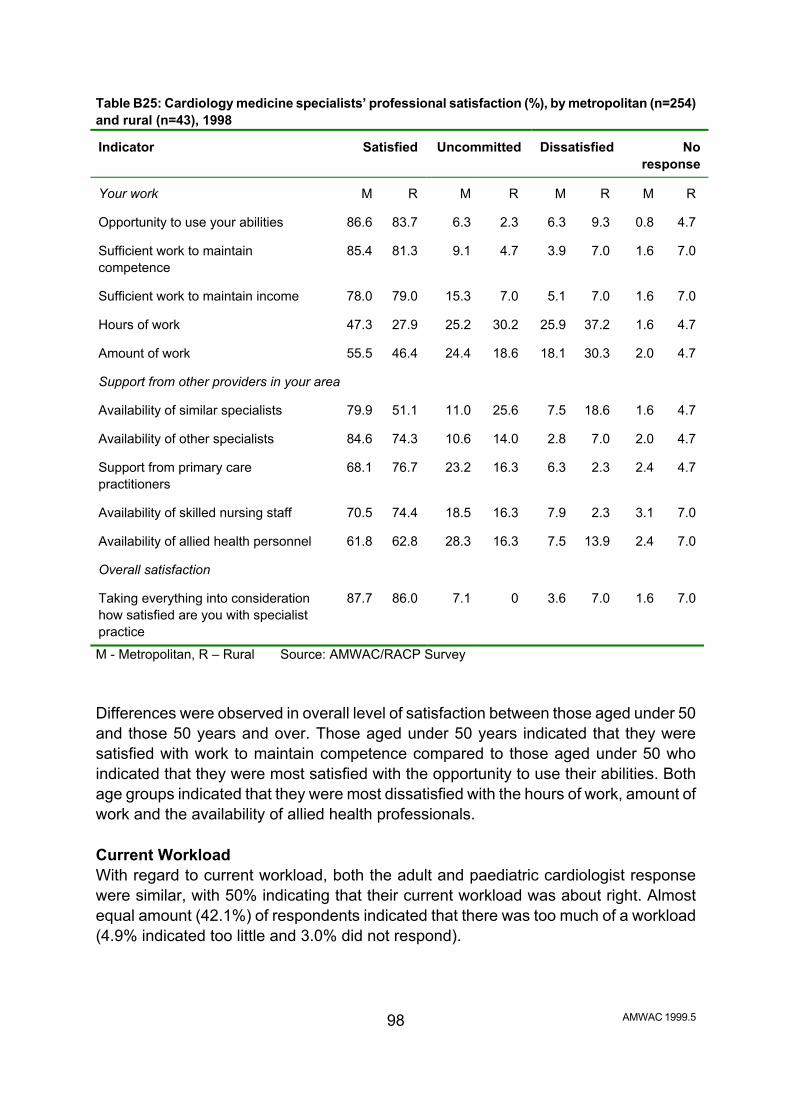
AMWAC 1999.5 98
Table B25: Cardiology medicine specialists’ professional satisfaction (%), by metropolitan (n=254) and rural (n=43), 1998 Indicator
Satisfied
Uncommitted
Dissatisfied
No
response Your work
M
R
M
R
M
R
M
R
Opportunity to use your abilities
86.6
83.7
6.3
2.3
6.3
9.3
0.8
4.7
Sufficient work to maintain competence
85.4
81.3
9.1
4.7
3.9
7.0
1.6
7.0
Sufficient work to maintain income
78.0
79.0
15.3
7.0
5.1
7.0
1.6
7.0
Hours of work
47.3
27.9
25.2
30.2
25.9
37.2
1.6
4.7
Amount of work
55.5
46.4
24.4
18.6
18.1
30.3
2.0
4.7
Support from other providers in your area Availability of similar specialists
79.9
51.1
11.0
25.6
7.5
18.6
1.6
4.7
Availability of other specialists
84.6
74.3
10.6
14.0
2.8
7.0
2.0
4.7
Support from primary care practitioners
68.1
76.7
23.2
16.3
6.3
2.3
2.4
4.7
Availability of skilled nursing staff
70.5
74.4
18.5
16.3
7.9
2.3
3.1
7.0
Availability of allied health personnel
61.8
62.8
28.3
16.3
7.5
13.9
2.4
7.0
Overall satisfaction Taking everything into consideration how satisfied are you with specialist practice
87.7
86.0
7.1
0
3.6
7.0
1.6
7.0
M - Metropolitan, R – Rural Source: AMWAC/RACP Survey Differences were observed in overall level of satisfaction between those aged under 50 and those 50 years and over. Those aged under 50 years indicated that they were satisfied with work to maintain competence compared to those aged under 50 who indicated that they were most satisfied with the opportunity to use their abilities. Both age groups indicated that they were most dissatisfied with the hours of work, amount of work and the availability of allied health professionals. Current Workload With regard to current workload, both the adult and paediatric cardiologist response were similar, with 50% indicating that their current workload was about right. Almost equal amount (42.1%) of respondents indicated that there was too much of a workload (4.9% indicated too little and 3.0% did not respond).

AMWAC 1999.5 99
When examining this variable by gender and age the workload was found to be about right. However, when examining metropolitan (n=254) and rural areas (n=43), rural specialist cardiologists indicated that there was too much workload (55.8%) compared to metropolitan specialist cardiologists who indicated that the workload was about right (53.1%). This applied for both adult and paediatric cardiologists. Plans to Change Hours Worked Once again, adult and paediatric cardiologists expressed similar responses with the majority of the respondents (45.4%, 138) indicating that they did not plan to change the hours they worked in the next three years (23.0% indicated an average increase of 10 to 20%, 28.0% indicated a decrease of 10 to 20% and 3.6% did not respond). When examining this variable by gender both males (n=285) and females (n=19) indicated no significant associations in plans to change hours worked. However, when examining this variable by metropolitan (n=254) and rural areas (n=43), 41.9% (18) rural cardiology specialists indicated that they would decrease the amount of hours worked in the next three years, with an average 20% reduction in total hours. As expected, age ranges indicated statistically significant results, with the majority of those aged under 50 years of age (32.6%, n=193) indicating an expected increase in their hours worked by an average of 25%. Those aged 51 to 60 years (n=78) indicated that they did not plan to change the hours they worked. 51.5% (17) of those aged over 60 years of age (n=33) indicated that they intended to decrease their hours by an average of 15 to 20%. The highest ranking factor for an anticipated reduction in the hours worked for males (n=285) was lifestyle preferences (23.9%), followed by changed patient numbers and family considerations. Females (n=19) sited family considerations (52.6%) as a major reason for change in hours worked. Respondents from metropolitan areas (n=254) indicated that lifestyle preferences (20.9%), family considerations (16.5%) changed patient numbers (18.5%) would be the major reasons why they would anticipate a reduction in the hours worked. Similar findings were shown by respondents from country areas. A significant association (46.2%) was observed between those male respondents who indicated intention to increase hours worked and plans to build practice and income who were aged over 35 years of age (n=65). Retirement Intentions 91.8% (279) of respondents provided details of their retirement intentions. Both adult and paediatric cardiologists indicated similar retirement intentions. The average expected age of retirement from the workforce was 64.8 years (range 45-80; median 65; mode 65; standard deviation 4.6). Table B26 indicates that 11.1% (34) of survey

AMWAC 1999.5 100
respondents intend retiring by the year 2004 and approximately a total of 25.3% (77) intend retiring by the year 2009. Table B26: Actual year of intended retirement from cardiology medicine, by State/Territory, 1998 Year
NSW
Vic
Qld
WA
SA
Tas
NT
ACT
NR
Aust
% Aust
1998
0
0
0
0
0
0
0
0
0
0
0
1999-00
1
2
1
1
0
0
0
1
0
6
1.9
2001-2
6
2
3
1
1
0
0
0
0
13
4.3
2003-4
6
4
1
1
1
2
0
0
0
15
4.9
2005-7
8
5
4
2
2
2
0
0
0
23
7.6
2008-9
7
7
3
0
1
1
0
1
0
20
6.6
2010-12
8
11
4
2
2
1
0
0
0
28
9.2
2013-15
11
8
4
3
4
0
0
2
0
32
10.5
2016-18
7
9
9
2
3
0
1
0
1
32
10.5
2019-24
15
16
9
4
5
1
0
1
0
51
16.8
>2025
31
11
8
2
7
0
0
0
0
59
19.4
No response
9
2
3
1
3
2
0
1
4
25
8.2
Total
109
77
49
19
29
9
1
6
5
304
100
Source: AMWAC/RACP Survey The average anticipated age of retirement for females was 64.1 years (range 60-70; mode 65; standard deviation 3.6). The average anticipated age of retirement for males was 64.8 years (range 45-80; mode 65; standard deviation 4.7). Table B27 shows the anticipated year of retirement by gender. This table also clearly shows the retirement pattern of the older cohort of males moving through to retirement; where approximately 25.9% (77) of males intend to retire by 2009.
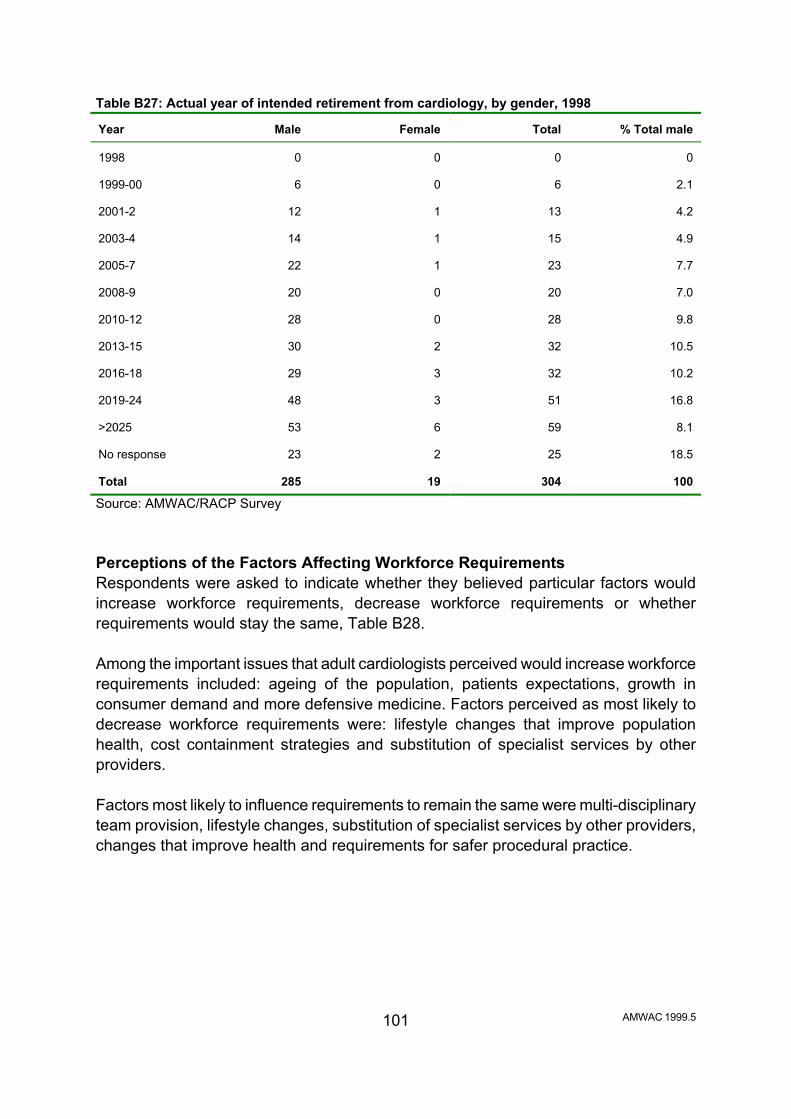
AMWAC 1999.5 101
Table B27: Actual year of intended retirement from cardiology, by gender, 1998 Year
Male
Female
Total
% Total male
1998
0
0
0
0
1999-00
6
0
6
2.1
2001-2
12
1
13
4.2
2003-4
14
1
15
4.9
2005-7
22
1
23
7.7
2008-9
20
0
20
7.0
2010-12
28
0
28
9.8
2013-15
30
2
32
10.5
2016-18
29
3
32
10.2
2019-24
48
3
51
16.8
>2025
53
6
59
8.1
No response
23
2
25
18.5
Total
285
19
304
100
Source: AMWAC/RACP Survey Perceptions of the Factors Affecting Workforce Requirements Respondents were asked to indicate whether they believed particular factors would increase workforce requirements, decrease workforce requirements or whether requirements would stay the same, Table B28. Among the important issues that adult cardiologists perceived would increase workforce requirements included: ageing of the population, patients expectations, growth in consumer demand and more defensive medicine. Factors perceived as most likely to decrease workforce requirements were: lifestyle changes that improve population health, cost containment strategies and substitution of specialist services by other providers. Factors most likely to influence requirements to remain the same were multi-disciplinary team provision, lifestyle changes, substitution of specialist services by other providers, changes that improve health and requirements for safer procedural practice.

AMWAC 1999.5 102
Table B28: Adult cardiologists’ perceptions of the factors that could affect the size of the cardiology workforce over the next ten years (percentage), 1998 (n=286) Factors affecting the size of the workforce
Increase
Decrease
Stay the
same
Don=t know
No
response Population trends
Ageing of the population
54.3
0
5.9
2.0
37.8
Changing disease patterns
25.4
11.8
22.7
2.3
37.8
Lifestyle changes that improve population health
11.2
18.4
29.3
3.3
37.8
Patients expectations/knowledge
48.8
1.3
10.5
1.6
37.8
Clinical practice trends
Requirements for safer procedural practice
35.2
0.3
22.7
3.6
38.2
Advances in medical technology
50.0
2.0
7.8
2.0
38.2
Multi-disciplinary team provision
24.7
2.6
30.6
3.9
38.2
More defensive medicine
41.1
0
18.4
2.3
38.2
Workforce trends
Need for improved geographic distribution of specialists
36.4
2.7
18.8
4.3
37.8
Increasing doctor specialisation
34.6
4.6
19.7
3.3
37.8
Substitution of specialist services by other providers
10.5
13.8
29.3
7.6
38.8
Health care system trends
Cost containment strategies
16.9
15.4
25.0
3.9
38.8
Reforms to increase efficiency
18.9
11.8
26.6
3.9
38.8
Growth due to consumer demands
47.1
0.3
11.5
1.6
39.5
Source: AMWAC/RACP Survey The perceptions of paediatric cardiologists showed differences, with the majority indicating that patients expectations, growth in consumer demand, more defensive medicine and the need for improved geographic distribution of specialists would increase workforce requirements. All the other factors listed in Table B28 were perceived to not affect the size of the workforce.
AMWAC 1999.5 103
Trainee Requirement Respondents (n=304) were asked to indicate whether in their view the cardiology workforce requires an increase or decrease in trainees. The adult cardiologists (n=286) indicated that trainees should remain the same (39.9%) followed closely by a decrease in trainees (38.5%). 12.9% indicated that they did not know whether an increase or decrease was required. 6.6% indicated for an increase in trainees and 2.1% did not respond. The suggested average decrease of trainee intakes was 28.5% (mode 20%, standard deviation 16.6%). The suggested average increase of trainee intakes was 17.8% (mode 10%, standard deviation 10.8%). Trainee requirements were also examined by the variables gender, age, rural and urban areas and by State/Territory. The variables gender, age and geographic location showed no statistically significant differences to that of the above, that is the majority indicated the need for a decrease in trainee numbers. However, respondents from the following States/Territories did indicate that trainees should remain the same, these were Western Australia, Tasmania, Queensland and Victoria. The majority (53.8%) of paediatric cardiologists (n=13) indicated that trainees remain the same followed by 23.1% indicating for a decrease in trainees. 15.4% indicated that there needs to be an increase and 7.7% indicated that they did not know whether an increase or decrease was required. The suggested average decrease of trainee intakes was 28.3% (mode 15%, standard deviation 18.9%). The suggested average increase of trainee intakes was 12.5% (mode 10%, standard deviation 3.5%). Trainee requirements were also examined by the variables gender, age, rural and urban areas and by State/Territory. The variables gender, age and geographic location showed no statistically significant differences to that of the above, that is the majority indicated the trainee numbers remain the same. Oversupply and also Shortages of Providers The survey asked that respondents specify provider groups that are relevant to the field and are in short supply in their geographic areas. Both adult and paediatric cardiologists comments were similar. State/Territory urban areas indicated a shortage of neurologists, endocrinologists, geriatricians, rehabilitation specialists, psychiatrists, cardiology nurses, allied health professionals such as physiotherapists and dietitians.
AMWAC 1999.5 104
Rural shortages were similar to those indicated in urban areas and also included gastroenterologists, thoracic specialist, cardiologists, general physicians and cardiac technologists. The survey asked that respondents specify provider groups that are relevant to the field and that were in oversupply. State/Territory urban areas indicated an oversupply in cardiologists, general practitioners and nuclear physicians. Rural areas indicated a similar response to oversupply as urban areas with the exception of cardiologists. Metropolitan Practitioners Providing Rural Outreach Services 58 out of 304 (19.1%) metropolitan specialist cardiologists indicated that they provided services to rural areas. Metropolitan specialist cardiologists consisted of 49 adult cardiologists (two of which were female) and 9 male paediatric cardiologists. The average hours spent per month by adult cardiology specialists was 21.7 hours (mode 20, standard deviation 32.4). Male specialist adult cardiologists providing rural outreach services were on average aged 46.5 years (minimum age 33, maximum age 69, mode 40). The average hours spent per month by males is 21.9 hours (mode 5, standard deviation 33.1) Female specialist adult cardiologists providing rural outreach services were on average aged 43.5 years (minimum age 34, maximum age 53, mode 34). The average hours spent per month by females is 15.0 hours (mode 10, standard deviation 7.1) The average hours spent per month by the 9 male paediatric cardiology specialists was 10.9 hours (mode 8, standard deviation 11.3). Male specialist paediatric cardiologists providing rural outreach services were on average aged 46.7 years (minimum age 37, maximum age 57, mode 55). Table B29 shows wide variation across States/Territories in the percentage of metropolitan respondents involved in the provision of rural outreach services. For example, 25.9% of metropolitan based specialist cardiologists in South Australia and 19.0% in New South Wales reported providing rural outreach services, while none from Tasmania and Northern Territory reported providing outreach services. Table B29: Metropolitan specialist cardiologists providing rural outreach services (n=58) (%), by State/Territory, 1998
NSW
Vic
Qld
WA
SA
Tas
ACT
NT
19.0
24.1
15.5
13.8
25.9
0
1.7
0
Source: AMWAC/RACP Survey Respondents gave the main reasons for providing rural outreach services as: the

AMWAC 1999.5 106
opportunity to expand ones practice, the nature of the clinical work, and that the employing hospital has an arrangement with rural providers. Paediatric cardiologists indicated that the catchment population required to sustain a rural outreach cardiology service ranged from 2,000 to 100,000 people. The average catchment population was 43,000 (mode 20,000) Adult cardiologists indicated that the catchment population required to sustain a rural outreach cardiology service ranged from 5,000 to 150,000 people. The average catchment population was 37,000 (mode 50,000). The respondents to the AMWAC survey indicated that the most important factor in ensuring a sustainable rural outreach service was dependent on local general practitioners who want you to provide such a service as well as other specialists. It was also noted that other important factors included: whether local hospitals want to provide cardiology services; that an appropriate infrastructure with necessary equipment and the availability of other investigative and support services were available. Respondents were asked to determine what would happen if their rural outreach service was discontinued, 62% of respondents indicated that patients would be managed by a general practitioner or another physician and also travel to metropolitan specialist cardiologists on referral, 36.2% indicated that patients would travel to metropolitan for management by a specialist, 1.8% made no response. Resident Rural Cardiologists 39 respondents (12.8%) out of 306, indicated that they lived and worked outside a major urban centre, two of which were paediatric cardiologists. Males represented the majority of 94.6% (35) of resident rural adult cardiologists with an average age of 49.1 years ∀ 8.4 (minimum age 33, maximum age 65, mode 50). The average years in rural practice was 17.4 years ∀ 9.4 (minimum 1 year, maximum 37 years, mode 20 years). Males intended remaining in rural practice on average another 12.8 ∀ 7.4 years (minimum 2 year, maximum 30 years, mode 10 years). Females represented 5.4% (2) of resident rural cardiologists. The main reasons for living and working in a rural area indicated by both adult and paediatric cardiologists were given as: rural lifestyle; nature of the clinical work; good place to raise children; and came from the country.

AMWAC 1999.5 107
Respondents were asked to rank in order of priority the basic requirements for providing a good resident rural cardiology service these were: the availability of local hospital facilities and equipment; the availability of investigative /supportive services; sufficient similar specialists to provide 24 hour cover; a public hospital appointment; the availability of skilled nursing staff; attributes/skills of referring general practitioners; the availability of allied health/ancillary staff; and lastly the availability of other specialists. Other basic requirements included the need for holiday/study leave cover, access to locum services and good schools for children, spouse satisfaction with lifestyle, income parity with city specialists. The adult cardiologists considered that a catchment population of 10,000 to 250,000 was required to sustain a resident rural practice (mean 83,000, mode 50,000). The paediatric cardiologists indicated that a catchment population of 20,000 to 45,000 was required to sustain a resident rural practice (mean 32,500, mode 20,000). 16 (41%) of the 39 rural resident specialist cardiologists indicated that if a specialty locum scheme were established they would make use of it. The majority of those interested indicated a requirement for 4 to 6 weeks of locum support (minimum 3 weeks, maximum 12 weeks, mode 4 weeks). Respondents were asked if they were intending to leave rural practice in the future and to list the reasons why. Reasons included retirement, overworked with no locums to give relief, there was lack of government support to rural hospitals and children's tertiary education.

AMWAC 1999.5 108
APPENDIX C: SUMMARY OF CARDIOLOGY DATA IN AIHW MEDICAL LABOUR FORCE SURVEY, 1997
The Medical Labour Force Survey data is based on the main specialty of practice for cardiology specialists. Number of Practising Cardiology Specialists The National Medical Labour Force Survey conducted in December 1997 found: • 612 specialists practising in cardiology, and for 551 of these it was their main
specialty of practice; of the 551 specialist practising mainly in cardiology, 42 (7.6%) were female; In 1991-92 there were 378 cardiology specialists who were identified as Medicare providers and a total of 500 in 1995-96, indicating a 32.3% increase in the workforce during this period, with the number per 100,000 population increasing slightly from 2.2 to 2.7. Of the 1995-96 500 Medicare provider specialists recognised as cardiologists by the Health Insurance Commission, 26 (5%) were female. The following data is based on the Medical Labour Force Survey, 1996, AIHW, for cardiology specialists who indicated that cardiology is their main specialty of practice (n=551). Table C1 shows the total number of specialist cardiologists by State/Territory and the number per 100,000 total population. Table C1: Total number of specialist cardiologists by State/Territory and gender, 1997
State/Terr
NSW
Vic
Qld
WA
SA
Tas
NT
ACT
Aust
Total
246
137
74
30
44
14
0
6
551
% Total
44.6
24.9
13.4
5.4
8.0
2.5
0
1.1
100.0
No. per 100,000 population
3.9
3.0
2.2
1.7
3.0
3.0
0.0
1.9
3.0
Source: AIHW 1999 Geographic Distribution In December 1997 there were 3.0 specialists per 100,000 total population mainly practising in cardiology, with the highest provision in New South Wales (3.0), and the lowest 0 in Northern Territory and Western Australia (1.7) (Table C1). In December 1997, the main job of 92.7% cardiology specialists was located in a capital city or other metropolitan area, where 72% of the total population reside. Only 7.3% of cardiology specialists reported any activity in rural centres/remote areas.

AMWAC 1999.5 109
Table C2: Geographic distribution of specialist cardiologists by State/Territory, 1997 Region of main job
Number of cardiologists
Capital city
469
Other metropolitan centre
41
Large rural centre
25
Other
15
Total
551
Source: AIHW 1999 The data indicate that metropolitan areas and large rural centres are well serviced with specialist cardiology services, but rural and remote populations elsewhere have a much lower patient and service coverage. Medicare data, which takes into account specialist outreach services and rural people travelling to metropolitan centres for treatment, showed 23% of services were provided in other than a capital city or other metropolitan area - less than the 28% of the population residing in those areas. In 1995-96, the rural population received: • specialists cardiology services for 4,150 patients per 100,000 population, compared
with 5,625 and 6,096 patients per 100,000 population in capital cities and other metropolitan areas respectively;
• 7,965 Medicare services by specialists cardiologists per 100,000 population compared with 10,705 and 12,630 services per 100,000 population in capital cities and other metropolitan areas respectively;
• 1.92 services per patient compared with 1.90 and 2.07 services per patient in capital cities and other metropolitan areas respectively.
Between 1990-91 and 1995-96 there was a 70% increase in the number of rural patients per 100,000 population receiving cardiology services, compared with a 49% increase in capital cities and a 71% increase in other metropolitan areas. Gender Profile There were 42 (7.6%) female cardiology specialists. Males made up 92.4% (509) of the specialty. Age Profile There were 37 (6.7%) cardiology specialists aged less than 35 years (27% of which were females) and 71 (12.9%) who were aged over 65 years of age.

AMWAC 1999.5 110
The 1996 AIHW data indicated that the average age of cardiology specialists was 49.8 years. For females the largest age range was the 35-44 years representing 57.1% (24) of the total female cardiologists, followed by the under 35 year age group representing 23.9% (10) of the total female cardiologists. For males the largest age range was the 45-54 year age group representing 32.7% (166) of the male cardiologists, followed by 29.1% (148) in the 35-44 year age group. There were 8 (1.6%) male cardiology specialists aged 75 and over. The largest five year age cohort group was the 45 to 54 year olds with 173 (31.4%) followed by the 35-44 year olds with 171 (31.0%). Hours Worked Based on 1997 data from AIHW medical labour force survey, the total average hours per week was 53.4 hours with male cardiology specialists averaging 53.9 hours and for females 45.1 hours. Cardiology specialists worked an average of 47.4 hours per week in the direct care of patients, with male cardiology specialists averaging 47.8 hours and for females 40.5 hours. Hours on call not worked for those averaged 44 hours per week (Table C3). Those under 55 years of age averaged 56.7 hours per week; this declined to 55.4 hours for 55 to 64 year olds and 31.1 hours for 65 to 74 year olds. The highest average hours worked per week were 57.8 hours by males aged 45 to 54 years. 104 cardiologists (18.8%) worked less than 35 hours per week, while 138 (25%) worked 65 hours per week or more. Specialist cardiologists worked an estimated total 1,350,500 hours per year. The annual direct patient care hours worked was 1,198,759 and the annual hours on call not worked in 1997 was 657,653 hours (Table C3).

AMWAC 1999.5 111
Table C3: Cardiology specialists average hours worked and estimated annual labour supply (a), sex by age group, 1997
<34
years
35-44 years
45-54 years
55-64 years
65-74 years
75+
years
Total
Total hours worked Male
55.8
59.7
57.9
55.9
31.5
9.2
53.9
Female
51.5
43.5
55.6
24.0
15.0
0
45.1
Total
54.7
57.7
57.8
55.4
31.1
9.2
53.4
Annual total hrs worked (>000)
93.7
454.6
459.9
253.0
90.3
3.3
1,350.5
Direct patient care Male
48.6
52.1
51.9
49.7
29.1
7.3
47.8
Female
48.8
39.0
45.0
22.0
15.0
0
40.5
Total
48.7
50.5
51.6
49.2
28.7
7.3
47.4
Annual direct pt care hrs worked (>000)
83.4
397.9
410.6
224.7
83.4
2.6
1,198.8
Hours on call not worked Male
40.3
44.7
42.2
44.0
63.2
0
44.2
Female
43.5
51.8
68.0
14.0
0
0
49.3
Total
40.9
45.3
43.1
43.3
63.1
0
44.4
Annual hrs on call not worked (>000)
28.7
216.9
239.4
113.3
80.6
0
657.7
(a) Calculated as average weekly hours multiplied by persons multiplied by 46 weeks per year. Source: Medical Labour Force Survey, 1999, AIHW Specialist cardiologists worked an estimated 1,350,500 hours (51,218 hours per 100,000 population aged 60 years and over). The total hours worked per 100,000 for the population aged 60 years and over was significantly above the national average for New South Wales (57,138), while Western Australia (29,496) and Queensland (35,574) were below the national average.

AMWAC 1999.5 112
Table C4: Cardiology specialists, estimated annual labour (hours) (a), State/Territory, 1997
NSW
Vic
Qld
WA
SA
Tas
ACT
NT
Aust
(>000 hours)
Total hours worked
599.7
342.2
180.8
74.7
110.7
31.4
14.7
-
1,351.0
Direct patient care hours worked
535.2
310.1
155.9
62.4
96.5
28.8
10.4
-
1,199.2
Hours on call not worked
255.0
201.6
97.8
20.5
60.4
19.9
11.8
-
657.8
hours worked per 100,000 population aged 60 and over
Total hours worked
57,138
44,826
35,574
39,496
40,875
38,907
45,704
-
51,218
Direct patient care hours worked
50,993
40,616
30,683
24,644
35,644
35,711
32,327
-
45,463
Population 60+ (>000) 31 Dec 1997
1,049.7
763.4
508.1
253.1
270.9
80.6
32.2
9.8
2,637.8
(a) Calculated as average weekly hours multiplied by persons multiplied by 46 weeks per year. Source: Medical Labour Force Survey, 1999, AIHW The proportion on call rose with distance away from a capital city/metropolitan area, with rural area cardiologists reporting up to 87.5% on call. The average hours worked varied by region with the average hours in direct patient care in a capital city/metropolitan area at 47 hours a week, 54.3 hours in large rural centres, 45 hours in small rural areas and 48 hours in other rural areas, as shown in Table C5. Table C5: Cardiology specialists average hours worked by region of main job, 1997
Capital
city
Other
metropolitan centre
Large rural
centre
Small rural
centre
Other
rural area
Total
Total hours worked
53.0
53.8
59.0
49.5
57.5
53.4
Direct patient care
47.0
47.2
54.3
45.0
48.3
47.4
Hours on call not worked
44.8
39.6
40.8
48.1
72.7
44.4
% specialists on call
55.7
51.5
70.0
87.5
75.0
58.6
Average age
50.0
46.8
50.6
47.5
55.8
49.8
Source: Medical Labour Force Survey, 1999, AIHW

AMWAC 1999.5 113
Cardiology specialists-in-training averaged 58.6 hours per week, with males averaging 59.3 hours and females 57.3 hours as is shown in Table C6. It is estimated that their contributions to total hours worked was 258,000 hours, 17% of the estimated combined hours worked by cardiology specialists and specialists-in training. Table C6: Cardiology specialists-in-training, by average hours worked, gender and age, 1997 Gender
25-35 years
35-44 years
Total
Total hours worked
Male
60.4
53.7
59.3
Female
57.5
56.0
57.3
Total
59.7
54.1
58.6
Direct patient care hours worked
Male
53.9
48.1
52.4
Female
51.0
44.0
50.1
Total
53.2
47.4
51.3
Hours on call not worked
Male
46.4
51.4
49.0
Female
48.8
8.0
43.0
Total
46.9
44.2
47.8
Source: Medical Labour Force Survey, 1999, AIHW

AMWAC 1999.5 114
REFERENCES Anderson P, Bhatia K & Cunningham J (1996), Mortality of Indigenous Australians. Occasional Paper ABS Cat. No. 3315.0, AIHW Cat. No. AIHW 1. Canberra: AGPS Australian Bureau of Statistics (1997), Australian Demographic Situation, June Quarter 1997, Catalogue no. 3101.0, ABS, Canberra Australian Bureau of Statistics & Australian Institute of Health and Welfare (1997), Health and Welfare of Australia=s National Aboriginal and Torres Strait Islander Peoples. Cat No 4704.0. ABS, Canberra Australian Bureau of Statistics (1997a), 1995 National Health Survey: Cardiovascular and Related Conditions, Australia. ABS Cat No 4372.0 ABS, Canberra Australian Bureau of Statistics (1997b), Causes of Death Australia, 1996. Cat No 3303.0. ABS, Canberra Australian Bureau of Statistics (1998), Projections of the Populations of Australia, States and Territories: 1997 to 2051, Catalogue no. 3222.0, ABS, Canberra Australian Institute of Health and Welfare (1997), Australia's Health 1998, Canberra Australian Institute of Health and Welfare (1997), Cardiology Labour Force Profile, 1997, unpublished data collection Australian Institute of Health and Welfare (1997), Cardiology workforce demand projections, unpublished projections analysis Australian Institute of Health and Welfare (1997), Cardiovascular Disease Series No. 5 AIHW Cat. No. CVD 2. Canberra: AIHW Australian Institute of Health and Welfare (1998), Australian hospital statistics 1996-97. AIHW Cat. No. HSE5. Canberra: Australian Institute of Health and Welfare (Health Services Series no. 11) Australian Institute of Health and Welfare (1998), Medical Health Labour Force 1996, Canberra

AMWAC 1999.5 115
Australian Medical Workforce Advisory Committee (1998), Sustainable Specialist Services: A Compendium Of Requirements, AMWAC Report 1998.7, Sydney Australian Medical Workforce Advisory Committee & Australian Institute of Health and Welfare (1996), Female Participation in the Australian Medical Workforce, AMWAC Report 1996.7, Sydney Bennett S., Dobson A.J., Magnus P., (1995) Outline of a national monitoring system for cardiovascular disease. Canberra: Australian Institute of Health and Welfare (Cardiovascular Disease Series; no. 4) Boyle C.A., Dobson A. J., (1995) Morbidity from cardiovascular disease in Australia, Canberra: Australian Institute of Health and Welfare (Cardiovascular Disease Series; no. 2) Commonwealth Department of Human Services and Health 1995. Medicare benefits schedule book. Operating from 1 November 1995. Canberra: Australian Government Publishing Service. Dent O and Goulston, K, (1999) Trends in the Specialists Workforce in Internal Medicine in Australia 1998 to 1995, Medical Journal of Australia, 170: 32-36 Department of Health and Family Services (1998), National Health Priority Areas Report, Cardiovascular health, unpublished report Gajanayake I., Bennett S. (1997) Surveillance of Cardiovascular Mortality in Australia 1983-1994. AIHW Cat. No. CVD2. Canberra: Australian Institute of Health and Welfare (Cardiovascular Disease Series; no. 5) Kelly D., (1997) Our Future Society, A Global Challenge, Circulation, 95:2459-2464 Mathur S., Gajanayake I. (1998) Surveillance of Cardiovascular Mortality in Australia 1983-1994. AIHW Cat. No. CVD3. Canberra: Australian Institute of Health and Welfare (Cardiovascular Disease Series; no. 6) Robertson, I., Richardson J., Hobbs M., (1998) The Impact of New Technology on the Treatment and Cost of Acute Myocradial Infarction in Australia, The Centre for Health Program Evaluation, Monash University.

AMWAC 1999.5 116
Robertson, I., Richardson J., Hobbs M., (1998) Changes in use of Invasive Technology following Myocardial Infarction, The Centre for Health Program Evaluation, Monash University Strong K, Trickett P, Titulaer I et al (1198) Health in Rural and Remote Australia. AIHW Cat No PHE 6. AIHW, Canberra Waters A-M, Artmstrong T, Senes-Ferrari S (1998). Medical care of cardiovascular disease in Australia. AIHW cat. no., CVD 4. Canberra: Australian Institute of Health and Welfare (Cardiovascular Disease Series no. 7) Waters A-M, Bennett S., (1995) Risk factors for cardiovascular disease: a summary of Australian data. Canberra: Australian Institute of Health and Welfare (Cardiovascular Disease Series; no. 1) Waters A-M, Bennett S., (1995) Mortality from cardiovascular disaese in Australia. Canberra: Australian Institute of Health and Welfare (Cardiovascular Disease Series; no. 3) Wise M., Graham-Clarke, P., (1994) Cardiovascular health in Australia: A review of current activities and future directions. Canberra: Department of Human Services and Health


