27
The Standardized Infection Ratio Steven P Hudson, MBA, MA Statistician Health Care Excel, Inc
| Date post: | 26-Dec-2015 |
| Category: |
Documents |
| Upload: | gerard-franklin |
| View: | 217 times |
| Download: | 1 times |

The Standardized Infection Ratio
Steven P Hudson, MBA, MA
Statistician
Health Care Excel, Inc

Objectives
• Describe what the Standardized Infection Ratio (SIR) is and how it is calculated.
• Explain how to generate and interpret a
report utilizing the SIR.
What is a standardized infection ratio?
The standardized infection ratio (SIR) is a summary measure used to track healthcare-associated infections (HAIs) at a national, state, or local level over time. The SIR adjusts for patients of varying risk within each facility.
- The National Healthcare Safety Network (NHSN)

The SIR calculation
• In HAI data analysis, the SIR compares the actual number of HAIs reported (observed) with the baseline U.S. experience (expected/predicted), adjusting for several risk factors that have been found to be significantly associated with differences in infection incidence.
number of observed (O) number of expected (E)
– NHSN aggregate data are used as the standard population and considered the baseline U.S. experience
– NHSN baseline data used in a SIR are used to calculate the expected or predicted number of HAIs adjusting for the identified risk factors.
SIR=
What does the SIR number mean?
• Accounting for differences in the types of patient followed:– A SIR greater than 1.0 indicates that more HAIs were
observed than predicted. – A SIR less than 1.0 indicates that fewer HAIs were
observed than predicted.– A SIR equal to 1.0 indicates the same number of HAIs
were observed than predicted.
• However, the SIR alone does not imply statistical significance.
Statistical significance of the SIR:p-value and 95% confidence intervals
• The SIR is only a point estimate and needs additional information to indicate if it is statistically significantly different from 1.
• A 95% confidence interval (CI) and a p-value are calculated by NHSN for each SIR and determines statistical significance. – A 95% CI assesses the magnitude and stability of a SIR.
Therefore, a 95% CI is the range of estimated SIR values that have a 95% probability of including the true SIR for the population.
– If the 95% CI does not contain the value 1, the SIR is “statistically significant.”
– If the p-value is less than 0.05, the SIR is “statistically significant.”
Statistical Significance
If the p-value is less than .05, then your rates are different than the national average
If the confidence level does not overlap 1, then your rates are different than the national average.
I was just getting used to rates, why the SIR?
More sensitive for low denominators
Ability to combine data
Useful for predicting state and national rates

OK , I’m no statistician-what’s all this mumbo jumbo about?
In simple terms- you are compared to the average of a referent population and adjusted for risk
In this case, it is a historical control.
The SIR
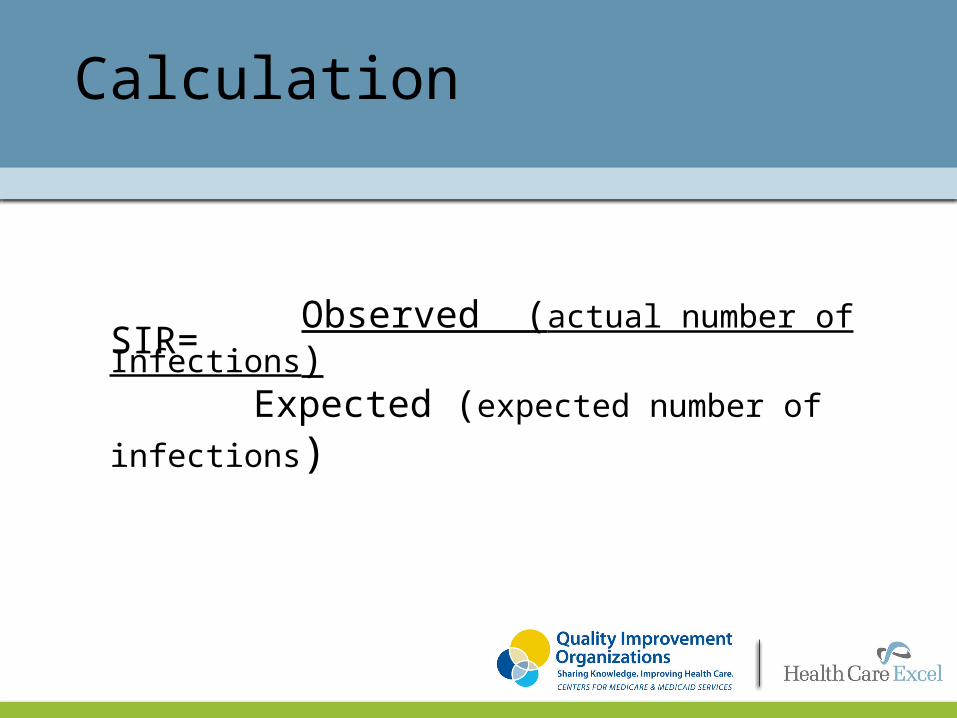
Calculation
Observed (actual number of
Infections) Expected (expected number of
infections)
SIR=
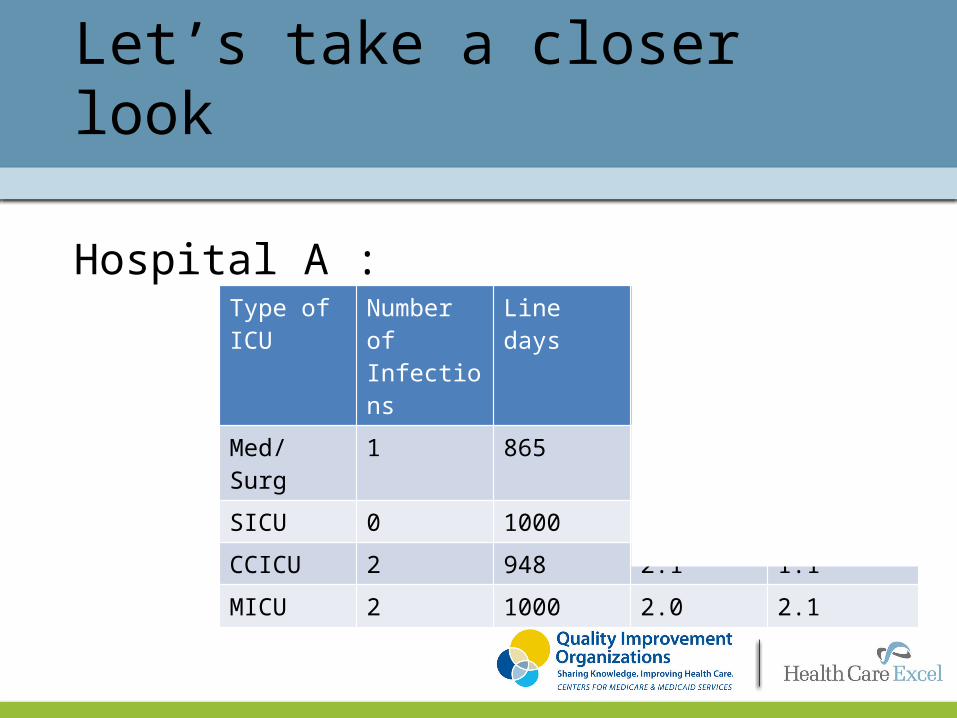
Let’s take a closer look
Hospital A :Type of ICU Number of
InfectionsLine days My rate NHSN Mean
Med/ Surg 1 865 1.1 2.1
SICU 0 1000 0 2.8
CCICU 2 948 2.1 1.1
MICU 2 1000 2.0 2.1
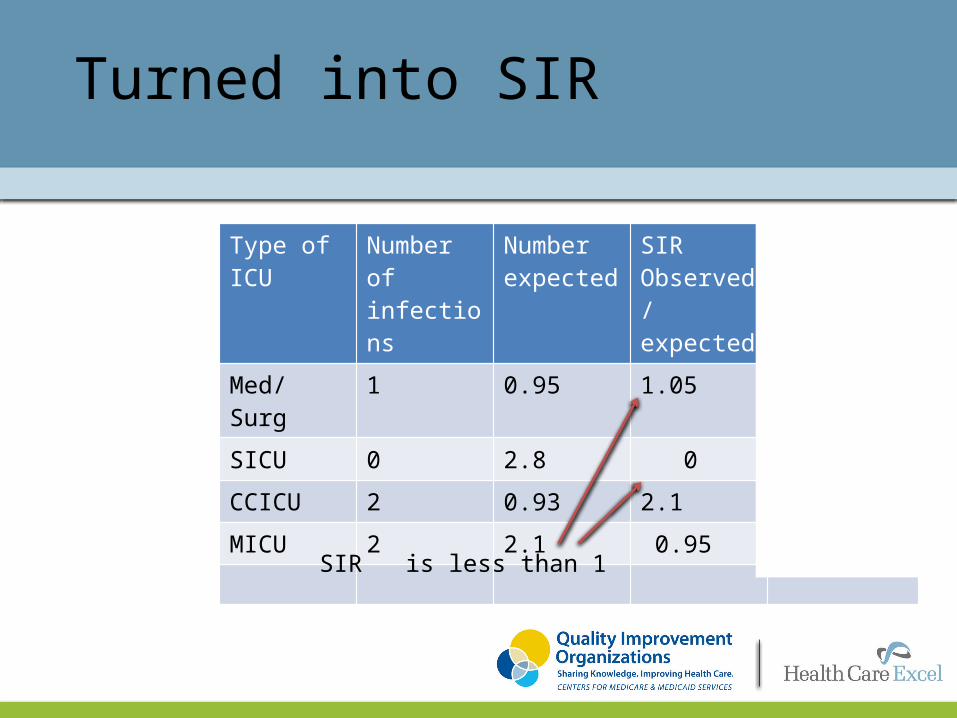
Turned into SIR
Type of ICU Number of infections
Number expected
SIRObserved/expected
P VALUE
Med/ Surg 1 0.95 1.05
SICU 0 2.8 0
CCICU 2 0.93 2.1
MICU 2 2.1 0.95
SIR is less than 1

Simply Put
• A SIR of 1.0 means the observed number of infections is equal to the number of expected infections.
• A SIR above 1.0 means that the infection rate is higher than that found in the "standard population." For HAI reports, the standard population comes from data reported by the hundreds of U.S. hospitals that use the NHSN system. The difference above 1.0 is the percentage by which the infection rate exceeds that of the standard population.
• A SIR below 1.0 means the infection rate is lower than that of the standard population. The difference below 1.0 is the percentage by which the infection rate is lower than that experienced by the standard population.

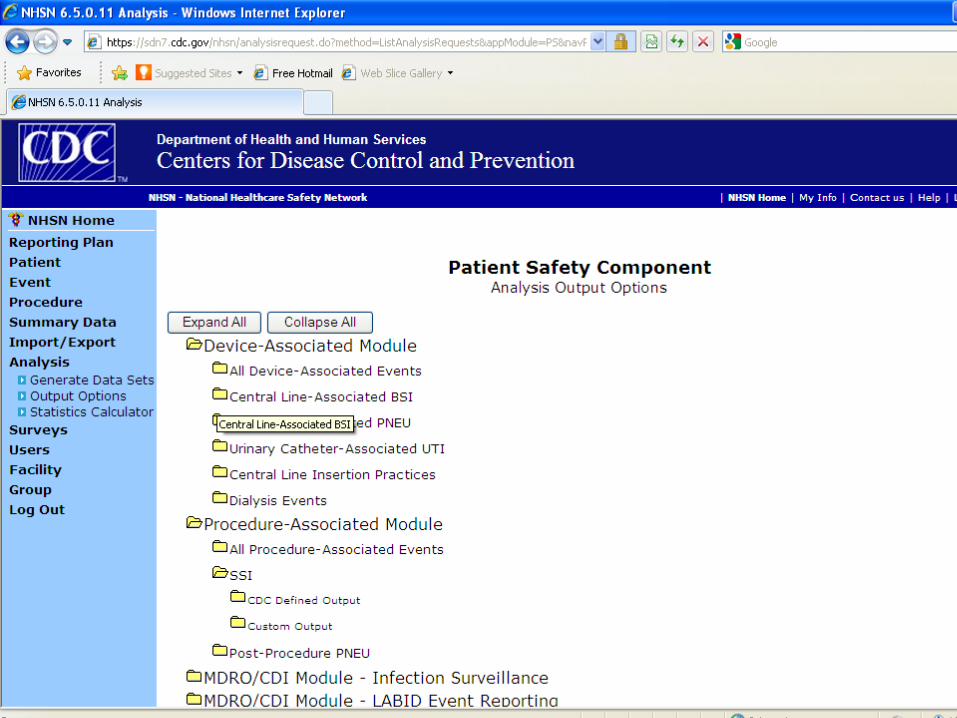
How to generate NHSN SIR outputs
1. Log into NHSN --> enter the Patient Safety Module
2. Starting from the blue navigation menu on the left, click “Analysis” --> “Generate Data Set” --> “Generate New” (note: this will take some time to load)
3. Click “Analysis” --> “Output Options”
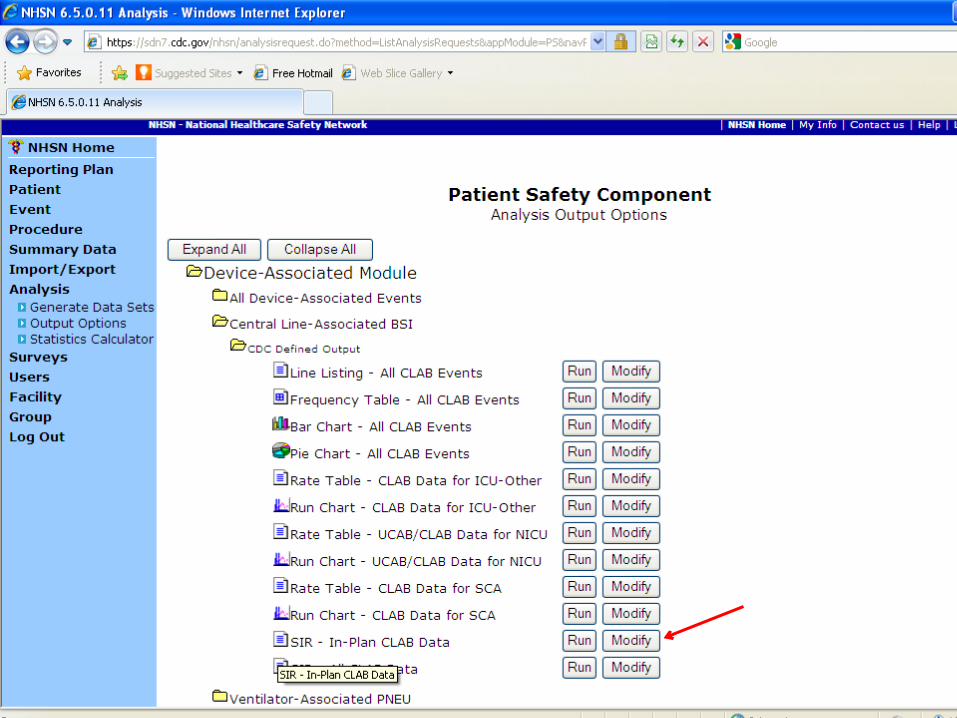
4. On the white screen, click “Device-Associated Module” --> “Central Line-Associated BSI” --> “CDC Defined Output” --> “SIR – In-Plan CLAB Data”
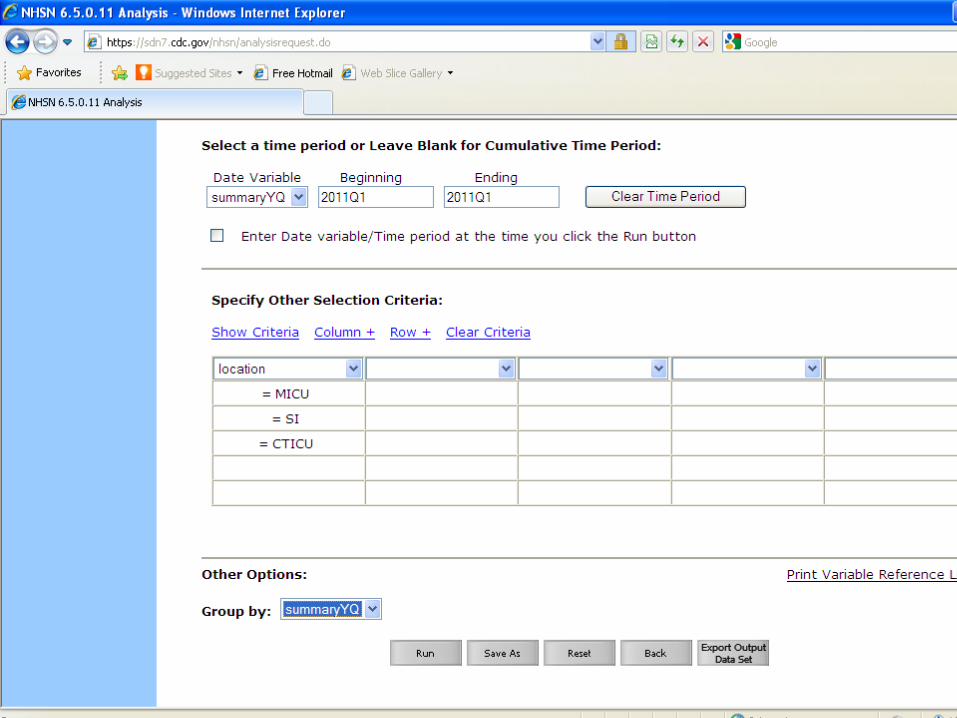
5. Select “Run” for data aggregated by 6-month intervals and CDC location type or select “Modify” to customize the output

Conducting your own analysis

orgid=10330


Surgical SIR
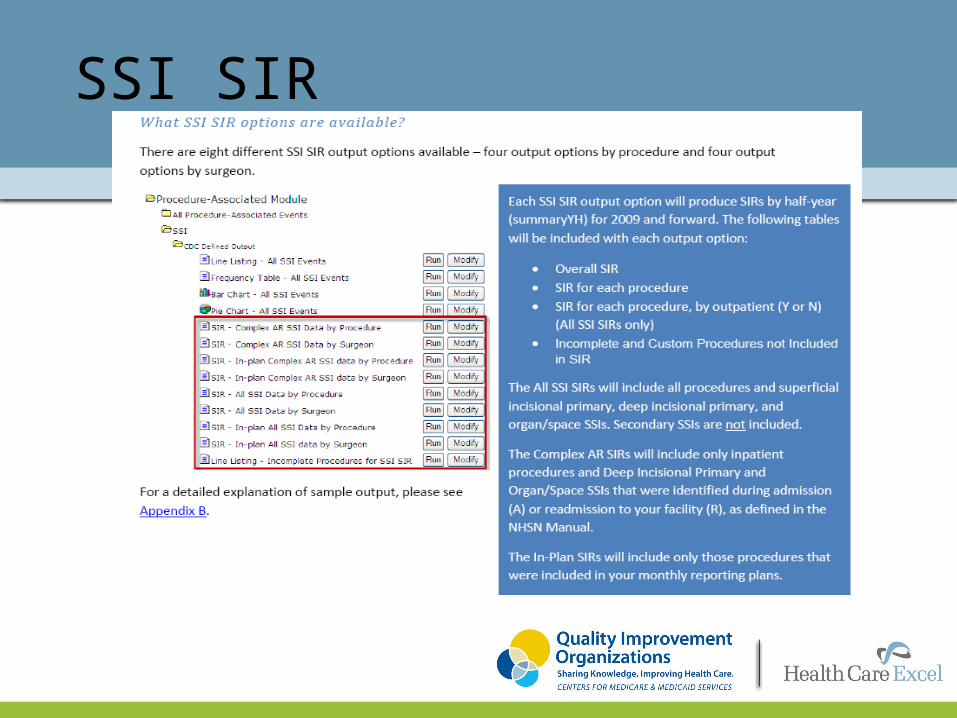
SSI SIR

SSI data are summarized like they are for CLABSIs:

Interpreting the SIR
• During 2009, there were 524 procedures performed and 13 SSIs identified.
• Based on the NHSN 2006-2008 baseline data 6.687 SSIs were expected.
• This results in a SIR of 1.94 (13/6.687), signifying that during this time period
our facility identified 94% more SSIs than expected.
• The p-value and 95% confidence interval indicate that the number of
observed SSIs is significantly higher than the number of expected SSIs.
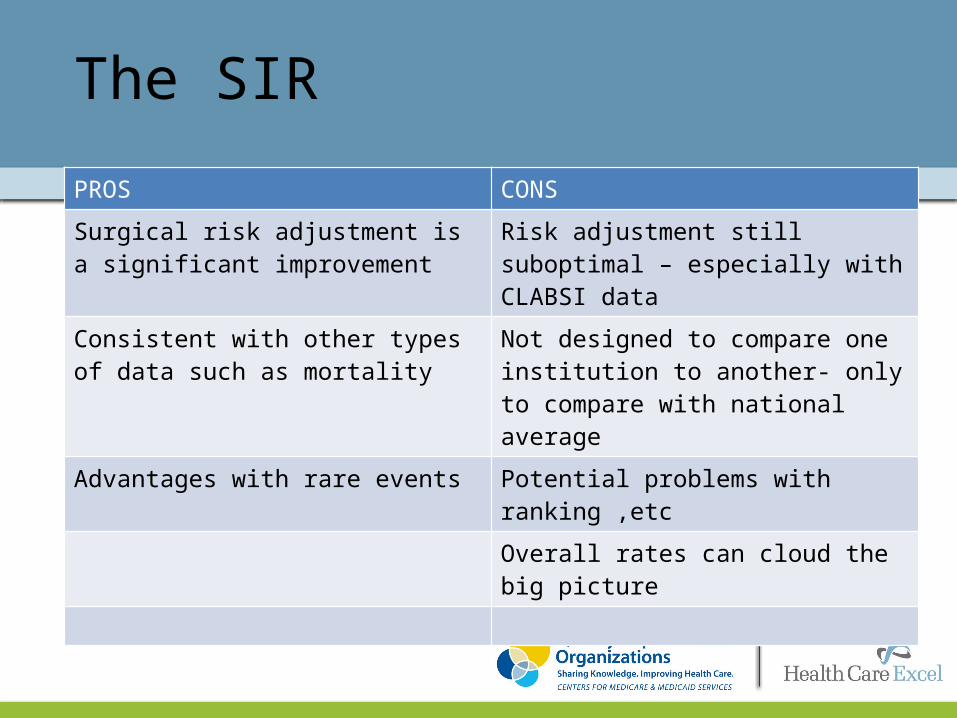
The SIR
PROS CONS
Surgical risk adjustment is a significant improvement
Risk adjustment still suboptimal – especially with CLABSI data
Consistent with other types of data such as mortality
Not designed to compare one institution to another- only to compare with national average
Advantages with rare events Potential problems with ranking ,etc
Overall rates can cloud the big picture
Questions ?
Contact Info
Email: [email protected] 502-454-5112 ext 2252
27
This material was prepared by Health Care Excel, the Medicare Quality Improvement Organization for Indiana, under contract with the Centers for Medicare & Medicaid Services (CMS), an agency of the U.S. Department of Health and Human Services. The contents presented do not necessarily reflect CMS policy. 10SOW-IN-INDPAT-13-012 4/1/13


