53
The State of Education in Indiana Jonathan A. Plucker, Ph.D. Indiana Association of Colleges for Teacher Education March 31, 2006
| Date post: | 27-Dec-2015 |
| Category: |
Documents |
| Upload: | johnathan-warner |
| View: | 214 times |
| Download: | 0 times |

The State of Education in Indiana
Jonathan A. Plucker, Ph.D.
Indiana Association of Colleges for Teacher Education
March 31, 2006
2
About the Center for Evaluation & Education Policy
• The Center for Evaluation & Education Policy (CEEP) is a client-focused, self-funded research center associated with the School of Education at Indiana University.
• CEEP provides a wide range of evaluation and nonpartisan policy research services to policymakers, governmental entities, and non-profit organizations.
• CEEP is continually looking for new opportunities to help inform, influence, and shape the development of P-16 education
policy not only in Indiana, but across the nation.
3
CEEP Associates focus their broad spectrum of experience and capabilities to produce high impact within five "Areas of Excellence":
• Educational Evaluation
• Math, Science, and Technology Evaluation
• Literacy Evaluation
• Education Policy Research and Technical Assistance
• Health, Human Services, and Community Development Evaluation

4
Outline
• Public Perceptions
• Good News
• Not-so-good News
• Teacher Preparation
• Predicted Trends

5
Data Sources
• The majority of data included in this overview is drawn from recent CEEP reports.
– ceep.indiana.edu
• “What’s New”
Hoosiers’ Perceptions of Education
7
Public Opinion on Education in Indiana
• CEEP conducted its third annual Public Opinion Survey on Education in Indiana in 2005
• Indicated that Hoosiers’ attitudes toward public schools and teachers are generally positive
• Indiana residents indicate greater knowledge of some areas of education, less knowledge in other areas than in previous surveys

8
Public School Quality
• 56% of Hoosiers say that public schools in Indiana provide an excellent or good education v. 37% fair or poor
• 55% (Excellent/Good) v. 42% (Fair/Poor) with school-aged children
• 57% v. 34% without school-aged children
0%
10%
20%
30%
40%
50%
60%
Excellent/Good Fair/Poor
2003
2004
2005
Source: 2005 Public Opinion Survey on Education in Indiana

9
Local School Quality
• 64% say their public schools provide an excellent or good education v. 30% fair or poor
• 63% (excellent/good) v. 33% fair/poor with school-aged children
• 64% v. 28% without school-aged children 0%
10%
20%
30%
40%
50%
60%
70%
Excellent/Good Fair/Poor20
03
2004
2005
Source: 2005 Public Opinion Survey on Education in Indiana
10
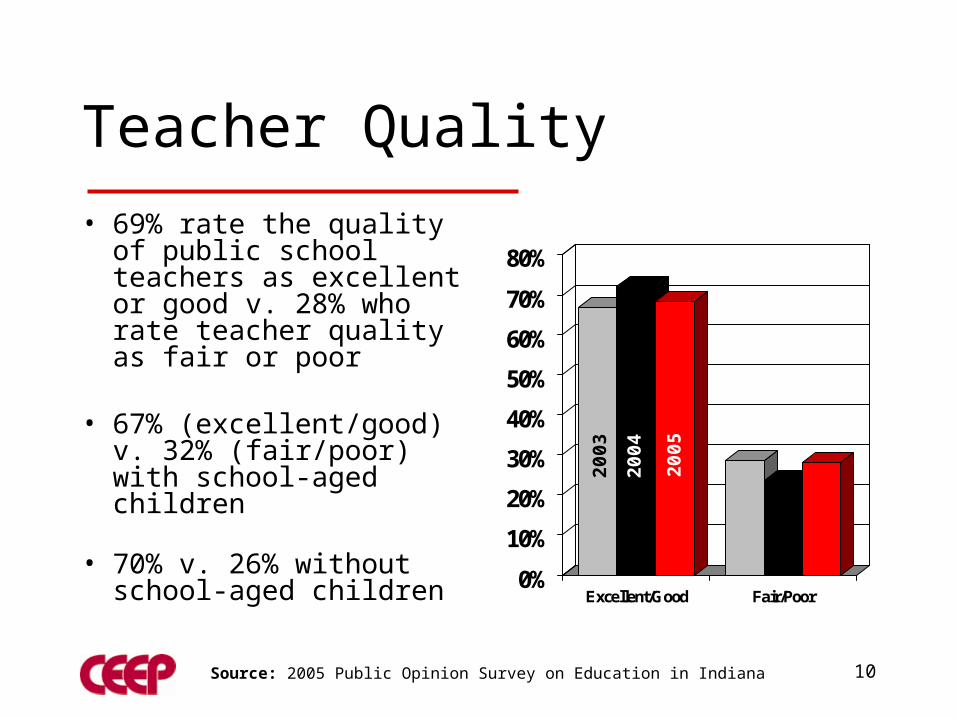
Teacher Quality
• 69% rate the quality of public school teachers as excellent or good v. 28% who rate teacher quality as fair or poor
• 67% (excellent/good) v. 32% (fair/poor) with school-aged children
• 70% v. 26% without school-aged children 0%
10%
20%
30%
40%
50%
60%
70%
80%
Excellent/Good Fair/Poor20
03
2004
2005
Source: 2005 Public Opinion Survey on Education in Indiana

11
Hoosiers Somewhat or Very Familiar With …
77%74% 74%
39% 34% 35% 40% 41% 38%
0%
10%20%
30%
40%
50%60%
70%
80%
90%100%
ISTEP+ Vouchers Charter Schools
2003
2004
2005
Source: 2005 Public Opinion Survey on Education in Indiana

12
46%47% 49%
40%
16% 15% 13%
0%
10%
20%
30%
40%
50%
60%
NCLB PL221
Hoosiers That Know a Great Deal or Some about …
2003
In
dian
a
2004
In
dian
a
2005
In
dian
a
2005
Nat
iona
lly
Source: 2005 Public Opinion Survey on Education in Indiana

The Good News

14
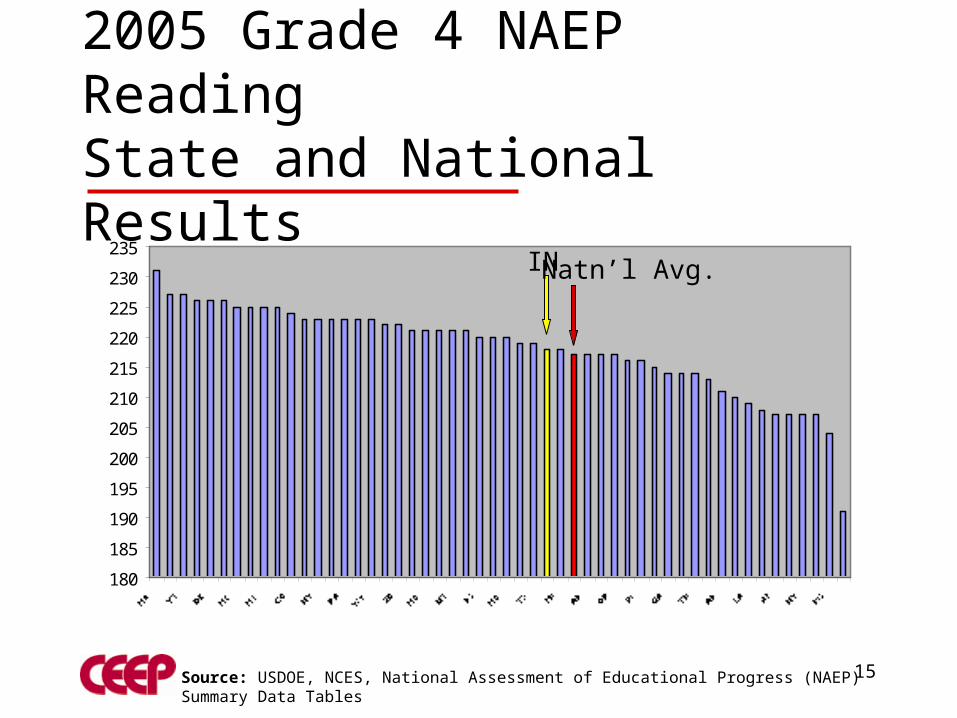
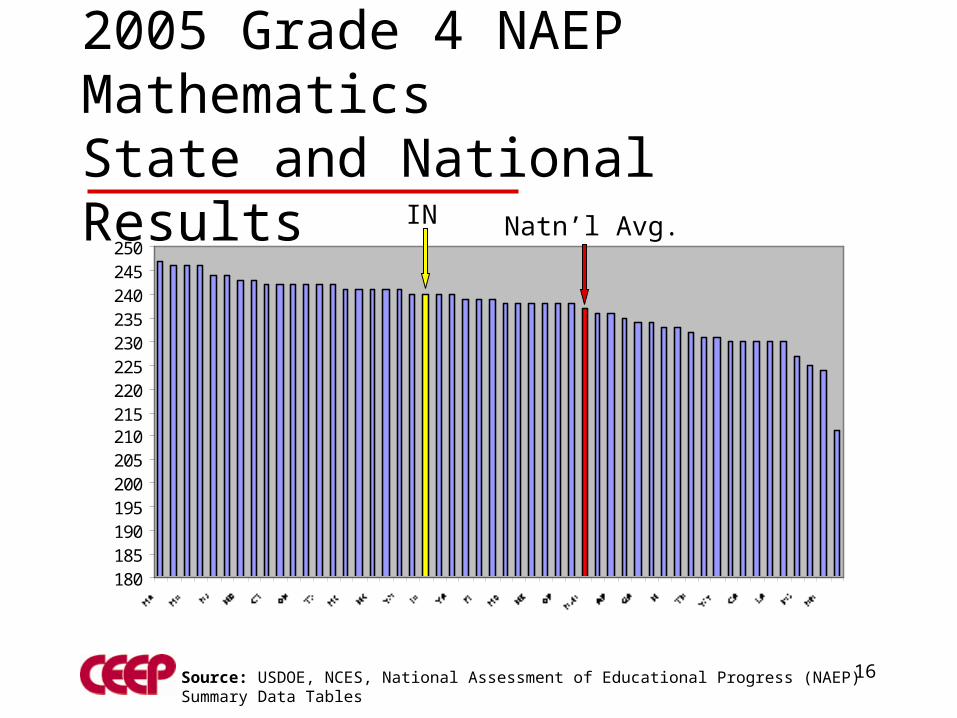
Hoosier students are showing improvement … • Indiana students score above the national average
on national assessments
• ISTEP+ achievement has been increasing
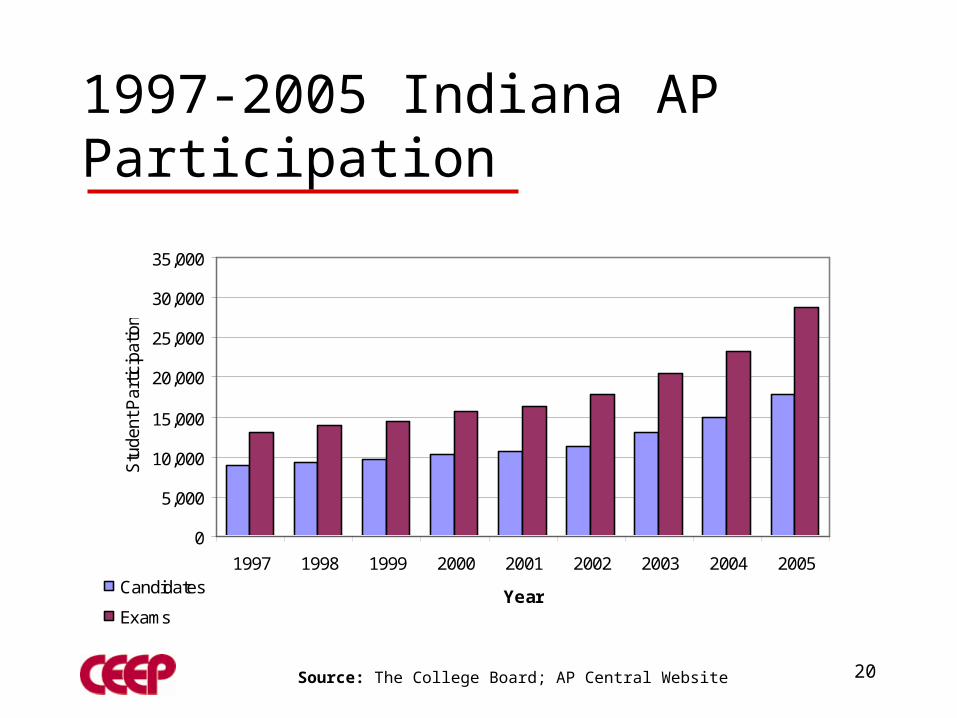
• AP participation, Core40 and AHD completion rates are increasing
• Hoosiers’ participation in higher education is also steadily increasing
15
180
185
190
195
200
205
210
215
220
225
230
235
2005 Grade 4 NAEP Reading State and National Results
Source: USDOE, NCES, National Assessment of Educational Progress (NAEP) Summary Data Tables
IN Natn’l Avg.
16
180185190195200205210215220225230235240245250
2005 Grade 4 NAEP Mathematics State and National Results
IN Natn’l Avg.
Source: USDOE, NCES, National Assessment of Educational Progress (NAEP) Summary Data Tables

17
215220225230235240245250255260265270275
2005 Grade 8 NAEP ReadingState and National Results
IN Natn’l Avg.
Source: USDOE, NCES, National Assessment of Educational Progress (NAEP) Summary Data Tables

18
235240245250255260265270275280285290295
2005 Grade 8 NAEP MathematicsState and National Results
INNatn’l Avg.
Source: USDOE, NCES, National Assessment of Educational Progress (NAEP) Summary Data Tables

19Source: Indiana Department of Education, ASAP Website
Students Passing Both English and Mathematics Sections of ISTEP+
0%
10%
20%
30%
40%
50%
60%
70%
1996 1997 1998 1999 2000 2001 2002 2003 2004 2005
20
1997-2005 Indiana AP Participation
Source: The College Board; AP Central Website
0
5,000
10,000
15,000
20,000
25,000
30,000
35,000
1997 1998 1999 2000 2001 2002 2003 2004 2005
Year
Stu
dent
Par
ticip
atio
n
Candidates
Exams

21
1998-2005 Indiana Students Earning Core 40 and Academic Honors Diplomas
0%
10%
20%
30%
40%
50%
60%
70%
80%
1998 1999 2000 2001 2002 2003 2004 2005
Indiana Total AHD
Indiana Total Core 40
Source: Indiana Department of Education, ASAP Website
22
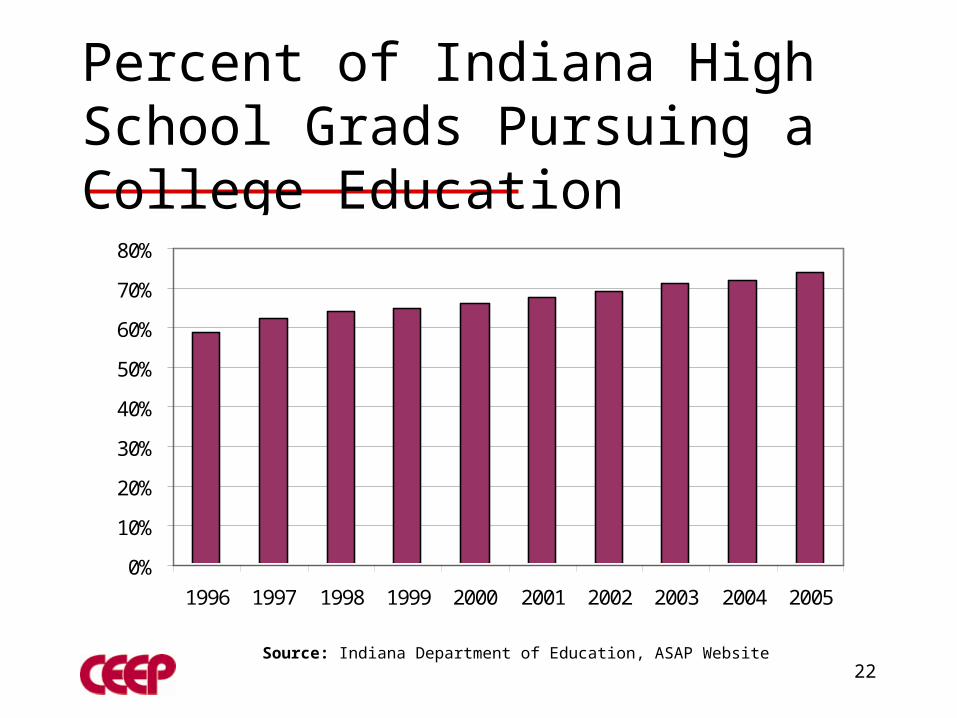
Percent of Indiana High School Grads Pursuing a College Education
0%
10%
20%
30%
40%
50%
60%
70%
80%
1996 1997 1998 1999 2000 2001 2002 2003 2004 2005
Source: Indiana Department of Education, ASAP Website

The Not-so-good News

24
The flip side of the student achievement coin … • Achievement gaps persist, and in many cases have
widened, over time
• These gaps are not evident in overall performance data, but when data are disaggregated by race/ethnicity and socio-economic status
• They are not localized, but present in all levels of education in Indiana

25
K-8 Indicators
• Performance disparities on ISTEP+ based on Ethnicity and SES
• African American and Hispanic students consistently demonstrate lower proficiency and achievement than their white peers

26
Grade 3 ISTEP+ Percent Passing by Ethnicity• The gap between white
and African American students in Grade 3 was 25 percentage points.
• The white/Hispanic gap at Grade 3 was 22 percentage points.
Source: Indiana Department of Education
27
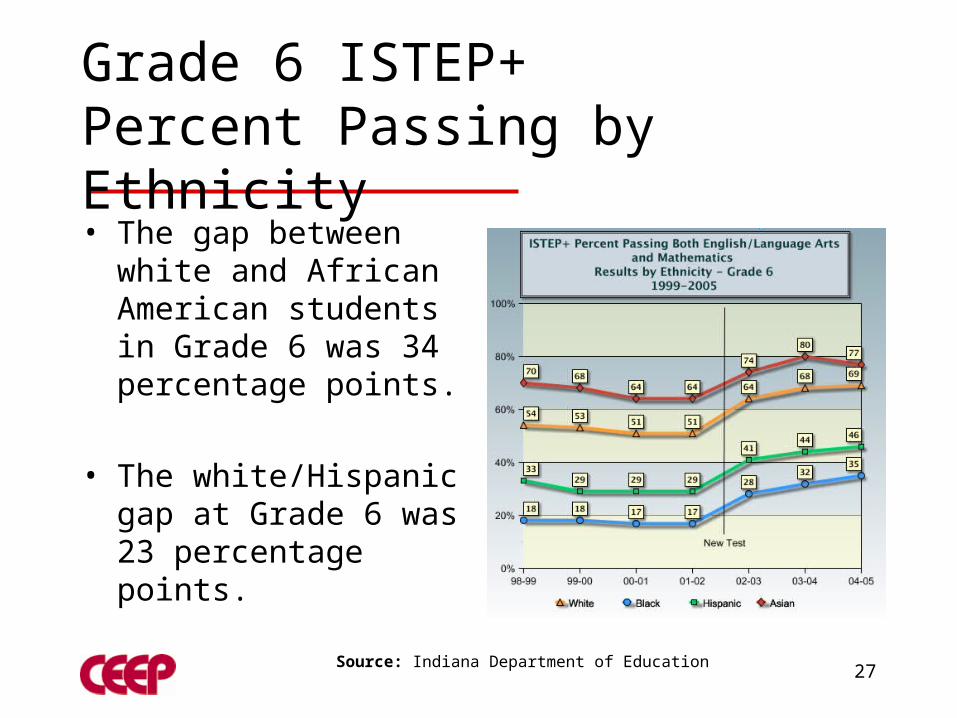
Grade 6 ISTEP+ Percent Passing by Ethnicity• The gap between white
and African American students in Grade 6 was 34 percentage points.
• The white/Hispanic gap at Grade 6 was 23 percentage points.
Source: Indiana Department of Education

28
Grade 8 ISTEP+ Percent Passing by Ethnicity
• The gap between white and African American students in Grade 8 was 35 percentage points.
• The white/Hispanic gap at Grade 8 was 24 percentage points.
Source: Indiana Department of Education

29
Grade 10 ISTEP+ Percent Passing by Ethnicity• The gap between white
and African American students in Grade 10 was 38 percentage points.
• The white/Hispanic gap at Grade 10 was 30 percentage points.
Source: Indiana Department of Education
30
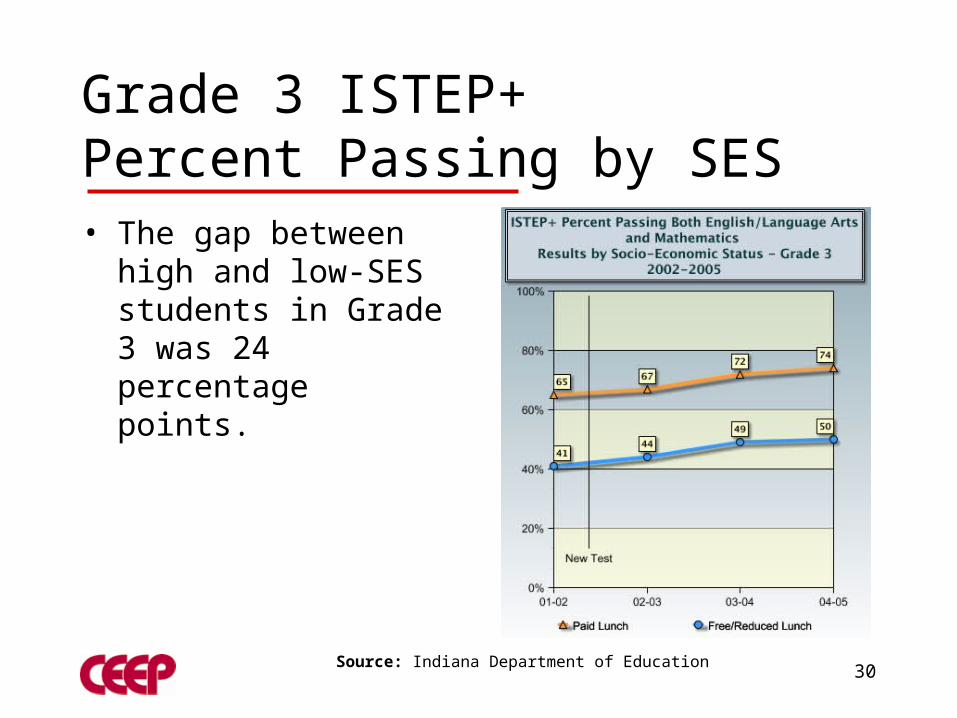
Grade 3 ISTEP+ Percent Passing by SES• The gap between high and
low-SES students in Grade 3 was 24 percentage points.
Source: Indiana Department of Education

31
Grade 6 ISTEP+ Percent Passing by SES• The gap between high and
low-SES students in Grade 6 was 27 percentage points.
Source: Indiana Department of Education

32
Grade 8 ISTEP+ Percent Passing by SES• The gap between high and
low-SES students in Grade 8 was 29 percentage points.
Source: Indiana Department of Education

33
Grade 10 ISTEP+ Percent Passing by SES• The gap between high and
low-SES students in Grade 10 was 30 percentage points.
Source: Indiana Department of Education

34
High School and Postsecondary Indicators
• Participation and achievement in AP programs and testing
• Achievement of Core 40 and Academic Honors Diplomas
• College participation and completion

35
Indiana AP Participation by Race/Ethnicity: 1997-2005
Source: The College Board; AP Central Website
0
2,000
4,000
6,000
8,000
10,000
12,000
14,000
16,000
1997 1998 1999 2000 2001 2002 2003 2004 2005African AmericanHispanicWhite
36
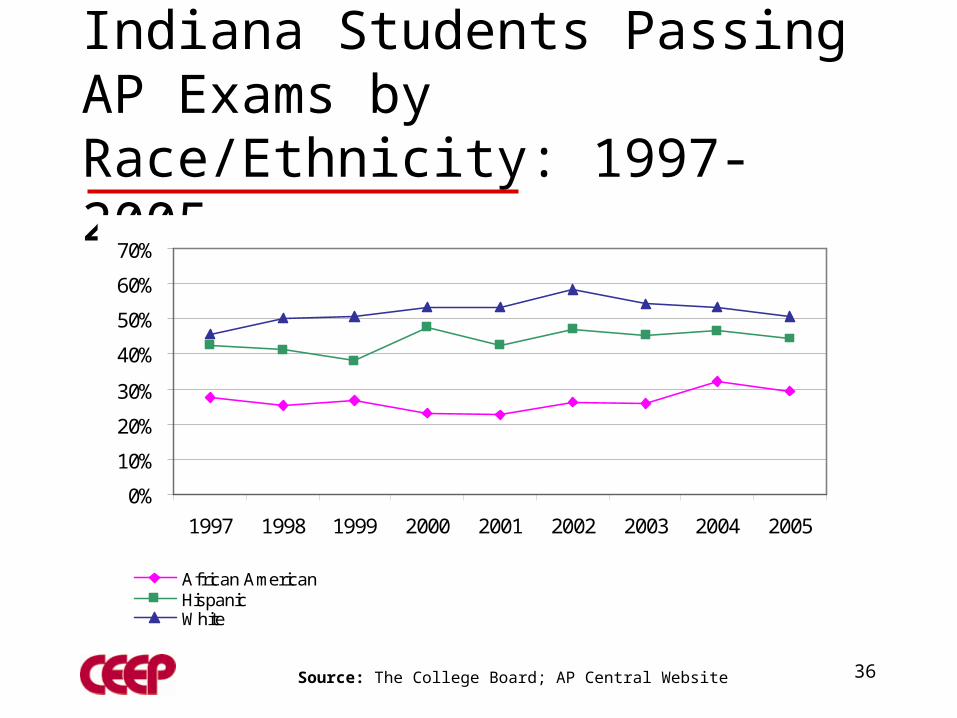
Indiana Students Passing AP Exams by Race/Ethnicity: 1997-2005
Source: The College Board; AP Central Website
0%
10%
20%
30%
40%
50%
60%
70%
1997 1998 1999 2000 2001 2002 2003 2004 2005
African AmericanHispanicWhite

37
1998-2005 Indiana Students Earning Core 40/Academic Honors Diplomas
0%
10%
20%
30%
40%
50%
60%
70%
80%
1998 1999 2000 2001 2002 2003 2004 2005
White HispanicAfrican-American Indiana Total
Source: Indiana Department of Education; ASAP Website

38
1998-2005 Indiana Students Earning Academic Honors Diplomas
Source: Indiana Department of Education; ASAP Website
0%
5%
10%
15%
20%
25%
30%
35%
1998 1999 2000 2001 2002 2003 2004 2005
White HispanicAfrican-American Indiana Total

40
Indiana Students’ High School to College Completion
Of every 100 Indiana 9th graders:
68 students graduate from high school
43 students enter college
32 are still enrolled as sophomores
22 graduate from college*
* College graduation defined by graduation within three years for an associate degree and six years for a baccalaureate degree.
Source: Drawn from Indiana Commission for Higher Education data based on the NCES Common Core of Data, NCES IPEDS Residency and Migration
Survey, ACT Institutional Survey, NCES IPEDS Graduation Rate Survey as presented by NCHEMS, 2002.
41
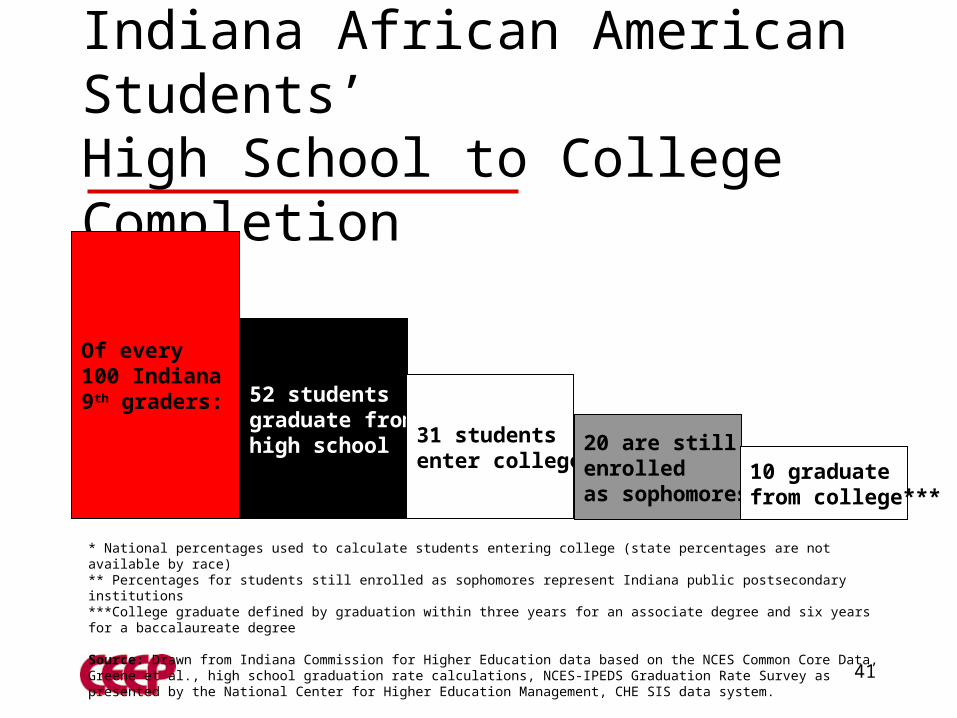
Indiana African American Students’ High School to College Completion
Of every 100 Indiana 9th graders: 52 students
graduate from high school 31 students
enter college*20 are still enrolled as sophomores**
10 graduate from college***
* National percentages used to calculate students entering college (state percentages are not available by race)** Percentages for students still enrolled as sophomores represent Indiana public postsecondary institutions***College graduate defined by graduation within three years for an associate degree and six years for a baccalaureate degree
Source: Drawn from Indiana Commission for Higher Education data based on the NCES Common Core Data, Greene et al., high school graduation rate calculations, NCES-IPEDS Graduation Rate Survey as presented by the National Center for Higher Education Management, CHE SIS data system.

42
Indiana Hispanic Students’ High School to College Completion
Of every 100 Indiana 9th graders: 53 students
graduate from high school 28 students
enter college*19 are still enrolled as sophomores**
8 graduate from college***
* National percentages used to calculate students entering college (state percentages are not available by race)** Percentages for students still enrolled as sophomores represent Indiana public postsecondary institutions***College graduate defined by graduation within three years for an associate degree and six years for a baccalaureate degree
Source: Drawn from Indiana Commission for Higher Education data based on the NCES Common Core Data, Greene et al., high school graduation rate calculations, NCES-IPEDS Graduation Rate Survey as presented by the National Center for Higher Education Management, CHE SIS data system.

43
Median Income by Education Level for Hoosiers Ages 25-34
$0
$5,000
$10,000
$15,000
$20,000
$25,000
$30,000
$35,000
$40,000
$45,000
No HSDiploma
HS Graduate SomeCollege
Bachelor'sDegree
AdvancedDegree
Source: U.S. Census Bureau; Data are from 1999

Teacher Education in Indiana
45
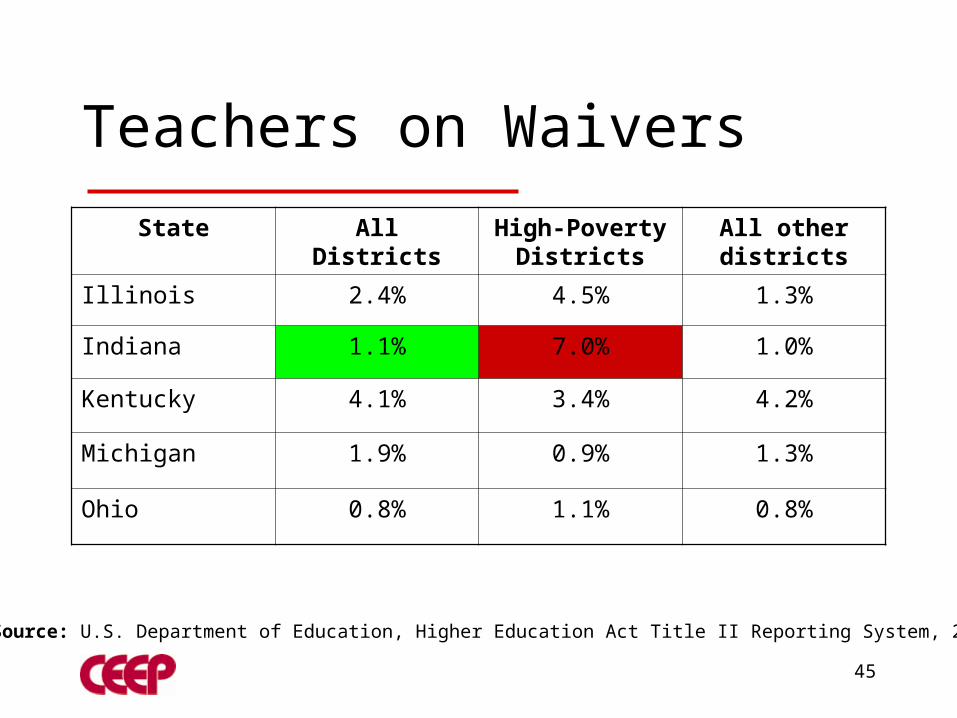
Teachers on Waivers
State All Districts High-Poverty Districts
All other districts
Illinois 2.4% 4.5% 1.3%
Indiana 1.1% 7.0% 1.0%
Kentucky 4.1% 3.4% 4.2%
Michigan 1.9% 0.9% 1.3%
Ohio 0.8% 1.1% 0.8%
Source: U.S. Department of Education, Higher Education Act Title II Reporting System, 2004
46
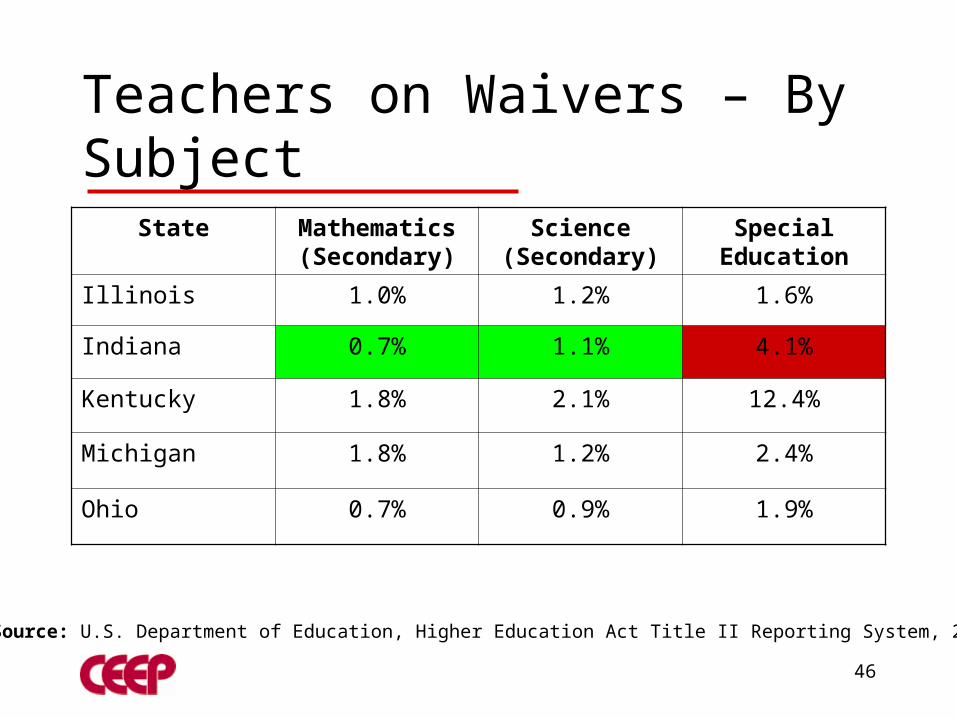
Teachers on Waivers – By Subject
State Mathematics (Secondary)
Science (Secondary)
Special Education
Illinois 1.0% 1.2% 1.6%
Indiana 0.7% 1.1% 4.1%
Kentucky 1.8% 2.1% 12.4%
Michigan 1.8% 1.2% 2.4%
Ohio 0.7% 0.9% 1.9%
Source: U.S. Department of Education, Higher Education Act Title II Reporting System, 2004

47
Efforts to Recruit/Retain Teachers
Initiative IN U.S.
State finances education assistance for teachers No 24
State finances and targets education assistance to teachers of subject-area shortages
No 18
State finances and targets education assistance for teachers in high-need schools
No 7
State finances housing assistance for teachers No 6
State finances and targets housing assistance to teachers of subject-area shortages
No 3
State finances and targets housing assistance to teachers in high-need schools
No 3
State finances signing bonuses for new teachers No 5
State finances and targets signing bonuses to teachers of subject-area shortages
No 2
Source: Edweek.org
48
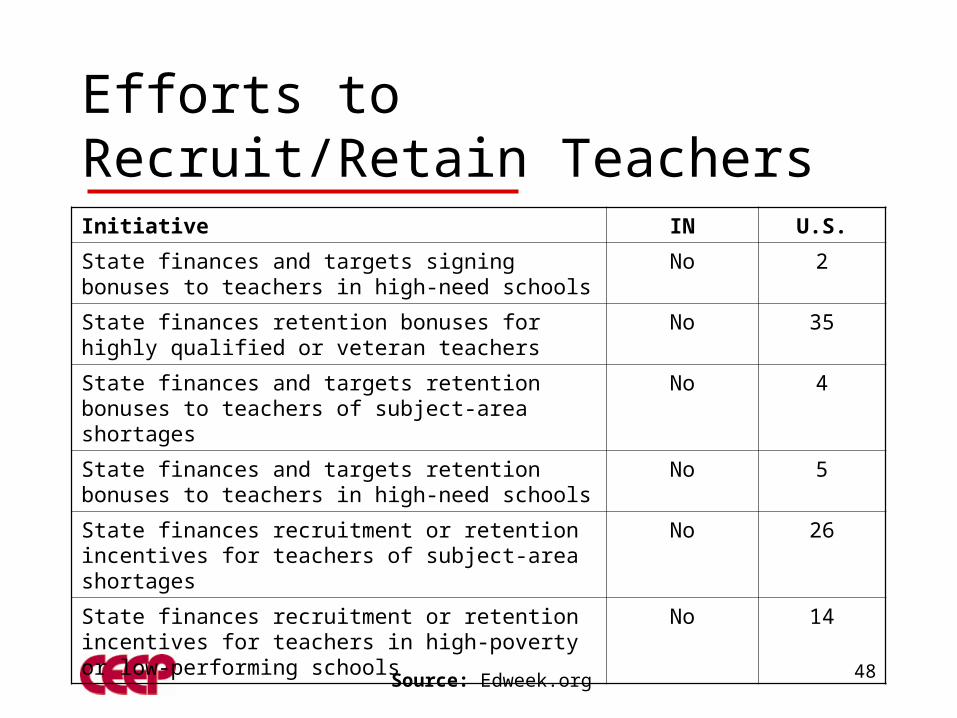
Efforts to Recruit/Retain Teachers
Initiative IN U.S.
State finances and targets signing bonuses to teachers in high-need schools
No 2
State finances retention bonuses for highly qualified or veteran teachers
No 35
State finances and targets retention bonuses to teachers of subject-area shortages
No 4
State finances and targets retention bonuses to teachers in high-need schools
No 5
State finances recruitment or retention incentives for teachers of subject-area shortages
No 26
State finances recruitment or retention incentives for teachers in high-poverty or low-performing schools
No 14
Source: Edweek.org

Predicted Trends

50
NCLB
• … will be reauthorized with minor to moderate revisions.
• For three reasons:– 90% of the law was preexisting, and it passed
with overwhelming bipartisan support– Bush will still be president– And …

51
Indiana Federal Ed Funding FY05
050,000,000
100,000,000150,000,000200,000,000250,000,000300,000,000350,000,000400,000,000450,000,000500,000,000
Federal Funding My salary
$

52
Likely NCLB Changes
• Growth model added to existing system
• Special education addressed but probably not changed substantially
• National standards and tests more likely but hardly ensured.
• WWC will be reformed or will collapse
53
Indiana Trends
• FDK more likely but hardly ensured.• Repayment of K-12 schools and colleges is
looking more likely.• Deregulation will happen in some form.• Intelligent design will be back.• Choice will expand … in some form.• # of ESL students will continue to increase
exponentially.

54
CEEP Contact Information:
Jonathan A. Plucker, Ph.D.Director
509 East Third Street
Bloomington, Indiana 47401-3654
812-855-4438
1-800-511-6575
Fax: 812-856-5890
http://ceep.indiana.edu


