53
THE STATE OF GLOBAL PET FOOD: TRENDS AND GROWTH OPPORTUNITIES JARED KOERTEN SENIOR ANALYST PFAC, OTTAWA, NOVEMBER 5, 2015
THE STATE OF GLOBAL PET FOOD:TRENDS AND GROWTH OPPORTUNITIES
JARED KOERTEN
SENIOR ANALYST
PFAC, OTTAWA, NOVEMBER 5, 2015

GLOBAL OVERVIEWDEVELOPED REGIONS
EMERGING REGIONS
THE FUTURE

© Euromonitor International
4
Pet Care: Category CoverageGLOBAL OVERVIEW
Pet Care
Pet Food
Dog Food
Cat Food Other Pet Food
Bird Food
Small Mammal/
Reptile Food
Fish Food
Pet Products
Cat Litter
Pet Dietary Supplements
Pet Healthcare
Other Pet Products

© Euromonitor International
5
Dog and Cat Food: Type and Price PlatformGLOBAL OVERVIEW
Pet Food by Type
Dog Food
Dry
Wet
Treats
Cat Food
Dry
Wet
Treats
Dog Food by Price Platform
Economy
Mid-Priced
Premium
Cat Food by Price Platform
Economy
Mid-Priced
Premium
© Euromonitor International
6
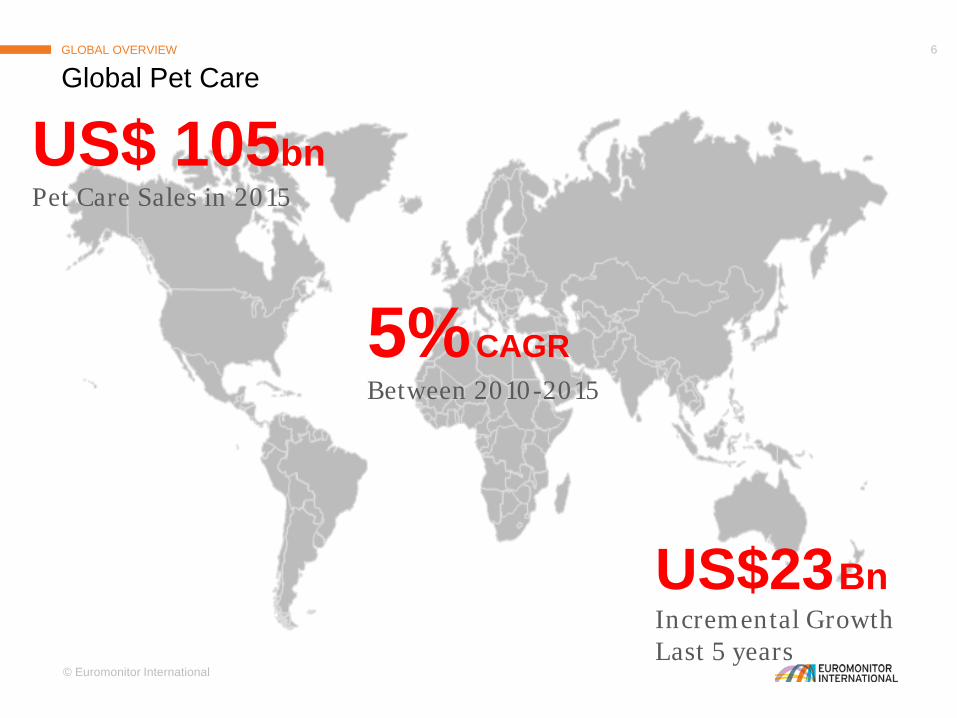
Global Pet CareGLOBAL OVERVIEW
US$ 105bnPet Care Sales in 2015
5%CAGRBetween 2010-2015
US$23BnIncremental Growth Last 5 years

© Euromonitor International
7
$0
$20
$40
$60
$80
$100
$120
2010 2011 2012 2013 2014 2015 (p)
Sale
s (U
S$, b
n, F
ixed
E-R
)
Global Spending on Pet Care: 2010-2015
Pet Products
Pet Food
A Large and Growing MarketGLOBAL OVERVIEW
© Euromonitor International
8
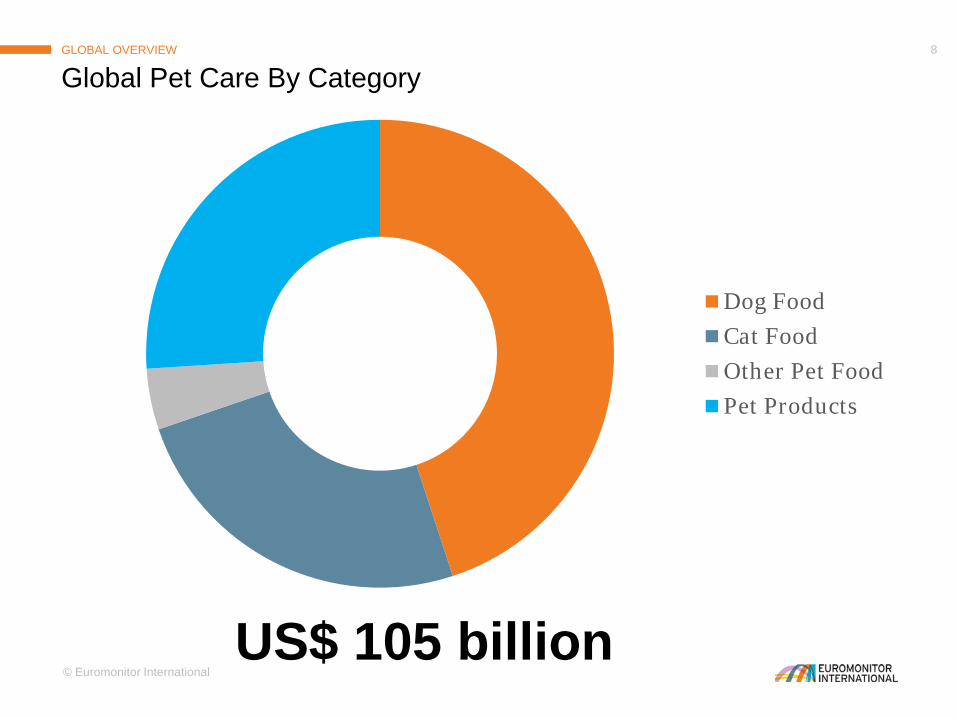
Dog FoodCat FoodOther Pet FoodPet Products
Global Pet Care By CategoryGLOBAL OVERVIEW
US$ 105 billion
© Euromonitor International
9
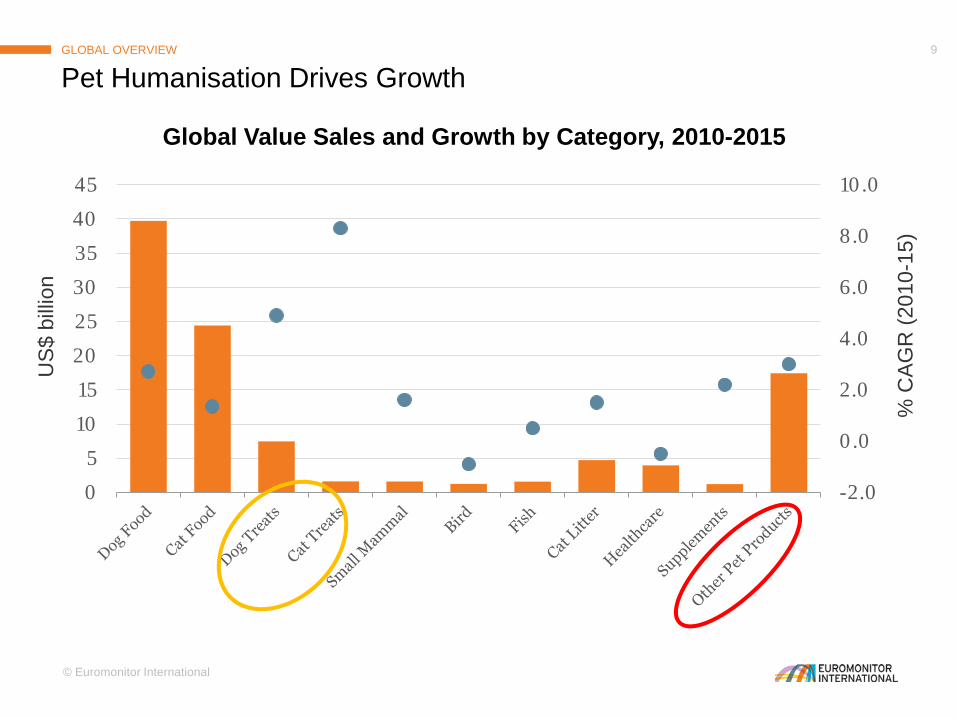
Pet Humanisation Drives GrowthGLOBAL OVERVIEW
-2.0
0.0
2.0
4.0
6.0
8.0
10.0
0
5
10
15
20
25
30
35
40
45
% C
AGR
(201
0-15
)
US$
billi
on
Global Value Sales and Growth by Category, 2010-2015
© Euromonitor International
10
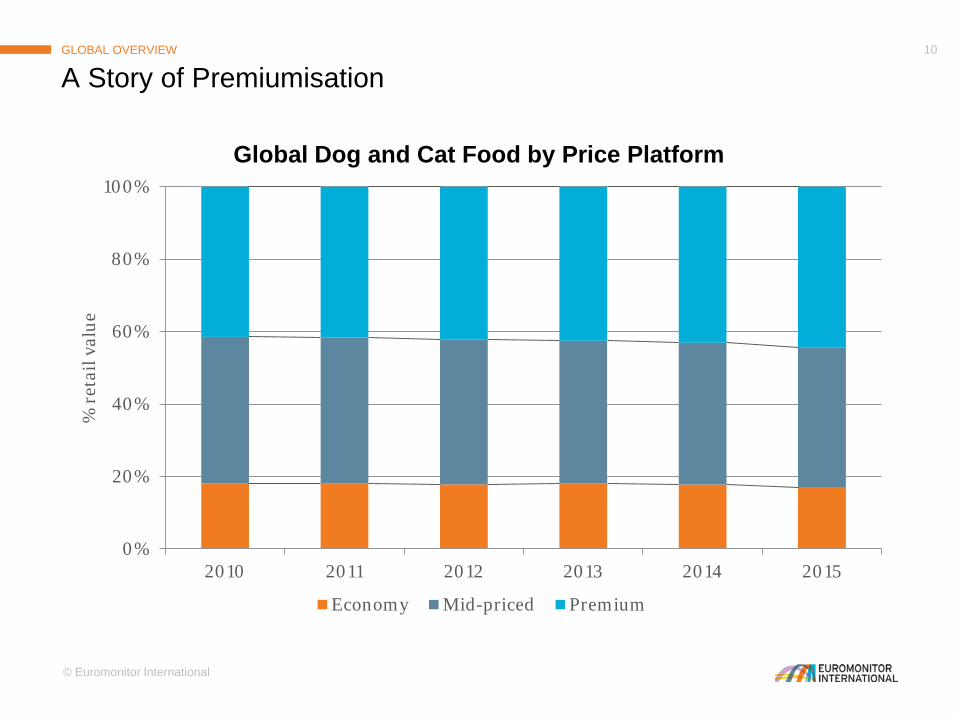
A Story of PremiumisationGLOBAL OVERVIEW
0%
20%
40%
60%
80%
100%
2010 2011 2012 2013 2014 2015
% r
etai
l val
ue
Global Dog and Cat Food by Price Platform
Economy Mid-priced Premium
© Euromonitor International
11
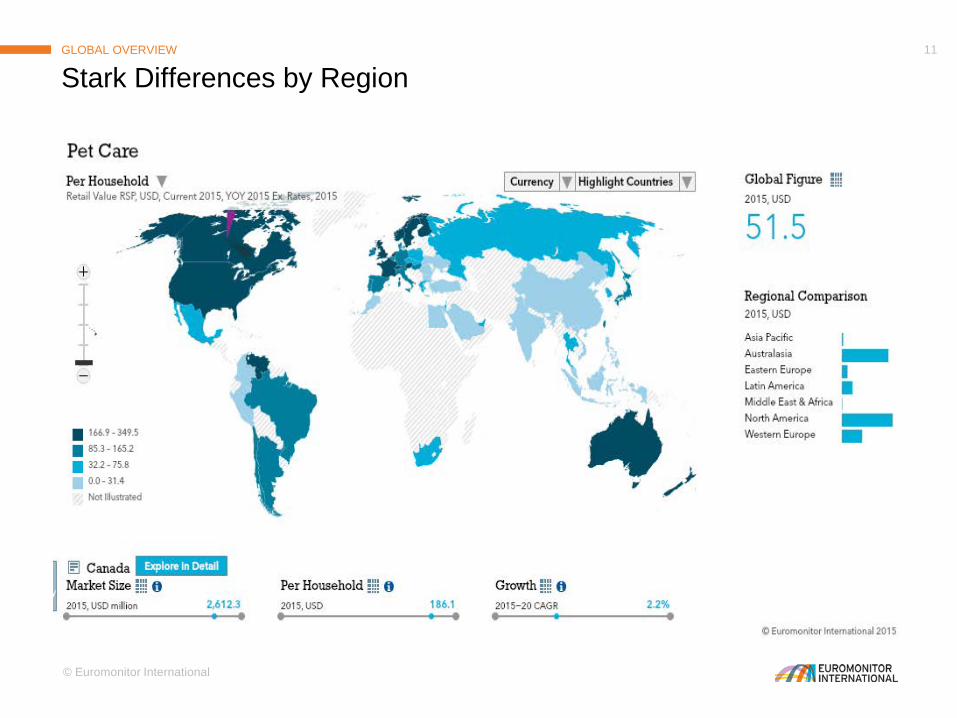
Stark Differences by RegionGLOBAL OVERVIEW
© Euromonitor International
12
Asia Pacific
Australasia
Eastern Europe
Latin America
Middle East & Africa
North America
Western Europe
0%
2%
4%
6%
8%
10%
12%
14%
16%
18%
$0 $50 $100 $150 $200 $250 $300 $350
CA
GR
, 201
0-15
Per Household Sales, 2014
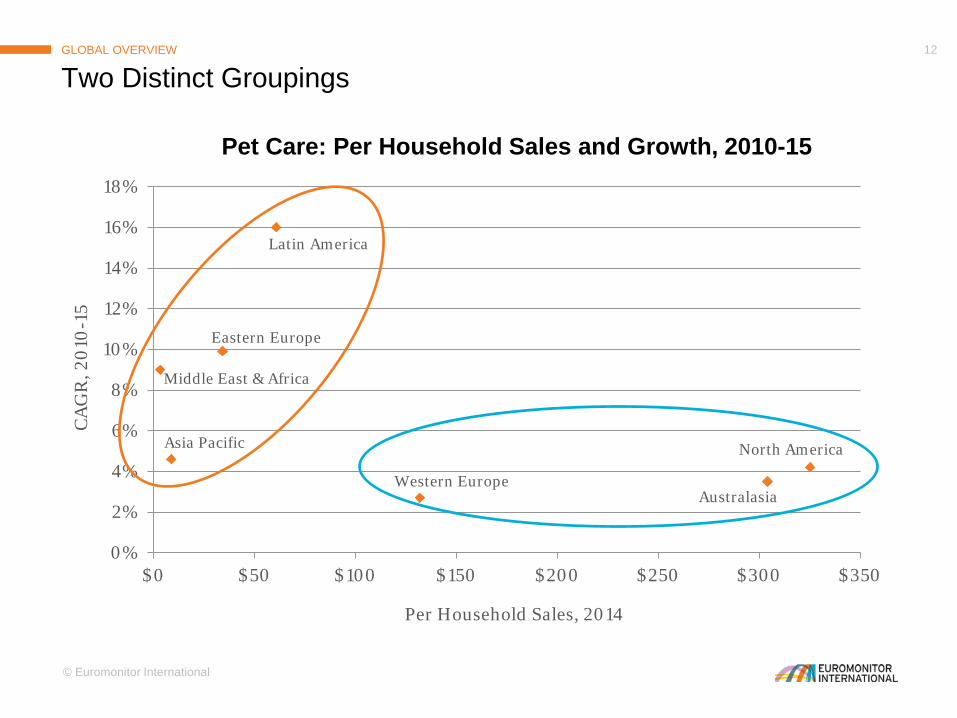
Pet Care: Per Household Sales and Growth, 2010-15
Two Distinct GroupingsGLOBAL OVERVIEW
GLOBAL OVERVIEW
DEVELOPED REGIONSEMERGING REGIONS
THE FUTURE
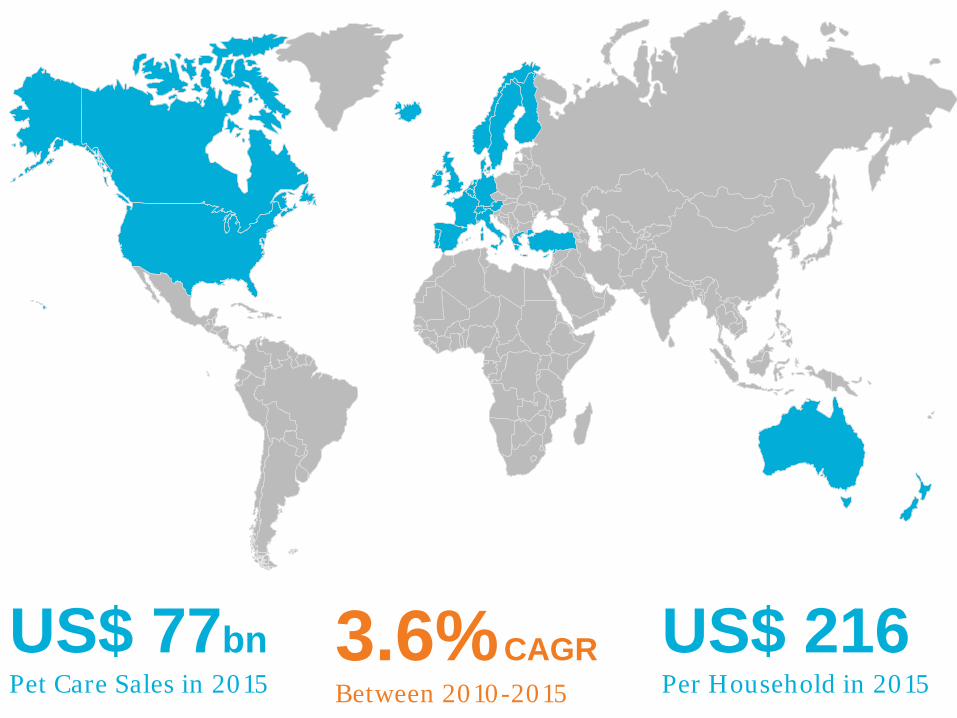
US$ 77bnPet Care Sales in 2015
US$ 216Per Household in 2015
3.6%CAGRBetween 2010-2015

© Euromonitor International
15
Leading MarketsDEVELOPED MARKETS
0.0
1.0
2.0
3.0
4.0
5.0
6.0
0
5
10
15
20
25
30
35
40
45
50
USA UnitedKingdom
France Germany Italy Australia Canada Spain Netherlands
% C
AG
R 2
010-
15 (F
ixed
E-R
)
US$
(bill
ions
, 201
5)
Leading Countries in Developed Regions, 2010-15

© Euromonitor International
16
Values over VolumesDEVELOPED MARKETS
-1%
0%
1%
2%
3%
4%
5%
2010-11 2011-12 2012-13 2013-14 2014-15
Y-on
-y g
row
th
Dog and Cat Food: Growth in Developed Regions
Value Sales(US$, Fixed E-R)
Volume Sales
© Euromonitor International
17
0
50
100
150
200
250
300
2010 2011 2012 2013 2014 2015
Popu
lati
on (i
n m
illio
ns)
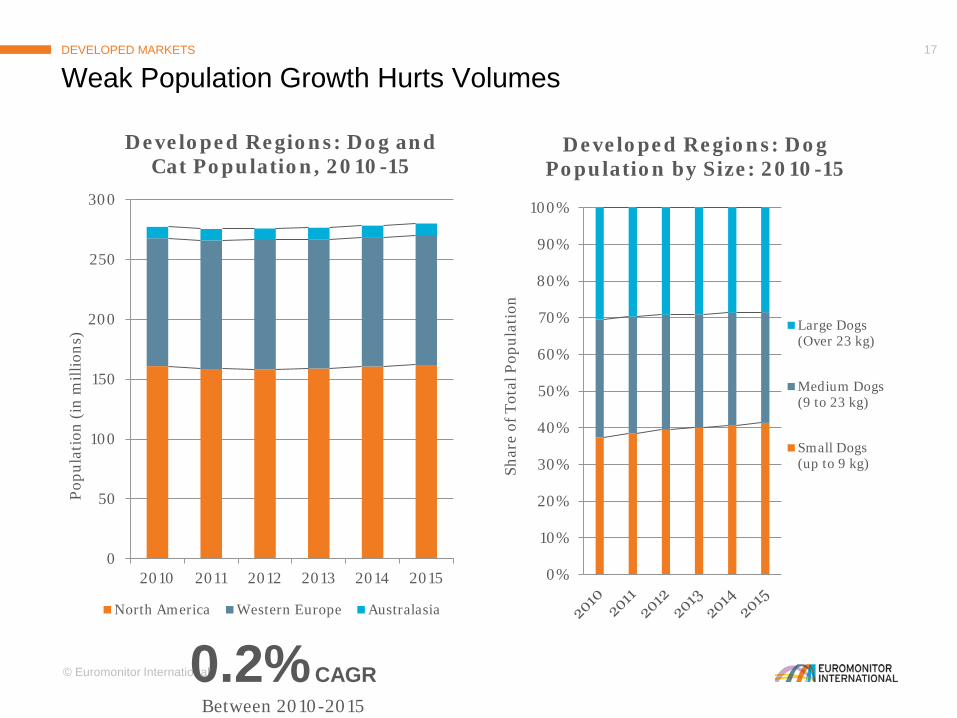
Developed Regions: Dog and Cat Population, 2010-15
North America Western Europe Australasia
0%
10%
20%
30%
40%
50%
60%
70%
80%
90%
100%
Shar
e of
Tot
al P
opul
atio
n
Developed Regions: Dog Population by Size: 2010-15
Large Dogs(Over 23 kg)
Medium Dogs(9 to 23 kg)
Small Dogs(up to 9 kg)
Weak Population Growth Hurts VolumesDEVELOPED MARKETS
0.2%CAGRBetween 2010-2015
© Euromonitor International
18
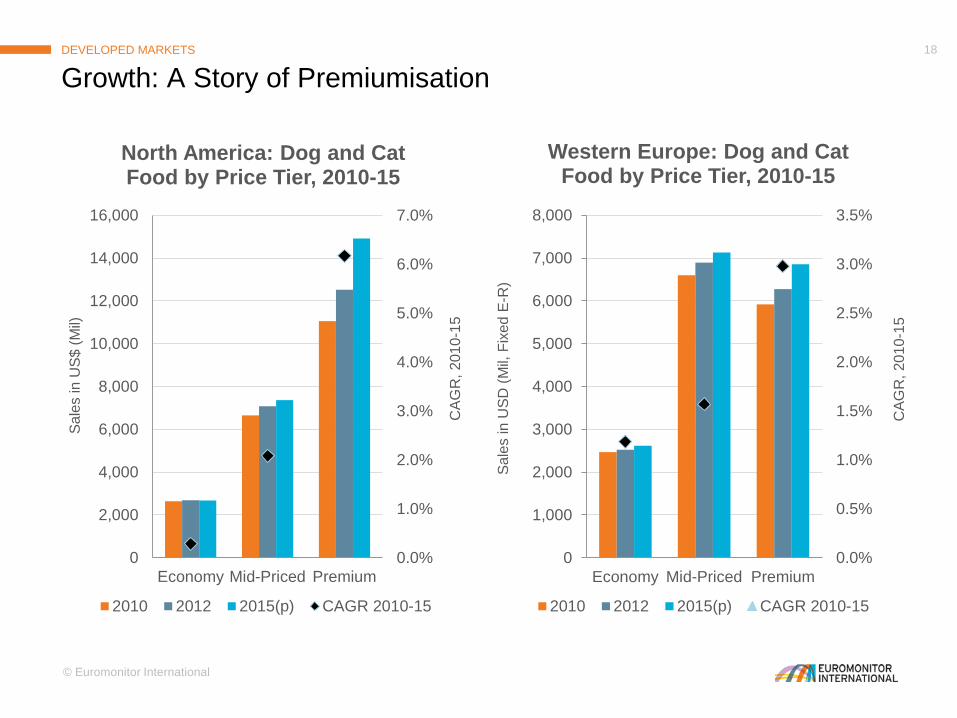
Growth: A Story of PremiumisationDEVELOPED MARKETS
0.0%
1.0%
2.0%
3.0%
4.0%
5.0%
6.0%
7.0%
0
2,000
4,000
6,000
8,000
10,000
12,000
14,000
16,000
Economy Mid-Priced Premium
CAG
R, 2
010-
15
Sale
s in
US$
(Mil)
North America: Dog and Cat Food by Price Tier, 2010-15
2010 2012 2015(p) CAGR 2010-15
0.0%
0.5%
1.0%
1.5%
2.0%
2.5%
3.0%
3.5%
0
1,000
2,000
3,000
4,000
5,000
6,000
7,000
8,000
Economy Mid-Priced Premium
CAG
R, 2
010-
15
Sale
s in
USD
(Mil,
Fix
ed E
-R)
Western Europe: Dog and Cat Food by Price Tier, 2010-15
2010 2012 2015(p) CAGR 2010-15

© Euromonitor International
19
Example: New Products in Canada Go UpscaleDEVELOPED MARKETS
Caru Naturals Stews by Caru Pet FoodPremium Wet Dog FoodLaunched June 2014
Resembles a stew that humans would eat: instantly-recognizable ingredients
Premium packaging: Recyclable Cartons; BPA-Free
All-Natural Formulation: No Artificial Colors, Flavors or Preservatives
Grain-Free, Gluten-Free, Soy-Free, No Animal By-Products
Fromm Four Star Beef Liva‘ttini Veg by Fromm Family FoodsPremium Dry Cat FoodLaunched April 2014
Grain-Free Recipe featuring beef liver, eggs, cheese, tomato, spinach, eggplant, zucchini
Premium packaging: Stand-Up pouch designed with fancy colors
Part of the company’s “Four Star Nutritionals” line
“An Italian Experience You Won’t Soon Forget”
“Pairs well with Chicken Duck and Salmon Pâté”
© Euromonitor International
20
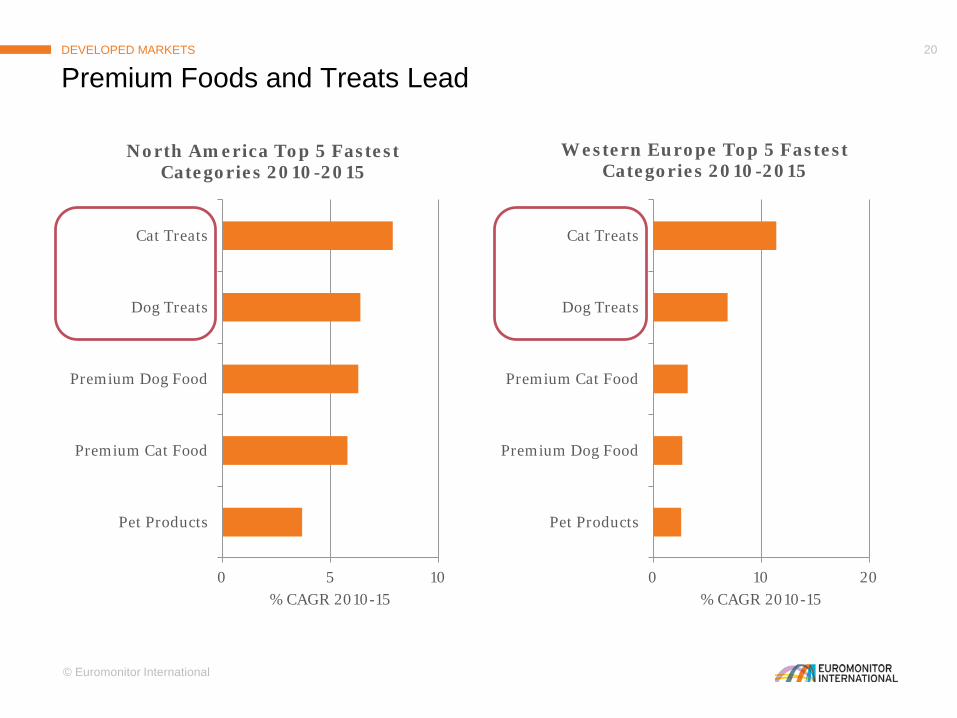
0 5 10
Pet Products
Premium Cat Food
Premium Dog Food
Dog Treats
Cat Treats
% CAGR 2010-15
North America Top 5 Fastest Categories 2010-2015
Premium Foods and Treats LeadDEVELOPED MARKETS
0 10 20
Pet Products
Premium Dog Food
Premium Cat Food
Dog Treats
Cat Treats
% CAGR 2010-15
Western Europe Top 5 Fastest Categories 2010-2015

© Euromonitor International
21
Temptations Snacky Mouse by Mars IncCat TreatsUSA, 2015
Interactive toy and treat combination
Treat dispenser - Whiskas Temptations included in package
Entertaining for both cats and owners
Milk-Bone Brushing Chews by Big Heart Pet BrandsDog TreatsUSA, 2014
Helps clean teeth while chewed
Veterinary Oral Health Council’s (VOHC) seal of approval
Packaging looks like premium toothpaste
Innovation in US Pet TreatsDEVELOPED MARKETS
© Euromonitor International
22
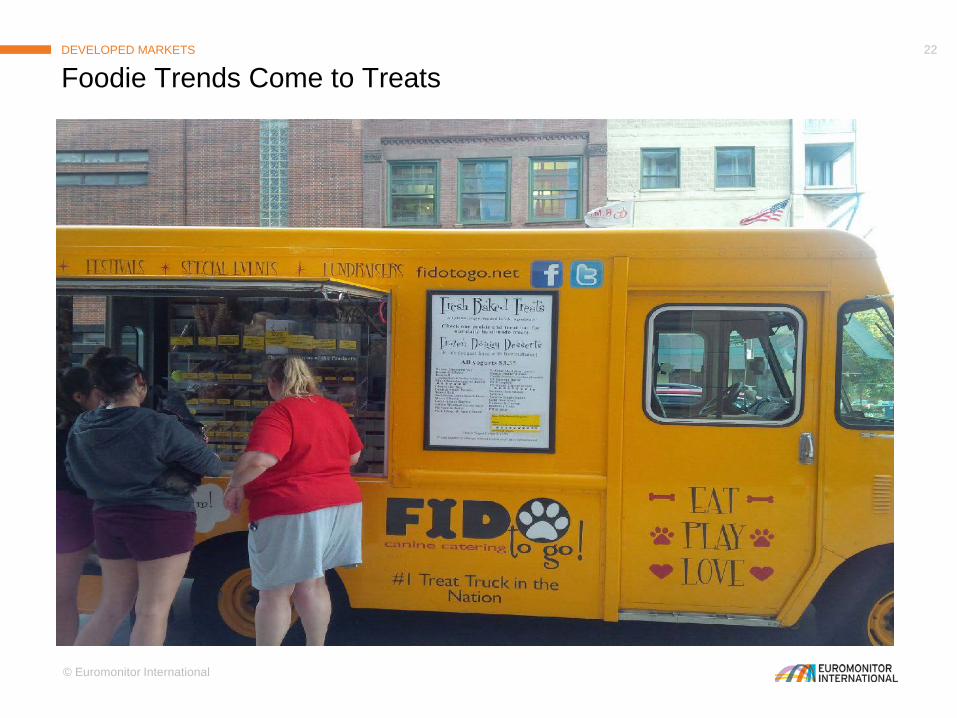
Foodie Trends Come to TreatsDEVELOPED MARKETS
© Euromonitor International
23
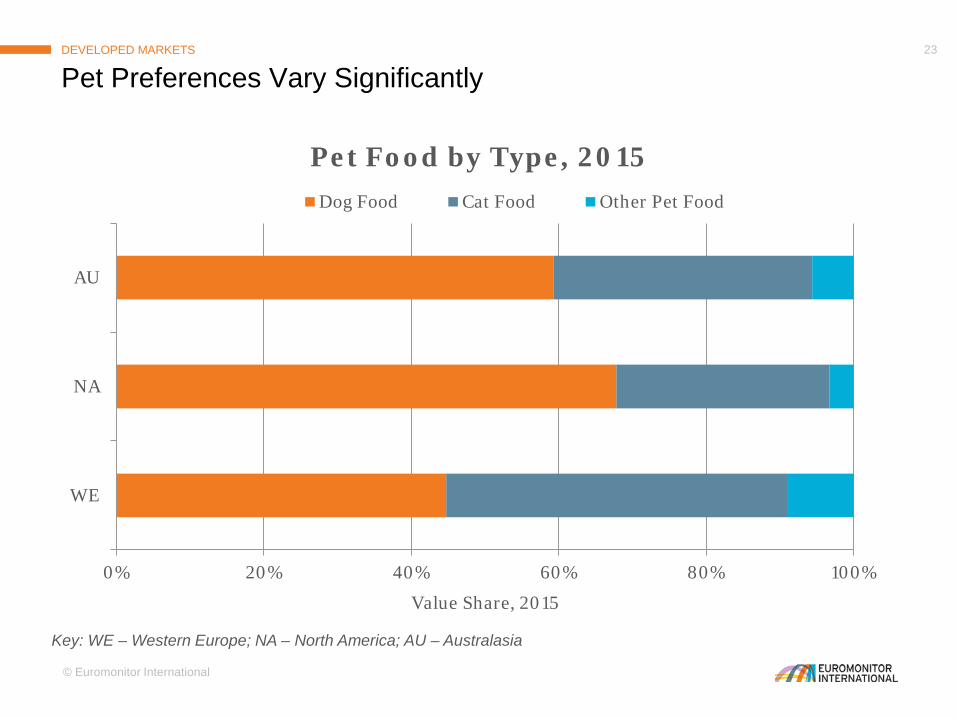
0% 20% 40% 60% 80% 100%
WE
NA
AU
Value Share, 2015
Pet Food by Type, 2015Dog Food Cat Food Other Pet Food
Pet Preferences Vary SignificantlyDEVELOPED MARKETS
Key: WE – Western Europe; NA – North America; AU – Australasia
© Euromonitor International
24
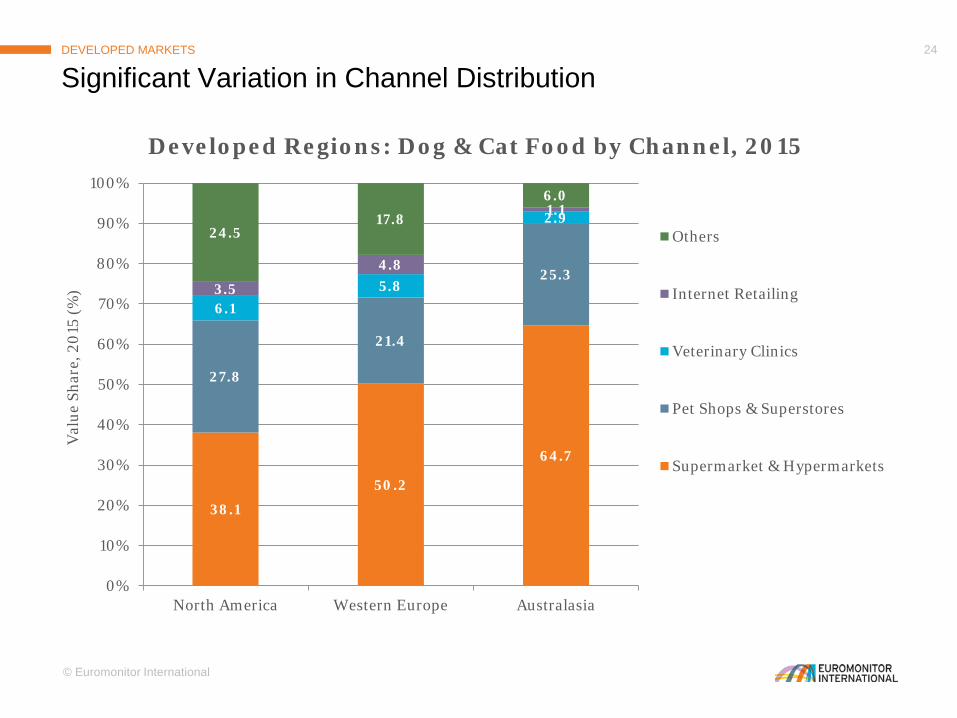
38.1
50.2
64.7
27.8
21.4
25.3
6.15.8
2.9
3.5
4.8
1.124.5
17.8
6.0
0%
10%
20%
30%
40%
50%
60%
70%
80%
90%
100%
North America Western Europe Australasia
Val
ue S
hare
, 201
5 (%
)
Developed Regions: Dog & Cat Food by Channel, 2015
Others
Internet Retailing
Veterinary Clinics
Pet Shops & Superstores
Supermarket & Hypermarkets
Significant Variation in Channel Distribution DEVELOPED MARKETS

© Euromonitor International
25
0% 20% 40% 60% 80% 100%
NA
AU
WE
Value Share, 2015
Dog & Cat Food: Pet Shops vs Superstores
Pet Shops Pet Superstores
Shops vs SuperstoresDEVELOPED MARKETS
Key: WE – Western Europe; NA – North America; AU – Australasia
Petco Photo Courtesy of: Mike Mozart (https://www.flickr.com/photos/jeepersmedia/14345603431/)Fressnapf Photo Courtesy of: Noebse (https://commons.wikimedia.org/wiki/Category:Fressnapf#/media/File:Fressnapf_Markt.JPG)
Pets at Home Photo Courtesy of: David Wright (https://commons.wikimedia.org/wiki/File:Pets_at_home_-_geograph.org.uk_-_485114.jpg)
47.5%
22.6%
12.2% 9.4%

© Euromonitor International
26
19.3 19.4
22.9 18.7
7.46.0
6.66.6
20.422.7
5.55.1
5.16.9
1.6 3.56.1 6.15.1 5.0
0%
10%
20%
30%
40%
50%
60%
70%
80%
90%
100%
2010 2015
Val
ue S
hare
North America: Dog & Cat Food Channel Share
Others
Veterinary clinics
Internet Retailing
Home and Garden
Pet shops
Pet superstores
Warehouse Clubs
Mass Merchandisers
Supermarkets
Hypermarkets
Pet Superstores Boom in North AmericaDEVELOPED MARKETS

© Euromonitor International
27
Premium Manufacturers Gain SharePREMIUM PRODUCTS LEAD THE WAY
30.8 30.3
22.4 26.9
7.1
9.98.1
3.53.6
2.84.5
2.53.4
12.0 11.5
9.0 11.7
0%
10%
20%
30%
40%
50%
60%
70%
80%
90%
100%
2009 2014
Val
ue S
hare
Canada: Dog & Cat Food Share by Company, 2009-14
Others
Private Label
Blue Buffalo Co Ltd
Champion Petfoods LP
Colgate-Palmolive Co
Big Heart Pet Brands
Procter & Gamble
Mars Inc*
Nestlé SA
*Note: Mars acquired Procter & Gamble’s Pet Business in April 2014
GLOBAL OVERVIEW
DEVELOPED REGIONS
EMERGING REGIONSTHE FUTURE
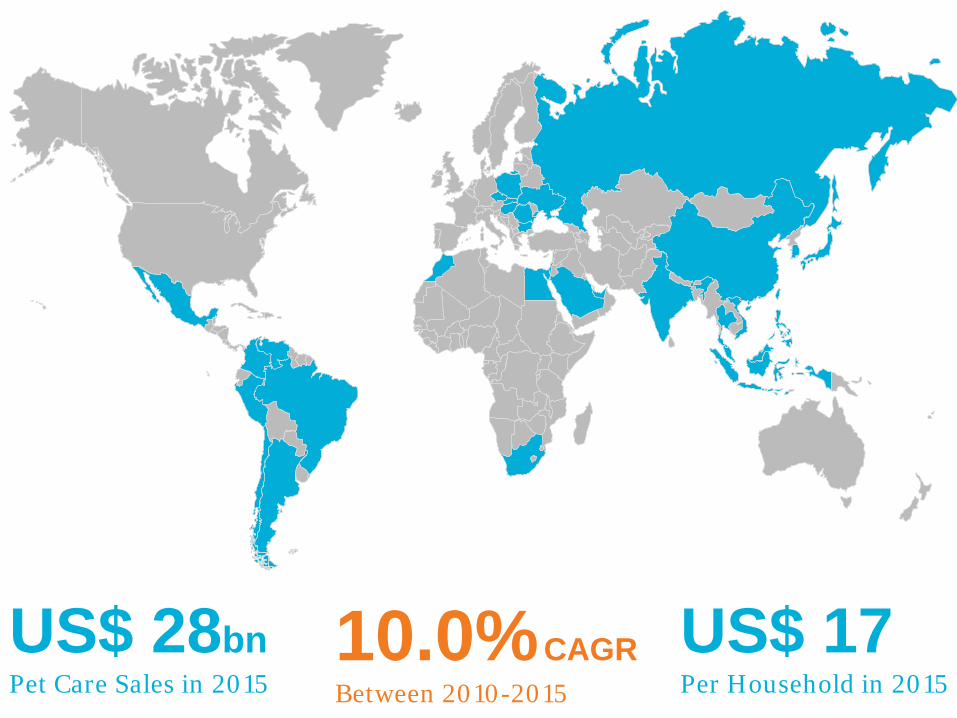
US$ 28bnPet Care Sales in 2015
US$ 17Per Household in 2015
10.0%CAGRBetween 2010-2015
© Euromonitor International
30
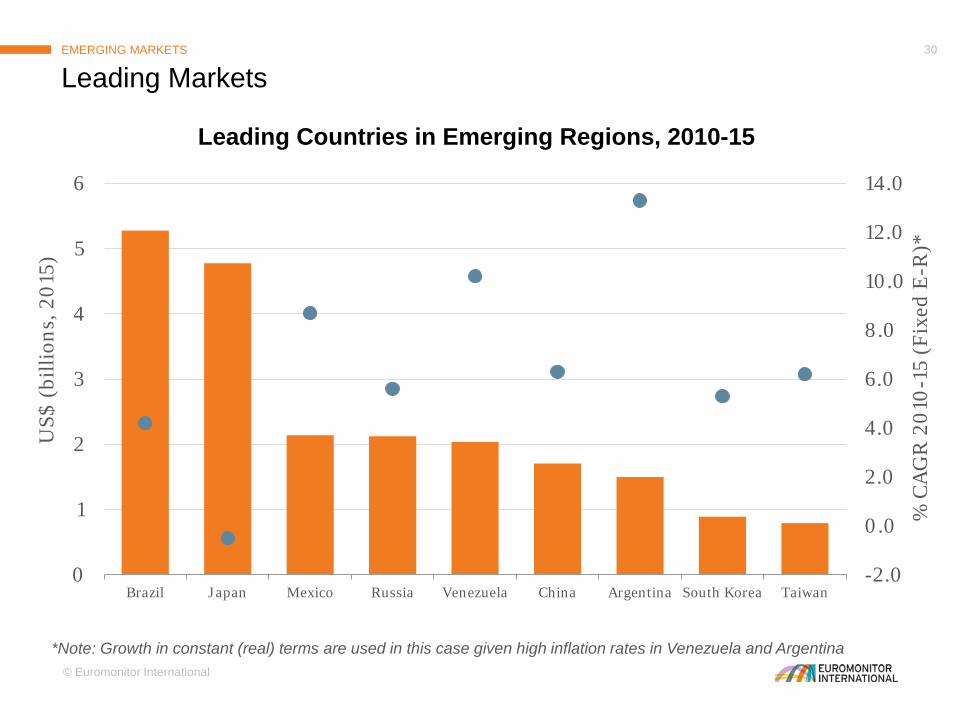
Leading MarketsEMERGING MARKETS
-2.0
0.0
2.0
4.0
6.0
8.0
10.0
12.0
14.0
0
1
2
3
4
5
6
Brazil Japan Mexico Russia Venezuela China Argentina South Korea Taiwan
% C
AG
R 2
010-
15 (F
ixed
E-R
)*
US$
(bill
ions
, 201
5)
Leading Countries in Emerging Regions, 2010-15
*Note: Growth in constant (real) terms are used in this case given high inflation rates in Venezuela and Argentina
© Euromonitor International
31
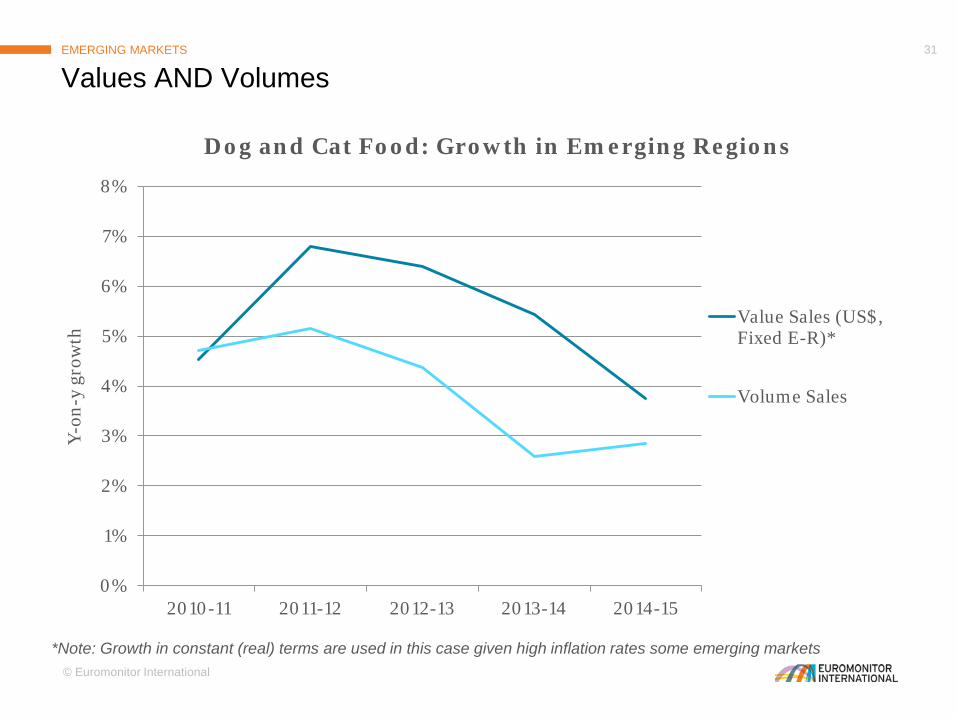
Values AND VolumesEMERGING MARKETS
0%
1%
2%
3%
4%
5%
6%
7%
8%
2010-11 2011-12 2012-13 2013-14 2014-15
Y-on
-y g
row
th
Dog and Cat Food: Growth in Emerging Regions
Value Sales (US$,Fixed E-R)*
Volume Sales
*Note: Growth in constant (real) terms are used in this case given high inflation rates some emerging markets

© Euromonitor International
32
0
50
100
150
200
250
300
350
400
2010 2011 2012 2013 2014 2015
Popu
lati
on (i
n m
illio
ns)
Emerging Regions: Dog and Cat Population, 2010-15
Middle East/Africa
Eastern Europe
Asia Pacific
Latin America
A Totally Different Trend in Pet PopulationsEMERGING MARKETS
3.0%CAGRBetween 2010-2015
© Euromonitor International
33
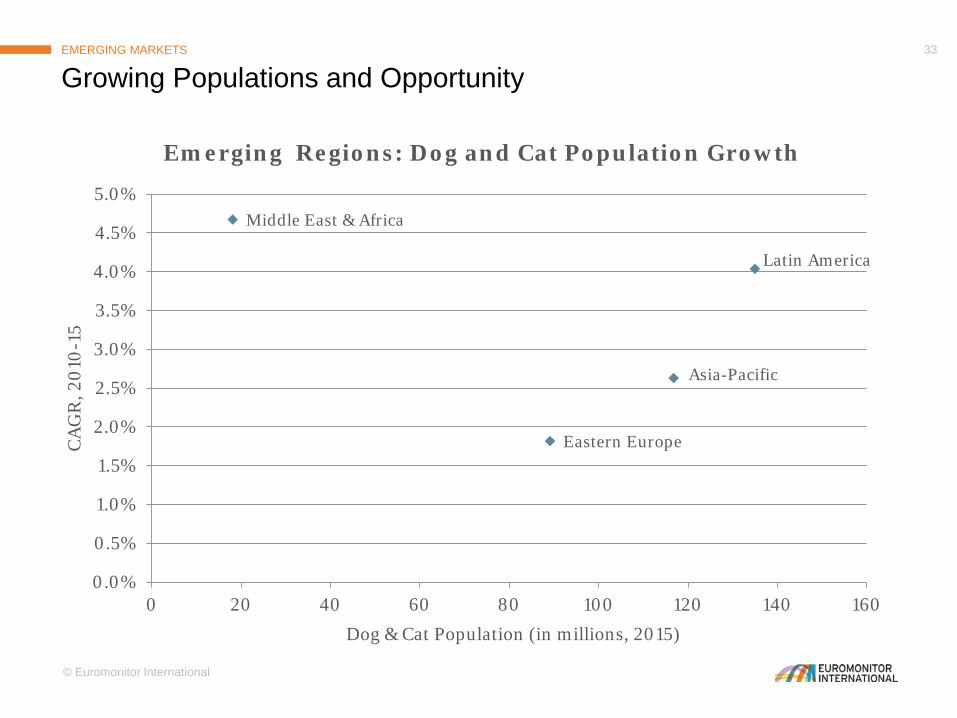
Asia-Pacific
Eastern Europe
Latin America
Middle East & Africa
0.0%
0.5%
1.0%
1.5%
2.0%
2.5%
3.0%
3.5%
4.0%
4.5%
5.0%
0 20 40 60 80 100 120 140 160
CA
GR
, 201
0-15
Dog & Cat Population (in millions, 2015)
Emerging Regions: Dog and Cat Population Growth
Growing Populations and OpportunityEMERGING MARKETS
© Euromonitor International
34
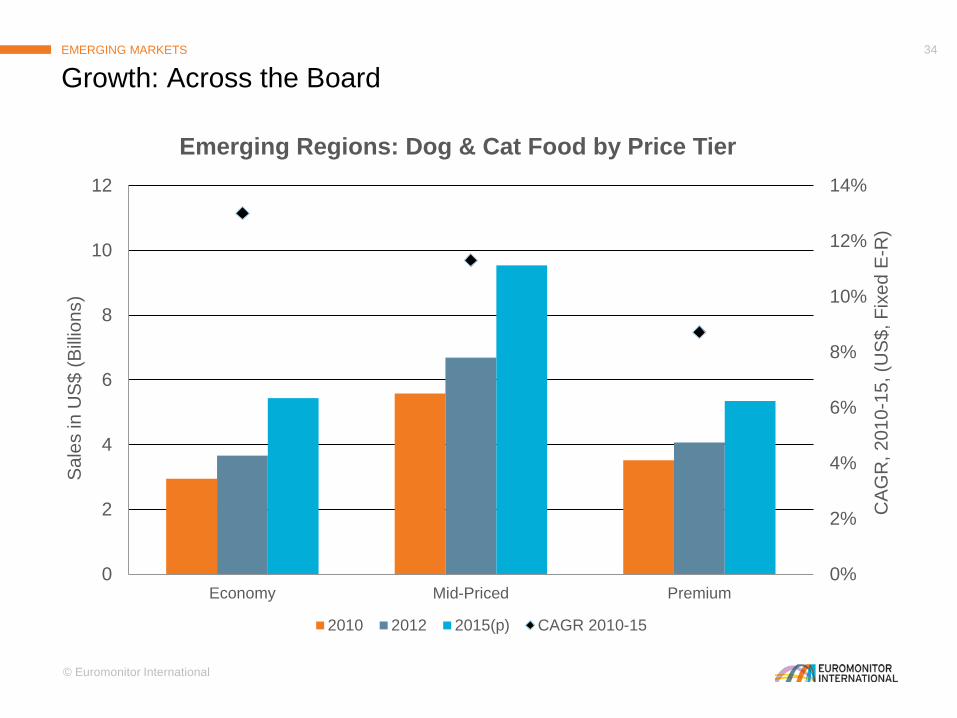
0%
2%
4%
6%
8%
10%
12%
14%
0
2
4
6
8
10
12
Economy Mid-Priced Premium
CAG
R, 2
010-
15, (
US$
, Fix
ed E
-R)
Sale
s in
US$
(Billi
ons)
Emerging Regions: Dog & Cat Food by Price Tier
2010 2012 2015(p) CAGR 2010-15
Growth: Across the BoardEMERGING MARKETS
© Euromonitor International
35
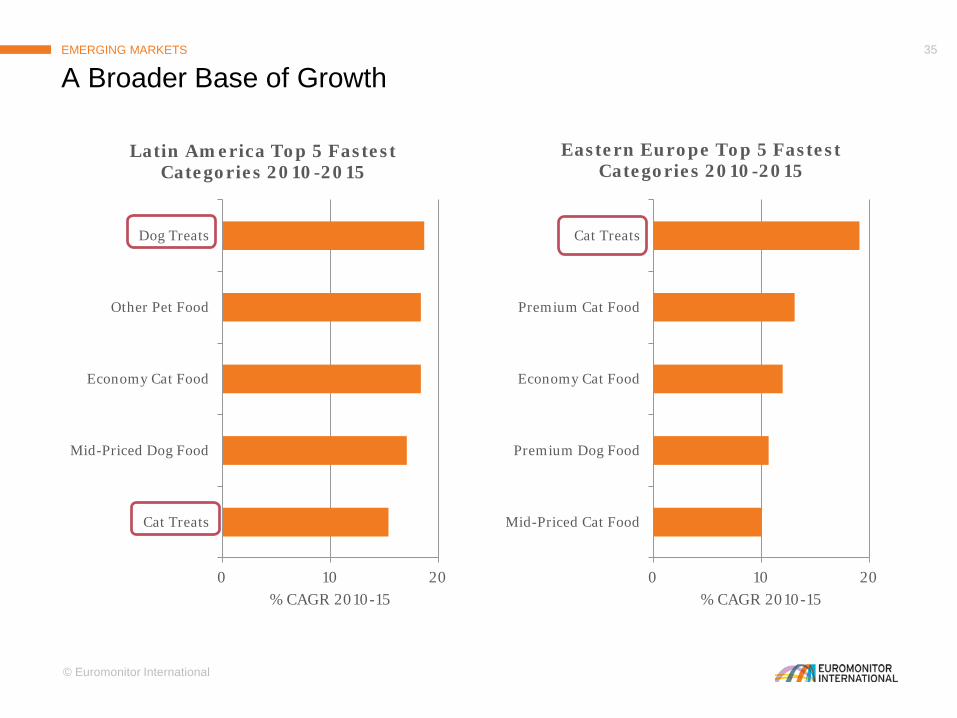
0 10 20
Cat Treats
Mid-Priced Dog Food
Economy Cat Food
Other Pet Food
Dog Treats
% CAGR 2010-15
Latin America Top 5 Fastest Categories 2010-2015
A Broader Base of GrowthEMERGING MARKETS
0 10 20
Mid-Priced Cat Food
Premium Dog Food
Economy Cat Food
Premium Cat Food
Cat Treats
% CAGR 2010-15
Eastern Europe Top 5 Fastest Categories 2010-2015

© Euromonitor International
36
0 10 20
Mid-Priced Cat Food
Pet Products
Premium Cat Food
Economy Dog Food
Cat Treats
% CAGR 2010-15
Asia-Pacific Top 5 Fastest Categories 2010-2015
A Broader Base of GrowthEMERGING MARKETS
0 10 20
Dog Treats
Pet Products
Mid-Priced Cat Food
Premium Dog Food
Premium Cat Food
% CAGR 2010-15
Middle East & Africa Top 5 Fastest Categories 2010-2015
© Euromonitor International
37
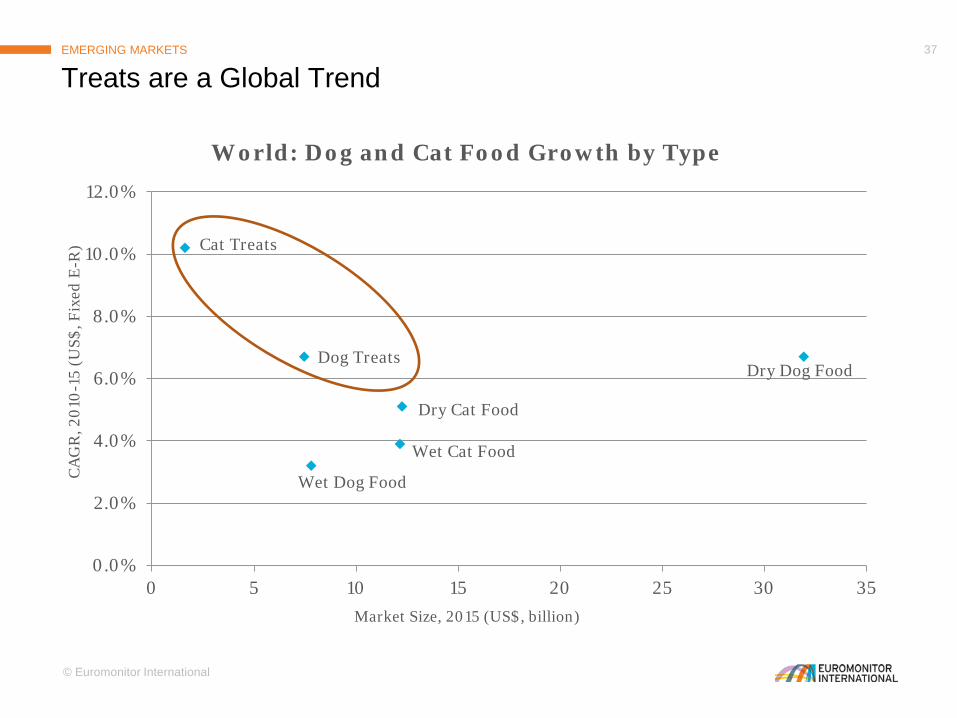
Treats are a Global TrendEMERGING MARKETS
Cat Treats
Dry Cat Food
Wet Cat Food
Dog TreatsDry Dog Food
Wet Dog Food
0.0%
2.0%
4.0%
6.0%
8.0%
10.0%
12.0%
0 5 10 15 20 25 30 35
CA
GR
, 201
0-15
(U
S$, F
ixed
E-R
)
Market Size, 2015 (US$, billion)
World: Dog and Cat Food Growth by Type

© Euromonitor International
38
Purina Dog Chow Abrazzos Integral Snaps by Nestlé Dog TreatsMexico, 2014
Made with whole wheat flour
Baked – reduced fat content
Fortified with essential vitamins and minerals
The Treat Boom Comes to Emerging RegionsEMERGING MARKETS
NoviPet Magic Treats by BioPet LtdDog TreatsSingapore, 2015
Fortified with DHA, Omega 6 and Multivitamins, Omega 3, Prebiotics or Glucosamine
Grain-free treats, no sugar
Available in blister and strip packs to maximize freshness
© Euromonitor International
39
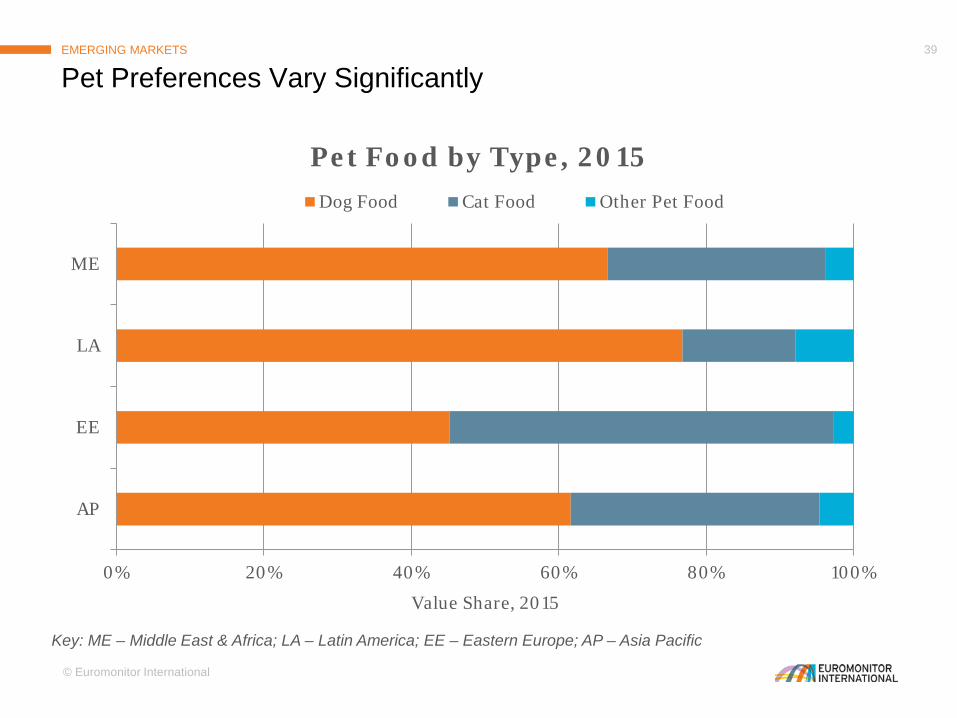
0% 20% 40% 60% 80% 100%
AP
EE
LA
ME
Value Share, 2015
Pet Food by Type, 2015Dog Food Cat Food Other Pet Food
Pet Preferences Vary SignificantlyEMERGING MARKETS
Key: ME – Middle East & Africa; LA – Latin America; EE – Eastern Europe; AP – Asia Pacific

© Euromonitor International
40
43.9
30.2
25.3
30.2
5.8
6.8
3.9
3.9
21.1 29.0
0%
10%
20%
30%
40%
50%
60%
70%
80%
90%
100%
Developed Regions Emerging Regions
Val
ue S
hare
, 201
5 (%
)
Dog & Cat Food by Channel, 2015
Others
Internet Retailing
Veterinary Clinics
Pet Shops & Superstores
Supermarket & Hypermarkets
Modern Grocery vs SpecialistsEMERGING MARKETS

© Euromonitor International
41
A Highly Fragmented ChannelEMERGING MARKETS
29,126 outlets
#1 global rank
55 m2/outlet
0% 20% 40% 60% 80% 100%
Developed
Emerging
Relative Value Share, 2015
Dog & Cat Food: Pet Shops vs SuperstoresPet Shops Pet Superstores
12,367 outlets
#2 global rank
84 m2/outlet
9,238 outlets
#3 global rank
666 m2/outlet

© Euromonitor International
42
The Potential for E-Commerce in Pet CareEMERGING MARKETS
US$839.6 bnInternet sales in 2014
169%Growth since 2009
5.8%Share total retail sales
© Euromonitor International
43
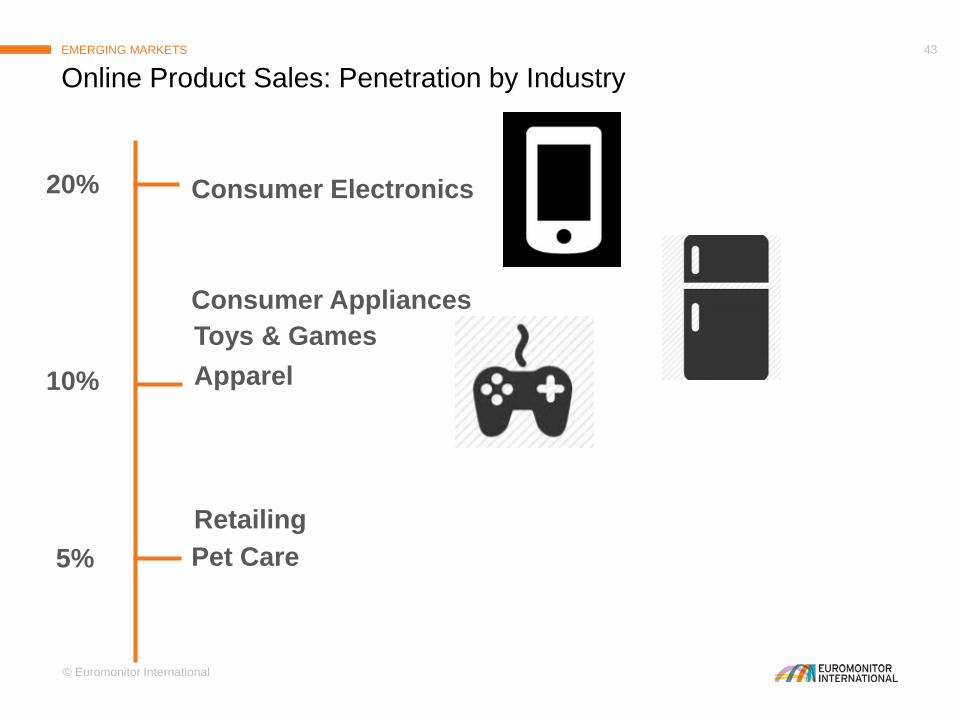
Online Product Sales: Penetration by IndustryEMERGING MARKETS
20%
10%
5%
Toys & Games
Consumer Electronics
Consumer Appliances
Apparel
RetailingPet Care
© Euromonitor International
44
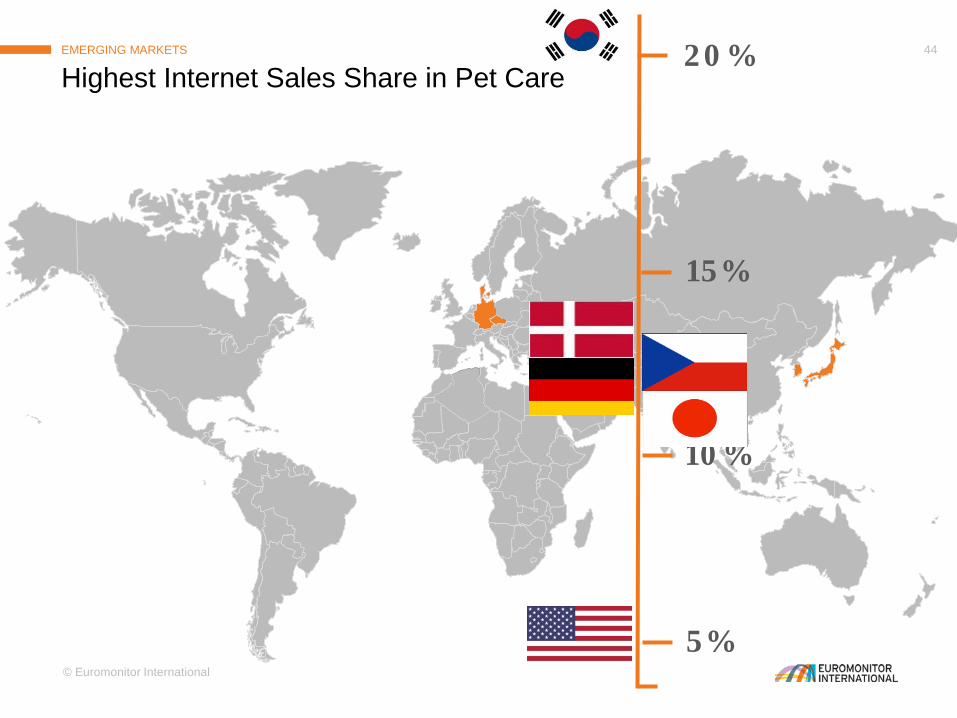
Highest Internet Sales Share in Pet CareEMERGING MARKETS
15%
10%
5%
20%

GLOBAL OVERVIEW
DEVELOPED REGIONS
EMERGING REGIONS
THE FUTURE
© Euromonitor International
46
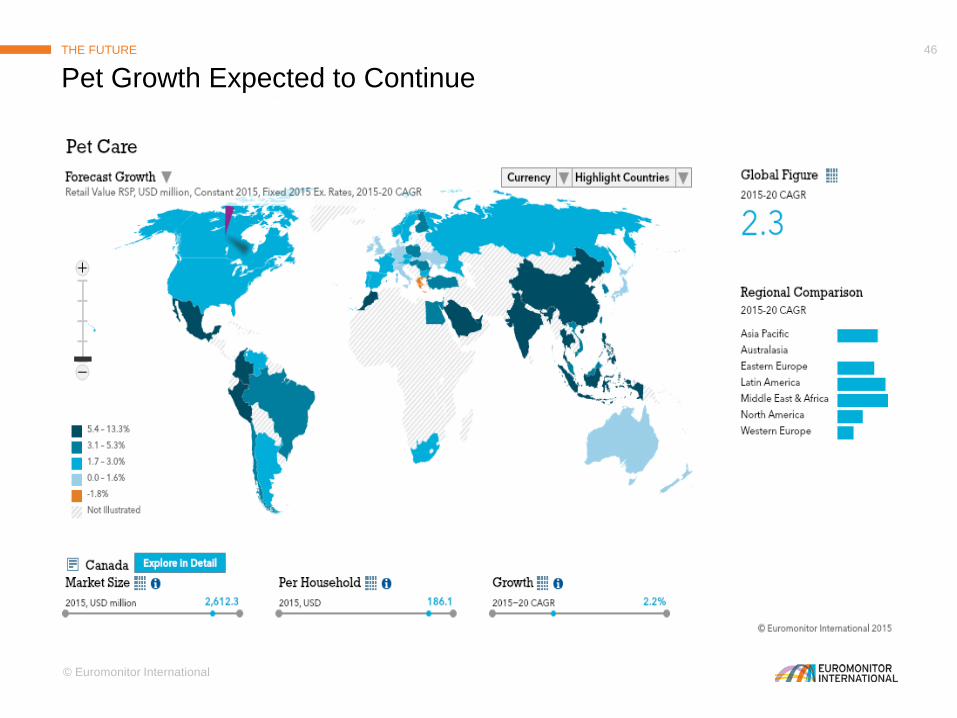
Pet Growth Expected to ContinueTHE FUTURE

© Euromonitor International
47
Cat Food 2010
AP EE LA Others
Cat Food by RegionTHE FUTURE AHEAD
Cat Food 2020
AP EE LA others

© Euromonitor International
48
Dog Food 2010
AP EE LA Others
Dog Food by RegionTHE FUTURE AHEAD
Dog Food 2020
AP EE LA Others
© Euromonitor International
49
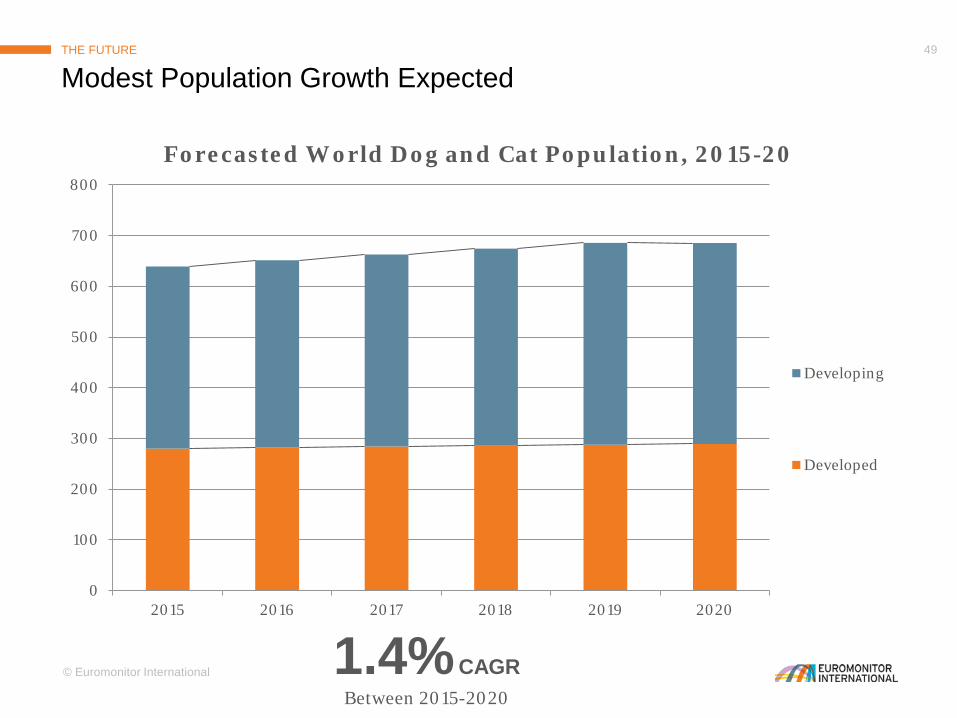
0
100
200
300
400
500
600
700
800
2015 2016 2017 2018 2019 2020
Forecasted World Dog and Cat Population, 2015-20
Developing
Developed
Modest Population Growth ExpectedTHE FUTURE
1.4%CAGRBetween 2015-2020

© Euromonitor International
50
Growth to also Stem from Premium FoodsMARKET PERFORMANCE
0%
20%
40%
60%
80%
100%
2015 2016 2017 2018 2019 2020
% r
etai
l val
ue
Global Dog and Cat Food by Price Platform
Economy Mid-priced Premium
© Euromonitor International
51
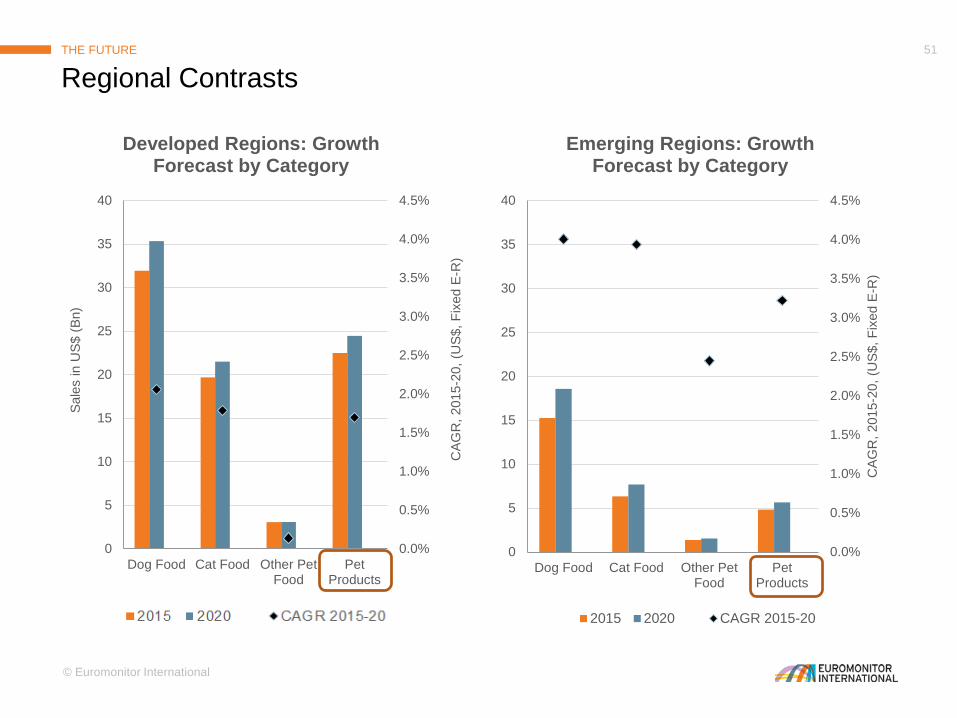
Regional ContrastsTHE FUTURE
0.0%
0.5%
1.0%
1.5%
2.0%
2.5%
3.0%
3.5%
4.0%
4.5%
0
5
10
15
20
25
30
35
40
Dog Food Cat Food Other PetFood
PetProducts
CAG
R, 2
015-
20, (
US$
, Fix
ed E
-R)
Emerging Regions: Growth Forecast by Category
2015 2020 CAGR 2015-20
0.0%
0.5%
1.0%
1.5%
2.0%
2.5%
3.0%
3.5%
4.0%
4.5%
0
5
10
15
20
25
30
35
40
Dog Food Cat Food Other PetFood
PetProducts
CAG
R, 2
015-
20, (
US$
, Fix
ed E
-R)
Sale
s in
US$
(Bn)
Developed Regions: Growth Forecast by Category
2015 2020 CAGR 2015-20
© Euromonitor International
52
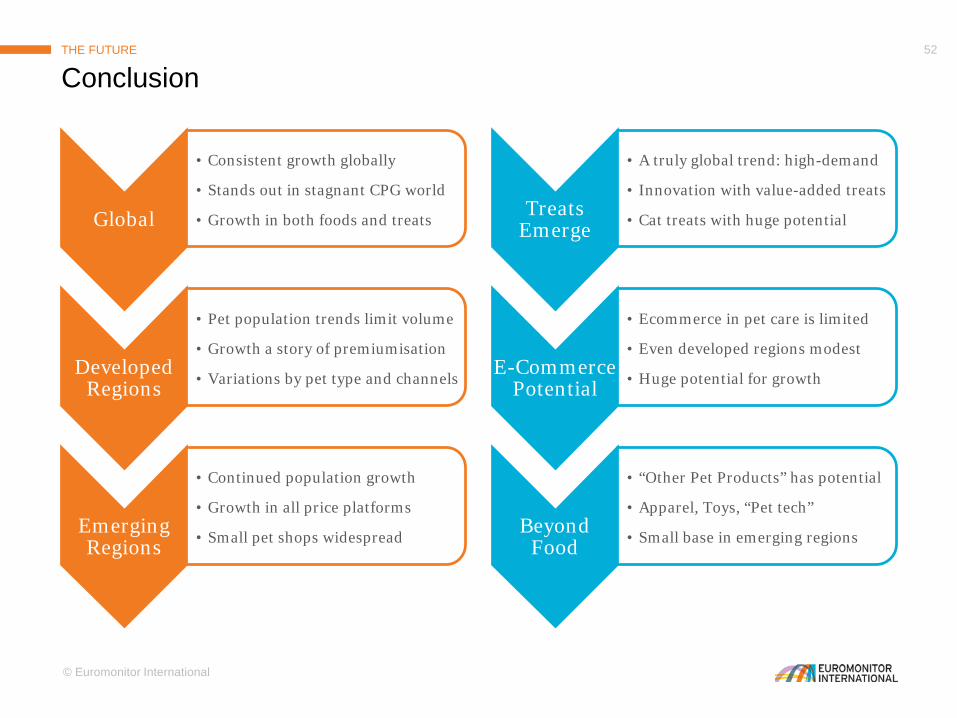
Global
• Consistent growth globally
• Stands out in stagnant CPG world
• Growth in both foods and treats
Developed Regions
• Pet population trends limit volume
• Growth a story of premiumisation
• Variations by pet type and channels
Emerging Regions
• Continued population growth
• Growth in all price platforms
• Small pet shops widespread
Treats Emerge
• A truly global trend: high-demand
• Innovation with value-added treats
• Cat treats with huge potential
E-Commerce Potential
• Ecommerce in pet care is limited
• Even developed regions modest
• Huge potential for growth
Beyond Food
• “Other Pet Products” has potential
• Apparel, Toys, “Pet tech”
• Small base in emerging regions
ConclusionTHE FUTURE

© Euromonitor International
53
THANK YOU FOR LISTENINGJared Koerten
Senior Analyst
Euromonitor Chicago224 S. Michigan Ave, 15th flChicago, IL 60604