The State of Manufacturing Challenges and Opportunities Executive Summary Pennsylvania’s True Commonwealth Commissioned by Pennsylvania’s Industrial Resource Centers (IRCs) Research Team Led by Dr. Edward W. (Ned) Hill, Dean of the Maxine Goodman Levin College of Urban Affairs, Cleveland State University.
Transcript
The State of Manufacturing
Challenges and Opportunities
Executive Summary
Pennsylvania’s True Commonwealth
Commissioned by
Pennsylvania’s Industrial Resource Centers (IRCs)
Research Team Led by Dr. Edward W. (Ned) Hill, Dean of the Maxine Goodman Levin College of Urban Affairs, Cleveland State University.
Pennsylvania’s True Commonwealth: The State of Manufacturing – Challenges and Opportunities Executive Summary: Page 1 of 20
Pennsylvania's True Commonwealth: The State of Manufacturing − Challenges and Opportunities
Pennsylvania is a Commonwealth, one of only four of the nation's states that has
deliberately maintained the traditional English term. This distinction is more than a question for
an elementary school social studies test or a trivia contest. In an era of shrinking government
budgets and declining revenues, it is more than a trifling pursuit to consider what is sufficient
and necessary to support the "common well-being." The question for such difficult economic
times is how best to identify, support and nurture activities that are critical to the Commonwealth
and the common good of its citizens.
Without a doubt, one of those critical areas is manufacturing. Manufacturing continues to
be one of Pennsylvania‟s important wealth generators. Although popular opinion seems to have
dismissed manufacturing as a relic of a different era and a different economic structure,
Pennsylvania's manufacturers continue to take seriously their role as wealth generators for the
state and nation. The facts support their claim: Manufacturing is Pennsylvania's largest source
of Gross State Product (GSP) and its fourth-largest employment sector. In 2009, Pennsylvania
was the sixth-largest manufacturing state in the nation in terms of GSP. Manufacturing remains
a key part of Pennsylvania's innovation infrastructure and is present in all parts of the state,
from city to suburb to rural county. Manufacturing productivity − measured as GSP per
employee − was more than $27,000 higher in 2008 than productivity measured among non-
manufacturing industries.
An essential measure of importance or centrality to an economy is the size of an
industry‟s multipliers − meaning, the additional jobs, sales, or income generated from sales in
the industry. Manufacturing has the highest multipliers of any other Pennsylvania industry.
Every $1 increase in final demand for products manufactured in Pennsylvania leads to a
total increase in gross value added by all industries of $2.52. No other industry in the state
comes close to rivaling the impact of manufacturing:
A $1 million increase in final demand for manufactured products in Pennsylvania results in the creation of 4.2 jobs; 2.9 jobs directly and indirectly in manufacturing and an additional 1.3 jobs through the spending of employees of the manufacturers and the employees in their supply chain;
Manufacturing's labor income multiplier effect of $3.60 is more than double that of most other Pennsylvania industry sectors. Agriculture is the state's only other industry with a labor income multiplier above $2. Manufacturing‟s multiplier is so extraordinarily high because of the length of its supply chain, which is reflected in its indirect income multiplier of $1.74.
Yet, there is also no doubt that the past decade has been a challenging time for
Pennsylvania's manufacturers. News accounts that chronicle job losses and plant closings have
been correct in the details − even if they have failed to convey the industry's ongoing
Pennsylvania’s True Commonwealth: The State of Manufacturing – Challenges and Opportunities Executive Summary: Page 2 of 20
importance. The reality is that the weakness in Pennsylvania‟s manufacturing sector could have
been even worse if not for critical state support in helping companies transition to more
advanced manufacturing products and processes.
Pennsylvania's seven Industrial Resource Centers (IRCs) have leveraged this state
support and targeted resources toward the specific needs of the regions they serve. The IRCs
were created in 1988 as a response to the declining steel industry and as a conduit for the
needed industrial transformation that became apparent in light of the double-dip recession of
1980 to 1982. Since their inception, the IRCs have remained true to their mission of helping
small and midsized manufacturing companies adapt and prosper in the face of ever-quickening
economic change. The public has received demonstrable benefit from the IRCs' focus on
manufacturers: Companies that received IRC services are estimated to have paid an additional
$31 million in state and local taxes in 2009 due to increased sales alone.
The Effects of a Bubble and Currency Pennsylvania is currently in the early stages of a slow recovery from the deepest
recession it has experienced since the double dip of the early 1980s. This latest economic crisis
has become known as the Great Recession because of its length and depth. For Pennsylvania,
there is a key difference between the double dip of the '80s and the recent Great Recession.
The recession of the 1980s triggered a major restructuring of the state‟s traditional economic
base. That recession was an economic heart attack for Pennsylvania and the rest of the
industrial Northeast and Midwest. The rest of the nation experienced a deep generalized
recession as the Federal Reserve acted to break the back of wage-price inflation and, in so
doing, triggered a major recession. In contrast, the triggers of the Great Recession did not lie in
the immediate structure of Pennsylvania‟s economy. They were located in other regional
economies in the nation and in the global financial markets. This is a critical difference and
demands different policy responses and approaches.
An enormous housing price bubble and a combination of fraud and poor regulation in the
international securities markets were the immediate triggers of the Great Recession, and major
restructuring is being experienced in those parts of the region, and globe, that had overheated
housing markets. A second source of macroeconomic tension in the decade leading up to the
current recession was the structural deficit of the U.S. federal government and the international
trade distortions associated with a grossly undervalued Chinese currency. The tie to
Pennsylvania for both triggers is indirect, but important. The housing bubble and consumers‟
ability to withdraw equity from their houses (or to withdraw their transitory speculative gains) fed
a massive boom in domestic consumption. Where were those goods produced?
U.S. and Pennsylvania‟s manufacturers had to compete against the “China Price.” The
Chinese currency was massively undervalued and manipulated. Not allowing it to float in
response to trade surpluses on the Chinese side and large deficits for the United States resulted
in production advantages for China that were not warranted by economic conditions. If China‟s
currency had been allowed to float, U.S. corporations would still have been investing in China −
Pennsylvania’s True Commonwealth: The State of Manufacturing – Challenges and Opportunities Executive Summary: Page 3 of 20
it is a rapidly growing market, after all − but the decline in U.S. manufacturing Gross Product
and employment would not have been as deep.
The combined impacts of the 2001 and 2008 recessions on manufacturing in
Pennsylvania, and the nation as a whole, are apparent in many of the figures and tables
presented in this report. So is the impact of an undervalued Chinese currency. Some economic
commentators blithely dismiss the Chinese currency problem as an indirect subsidy to American
consumption and, therefore, a beneficial transfer of wealth from China to the United States.
There is a problem with this logic in a continent-wide common market, which is what the U.S.
economy is. Goods-producing, or manufacturing, states, such as Pennsylvania, do not have
their own currencies. They cannot devalue their currency to lower their production costs.
Instead, plants close and production moves to offshore competitors.
Yes, U.S. consumers have enjoyed a boost in their ability to consume, especially those
in states and regions that produce services or that experienced the bubble in housing prices and
with it phantom wealth. But, in a global economy where one major producer manipulates its
currency, there is a long-term cost. The manufacturing base becomes hollowed out over time.
This is a threat to overall economic well-being because, when market forces eventually
overcome the artificial relative value of China‟s currency, the U.S. manufacturing base will not
be in place to respond. And, contrary to expectations of those who look no further than the
smooth, quick operation of the theoretical economists‟ invisible hand, manufacturing capacity,
supply chain, knowledge and products will not be sitting patiently on a shelf somewhere to be
rapidly redeployed. The path to prosperity will have been permanently altered, and the
manufacturing commons will need to be recreated.
How Pennsylvania’s Best Manufacturers Are Competing While many may agree with this macroeconomic lament over the hollowing out of
America‟s manufacturing core, what does this have to do with public policy in Pennsylvania
today? There are two implications. The first is immediate. Our research and conversations with
Pennsylvania‟s manufacturers show a clear ability to compete against the punishing headwinds
of currency manipulation when firms engage in enterprise transformation. Such transformation:
Is built on the foundation of a strong objective strategic plan;
Is followed by the systematic elimination of waste in the production process,
improving quality, and shortening the time it takes to get product to market (these
actions are frequently put under the label of what is known as lean manufacturing
techniques);
Measures what is important and establishes a culture of continuous improvement;
Empowers the core workforce and frees senior management to work on the
business;
Engages in product development in a niche market, coupled with an effective sales
and marketing strategy.
This is a recipe that is easy to recite, challenging to implement and hard to stick with unless it is a core part of a company‟s operations. We have witnessed that the best-of-the-best manufacturers in Pennsylvania can structure their operations to contain cost structures that
Pennsylvania’s True Commonwealth: The State of Manufacturing – Challenges and Opportunities Executive Summary: Page 4 of 20
reside in the middle of their income statements, while allowing company leadership the time and resources to implement strategies to grow the top line. To succeed, manufacturers today cannot just focus on cost containment or on growth; the imperative is to do both. "If you‟re not doing lean, if you‟re not doing some sort of continuous improvement, I don‟t know how you‟re still around,” said an Erie-area manufacturer. It is evident from discussions with the leaders of some of Pennsylvania‟s best manufacturing firms that lean manufacturing and other production process improvement techniques do not cost jobs; they save companies. With those saved companies come saved jobs.
The words of Pennsylvania‟s manufacturing leaders speak most eloquently on this
point:
“You have to simplify your business, eliminate stuff that doesn‟t make you money,”
said one focus group participant. “We make it really easy to decide what business to
go after and what we don‟t. Lean is part of that. Every employee has gone through
lean training."
“We train people that this is the way things are done. Lean is core to the culture,” a
Bethlehem focus group participant said. “In order to stay ahead of the competition,
this is what we do. We just don‟t say „no‟ unless physically it isn‟t possible. That
message has to get down right to that employee level about the importance of why
we do things.”
“Operational excellence is something you have to embrace,” said a manufacturer in
the Wilkes-Barre area. “We run a lot of continuous improvement programs. We don‟t
have one silver bullet.”
In our discussions with the best manufacturers in Pennsylvania, this recipe is most
effective when the secret sauce is applied: full disclosure of operating financials and
performance metrics to the corporate team, which is then reinforced with meaningful gain-
sharing on a monthly or quarterly basis with employees. This systematic approach to enterprise
transformation among Pennsylvania‟s small and midsized manufacturers is not taught in any
business school. However, this knowledge resides in affordable form in the state‟s IRCs. The
IRCs function as applied graduate business schools, engaged not only in enterprise
transformation, but also in a slow, grinding battle to remake the state‟s manufacturing base.
Transferring knowledge of how the largest and most important contributor to Pennsylvania‟s
wealth and prosperity can transform itself is the IRCs' mission. The IRCs have a stewardship
responsibility not only to enhance that manufacturing knowledge base, but also to disseminate
that knowledge.
Pennsylvania’s True Commonwealth: The State of Manufacturing – Challenges and Opportunities Executive Summary: Page 5 of 20
Over the longer term, the competitive
position of America‟s manufacturers will improve
when the value of the U.S. currency drops,
which is inevitable. The speed of the snap-back
will be dictated either by the speed at which
widespread enterprise transformation takes
place or the speed at which new firms fill gaps
created by the death of old ones. The social
and economic cost triggered by firm deaths
greatly exceeds the cost of enterprise
transformation. Here again, the IRC program is
positioned to accelerate positive and necessary
transition.
Despite the pressure of almost a decade
of intense global economic competition, many of
Pennsylvania's manufacturing companies have
adapted, survived and laid the foundation for a
robust revival, frequently aided and advised by
their regional IRC. “The only sustainable
competitive advantage any company today has
is the ability to learn faster,” a Bethlehem-area
manufacturer noted during a focus group.
“Eventually you will be copied. So the only
sustainable advantage is your ability to learn.”
Manufacturing − A Vital Part of Pennsylvania’s Economy The data are clear: Manufacturing is the
largest sector of Pennsylvania‟s economy.
Despite the news reports and political comments
that declare its demise, manufacturing continues
to fuel Pennsylvania‟s economic engine. As can
be seen in the following two tables,
manufacturing accounts for the largest
contribution and share of Pennsylvania‟s GSP. It
held onto the top spot throughout the decade
analyzed. However, the dramatically declining
share – falling from 18.8 percent of GSP to 13.6
percent by 2008 – demonstrates the urgent
need for reassessing Pennsylvania‟s
manufacturing environment and suggesting
strategies for shoring up this vital segment of
What Counts As Manufacturing? There is a difference between the way manufacturing is defined in economic statistics and what most of us think of as a manufacturing company. In terms of the North American Industrial Classification System (NAICS), manufacturing covers industry codes 31-33. The economic statistics will count a business establishment as a manufacturing plant as long as more than half of the value added at that location comes from physical manufacturing production. There are multi-establishment firms in which the headquarters is in one location, research and product development in another, and production in a third. In that case, the company’s economic impact will appear in three different industry classifications: Management of Companies and Enterprises; Professional, Scientific, and Technical Services; and Manufacturing. Alternatively, a single-establishment company, where all business functions take place at a single address, will be assigned to the NAICS code that accounts for the largest portion of value added. If production accounts for the most value added, then the company will be classified as a manufacturer; if management provides the most value added, then the classification will be Management of Companies or Enterprises. To the statistics keepers, Nike is not a manufacturer; its establishments fall into management, research, and wholesale footwear. Apple is not an electronics manufacturer; its establishments are listed in management, research, information, wholesale electronics, and retail electronics.
Pennsylvania’s True Commonwealth: The State of Manufacturing – Challenges and Opportunities Executive Summary: Page 6 of 20
economic infrastructure. The heavy toll of the 2001 recession manifested in a nearly 3
percentage point contraction in GSP in manufacturing in the five years from 1998 to 2003.
Global competition and commoditization continued to erode Pennsylvania‟s manufacturing base
throughout the first decade of the 21st century. Despite this decade of stress, the sector
generates more than $60 billion in GSP.
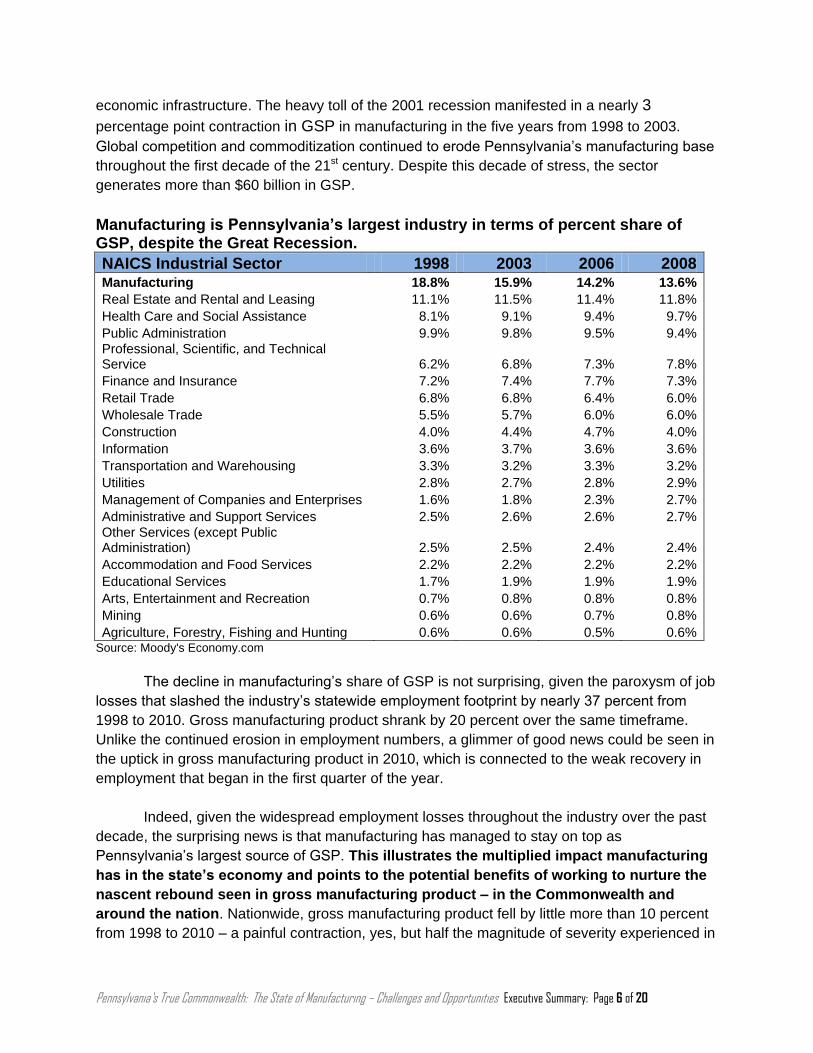
Manufacturing is Pennsylvania’s largest industry in terms of percent share of GSP, despite the Great Recession.
The decline in manufacturing‟s share of GSP is not surprising, given the paroxysm of job
losses that slashed the industry‟s statewide employment footprint by nearly 37 percent from
1998 to 2010. Gross manufacturing product shrank by 20 percent over the same timeframe.
Unlike the continued erosion in employment numbers, a glimmer of good news could be seen in
the uptick in gross manufacturing product in 2010, which is connected to the weak recovery in
employment that began in the first quarter of the year.
Indeed, given the widespread employment losses throughout the industry over the past
decade, the surprising news is that manufacturing has managed to stay on top as
Pennsylvania‟s largest source of GSP. This illustrates the multiplied impact manufacturing
has in the state’s economy and points to the potential benefits of working to nurture the
nascent rebound seen in gross manufacturing product – in the Commonwealth and
around the nation. Nationwide, gross manufacturing product fell by little more than 10 percent
from 1998 to 2010 – a painful contraction, yes, but half the magnitude of severity experienced in
Pennsylvania’s True Commonwealth: The State of Manufacturing – Challenges and Opportunities Executive Summary: Page 7 of 20
Pennsylvania. In terms of manufacturing employment, the distress was more equally shared,
with the nation as a whole seeing a 34 percent decrease in jobs.
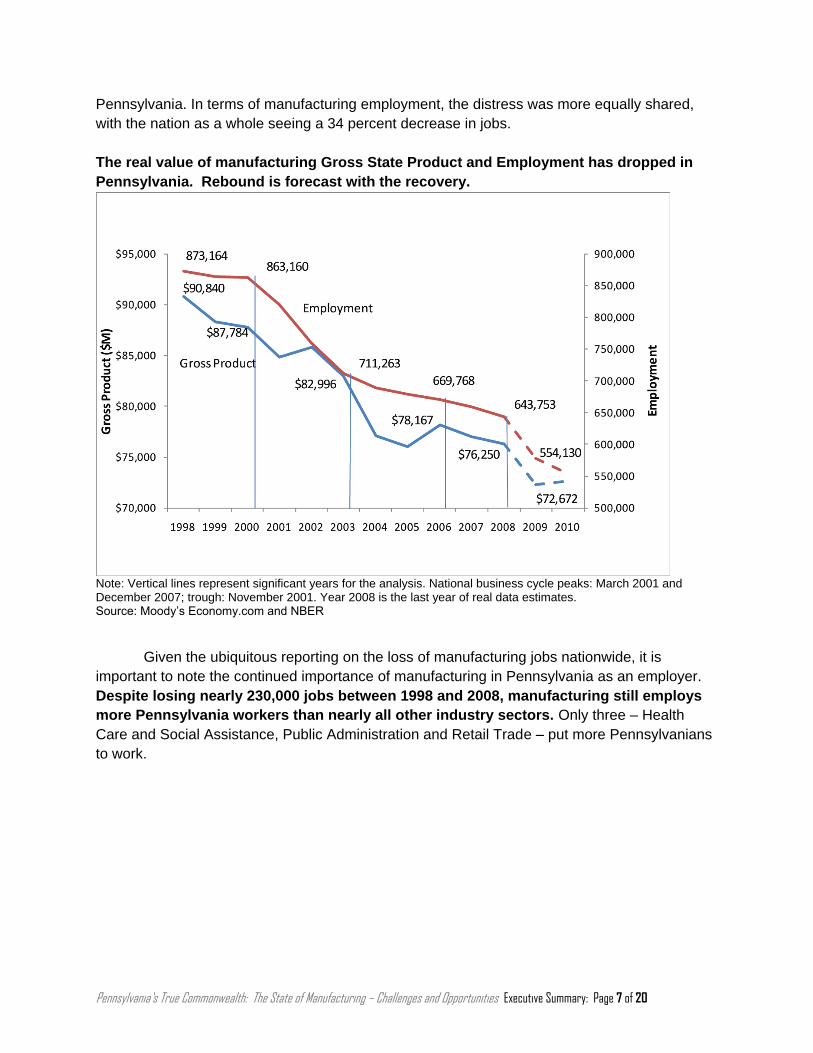
The real value of manufacturing Gross State Product and Employment has dropped in
Pennsylvania. Rebound is forecast with the recovery.
Note: Vertical lines represent significant years for the analysis. National business cycle peaks: March 2001 and December 2007; trough: November 2001. Year 2008 is the last year of real data estimates. Source: Moody‟s Economy.com and NBER
Given the ubiquitous reporting on the loss of manufacturing jobs nationwide, it is
important to note the continued importance of manufacturing in Pennsylvania as an employer.
Despite losing nearly 230,000 jobs between 1998 and 2008, manufacturing still employs
more Pennsylvania workers than nearly all other industry sectors. Only three – Health
Care and Social Assistance, Public Administration and Retail Trade – put more Pennsylvanians
to work.
Pennsylvania’s True Commonwealth: The State of Manufacturing – Challenges and Opportunities Executive Summary: Page 8 of 20
Manufacturing was Pennsylvania’s fourth-largest employer in 2008.
Source: Moody‟s Economy.com
The massive job losses have led many political leaders and media pundits to write off
manufacturing. Many reportedly in-the-know analysts and policy makers have declared U.S.
manufacturing to be dead. Yet, manufacturers who have survived the difficult environment of the
past decade by retooling and repositioning say they are poised for growth. That positioning can,
and should, be enhanced with selective changes in public policy. These new policy
recommendations will be discussed later in this summary.
Manufacturing, Productivity, and Earnings Understanding productivity is key to understanding how economies develop. Earnings
cannot increase without increases in productivity to pay for the higher earnings. Productivity is
defined as value added per hour worked. In this report, productivity is measured as gross state
product per job. This approach was taken because state-level data on hours worked by industry
do not exist and GSP is similar to value added.
Most people associate productivity with how hard or smart people work, which is an
important contributing factor. However, productivity is also influenced by the level and types of
machinery, the cost of management and supervision, and, most importantly, by the margin the
product can earn. An example may help illustrate this meaning: If you go to a local lunch
counter, how much does a cup of coffee cost? Perhaps it costs a dollar. How much does the
same cup cost in a nationally branded coffee shop, such as Starbucks or Caribou? If you order
a standard cup of coffee, it is nearly double the cost at the local establishment, and the price
climbs as you customize the product. Who is the hardest worker? Is it the barista? Or is it the
person who takes the order, delivers the food, cleans up and keeps everyone in line? The
Pennsylvania’s True Commonwealth: The State of Manufacturing – Challenges and Opportunities Executive Summary: Page 9 of 20
lesson to be learned is that the real source of productivity lies with the product, the brand,
management and the production system. In other words, productivity lies with the margins
embedded in the product and in the customer‟s experience. As margins increase, so does value
added. The reason this is relevant is that, as margins erode and products become commodities,
productivity gains can only take place if companies work harder, smarter, or with more efficient
equipment. If companies don't, then productivity growth slows or reverses.
As products age, both in terms of location along the product cycle and in terms of the
chronological age of the product, competitors appear, prices are cut, margins erode, and
productivity declines. That is where margins play a key role in measured productivity. Margins
are only maintained by having a steady flow of innovation, which prevents the business‟s
product from becoming commoditized, and by having a strong brand.
The best of Pennsylvania‟s manufacturers fight commoditization each and every day and
understand that improving productivity is management‟s job through product innovation. Despite
the challenging environment, focus group participants spoke of opportunity. They are
developing new products, offering new services and creatively adding new value. Many spoke
of the need to focus on a niche market and learn to anticipate the needs of clients.
“The only way we‟re going to survive is to come up with new products,” said one
Philadelphia-area manufacturer.
“We‟re pretty versatile,” said a counterpart in the York area. “We‟re not afraid to try
things we‟ve never tried before. Our product mix has changed over the past five
years. That‟s probably why we‟re still around now − product flexibility.”
“Our approach is let‟s get close and then jump in with both feet and learn as we go,”
said an Erie-area focus group participant. “We have to leverage our strengths. … We
don‟t have to be perfect; we just have to be good enough to live to fight another day.”
“We have to be much more nimble, provide faster delivery, have lower prices. Quality
is a given,” said one York-area manufacturer.
“We look for „I need this but…‟ I love the „but‟ because that‟s where we can do
something. We‟re looking for volumes that are large enough that we can have some
impact but small enough that China is not going to be interested. … We‟re not sitting
around in a think tank, thinking what‟s the next best thing. We‟re looking at what we
can make better and make better for your application. We‟re telling [our sales]
representatives [to ask], „What can we do to solve your problem?‟ ”
“As we emerge from this, I think we will have a lot bigger piece of the pie. The
recession has cleaned out a lot of companies that were teetering on the edge,” said
a Williamsport-area manufacturer.
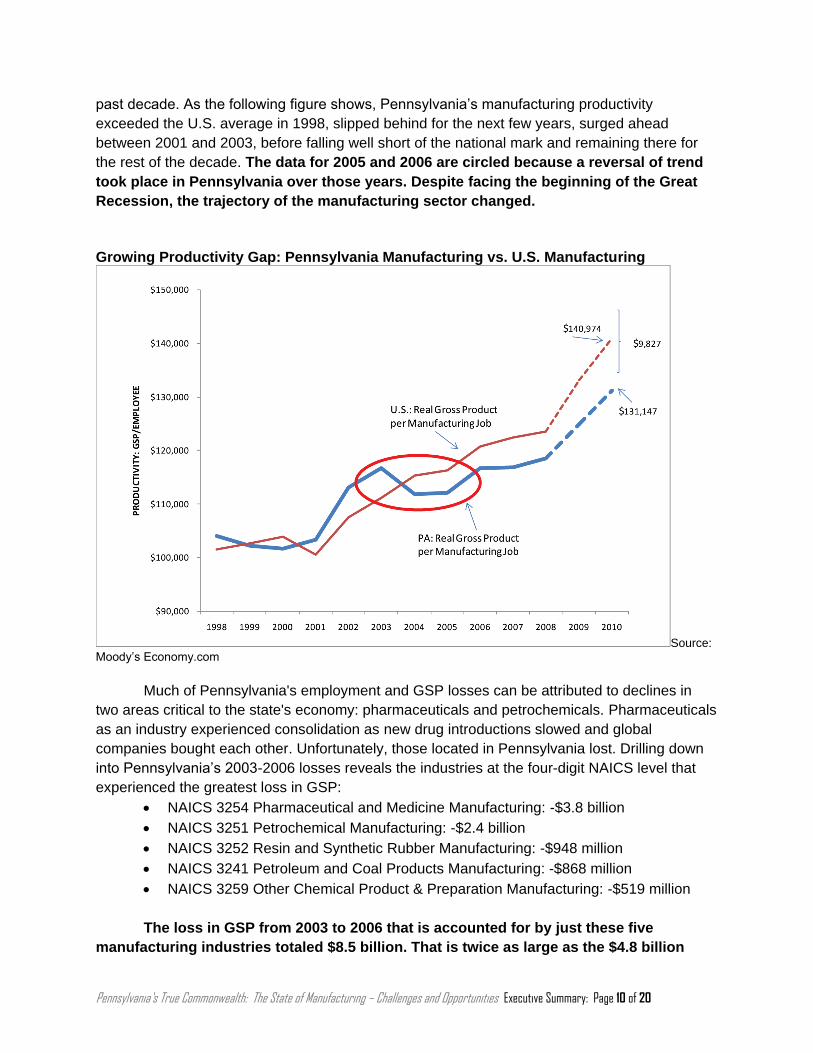
Pennsylvania manufacturers, who once were national leaders in productivity, have fallen
behind their counterparts in other areas of the country. Pennsylvania manufacturing productivity
lagged the national average by $5,098 per job in 2008. The gap for 2010 was projected to
nearly double to $9,827 per job. Underperformance has been the case throughout much of the
Pennsylvania’s True Commonwealth: The State of Manufacturing – Challenges and Opportunities Executive Summary: Page 10 of 20
past decade. As the following figure shows, Pennsylvania‟s manufacturing productivity
exceeded the U.S. average in 1998, slipped behind for the next few years, surged ahead
between 2001 and 2003, before falling well short of the national mark and remaining there for
the rest of the decade. The data for 2005 and 2006 are circled because a reversal of trend
took place in Pennsylvania over those years. Despite facing the beginning of the Great
Recession, the trajectory of the manufacturing sector changed.
Growing Productivity Gap: Pennsylvania Manufacturing vs. U.S. Manufacturing
Source: Moody‟s Economy.com
Much of Pennsylvania's employment and GSP losses can be attributed to declines in
two areas critical to the state's economy: pharmaceuticals and petrochemicals. Pharmaceuticals
as an industry experienced consolidation as new drug introductions slowed and global
companies bought each other. Unfortunately, those located in Pennsylvania lost. Drilling down
into Pennsylvania‟s 2003-2006 losses reveals the industries at the four-digit NAICS level that
experienced the greatest loss in GSP:
NAICS 3254 Pharmaceutical and Medicine Manufacturing: -$3.8 billion
NAICS 3252 Resin and Synthetic Rubber Manufacturing: -$948 million
NAICS 3241 Petroleum and Coal Products Manufacturing: -$868 million
NAICS 3259 Other Chemical Product & Preparation Manufacturing: -$519 million
The loss in GSP from 2003 to 2006 that is accounted for by just these five
manufacturing industries totaled $8.5 billion. That is twice as large as the $4.8 billion
Pennsylvania’s True Commonwealth: The State of Manufacturing – Challenges and Opportunities Executive Summary: Page 11 of 20
total drop in manufacturing GSP over the same time period. In terms of manufacturing
employment from 2003 to 2006, Pennsylvania‟s pharmaceutical and petrochemical industries
experienced some of the largest losses, but the textile sector also witnessed sharp cuts.
Despite the challenges displayed in the figures throughout this summary and report,
productivity in manufacturing dwarfs that in the non-manufacturing private sector. Manufacturing
is key to the level of productivity in the state, as the following figure shows. Gross product per
employee in 2008 was more than $27,000 higher for Pennsylvania manufacturers than for non-
manufacturers. The gap was projected to widen through 2010 to $33,925. This gap may be
explained by improved capital and managerial practices among manufacturers. However, it
reinforces the need for strategies to support Pennsylvania‟s critical manufacturing sector and to
fight commoditization.
Pennsylvania Manufacturing vs. Non-manufacturing Productivity
Source: Moody‟s Economy.com
The Geography of Pennsylvania’s Manufacturing As was discussed earlier, manufacturing contributed 13.6 percent to Pennsylvania‟s
GSP and accounted for 10.9 percent of the state‟s total employment in 2008, putting to work
more than a half million people. What may be less appreciated is the effect the manufacturing
sector has in all of Pennsylvania‟s counties. While important to the entire state – manufacturing
is of particular importance to rural Pennsylvania.
Pennsylvania’s True Commonwealth: The State of Manufacturing – Challenges and Opportunities Executive Summary: Page 12 of 20
In Pennsylvania‟s central counties − those counties where one of the state‟s central
cities is located and where greater population and business densities exist − manufacturing
contributed 11.4 percent of GSP and employed 9.6 percent of workers. In Pennsylvania‟s
suburban counties− counties that are part of the metropolitan statistical area and abut a central
county − manufacturing accounted for 14.3 percent of GSP and employed 10.6 percent of
workers. Manufacturing had the largest impact on the state‟s more rural counties, where it
accounted for 22.6 percent of GSP and 16.4 percent of employment.
Although the actual dollar amount contributed toward GSP and employment totals were
far greater in the 14 central counties and the 18 suburban counties, manufacturing accounted
for a much greater share of GSP and employment in the rural areas of Pennsylvania.
Manufacturing Activity by Type of County
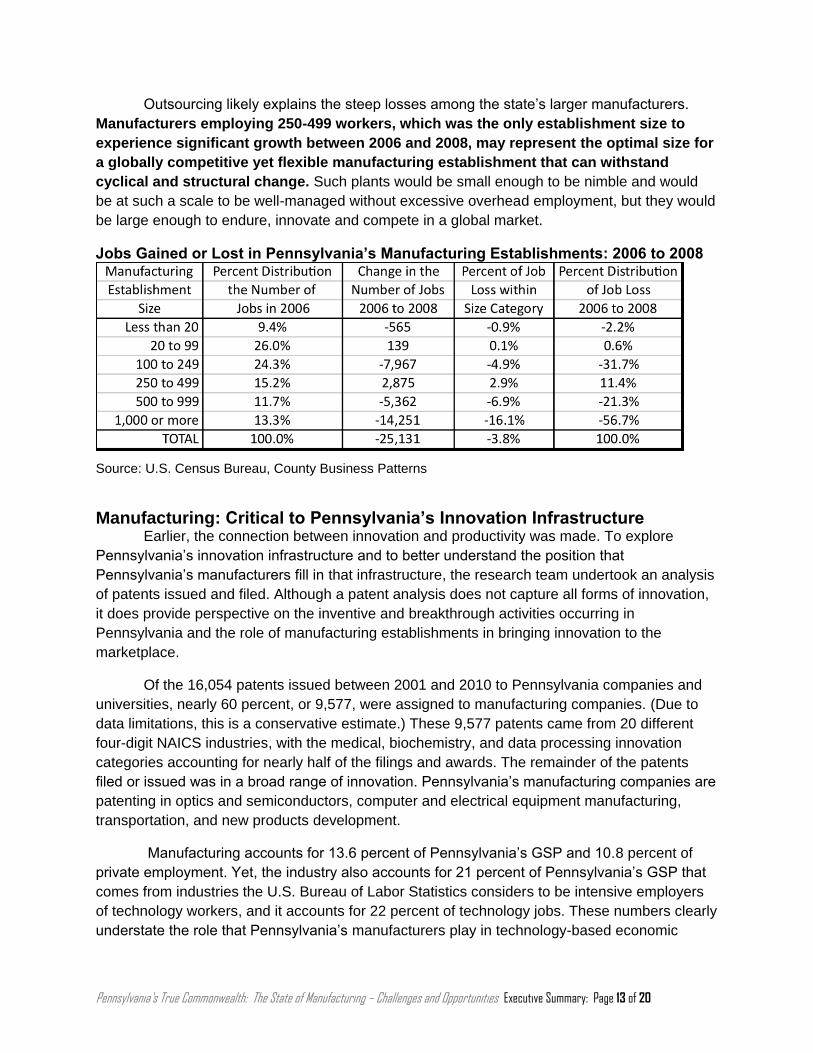
Pennsylvania’s Employment by Establishment Size Between 2006 and 2008, Pennsylvania‟s largest manufacturing establishments – those
with more than 1,000 employees – shed more than 16 percent of their jobs, idling 14,251
workers. As can be seen in the following table, manufacturers that employed 500 to 999
workers cut 6.9 percent of their workforce, and plants employing 100 to 249 workers contracted
by 4.9 percent.
Two size groups of manufacturing plants experienced job growth over this three-year
period: those with 20 to 99 workers and those with 250 to 499 employees. More than one-
quarter of the state‟s manufacturing jobs are in plants employing 20 to 99 workers. This was an
establishment size that did not experience any job losses as the Great Recession began and
deepened. Companies with 100 to 249 employees, which account for nearly one-quarter of
manufacturing jobs, experienced 32 percent of the overall job loss for the industry. Companies
with 250 to 499 workers experienced nearly 3 percent job growth. The next two establishment
size categories lost almost 20,000 jobs.
Pennsylvania’s True Commonwealth: The State of Manufacturing – Challenges and Opportunities Executive Summary: Page 13 of 20
Outsourcing likely explains the steep losses among the state‟s larger manufacturers.
Manufacturers employing 250-499 workers, which was the only establishment size to
experience significant growth between 2006 and 2008, may represent the optimal size for
a globally competitive yet flexible manufacturing establishment that can withstand
cyclical and structural change. Such plants would be small enough to be nimble and would
be at such a scale to be well-managed without excessive overhead employment, but they would
be large enough to endure, innovate and compete in a global market.
Jobs Gained or Lost in Pennsylvania’s Manufacturing Establishments: 2006 to 2008
Source: U.S. Census Bureau, County Business Patterns
Manufacturing: Critical to Pennsylvania’s Innovation Infrastructure Earlier, the connection between innovation and productivity was made. To explore
Pennsylvania‟s innovation infrastructure and to better understand the position that
Pennsylvania‟s manufacturers fill in that infrastructure, the research team undertook an analysis
of patents issued and filed. Although a patent analysis does not capture all forms of innovation,
it does provide perspective on the inventive and breakthrough activities occurring in
Pennsylvania and the role of manufacturing establishments in bringing innovation to the
marketplace.
Of the 16,054 patents issued between 2001 and 2010 to Pennsylvania companies and
universities, nearly 60 percent, or 9,577, were assigned to manufacturing companies. (Due to
data limitations, this is a conservative estimate.) These 9,577 patents came from 20 different
four-digit NAICS industries, with the medical, biochemistry, and data processing innovation
categories accounting for nearly half of the filings and awards. The remainder of the patents
filed or issued was in a broad range of innovation. Pennsylvania‟s manufacturing companies are
patenting in optics and semiconductors, computer and electrical equipment manufacturing,
transportation, and new products development.
Manufacturing accounts for 13.6 percent of Pennsylvania‟s GSP and 10.8 percent of
private employment. Yet, the industry also accounts for 21 percent of Pennsylvania‟s GSP that
comes from industries the U.S. Bureau of Labor Statistics considers to be intensive employers
of technology workers, and it accounts for 22 percent of technology jobs. These numbers clearly
understate the role that Pennsylvania‟s manufacturers play in technology-based economic
Pennsylvania’s True Commonwealth: The State of Manufacturing – Challenges and Opportunities Executive Summary: Page 14 of 20
development. As we noted earlier, if an establishment's primary value added is not production,
then its NAICS code will not designate technology jobs that support production as
manufacturing activity. Whether it is through patent activity or through GSP that comes from
industries that are intense employers of technology labor, manufacturing is a critical part of
Pennsylvania‟s technology infrastructure.
Skill Development and the Manufacturing Industry Manufacturing in the United States traditionally provided hard-working people who had
not pursued college education with jobs that paid well enough to support a family. The
substantial job losses in manufacturing and the transition toward a more service-oriented
economy have raised concerns about the fate of good-paying jobs for people who lack
advanced education and skills. Some prominent economists have suggested that U.S.
employment is taking on the shape of a barbell, with most growth concentrated either among
low-skill jobs that are accessible to high school graduates with limited on-the-job training or
high-skill positions that require a bachelor‟s degree, frequently coupled with large amounts of
on-the-job training. Others economists have noted this job creation pattern, but they assert that
retirements will create many job openings in the middle of the skills distribution. The fate of
middle-skill jobs is an important long-term public policy issue in Pennsylvania because nearly 58
percent of the state‟s adult workers have a high school education or less. Skill development and
acquisition are critical to this group's economic security.
Yet, Pennsylvania manufacturers paint a different view of the workplace: They don't see
a shortage of middle-skill jobs; they worry about a scarcity of workers with skills critical to
manufacturing activities. This is a surprising result coming at the tail end of the Great Recession
and in the early stages of an anemic recovery. Among focus group participants surveyed, 94
percent rated "human-capital acquisition, development and retention" as important to their
company's success over the next five years; 60 percent described it as highly important. In
particular, these top performers fretted over skills, attitude and interest. Workforce issues
constrained their ability to grow. “We can‟t find machinists, welders, hands-on guys who used to
be the backbone of this country,” said a Philadelphia-area manufacturer. “We have the
opportunity to grow. But we can‟t find the people.”
How can the observations from the national data and the focus group observations be
reconciled? Pennsylvania occupational data show something different than what is seen in the
national reports. Classifying jobs into three categories hides what is happening in the middle.
Most of the employment shift in Pennsylvania is from Gateway occupations to low-skill jobs.
Gateway positions require a high school diploma and modest amounts of on-the-job training.
Middle-skill occupations require some combination of postsecondary schooling that is industry-
recognized, substantial amounts of on-the-job training, or, less frequently, a specialized
associate's degree. Middle-skill jobs, as a whole, did not shrink in Pennsylvania. However, they
did shift into different industries, meaning that a person may hold middle skills applicable for one
job but those skills may not transfer to another.
From 2006 to 2008, the number of middle-skill manufacturing jobs did decline by 3.7
percent, but that compares to the nearly 5 percent decline for both Gateway and low-skill
Pennsylvania’s True Commonwealth: The State of Manufacturing – Challenges and Opportunities Executive Summary: Page 15 of 20
positions. Manufacturing jobs that require advanced skills saw a 2.1 percent gain. In 2008, 25.5
percent of all manufacturing jobs were middle-skill; 11.8 percent required advanced skills; 38.9
percent were Gateway occupations, and 23.7 percent were low-skill jobs.
Given manufacturing‟s shifting employment structure, does the industry continue to be
an important source of middle-skill work in Pennsylvania? The data say yes:
In 2008, middle-skill manufacturing jobs accounted for 10.8 percent of all middle-skill
positions in Pennsylvania and 2.9 percent of all jobs in the Commonwealth.
Half of all middle-skill manufacturing jobs are in production. The next-largest
occupational grouping for middle-skill manufacturing jobs is in the skilled trades and
industrial maintenance.
Sales positions are the third-largest source of middle-skill occupations within the
manufacturing sector.
As productivity continues to increase in the manufacturing sector and production jobs
come back slowly, we expect to see increased demand for workers with mid-level skills. Job
creation will occur mostly through turnover. Building career ladders for those in Gateway
positions by providing access to middle-skill positions, particularly production occupations, will
be critical to both the success of the manufacturing sector and to the economic success of
workers who do not go on to earn college degrees.
The Impact of Pennsylvania’s IRC Program
The research team used two different sets of techniques to measure the impact of the
IRC program on Pennsylvania's economy. The impact analysis began with data collected by the
federal partner to the IRC Network, the Hollings Manufacturing Extension Partnership program
of the National Institute of Standards and Technology. NIST/MEP hires an independent survey
firm to collect data from business establishments that use MEP-supported services. The
research team used data from the NIST/MEP survey on new and retained sales and new and
retained jobs to power two separate analyses. The first was a straightforward examination of the
financial impact of the IRC program. The second used an input-output model, a commonly used
economic impact analytical technique, to estimate the multiplier effects of the IRC program.
Data were examined for fiscal years 2008 and 2009; fiscal year 2010 was not examined
because impact data had not been collected.
The first measure of the program's impact was leverage. This measured additional funds
raised from federal, client and other sources due to the presence of state funds invested in the
IRC program. Each dollar of state funding for the IRC program was associated with $1.50 in
additional funds raised and earned in fiscal years 2008 and 2009. The fiscal data reveal the
connection between state funding for the IRCs and program activities. The steep decline in
state funding from FY 2009 to FY 2010 was accompanied by a dramatic drop in client
revenues. Client revenues declined 35 percent in the same year although federal funding
remained relatively constant. Funding from other grants also declined by 64 percent. Such
significant losses in funding would be presumed to affect IRC activities, but the impact in terms
of economic outcomes cannot be assessed at this time.
Pennsylvania’s True Commonwealth: The State of Manufacturing – Challenges and Opportunities Executive Summary: Page 16 of 20
Leverage is not impact, however; what is important is how these leveraged funds affect
the economy of the state. The impact of Pennsylvania's Department of Community and
Economic Development funding of the IRC program was measured through sales of client
companies as reported in the NIST/MEP survey. Every $1 of DCED funding for the network of
regional centers in fiscal year 2008 returned $51 in new and retained sales. In fiscal year 2009,
the yield dropped to $46. The IRCs' client companies reported that services delivered to them
by the network centers were responsible for an increase in sales in fiscal year 2008 of more
than a quarter-billion dollars and retained sales of another half-billion dollars. Sales impact
associated with DCED funding of the IRC program in fiscal year 2009 dropped. Although
retained sales remained about the same ($531 million), reported new sales fell by more than
half, dropping from $273 million to $102 million. Given that the economy began its recovery in
2009, it is difficult to associate this drop with the lingering effects of the recession. It is highly
likely that the drop is related to the $1.3 million decline in DCED funding from FY 2008 to
FY2009.
An important measure of the effectiveness of any economic development program is the
cost per job created and retained. IRC activity affected more than 6,331 jobs in fiscal year 2009;
clients reported 4,833 jobs retained and 1,498 new jobs created. The cost per job to the state
of Pennsylvania was $2,187 in fiscal year 2009. This calculation is justified based on the
assumption that DCED funding leverages the federal funds from NIST/MEP. However,
combining federal and state funds in the calculation would bring the public cost per job to
$3,027. The cost per job created or retained due to IRC support for manufacturing services is
substantially lower than the cost per job created by other economic development programs
reviewed. The cost per job created or retained due to IRC support for manufacturing was also
much lower than the allowable cost per job stated in guidelines for other state and federal
economic development programs.
In addition to examining the direct financial impact of the IRC program on Pennsylvania‟s
economy, the study team sought to quantify the economic impact of both the manufacturing
sector and the IRC program. The economic impact was measured in terms of the value added,
employment multipliers, labor (household) income, and state and local taxes paid that
were triggered by the performance improvements of client manufacturing companies.
Without a doubt, investment in the IRC program has sparked dynamic returns. The
impact has rippled throughout the Pennsylvania economy:
The economic impact model estimated that more than 4,200 jobs were created in the
state by the direct, indirect or induced result of increased sales in companies that
used IRC services.
As a result of increased sales, labor income in the state increased by more than
$235 million.
The increased sales generated an increased demand in output (sales) for
Pennsylvania products and services valued at almost $1.1 billion.
Companies that received IRC services are estimated to have paid an additional $31 million in state and local taxes in 2009 due to increased sales alone.
Pennsylvania’s True Commonwealth: The State of Manufacturing – Challenges and Opportunities Executive Summary: Page 17 of 20
State and local governments collected nearly $17 million in business sales and
property taxes and nearly $5 million in personal income tax. This by itself was $8
million more than the state‟s FY 2009 support for the IRC program.
Total GSP, or total value added, grew by nearly $411 million as a result of increased
sales at companies that used IRC services.
Opportunities for Policy and Programming Understanding manufacturing's economic contribution and competitive performance in
Pennsylvania is important. Knowing context beyond banner headlines of job losses and plant
closings is critical. But manufacturers struggling to survive and retool in such a challenging
environment need more than understanding; they need support as they transform their
enterprises to compete and succeed. The months-long analysis of economic data and
discussions with dozens of Pennsylvania‟s successful manufacturers has generated
recommendations for wide-ranging policy and programmatic changes for supporting this crucial
contributor to the Commonwealth and the common well-being.
Taxes Tax reform was not a lengthy topic of conversation during the focus groups, but the little
said spoke volumes about what manufacturers consider an over burdensome tax climate in
Pennsylvania. The limited discussion of the state‟s tax structure had the effect of conveying the
obvious: Tax reform has been talked about repeatedly among political and business leaders.
Reforming the tax structure is important to help Pennsylvania compete, but there are other
factors, as well. Among surveyed manufacturers who represented the “best” of their region,
taxes were a recurring concern. Survey results and comments were more succinct. They
focused on the state‟s high tax rates (its corporate rate, especially) and the complexity of the tax
code (compliance and navigation). Of 57 written survey responses outside of the prepared
survey questions, 24 comments were made about the tax rate or the tax code. When asked
what kept them up at night, many respondents answered taxes. Of those who wrote simply one
word or one phrase, taxes in Pennsylvania was the dominant response.
The manufacturers know that they have a duty to pay taxes. However, they are looking
for a system that is flatter and easier to comply with. If they were given a choice between a
corporate tax system that was flatter and broader and was easier to comply with versus one that
had a number of carve-outs and incentives tailored for manufacturing, they would go with flatter,
fairer, and easier. Their highest concern is in reducing the corporate net income tax. At a flat
rate of 9.99 percent, it is currently the second-highest rate in the country.
Most of the companies that participated in the focus groups were small to midsized
manufacturers, which is the group that has been the state‟s strongest performers. They wanted
a tax system that provided incentives to reinvest in their businesses, especially in capital
equipment, new product development, and workforce training. They typically pay for their
research and development and invest in their workforce through cash flow. Their comments
indicated that they would like to see the state‟s research and development tax credit work for
Pennsylvania’s True Commonwealth: The State of Manufacturing – Challenges and Opportunities Executive Summary: Page 18 of 20
their firms and apply to product development. Comments were made that there is a limited pool
of funds and they go quickly.
A lesson learned by small and midsized businesses during the Great Recession is the
importance of internal finance and investing in their businesses through retained earnings.
Public policy should encourage the use of retained earnings as an investment vehicle for small
to midsized businesses. Granted, this is mainly a federal issue, but long-term economic benefit
could come from promoting less leveraged financial structures, especially among small and
midsized firms.
Firm-based Economic Development Public policy analysts and economists love to think about their ability to influence the
world through the manipulation of a few big public policy levers. In the case of Pennsylvania, the
thought may be that it is enough to fix the business tax code and let the market work to return
the state to prosperity. Unfortunately, pulling on that one big lever will not be enough. Contrary
to expectations of those who look no further than at the smooth, quick operation of the
theoretical economists‟ invisible hand, manufacturing capacity, supply chain, knowledge, and
products will not be sitting patiently on a shelf somewhere to be rapidly redeployed. The path to
prosperity will be permanently altered and the manufacturing commons will have to be
recreated.
Many of Pennsylvania‟s manufacturers have cut so much to survive this recession that
they no longer have the capability to manage their business properly. Many have divested their
product development capacity. Others have abandoned their practices of lean manufacturing
and continuous improvement. As production comes back, they will have to rethink their
production processes and sourcing. Yes, over a decade, the market will work toward a solution.
But the cost of such a laissez faire approach will be a slower-than-need-be pace of recovery
and an unnecessary loss of firms. The speed of the rebound among Pennsylvania's
manufacturers will be dictated by the speed at which widespread enterprise transformation
takes place or the speed at which firms transition to fill gaps created by the death of companies
that could not adapt. Here, the IRCs are positioned to accelerate positive and necessary
transition, and it is here where the practice of economic development takes place.
There are areas of managerial weakness that represent opportunities for transformation
through strategic state support. Focus group interviews with manufacturers that are succeeding
despite the challenges of market realignment and economic environment pointed to two key
areas: improved management practices and new product development.
Many focus group participants talked of their lean journey and of the need to “change
their culture.” Lean is one of several business management strategies that focus group
participants have embraced. Although lean focuses on eliminating waste, which some have
interpreted simply to mean cutting jobs, focus group participants spoke of lean as a necessary
component of growth. It has given them the tools to determine where opportunities lie. But it
works best when it is part of a sustained strategic effort to transform the manufacturing
enterprise and is a tool to implement a corporate culture of continuous improvement.
Pennsylvania’s True Commonwealth: The State of Manufacturing – Challenges and Opportunities Executive Summary: Page 19 of 20
Many focus group participants indicated that they have been so concerned about
surviving the Great Recession that they have not focused on new product development. Much
of new product development, they said, is being driven by customer requests. Several also have
moved to integrate their suppliers into the development process. This suggests that state-
supported efforts to stimulate niche-based new product development in small to
midsized manufacturing establishments can yield important returns. The prospect is all
the brighter when product development pulls new technologies into their products or
production processes.
There is no silver bullet when it comes to helping a private company become more
competitive. Many things have to be done right, and this rests on the company‟s commitment to
engage in enterprise transformation. There is no single place to start the journey. The most
successful small and midsized manufacturers have found ways to provide service offerings that
shelter their physical products from pure price-based competition. Most of the firms we talked to
engaged in product development, but it is very different from the formal processes used by large
companies. Most follow their customers to understand need, use suppliers as research and
development and technology resources, finance internally, and use their current product sets as
platforms for product improvements and extensions. This is a world of sustaining innovation, not
disruptive innovation.
Workforce Development There is always a tension in an organization that has two customers; and this is
universally true when it comes to workforce development. The current system is expected to
treat both potential employers and workers as clients. The workforce system is expected to be a
competitive source of workers, yet also take on social service responsibilities for the
underprivileged and under-skilled. This can be thought of as a tension between the demand-
side of a market (employers) and the supply side (potential employees), with the workforce
system being a “market maker.” An ever-present challenge is how effectively to organize
demand − the employers. Many employers are using temporary staffing agencies, especially for
low-skill and Gateway occupations. The difficulty lies in organizing and articulating the demand
for workers with middle skills.
The seven regional IRCs are part of the state‟s economic development capacity and are
its “feet on the street,” working on a daily basis with employers. In a future where middle-skill
manufacturing jobs will be at the top of the job ladders many workers climb, the IRC program
can bridge the gap between the supply and demand sides of the labor market. Middle-skill jobs
that can support families require substantial amounts of on-the-job training accompanied by
industry-standard and certified skills training. This is a recipe for a modern version of an
apprenticeship program, one that is responsive to employers, combines formal training attached
to a certificate, and is cemented by structured on-the-job training. Such comprehensive
workforce development will require an intermediary that has experience in structuring programs,
that is responsive to employers, especially manufacturers, and that understands how to work in
both the private and public realms.
Pennsylvania’s True Commonwealth: The State of Manufacturing – Challenges and Opportunities Executive Summary: Page 20 of 20
Conclusion Pennsylvania‟s manufacturing sector is central to the state‟s economy. It is the largest
sector in terms of the generation of Gross State Product; it is the state‟s fourth-largest source of
jobs; it has the highest productivity of any sector; and it has the highest employment, income,
and value added multipliers of any economic sector in the state. The sector is in transition and
will need management support and education as it regains its footing after emerging from the
Great Recession and a decade in which the value of the U.S. currency worked against it.
Of particular note is the performance of the small to midsized segment of the industry
during the Great Recession and the disproportionate role the industry plays in the economic
development of rural Pennsylvania.
Manufacturing is a sector that deserves continued public support and investment in the
form of state tax and regulatory reform, employer-responsive workforce development programs,
and a resource that can transfer knowledge about business growth strategies and management
practices that fit the demands of small and midsized firms. The Industrial Resource Center
program is a tested tool in the state‟s economic development toolbox. It works with small to
midsized manufacturing companies to improve their competitiveness by providing management
education, training and implementation strategies that are experientially based and respond to
the needs of a sector and size of firm that is frequently overlooked.
The data demonstrate that the IRC program creates and retains jobs in a cost-effective
manner, that the tax return from new sales alone pays for the state‟s program cost, and that
program services pass a market test through the fees charged. Although the fees clients paid
for services are a sign of value, state and federal support is justified to allow the IRC Network to
engage in its own product development to better serve the emerging needs of small and
midsized manufacturers and to allow the IRCs to provide services to companies that cannot
afford the fees of major management consulting organizations.
True economic development takes place by helping leaders improve the income
statements of their businesses through their location in Pennsylvania. This is the mission of the
IRCs. They help businesses improve their operations by moving the numbers on the middle
lines of the statement. They help to grow the top line by helping companies develop new
products and provide new services based on strategic thinking and action. The seven
manufacturing centers supported by the IRC program are true stewards of Pennsylvania‟s