147
THE STATE OF RENEWABLE ENERGIES IN EUROPE EDITION 18 th EurObserv’ER Report
| Date post: | 11-Aug-2019 |
| Category: |
Documents |
| Upload: | truongthuan |
| View: | 214 times |
| Download: | 0 times |

THE STATE OF RENEWABLE ENERGIES IN EUROPE
EDITION !"#$18th EurObserv’ER Report

1
EUROBSERV !ER " THE STATE OF RENEWABLE ENERGIES IN EUROPE " #$%& EDITION
THE STATE OF RENEWABLEENERGIES IN EUROPE
EDITION !"#$18th EurObserv’ER Report
This barometer was prepared by the EurObserv’ER consortium, which groups togetherObserv’ER (FR), ECN part of TNO (NL), RENAC (DE), Frankfurt School of Finance and Management (DE), Fraunhofer ISI (DE) and Statistics Netherlands (NL).
The information and views set out in this publication are those of the author(s) and do not necessarily reflect theofficial opinion of the Commission. The Commission does not guarantee the accuracy of the data included in thisstudy. Neither the Commission nor any person acting on the Commission’s behalf may be held responsible for theuse which may be made of the information contained therein.
This project is funded by the European Union under
contract no ENER/C2/2016-487/SI2.742173
2 3
EUROBSERV !ER " THE STATE OF RENEWABLE ENERGIES IN EUROPE " #$%& EDITION
EDITORIAL by Vincent Jacques le Seigneur !
Energy indicators "
Wind power # Photovoltaic $! Solar thermal %& Hydropower %" Geothermal energy '& Heat pumps '" Biogas !% Biofuels (& Renewable municipal waste (" Solid biomass "% Concentrated solar power )& Ocean energy )"
Integration of RES in the building stock and urban infrastructure #$
•! Conclusion ##
Socio-economic indicators **
Wind power $&% Photovoltaic $&" Solar thermal $$& Hydropower $$! Geothermal energy $$# Heat pumps $%% Biogas $%" Biofuels $%# Renewable municipal waste $'% Solid biomass $'!
•! Conclusion $'#
RES development impact on fossil fuel sectors $!#
Investment Indicators $($
Investment in Renewable Energy Capacity $('
Wind power $(! Photovoltaic $(# Biogas $"% Renewable municipal waste $"" Geothermal energy $"# Solid biomass $)& International comparison of investment costs $)!
Public finance programmes for RES investments $)#
Investment in Renewable Energy Technology $#%
Venture capital – private equity $#!
Performance of RES technology firms and RES assets $#"
On the whole $*%
Renewable energy costs, prices and cost competitiveness $*(
Avoided fossil fuel use and resulting avoided costs %&&
Indicators on innovation and competitiveness %$$
R&D Investments %$%
• Public R&D Investments Wind Energy %$! Solar Energy %$( Hydropower %$" Geothermal energy %$) Biofuels %$# Ocean energy %$* Renewable Energy Technologies in Total %%&
• Private R&D Investments Wind Energy %%$ Solar Energy %%% Hydropower %%' Geothermal energy %%! Biofuels %%( Ocean energy %%" Renewable Energy Technologies in Total %%)
• Conclusions %%#
Patent Fillings %'% Wind Energy %'! Solar Energy %'" Hydropower %'# Geothermal energy %!& Biofuels %!% Ocean energy %!! Renewable Energy Technologies in Total %!"
• Conclusion %!#
International Trade %(& All RES %(% Wind Energy %(! Photovoltaic %(" Biofuels %(# Hydropower %"&
• Conclusion %"%
Indicators on the flexibility of the electricity system %"(
Sources & references 276

4 5
EUROBSERV !ER " THE STATE OF RENEWABLE ENERGIES IN EUROPE " #$%& EDITION
EDITORIALEDITORIAL
“If there is one project today which carries a positive vision for Europe, it is definitely the energy transi-tion”, highlighted Jacques Delors and Enrico Letta in the Notre Europe1 think tank manifesto. History appears to have proved them right. For the energy challenge that sparked off the European Coal and Steel Community (ECSC, 1951) followed by the atom (Euratom, 1957), is once again at the centre of all discussions in a spirit of openness and convergence, even though much remains to be accomplished.
Today, the European Union is centre-stage of a two-pronged approach to set the course for the next decade. Firstly, with the penning of a climate stra-tegy2 for a carbon-neutral Europe by 2050, which will be debated by the European Council on 9 May 2019 at Sibiu. Secondly it is rolling out the new 2010 Climate-Energy package, the first of whose eight regulations has just been voted through. It has been a long road travelled since 2014 to convince the most stubborn Member States, but also to get the European Parliament to shift the Commission and the European Council from their initial stance. Now the results are there to be seen! The European Union’s leadership role has been confirmed, the renewables share in final energy consumption, ini-tially set at 27%, is now 32% and energy efficiency gains have been increased by more than five points. While the abandonment of binding targets on the Member States is a blow, the insistence on having
national energy and climate plans3 will enable the Commission to assess them and make recommen-dations if not demand corrective measures4.
This political agenda is crucial on a number of counts. It gives visibility to all public and private investors and decision-makers. It is particularly timely for the economy because renewable ener-gies that already employ more than 1.5 million people and generate sales worth some 155 billion euros are well and truly sources of growth. It also meets Europeans’ expectations as 75 % of them would rather have a common energy policy than the economic or monetary union or unlikely new extensions5. It comes second only to free movement of persons in Europe at the top of their wish list.
Many initiatives have been taken without waiting for this European energy community that was so dear to Jacques Delors. The European Commission’s Directorate-General for Competition which encou-rages the introduction of cross-border tenders to facilitate deployment of renewable energies in the most conducive areas, and at the same time bringing down costs faster. Another example is the requirement to harmonise support mechanisms enshrined in this new set of legislation that could affect the development pace of wind and solar pho-tovoltaic energy but is far and away the best way to build tomorrow’s Europe.
EUROPE TRANSCENDS BORDERSVincent Jacques le Seigneur, president of Observ’ER
Governance has been fixed to stay on course. For the Member States this means the obligation to present a progress report on the Energy Union’s five dimensions every two years: security of sup-ply, internal market, energy efficiency, emissions reduction, research and competitiveness. For the Commission it entails the obligation to present an annual report on the state of the Energy Union to the European Parliament and Council. Let’s leave it up to our two illustrious rapporteurs to conclude: “The European Commission has done its part of the work by submitting ambitious proposals that must now be improved on. We would like our national and European leaders to be aware of the strategic importance of the Energy Union for our Europe, our nations and our way of life”. Let them still and always be heard.
1. “Making the transition of energy a European Union
success” Notre Europe, 2017
2. Communication presented at the end of November 2018:
“A Clean Planet for all”
3. Submitted to the Commission before 1 October 2019
4. The legislative package, Franco-German Office for the
Energy Transition (OFATE), December 2018
5. Eurobarometer No. 90, Oct 2017

Energy indicators
EUROBSERV !ER " THE STATE OF RENEWABLE ENERGIES IN EUROPE " #$%& EDITIONEUROBSERV !ER " THE STATE OF RENEWABLE ENERGIES IN EUROPE " #$%& EDITION
6 7
The tables reproduce the most recent figures avai-lable for each sector. In publishing this edition, the EurObserv’ER data was fully reconciled with the Eurostat data published on 31 January 2019 and the Indicator-specific data from the Renewable Energy Directive provided by the SHARES (Short Assessment of Renewable Energy Sources) tool published on 4 February 2019. This reconciliation covers the indica-tors for electricity output, electrical capacity, final energy consumption and derived heat from heating or cogeneration plants. In the case of market indica-tors not monitored by Eurostat, such as market data for different types of heat pumps or different types
of solar thermal collectors, the EurObserv’ER source or indicators was exclusively used.
As for the “heat” data, a distinction is made between derived heat from the processing sec- tor and final energy consumption in line with Eurostat definitions. Derived heat covers the total production of heat in heating plants and cogeneration plants (combined heat and power plants). It includes heat used by the auxiliaries of the installation which use hot fluid (space heating, liquid fuel heating, etc.) and losses in the installa tion/network heat exchanges. For auto-producing
entities i.e. entities generating electricity and/or heat wholly or partially for their own use as an activity which supports their primary activity) the heat used by the undertaking for its own processes is not included.
Final energy consumption is the total energy consu- med by end users, such as households, industry and agriculture. It is the energy which reaches the final consumer’s door and excludes that which is used by the energy sector itself including for deliveries, and transformation. It also excludes fuel transfor- med in the electrical power stations of industrial auto-producers and coke transformed into blast-fur-
nace gas where this is not part of overall industrial consumption but of the transformation sector. Final energy consumption in «households, services, etc.» covers quantities consumed by private households, commerce, public administration, services, agricul- ture and fisheries.
A distinction is also made with regard to electricity and derived heat production data between output from plants solely producing either electricity or heat and the output from cogeneration plants simultaneously producing heat and electricity. For French indicators, overseas departments are always included.
Methodological note
The sectors that were not covered by indivi-dual barometers have also been analysed in detail and statistically monitored using data published in 2018. They cover small hydro-power, heat pumps, geothermal energy, biogas, the incineration of renewable muni-cipal waste and ocean energies.
This work offers a full synopsis of the energy dimension of the twelve renewable sectors now developed at an industrial scale within the European Union.
EurObserv’ER has been collecting data on the European Union’s renewable energy sources for twenty years to describe the state and thrust of the various sectors in theme-based barometers. The first part of this assessment is a summary of the barometers published in 2018 for the wind energy, photovoltaic, solar thermal, concentrated solar power, biogas, biofuel, solid biomass and heat pumps sec-tors. The data drawn from these barometers has been consolidated with the official data available at the very end of the year.
ENERGY INDICATORS

Energy indicators
EUROBSERV !ER " THE STATE OF RENEWABLE ENERGIES IN EUROPE " #$%& EDITIONEUROBSERV !ER " THE STATE OF RENEWABLE ENERGIES IN EUROPE " #$%& EDITION
8 9
WIND POWER
NEW INSTALLATION RECORDAccording to Eurostat, 168.9!GW of net maximum onshore and off-shore wind electrical capacity (i.e. the maximum active capacity that can be continuously supplied) was in service in the European Union in 2017, 14.7!GW more than in 2016. It is the highest increase ever recorded by the sector, overtaking those of 2016 and 2015 (12.8!GW each). This installation record can be attribu-ted to the positive thrust of the three biggest markets, and espe-cially the leading market, Germany. It alone posted 6 126!MW of net additional capacity, taking its capa-city to 55.7!GW by the end of 2017, which is almost a third of the Euro-pean Union’s wind energy capacity. In 2017 the UK also made a spirited comeback, boosted by its offshore segment, and posted 3 662!MW of additional capacity, which is almost double the amount it installed in 2016 (1 868!MW). France (including the overseas departments) also posted its best growth in 2017 to date by adding 2!GW (2 001!MW).
These three countries, through their market sizes, may account PN
E G
rupp
e
for the major share of newly-ins-talled capacities in the European Union, but other countries have also been active. New records were set in Belgium (436!MW) and Ireland (532!MW). Sweden (177!MW), Aus-tria (157!MW) and Greece (171!MW) lost steam. However, height Mem-ber States installed no additional capacity.
OFFSHORE EXPANDSHaving dimmed in 2016, offshore wind energy’s sparkle returned in 2017 and was a factor in the wind energy sector’s performance. According to EurObserv’ER, the maritime sector posted 3 228.6!MW of additional net capacity, taking the EU’s offshore wind turbine capacity base to 15 821.5!MW. The sector now accounts for just under 10% (9.4%) of total EU wind energy capacity but benefitted from more than 22% of all the additional capa-city installed in 2017.
If we take the French Floatgen floa-ting wind turbine demonstrator out of the equation, 12 offshore wind farms were fully connected to the

Energy indicators
EUROBSERV !ER " THE STATE OF RENEWABLE ENERGIES IN EUROPE " #$%& EDITIONEUROBSERV !ER " THE STATE OF RENEWABLE ENERGIES IN EUROPE " #$%& EDITION
10 11
grid in 2017. Four farms, all of them British, were partially connected: Race Bank, Walney, Rampion and Galloper. The fully-connected Bri-tish wind farms were Dudgeon East (402!MW), Burbo Bank Exten-sion (200!MW), Blyth (42!MW) and Hywind Scotland (30!MW). The lat-ter is a special case because it is the world’s first offshore farm (leaving aside demonstrators) to use floa-ting foundations. Germany also has 5 new fully connected farms: Veja Mate (402!MW), Wikinger (350!MW), Nordsee One (332! MW), Norder-gründe (111!MW) and Sandbank (52!MW). As for Belgium, it inaugu-rated the NobelWind farm (165!MW) and Finland commissioned its Pori Tahkoluoto farm (42! MW) and replaced all of its Kemis Ajos farm wind turbines (26.4!MW). The French floating wind turbine demonstrator Floatgen (2!MW) was inaugurated in October 2017 but although it pro-duced its first!kWh while in dock in December 2017, it was only connec-ted to its real site off the Croisic coast early in 2018.
PRODUCTION IN !"#$ WAS MORE LIKE BACK%TO%NORMALThe poor winds along the British coasts, in the North and Baltic Seas and broadly over the Northern half of Europe in 2016 hit wind power production hard. But wind condi-tions in 2017 returned to normal. Eurostat reports that output rea-ched 362.4!TWh in 2017, which is a 19.7% increase on 2016 (equivalent to an additional 59.6!TWh). Ger-many was the first country to pass the 100!TWh output threshold as it generated 105.7!TWh in 2017. The UK (50!TWh) beat Spain (49.1!TWh) by a hairs’ breadth to second place in the EU producer rankings.
Obviously output improved in the countries that have major offshore capacity. An increasing number of offshore wind farms have annual load factors close to if not in excess of 50%. This rate can be even higher in winter, coinciding with electri-city requirement peaks in many countries. The load factor of a wind turbine is the ratio between the energy effectively produced during a given timeframe and the potential energy it could have generated at nominal capacity during the same timeframe.
2016 2017
United Kingdom 5!293.4 6!987.9
Germany 4!152.0 5!427.0
Denmark 1!271.1 1!296.8
Netherlands 957.0 957.0
Belgium 712.2 877.2
Sweden 203.0 203.0
Finland 4.3 72.7
Total EU 28 12!593.0 15!821.5* Net maximum electrical capacity. Source: EurObserv’ER 2018
Wind power net capacity installed* in the European Union at the end of 2017 (in MW)
Installed offshore wind power net capacity* in the European Union at the end of 2017 (in MW)
2016 2017
Germany 49!592 55!718
Spain 22!990 23!100
United Kingdom 16!174 19!835
France 11!511 13!512
Italy 9!384 9!737
Sweden 6!434 6!611
Poland 5!747 5!759
Denmark 5!246 5!522
Portugal 5!124 5!124
Netherlands 4!257 4!202
Ireland 2!786 3!318
Romania 3!025 3!030
Austria 2!730 2!887
Belgium 2!370 2!806
Greece 2!370 2!624
Finland 1!565 2!044
Bulgaria 699 698
Croatia 483 576
Lithuania 509 518
Hungary 329 329
Estonia 310 312
Czechia 282 308
Cyprus 158 158
Luxembourg 120 120
Latvia 70 77
Slovenia 5 5
Slovakia 3 4
Malta 0 0
Total EU 28 154!272 168!934* Net maximum electrical capacity. Source: Eurostat
1
2
EnB
w

Energy indicators
EUROBSERV !ER " THE STATE OF RENEWABLE ENERGIES IN EUROPE " #$%& EDITIONEUROBSERV !ER " THE STATE OF RENEWABLE ENERGIES IN EUROPE " #$%& EDITION
12 13
THE LEVEL OF EUROPEAN COOPERATION IS PARTLY RESPONSIBLE FOR THE CHANGE Projected European growth through to 2020 should generally stay on course to meet the national renewable energy action plan tar-gets, but in the longer term, projec-tions will be hazier. In fact, while the drop in the price of wind power and its competitiveness in relation to other technologies opens up new prospects for the sector, wind energy’s future development pace will be constrained by the dearth of outlets in the European electri-city market, unlike its American and Chinese counterparts. The European electricity market’s over-capacity situation combined with the influx of “variable” renewable energies has led to a drop in the wholesale price of electricity and thereby undermined many histori-cal operators that are thus asking for more time to decarbonise their production systems.
One solution advanced by the Directorate General for Competi-tion of the European Commission entails cross-border tendering which would make the develop-ment of renewable energies easier in the most conducive areas at the lowest possible costs. The Euro-pean Commission reckons that by opening up 10–15% of tenders to foreign capacities, support costs would drop by about 4–5% over the 2021–2030 period. The Commission also believes that cross-border ten-ders are the most effective way of harmonising support mechanisms. Lastly it feels that this move would enable a European renewable energy development target to be
Electricity production from wind power in the European Union in 2016 and 2017 (in TWh)
Comparison of the current trend against the NREAP (National Renewable Energy Action Plans) roadmap (in GW)
Source: EurObserv’ER 2018
2016 2017
Germany 78.598 105.693
United Kingdom 37.263 50.004
Spain 48.905 49.127
France 21.473 24.711
Italy 17.689 17.742
Sweden 15.479 17.609
Poland 12.588 14.909
Denmark 12.782 14.780
Portugal 12.474 12.248
Netherlands 8.170 10.569
Ireland 6.149 7.445
Romania 6.590 7.407
Austria 5.232 6.574
Belgium 5.437 6.511
Greece 5.146 5.537
Finland 3.068 4.795
Bulgaria 1.425 1.504
Lithuania 1.136 1.364
Croatia 1.014 1.204
Hungary 0.684 0.758
Estonia 0.594 0.723
Czechia 0.497 0.591
Luxembourg 0.101 0.235
Cyprus 0.227 0.211
Latvia 0.128 0.150
Slovakia 0.006 0.006
Slovenia 0.006 0.006
Malta 0.000 0.000
Total EU 28 302.859 362.412Source: Eurostat
2015 2016 2017 2020
!"!.#!#".$
!%&.'
(!)
!"(.(
(!(.(
NREA
P NREA
P
3 4
e.o
n
set linked to a “European” support mechanism. If that happens, the future development pace of wind energy will be closely linked to the level of European cooperation as part of a common energy vision, in addition to the efforts to combat climate warming that the Member States have agreed to make by the 2030 timeline.

Energy indicators
EUROBSERV !ER " THE STATE OF RENEWABLE ENERGIES IN EUROPE " #$%& EDITIONEUROBSERV !ER " THE STATE OF RENEWABLE ENERGIES IN EUROPE " #$%& EDITION
14 15
Solar power’s spectacular growth, which is based on solid industrial
foundations, makes photovoltaic one of the cornerstones of global energy transition. During 2017, approximately 100!GW of photovol-taic capacity was installed all over the world and took global instal-led capacity to more than 400!GW (403.3!GW according to the IEA’s PVPS report). China installed more than half of this new capacity (53!GW) The European Union has now dropped out of the top 5 global markets, for behind the top three represented by China (53!GW), the USA (10.7!GW) and India (9.6!GW), come Japan (7.5!GW) and Turkey (2.6!GW). Only three EU countries are left in the top 10 – Ger-many in 6th place (1.7!GW), ahead of Australia (1.3!GW) and South Korea (1.2!GW), with France (0.9!GW), the UK (0.9!GW) and Brazil (0.9!GW) – all tightly bunched. The 2017 global market amounted to a little less than the whole of the European Union’s installed collector base, which Eurostat claims was 106.7!GW. It is clear that as the globalisation process of solar power picks up speed, the European Union market’s relative share and installed base are gradually shrinking.
TRANSITION STILL DOMINATES THE EU MARKET The 2017 data released by Eurostat in January 2019 confirms the trend decline in net capacity connection for the year. In 2011, the EU enjoyed an installation peak of 23.2!GW, then the annual net installed capacity decreased to 6.5!GW in 2014. After the 2015 spurt, addi-tional annual installed capacity continued its downward slide to 5.7!GW in 2017.
Thus, the European Union mar-ket is still in transition, with less emphasis on fast development of big photovoltaic power plants which is now regulated by a tende-ring policy, and more on commer-cial and residential roof-mounted systems. Its focus is also driven by self-consumption systems that allow investors to benefit from the lower production costs of self-consumed solar power, rather than purchase more expensive power from the grid.
PHOTOVOLTAIC
EDF

Energy indicators
EUROBSERV !ER " THE STATE OF RENEWABLE ENERGIES IN EUROPE " #$%& EDITIONEUROBSERV !ER " THE STATE OF RENEWABLE ENERGIES IN EUROPE " #$%& EDITION
16 17
Installed solar photovoltaic net capacity* in the European Union at the end of 2017 (in MW)
Electricity production from solar photovoltaic in the European Union in 2016 and 2017 (in!TWh)
2016 2017
Germany 40!714 42!337
Italy 19!283 19!682
United Kingdom 11!912 12!776
France 7!702 8!610
Spain 4!716 4!725
Belgium 3!325 3!610
Netherlands 2!049 2!903
Greece 2!604 2!606
Czechia 2!068 2!070
Romania 1!372 1!374
Austria 1!096 1!269
Bulgaria 1!028 1!036
Denmark 851 906
Portugal 513 579
Slovakia 533 528
Hungary 235 344
Poland 187 287
Slovenia 233 247
Sweden 153 244
Luxembourg 122 128
Malta 93 112
Cyprus 84 110
Finland 35 74
Lithuania 70 74
Croatia 56 60
Ireland 6 16
Latvia 1 1
Estonia 0 0
Total EU 28 101!041 106!707* Net maximum electrical capacity. Source: Eurostat
2016 2017
Germany 38.098 39.401
Italy 22.104 24.378
United Kingdom 10.411 11.525
France 8.657 9.573
Spain 8.064 8.514
Greece 3.930 3.991
Belgium 3.092 3.288
Netherlands 1.602 2.204
Czechia 2.131 2.193
Romania 1.820 1.856
Bulgaria 1.386 1.403
Austria 1.096 1.269
Portugal 0.871 0.992
Denmark 0.744 0.751
Slovakia 0.533 0.506
Hungary 0.244 0.349
Malta 0.254 0.310
Slovenia 0.267 0.284
Sweden 0.143 0.230
Cyprus 0.146 0.172
Poland 0.124 0.165
Luxembourg 0.100 0.108
Croatia 0.066 0.079
Lithuania 0.066 0.068
Finland 0.019 0.044
Ireland 0.006 0.011
Latvia 0.000 0.000
Estonia 0.000 0.000
Total EU 28 105.975 113.665Source: Eurostat
1 2GERMANY REGAINS ITS EU LEADERSHIPIn 2017, Germany took back the European market reins after having left them in the UK’s hands for three years in a row. According to Eurostat, Germany’s installed photovoltaic capacity increased by 1!623!MW in 2017 (compared to 1! 471! MW in 2016) rising to 42!337!MW, which equates to about 1.6 million on-grid installations. Photovoltaic electricity output rose to 39.4! TWh in 2017, (3.4% more than in 2016) and amounted to 6% of the country’s brut elec-tricity production. According to AGEE-Stat, the self-consumed share of electricity continued to rise, achieving 10% in 2017 (9.5% in 2016 and 9.1% in 2015). This self-consumption market is now supported by the solar power sto-rage market. The Franco-German Office for the Energy Transition (OFATE) claims that 40 000 small photovoltaic battery systems were sold in Germany by 31 December 2017, and that 32 000 of them were subsidized through the KfW (deve-lopment bank) programme for pro-moting stationary battery storage systems.
Solar photovoltaic power plants with capacities greater than or equal to 750!kWp are subject to ten-dering. The fourth tendering period for ground-mounted photovoltaic plants with minimum capacity of 750!kWp, published on 1!February 2018, saw prices continue to drop. There were 79 bids for a total volume of 546! MWp and 24 of them were successful for 200!MW of capacity. The reference value of these tenders was "!0.433 per!kWh. The lowest bid made was "!0.386 per!kWh. The reference value of the
previous bid was "!0.491 per!kWh. On 1 April 2018, the Federal Grid Agency released the results of the first bi-technology tender for solar energy and wind energy. All the successful bidders for this tender bid for photovoltaic power plants, which demonstrates the competitive advantage enjoyed by solar power in Germany. A total of 32! photovoltaic power plant projects were successful for total capacity of 210!MW. The average price was set at "!0.467 per!kWh (a little higher than the last pho-tovoltaic-specific tender), with the lowest bidding price at "!0.396 per!kWh and the highest at "!0.576 per!kWh.
THE UK LARGE POWER PLANT MARKET COMES TO A STANDSTILL Having held the European leader-ship for three years, the British large solar power plant market has gradually waned. According to the Department for Business, Energy and Industrial Strategy (BEIS), 864!MW of capacity went on-grid 2017 compared to 2! 311!MW in 2016 (and to 4 073!MW in 2015). This additional capacity brings the net installed capacity at the end of 2017 to 12 776!MW. Most of the capacity installed in 2017 was on sites accredited under the old Renewable Obligation incentive system and was installed in the first quarter of the year before the mechanism was curtailed for good (720!MW installed in Q1, then 43!MW in Q2, 55!MW in Q3 and 45!MW in Q4). The few tens of!MW installed over the last quarters were from the market for small installations that were still eli-

Energy indicators
EUROBSERV !ER " THE STATE OF RENEWABLE ENERGIES IN EUROPE " #$%& EDITIONEUROBSERV !ER " THE STATE OF RENEWABLE ENERGIES IN EUROPE " #$%& EDITION
18 19
gible for Feed-in Tariffs. This situa-tion has arisen because no solar energy project has qualified since the second Contract for Difference (CfD) auction was held.
THE EUROPEAN UNION PRODUCES ##&.$'TWH OF PHOTOVOLTAIC ELECTRICITY In terms of output, 2017 was much better than 2016, aided by slightly better sunshine conditions and a net additional capacity of 11.7!GW over the past two years. According to Eurostat, European Union out-put reached 113.7! TWh in 2017, which equates to annual growth of 7.3%. Solar power now amounts to 3.4% of the European Union’s gross electricity output.
FINE PROSPECTS UNDER POLITICAL PRESSUREDespite the further drop in the number of connections in the EU, the negative momentum should be broken at least for the next three years. Solaire photovol-taic has without a doubt become the most popular, cheapest and easiest renewable energy for economic stakeholders to access. Hence, many governments are banking on solar power to achieve their national targets for 2020. The latecomers, including France and the Netherlands, have responded to their wake-up call and this is already giving new impetus to the EU market, which is enjoying the very positive reduction in costs. Spain’s tenders should also perk up the European mar-ket from 2019 onwards, aided by the implementation of new PPA (power purchase agreement) pro-jects without public subsidies. Germany, helped by the imple-
mentation of a stable regulatory framework, should continue to be the mainstay of the European mar-ket with a target to install 2.5!GW per annum. As for the eleven EU countries that have already met their gross electricity consump-tion target shares of renewable energy, the European obligation to develop these sectors has been diluted and is only motivated by national political will. That may explain why markets that were formerly buoyant, such as the Cze-chia, Romania and Bulgaria, are now completely listless. EurOb-serv’ER reckons that the newly-installed capacity across the European Union could gradually rise to at least 10!GW by 2020.
Another positive factor is the increasing appetite of a variety of economic sectors (retail distribu-tion, food-processing, agriculture, etc.) for the new self-consump-tion models. However, the area of collective solar power self-consumption is subject to fric-tion between the stakeholders of the relevant countries, both over regulatory issues and the input of those installations to the development and maintenance of the distribution grid.
Bel
ectr
ic
Comparison of the current trend of photovoltaic capacity installed against the NREAP (National Renewable Energy Action Plans) roadmap (in!GW)
2015 2016 2017 2020
!".#$#$.#
$#%.&
$'".#
"(.%
)(."
NREA
P NREA
P
Source: EurObserv’ER 2018
3

Energy indicators
EUROBSERV !ER " THE STATE OF RENEWABLE ENERGIES IN EUROPE " #$%& EDITIONEUROBSERV !ER " THE STATE OF RENEWABLE ENERGIES IN EUROPE " #$%& EDITION
20 21
Solar thermal is certainly the very best form of energy for
transferring heat to water from a physical point of view, as it nei-ther emits GHG nor pollutants. Yet, the sector is struggling to make economic inroads into the hot water and heating production market. The European Union mar-ket experienced another sharp drop in the installed surface for hot water and heating produc-tion in 2017, its ninth hard year in a row since 2009. According to EurObserv’ER, the 16.6% drop was particularly sharp between 2016 and 2017 – when 2 175 546 m2 of collector surface was installed, adding 1 523! MWth of thermal capacity (2 609 886 m2 in 2016).
STRUGGLING TO FIND A GAP IN THE CLOUDSAll in all, Europe’s solar thermal markets are finding it hard to sta-bilize (Spain, Austria, Poland) or are contracting (Germany, France, Italy and Belgium). Despite its patent energy efficiency and CO2 balance advantages, solar thermal heat is struggling to establish an economic foothold in the heating and domestic hot water produc-
SOLAR THERMAL
tion market. It faces particularly stiff competition in the renova-tion segment but also in new build, where it has never really taken off.
The solar thermal business is highly sensitive to government policies that may or may not create an obligation to install renewable heat in new build under the terms of its thermal regulations. Spain is a case in point. Thermal regulation specifi-cations also have a strong impact on the market’s momentum because, if there is no renewable obligation, minimum adherence to construction standards can be achieved by good insulation or by incorporating fossil or electrical technologies that have also made great strides in energy efficiency. Yet those thermal regulations that insist on the introduction of renewable technologies, or a mini-mum share of renewable energy in building energy consumption do not necessarily benefit solar thermal solutions. In actual fact, each regulation tends to bolster one heating or domestic hot water production solution over another.
Statistics that works for the Federal Ministry for Economic Affairs and Energy (BMWi), Germany installed about 650 000 m2 of collectors in 2017 (equating to 455!MWth of out-put). This data signals a 15.1% drop in newly-installed area over 2016 (766 000 m2) and also confirms the observations made last year by the sector’s players. The MAP incentive programme which was upgraded in 2015, and the new “Anreizprogramm Energieeffizienz (APEE)” energy effi-ciency stimulation programme set up on 1 January 2016, fell short of stemming solar thermal’s decline. The industry blames the downward trend not only on the cost of gas-fired heating which is still very competitive but also on increasing competition from other renewable energy heating systems. Another grumble observed elsewhere, is installers’ growing indifference to solar thermal solutions, in favour of solutions that are faster to install.
Upturn for the Greek market The Greek market is on an upswing, unlike the other main European solar thermal markets.
Wag
ner
& C
o S
ola
rtec
hn
ik G
mbH
Competition from the other renewable heating technologies such as air-sourced heat pumps and thermodynamic hot water heaters is rife. These sectors are booming and are also boosted by the trend to electrify heating and cooling needs. Solar thermal is also caught up in internecine rivalry with solar photovoltaic where it competes not only for available roof space, but also, and this is new, for uses. The drive to achieve network parity in many countries is fuelling development of self-consumption, firstly to meet electricity needs, and increasingly by making recourse to systems directly linked to an immersion heater or a thermodynamic hot water heater to meet domestic hot water needs.
Installers’ failure to recommend solar thermal in the individual family home renovation sector is compounding the situation. Installers often try to orient their customers towards cheaper, easier-to-install systems (which do not involve working on the roof). Energy labelling, which should be an asset for the solar thermal sector (as
solar thermal systems are the top scorers) also tends to be played down. This is despite the efforts made to raise installers’ awareness of energy labelling through the LabelPack A+ project coordinated by Solar Heat Europe and funded by the European Union’s Framework Programme for Research and Inno-vation, Horizon 2020.
NEWS FROM AROUND THE MAIN EUROPEAN MARKETS
The German market has contracted considerablyGermany stayed at the top of the EU solar thermal market ranks in 2017. According to AGEE-Stat, the Wor-king Group on Renewable Energy

Energy indicators
EUROBSERV !ER " THE STATE OF RENEWABLE ENERGIES IN EUROPE " #$%& EDITIONEUROBSERV !ER " THE STATE OF RENEWABLE ENERGIES IN EUROPE " #$%& EDITION
22 23
Annual installed surfaces in 2016 per type of collectors (in m2) and power equivalent (in!MWth) Annual installed surfaces in 2017* per type of collectors (in m2) and power equivalent (in MWth)
Glazed collectorsUnglazed collectors
Total (in m2)
Equivalent power
(MWth)Flat plate collectors Vacuum collectors
Germany 677!000 67!000 22!000 766!000 536.2
Denmark 478!297 478!297 334.8
Greece 271!400 600 272!000 190.4
Spain 214!000 214!000 149.8
Italy 186!647 25!043 211!690 148.2
France* 114!894 5!500 120!394 84.3
Poland 116!000 116!000 81.2
Austria 109!600 1!440 760 111!800 78.3
Portugal 55!000 55!000 38.5
Belgium 39!000 7!500 46!500 32.6
Czechia 22!000 9!000 31!000 21.7
Netherlands 20!137 5!179 2!621 27!937 19.6
Ireland 23!305 23!305 16.3
Croatia 19!000 2!500 21!500 15.1
Hungary 13!050 5!592 188 18!830 13.2
Cyprus 18!000 600 18!600 13.0
Romania 6!800 11!000 17!800 12.5
United Kingdom 17!000 17!000 11.9
Bulgaria 10!000 0 10!000 7.0
Slovakia 8!000 1!600 9!600 6.7
Finland 5!000 5!000 3.5
Luxembourg 3!759 3!759 2.6
Sweden 2!763 336 75 3!174 2.2
Slovenia 2!300 400 2!700 1.9
Lithuania 800 1!400 2!200 1.5
Estonia 1!000 1!000 2!000 1.4
Malta 2!000 2!000 1.4
Latvia 1!500 300 1!800 1.3
Total EU 28 2!438!252 140!490 31!144 2!609!886 1!827
* Including 38 739 m2 in overseas departments. Source: EurObserv’ER 2018
Glazed collectorsUnglazed collectors
Total (in m2)
Equivalent power
(in MWth)Flat plate collectors Vacuum collectors
Germany 573!000 57!000 20!000 650!000 455.0
Greece 312!840 3!160 316!000 221.2
Spain 190!666 7!187 3!652 201!505 141.1
Denmark 173!387 0 0 173!387 121.4
Italy 159!666 159!666 111.8
France** 114!591 5!500 120!091 84.1
Poland 115!000 115!000 80.5
Austria 99!770 1!060 630 101!460 71.0
Portugal 55!105 55!105 38.6
Belgium 30!200 5!200 0 35!400 24.8
Netherlands 21!150 6!162 2!621 29!933 21.0
United Kingdom 28!000 28!000 19.6
Bulgaria 24!000 24!000 16.8
Czechia 16!500 7!500 24!000 16.8
Slovakia 24!000 24!000 16.8
Croatia 22!700 22!700 15.9
Ireland 11!254 9!049 0 20!303 14.2
Cyprus 18!000 860 18!860 13.2
Romania 6!800 11!000 17!800 12.5
Hungary 12!000 5!000 180 17!180 12.0
Finland 5!000 5!000 3.5
Luxembourg 3!600 3!600 2.5
Sweden 2!867 341 3!208 2.2
Slovenia 2!300 400 2!700 1.9
Lithuania 800 1!400 2!200 1.5
Estonia* 1!000 1!000 2!000 1.4
Latvia 1!500 300 1!800 1.3
Malta 518 130 648 0.5
Total EU 28 2!026!214 116!749 32!583 2!175!546 1!522.9
* Estimate. ** Including 39 220 m2 in overseas departments. Source: EurObserv’ER 2018
21

Energy indicators
EUROBSERV !ER " THE STATE OF RENEWABLE ENERGIES IN EUROPE " #$%& EDITIONEUROBSERV !ER " THE STATE OF RENEWABLE ENERGIES IN EUROPE " #$%& EDITION
24 25
Cumulated capacity of solar thermal collectors* installed in the European Union in 2016 and 2017** (in m2 and in!MWth)
2016 2017
m2 MWth m2 MWth
Germany 19!122!000 13!385 19!109!000 13!376
Austria 5!288!813 3!702 5!271!743 3!690
Greece 4!477!000 3!134 4!596!000 3!217
Italy 3!891!000 2!724 4!050!666 2!835
Spain 3!796!000 2!657 3!997!000 2!798
France 3!005!947 2!104 3!094!442 2!166
Poland 2!016!000 1!411 2!131!000 1!492
Denmark 1!368!997 958 1!542!384 1!080
United Kingdom 1!400!000 980 1!428!000 1!000
Portugal 1!176!000 823 1!231!105 862
Cyprus 1!025!000 718 1!043!860 731
Belgium 721!000 505 750!600 525
Netherlands 652!000 456 649!000 454
Czechia 569!000 398 593!000 415
Sweden 475!000 333 472!000 330
Bulgaria 354!000 248 378!000 265
Ireland 343!251 240 311!216 218
Hungary 292!000 204 308!000 216
Slovenia 239!000 167 238!750 167
Croatia 204!000 143 226!700 159
Slovakia 177!000 124 201!000 141
Romania 174!000 122 189!000 132
Malta 72!000 50 72!250 51
Luxembourg 59!550 42 63!150 44
Finland 55!000 39 60!000 42
Latvia 22!720 16 24!520 17
Lithuania 17!950 13 20!150 14
Estonia 14!120 10 16!120 11
Total EU 28 51!008!348 35!706 52!068!656 36!448
* All technologies including unglazed collectors. ** Estimate. Source: EurObserv’ER 2018
According to Costas Travasores, executive secretary of the EBHE (the Greek Solar Industry Asso-ciation), the Greek market grew by 16.2% to 316 000 m2 in 2017 compared to 272 000 m2 in 2016. The EBHE ascribes this growth to the drop in the price of systems due to keen competition between players. Other factors are the increase in the number of distribu-tion networks as e-business builds up, along with the emergence of new private labels working with OEM partners and a slight impro-vement in the Greek economy.
The Spanish market sags According to the annual survey conducted by the Spanish Solar Thermal Association (ASIT), Spain installed 201 505 m2 of collectors in 2017 (equating to 141!MWth of thermal capacity). The figure is slightly (5%) lower than last year’s survey results. The installed base is put at 2 875!MWth, namely more than 4 million m2 in area.
Spain’s solar thermal market is closely linked to that of the new build market through the 2006 construction code (Technical Buil-ding Code) which made the ins-tallation of renewable hot water production systems obligatory in new buildings. The regulations pro-pelled the sector to new heights in 2007 (641 419 dwellings built) and 2008 (615 072 dwellings built) only to plummet when the Spanish pro-perty bubble burst, compounded by the global financial crisis.
A QUESTION MARK HANGS OVER SOLAR HEAT(S CONTRIBUTION The European market downturn observed since 2009 has deflected
the sector’s trajectory from the National Renewable Energy Action Plan (NREAP) targets. This decline begs the question of how solar heat’s contribution to Europe’s renewable energy targets can be kept up in the coming years, as older systems are decommis-sioned. The current market level is now very similar to 2003 (2.1 million m2). If proof of this trend is required, Austria, an erstwhile solar thermal pioneer with one of the highest equipment levels in Europe, saw solar heat’s contri-bution drop slightly in 2017 after stabilizing in 2016.
Nonetheless on paper, the inten-tions are clearly stated and likely to relaunch the sector in the next decade. The new European legis-lative package that defines the renewable energy trajectory to 2030 could encourage the mem-ber states to be much more proac-tive about solar heat. Article 23 of the new renewable energy directive states that each Mem-ber State must ensure that the renewable energy share of these
uses increases every year, to facili-tate the penetration of renewable energies in the heating and cooling sector. The indicative annual mean value adopted is 1.3 percentage points for the following periods: 2021–2025 and 2026–2030, star-ting from the baseline renewable energy share in the heat and cooling sector measured in 2020, expressed as the national share of final energy consumption.
Solar heat still has good prospects. Domestic hot water production in the collective sector has the most growth potential because of the huge reservoir of buildings requiring upgrading. Other growth opportunities such as solar hea-ting networks and solar industrial heat should gradually develop and give the sector more room for manoeuvre.
3Comparison of the current trend against the NREAP (National Renewable Energy Action Plans) roadmap (in!ktoe)
! ""# ! "$% ! &%'! #'#
2015 2016 2017 2020
& %&(
# )("
NREA
P
NREA
P
Source: EurObserv’ER 2018
4

Energy indicators
EUROBSERV !ER " THE STATE OF RENEWABLE ENERGIES IN EUROPE " #$%& EDITIONEUROBSERV !ER " THE STATE OF RENEWABLE ENERGIES IN EUROPE " #$%& EDITION
26 27
HYDROPOWER
Record rainfall deficit hit much of Europe in 2017. Hydropower
generated by natural water flow, i.e. that does not take into account the electricity produced by pum-ping, generated just over 300!TWh in 2017 (300.7!TWh) in the Euro-pean Union down from 351!TWh in 2016.
Only two of the major producer countries were spared, Sweden and Latvia. Sweden produced 3!TWh more than in 2016 with a total of 65.1! TWh, while Latvia produced an extra 1.9!TWh, with a total of 4.4!TWh in 2017.
The Southern and most westerly countries of Europe suffered the greatest losses. Spain’s output was almost halved (by 48.4%) drop-ping from 36.4 to 18.8!TWh, while Portuguese hydropower output dropped 62.5% (losing 9.8!TWh) to just 5.9!TWh. French output was cut by 10.9!TWh (by 17.9%) down to 50!TWh, Italy lost 6.2!TWh (14.7%) of output to reach 36.2!TWh and Greece lost 1.6! TWh (28.5%) to generate 4! TWh. Germany and
An
dr
itz
1Net capacity* of pure hydro plants, mixed hydro plants and pure pumped hydro plants in the European Union in 2016 and in 2017 (in MW)
2016 2017
Pure hydro
power
Mixed hydro
power
Pumped hydro
powerTotal
Pure hydro
power
Mixed hydro
power
Pumped hydro
powerTotal
France 18 487 5 407 1 728 25 621 18 560 5 418 1 728 25 706
Italy 14 991 3 325 3 982 22 298 15 109 3 377 3 940 22 426
Spain 14 053 2 690 3 337 20 080 14 052 2 690 3 337 20 079
Sweden 16 367 99 16 466 16 403 99 16 502
Austria 8 493 5 623 14 116 8 506 5 644 14 150
Germany 4 573 1 187 5 540 11 300 4 449 1 178 5 493 11 120
Portugal 4 458 2 502 6 960 4 462 2 764 7 226
Romania 6 377 265 92 6 734 6 328 272 92 6 692
United Kingdom 1 835 300 2 444 4 579 1 874 300 2 444 4 618
Greece 2 693 699 3 392 2 693 699 3 392
Bulgaria 2 210 149 864 3 223 2 359 149 864 3 372
Finland 3 250 3 250 3 272 3 272
Slovakia 1 608 916 2 524 1 607 916 2 523
Poland 596 376 1 413 2 385 591 376 1 423 2 390
Czechia 1 090 1 172 2 262 1 093 1 172 2 265
Croatia 1 912 293 2 205 1 913 293 2 206
Latvia 1 564 1 564 1 564 1 564
Belgium 115 1310 1 425 113 1 310 1 423
Slovenia 1 113 180 1 293 1 167 180 1 347
Luxembourg 34 1296 1 330 35 1 296 1 331
Lithuania 117 760 877 117 760 877
Ireland 237 292 529 237 292 529
Hungary 57 57 57 57
Netherlands 37 37 37 37
Denmark 9 9 9 9
Estonia 6 6 7 7
Total EU 28 106 283 22 915 25 326 154 523 106 613 23 260 25 247 155 119
* Net maximum electrical capacity. Source: Eurostat
Energy indicators
EUROBSERV !ER " THE STATE OF RENEWABLE ENERGIES IN EUROPE " #$%& EDITIONEUROBSERV !ER " THE STATE OF RENEWABLE ENERGIES IN EUROPE " #$%& EDITION
28 29
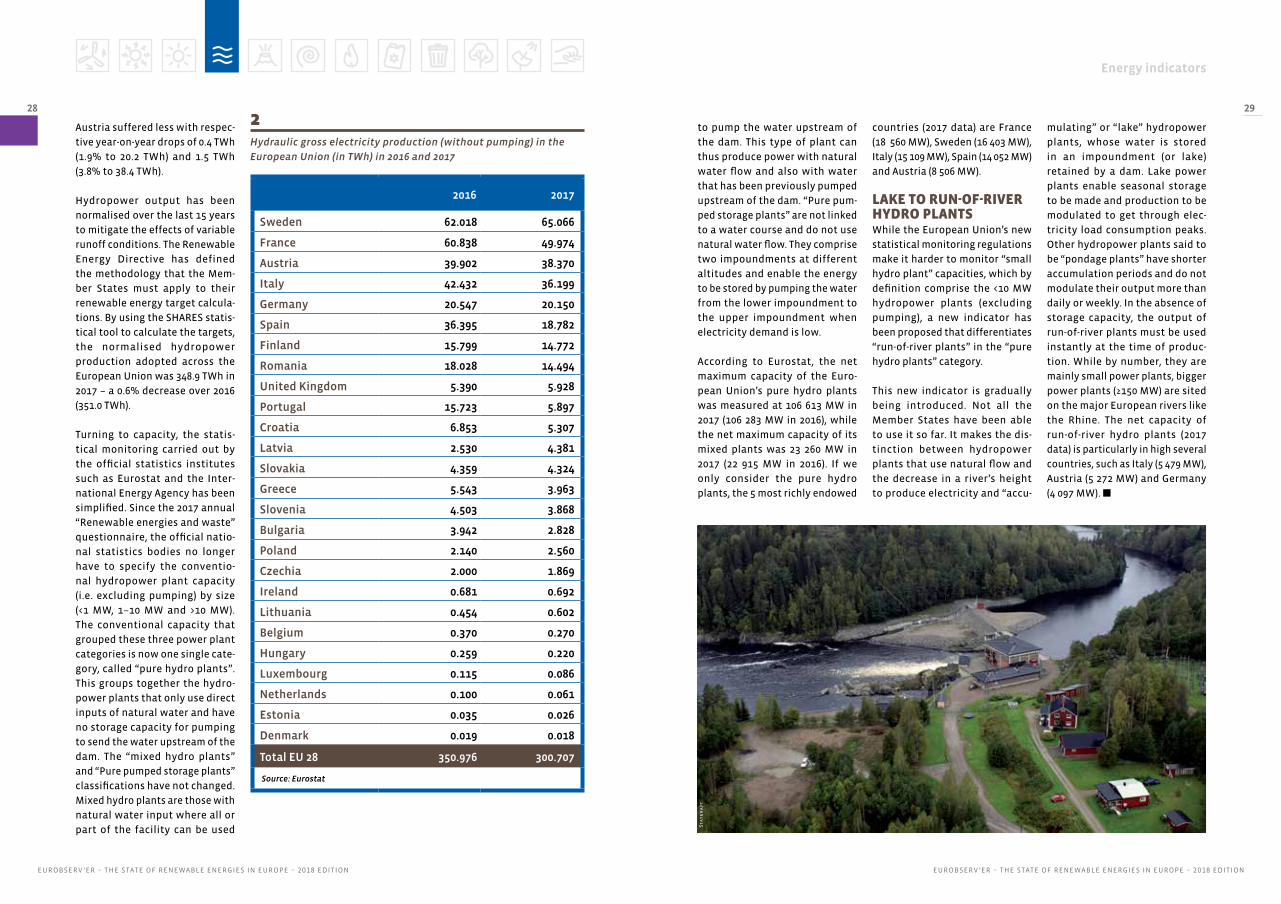
Hydraulic gross electricity production (without pumping) in the European Union (in!TWh) in 2016 and 2017
2016 2017
Sweden 62.018 65.066
France 60.838 49.974
Austria 39.902 38.370
Italy 42.432 36.199
Germany 20.547 20.150
Spain 36.395 18.782
Finland 15.799 14.772
Romania 18.028 14.494
United Kingdom 5.390 5.928
Portugal 15.723 5.897
Croatia 6.853 5.307
Latvia 2.530 4.381
Slovakia 4.359 4.324
Greece 5.543 3.963
Slovenia 4.503 3.868
Bulgaria 3.942 2.828
Poland 2.140 2.560
Czechia 2.000 1.869
Ireland 0.681 0.692
Lithuania 0.454 0.602
Belgium 0.370 0.270
Hungary 0.259 0.220
Luxembourg 0.115 0.086
Netherlands 0.100 0.061
Estonia 0.035 0.026
Denmark 0.019 0.018
Total EU 28 350.976 300.707
Source: Eurostat
Austria suffered less with respec-tive year-on-year drops of 0.4!TWh (1.9% to 20.2!TWh) and 1.5!TWh (3.8% to 38.4!TWh).
Hydropower output has been normalised over the last 15!years to mitigate the effects of variable runoff conditions. The Renewable Energy Directive has defined the methodology that the Mem-ber States must apply to their renewable energy target calcula-tions. By using the SHARES statis-tical tool to calculate the targets, the normalised hydropower production adopted across the European Union was 348.9!TWh in 2017 – a 0.6% decrease over 2016 (351.0!TWh).
Turning to capacity, the statis-tical monitoring carried out by the official statistics institutes such as Eurostat and the Inter-national Energy Agency has been simplified. Since the 2017 annual “Renewable energies and waste” questionnaire, the official natio-nal statistics bodies no longer have to specify the conventio-nal hydropower plant capacity (i.e. excluding pumping) by size (<1!MW, 1–10!MW and >10!MW). The conventional capacity that grouped these three power plant categories is now one single cate-gory, called “pure hydro plants”. This groups together the hydro-power plants that only use direct inputs of natural water and have no storage capacity for pumping to send the water upstream of the dam. The “mixed hydro plants” and “Pure pumped storage plants” classifications have not changed. Mixed hydro plants are those with natural water input where all or part of the facility can be used
to pump the water upstream of the dam. This type of plant can thus produce power with natural water flow and also with water that has been previously pumped upstream of the dam. “Pure pum-ped storage plants” are not linked to a water course and do not use natural water flow. They comprise two impoundments at different altitudes and enable the energy to be stored by pumping the water from the lower impoundment to the upper impoundment when electricity demand is low.
According to Eurostat, the net maximum capacity of the Euro-pean Union’s pure hydro plants was measured at 106 613!MW in 2017 (106!283!MW in 2016), while the net maximum capacity of its mixed plants was 23 260!MW in 2017 (22! 915!MW in 2016). If we only consider the pure hydro plants, the 5 most richly endowed
2
Stat
kraf
t
countries (2017 data) are France (18 !560!MW), Sweden (16!403!MW), Italy (15 109!MW), Spain (14!052!MW) and Austria (8!506!MW).
LAKE TO RUN%OF%RIVER HYDRO PLANTSWhile the European Union’s new statistical monitoring regulations make it harder to monitor “small hydro plant” capacities, which by definition comprise the <10!MW hydropower plants (excluding pumping), a new indicator has been proposed that differentiates “run-of-river plants” in the “pure hydro plants” category.
This new indicator is gradually being introduced. Not all the Member States have been able to use it so far. It makes the dis-tinction between hydropower plants that use natural flow and the decrease in a river’s height to produce electricity and “accu-
mulating” or “lake” hydropower plants, whose water is stored in an impoundment (or lake) retained by a dam. Lake power plants enable seasonal storage to be made and production to be modulated to get through elec-tricity load consumption peaks. Other hydropower plants said to be “pondage plants” have shorter accumulation periods and do not modulate their output more than daily or weekly. In the absence of storage capacity, the output of run-of-river plants must be used instantly at the time of produc-tion. While by number, they are mainly small power plants, bigger power plants (#150!MW) are sited on the major European rivers like the Rhine. The net capacity of run-of-river hydro plants (2017 data) is particularly in high several countries, such as Italy (5 479!MW), Austria (5 272!MW) and Germany (4!097!MW).

Energy indicators
EUROBSERV !ER " THE STATE OF RENEWABLE ENERGIES IN EUROPE " #$%& EDITIONEUROBSERV !ER " THE STATE OF RENEWABLE ENERGIES IN EUROPE " #$%& EDITION
30 31
This form of energy is hot water or steam drawn from the sub-
soil. It is used for producing heat, electricity or to deal with cooling needs. Geothermal techniques and uses vary in line with the aquifer temperature (groundwater) from which the water is drawn. When it is in the range 30–150° C (from a depth of a few hundred to approxi-mately 2 000 metres), geothermal heat can be used for district hea-ting (heating networks) or be sup-plied directly to heat dwellings. The use of one or more very high capacity heat pumps (HP) may be envisaged to improve the perfor-mance of a geothermal heating network. Heat pumps increase the temperature range that can be harnessed by the network and thus make optimum use of avai-lable geothermal energy.
When the aquifer temperature ranges from 90 to 150° C, electri-city can also be produced. In this case, the water drawn from the subsoil, transfers its heat to ano-ther liquid that vaporises at below 100° C. The steam obtained by this technique drives a turbine to generate electricity. These plants
GEOTHERMAL ENERGY
Capacity installed and net usable capacity of geothermal electricity plants in the EU in 2016 and 2017 (in!MWe)
2016 2017
Capacity installed
Net capacity
Capacity installed
Net capacity
Italy 915.5 767.0 915.5 767.2
Germany 38.0 29.0 38.0 32.0
Portugal 28.8 25.0 34.3 29.1
France* 17.1 15.5 17.1 15.9
Hungary 0.0 0.0 3.4 3.0
Austria 1.0 0.9 1.0 0.9
Romania 0.0 0.0 0.05 0.05
Total EU 28 1!000.4 837.4 1!009.3 848.2
*Net maximum electrical capacity. Source EurObserv’ER 2018 (Capacity installed), Eurostat (Net capacity)
1
can be run as combined heat and power plants producing heat for heating networks and power at the same time. Water drawn from depths of more than 1 500 metres above 150° C (up to 250°!C), reaches the surface as steam and can be used directly to drive electricity generating turbines. This is what is called high-energy geothermal
power and is found in volcanic regions and along plate boun-daries. Heat pump systems that extract the superficial heat from the soil and surface aquifers are dealt with specifically and by convention are excluded from official geothermal energy data.
EDF

Energy indicators
EUROBSERV !ER " THE STATE OF RENEWABLE ENERGIES IN EUROPE " #$%& EDITIONEUROBSERV !ER " THE STATE OF RENEWABLE ENERGIES IN EUROPE " #$%& EDITION
32 33
Capacity of geothermal district heating systems installed in the European Union in 2016 and 2017 (in!MWth)
2016 2017
France 493 509
Germany 336 336
Hungary 254 253
Italy 157 160
Netherlands 127 142
Romania 85 88
Poland 64 64
Austria 60 60
Sweden 48 44
Denmark 33 33
Croatia 20 20
Slovakia 16 16
Lithuania 14 14
Belgium 10 10
Czechia 7 8
Slovenia 4 4
United Kingdom 2 2
Total EU 28 1!730 1!763
Source: EGEC Market reports 2016 and 2017
3HEAT PRODUCTION There are many applications for geothermal heat. The main use is for heating dwellings and commercial premises. Other uses are possible, primarily in agriculture (heating greenhouses, drying crops, etc.), fish-farming, industrial processes and heating pools. Refrigeration is another area of use. Faced with so many solutions, accurate and regu-lar monitoring of the thermal capa-city by the official statistical bodies can be dogged by shortcomings. In its annual market survey (EGEC Geothermal market report) EGEC (the European Geothermal Energy Council), provides data on European geothermal heating network capa-cities. The report states that at the end of 2017 the thermal capacity of the EU’s geothermal heating networks was about 1! 763! MW distributed over 198 heating networks. Most of the year’s addi-tional capacity was installed in France, the Netherlands and Italy. France commissioned three new networks in 2017, all of them in the Greater Paris region. A new doublet (a doublet is a double borehole, the first to draw water and the second to re-inject it into the water table) has been added to the Blanc Mesnil (1!MW) urban network and another to the Dammarie-Les-Lys (9!MW) network. France also inaugurated the new urban heating network at Grigny (10!MW). The Netherlands, together with France, is one of the most active geothermal players. It commissioned two new heating networks… one at Venlo/Grubben-vorst (10.6!MW) and the other at Ard-warmte Vogelaer (10.2!MW), while The Piancastagnaio-Siena (4.4!MW) project was commissioned in Tus-cany, Italy for the “La Rota” indus-trial estate.
Geothermal heat output data is regularly monitored by the national statistics bodies and Eurostat. The official data, that amalgamates the heat distribu-ted by the networks and the heat used directly by final consumers, records 828.7! ktoe of output in 2017 (257.9!ktoe of derived heat and 570.8!ktoe of final energy consump-tion), which points to 6.5% growth over the twelve month period.
ELECTRICITY PRODUCTION The geothermal power capacity of all the European Union countries taken together is slowly increa-
sing. In 2017, 8.9!MW of new capa-city was installed taking the total to 1009.3!MW. Net capacity, which is the maximum usable capacity, is put at 848.2!MW (10.7!MW). Gross geothermal power output chan-ged very slightly (it was 0.3% less than in 2016) at 6.7!TWh. Lower output in Germany and Italy was made up for by the Portuguese and French increases. Italy dominates geothermal power production in the EU (6.2!TWh in 2017), and alone accounts for 92.3% of the total.
According to EurObserv’ER, two countries increased their geo-thermal power capacity in 2017.
Hungary commissioned its first geothermal plant in November 2017 to become the 6th European Union country with a geother-mal power sector. The Tura plant, owned by KS Orka, uses binary cycle technology and operates as a CHP plant with 3.35!MW of elec-trical capacity and 7!MW of ther-mal capacity. While the electrical part went on stream at the end of 2017, the plant will only start reco-vering heat once construction of the greenhouses due to be heated is completed in 2018. The project’s second phase is now being prepa-red and could eventually take the site’s power-generating capacity to more than 10!MW. Portugal also commissioned a plant in November 2017 – Pico Alto (an ORC type binary cycle plant) on Terceira Island in the autonomous region of the Azores. This 4.5!MW power plant is designed to produce 21!GWh of electricity per annum and cover 10% of the island’s electricity requi-rements.
THE SECTOR CALLS FOR THE REMOVAL OF BARRIERSWhile every year deep geothermal energy contributes more to mee-ting the climate targets, it falls far short of the trajectory planned in the national renewable energy action plans. The sector players complain that the dearth of public authority awareness of the tech-nology or commitment constitute a major barrier to broader deploy-ment of geothermal energy. They argue that a stable framework to provide project developers with security of investment must be set up if geothermal energy is
Gross electricity generation from geothermal energy in the European Union in 2016 and 2017 (in!GWh)
2016 2017
Italy 6 289.0 6 201.2
Portugal 172.0 216.7
Germany 175.0 163.0
France 97.6 133.1
Hungary 0.0 1.0
Austria 0.02 0.09
Total EU 28 6 733.6 6 715.0Source: Eurostat
2
Etao
Geo
Res
sou
rces

Energy indicators
EUROBSERV !ER " THE STATE OF RENEWABLE ENERGIES IN EUROPE " #$%& EDITIONEUROBSERV !ER " THE STATE OF RENEWABLE ENERGIES IN EUROPE " #$%& EDITION
34 35
Comparison of the current geothermal heat generation trend against the NREAP (National Renewable Energy Action Plan) roadmap (in!ktoe)
a framework suitable for ambi-tious geothermal development, that will galvanise its geother-mal industry into providing new renewable energy capacities.
In a joint statement sent to the European bodies and member countries in November 2018, the geothermal sector players also asked for stronger backing for research, development and inno-vation in geothermal energy, and the launching of a major European geothermal exploration cam-paign. Limited knowledge of the deep subsoil is viewed as a major barrier to the development of geo-thermal projects. They consider that the removal of these barriers is essential to enable the sector to make a meaningful contribution to the EU’s climate targets by the 2030 and 2050 timelines.
6
Source: EurObserv’ER 2018
Heat consumption from geothermal energy in the European Union in 2016 and 2017
4
ever to expand. This should be achieved through support pro-grammes, and suitable regulatory and operating conditions required by deep geothermal technologies. According to the EGEC, many projects launched will lead to a significant expansion in deep geothermal capacity for heating
and cooling, and also for power. However, these new additions will fall short of meeting the 2020 targets, because to do so implies increasing the deep geothermal capacity installed for heating and cooling almost four-fold and increasing installed geothermal power capacity by 50% within
the next two to three years. Fur-thermore, geothermal project lead times are fairly long. As a result, it is fairly unlikely that they will all be commissioned before 2020. Nevertheless, some countries can be quoted as positive examples. The Netherlands is one of the few EU Member States to have set up
2016 2017
Total heat consumption
of which final energy
consumption
of which derived
heat*
Total heat consumption
of which final energy
consumption
of which derived
heat*
France 145.2 40.2 105.0 170.1 40.2 130.0
Italy 144.1 124.7 19.3 149.8 130.8 18.9
Hungary 115.1 50.6 64.5 127.5 61.8 65.7
Germany 100.1 81.1 19.0 100.4 85.1 15.3
Netherlands 67.9 67.9 0.0 72.8 72.8 0.0
Slovenia 44.2 43.8 0.4 48.3 47.8 0.4
Bulgaria 34.6 34.6 0.0 34.6 34.6 0.0
Romania 31.7 25.6 6.1 32.5 26.2 6.3
Poland 22.2 22.2 0.0 22.6 22.6 0.0
Austria 21.2 7.2 14.0 21.7 7.5 14.1
Spain 18.8 18.8 0.0 18.8 18.8 0.0
Greece 10.1 10.1 0.0 8.8 8.8 0.0
Croatia 9.1 9.1 0.0 8.2 8.2 0.0
Slovakia 4.9 1.6 3.3 5.0 1.5 3.5
Denmark 2.7 0.0 2.7 1.8 0.0 1.8
Portugal 1.4 1.4 0.0 1.6 1.6 0.0
Cyprus 1.6 1.6 0.0 1.6 1.6 0.0
Belgium 1.6 0.0 1.6 1.5 0.0 1.5
United Kingdom 0.8 0.8 0.0 0.8 0.8 0.0
Lithuania 1.0 0.0 1.0 0.4 0.0 0.4
Total EU 28 778.2 541.1 237.0 828.7 570.8 257.9
* Essentially district heating (see Eurostat definition). Source: Eurostat
2015 2016 2017 2020
! !"# ! $%%.! ! $"# $ &&&$ %''
"& $&(
NREA
P NREA
P
2015 2016 2017 2020
!"#.$ $$%.# %#%.$
& #''& ()(
# !(#
NREA
P
NREA
P
Comparison of the current geothermal electricity generation trend against the NREAP (National Renewable Energy Action Plan) roadmap (in!GWh)
5
Source: EurObserv’ER 2018

Energy indicators
EUROBSERV !ER " THE STATE OF RENEWABLE ENERGIES IN EUROPE " #$%& EDITIONEUROBSERV !ER " THE STATE OF RENEWABLE ENERGIES IN EUROPE " #$%& EDITION
36 37
HEAT PUMPS
In order to understand heat pump (HP) market trends, you must first
be able to identify the various types of systems. There are three main HP families differentiated by the heat source used. Air-sour-ced heat pumps (ASHP) use the air (ambient, extracted or indoor) as their heat source. Ground-source heat pumps (GSHP) extract their heat from the ground while hydro-thermal HPs use heat from water (groundwater, rivers or lakes). EurObserv’ER amalgamates the hydrothermal family of HPs with ground-source HPs, in the interests of simplicity.
Heat from GSHPs is distributed via a heating circuit through underfloor heating or to low- or high-temperature radiators, the notion being that of water-based heat. ASHPs use various heat dis-tribution methods. Some of them, like GSHPs use water as the vector and are known as air-water HPs. Others use systems that blow out hot air and are known as air-air HPs. Almost all of these air-air systems work reversibly, and their cooling function often makes air-conditioning the main use for them
that the market was saturated after the sweltering summer of 2016 prompted a surge in sales (55.4%). The increase in summer comfort needs is now the main reversible air-air HP market driver in France, Spain and Portugal.
The air-water ASHP market speci-fically meets heating needs. Sales have steadily risen since 2013 and even accelerated in 2017 increa-sing by 18.3%, with more than 300!000!units sold (300 756 regis-tered in 21 EU countries), after already having increased by 13% in 2016.
EurObserv’ER found the 2017 geothermal HP market (which in our study includes hydrothermal HPs) to be stable (it slipped 0.6%). However, performance was pat-chy across Europe. The market perked up in the UK, Belgium and the Netherlands, finally stabilized in France, Austria and Sweden, but appears to be contracting in Finland and Denmark, where geothermal HPs are already well established.
compressor (the country’s electri-city system mix), the heat source used (ground, water, air), the mode used (heating versus cooling), the length of time used and the cli-mate zone where they are instal-led. The European Commission published a methodological guide in March 2013 to help the Member States measure the renewable energy production generated by their heat pump bases, that set out guidelines for calculating the renewable energy share produced by the various heat pump techno-logies in compliance with Article 5 of the 2009/28/EC directive.
THE HP MARKET FOR HEATING IS IN FINE FETTLEThe European heat pump sector for heating and cooling applica-tions has been based on strong markets for many years. According to EurObserv’ER, more than 3.5 mil-lion systems were sold in the Euro-pean Union in 2017, which is a 4.4% increase over 2016. Growth could have been very much better had it not been for the downturn in the Italian market, the main European market, whose volume is heavily
geared to cooling requirements. Approximately one third of the total sales were intended to cover heating requirements (1.1!million according to EHPA). The remai-ning two-thirds catered for coo-ling needs in warmer country climates (Italy, Spain, Portugal, and the South of France in particular). This ambivalence with regard to uses raises statistical comparison issues between the various EU markets, all the more so because reversible air-air HPs are used in heating mode in Northern Europe – in Sweden, Denmark and Finland.
Reversible air-air ASHPs still account for the majority of sales in the European market with 3.1 mil-lion systems sold in 2017, which is about 100 000 units more than in 2016 (3.3% growth). The only reason for the glitch in reversible air-air HP market growth is poorer perfor-mance by the Italian market (which slipped 7.2% on its 2016 sales). Given its size – 45% of the EU market for these HPs – this decline hit overall HP sales figures. Italy’s market is very specific in that in volume it is essentially geared to cooling needs. The reason for the decline may be V
iess
man
n W
erke
Gm
bH &
Co
in hot climate countries. Reversible air-air HPs dominate HP system sales in the EU. Their unit capacity is generally much lower than that of water-based HPs.
We should point out that the amount of renewable energy produced by heat pumps varies. Firstly, it depends on the auxiliary energy source used to run the

Energy indicators
EUROBSERV !ER " THE STATE OF RENEWABLE ENERGIES IN EUROPE " #$%& EDITIONEUROBSERV !ER " THE STATE OF RENEWABLE ENERGIES IN EUROPE " #$%& EDITION
38 39
RENEWABLE ENERGY PRODUCTION IN !"#$% #".& MTOEWhile the Eurostat SHARES tool used to monitor progress on the renewable energy targets does not provide a market indicator,
it does specify the capacity of national HP bases eligible for renewable energy production accounting in its detailed version. This data enables us to determine the amount of renewable energy delivered by HPs using the metho-
dology and criteria defined by the Renewable Energy Direc-tive. According to SHARES, this contribution was 10 467!ktoe in 2017, an increase of 537!ktoe over 2016. Therefore, HPs make a high contribution to the increase in
renewable heat across the Euro-pean Union. It is also the main renewable technology capable of meeting cooling needs.
Market of aerothermal heat pumps in 2016 and 2017* (number of units sold).
2016 2017
Sweden 22 843 22 641
Germany 20 789 20 170
Finland 8 491 7 986
Poland 5 390 5 660
Austria 5 228 5 230
Netherlands 4 065 4 806
France 3 095 3 100
United Kingdom 1 920 2 358
Denmark 2 248 2 143
Belgium 1 600 1 963
Estonia 1 750 1 750
Czechia 1 521 1 561
Italy 857 860
Lithuania 770 633
Slovenia 700 598
Ireland 371 291
Hungary 800 220
Slovakia 242 168
Luxembourg 116 116
Spain 77 95
Portugal 25 52
Bulgaria 0 0
Total EU 28 82 898 82 401
* Hydrothermal heat pumps included. ** Estimate. Source: EurObserv’ER 2018
Market of geothermal (ground source) heat pumps* in 2016 et 2017** (number of units sold)
1 2
2016 2017
Aerothermal HP
of which air-air HP
of which air-water HP
of which exhaust air
HP
Aerothermal HP
of which air-air HP
of which air-water HP
of which exhaust air
HP
Italy 1 541 200 1 511 400 29 800 0 1 440 000 1 403 000 37 000 0
Spain 792 088 781 116 10 972 0 912 378 901 406 10 972 0
France 446 745 372 270 74 475 0 487 090 405 390 81 700 0
Portugal 129 136 128 611 525 0 144 666 144 141 525 0
Sweden 78 413 55 000 8 099 15 314 81 355 55 000 9 035 17 320
Netherlands 69 797 58 618 11 179 0 80 026 60 168 19 858 0
Germany 60 970 0 48 501 12 469 71 138 0 57 638 13 500
Belgium 37 812 32 350 5 462 0 55 528 49 190 6 338 0
Finland 51 672 45 742 3 709 2 221 54 141 47 281 4 138 2 722
Denmark 25 209 21 396 3 784 29 41 793 35 504 6 125 164
United Kingdom 16 058 0 16 058 0 19 260 0 18 935 325
Poland 8 756 3 546 5 160 50 16 370 8 280 8 080 10
Estonia 15 010 13 700 1 280 30 15 010 13 700 1 280 30
Czechia 10 862 0 10 827 35 13 778 0 13 718 60
Austria 12 131 0 12 076 55 13 764 0 13 689 75
Ireland 4 457 0 4 398 59 4 457 0 4 398 59
Slovenia 5 200 0 5 200 0 3 200 0 3 200 0
Slovakia 1 888 158 1 730 0 2 554 306 2 248 0
Lithuania 890 0 890 0 1 498 0 1 474 24
Hungary 180 70 105 5 650 320 325 5
Luxembourg 80 0 80 0 80 0 80 0
Total EU 28 3 308 553 3 023 976 254 310 30 267 3 458 736 3 123 686 300 756 34 294
Note: Data from Italian, French and Portuguese aerothermal heat pump market are not directly comparable to others, because they include the heat pumps whose principal function is cooling. *Estimate. Source: EurObserv’ER 2018
THE ROUTE TO !"'" IS NOW MAPPED OUTMajor trends will contribute to a build-up of this technology for the next few years as regulatory and political signals encourage further electrification of heating needs.
The technological progress made over the last decade has opened up new growth opportunities. High-temperature heat pumps can now run efficiently when outdoor

Energy indicators
EUROBSERV !ER " THE STATE OF RENEWABLE ENERGIES IN EUROPE " #$%& EDITIONEUROBSERV !ER " THE STATE OF RENEWABLE ENERGIES IN EUROPE " #$%& EDITION
40 41
temperatures are sub-zero. As a result, they can be used in many more buildings and tackle the reno-vation market head-on.
Heat pumps also benefit from a winning combination as individual and collective solar photovoltaic self-consumption takes off. The possibility of generating one’s own power at lower cost than purcha-sing it from the grid has begun to influence the heating and domestic hot water market. As peaks in solar power production coincide directly with summer comfort needs, the move to solar photovoltaic power self-consumption is also a boon to the reversible ASHP market.
Article 23 of the new renewable energy directive 2018/2001 (Decem-ber 11, 2018) will have a direct impact on the HP sector’s deve-lopment trajectory. This article specifies that to help renewable energy enter the heating and coo-ling sector, each Member State must keep up an annual increase in the renewable energy share of these uses. The proposed indica-tive annual mean value adopted is 1.3 percentage points for the following periods: 2021–2025 and 2026–2030, starting from the baseline renewable energy share measured in 2020, expressed as the national share of final energy consumption.
Generally speaking, the new Euro-pean legislation that has been adopted sends an extremely posi-tive signal to heat pumps indus-trials. The route to 2030 is now mapped out and it is up to the heat pump sector to rise to the challenge of the European Union’s renewable energy ambitions.
2016 2017
Aerothermal heat pumps
Ground source heat
pumps
Total heat pumps
Aerothermal heat pumps
Ground source heat
pumps
Total heat pumps
Italy 19!045!000 14!220 19!059!220 19!520!000 14!200 19!534!200
France 5!085!653 151!770 5!237!423 5!572!743 154!870 5!727!613
Spain 2!289!432 1!293 2!290!725 3!201!810 1!388 3!203!198
Sweden 1!057!666 514!038 1!571!704 1!136!341 525!678 1!662!019
Germany 551!958 339!946 891!904 616!569 358!181 974!750
Finland 629!480 102!995 732!475 683!621 110!981 794!602
Portugal 384!080 857 384!937 528!746 909 529!655
Netherlands 316!899 50!943 367!842 393!922 54!846 448!768
Denmark 272!470 60!691 333!161 290!254 61!204 351!458
Bulgaria 214!971 4!272 219!243 214!971 4!272 219!243
Austria 79!065 99!547 178!612 92!808 103!120 195!928
United Kingdom 130!852 29!183 160!035 150!112 31!541 181!653
Belgium 91!938 9!374 101!312 147!466 11!337 158!803
Estonia 116!717 12!375 129!092 131!727 14!125 145!852
Poland 45!361 41!995 87!356 61!731 47!655 109!386
Czechia 54!975 23!149 78!124 68!753 24!710 93!463
Slovenia 24!900 10!050 34!950 27!900 10!648 38!548
Ireland 13!484 3!824 17!308 17!941 4!115 22!056
Slovakia 8!495 3!315 11!810 11!049 3!483 14!532
Lithuania 2!760 4!463 7!223 4!258 5!096 9!354
Hungary 5!400 1!310 6!710 6!050 1!530 7!580
Luxembourg 1!309 555 1!864 1!389 671 2!060
Total EU 28 30!422!864 1!480!165 31!903!029 32!880!160 1!544!560 34!424!720
Note: Data from italian, French and Portuguese aerothermal heat pump market are not directly comparable to others, because they include the heat pumps whose principal function is cooling. * Estimate. Source: EurObserv’ER 2018
Total number of heat pumps in operation in 2016 and 2017* Comparison of the current trend against the NREAP (National Re-newable Energy Action Plans) roadmap (in!ktoe)
2015 2016 2017 2020
! "#$! !%&
"& $#'
"( )&&
' (!(
"( (*)
NREA
P
NREA
P
3 4
Source: EurObserv’ER 2018
DR

Energy indicators
EUROBSERV !ER " THE STATE OF RENEWABLE ENERGIES IN EUROPE " #$%& EDITIONEUROBSERV !ER " THE STATE OF RENEWABLE ENERGIES IN EUROPE " #$%& EDITION
42 43
Methanization is a natural bio-logical process in which many
micro-organisms (bacteria) break down organic matter in an oxygen-free environment. Methanization biogas produced by anaerobic fer-mentation is classified as three sub-sectors along the lines of the origin and treatment of the waste. They are methanization of wastewater treatment plant sludge (“sewage sludge gas”), non-hazardous waste storage facility biogas (“landfill gas”) and the methanization of non-hazardous waste or raw plant matter (“other biogas”). A fourth biogas sector is also monitored in international nomenclatures. It is produced by applying a thermal treatment (“biogas from thermal treatments”), namely pyrolysis or gasification of solid biomass (wood, forest residue, solid and fer-mentable household waste). These processes produce hydrogen (H2) and carbon monoxide (CO), which when combined can be transfor-med into synthetic biogas to subs-titute natural gas (CH4). These processes have been identified in Finland, Spain, Denmark, Italy and Belgium, and new projects are underway, as in the Netherlands.
which equates to 8.8% growth. Final energy consumption (disre-garding the processing sector), is put at 3 million toe at the end of 2017 (3.4% more than in 2016).
Biogas can also be purified for conversion into biomethane, which is then used in the same way as natural gas – namely as electricity in CHP plants, or also
by natural gas vehicles (NGV) and alternatively can be injected into the natural gas grid. In recent years, biomethane injection has become a major outlet for the biogas market. The European Bio-methane Observatory reports that at the end of 2017, the European sector had at least 542 biomethane
BIOGAS
#(.) MILLION TOE PRODUCED IN THE EUROPEAN UNIONIn 2017, primary energy output from biogas in the European Union slightly rose (0,4% more than in 2016). According to Eurostat, it amounted to 16 812!ktoe compa-red to 16 742!ktoe in 2016. This out-come is in keeping with the slower growth displayed by the sector since 2011. Primary energy output growth has steadily declined ever since it peaked in 2011 (with a year-on-year rise of 21.9%). The introduc-tion of more stringent regulations governing the use of food crops (such as maize), limiting the capa-cities allocated to biogas tenders and much less attractive biogas electricity remuneration condi-tions accounts for the dwindling growth. While the general trend of the main producer countries is one of slowdown (the UK, Poland, Italy), and even lower output (Germany, Austria), biogas is still enjoying double-digit growth in four countries – Denmark (34.0%, at 389! ktoe), France (14.0%, at 899.5! ktoe) Finland (11.1%, at 124.5!ktoe) and Estonia (20.5%, at 12.9!ktoe). France increased its out-
put more than any other country in 2017 (by 110.7!ktoe). It had intro-duced a more lucrative remunera-tion system which is starting to pay off (feed-in tariff for biogas injection, higher feed-in tariff for small plants of <500 kW, tenders for >500-kw plants), yet still limits the food crop input allowed in pro-duction. Non-hazardous waste or raw plant matter methanization plants may have food or energy crop inputs, grown as a main crop provided the maximum annual pro-portion of raw tonnage feedstock per annum does not exceed 15%.
According to Eurostat, non-hazar-dous waste and raw plant matter methanization biogas (“other bio-gas”) now accounts three-quarters (75%) of biogas production (74.9% in 2016). This increase has been at the expense of landfill bio-gas (which fell from 16 to 15.4%). Sewage sludge biogas production rose slightly (from 8.2 to 8.3%) in 2017 while the thermal biogas share rose from 1.0 to 1.3%.
While primary energy output has not increased across the European Union, the same does
not apply to final energy output, which suggests fewer losses in the processing sector. According to Eurostat, biogas electricity output totalled 63.4!TWh in 2017 compared to 62.8!TWh in 2016, or a 1% increase. Its recovery as heat increased at a faster pace. Derived heat (from the processing sector) came to 757.2!ktoe by the end of 2017 (695.9!ktoe at the end of 2016),
Bio
con
stru
ct

Energy indicators
EUROBSERV !ER " THE STATE OF RENEWABLE ENERGIES IN EUROPE " #$%& EDITIONEUROBSERV !ER " THE STATE OF RENEWABLE ENERGIES IN EUROPE " #$%& EDITION
44 45
producing plants (528 in the Euro-pean Union, 35 in Switzerland and 9 in Norway). The vast majority of these plants inject biomethane directly into the grid.
Germany, with 203, had the highest number of plants at the end of the year, followed by Sweden (67) and the UK (85). Biomethane injection into the grid is growing steadily in France. According to the SDES (Monitoring and Statistics Direc-torate) trend charts, 44 plants were injecting into the gas grid at the end of 2017 for maximum annual production capacity of 696!GWh, compared to 67 plants on 30 September 2018, with maxi-mum annual production capacity of 1048!GWh. Sweden is a special case as only 27% of its plants inject into the grid, since most of the bio-methane produced is used in the country’s road transport. Accor-ding to Statistics Sweden, 111!ktoe of biomethane was used directly in transport in 2017 compared to 98.9 !ktoe in 2016.
THE '"*MTOE TARGET CAN BE ACHIEVED BY !"'"The main European biogas produ-cer countries’ decision to reduce or regulate the use of energy crops, has had a strong impact on the biogas sector’s growth scenarios. They are now more closely linked to optimized recovery of digestate rather than the increased use of energy crops, at least until 2030. In the long-term, rapid commit-ment to energy strategy choices will be required to set up a cli-mate neutral economy in line
1Primary energy production from biogas in the European Union in 2016 and 2017 (in!ktoe)
2016 2017
Landfill gasSewage
sludge gas
Other biogas from anaerobic
fermentation
Thermal biogas
Total Landfill gasSewage
sludge gas
Other biogas from anaerobic
fermentation
Thermal biogas
Total
Germany 83.5 464.3 7547.2 0.0 8095.0 132.0 460.4 7252.1 0.0 7844.6
United Kingdom 1400.8 303.4 938.7 0.0 2642.9 1277.1 311.6 1130.2 0.0 2718.9
Italy 365.5 53.1 1449.9 6.6 1875.1 349.8 53.5 1488.0 6.4 1897.7
France 290.1 25.4 473.3 0.0 788.8 311.1 27.4 561.0 0.0 899.5
Czechia 25.4 41.5 534.0 0.0 601.0 23.1 43.1 541.4 0.0 607.7
Netherlands 16.2 57.6 244.9 0.0 318.6 16.9 57.6 246.4 0.0 320.8
Austria 3.7 15.1 287.6 0.0 306.4 2.4 14.5 229.1 0.0 246.1
Denmark 4.7 25.2 186.2 74.2 290.3 4.7 26.3 235.5 122.5 389.0
Poland 57.6 119.8 83.7 0.0 261.1 48.0 115.0 117.5 0.0 280.6
Spain 138.6 62.1 20.5 23.9 245.2 149.9 64.7 22.8 23.9 261.4
Belgium 21.9 26.3 179.8 5.9 233.9 20.0 24.9 174.1 5.3 224.3
Sweden 6.7 75.6 91.2 0.0 173.5 4.7 78.6 94.6 0.0 177.8
Slovakia 11.9 10.6 129.4 0.0 151.8 9.9 12.5 130.1 0.0 152.5
Finland 22.8 15.1 25.0 49.3 112.1 20.9 16.1 31.4 56.1 124.5
Greece 72.5 16.6 12.6 0.0 101.7 68.8 16.1 22.2 0.0 107.1
Latvia 7.8 2.6 79.5 0.0 89.9 8.1 2.4 82.7 0.0 93.2
Hungary 18.4 23.2 46.9 0.0 88.6 15.1 29.0 47.9 0.0 91.9
Portugal 68.2 2.7 9.4 0.0 80.3 73.5 3.0 8.6 0.0 85.1
Bulgaria 0.1 0.2 59.7 0.0 60.0 0.0 2.8 44.0 0.0 46.8
Ireland 38.9 8.4 7.5 0.0 54.8 38.1 9.2 7.2 0.0 54.6
Croatia 5.3 3.5 37.9 0.0 46.6 5.0 3.5 55.3 0.0 63.8
Lithuania 8.5 7.5 16.0 0.0 32.0 5.1 7.2 19.9 0.0 32.2
Slovenia 3.7 2.2 24.3 0.0 30.2 1.9 2.1 21.8 0.0 25.7
Luxembourg 0.0 2.3 17.6 0.0 19.9 0.0 1.8 18.7 0.0 20.5
Romania 0.0 0.0 17.7 0.0 17.7 0.0 0.0 18.0 0.0 18.0
Cyprus 0.0 0.6 11.1 0.0 11.8 0.0 0.7 11.4 0.0 12.0
Estonia 7.2 3.5 0.0 0.0 10.7 9.5 3.4 0.0 0.0 12.9
Malta 0.0 0.0 1.9 0.0 1.9 0.0 0.0 2.3 0.0 2.3
Total EU 28 2679.9 1368.5 12533.3 159.9 16741.6 2595.5 1387.4 12614.4 214.3 16811.6
Source: Eurostat

Energy indicators
EUROBSERV !ER " THE STATE OF RENEWABLE ENERGIES IN EUROPE " #$%& EDITIONEUROBSERV !ER " THE STATE OF RENEWABLE ENERGIES IN EUROPE " #$%& EDITION
46 47
2Gross electricity production from biogas in the European Union in 2016 and 2017 (in!GWh)
3Gross heat production from biogas in the European Union in 2016 and in 2017* (in!ktoe) in the transfor-mation sector*
2016 2017
Electricity only plants
CHP plants TotalElectricity
only plantsCHP plants Total
Germany 9!223.1 24!480.4 33!703.5 7!911.0 25!968.0 33!879.0
Italy 3!073.2 5!185.5 8!258.7 2!961.1 5!338.0 8!299.1
United Kingdom 7!024.6 711.1 7!735.7 6!937.2 784.6 7!721.8
Czechia 49.2 2!539.8 2!589.0 41.3 2!598.0 2!639.3
France 661.2 1!306.7 1!967.9 382.3 1!709.2 2!091.5
Poland 0.0 1!027.6 1!027.6 0.0 1!096.4 1!096.4
Spain 726.0 180.1 906.0 742.0 199.0 941.0
Belgium 93.0 893.0 986.0 72.3 866.0 938.3
Netherlands 34.0 958.8 992.8 29.7 893.6 923.3
Denmark 0.8 565.4 566.1 1.0 685.1 686.0
Austria 597.3 68.5 665.9 562.7 67.4 630.1
Slovakia 114.0 462.0 576.0 86.0 508.0 594.0
Finland 222.3 174.6 396.8 231.6 179.6 411.2
Latvia 0.0 396.9 396.9 0.0 405.4 405.4
Hungary 90.2 243.1 333.3 88.0 246.0 334.0
Croatia 26.4 211.0 237.3 24.1 285.6 309.7
Greece 32.8 236.9 269.6 51.0 249.2 300.2
Portugal 267.8 16.7 284.6 269.6 16.9 286.5
Bulgaria 96.4 94.4 190.8 93.0 122.8 215.8
Ireland 160.9 44.2 205.1 155.0 42.6 197.7
Slovenia 2.3 139.8 142.1 1.1 129.0 130.1
Lithuania 0.0 122.7 122.7 0.0 127.2 127.2
Luxembourg 0.0 72.7 72.7 0.0 72.4 72.4
Romania 35.9 29.0 64.9 38.1 28.6 66.7
Cyprus 0.0 52.0 52.0 0.0 51.8 51.8
Estonia 0.0 45.0 45.0 0.0 41.8 41.8
Sweden 0.1 11.0 11.1 0.0 11.0 11.0
Malta 0.0 8.3 8.3 0.0 9.7 9.7
Total EU 28 22!531.4 40!277.2 62!808.7 20!678.1 42!732.9 63!411.0
Source: Eurostat
2016 2017
Heat only plants
CHP plants TotalHeat only
plantsCHP plants Total
Italy 0.2 207.8 208.0 0.1 225.9 226.0
Germany 68.8 153.8 222.5 60.0 154.7 214.7
Denmark 14.8 62.6 77.4 19.1 79.9 99.0
France 5.8 40.0 45.8 14.2 47.9 62.1
Latvia 0.0 22.7 22.7 0.0 23.9 23.9
Poland 0.3 13.8 14.1 0.3 21.0 21.3
Finland 7.0 12.9 19.8 6.0 15.1 21.2
Czechia 0.0 14.3 14.3 0.0 17.2 17.2
Slovakia 0.0 11.2 11.2 0.1 13.0 13.1
Sweden 3.1 3.5 6.5 7.1 3.3 10.4
Belgium 0.0 10.2 10.2 0.0 8.9 8.9
Croatia 0.0 6.8 6.8 0.0 7.8 7.8
Netherlands 0.0 6.5 6.5 0.0 6.4 6.4
Slovenia 0.0 6.6 6.6 0.0 5.3 5.3
Romania 0.4 3.5 3.9 1.6 3.3 4.9
Austria 1.6 4.2 5.9 1.2 2.5 3.7
Bulgaria 0.0 3.2 3.2 0.0 3.3 3.3
Luxembourg 0.0 2.0 2.0 0.0 2.0 2.0
Lithuania 0.0 2.2 2.2 0.0 2.0 2.0
Hungary 0.2 3.8 3.9 0.0 1.8 1.8
Cyprus 0.0 1.2 1.2 0.0 1.3 1.3
Estonia 0.0 0.6 0.6 0.0 0.6 0.6
Malta 0.0 0.2 0.2 0.0 0.4 0.4
Ireland 0.0 0.0 0.0 0.0 0.0 0.0
Greece 0.0 0.0 0.0 0.0 0.0 0.0
Spain 0.0 0.0 0.0 0.0 0.0 0.0
Portugal 0.0 0.0 0.0 0.0 0.0 0.0
United Kingdom 0.0 0.0 0.0 0.0 0.0 0.0
Total EU 28 102.1 593.8 695.9 109.7 647.5 757.2
* Corresponds to «Derived heat» (see Eurostat definition). Source: Eurostat

Energy indicators
EUROBSERV !ER " THE STATE OF RENEWABLE ENERGIES IN EUROPE " #$%& EDITIONEUROBSERV !ER " THE STATE OF RENEWABLE ENERGIES IN EUROPE " #$%& EDITION
48 49
with the Paris Agreement. The European Commission, at the request of the European Council, provided an initial response on 28 November 2018 in the form of a communiqué entitled “A Clean Planet for all”, along with an in-depth analysis “Depth analysis in Support of the Commission”. The Commission believes that achie-ving a climate neutral economy by 2050 is technologically, economi-cally and socially achievable, but will call for societal and economic sea changes within a single gene-ration. The Commission’s “In depth Analysis” puts forward eight sce-narios to enable the European Union to achieve its climate objec-tives. Each one has an important role to play for renewable gas. The Commission reckons that the contribution of methaniza-tion biogas could increase from 16!Mtoe in 2015 to 30 Mtoe by 2030 (including a small amount of “ther-mal” biogas), and according to the scenarios examined, could change by 2050 from 45 Mtoe (EE scenario) to 79 Mtoe (P2X scenario).
E-gas (biomethane produced by electrolysis), would add 91!Mtoe in 2050 and between 40 and 50 !Mtoe according to the other scenarios that have considered its widescale use. The various renewable gas industry players have expressed their willingness to help the European Commission turn these scenarios into reality. They highlight the benefits of gas distribution networks for smoo-thing out renewable electricity production fluctuations. They emphasize the technical ease and storage capacities of the gas distribution networks, the advan-tages of a hybrid energy infras-
tructure, based on stronger gas and electricity networks that in their view would form the back-bone of a completely carbon-free European energy system.
An
dre
Wip
ff /
Ag
riv
alo
r
5Comparison of the current trend of biogas heat consumption against the NREAP (National Renewable Energy Action Plans) roadmap (in!ktoe)
4Comparison of the current trend of electricity biogas generation against the NREAP (National Renewable Energy Action Plans) roadmap (in!GWh)
2015 2016 2017 2020
!" #$% !& '#( !$ )""!' ###
)) $#(
!$ %'*
NREA
P NREA
P
2015 2016 2017 2020
! "#$! $%& ! '("
$ #&&
( )$)
# &**
NREA
P
NREA
P
Source: EurObserv’ER 2018
Source: EurObserv’ER 2018

Energy indicators
EUROBSERV !ER " THE STATE OF RENEWABLE ENERGIES IN EUROPE " #$%& EDITIONEUROBSERV !ER " THE STATE OF RENEWABLE ENERGIES IN EUROPE " #$%& EDITION
50 51
The final settlement of the new renewable energy directive has
at last ended the uncertainty over biofuel’s future. Its deployment now has a more formal framework which should enable the sector to match the philosophy of the forth-coming climate-energy package, namely, to combat climate war-ming. Biofuel consumption figures in the transport sector reflect this expected outcome, for having been stable for several years, consump-tion picked up in 2017 (growing by 8.0%), to reach 15.4 Mtoe.
Time has been taken to reflect and consult on renewable ener-gy’s contribution in transport and the allowance made in that contribution for “agro-fuels” (produced from food crops). The new renewable energy directive 2018/2001 (RED II) dated 11 Decem-ber 2018 enshrines the sector’s development framework until at least 2030. By that timeline, each Member State must require fuel suppliers to supply a minimum of 14% share (minimum) of the final energy consumed in road and rail transport by 2030 as renewable energy according to its own indi-
cative trajectory. A clause provides for upgrading the target by 2023. It has been decided to maintain the contribution of agro-fuels, bio-diesel and bioethanol produced from feed crops capped at 7% for transport, which is the same level as it is for 2020 prescribed by the ILUC directive (2015/1513 directive) dated 9 September 2015. RED II has also set binding incorporation targets for advanced biofuels and biogas, not produced from food feedstocks, at a minimum of 0.2% in 2022, at least 1% in 2025 and at least 3.5% by 2030.
BIOFUEL CONSUMPTION INCREASES BY )+ IN THE EUWhile the biofuel roadmap to the 2030 timeline is now highly regula-ted, the current consumption level, and confirmation of the 7% cap for biofuel produced from feed crops, open up new outlets to the sector.
After increasing slightly in 2016, total consumption of both sus-tainably-certified and other bio-fuel, put on a real spurt in 2017. Consumption of all biofuels taken together increased by 8.0%
BIOFUELS
between 2016 and 2017 to reach 15 392.8!ktoe, which is 1 135.8!ktoe more than in 2016. All the main categories of biofuel profited. Of the two main types, it is biodiesel (which includes synthetic HVO biodiesel) whose consumption increased the most… by 991.8!ktoe or 8.6%. At the same time, bioetha-nol consumption only increased by 128.9!ktoe (4.9%). Biogas fuel consumption for NGVs (Natural Gas Vehicles), is recorded in five countries: Sweden, Germany, Fin-land, Austria and Denmark. This consumption also increased by 9.7% from 131.4! ktoe in 2016 to 150.4 !ktoe in 2017.
Sustainably-certified biofuel consumption, the only consump-tion eligible for inclusion in the directive’s renewable energy and transport target calculations, has been made public via the Eurostat SHARES tool that aims to harmonise calculation of the renewably-sour-ced energy share. The advantage of this tool is that all Member States must use exactly the same method to calculate the desired values.
Cro
pEn
erg
ies
AG

Energy indicators
EUROBSERV !ER " THE STATE OF RENEWABLE ENERGIES IN EUROPE " #$%& EDITIONEUROBSERV !ER " THE STATE OF RENEWABLE ENERGIES IN EUROPE " #$%& EDITION
52 53
Bioethanol Biodiesel Biogas fuelOther
biofuels*Total
consumption% compliant**
France 476.0 2!639.2 0.0 0.0 3!115.3 100%
Germany 744.9 1!808.8 31.8 2.2 2!587.7 98%
Sweden 109.3 1!268.6 98.9 0.0 1!476.7 100%
Spain 134.1 1!029.8 0.0 0.0 1!163.9 100%
Italy 32.5 1!008.5 0.0 0.0 1!041.0 100%
United Kingdom 386.4 630.2 0.0 0.0 1!016.5 100%
Austria 57.1 481.1 0.4 0.0 538.6 97%
Poland 167.7 289.8 0.0 0.0 457.4 100%
Belgium 43.1 391.0 0.0 0.0 434.1 100%
Czechia 48.4 252.7 0.0 0.0 301.1 100%
Portugal 26.3 231.2 0.0 2.2 259.7 100%
Romania 81.3 175.9 0.0 0.0 257.2 100%
Netherlands 120.6 123.8 0.0 0.0 244.4 97%
Denmark 0.0 235.6 0.1 0.0 235.7 100%
Hungary 43.8 142.1 0.0 0.0 185.9 100%
Finland 67.6 110.3 0.2 0.0 178.1 100%
Bulgaria 32.9 127.3 0.0 0.0 160.2 100%
Greece 0.0 149.5 0.0 0.0 149.5 33%
Slovakia 15.5 129.2 0.0 0.0 144.8 98%
Ireland 31.6 86.8 0.0 0.0 118.5 100%
Luxembourg 8.8 78.2 0.0 0.1 87.1 100%
Lithuania 6.4 50.1 0.0 0.0 56.5 100%
Slovenia 4.3 13.8 0.0 0.0 18.2 100%
Latvia 8.3 2.0 0.0 0.0 10.3 100%
Cyprus 0.0 8.8 0.0 0.0 8.8 99%
Malta 0.0 6.1 0.0 0.0 6.1 100%
Estonia 2.6 0.0 0.0 0.0 2.6 0%
Croatia 0.0 1.0 0.0 0.0 1.0 100%
Total EU 28 2!649.6 11!471.5 131.4 4.5 14!257.0 99%
* Pure used vegetable oil and unspecified biofuel. ** Compliant with Articles 17 and 18 of Directive 2009/28/EC. Source: EurObserv’ER 2018, Shares 2017 for % compliant
Bioethanol Biodiesel Biogas fuelOther
biofuels*Total
consumption% compliant**
France 537.3 2!797.7 0.0 0.0 3!335.0 100%
Germany 733.4 1!842.6 38.3 0.6 2!614.9 98%
Sweden 99.1 1!460.6 111.1 0.0 1!670.8 100%
Spain 138.0 1!231.5 0.0 0.0 1!369.5 100%
Italy 33.1 1!028.8 0.0 0.0 1!061.9 100%
United Kingdom 383.2 636.5 0.0 0.0 1!019.7 100%
Poland 176.2 428.7 0.0 0.0 604.9 100%
Austria 56.0 410.3 0.3 0.0 466.6 96%
Belgium 96.7 368.4 0.0 0.0 465.1 100%
Finland 80.7 311.0 0.3 0.0 392.1 99%
Czechia 59.3 254.5 0.0 0.0 313.8 100%
Netherlands 129.0 182.6 0.0 0.0 311.5 97%
Romania 91.1 206.1 0.0 0.0 297.2 100%
Portugal 3.1 239.0 0.0 0.0 242.1 100%
Denmark 0.0 218.2 0.3 0.0 218.5 100%
Greece 0.0 165.9 0.0 0.0 165.9 33%
Bulgaria 26.7 136.4 0.0 0.0 163.0 100%
Ireland 44.5 116.1 0.0 0.0 160.6 100%
Slovakia 19.6 129.9 0.0 0.0 149.5 100%
Hungary 40.0 108.0 0.0 0.0 148.0 100%
Luxembourg 6.7 103.5 0.0 0.0 110.3 100%
Lithuania 7.4 53.6 0.0 0.0 61.0 100%
Slovenia 8.6 15.7 0.0 0.0 24.3 99%
Latvia 7.9 1.2 0.0 0.0 9.2 100%
Cyprus 0.0 8.6 0.0 0.0 8.6 100%
Malta 0.0 7.4 0.0 0.0 7.4 100%
Estonia 1.0 0.0 0.0 0.0 1.0 0%
Croatia 0.2 0.3 0.0 0.0 0.5 100%
Total EU 28 2!778.6 12!463.2 150.4 0.6 15!392.8 99%
* Pure used vegetable oil and unspecified biofuel. ** Compliant with Articles 17 and 18 of Directive 2009/28/EC. Source: EurObserv’ER 2018, Shares 2017 for % compliant
Biofuels consumption for transport in the European Union in 2016 (in toe) Biofuels consumption for transport in the European Union in 2017 (in toe)
21

Energy indicators
EUROBSERV !ER " THE STATE OF RENEWABLE ENERGIES IN EUROPE " #$%& EDITIONEUROBSERV !ER " THE STATE OF RENEWABLE ENERGIES IN EUROPE " #$%& EDITION
54 55
Comparison of the current trend of biofuel consumption dedicated to transport against the NREAP (National Renewable Energy Action Plans) roadmap (in!ktoe)
2017 20202015 2016
!" ##$ !" #$%!$ &'&
!' (((!' )#'
#' )'%
NREA
P NREA
P
Source: EurObserv’ER 2018
It prevents irregularities arising from the various parameters and rules used by different calculation methods. According to SHARES, sustainably-certified biofuel consumption in transport came to 15 191.6!ktoe in 2017 (14!081.3!ktoe in 2016), which equates to an increase of 1!110.3!ktoe.
CONSUMPTION MAY WELL DOUBLE BY !"'"Consumption of conventional and advanced bioethanol and biodie-sel will continue to grow across the European Union, driven by the increase in the incorporation rates provided for by each Member
for Poland, 8.75% for Austria, 8.81% for Croatia, 10% for Greece, 10% for Italy, 10% for the Netherlands, 10% for Portugal, and 20% for Finland.
The annual GAIN Report data published by the USDA Foreign Agricultural Service concludes that the incorporation rate by energy content, excluding double accoun-ting, could reach 5.2% in 2018, i.e. a 3.6% share for bioethanol and a 5.8% share for biodiesel. The food crop biofuel share is put at 4.1%, whereas the ILUC Directive caps this at 7% for the 2020 timeline and the RED II directive applies the same cap in the longer term from
2021–2030. The theoretical poten-tial for conventional biofuels to improve is thus 2.9 percentage points by 2020. The blend and energy content share of advanced biofuels (not produced from food crops) is put at 1.2%, broken down as 1% from used cooking oil or ani-mal fat (listed in Part B of Annex IX of the RED II) and 0.2% from farming and forestry by-products, primarily from cellulosic raw materials (listed in Part A of the same annex).
The authors of the GAIN report adopted a forward-looking approach. By taking into account the historical records of EU fuel consumption and the European Commission’s projections for the use of fuels in transport (from its EU Reference Scenario 2016 Energy, transport and GHG emissions Trends to 2050 publication) and
combining them with the 7% cap, they suggest that the maximum potential consumption of biofuels produced from food crops could in theory reach 23 Mtoe in 2022 then drop to 21 Mtoe in 2030. These consumption levels are theoretical and likely to be downgraded in line with the various Member States’ policies. They also depend on the importance given by the various States to other energy sources that enable them to achieve the obligatory 14% share of renewable energy in transport, applying the various multiplying factors. These proposed multiplying factors are four for renewable energy used in electric vehicles, 1.5 for rail trans-port, 1.2 for biofuels used in air and maritime transport and two for advanced biofuels (Parts A and B). The RED II targets for advanced biofuels from Part A of the annex
(cellulosic biofuel) are 0.2% in 2020, which is the same as the current level. However, this share should rise to 3.5% by 2030, which will raise the consumption level closer to 10 Mtoe. The construction of a hundred or more celullosic biofuel plants each with 200 000 litres of capacity will be required to achieve this. Consumption of advanced bio-fuels produced from the raw mate-rial listed in Part B (used vegetable oils and animal fats) could rise to a little over 5 Mtoe by 2022 and sta-bilise at 5 Mtoe in 2030. Thus, the maximum theoretical output of all biofuels taken together could rise to 35 Mtoe by 2030, which is more than double the consumption measured in 2017. EurObserv’ER projects that the consumption of biofuels used in transport will be 30 Mtoe in 2030.
However, these projections are still largely theoretical, because while the intentions are positive, in practice the targets set for RED II are not binding on each indivi-dual Member State. The European Commission will have the prero-gative to verify that the Member States actually meet their commit-ments, so that the common target across the European Union is met by the combined total of their commitments. Country negotia-tions attest to the existence of a two-speed Europe split between those that are ready to step up their energy transition efforts and the Central European nations that intend to develop at their own pace. That is likely to produce a less ambitious common outcome and very certainly not enough to meet European commitments to limit the consequences of climate warming.
3
State. These rates are either set as energy content or incorporation volume and may or may not have specific targets for bioethanol and biodiesel. Most of the Mem-ber States have adopted double accounting for advanced biofuels as authorized by the European Directive (i.e. the possibility of applying a multiplying factor of 2 to consumption of this type of biofuel in the renewable energy target calculations for transport), thereby reducing the real incorpo-ration level. Examples of biofuel incorporation rates defined by indi-vidual countries as energy content for 2020 are: 8.5% for Spain, 8.5%
Jean
-Cla
ud
e M
osc
het
ti_A
lgo
Soli
s_C
NR
S P
ho
toth
equ
e

Energy indicators
EUROBSERV !ER " THE STATE OF RENEWABLE ENERGIES IN EUROPE " #$%& EDITIONEUROBSERV !ER " THE STATE OF RENEWABLE ENERGIES IN EUROPE " #$%& EDITION
56 57
In 2017, European Union primary energy output from renewable
municipal waste recovered by waste-to-energy incineration plants passed the symbolic thres-hold of 10 million tonnes oil equiva-lent (Mtoe). According to Eurostat, this output was 10 059.9!ktoe in 2017, which amounts to 2.5% growth (245.7!ktoe more than in 2016). These figures do not take into account all the energy reco-vered by these plants, but just the biodegradable part of the house-hold waste. The energy recovered from non-renewable household waste (plastic packaging, water bottles, etc.) is slightly lower. Trends vary across the Member States, for while the energy reco-vered from renewable household waste increased in most countries, 5 countries saw their output level fall (see table).
The sector has a natural advantage in that incineration plants tend to be sited near major conurbations that both supply the waste but that are also major energy consu-mers. This proximity makes for optimum, local use of the energy, be it as heat, electricity, or more
RENEWABLE MUNICIPAL WASTE
often than not the two simulta-neously through cogeneration. Thus, heat can be exported more easily to supply district heating systems or industrial sites in need of heat.
In 2017, electricity was the main energy recovery mode from incinerators. If we consider the renewable part of the waste only, incineration plants generated 22.2!TWh by the end of 2017, or nearly 975!GWh more than in 2016 (a 4.6% rise). The main recovery method used in these plants is cogeneration and the improved energy efficiency of incinerators constantly increases output, as demonstrated by the electricity output share which increased by 52.4% in 2015, by 53.4% in 2016 and by 56.2% in 2017.
The heat sold to heating networks also increased (by 4.1%) to 2!904.6!ktoe in 2017 (from 2!789.8!ktoe in 2016). The share of heat produced by cogeneration also increased, rising from 79.5% in 2015, to 80.0% in 2016 and 80.3% in 2017.
2016 2017
Germany 3!102.0 3!216.9France 1!369.7 1!390.9United Kingdom 820.1 886.6Italy 870.7 853.2Sweden 832.0 779.1Netherlands 793.6 764.3Denmark 450.2 467.7Belgium 370.6 375.1Finland 306.2 326.9Spain 235.2 259.7Austria 199.0 176.7Portugal 103.7 119.0Ireland 63.9 103.1Poland 61.0 92.5Czechia 85.5 92.0Hungary 66.1 46.1Bulgaria 28.9 32.2Lithuania 21.8 29.4Slovakia 19.5 28.5Luxembourg 12.6 14.1Latvia 0.0 3.7Romania 1.7 2.0Cyprus 0.2 0.5Total EU 28 9!814.2 10!059.9Source: Eurostat
Primary energy production of renewable municipal waste in the European Union in 2016 and 2017 (in!ktoe)
1
Ch
ris
toph
e M
ajan
i d
_In
gu
imbe
rt_V
eoli
a

Energy indicators
EUROBSERV !ER " THE STATE OF RENEWABLE ENERGIES IN EUROPE " #$%& EDITIONEUROBSERV !ER " THE STATE OF RENEWABLE ENERGIES IN EUROPE " #$%& EDITION
58 59
Urban waste-to-energy figures vary wildly within the EU. If we take primary energy output per inhabitant as our indicator, the Nordic countries are far and away the most heavily involved in reco-vering energy from their house-hold waste (81.4 toe/1 000 inhab. for Denmark, 77.9 toe/1!000 inhab.
for Sweden, and 59.4 toe/1 000 inhab. for Finland) and the Nether-lands (44.7 toe/1 000 inhab.).
The sector is much less advanced in countries like France (with 20.8!toe/1 000 inhab.), where many older-generation plants were not specifically designed to produce
energy but just to dispose of the waste by incineration. The Cen-tral European and some Southern EU countries like Spain have so far invested very little in recove-ring energy from their household waste, with ratios frequently below 10 toe/1 000 inhab.
The UK currently has one of the most active new incineration construction programmes unde-rway. According to the Depart-ment for Business, Energy & Industrial Strategy (BEIS), energy output from renewable household waste increased by 8.1% between 2016 and 2017 (886.6!ktoe in 2017) and by 71.9% compared to the 2014 output level. Most of this energy has been recovered as electricity, whose output stood at 3.4!TWh in 2017 (a 23.6% annual rise). The rea-
son for this strong growth is that several incinerators with energy recovery were commissioned during 2016 (including Teeside and Greatmore) and have now opera-ted throughout 2017. According to the BEIS, the nett electrical capa-city of the incineration plants rose from 930!MW in 2015, to 1028!MW in 2016 and 1 091!MW in 2017… and has more than doubled since 2012 (513!MW). British legislation is responsible for this trend, as the landfill tax has risen annually
since 1996. The levy applied rose from £ 86.10 per tonne on 1 April 2017 to £ 88.95 on 1 April 2018.
Energy recovery from renewable municipal waste has increased the most in Germany, where the additional 115! ktoe for the year resulted in total output of 3!217!ktoe in 2017. This particular increase has contributed to driving up heat sales to district heating
2016 2017
Electricity-only plants
CHP plants TotalElectricity- only plants
CHP plants Total
Germany 3!601.3 2!328.5 5!929.8 3!309.0 2!647.0 5!956.0
United Kingdom 1!892.3 847.4 2!739.8 1!949.2 1!436.4 3!385.6
Italy 1!217.8 1!197.6 2!415.4 1!160.1 1!223.6 2!383.6
France 1!177.2 1!005.8 2!183.0 1!236.8 1!025.0 2!261.8
Netherlands 0.0 2!005.1 2!005.1 0.0 1!903.7 1!903.7
Sweden 0.0 1!681.0 1!681.0 0.0 1!778.0 1!778.0
Belgium 452.0 497.0 949.0 473.9 498.3 972.2
Denmark 0.0 860.8 860.8 0.0 883.6 883.6
Spain 641.3 94.3 735.5 674.0 98.0 772.0
Finland 40.2 479.1 519.2 28.0 528.4 556.4
Portugal 304.8 0.0 304.8 360.3 0.0 360.3
Austria 250.4 82.8 333.2 247.9 70.2 318.1
Hungary 178.7 66.4 245.1 83.0 77.0 160.0
Ireland 75.8 0.0 75.8 150.7 0.0 150.7
Czechia 0.0 98.6 98.6 0.0 114.3 114.3
Poland 0.0 12.7 12.7 0.0 80.7 80.7
Lithuania 0.0 47.4 47.4 0.0 73.2 73.2
Luxembourg 42.2 0.0 42.2 46.9 0.0 46.9
Slovakia 0.0 26.0 26.0 0.0 22.0 22.0
Total EU 28 9!873.9 11!330.5 21!204.4 9!719.8 12!459.3 22!179.1Source: Eurostat
Gross electricity production from renewable municipal waste in the European Union in 2016 and 2017 (in!GWh)
2
Xav
ier
Sch
web
el /
Su
ez E
nvi
ron
nem
ent

Energy indicators
EUROBSERV !ER " THE STATE OF RENEWABLE ENERGIES IN EUROPE " #$%& EDITIONEUROBSERV !ER " THE STATE OF RENEWABLE ENERGIES IN EUROPE " #$%& EDITION
60 61
2016 2017Heat only
plantsCHP plants Total
Heat only plants
CHP plants Total
Germany 271.9 460.5 732.4 284.8 488.5 773.3
Sweden 56.3 509.8 566.1 56.4 528.0 584.4
France 147.4 279.5 427.0 149.1 285.4 434.5
Denmark 35.8 320.4 356.2 34.8 331.3 366.1
Netherlands 0.0 265.2 265.2 0.0 277.0 277.0
Finland 22.4 145.9 168.3 25.3 141.5 166.9
Italy 0.0 117.1 117.1 0.0 124.2 124.2
Austria 13.7 48.6 62.3 14.6 50.9 65.6
Czechia 0.0 35.9 35.9 0.0 40.6 40.6
Belgium 0.0 26.8 26.9 0.1 26.0 26.1
Lithuania 0.0 10.4 10.4 0.0 16.4 16.4
Poland 0.1 0.3 0.4 0.1 10.8 10.9
Hungary 0.0 12.1 12.1 0.0 10.9 10.9
United Kingdom 8.1 0.0 8.1 7.0 0.0 7.0
Slovakia 1.5 0.0 1.5 0.8 0.0 0.8
Romania 0.02 0.00 0.02 0.01 0.00 0.01
EU 28 557.2 2!232.6 2!789.8 573.0 2!331.6 2!904.6
* corresponds to «Derived heat» (see Eurostat definition). Source: Eurostat
Gross heat production from renewable municipal waste in the European Union in 2016 and in 2017 (in!ktoe) in the transformation sector*
3
networks. Heat from the proces-sing sector increased by 40.8!ktoe to 773.3!ktoe in 2017. Final energy consumption, namely direct heat consumption on production sites increased at the same time from 364 to 413.4!ktoe.
THE TARGETS ARE WELL ON THEIR WAY TO BEING METAll-in-all, the momentum for reco-vering energy from renewable municipal waste is positive. Increasing landfill taxes and the
ban on dumping organic waste in landfills, have stimulated the sector. This is borne out by the increase in primary energy output from 8.1 Mtoe in 2010 to 10 Mtoe in 2017.
If the framework directive on waste which has established a “ waste hierarchy” (prevention, preparation for reuse, recycling, recovery, disposal) is adhered to, an increasing share of recyclable waste will be deflected from the incineration plant chain (recycling
of cartons, paper, packaging, milk cartons, etc.). In time, regulations will only allow the biodegradable fraction of waste to be incinerated, either because it is unsuitable for recycling or quality composting – which applies to soiled cartons or because it is too complicated to recycle –e.g. multi-layer packaging. Nonetheless, there is significant growth potential across the Euro-pean Union. According to CEWEP, twelve Member States still bury most of their municipal waste. This has serious consequences for
GHG emissions such as methane and, in the case of poor manage-ment, generates potential leachate pollution, with the ensuing health problems. The association reckons that these countries will require financial support and aid from the European Union to achieve their targets.
Turning to the forecasts for 2020, CEWEP believes that the energy contribution from waste towards the renewable energy directive targets could realistically reach 67!TWh by 2020, with 25!TWh of electricity and 42!TWh (3.6 Mtoe) of heat. Total heat consumption (heat from the processing sector and final heat consumption) already stands
at 3.8 Mtoe (including 2.9 Mtoe of heat sold to heating networks). The down-to-earth CEWEP heat target for 2020 could easily be outstripped. The forthcoming commissioning of new incineration plants in the UK, coupled with the improvements to the energy efficiency of existing plants should also result in meeting the 25!TWh target for 2020.
EEW
En
erg
y fr
om
Was
te

Energy indicators
EUROBSERV !ER " THE STATE OF RENEWABLE ENERGIES IN EUROPE " #$%& EDITIONEUROBSERV !ER " THE STATE OF RENEWABLE ENERGIES IN EUROPE " #$%& EDITION
62 63
Solid biomass is an umbrella term for all solid organic com-
ponents to be used as fuels. They include wood, wood chips, timber industry by-products (offcuts, sawdust, etc.), black liquor from the paper industry, wood pellets, straw, bagasse, animal waste and other solid plant residues. Char-coal, which derives from solid biomass, has its own statistical processing, so it is excluded from the data we present. The same goes for renewable municipal waste which is also likened to solid bio-mass and recovered in incineration plants and is thus subject to speci-fic statistical processing.
Solid biomass energy consumption trends are at the mercy of public policies encouraging its use, but when we look at the heating appli-cation, it also correlates to outdoor temperatures, which were fairly mild in 2017. According to the World Meteorological Organization it was the 5th hottest year ever recorded in Europe, which restrained its increase in heating requirements in the European Union. Last year, 2018, was also very warm, the hottest ever recorded in several European
SOLID BIOMASS
gned to Italy (571!ktoe), the UK (423! ktoe), Denmark (401! ktoe), Finland (285!ktoe) and Germany (278!ktoe).
Primary energy production from solid biomass, exclusively sour-ced from European Union soil, increased at a slightly slower pace (1.3%) totalling 95 Mtoe (a 1.2 Mtoe increase between 2016 and 2017). Most of the difference, equating to net imports, can be put down to wood pellet imports from the USA and Canada. Over the last three years, the EU balance of net imports has been rising. It stood at 3.7 Mtoe in 2015, 4.1 Mtoe in 2016 and 4.8 Mtoe in 2017.
Final energy consumption equates to primary energy consumption minus all the energy losses along the industrial chain that converts the energy resources into energies used in final consumption, namely electricity and heat. Solid biomass heat is differentiated on the basis of whether it is directly used by the end user in heating appliances (boilers, stoves, inserts, etc.) or
countries including France, since the first temperature readings were taken in 1900. The succession of mild years and winters in Europe – a measurable consequence of cli-mate warming – effectively blurs out interpretation of the impact of the policies implemented to pro-mote the use of solid biomass in high-efficiency heating appliances.
Another element that needs to be taken into consideration is that in some of the Northern European countries where the forestry industry is a major eco-nomic player, the availability of solid biomass likely to be conver-ted into energy (wood offcuts, black liquors, forest residue) is also dependent on the European market needs for forestry pro-ducts (construction, grinding, fur-nishings, etc.). Part of the available quantity of biomass energy is thus linked to the activity level of the forestry industry, even though ano-ther part of the activity is totally dedicated to supplying biomass to the energy sector.
Lastly improvements in monitoring through new surveys, especially
surveys of household wood energy consumption, must also be taken into account when discussing trends and analysing the monito-ring of solid biomass consumption. It also needs to be said that in addi-tion to changing weather condi-tions, average wood consumption per dwelling is falling, particularly because of the improvements to wood-fired heating appliance per-formance and building insulation.
PRIMARY ENERGY CONSUMPTION APPROACHES THE !""#MTOE THRESHOLDAccording to Eurostat, primary solid biomass energy consumption remained just below the 100-Mtoe threshold in 2017. Consumption grew by 1.9% to reach 99.8 Mtoe, which equates to a 1.9-Mtoe increase. The individual member states present a mixed picture, as a few of them saw their solid biomass consumption contract slightly. They include Poland (by 329! ktoe), France, including the Overseas Territories (218! ktoe), Sweden (72! ktoe) and Hungary (39! ktoe). In contrast, the most significant increases can be assi- W
. Si
mli
ng
er

Energy indicators
EUROBSERV !ER " THE STATE OF RENEWABLE ENERGIES IN EUROPE " #$%& EDITIONEUROBSERV !ER " THE STATE OF RENEWABLE ENERGIES IN EUROPE " #$%& EDITION
64 65
2016 2017
Production Consumption Production Consumption
Germany 12.169 12.169 12.011 12.447
France 11.012 11.012 10.794 10.794
Sweden 9.402 9.419 9.316 9.347
Italy 7.232 8.441 7.826 9.013
Finland 8.334 8.358 8.611 8.643
United Kingdom 3.715 6.245 4.253 6.668
Poland 6.415 6.620 6.161 6.291
Spain 5.327 5.327 5.473 5.473
Austria 4.457 4.555 4.593 4.590
Romania 3.579 3.607 3.564 3.639
Denmark 1.693 2.816 1.727 3.216
Czechia 2.970 2.906 2.997 2.962
Portugal 2.605 2.402 2.619 2.421
Hungary 2.402 2.413 2.360 2.374
Belgium 1.285 2.051 1.202 2.038
Latvia 2.076 1.300 2.040 1.428
Netherlands 1.366 1.209 1.434 1.264
Lithuania 1.203 1.209 1.306 1.263
Croatia 1.531 1.253 1.543 1.241
Bulgaria 1.121 1.057 1.123 1.066
Estonia 1.396 0.898 1.487 0.984
Greece 0.797 0.855 0.809 0.862
Slovakia 0.835 0.826 0.841 0.827
Slovenia 0.609 0.609 0.592 0.592
Ireland 0.227 0.270 0.246 0.275
Luxembourg 0.063 0.069 0.077 0.084
Cyprus 0.009 0.010 0.010 0.012
Malta 0.000 0.001 0.000 0.001
Total EU 28 93.830 97.906 95.015 99.815* Excluding charcoal. Source: EurObserv’ER 2018
2016 2017
Electricity- only plants
CHP plants
Total Electricity- only plants
CHP plants
Total
United Kingdom 19.589 0.000 19.589 20.763 0.000 20.763
Finland 1.004 9.599 10.603 0.918 9.973 10.890
Germany 4.775 6.019 10.794 4.602 6.055 10.657
Sweden 0.000 9.750 9.750 0.000 10.250 10.250
Poland 2.052 4.861 6.913 1.415 3.893 5.309
Denmark 0.000 3.486 3.486 0.000 4.798 4.798
Spain 3.212 0.836 4.048 3.458 0.907 4.365
Italy 2.226 1.899 4.125 2.198 2.033 4.232
Belgium 2.156 1.315 3.471 2.491 1.326 3.816
Austria 0.875 2.816 3.691 0.877 2.816 3.692
France 0.419 3.032 3.450 0.419 2.922 3.341
Portugal 0.760 1.721 2.481 0.799 1.775 2.573
Czechia 0.014 2.053 2.068 0.004 2.209 2.213
Netherlands 1.116 0.791 1.907 1.099 0.674 1.772
Hungary 0.827 0.666 1.493 0.955 0.691 1.646
Slovakia 0.003 1.126 1.129 0.000 1.080 1.080
Estonia 0.127 0.713 0.840 0.140 0.856 0.996
Latvia 0.000 0.427 0.427 0.000 0.525 0.525
Romania 0.077 0.388 0.466 0.064 0.395 0.458
Ireland 0.379 0.016 0.395 0.366 0.016 0.381
Lithuania 0.000 0.269 0.269 0.000 0.303 0.303
Croatia 0.000 0.194 0.194 0.000 0.216 0.216
Bulgaria 0.003 0.160 0.163 0.014 0.167 0.180
Slovenia 0.000 0.137 0.137 0.000 0.155 0.155
Luxembourg 0.000 0.025 0.025 0.000 0.052 0.052
Greece 0.005 0.000 0.005 0.010 0.000 0.010
Total EU 28 39.619 52.300 91.918 40.590 54.086 94.675* Excluding charcoal. Source: Eurostat
Primary energy production and gross inland consumption of solid biomass* in the European Union in 2016 and 2017 (in Mtoe)
Gross electricity production from solid biomass* in the European Union in 2016 and 2017 (in!TWh)
21

Energy indicators
EUROBSERV !ER " THE STATE OF RENEWABLE ENERGIES IN EUROPE " #$%& EDITIONEUROBSERV !ER " THE STATE OF RENEWABLE ENERGIES IN EUROPE " #$%& EDITION
66 67
2016 2017
Heat only plants
CHP plants
Total Heat only plants
CHP plants
Total
Sweden 0.711 1.765 2.477 0.709 1.808 2.518
Finland 0.668 1.092 1.760 0.711 0.995 1.706
Denmark 0.473 0.666 1.139 0.478 0.878 1.356
France 0.533 0.498 1.031 0.569 0.555 1.124
Austria 0.543 0.341 0.884 0.547 0.360 0.908
Germany 0.216 0.400 0.616 0.208 0.401 0.609
Lithuania 0.392 0.096 0.488 0.422 0.124 0.545
Italy 0.078 0.464 0.542 0.078 0.466 0.544
Estonia 0.157 0.150 0.308 0.165 0.132 0.296
Latvia 0.114 0.137 0.251 0.145 0.147 0.292
Poland 0.048 0.271 0.319 0.054 0.225 0.279
Czechia 0.023 0.138 0.161 0.032 0.139 0.171
Slovakia 0.048 0.077 0.125 0.049 0.083 0.133
Hungary 0.056 0.068 0.124 0.048 0.064 0.112
Netherlands 0.027 0.022 0.049 0.024 0.077 0.101
United Kingdom 0.080 0.000 0.080 0.086 0.000 0.086
Romania 0.031 0.041 0.072 0.018 0.047 0.065
Croatia 0.000 0.022 0.022 0.000 0.036 0.036
Slovenia 0.009 0.019 0.028 0.011 0.020 0.030
Luxembourg 0.004 0.009 0.013 0.004 0.019 0.024
Bulgaria 0.006 0.009 0.015 0.004 0.010 0.014
Belgium 0.000 0.006 0.006 0.000 0.007 0.007
Total EU 28 4.218 6.292 10.510 4.362 6.593 10.955* Excluding charcoal. ** Correspond to “Derived heat” (see Eurostat definition). Source: Eurostat
Gross heat production from solid biomass* in the European Union in 2016 and in 2017 (in Mtoe) in the transformation sector**
3whether it is derived heat from the processing sector (from biomass boiler houses and biomass units operating in combined heat and power plants (CHP). Eurostat’s data records an 1.6% increase (1.1 Mtoe) in the amount of heat consumed directly used by end users compa-red to 2016 by reaching 69.4 Mtoe in 2017. Gross solid biomass heat output sold to heating networks increased by 4.2% (by 445!ktoe), driven by increased heating needs. It reached 11 Mtoe in 2017, 60.2% of which was supplied by CHP plants. If we add these two elements together, total final biomass heat energy consumption increased by 2.0% between 2016 and 2017 to 80.3!Mtoe – an additional 1.6 Mtoe).
European Union production of solid biomass electricity is less vulne-rable to the vagaries of climate. It depends more on the policies of the few member states that promote its use instead of coal. Across the European Union, biomass electri-city production increased by 3.0% year-on-year to 94.7!TWh in 2017 (adding 2.8!TWh). Most of this figure can be attributed to the growth in solid biomass’ net maximum electri-cal capacity in the major producer countries. Electrical capacity in the UK, reached 3 191!MW at the end of 2017 (196!MW more than in 2016), that of Finland 1 966!MW (219!MW more) and Denmark 1 504! MW (472.6!MW more). Higher output in the other countries can be ascribed to better use of existing capacities. Examples of this are Sweden and Belgium whose solid biomass elec-trical capacities at the end of 2017 were 3 706!MW and 559!MW respec-tively. Four countries stand out as the clear leaders in the solid bio-mass electricity producer country
rankings – the UK (20.8!TWh in 2017, 1.2!TWh more than in 2016), Sweden (10.3!TWh, 0.5!TWh more), Finland (10.9!TWh, 0.3!TWh more), and Ger-many (10.7!TWh, 0.1!TWh less). Taken together, the four account for 55.7% of the European Union’s solid bio-mass electricity output in 2017. Across the European Union (EU of 28), cogeneration plants produce more than half (57.1% in 2017) of its solid biomass electricity. If we exclude the UK, the proportion is 73.2%.
ELECTRICITY PRODUCTION SHOULD SPEED UP BY $"$"Many states have put solid bio-mass at the centre of their national renewable energy action plan stra-tegy and more generally in their climate warming control strategy, because of its available potential and technical capacity to replace fossil fuels for producing heat and electricity.
The EurObserv’ER forecasts put the input of biomass heat at 90 Mtoe by the 2020 timeline, breaking it down as 86 Mtoe from solid bio-mass and 4 Mtoe from renewable municipal waste. If biogas and
liquid biomass heat are added to the equation, EurObserv’ER puts the combined biomass heat contri-bution at 95 Mtoe by 2020.
Turning to power, the solid bio-mass sector will also benefit from the conversion of Danish coal-fired power plants, the spread of biomass cogeneration in Sweden (an additional 500!MW is expected by 2023 according to the IEA) and the expected boom in biomass co-firing in the Netherlands (e.g. the Amer and Eemshaven plants). In the Netherlands, several large biomass co-firing projects in exis-ting coal-fired plants have been awarded SDE+ subsidies. Output should be 7!TWh per annum by 2020. The UK, whose effective exit from the EU is due on 1 January 2021, following a transition period com-mencing on 29 March 2019, should also increase its bioenergy capacity by 2.1!GW by 2023. A sizeable part of this additional capacity will be up and running before 2020. These ele-ments indicate that solid biomass electricity production should grow very significantly in the next three years. EurObserv’ER believes that
Han
s Ek
esta
ng
/ S
tock
ho
lm E
xerg
i

Energy indicators
EUROBSERV !ER " THE STATE OF RENEWABLE ENERGIES IN EUROPE " #$%& EDITIONEUROBSERV !ER " THE STATE OF RENEWABLE ENERGIES IN EUROPE " #$%& EDITION
68 69
2016of which
final energy consumption
of which derived
heat**2017
of which final energy
consumption
of which derived
heat**
Germany 9.566 8.949 0.616 9.853 9.244 0.609
France 9.965 8.934 1.031 9.777 8.653 1.124
Sweden 7.852 5.376 2.477 7.792 5.275 2.518
Italy 7.123 6.582 0.542 7.716 7.173 0.544
Finland 6.922 5.162 1.760 7.048 5.342 1.706
Poland 5.170 4.851 0.319 5.222 4.943 0.279
Spain 4.005 4.005 0.000 4.059 4.059 0.000
Austria 3.839 2.955 0.884 3.934 3.027 0.908
Romania 3.465 3.393 0.072 3.512 3.447 0.065
United Kingdom 2.888 2.808 0.080 3.002 2.917 0.086
Denmark 2.367 1.228 1.139 2.626 1.270 1.356
Czechia 2.438 2.278 0.161 2.446 2.275 0.171
Hungary 2.015 1.891 0.124 1.932 1.820 0.112
Portugal 1.773 1.773 0.000 1.772 1.772 0.000
Belgium 1.317 1.310 0.006 1.267 1.261 0.007
Latvia 1.121 0.870 0.251 1.232 0.940 0.292
Croatia 1.171 1.149 0.022 1.160 1.124 0.036
Lithuania 1.110 0.621 0.488 1.157 0.612 0.545
Bulgaria 1.007 0.993 0.015 1.037 1.023 0.014
Greece 0.849 0.849 0.000 0.857 0.857 0.000
Netherlands 0.712 0.662 0.049 0.820 0.719 0.101
Estonia 0.711 0.404 0.308 0.716 0.420 0.296
Slovenia 0.585 0.556 0.028 0.562 0.531 0.030
Slovakia 0.513 0.388 0.125 0.527 0.394 0.133
Ireland 0.190 0.190 0.000 0.197 0.197 0.000
Luxembourg 0.063 0.050 0.013 0.072 0.048 0.024
Cyprus 0.006 0.006 0.000 0.008 0.008 0.000
Malta 0.001 0.001 0.000 0.001 0.001 0.000
Total EU 28 78.744 68.234 10.510 80.306 69.351 10.955
* Excluding charcoal. ** Essentially district heating (see Eurostat definition). Source: Eurostat
Heat consumption from solid biomass* in the European Union in 2016 and 2017
4Comparison of the current trend of electricty production from solid biomass against the NREAP (National Renewable Energy Action Plan) roadmap (in!TWh)
2015 2016 2017 2020
!!!." !!#.! !!$.%!#&
!!'."
!'(.)
NREA
P NREA
P
2015 2016 2017 2020
!".! #$.% #&.'"(.(
)).$
#'.(
NREA
P
NREA
P
This data includes an estimate of renewable electricity from municipal waste incineration plants. Source: EurObserv’ER 2018
5
This data includes an estimate of renewable heat from municipal waste incineration plants. Source: EurObserv’ER 2018
Comparison of the current trend of heat consumption from solid biomass against the NREAP (National Renewable Energy Action Plan) roadmap (in Mtoe)
6
if the renewable municipal waste recovered in incineration plants as electricity is included, it could exceed 130!TWh in 2020.
Rapid growth in the number of large-scale biomass power plants also raises the issue of raw mate-rial procurement. It is vital that bio-mass needs are met responsibly and sustainably. The new renewable energies directive enforces sustai-nability requirements on biomass feedstocks to be included in the renewable energy share calcula-tions of gross final energy consump-tion. The 6th and 7th paragraphs of Article 29 of the directive detail the criteria that must be met to reduce the risk of being produced in a non-sustainable manner. Biomass fuel derived from forestry work must come from countries that have implemented legislation that gua-rantees the lawfulness of forest operations, forest regeneration, and the maintenance or improve-ment of its capacity to produce biomass, the protection of classi-fied areas under international or national law, the preservation of soil quality and biodiversity. Bio-mass fuels from forestry work must also fulfil land use, land-use change and forestry (LULUCF) criteria. In particular, they must be sourced from a signatory state to the Paris Agreements, that has made a defi-ned national contribution to the United Nations Framework Conven-tion on climate change and whose legislation or regulations guarantee that the emissions generated by the LULUCF sector do not exceed its emission reductions. The Com-mission has to decide how proof of compliance with these sustainabi-lity criteria will be demonstrated no later than 31 January 2021.

Energy indicators
EUROBSERV !ER " THE STATE OF RENEWABLE ENERGIES IN EUROPE " #$%& EDITIONEUROBSERV !ER " THE STATE OF RENEWABLE ENERGIES IN EUROPE " #$%& EDITION
70 71
Concentrated Solar Power plants include all the technologies
that convert the energy from the sun’s rays into very high-tempera-ture heat and recover it as electri-city or heat. The technologies used are tower plants where heliostats concentrate the radiation on a collector at the top of the tower, plants that use Fresnel collectors where rows of flat mirrors concen-trate the radiation on a tube-sha-ped collector, parabolic trough collectors that concentrate the rays on a tube and parabolic col-lectors where a parabolic mirror reflects the sun’s rays onto a convergence point.
% "&'(MW OF CSP CAPACITY IN THE WORLDMost of the current development work on CSP plants is going on in China, Australia, South Africa, the Gulf States and the Maghreb, whose sunshine conditions are particularly suitable for this appli-cation. According to the Protermo-solar website, the global capacity of these plants was put at 5 079!MW at the end of 2018 (4 879!MW at the end of 2017). Two facilities were
commissioned in 2017 – the Xina Solar One plant (100!MW) in South Africa and the Agua Prieta plant in Mexico (12!MW). In 2018, three new plants came on stream – Waad Al Shamal ISCC Plant in Saudi Arabia (50!MW), Kathu Solar Park (100!MW) in South Africa and the Delingha plant (50! MW) in China. Many more plants are currently under construction and should result in a significant increase in installed global capacity from 2019 onwards.
$ )!*(MW IN THE EUROPEAN UNION The market slowed down substan-tially after a spate of installations concentrated in Spain between 2007 and 2014. At the end of 2017, the European Union capacity level inched up when the Ottana plant (0.6!MW) in Sardinia went on-grid. This took the EU’s instal-led thermodynamic solar capacity to 2!314.3!MW including pilot pro-jects and demonstrators, but 2018 saw no new developments. The eLLO plant in the French Eastern Pyrenees has been running since the end of October 2018 (when the collector field started up). Howe-ver, it will not be connected to the
put, which has remained upwards of 5!TWh, without any operating problems. Eurostat says that out-put rose to 5 883!GWh in 2017, from 5 579.2!GWh in 2016 and 5 93.2!GWh in 2015. Protermosolar claims that, Spain’s current CSP capacity can cover peaks of up to 10% of the country’s electricity needs. Its mean input is around 8% in the summer. The Spanish situation is unlikely to change over the next few years. Despite the end of the moratorium, Spain’s tenders for new “technologically neutral” renewable energy projects since 2017 have forced CSP to take a backseat vis-à-vis competitive technologies such as solar photo-voltaic.
COMMISSIONING IN FRANCE MIS#TIMEDThe eLLO project at Llo in the eas-tern Pyrenees, will be the first Fresnel-type plant to have a sto-rage system. The site has been ready since the end of 2018 when the solar field was commissioned, and the heat storage system was installed. It will only be included
CONCENTRATED SOLAR POWER
Ian
Wil
son
/ C
siro
power grid and therefore will not be included in the statistics until 2019. Four bigger projects (Sole-caldo 41! MW at Aidone, Sicily, Reflex Solar Power 12.5!MW at Gela, Sicily, Lentini 55!MW, Sicily and the San Quirico 10-MW hybrid solar CSP project in Sardinia) are still slated for completion by 2020-2021 in Italy, although the investors are waiting for the decree that will set the remuneration conditions. Commercial commissioning is thus on hold.
CSP IS SIDE#LINED IN SPAINIn 2012, the incumbent conser-vative government applied a moratorium on renewable energy grants, which put a stop to CSP development. The European sector leader, Spain, had completed and connected 49 commercially-opera-ting CSP plants and one prototype (Puerto Errado 1) between 2007 and 2013, with a combined capacity of 2!303.9!MW. Since 2014, its CSP plants have operated solely using solar energy as the initial option of using a 15% natural gas top-up was called off. The move has had absolutely no effect on plant out-

Energy indicators
EUROBSERV !ER " THE STATE OF RENEWABLE ENERGIES IN EUROPE " #$%& EDITIONEUROBSERV !ER " THE STATE OF RENEWABLE ENERGIES IN EUROPE " #$%& EDITION
72 73
Helios 1 Parabolic trough 50 2012
Moron Parabolic trough 50 2012
Solaben 3 Parabolic trough 50 2012
Guzman Parabolic trough 50 2012
La Africana Parabolic trough 50 2012
Olivenza 1 Parabolic trough 50 2012
Helios 2 Parabolic trough 50 2012
Orellana Parabolic trough 50 2012
Extresol-3 Parabolic trough 50 2012
Solaben 2 Parabolic trough 50 2012
Termosolar Borges Parabolic trough + HB 22.5 2012
Termosol 1 Parabolic trough 50 2013
Termosol 2 Parabolic trough 50 2013
Solaben 1 Parabolic trough 50 2013
Casablanca Parabolic trough 50 2013
Enerstar Parabolic trough 50 2013
Solaben 6 Parabolic trough 50 2013
Arenales Parabolic trough 50 2013
Total Spain 2303.9
Italy
Archimede (prototype) Parabolic trough 5 2010
Archimede-Chiyoda Molten Salt Test Loop Parabolic trough 0.35 2013
Freesun Linear Fresnel 1 2013
Zasoli Linear Fresnel + HB 0.2 2014
Rende Linear Fresnel + HB 1 2014
Ottana Linear Fresnel 0.6 2017
Total Italy 8.15
Germany
Jülich Central receiver 1.5 2010
Total Germany 1.5
France
La Seyne sur mer (prototype) Linear Fresnel 0.5 2010
Augustin Fresnel 1 (prototype) Linear Fresnel 0.25 2011
Total France 0.75
Total EU 28 2314.3Parabolic trough plants, Central receiver plants, Dish Stirling systems, Linear Fresnel systems, HB (Hybride Biomass) Source: EurObserv’ER 2018
Projects Technology Capacity (in MW) Commisionning date
Spain
Planta Solar 10 Central receiver 10 2007
Andasol-1 Parabolic trough 50 2008
Planta Solar 20 Central receiver 20 2009
Ibersol Ciudad Real (Puertollano) Parabolic trough 50 2009
Puerto Errado 1 (prototype) Linear Fresnel 1.4 2009
Alvarado I La Risca Parabolic trough 50 2009
Andasol-2 Parabolic trough 50 2009
Extresol-1 Parabolic trough 50 2009
Extresol-2 Parabolic trough 50 2010
Solnova 1 Parabolic trough 50 2010
Solnova 3 Parabolic trough 50 2010
Solnova 4 Parabolic trough 50 2010
La Florida Parabolic trough 50 2010
Majadas Parabolic trough 50 2010
La Dehesa Parabolic trough 50 2010
Palma del Río II Parabolic trough 50 2010
Manchasol 1 Parabolic trough 50 2010
Manchasol 2 Parabolic trough 50 2011
Gemasolar Central receiver 20 2011
Palma del Río I Parabolic trough 50 2011
Lebrija 1 Parabolic trough 50 2011
Andasol-3 Parabolic trough 50 2011
Helioenergy 1 Parabolic trough 50 2011
Astexol II Parabolic trough 50 2011
Arcosol-50 Parabolic trough 50 2011
Termesol-50 Parabolic trough 50 2011
Aste 1A Parabolic trough 50 2012
Aste 1B Parabolic trough 50 2012
Helioenergy 2 Parabolic trough 50 2012
Puerto Errado II Linear Fresnel 30 2012
Solacor 1 Parabolic trough 50 2012
Solacor 2 Parabolic trough 50 2012
Concentrated solar power plants in operation at the end of 2017
Continues overleaf
1

Energy indicators
EUROBSERV !ER " THE STATE OF RENEWABLE ENERGIES IN EUROPE " #$%& EDITIONEUROBSERV !ER " THE STATE OF RENEWABLE ENERGIES IN EUROPE " #$%& EDITION
74 75
in the statistics starting in 2019. The plant occupies a 36-hectare site and is equipped with 95 200 mirrors assembled in 23 800 collec-tors that cover a 153 000-m2 area. The output will be stored in nine 90-tonne, 120-m" steam accumula-tors at 80!bar, which equates to four hours’ storage. The plant’s design capacity is 9!MW, which is enough to supply power to more than 6 000 households, namely about 20!GWh per annum. According to SUNCNIM, the project designer, the capacity level and storage technology are no longer suitable for the global elec-tricity market. The operator has the-refore switched focus to the plant’s thermal production capacity, and aims to supply steam to industry, primarily the oil industry, in countries with high sunshine levels.
PROJECTS STILL BLOCKED IN ITALYAccording to Emilio Conti, of Anest (the Italian National Association
of Thermodynamic Solar Energy), the situation changed very little in 2017. The sector has been waiting for two years for a new decree covering the renumeration condi-tions of >5-MW plants, that should have been published at the end of 2017. The decree was due to take over elements of the decree dated 23 June 2016 prompting the start of construction work on 118.5!MW of capacity which had received permission. Three projects are involved in Sicily (55!MW at Car-lentini, 41!MW at Aidone, 12.5!MW at Gela) and one in Sardinia (a 10-MW hybrid CSP/Biomass plant at San Quirico). Two other plants are still in the final licensing stage – the Flumini Mannu (55!MW) plant that straddles Villasor and Decimo-putzu, Sardinia and the 10-MW 3QP plant at San Severo in Puglia.
As regards <5-MW plants, 8 pro-jects have made it to the regis-ters of the Italian Energy Services
Operator (GSE). Seven of the pro-jects are located in Sicily and one in Sardinia. According to Anest, construction is likely to start soonest on Calliope PV Srl at Trapani, Sicily (4!MW), Stromboli Solar Srl also at Trapani (4!MW), Solin Par SRL at Partanna (4.3!MW) and Bilancia PV Srl at Mezzojuso (4!MW) near Palermo. In the mean-time, the sector has had to settle for connection of the small 600-kW Fresnel-type plant to the grid on 5 October (with 9 000 m2 of mirrors) at Ottana, Sardinia, the first to use an Organic Rankine Cycle. A second 1-MW parabolic-trough demonstrator, also connected to an ORC system is under construc-tion at Melilli, Sicily. The Feed-in tariff for 250 kW–5!MW installa-tions is #!296 per!MWh, to which “an integration factor” is added if the plant has its own storage system, which in the case of the Melilli CSP plant adds another #!45 per!MWh (giving a total of #!341 per!MWh).
CSP IS LOOKING AT AN AMORPHOUS FUTURE IN EUROPEBy 2020, the sector’s European growth prospects will be far below the targets set by the member states for their national renewable energy action plans. The trajectory for the next three years is still blurred because completion of the only current tangible projects – all in Italy – is on hold, pending the publication of decrees offering better remuneration conditions.
With the new renewable energy directive almost upon us, new major CSP projects could still be rolled out in Europe. The sector’s representatives, such as Luis Crespo of Protermosolar reminds us of the important role CSP could play in the context of an increasingly interdependent and interconnected European grid. He highlights the sector’s strengths stemming from the long-lasting storage capabilities that can secure part of the European countries’ power supplies, especially in Cen-tral Europe, where only variable capacity technologies such as wind energy and solar photovoltaic are likely to be developed. Luis Crespo also points out that the new Euro-pean renewable energy directive stresses the importance of cross-border exchanges encouraging investments to be made where resources are at their best. The future role for CSP in achieving the new targets for 2030 will depend on the countries’ capacities to geographically coordinate their investments on the basis of the complementary features of all the renewable energies to give Europe a robust, cheap, emission-free elec-tricity-generating system.
CSP plant capacity trend in the European Union (in MW)
Comparison of the current trend against the NREAP (National Renewable Energy Action Plans) roadmap (in!MW)
!"," #","
$%!.&
'(%.&
! !)%.'
!*#!.$
$(!$.) $(!(.' $(!(.' $(!(.' $(!&.(
2007 2008 2009 2010 2011 2012 2013 2015 2016 20172014
2015 2016 2017 2020
! "#".$ ! "#".$ ! "#%." ! %&&.&
" %!$
' ()%
NREA
P
NREA
P
Source: EurObserv’ER 2018
Source: EurObserv’ER 2018
2
3
Torr
eso
l En
erg
y

Energy indicators
EUROBSERV !ER " THE STATE OF RENEWABLE ENERGIES IN EUROPE " #$%& EDITIONEUROBSERV !ER " THE STATE OF RENEWABLE ENERGIES IN EUROPE " #$%& EDITION
76 77
Demotide project – also 6!MW is due to start operating commer-cially in 2019. However, as most of the marine energy projects receive European funding, the spectre of Brexit hangs over the country’s efforts.
France’s sector was dealt a blow when Naval Energies pulled out of the current energy develop-ment work. Nonetheless, Atlantis Resources Corporation announced its intention to install 10 x 2!MW tidal turbines at Raz Blanchard as a test facility, while river tur-bines are taking off in France. HydroQuest has commissio-ned four river turbines in the Rhone, near Lyon (320 kW in all) and in 2019 will immerse 39 x 40 and 80!kW (2!MW in all) turbines downstream of the Génissiat dam (Ain). Good progress has also been made in wave energy conversion with the launch of a 50!MW pilot wave energy converter in August in the port of La Rochelle by the Gironde start-up, Hydro Air Concept Energie (Hace). Ireland, Spain, Denmark, Sweden, Italy and
Seas and oceans offer an inva-luable source of energy that
can be harnessed as tidal energy, marine current power, wave energy, energy recovered from temperature and salt content differences between two bodies of water (thermal and osmotic energy respectively). Europe has considerable, diverse potential that makes it the ocean energy sector leader thanks to its many kilometres of continental and far-flung coastlines.
The European Horizon 2020 pro-gramme supports research and innovation. In 2018, it enabled a third MaRINET programme to be launched, that provides free access to a network of 57! lea-ding-edge research facilities throughout Europe. Further-more, the 3-year (2018 – 2021) European DTOcean+ project has been relaunched. It will set up an open source advanced design tool suite for marine current and wave energy system innovation, development and deployment that aims to reduce the LCOE from 6 to 8%.
Tidal energy has been commer-cially harnessed since 1966 at France’s la Rance (Ille-et-Vilaine) tidal barrage (240!MW) installed in the Rance river estuary. As estuary barrages raise environmental and social acceptance issues, research work on artificial lagoon systems out at sea is underway. However, the UK government has dropped the most advanced project, a 320!MW prototype led by Tidal Lagoon Power in Cardiff, Wales.
Pilot projects have tested cur-rent and wave energy installa-tions and should soon move on to the commercial stage. The United Kingdom has made the most progress in the sector, not only through small-scale experi-ments carried out at the European Marine Energy Centre (EMEC) in Scotland for more than a decade, but also through larger-scale projects that are about to come on stream. The most advanced is Australia’s Atlantis Resources Meygen Corporation tidal turbine project for a 398-MW installation in the Pentland Firth strait. The first 6-MW phase was completed in 2017. The second phase – the
OCEAN ENERGY
Emm
anu
el D
on
fut
/ B
alao

Energy indicators
EUROBSERV !ER " THE STATE OF RENEWABLE ENERGIES IN EUROPE " #$%& EDITIONEUROBSERV !ER " THE STATE OF RENEWABLE ENERGIES IN EUROPE " #$%& EDITION
78 79
Belgium are also working in this sector as well as Portugal where Finland’s AW-Energy will shortly install a 350-kW WaveRoller pro-totype wave energy converter (off Peniche). The Netherlands is cham-pioning water current and osmo-tic energy development efforts.
The sector will need strong sup-port if Europe is to maintain its lead in marine energies, according to a new marine energy market survey commissioned by the Euro-pean Commission (EC). The survey suggests the establishment of a European investment platform
Projects Capacity (in MW) Commissioning date Current state
United Kingdom
SeaGen 1.2 2008 Connected
Wello Oy- Penguin WEC 0.6 2012 Connected
Minesto - Deep GreenOcean 0.03 2013 Connected
WaveNET 0.45 2016 Connected
Nova 30 0.03 2014 Connected
Nova 100 0.3 2016 Connected
Andritz TTG#1 – Meygen 4.5 2016-2017 Connected
Atlantis AR1500 – Meygen 1.5 2017 Connected
CorPower C3 0.05 2018 Connected
PLAT-O 1 2016 Connected
Minesto - Deep GreenOcean 0.5 2018 Connected
Total UK 10.16
France
La Rance Barrage 240 1966 Connected
Hydrotube Énergie H3 0.02 2015 Being tested
Sabella D10 1 2015 Connected
Bertin Technologies 0.018 2016 Connected
Guinard Énergie 0.004 2018 Connected
Seeneoh / Hydroquest 0.08 2018 Connected
Seeneoh/Design Pro 0.025 2018 Connected
Hydrowatt/Hydroquest 0.32 2018 Connected
Hydro Air Concept Energie (Hace) 0.05 2018 Connected
Total France 241.52
Spain
Mutriku OWC – Voith Wavegen 0.3 2011 Connected
Oceantec WEC MARMOK-A-5 0.03 2016 Connected
Total Spain 0.33
List of European Union plants harnessing ocean energy at the end of 2018
1
Continues overleaf
Italy
KOBOLD turbine 0.03 2000 Connected
H24 0.05 2015 Connected
REWEC3 0.02 2016 Being tested
OBREC n.c 2016 Being tested
ISWEC 0.1 2016 Being tested
GEM 0.02 2014 Being tested
Total Italy 0.22
Netherlands
Tocardo T1 0.3 2015 Connected
Tocardo T2 0.25 2016 Connected
Eastern Scheldt Tocardo T2 1.25 2015 Connected
REDstack Afsluitdijk 0.05 2014 Connected
Total Netherlands 1.85
SwedenLysekil Project n.c 2006 Connected
Seabased Sotenäs project 3 2016 Being tested
Total Sweden 3Denmark
Wavepiston 0.012 2015 Being tested
Weptos n.c 2017 Being tested
Crestwing n.c 2018 Being tested
Total Denmark 0.012
Portugal
Evopod E1 0.001 n.c Being tested
Total Portugal 0.001
Greece
SINN Power n.c 2018 Connected
Total Greece n.cTotal EU 257.1Source: EurObserv’ER 2018
for marine energies, to validate the 2016 Ocean Energy Roadmap recommendations made by the industry represented by OEE (Ocean Energy Europe). But the report’s main recommendation is to introduce Feed-in Tariffs.

Energy indicators
EUROBSERV !ER " THE STATE OF RENEWABLE ENERGIES IN EUROPE " #$%& EDITIONEUROBSERV !ER " THE STATE OF RENEWABLE ENERGIES IN EUROPE " #$%& EDITION
80 81
Currently, heating and cooling is mainly provi-ded by onsite technologies integrated in buil-dings. For the further decarbonisation of the heating sector especially in highly populated areas, the integration of RES in district heating grids is gaining in importance. The consump-tion and market indicators on RES integration in the building stock and urban structure are designed to show the status quo of RES use and the development of RES deployment in this respect. Due to the large building stock and the long life cycle of heating systems, the consumption and market stock shares change slowly while the market sales shares reflects changes at the margin.
RES integrated in buildings or urban infrastructure comprises various technologies that are applied to provide heating, cooling and electricity. Decentralized technologies in buildings include heat pumps, biomass boilers, and solar thermal collectors. Relevant urban infrastructure for the integration of RES comprises mainly district heating plants including biomass CHP and heat only plants, geothermal plants, innovative applications such as solar thermal collector fields and large-scale heat pumps.
INTEGRATION OF RES IN THE BUILDING STOCK AND URBAN INFRASTRUCTURE
The consumption shares of RES in the building stock shows the significance of the respective RES in the building sector, and its use. It is the quotient of final renewable energy demand for heating and cooling in building and total final energy demand in buildings including electricity for heating and hot water preparation. In addition, the market stock shares of RES are depicted. They show the installed heating units as a percentage of all dwellings. As solar power is mainly applied in combination with other technologies, it is not counted here as an alone standing system. In contrast, electric heating is included in the market stock share as an alone-standing system. It is an important technology for heating and hot water preparation in some countries. In contrast to consumption shares of RES, market sales shares of RES depict the dynamics and deve-lopment of RES at the edge. Market shares show
the share of technologies sold in relation to the total of all sold heating units. They may vary from year to year in each country. As data on sales were not available for all technologies or countries, the number of system exchanges is assessed based on the average exchange rate of systems of those countries, for which data were available. Although solar thermal energy is mainly used in combina-tion with other systems, it is separately listed here to show its significance and dynamics. A more detailed description on the methodolo-gical approach of the market and consumption shares can be found on the project’s website and on Eurostat’s methodology on consumption shares see http://ec.europa.eu/eurostat/web/energy/data/shares. Because Eurostat data for 2017 were not published at that time, the shares are shown for 2016 only.
Methodological note

Energy indicators
EUROBSERV !ER " THE STATE OF RENEWABLE ENERGIES IN EUROPE " #$%& EDITIONEUROBSERV !ER " THE STATE OF RENEWABLE ENERGIES IN EUROPE " #$%& EDITION
82 83
CoalOilNatural Gas
BiomassHeat pump* District heating**
Direct electric heat
Solar thermal
0
20
40
60
80
100
Net
her
lan
ds
Un
ited
Kin
gdo
m
Slo
vaki
a
Ital
y
Hu
nga
ry
Bel
giu
m
Luxe
mb
urg
Ger
man
y
Fran
ce
Spai
n
Cze
chia
Ro
man
ia
Irel
and
Cro
atia
Au
stri
a
Po
lan
d
Po
rtu
gal
Den
mar
k
Slo
ven
ia
Gre
ece
Esto
nia
Latv
ia
Lith
uan
ia
Bu
lgar
ia
Swed
en
Fin
lan
d
Mal
ta
Cyp
rus
Coal
Natural Gas
Petroleum products
Electric boilers
Heat pumps
Biofuels Excess heat
Other
Bu
lgar
ia
Hu
gary
Latv
ia
Cze
chia
Lith
uan
ia
Ro
man
ia
Ger
man
y
Au
stri
a
Esto
nia
Slo
vaki
a
Slo
ven
ia
Den
mar
k
Fin
lan
d
Po
lan
d
Swed
en
0
20
40
60
80
100
Source: EurObserv’ER 2018 - own assessment based on diverse sources. *Heat pumps consider both ambient heat and electricity**District heating contains derived heat obtained by burning combustible fuels like coal, natural gas, oil, renewables (biofuels) and waste, or also by transforming electricity to heat in electric boilers or heat pumps.
Source: EurObserv’ER 2018 - Based on 2016 data for: DK, DE, AT, FI ; Based on 2015 data for: PL, RO, SE ; Based on 2013 data for: LT, LV, EE, BG, SK, CZ, SI, HU
RES consumption shares in 2016 District heating supply mix in 2016
1 2
RESULTS AND INTERPRETATION
Figure 1 presents the consumption shares of heating and cooling
with renewable energies in 2016 for residential buildings and services. Basically, this share is a combined indicator for the integration of renewable energies in buildings and urban infrastructure. It depicts the final renewable energy demand for heating and cooling as a share of total final energy demand for heating and cooling. Annual exchange rates for heating/cooling
systems range around two to four percent, thus the consumption share shows only small changes from one year to the other. Thus, the situation in 2017 is expected to be similar to 2016.
In the Netherlands and the United Kingdom, and to a smaller share in Slovakia, Italy, Hungary, Luxemburg and Belgium gas is still dominating the heating system. Oil boilers are mainly used in Malta, Cyprus, Ire-
land and in Luxemburg, Belgium, Greece, Slovenia, Portugal and Ger-many they still represent an impor-tant technology or source for heat.
Figure 2 depicts the existing sup-ply mix in the countries where DH covers around 10% or more from the heating and hot water demand in 2016. From the arithmetic average, it can be concluded that the exis-ting DH networks still rely on fos-sil fuels with natural gas and coal
(39%), and Portugal (36%). Albeit the growth of heat pumps in some countries, they display still a minor share apart from Sweden (18%), Portugal (13%) and other Southern European countries such as Malta (19%), Cyprus(12%), Greece (10%), and Spain (9%). Overall, solar ther-mal displays the smallest shares and is mainly used to a small extent in Southern European countries, where the solar radiation is stron-ger than in the north. It is highest in Cyprus (22%), and lowest in the Baltic States and Romania and Fin-land. In Poland a large share of coal (34%) is used for heating while elec-tric heating plays a role in Malta, Portugal, Cyprus, and Finland but also in Sweden, France, Bulgaria and Greece.
Figure 3 depicts the technology shares in the building stock, i.e. for all dwellings. In contrast to Figure 1 above, it shows the share of house-holds with another or unknown hea-ting system or no heating system at all. This share is very high for Cyprus, Greece, and high for Malta and Luxemburg, and also considerable for Croatia, Ireland and Spain. Due to climatic conditions some dwel-lings might have only a small heater, stove etc., which is not accounted in the statistics. Further, the high share could reflect data problems in this group. As solar thermal is not included here as separate system, dwellings which use only solar ther-mal energy for heating are part of this group as well.With respect to rising RES shares in
as predominant sources. Coal is mostly used in Poland, Slovenia, Slo-vakia, Germany and Romania. The oil DH consumption with exception of Estonia is almost phased out and presents an insignificant amount in the supply mix. In average, the bio-fuels such as biomass, biogas and renewable waste play a significant role with about 24% of all energy sources for DH. The biofuels are a predominant DH heat source in the Scandina-vian countries and Austria and has a substantial share in the Baltic countries and Slovenia. Excess heat and heat pumps are mostly used in
Finland and Sweden.
District heating is strong especially in the Scandinavian countries as well as in the Baltic and other East European countries. In the latter countries, district heating has a long history and can rely on existing infrastructure.
Back to figure 1, RES dominate in Croatia (54%), Slovenia (50%),and Bulgaria (49%). This domination is only due to the high use of biomass, which represents a rather cheap fuel for heating in these countries. It is also used in Romania (43%), Latvia

Energy indicators
EUROBSERV !ER " THE STATE OF RENEWABLE ENERGIES IN EUROPE " #$%& EDITIONEUROBSERV !ER " THE STATE OF RENEWABLE ENERGIES IN EUROPE " #$%& EDITION
84 85
dynamic in Denmark (solar district heating) while Austria, Germany, Poland and Spain reveal a mode-rate development.
Overall, in many EU countries, the dynamic of RES in the heating/coo-ling sector is low.
CONCLUSIONSOverall, natural gas is the most commonly used heating system, followed by oil boilers, while coal boilers are slowly disappearing as
the consumption shares as well as the market sale shares indicate. In addition, there is a high dynamic in sales of condensing gas and oil boilers, indicating that they will play a significant role in heating even in the future.
Albeit the relatively high dyna-mic of heat pumps in some of the countries, the consumption shares are small compared to fossil fuel based heating. Solar thermal power has quite some potential even in
Northern countries as the case of Denmark shows but its dynamic as well as share in the stock is low.
In Table 1 an overview of the hea-ting systems exchange rates for the selected EU MS is presented. It can be observed that in countries like Belgium, Italy, Netherlands, and the UK where the share of district heating is very low, the exchange rates are higher than in
Bu
lgar
ia
Ro
man
ia
Slo
ven
ia
Latv
ia
Hu
nga
ry
Mal
ta
Net
her
lan
ds
Slo
vaki
a
Un
ited
Kin
gdo
m
Lith
uan
ia
Cro
atia
Cze
chia
Luxe
mb
ou
rg
Irel
and
Po
rtu
gal
Cyp
rus
Bel
giu
m
Gre
ece
Po
lan
d
Ital
y
Ger
man
y
Fran
ce
Spai
n
Fin
lan
d
Au
stri
a
Den
mar
k
Esto
nia
Swed
en
0
20
40
60
80
100
Condensing gas boilers Standard gas boilersOther than RES heating*
Condensing oil boilers
Standard oil boilers Biomass boilers Heat pumps Solar thermal**
Source: EurObserv’ER 2018 - own assessment based on diverse sources. * could comprise gas, oil and SEB_CHP, calculated for EU countries with missing data, based on average share of sales of AT, BE, FR, DE, IT, NL, PL, ES, UK; ** solar thermal system corresponds to 4 m2 collector area
RES-market sale shares in 2016
4
Coal boilerOil boilerGas boiler
Biomass boilerHeat pump District heating
Direct electric heat
Others/no heating
Net
her
lan
ds
Un
ited
Kin
gdo
m
Hu
nga
ry
Slo
vaki
a
Ital
y
Bel
giu
m
Ger
man
y
Ro
man
ia
Cze
chia
Cro
atia
Fran
ce
Luxe
mb
ou
rg
Spai
n
Slo
ven
ia
Au
stri
a
Irel
and
Po
rtu
gal
Po
lan
d
Latv
ia
Lith
uan
ia
Esto
nia
Den
mar
k
Gre
ece
Bu
lgar
ia
Fin
lan
d
Swed
en
Mal
ta
Cyp
rus
0
20
40
60
80
100
Source: EurObserv’ER 2018 - own assessment based on diverse sources. Note: solar is not counted as an alone standing system as it is used mainly in combination with other systems
RES market stock shares in 2016
3
the power sector, electric heating gains in significance. In Bulgaria, Portugal and Malta the shares range significantly above ten percent, while in Spain, Slovakia, France, Finland, Greece and Swe-den they are slightly above this threshold. This means a rising RES share in electricity contributes to low-carbon heating/cooling in these countries.
MARKET SALES SHARES OF RES
Figure 4 and Figure 5 depict the market sales share of RES techno-logies used for heating and coo-ling. In contrast to Figure 3 above, Figure 4 shows the recent develop-ments in RES by illustrating the sales shares of RES heating/coo-ling in the respective year. Thus, it shows the dynamic in the market.
Heat pumps show a very high dynamic in Estonia, Finland, Swe-den and France. Biomass boilers, although at a lower level than heat
pumps, display a high dynamic in Italy, France, Spain and Austria. Despite the lack of market sales data for some countries, it can be assumed based on the consump-tion and market share that the sales of individual biomass tech-nologies is also high in the Baltic countries, Bulgaria, Romania, Croatia and Slovenia. Solar ther-mal energy shows a high dynamic in countries where it has already a high share, such as Cyprus and Greece, but it displays the highest
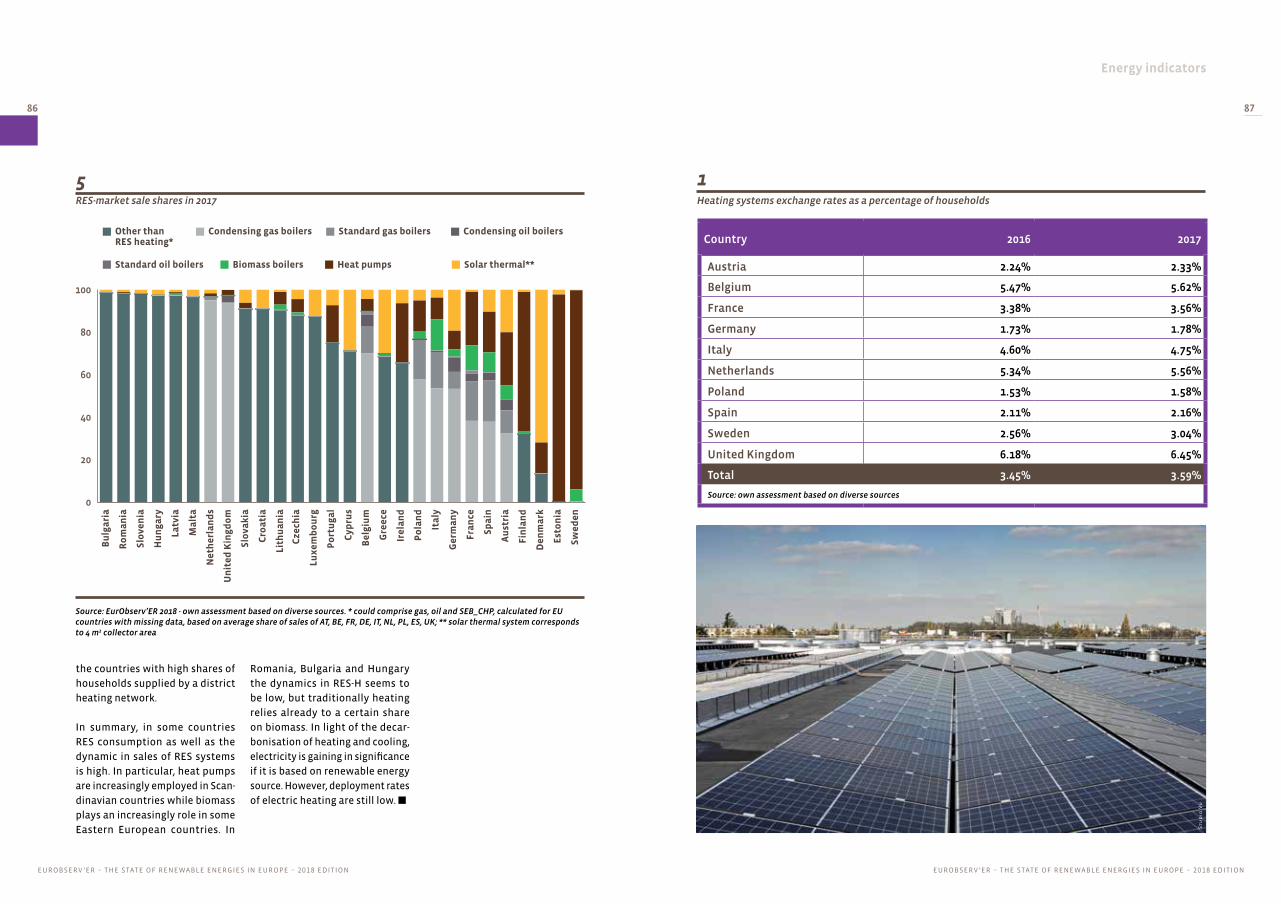
Energy indicators
EUROBSERV !ER " THE STATE OF RENEWABLE ENERGIES IN EUROPE " #$%& EDITIONEUROBSERV !ER " THE STATE OF RENEWABLE ENERGIES IN EUROPE " #$%& EDITION
86 87
Country 2016 2017
Austria 2.24% 2.33%
Belgium 5.47% 5.62%
France 3.38% 3.56%
Germany 1.73% 1.78%
Italy 4.60% 4.75%
Netherlands 5.34% 5.56%
Poland 1.53% 1.58%
Spain 2.11% 2.16%
Sweden 2.56% 3.04%
United Kingdom 6.18% 6.45%
Total 3.45% 3.59%
Source: own assessment based on diverse sources
Heating systems exchange rates as a percentage of households
1
Stu
dio
Vu
Bu
lgar
ia
Ro
man
ia
Slo
ven
ia
Hu
nga
ry
Latv
ia
Mal
ta
Net
her
lan
ds
Un
ited
Kin
gdo
m
Slo
vaki
a
Cro
atia
Lith
uan
ia
Cze
chia
Luxe
mb
ou
rg
Po
rtu
gal
Cyp
rus
Bel
giu
m
Gre
ece
Irel
and
Po
lan
d
Ital
y
Ger
man
y
Fran
ce
Spai
n
Au
stri
a
Fin
lan
d
Den
mar
k
Esto
nia
Swed
en
0
20
40
60
80
100
Condensing gas boilers Standard gas boilersOther than RES heating*
Condensing oil boilers
Standard oil boilers Biomass boilers Heat pumps Solar thermal**
Source: EurObserv’ER 2018 - own assessment based on diverse sources. * could comprise gas, oil and SEB_CHP, calculated for EU countries with missing data, based on average share of sales of AT, BE, FR, DE, IT, NL, PL, ES, UK; ** solar thermal system corresponds to 4 m2 collector area
RES-market sale shares in 2017
5
the countries with high shares of households supplied by a district heating network.
In summary, in some countries RES consumption as well as the dynamic in sales of RES systems is high. In particular, heat pumps are increasingly employed in Scan-dinavian countries while biomass plays an increasingly role in some Eastern European countries. In
Romania, Bulgaria and Hungary the dynamics in RES-H seems to be low, but traditionally heating relies already to a certain share on biomass. In light of the decar-bonisation of heating and cooling, electricity is gaining in significance if it is based on renewable energy source. However, deployment rates of electric heating are still low.

Energy indicators
EUROBSERV !ER " THE STATE OF RENEWABLE ENERGIES IN EUROPE " #$%& EDITIONEUROBSERV !ER " THE STATE OF RENEWABLE ENERGIES IN EUROPE " #$%& EDITION
88 89
Renewable energy output levels are by nature sen-sitive to climate conditions, both by prevailing
on the demand made of them (e.g.: household wood consumption depends on winter temperatures, or the amount of time heat pumps are in use for winter hea-ting or for their reversible function in the summer). Their variability also directly dictates output level at a given capacity – so annual rainfall levels affect hydroelectricity; average wind speeds affect wind energy and hours of sunshine affect solar installa-tion output.
One of the conclusions we can draw from 2017, is that like 2016, agitated climate conditions affected the out-put of several renewable sectors, with contrasting and even reversed situations, depending on the member countries’ geography. At the scale of the European Union two major electricity production sectors were particularly affected in 2017. On the downside, most of Europe suffered a record hydropower deficit, while on the upside wind energy production surged in 2017, in the wake of a year of particularly low winds in the Northern half of Europe. Current climate warming is probably to blame for these disturbances. According to the World Meteorological Organization, 2017 was the 5th hottest year ever recorded in Europe. Judging from the heat records broken from the North Sea to the Danube, many continental European countries expe-rienced unheard-of mean annual temperatures in 2018.
THE NEW RENEWABLE SECTORS MAKE UP FOR THE RECORD HYDROPOWER DEFICIT Gross real renewable electricity output (non-nor-malised), whose hydropower component derives from natural water flow (i.e., it excludes hydraulic pumping), crept up very slightly in 2017 to 975.2 TWh (graph 1), a 2.2% increase over 2016 (953.9 TWh). This equates to 21.3 TWh of additional output between 2016 and 2017, which betters the previous year’s per-formance slightly (1.7% between 2015 and 2016) but was not as good as the 2015 (4%), 2014 (4.9%) and 2013 (11.7%) performance levels. If we factor in the hydropower output generated by pumping, which does not qualify as renewable energy by the Euro-pean Renewable Energy Directive, then output came to 1 005.8 TWh in 2017 (983.9 TWh in 2016) – namely an increase of 2.2%.
Drought and record rainfall shortages characterized 2017 for much of Europe. Hydropower output from natural water flow, that excludes electricity pro-duced by pumping, was 50.3 TWh lower than in 2016, dropping to an historic low of 300.7 TWh (351 TWh in 2016). Only two major producer countries were spared… Sweden and Latvia. The Southern and most westerly countries of Europe suffered the greatest losses, with output slashed by 48.4% in Spain, 62.5% in Portugal, 28.5% in Greece, 17.9% in France and 14.7% in Italy. Annual variations in “natural” hydro-power output can be very significant. The 2017 level was a far cry from those of 2014 (375.9 TWh) and 2010 (376.9 TWh), which were particularly rainy years for the European Union as a whole.
The hydroelectricity deficit was offset by a huge surge in wind and solar power output. While in 2016 winds were particularly ill-disposed to wind power production along the British coasts, the North Sea, the Baltic and more generally over half of Northern Europe, more normal conditions prevailed in 2017. According to Eurostat, 362.4 TWh of wind power was generated in 2017, which is a 19.7% year-on-year rise (an increase of 59.6 TWh). Germany is the first country
HALF A PERCENTAGE POINT CLOSER TO THE !"!" TARGET IN !"#$
to have broken the 100-TWh wind power output barrier when it generated 105.7 TWh in 2017. The UK (50!TWh) beat Spain (at 49.1 TWh) to the finishing line to become the number two producer in the European Union. Naturally, output improved in the countries with major offshore wind turbine capacities. Increa-sing numbers of offshore wind farms have annual load factors approaching if not above 50%. The rate can be even higher during the winter which is when many countries experience peaks in electricity demand. The other factor that boosted development is the increase in wind turbine production capacities (onshore and offshore). Nett capacity rose by 14.7 GW (for a total of 169.8 GW), which is the highest increase in capacity the sector has ever recorded, outstripping those of 2016 and 2015 (12.8 GW each).
Solar photovoltaic also performed well in 2017, aided by more sunshine and 11.7 GW of nett newly-instal-led capacity over the past two years. According to Eurostat, European Union output rose to 113.7 TWh in 2017, or 7.3% year-on-year growth. Photovoltaic power now amounts to 3.4% of the European Union’s gross electricity output. If we add the output of Spain’s concentrated solar power plants (5.9 TWh), whose installed capacity has remained stable, solar power’s total contribution was 119.5 TWh.
As for biomass energy taken as a whole, electricity output rose to 185.3 TWh in 2017… 4 TWh more or a 2.2% rise over its 2016 performance. The thrust of the growth in biomass electricity production is primarily provided by its solid biomass component that increased in twelve months by 3.0% to 94.7 !TWh (thus adding 2.8 TWh). Most of this can be put down to an increase in solid biomass’ net maximum elec-trical capacity in the countries that promote its use to replace coal and also via increased biomass cogeneration activity. The UK, Finland and Denmark are currently the most active countries in this area. Biomass electricity also benefits from an increase in the renewable electricity share from household waste incineration (by 1 TWh, for a total of 22.2 TWh).
The increase in biogas electricity output, whose politi-cal support is waning, was smaller (0.6 TWh, for a total of 63.4 TWh), while liquid biomass electricity output decreased by 0.3 TWh, to give a total of 5 TWh. The geo-thermal and ocean energy electricity sectors saw little change in their output. Geothermal electricity slid by 19 GWh (producing a total of 6.7 TWh) whereas ocean energy gained 25 GWh (producing a total of 526 GWh).
A MORE ADVANTAGEOUS DIRECTIVE MONITORING INDICATOR The renewable electricity production monitoring indicator used for calculating the Renewable Ener-gies Directive (2009/28/EC) target differs in that it includes normalised production for hydropower and wind energy – the normalisation formula is defi-ned in Annex II of the directive – to tone down the impact of climate vagaries, at least for rainfall and wind. The resulting indicator is more representative of the efforts made by each Member State. It is also more accurate because it factors in an estimate of the renewable electricity output produced by biomethane (refined biogas) that is injected into the natural gas grid and only includes the electricity output derived from sustainably-certified liquid biomass.
The normalised hydropower output figure finally adopted was 348.9 TWh in 2017 (351 TWh in 2016), that of wind energy 346.7 TWh (311.1 TWh in 2016). They take the renewable electricity output included in the Euro-pean target calculations to 1 008.1 TWh in 2017 compa-red to 962.1 TWh in 2016. The total electricity output retained was 3 278.7 TWh in 2017, 0.7% more than in 2016 (3 255 TWh). This accounting change increases the renewable energy share from 29.6% in 2016 to 30.7% in 2017. The “normalised” renewable electricity share has more than doubled from its 2005 level (14.8%).
Turning to the reference period (2005–2017), we see that many EU countries have enjoyed considerable increases in their renewable electricity shares,

Energy indicators
EUROBSERV !ER " THE STATE OF RENEWABLE ENERGIES IN EUROPE " #$%& EDITIONEUROBSERV !ER " THE STATE OF RENEWABLE ENERGIES IN EUROPE " #$%& EDITION
90 91
* estimated, provisional for Greece. Notes for calculation: Hydro is normalised and excluding pumping. Wind is normalised. Solar includes solar photovoltaic and solar thermal generation. All other renewables include electricity generation from gaseous and liquid biofuels, renewable municipal waste, geothermal, and tide, wave & ocean. Source: SHARES 2017 (updated 4 February 2019)
!"#$ : total %$&,! TWh
'$,! ((')!,* TWh)
Wind power
'",+ (('"",$ TWh)
Hydropower
#% ((#+&,' TWh)
Biomass
#!,' ((##%,& TWh)
Solar power
",$ ((),$ TWh)
Geothermal power
",# ((",& TWh)
Ocean energy
!"#$!"#%
%!.! &
$'.( &
$".) &
').) &
').! &
)$.) &
)#.$ &
*$.* &
*'.! &
*).) &
*).# &
*!.) &
*".# &
!+.# &
!).' &
!#.* &
#(.( &
#(.# &
+.# &
%.' &
$.$ &
*".% &
%*.* &
$).( &
'*.( &
'#.* &
')." &
)$.$ &
)!.% &
*$.$ &
*!.( &
*!.! &
*)." &
*!.# &
!$.+ &
!).$ &
!!.% &
!!.' &
#(.! &
#(.! &
$.% &
%.* &
'.% &
!(.$ &
#%.! &
#%." &
#*.+ &
#*.% &
#*.# &
+.( &
#'.+ &#+.* &
#$.( &
#'.! &
#!.' &
#*.$ &
#*.) &
+.$ &
Austria
Sweden
Denmark
Latvia
Portugal
Croatia
Romania
Spain
Finland
Germany
Italy
Slovenia
Ireland
United Kingdom
Greece*
Slovakia
France
Bulgaria
Lithuania
Belgium
Estonia
Netherlands
Czechia
Poland
Cyprus
Luxembourg
Hungary
Malta
Total EU
Note: Figures for actual hydraulic and wind generation (not normalised), pumped hydro excluded. Source : EurObserv’ER
!"#$ : total %&',% TWh
'#,( )('"!,% TWh)
Wind power
'$,( )('&#," TWh)
Hydropower
#% )(#(#,! TWh)
Biomass
##,* )(###,$ TWh)
Solar power
",* )($,* TWh)
Geothermal power
",# )(",& TWh)
Ocean energy
Share of renewable energy in the electricity generation of EU countries in 2016 and 2017Share of each energy source in renewable electricity generation in the EU 28.
21
accompanied by profound changes to the electri-city production mix. The biggest increases can be credited to Denmark (35.7 percentage points), Por-tugal (26.5!pp), Germany (24!pp), the UK (24!pp), Ire-land (22.9!pp), Italy (17.8!pp) and Spain (17.2!pp). This contrasts with meagre renewable electricity share growth in Hungary (3.1!pp), Slovenia (3.8!pp), Luxem-bourg (4.9!pp), Slovakia (5.6!pp), France (6.2!pp) and the Netherlands (7.5!pp).
Member States’ renewable energy potential and sup-port policies lead to wild divergences in the renewable electricity share as shown in Graph 2. Renewable out-put now dominates the mix in the top five countries – Austria (72.2% in 2017), Sweden (65.9%), Denmark (60.4%), Latvia (54.4%) and Portugal (54.2%). Yet, it is less than 10% in four straggling countries – Cyprus, Luxembourg, Hungary and Malta.
HEAT PASSES THE !""#MTOE THRESHOLDThe Eurostat data released through its SHARES calcu-lation tool shows that in 2017, renewable heat contri-buted less than renewable electricity to the increase in final renewable energy consumption, although the
opposite was true in 2016. This indicator covers both the energy directly consumed by final users that is not produced by the processing sector (e.g.: house-hold wood energy consumption that fuels domestic heating appliances), derived heat from heating and cogeneration plants and the renewable output reco-vered by heat pumps. Thus, heat output contributed up to 100.2!Mtoe in 2017 (99.5!Mtoe), which repre-sents 2.7% growth over the 2016 level (an additional 2.7!Mtoe). This growth is less than the previous year‘s when 3.3!Mtoe was added (3.5%) or that of 2015 when 4.7!Mtoe was added (+5.1%).
Care needs to be taken when analysing renewable heat consumption variations. This is because the string of mild years and winters in Europe – a mea-surable consequence of climate warming – clouds the interpretation of the impact of renewable heat
1. SHARES 2017, update of 4 February 2019, downloaded
from https://ec.europa.eu/eurostat/web/energy/data/
shares

Energy indicators
EUROBSERV !ER " THE STATE OF RENEWABLE ENERGIES IN EUROPE " #$%& EDITIONEUROBSERV !ER " THE STATE OF RENEWABLE ENERGIES IN EUROPE " #$%& EDITION
92 93
!"#$ : total #"!.! Mtep
".% &(".% Mtep)
Liquid biomass
".% &(".% Mtep)
Charcoal
$'.( &('".) Mtep)
Solid biomass
).$ &().' Mtep)
Renewable municipal waste
).( &().$ Mtep)
Biogas
#".! &(#".* Mtep)
Heat pumps
!.) &(!.) Mtep)
Solar power
".' &(".' Mtep)
Geothermal energy
Source: EurObserv’ER
!"#$ : total %%.& Mtep
".' ((".' Mtep)
Liquid biomass
".! ((".! Mtep)
Charcoal
)%.! (()*.) Mtep)
Solid biomass
+.$ ((+.$ Mtep)
Renewable municipal waste
+.$ ((+.$ Mtep)
Biogas
#" ((%.% Mtep)
Heat pumps
!.! ((!.! Mtep)
Solar power
".* ((".* Mtep)
Geothermal energy
Share of each energy source in renewable heat and cooling consumption in the EU 28
3
!"#$!"#%
$&.# '
().* '
().$ '
(#.$ '
)$.( '
)$.( '
+$.( '
+).) '
++.! '
+!." '
!&.& '
!$.$ '
!$.$ '
!).( '
!#.+ '
!".! '
!".# '
#&.% '
%.( '
$.& '
(.& '
$*.( '
(+.% '
(#.* '
(#.! '
)!.! '
)$.$ '
+%.$ '
+(.# '
+)." '
+!.! '
+"." '
!$.& '
!).$ '
!+." '
!#.# '
#$.( '
#*.& '
#&.* '
%." '
$.+ '
(.) '
#&.( '#&." '
#%.( '
#).( '
#+.) '
&.* '
*.# '
*." '
#%.# '#&.$ '!".& '
#).% '
#+.# '
&.& '
%.+ '
*.# '
Sweden
Finland
Latvia
Estonia
Denmark
Lithuania
Croatia
Portugal
Slovenia
Austria
Bulgaria
Romania
Greece*
Cyprus
France
Malta
Italy
Czechia
Hungary
Spain
Poland
Germany
Slovakia
Luxembourg
Belgium
United Kingdom
Ireland
Netherlands
Total EU !*
Share of renewable energy in heating and cooling of EU countries in 2016 and 2017
4
Source: SHARES 2017 (updated 4 February 2019)
promotion policies, because heating requirements are directly correlated with average temperature levels. We should signal that over and above considerations of climate, energy efficiency efforts made possible by better building insulation and high performance heating appliances enable the full energy benefit of primary renewable energy to be drawn. The installa-tion of a new wood heating system, replacing an older wood heating system, will have the effect of reducing the final renewable energy consumption, even more if insulation work has been done.
If we examine the individual sector trends, the increases can be largely ascribed to the additional input of solid biomass (1.6!Mtoe) and to a lesser extent the heat pump sector (0.5!Mtoe), renewable municipal waste (0.2!Mtoe), charcoal (0.2!Mtoe), solar thermal (0.1!Mtoe) and biogas (0.1 ktoe). The increased input of the geothermal sector was lower (0.05!Mtoe) and the liquid biomass input broadly remained stable.
According to EurObserv’ER’s calculations, the distri-bution between the various renewable heat sectors changed little between 2016 and 2017 (graph 3). Solid
biomass is still the dominant renewable heat source (78.6% of the 2017 total) equating to 80.3!Mtoe of consumption. Heat pumps, be they air-sourced, hydro-thermal or ground-sourced, provide the European Union with its second biggest source of renewable heat – a 10.2% share and output of 10.5!Mtoe. They are followed by renewable municipal waste (a 3.7% share and output of 3.8!Mtoe), biogas (3.6%, 3.7!Mtoe), solar (2.3%, 2.3!Mtoe), geothermal energy (0.8%, 0.8!Mtoe) and liquid biomass (0.4%, 0.4!Mtoe).
Given the total increase in heat consumption from 522.3!Mtoe in 2016 to 524.5!Mtoe in 2017 (0.4%), the renewable heat share rose to 19.5% (19.0% in 2016). If we take 2005 as the reference year (11.1%), we arrive at an 8.4 percentage point gain.
From 2005 to 2017, the highest renewable heat share growth can be credited to Denmark (23.7!pp), Estonia (19.5!pp), Malta (19.2!pp), Sweden (17.3!pp), Lithuania (17.2!pp), Finland (15.7!pp), Bulgaria (15.6!pp) and Slo-venia (14.3!pp). They contrast with the countries with

Energy indicators
EUROBSERV !ER " THE STATE OF RENEWABLE ENERGIES IN EUROPE " #$%& EDITIONEUROBSERV !ER " THE STATE OF RENEWABLE ENERGIES IN EUROPE " #$%& EDITION
94 95
0
10
20
30
40
50
60
Swed
en
Fin
lan
d
Latv
ia
Den
mar
k
Au
stri
a
Esto
nia
Port
uga
l
Cro
atia
Lith
uan
ia
Ro
man
ia
Slo
ven
ia
Bu
lgar
ia
Ital
y
Spai
n
Gre
ece*
Fran
ce
Ger
man
y
Cze
chia
Hu
nga
ry
Slo
vaki
a
Pola
nd
Irel
and
Un
ited
Kin
gdo
m
Cyp
rus
Bel
giu
m
Mal
ta
Net
her
lan
ds
Luxe
mb
ou
rg
Tota
l EU
28
!"#$!"#%
!"!" target
&'.(
)&*
.& )
*+."
)
'+."
)*#
." )
'(."
)
'%.#
)'+
." )
*"."
)
'!.$
) '&.(
)'"
." )
'' )
'!.$
)'*
." )
!(.$
)!+
.! )
!&."
) !(.*
)!(
.# ) '#
." )
!(.'
)!%
.' )
!"."
)
!&.$
)!&
.( )
!'."
)
!&."
)!*
.& )
!*."
)
!#.'
)!#
.& ) !&
." )
#(.(
)#(
.% )
#$."
)
#%.*
)#(
.' )
#%."
)
#%.*
)#%
.& ) !"
." )
#&.#
)#$
.' )
#(."
)
#&.+
)#$
.' )
!'."
)
#*.+
)#&
.& ) #(
." )
#*.+
)#*
.( )
#'."
)
#*.'
)#'
.' )
#'."
)
#!."
)##
.& ) #*
." )
##.'
)#"
.+ ) #&
." )
+.' )
#".%
)#$
." )
+.! )
#".!
)#&
." )
+.' )
+.+ ) #'
." )
(.$ )
+.# ) #'
." )
$.! )
%.! )
&.+ )
$.$ )
&.* )
$.* )
#%."
)#%
.& )
#"."
) #*."
)
##."
)
!"."
)
* estimated, provisional for Greece. Note: SHARES tool version 2017 that takes into account specific calculation provisions as in place in Directive 2009/28/EC following its amendment by Directive (EU) 2016/1513 of the European Parliament and of the Council of 9 September 2016 amending Directive 98/70/EC relating to the quality of petrol and diesel fuels and amending Directive 2009/28/EC on the promotion of the use of energy from renewable sources. Source: SHARES 2017 (updated 4 February 2019)
Share of energy from renewable sources in gross final energy consumption in 2016 and 2017 and 2020 targets
5
the lowest growth increases – Portugal (2.3!pp), Ire-land (3.4!pp), the Netherlands (3.5!pp), Poland (4.3!pp) and Luxembourg (4.5!pp).
Turning to the Member States, as biomass is patently the main renewable heat source, the biggest renewable heat share in total heat consumption naturally occurs in countries with forestry industries. It even dominates or almost dominates the heat mix in Northern Europe (68.6% in Sweden, 53.7% in Fin-land), and the Baltic States (54.6% in Latvia, 51.6% in Estonia and 46.5% in Lithuania). At the bottom of the scale, renewable heat has a tiny share of the heat mix in the Benelux (Luxembourg 8.1%, Belgium 8.0%, and 5.9% in the Netherlands) and the British Isles (6.9% in Ireland and 7.5% in the UK).
HALF A PERCENTAGE POINT CLOSER TO THE !"!" TARGET IN !"#$Eurostat has published its preliminary results for the renewably-sourced share of energy that meets the 2009/28/EC directive calculated by its SHARES (Short Assessment of Renewable Energy Sources) tool. The 4 February 2019 update confirms the December esti-mates made for the EurObserv’ER project across the whole of the European Union. The renewably-sourced share of gross final energy consumption was 17.5% in 2017, which is half a percentage point improvement (0.5!pp) on 2016.
The 2017 increase in the renewable energy share across the European Union was a little higher than that of 2016 when 0.3!pp was added between 2015
and 2016. Yet it is still below the gains made in 2012 (1.3!pp), 2013 (0.7!pp) and 2014 (0.8!pp). The current growth rate is too low to meet the 2020 target, for it needs to be at least 0.83!pp every year between 2018 and 2020. With collective effort the target still remains within the European Union’s reach, prima-rily by implementing cooperation mechanisms that include “statistical transfers” from countries that expect to overshoot their targets to countries expec-ting to fall short of target.
Each EU Member State has its own 2020 target. The national targets make allowance for the starting point situation differences as well as the renewable energy potentials, ambitions and economic perfor-mances specific to the Member States. The major forestry countries and/or those with high hydro-power potential are naturally at an advantage. This applies to Sweden whose renewably-sourced energy dominated its energy mix at 54.5% in 2017.
Four other countries produce a third or more of their final energy consumption from renewable sources – Finland (41.0%), Latvia (39.0%), Denmark (35.8%) and Austria (32.6%). At the other end of the scale five countries had renewable energy shares of less than 10% (i.e. two fewer than in 2016, as the UK and Ireland left the group in 2017). The five are Cyprus (9.9%), Belgium (9.1%), Malta (7.2%), the Netherlands (6.6%), and Luxembourg (6.4%).
An update on 2017 shows that a sizeable majority of the member countries are on course to make their targets, ergo, they have already achieved target, or are on track to do so by their indicative renewable energy directive trajectories. The provisional SHARES results show that 11 member countries had exceeded their 2020 targets in 2017. They are the same 11 as last year, i.e.: Sweden ( by 5.5!pp), Finland (by 3!pp), Denmark by

Energy indicators
EUROBSERV !ER " THE STATE OF RENEWABLE ENERGIES IN EUROPE " #$%& EDITIONEUROBSERV !ER " THE STATE OF RENEWABLE ENERGIES IN EUROPE " #$%& EDITION
96 97
Countries 2016 2017 Indicative trajectory 2017-2018
Sweden 53.8% 54.5% 45.8%
Finland 39.0% 41.0% 34.7%
Latvia 37.1% 39.0% 37.4%
Denmark 32.6% 35.8% 25.5%
Austria 33.0% 32.6% 30.3%
Estonia 28.6% 29.2% 22.6%
Portugal 28.4% 28.1% 27.3%
Croatia 28.3% 27.3% 17.4%
Lithuania 25.6% 25.8% 20.2%
Romania 25.0% 24.5% 21.8%
Slovenia 21.3% 21.5% 21.9%
Bulgaria 18.8% 18.7% 13.7%
Italy 17.4% 18.3% 12.9%
Spain 17.4% 17.5% 16.0%
Greece* 15.1% 16.3% 14.1%
France 15.9% 16.3% 18.6%
Germany 14.9% 15.5% 13.7%
Czechia 14.9% 14.8% 10.6%
Hungary 14.3% 13.3% 10.0%
Slovakia 12.0% 11.5% 11.4%
Poland 11.3% 10.9% 12.3%
Ireland 9.3% 10.7% 11.5%
United Kingdom 9.2% 10.2% 10.2%
Cyprus 9.3% 9.9% 9.5%
Belgium 8.6% 9.1% 9.2%
Malta 6.2% 7.2% 6.5%
Netherlands 5.9% 6.6% 9.9%
Luxembourg 5.4% 6.4% 7.5%
Total EU 28 17.0% 17.5% -
* estimated, provisional for Greece. Note: SHARES tool version 2017 that takes into account specific calculation provisions as in place in Directive 2009/28/EC following its amendment by Directive (EU) 2016/1513 of the European Parliament and of the Council of 9 September 2016 amending Directive 98/70/EC relating to the quality of petrol and diesel fuels and amending Directive 2009/28/EC on the promotion of the use of energy from renewable sources. Source: SHARES 2017 (updated 4 February 2019)
Share of energy from renewable sources in gross final energy consumption in 2016 and 2017 and indicative trajectory
65.8!pp), Estonia by 4.2!pp), Croatia by 7.3!pp), Lithuania by 2.8!pp), Romania (by 0.5!pp), Bulgaria (by 2.7!pp), Italy (by 1.3!pp), the Czech Republic (by 1.8!pp) and Hungary (by 0.3!pp). The countries furthest off the mark are the Netherlands (7.4!pp under target), France (6.7!pp), Ire-land ( 5.3!pp), the UK (4.8!pp) and Luxembourg (4.6!pp).
If we now focus on the indicative trajectory, whose percentage is identical for 2017–2018, only a hand-ful of countries fell behind. The worst offenders are the Netherlands (3.3!pp off track) and France (2.3!pp off track). The shortfalls are smaller for Poland (by 1.4!pp), Luxembourg (by 1.1!pp), Ireland (by 0.8!pp) while Slovenia and Belgium are only very slightly off track (by 0.3!pp and 0.2!pp respectively).
Growth of the renewable share is not always linear and can slip from one year to the next. In 2017, the renewable share of about one third of the member countries (9 of the 28) contracted on its 2016 level, but this is an improvement on 2016, when 13 countries had slightly lower renewable shares than in 2015. In 2017, the nine countries with lower renewable shares were Austria, Portugal, Poland, Slovakia, Croatia, Romania, Bulgaria, the Czech Republic and Hungary. Leaving aside Hungary, the drop in the renewable share cannot be attributed to a drop in final renewable energy consumption but to higher growth in final consumption of non-renewable energy (oil, gas, coal and nuclear energy). For the third year running, and having approached its 2020 target in 2014, the EU’s final energy consumption is increasing according to Eurostat. It was measured in the European Union of 28 at 1 122.3 Mtoe in 2017, which is a 1.1% annual rise (1 109.8 toe in 2016). The reason for this increase is the upturn in economic activity, as the European Union’s GDP grew by 2.4% in 2017, which is the highest annual growth rate since the 2009 financial crisis.
But the additional energy needs of a country driven by economic growth in certain specific sectors rela-ting to economic activity (such as industry and trans-port) have yet to be systematically filled by increased renewable energy development.
The European Union now has three years left in which to gain the missing 2.5!pp to reach its 2020 target and create the best foundations for meeting the new renewable energy directive 2018/2001 goals. This
new directive that was finally adopted on 11 Decem-ber 2018, makes it binding on the Member States to collectively ensure that the renewably-sourced energy share of the EU’s gross final energy consumption in 2030 is at least 32%.
While quantified targets are important for the industry players involved in energy transition, as well as for the programming laws that will ensure their implementation at national level, it is crucial that the European Union gives its citizens a long-term strategic vision, a common goal, in order to reach a prosperous, modern and climate neutral economy by 2050.
The European Council, made up of Heads of State and governments, has asked the European Commission to present it with a climate strategy for 2050 by the first quarter of 2019. It must comply with the Paris Agreement and integrate the national climate-energy plans. A preliminary response was submitted by the European Commission on 28 November 2018 in the form of a communication entitled “A Clean Planet for All”. It offers a strategic vision of the economic and social sea changes required to set up a climate-neutral economy. The underlying idea is not to set targets, but to ensure that the transition is socially fair, that it does not side-line Europeans or leave regions behind schedule but empower and strengthen the competitiveness of the European economy in global markets. According to the Commission, achieving a climate-neutral economy by 2050 is technologically, economically and socially achie-vable but will call for radical societal and economic transformations within a single generation. Thus, the Commission has listed its strategic priorities to achieve climate neutrality for the economy. Its first measure is full decarbonisation of the European energy procu-rement system, with large-scale electrification of the energy system coupled with significant deployment of renewables, maximising the benefits of energy effi-ciency, by almost halving energy consumption between 2005 and 2050, (and a target of 956 Mtoe in 2030), deve-loping intelligent infrastructures and smart grids, spreading the benefits of bio-economy and creating a carbon sink by developing sustainable agriculture and land management, setting up carbon capture and sto-rage systems, implementing clean, connected mobility and making industrial modernisation the flagship of a circular economy.

Socio-economic indicators
EUROBSERV !ER " THE STATE OF RENEWABLE ENERGIES IN EUROPE " #$%& EDITIONEUROBSERV !ER " THE STATE OF RENEWABLE ENERGIES IN EUROPE " #$%& EDITION
98 99
The following chapter sheds a light on the European renewable energy sectors in terms
SOCIO!ECONOMIC INDICATORS
For the socio-economic indicators, an important methodological change has been implemented as of the 2017 Edition of ‘The State of Renewable Energy in Europe’, by setting up a modelling envi-ronment that formalises the assessment procedure of employment and turnover. The model was deve-loped by the Energy research Centre of the Nether-lands (ECN), currently ECN part of TNO.
It is important to note that the indicators used in this methodology differ from those of previous years (up to and including Edition 2016); instead of determining the actual jobs that are present or revenues made in a certain year, the methodology determines the jobs and revenues that are rela-ted to the capacity of a technology (installed and already present) of a certain year. This subtle diffe-rence means that a sudden decline or increase in jobs as presented in this study does not necessarily correspond with what is observed by national sec-
Methodological note
tor associations, as during short periods in which less new technology capacity is installed, compa-nies (and their employees) can still continue to hold on using their reserves.
The new methodological approach is based on an evaluation of the economic activity of each renewable sector covered, which is then expressed into full-time equivalent (FTE) employment. Note that from this point on the term ‘job’ will refer to a full-time equivalent. This new approach focuses on money flows from four distinct activities:1. Investments in new installations;2. Operational and maintenance activities for exis-
ting plants including the newly added plants;3. Production and trading of renewable energy
equipment;4. Production and trading of biomass feedstock.
of socioeconomic impacts. All 28 members States are covered for 2016 and 2017.
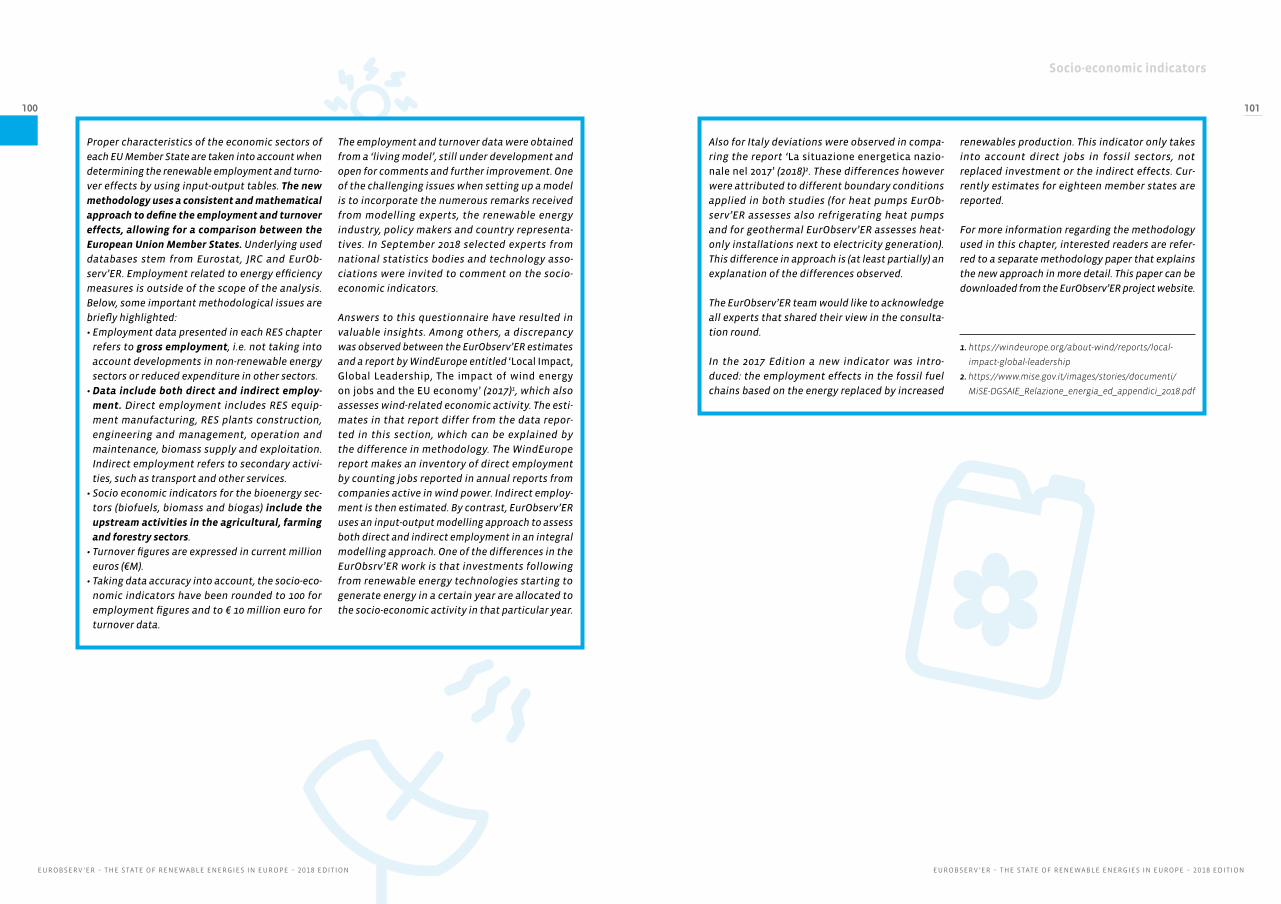
Socio-economic indicators
EUROBSERV !ER " THE STATE OF RENEWABLE ENERGIES IN EUROPE " #$%& EDITIONEUROBSERV !ER " THE STATE OF RENEWABLE ENERGIES IN EUROPE " #$%& EDITION
100 101
Proper characteristics of the economic sectors of each EU Member State are taken into account when determining the renewable employment and turno-ver effects by using input-output tables. The new methodology uses a consistent and mathematical approach to define the employment and turnover effects, allowing for a comparison between the European Union Member States. Underlying used databases stem from Eurostat, JRC and EurOb-serv’ER. Employment related to energy efficiency measures is outside of the scope of the analysis. Below, some important methodological issues are briefly highlighted:• Employment data presented in each RES chapter
refers to gross employment, i.e. not taking into account developments in non-renewable energy sectors or reduced expenditure in other sectors.
• Data include both direct and indirect employ-ment. Direct employment includes RES equip-ment manufacturing, RES plants construction, engineering and management, operation and maintenance, biomass supply and exploitation. Indirect employment refers to secondary activi-ties, such as transport and other services.
• Socio economic indicators for the bioenergy sec-tors (biofuels, biomass and biogas) include the upstream activities in the agricultural, farming and forestry sectors.
• Turnover figures are expressed in current million euros (!M).
• Taking data accuracy into account, the socio-eco-nomic indicators have been rounded to 100 for employment figures and to !"10 million euro for turnover data.
The employment and turnover data were obtained from a ‘living model’, still under development and open for comments and further improvement. One of the challenging issues when setting up a model is to incorporate the numerous remarks received from modelling experts, the renewable energy industry, policy makers and country representa-tives. In September 2018 selected experts from national statistics bodies and technology asso-ciations were invited to comment on the socio-economic indicators.
Answers to this questionnaire have resulted in valuable insights. Among others, a discrepancy was observed between the EurObserv’ER estimates and a report by WindEurope entitled ‘Local Impact, Global Leadership, The impact of wind energy on jobs and the EU economy’ (2017)1, which also assesses wind-related economic activity. The esti-mates in that report differ from the data repor-ted in this section, which can be explained by the difference in methodology. The WindEurope report makes an inventory of direct employment by counting jobs reported in annual reports from companies active in wind power. Indirect employ-ment is then estimated. By contrast, EurObserv’ER uses an input-output modelling approach to assess both direct and indirect employment in an integral modelling approach. One of the differences in the EurObsrv’ER work is that investments following from renewable energy technologies starting to generate energy in a certain year are allocated to the socio-economic activity in that particular year.
Also for Italy deviations were observed in compa-ring the report ‘La situazione energetica nazio-nale nel 2017’ (2018)2. These differences however were attributed to different boundary conditions applied in both studies (for heat pumps EurOb-serv’ER assesses also refrigerating heat pumps and for geothermal EurObserv’ER assesses heat-only installations next to electricity generation). This difference in approach is (at least partially) an explanation of the differences observed.
The EurObserv’ER team would like to acknowledge all experts that shared their view in the consulta-tion round.
In the 2017 Edition a new indicator was intro-duced: the employment effects in the fossil fuel chains based on the energy replaced by increased
renewables production. This indicator only takes into account direct jobs in fossil sectors, not replaced investment or the indirect effects. Cur-rently estimates for eighteen member states are reported.
For more information regarding the methodology used in this chapter, interested readers are refer-red to a separate methodology paper that explains the new approach in more detail. This paper can be downloaded from the EurObserv’ER project website.
1. https://windeurope.org/about-wind/reports/local-
impact-global-leadership
2. https://www.mise.gov.it/images/stories/documenti/
MiSE-DGSAIE_Relazione_energia_ed_appendici_2018.pdf

Socio-economic indicators
EUROBSERV !ER " THE STATE OF RENEWABLE ENERGIES IN EUROPE " #$%& EDITIONEUROBSERV !ER " THE STATE OF RENEWABLE ENERGIES IN EUROPE " #$%& EDITION
102 103
WIND POWER
Wind power sector remains an important contribu-
tor to employment within the EU’s renewable energy market. According to the EurObserv’ER model, employment picked up in 2017 after a drop in turnover and employment in 2016, increasing from an estimated 309 000 to 356!700!FTE. The turnover increased from an estimated 39 250 M"! to 48 040 M"!. The top five countries in terms of wind energy related employment remains similar as in 2016, except for the Nether-lands whose fifth place is claimed by France. Both the onshore and offshore wind sector has been assessed in this chapter.
The total additional installed wind turbines in 2017 increased, mainly due to offshore wind (3!228.6 ins-talled!MW in 2017 compared to 1!613.8!MW in 2016). The employ-ment related to the wind energy sector increased significantly. The export of wind turbines and offshore foundations remains strong. In particular, the manu-facturing sectors of wind turbine producers such as Denmark, Ger-many and Spain, profited from this.
Vestas (Denmark), Siemens Gamesa (Germany and Spain) and Enercon (Germany) are the biggest players in the EU with their exports going to non-EU countries: India, USA, Argentina, Chile, Canada, Mexico, China, Egypt, Taiwan, Thailand and Vietnam.
In Germany, the number of!FTE jobs derived from wind power has reached 140 800 jobs as compared to 121 700 jobs in the past year with revenues surpassing "!20 billion. Germany secures its position as the EU leader in job creation within the wind power sector accounting for 39.5% of the total jobs in this sec-tor. Job creation could be attribu-ted towards Germany’s impressive and record-breaking growth within this one-year period. According to Eurostat, Germany installed 6!126!MW worth of capacity in 2017 of which 4!431.5!MW accounted for onshore wind facilities and 1!694.5!MW accounted for offshore wind. Changes in support systems offered by the German govern-ment have boosted growth of the industry and incentivized develo-pers to seize advantageous pay-ment options, encouraged in part
by the move towards a tendering system and direct sales. Bidding values for the three tenders in 2017 showed a remarkable drop over the year. The Renewable Energy Office of the German Ministry for Economic Affairs and Energy (BMWi) concludes that if the ten-der results in offshore wind pricing continues on this downward trend in 2018, future bids at 0 euro cents per kWh are a possibility.
With an impressive year-on-year increase of 63% United Kingdom had the second highest number of!FTE with a total of 69 900 jobs. Revenues derived from the sector followed a similar trend, totalling "!7.4 billion in 2017 ("!4.5 billion in 2016). This number of!FTE accounts for 19.6% of all wind related jobs in the EU.
Spain came in 3rd in terms of the number of!FTE with 37 200 jobs, accounting for 10% of the total jobs within the wind sector in the EU. Revenues continue to increase from "!2.8 billion in 2016 to "!4.3 billion in 2017. Strong growth
Acc
ion
a

Socio-economic indicators
EUROBSERV !ER " THE STATE OF RENEWABLE ENERGIES IN EUROPE " #$%& EDITIONEUROBSERV !ER " THE STATE OF RENEWABLE ENERGIES IN EUROPE " #$%& EDITION
104 105
Employment (direct and indirect jobs)
Turnover (in ! m")
2016 2017 2016 2017
Germany 121"700 140"800 16"060 20"040
United Kingdom 42"900 69"900 4"490 7"360
Denmark 26"600 34"200 4"600 6"310
Spain 23"500 37"200 2"820 4"340
Netherlands 21"500 5"800 2"680 830
France 18"800 18"500 2"790 2"860
Poland 11"400 8"000 790 660
Portugal 6"400 3"100 500 320
Italy 6"300 7"500 950 1"120
Sweden 4"900 2"700 1"010 620
Ireland 4"200 6"500 440 700
Greece 3"700 3"100 300 230
Finland 3"500 4"100 520 630
Romania 2"500 2"100 150 160
Belgium 2"300 5"500 450 1"100
Austria 1"700 2"000 280 350
Estonia 1"600 1"200 90 80
Lithuania 1"600 500 60 30
Czechia 900 900 60 70
Croatia 900 1"100 50 70
Hungary 800 800 50 50
Bulgaria 600 500 30 30
Luxembourg 200 100 30 20
Cyprus <100 200 <10 20
Latvia <100 <100 <10 <10
Malta <100 <100 <10 <10
Slovenia <100 <100 <10 <10
Slovakia <100 <100 <10 <10
Total EU 28 309"000 356"700 39"250 48"040
Source: EurObserv’ER 2018
Employment and turnover
in employment was fuelled by a surge of activity in the manufac-turing sector and by wind farm developers (for instance Iberdrola Renovables that developed and operated 16 077!MW in 2017).
The number of!FTE in Denmark rose by 28.7% from 2016 levels to attain 34 200 in 2017. Revenues for the year added up to "!6.3 billion. The increase is partly related to domestic realised wind energy pro-jects, but the majority of the!FTE are due to manufacturing of wind turbine equipment that is exported to other EU and non-EU countries. With a total of 5!522!MW of wind
capacity developed and operated in 2017, Denmark also leads in terms of wind power capacity per 1 000 inhabitants with an astoun-ding capacity of 960.3 kW/1000 inhabitants. In comparison, Ger-many, ranked fourth, has only 671.5kW/1000 inhabitants. Den-mark has also achieved a cumu-lative capacity of 5!522!MW at the end of 2017 of which 1!296.8!MW in offshore wind capacity. This makes it the country with the third largest offshore energy sector in the EU (after the UK and Germany).
In France, the number of!FTE fell slightly from 18 800 jobs in 2016
to 18 500 in 2017 even though the total installed capacity of onshore wind in France increased by 15.3% to reach 13 512!MW. The decline in jobs appears to be caused by a lower net export of wind turbine equipment compared to 2016. Favourable weather conditions resulted in an increase in elec-tricity produced from the wind sector from 0.7% in 2016 to 15% in 2017. At the same time, the number of projects in the pipeline grew by 5%. A contributing factor was a more robust regulatory framework that enabled the shift towards top-up remuneration and a phasing out of feed-in tariffs.
PN
E W
IND
AG
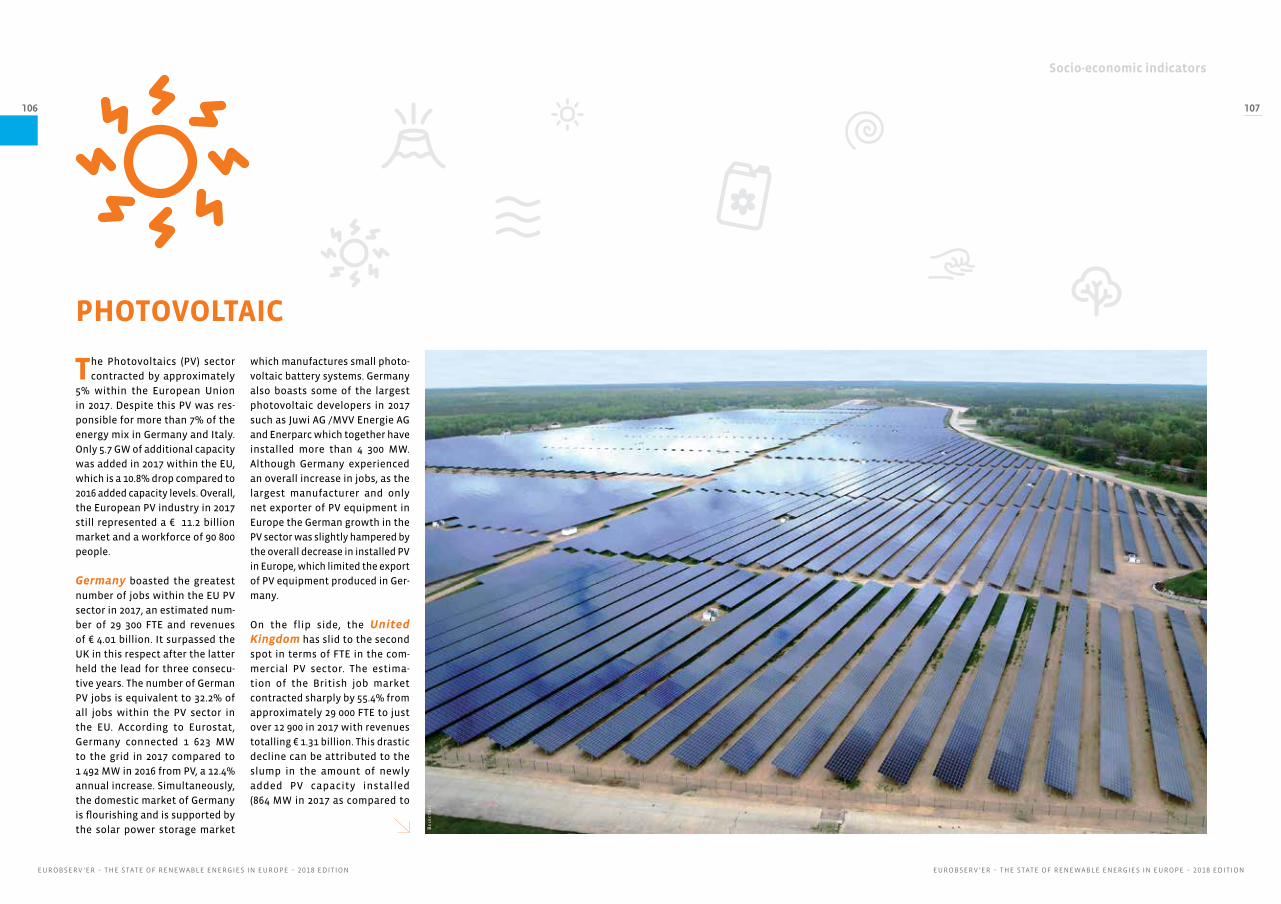
Socio-economic indicators
EUROBSERV !ER " THE STATE OF RENEWABLE ENERGIES IN EUROPE " #$%& EDITIONEUROBSERV !ER " THE STATE OF RENEWABLE ENERGIES IN EUROPE " #$%& EDITION
106 107
PHOTOVOLTAIC
The Photovoltaics (PV) sector contracted by approximately
5% within the European Union in 2017. Despite this PV was res-ponsible for more than 7% of the energy mix in Germany and Italy. Only 5.7!GW of additional capacity was added in 2017 within the EU, which is a 10.8% drop compared to 2016 added capacity levels. Overall, the European PV industry in 2017 still represented a "! 11.2 billion market and a workforce of 90 800 people.
Germany boasted the greatest number of jobs within the EU PV sector in 2017, an estimated num-ber of 29 300! FTE and revenues of "!4.01 billion. It surpassed the UK in this respect after the latter held the lead for three consecu-tive years. The number of German PV jobs is equivalent to 32.2% of all jobs within the PV sector in the EU. According to Eurostat, Germany connected 1! 623! MW to the grid in 2017 compared to 1!492!MW in 2016 from PV, a 12.4% annual increase. Simultaneously, the domestic market of Germany is flourishing and is supported by the solar power storage market
which manufactures small photo-voltaic battery systems. Germany also boasts some of the largest photovoltaic developers in 2017 such as Juwi AG /MVV Energie AG and Enerparc which together have installed more than 4 300! MW. Although Germany experienced an overall increase in jobs, as the largest manufacturer and only net exporter of PV equipment in Europe the German growth in the PV sector was slightly hampered by the overall decrease in installed PV in Europe, which limited the export of PV equipment produced in Ger-many.
On the flip side, the United Kingdom has slid to the second spot in terms of!FTE in the com-mercial PV sector. The estima-tion of the British job market contracted sharply by 55.4% from approximately 29 000!FTE to just over 12!900 in 2017 with revenues totalling "!1.31 billion. This drastic decline can be attributed to the slump in the amount of newly added PV capacity installed (864!MW in 2017 as compared to
Bel
ectr
ic

Socio-economic indicators
EUROBSERV !ER " THE STATE OF RENEWABLE ENERGIES IN EUROPE " #$%& EDITIONEUROBSERV !ER " THE STATE OF RENEWABLE ENERGIES IN EUROPE " #$%& EDITION
108 109
Employment (direct and indirect jobs)
Turnover (in ! m")
2016 2017 2016 2017
Germany 27"100 29"300 3"400 4"010
United Kingdom 29"000 12"900 2"810 1"310
Italy 10"700 11"200 1"400 1"450
France 5"200 9"300 710 1"310
Netherlands 4"700 6"000 560 730
Spain 2"200 5"500 220 500
Belgium 2"400 3"000 440 570
Austria 1"300 1"600 190 260
Portugal 700 1"500 40 90
Hungary 2"000 1"300 90 60
Czechia 1"700 1"300 110 100
Greece 1"100 1"300 90 90
Poland 1"500 1"100 90 80
Denmark 1"200 1"100 200 190
Romania 1"800 900 90 60
Finland 400 700 80 120
Bulgaria 800 600 30 30
Sweden 300 500 60 90
Cyprus <100 500 <10 30
Malta 100 300 <10 20
Slovakia 400 200 20 20
Lithuania 300 100 10 <10
Slovenia 300 100 20 10
Estonia 200 100 10 <10
Croatia <100 100 <10 <10
Luxembourg <100 100 10 10
Ireland <100 <100 <10 10
Latvia <100 <100 <10 <10
Total EU 28 95"900 90"800 10"730 11"190
Source: EurObserv’ER 2018
2!364!MW in 2016). The downturn was induced by the fact that not a single solar project has qualified since the second auction under the Contract for Difference (CID) system. Nevertheless, the output from solar power has increased by 10.7% as compared to 2016 and currently accounts for 3.2% of the UK’s electricity output.
Italy clinched the third place with 11 200!FTEs in 2017, a slight year-on-year growth of 4.6%. Revenues for 2017 amounted to "!1.45 billion. The total added capacity increased from 382!MW in 2016 to 399!MW in
2017 bringing the total connected and cumulated PV capacity to 19!682!MW at the end of the year. Employment in Italy could poten-tially be driven by the presence of solar PV developers such as Enerl Green Power, who installed 1 200!MWp of PV capacity in 2017, as well as the need for workers for both the installation of new PV panels as well as the repair and maintenance of older equipment.
The number of jobs in France has increased by an astounding 78.7% to reach 9 300! FTE with revenues amounting to "!1.3 bil-
lion. This rebound is in part faci-litated by the positive traction that France is gaining after 2016’s disappointing performance. With more than eight calls for tender in 2017, amounting to 1 503!MW, the sector is expected to display continued growth as well in 2018. This growth will be additionally driven by an increase in the ten-der volume for solar PV by 1!GW in the coming year. Unprecedented growth in the domestic market boosted employment numbers as the number of households produ-cing their own electricity jumped from 8 000 to 20 000 in 2017.
Fir
st S
ola
r
Employment and turnover

Socio-economic indicators
EUROBSERV !ER " THE STATE OF RENEWABLE ENERGIES IN EUROPE " #$%& EDITIONEUROBSERV !ER " THE STATE OF RENEWABLE ENERGIES IN EUROPE " #$%& EDITION
110 111
The solar thermal market in the EU once again contracted with
a further decline of 17% for the 9th year running with a little more than 2 million m2 installed surface area. European solar thermal mar-kets are finding it challenging to stabilize and are struggling to stay afloat. Regulations curbing the ins-tallation of solar thermal collec-tors, restrictive political choices as well as competition from both ‘fossil’ and ‘electric’ technologies that are becoming more efficient and other renewables, are some of the factors that contribute to the deterioration of the market in the EU. In the concentrated solar power (CSP) sector, the EU market has slowed down with 2 314!MW of installed power capacity including pilot plants and demonstrators. New projects are expected to be completed in 2018, mostly in Italy, which should lead to an increase in employment for this country. Total solar thermal sector employment is estimated at 21 900 jobs in and turnover at "!2.4 billion in 2017 as compared to 29 000 jobs and "!3.4 billion in 2016.
SOLAR THERMAL
Spain has maintained its title of the largest European player, with the number of!FTE totalling 8 100 and revenues reaching "!970 mil-lion, a slight increase from 2016 levels. Most of these workers ope-rate and do maintenance on the existing concentrated solar power (CSP) installations or provide rela-ted secondary activities. Although the growth of yearly newly added solar thermal installations has dipped by about 6%, growth is still anticipated in this sector. This is due to the obligation under the Technical Building Code (CTE) to provide between 30% and 70% of all new buildings’ hot water needs from renewable hot water produc-tion systems. Although this had ini-tially led to rapid growth in 2007, the Spanish property bubble burst just a year later leading to a plum-met in the number of new proper-ties being constructed and set the stage for declining developments since. This decline however began to reverse in 2017. Market growth resulting from the CTE scheme of 15% was perceived over the past year, although unsubsidised sys-tem sales fell. In the industrial and social service sector, instal-
led collector area has doubled in 2017 to 4 000m2, a clear indicator that the overall market decline can be attributed to the renova-tion market. Turning to CSP, the output achieved in Spain in 2017 reached 5 348 GWh as compared to 5 071 GWh 2016 according to Red Eléctrica de España. Although the temporary suspension to construct more CSP plants, due to refusal from the government to continue subsidies, has ended, Spain’s CSP market has yet to pick up. The shift towards more “technologically neutral” tenders in 2017 has major implications for the CSP sector as other competing technologies such as solar photovoltaic can get the upper hand in the application for these tenders.
Our estimation of employment in Germany is sharply going down in 2017 (-30%) to 4 500 from 6 400. Revenues added up to "!580M, a downturn from "!760M compared to the previous year. This slump can be ascribed to various reasons. There is strong competition from gas-fired heating and many installers
DEE
RN
S Fr
ance

Socio-economic indicators
EUROBSERV !ER " THE STATE OF RENEWABLE ENERGIES IN EUROPE " #$%& EDITIONEUROBSERV !ER " THE STATE OF RENEWABLE ENERGIES IN EUROPE " #$%& EDITION
112 113
Employment (direct and indirect jobs) Turnover
(in ! m")
2016 2017 2016 2017
Spain 8"000 8"100 980 970
Germany 6"400 4"500 760 580
Greece 1"500 2"000 110 130
Bulgaria 1"300 1"300 40 50
Austria 2"000 1"200 330 200
France 1"100 1"000 150 130
Italy 1"400 600 170 70
Portugal 200 500 10 30
Poland 1"100 300 70 20
Croatia 100 200 <10 10
Czechia 400 200 20 10
Denmark 3"200 200 530 30
Hungary 400 200 20 10
United Kingdom 200 200 10 10
Belgium 200 100 30 30
Cyprus 100 100 <10 10
Ireland 100 100 10 10
Malta <100 100 <10 <10
Netherlands 100 100 10 10
Slovakia <100 100 <10 <10
Slovenia 200 100 <10 <10
Estonia <100 <100 <10 <10
Finland <100 <100 <10 <10
Latvia <100 <100 <10 <10
Lithuania <100 <100 <10 <10
Luxembourg <100 <100 <10 <10
Romania 200 <100 <10 <10
Sweden <100 <100 20 10
Total EU 28 29"000 21"900 3"380 2"410
Source: EurObserv’ER 2018
Acc
or
Employment and turnover are additionally discouraged by the time lag between installation procedures and seeing profits. These factors are so influential, that even the energy efficiency sti-mulation programme “Anreizpro-gramm Energieef¬fizienz” (APEE) has been unsuccessful in its efforts to stimulate growth in the sector. According to the German Economics and Energy Ministry (BMWi), the country installed about 650 000m2 of collectors in 2017, a 15.1% drop compared to the previous year.
The estimation of!FTE in Greece is going from 1 500 to 2 000, showing remarkable growth in stark contrast to the downturn of other main European markets. Revenues totalling "!130 million were attained over the last year. The Greek solar thermal market expanded by a striking 16.2% to
reach 316 000m2 installed surface area in 2017. Competition between players has driven prices down drastically. Development was fur-ther enhanced by the expansion of distribution grids, cyber-com-merce as well as the emergence of do it yourself (DIY) chains in the market, and private labels working with original equipment manufacturers (OEM) partners- all amidst the backdrop of a recove-ring/ improving economy. Further-more, sales from export, e.g. by the Greek company Dimas Solar has increased by 12% as a result of the booming demand from the North African market. In terms of CSP, several projects were in the pipe-line in Greece amounting to about 125!MW at the start of 2018. These projects could also be a significant contributor to employment levels in the country.
The greatest fall in EurObserv’ER employment estimation rela-ted to solar thermal occurred in Denmark, mostly the result of a lack of newly installed solar ther-mal installations in Denmark in 2017 caused by changes in regu-lations. Note that there was a great increase in the number of solar thermal installations in 2016 whereas almost no new installa-tions took place in 2017. This has a highly negative impact on the!FTE derived using the methodology described earlier in this chapter. With both the demand from the domestic market as well as the export market dwindling, Den-mark takes a big loss in!FTE in both workers in the installation sector as well as in the manufacturing sector.
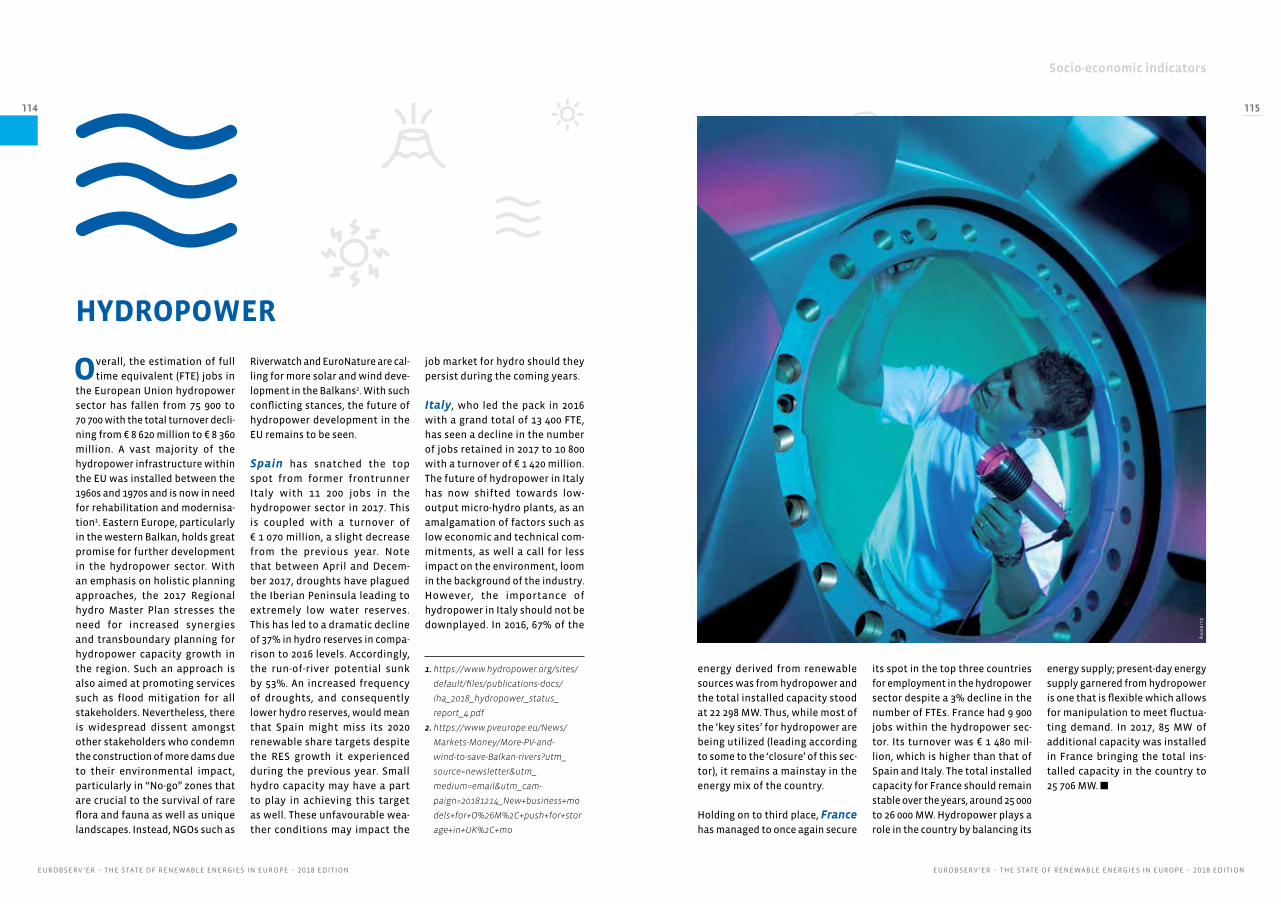
Socio-economic indicators
EUROBSERV !ER " THE STATE OF RENEWABLE ENERGIES IN EUROPE " #$%& EDITIONEUROBSERV !ER " THE STATE OF RENEWABLE ENERGIES IN EUROPE " #$%& EDITION
114 115
HYDROPOWER
Overall, the estimation of full time equivalent (FTE) jobs in
the European Union hydropower sector has fallen from 75 900 to 70!700 with the total turnover decli-ning from "!8!620 million to "!8!360 million. A vast majority of the hydropower infrastructure within the EU was installed between the 1960s and 1970s and is now in need for rehabilitation and modernisa-tion1. Eastern Europe, particularly in the western Balkan, holds great promise for further development in the hydropower sector. With an emphasis on holistic planning approaches, the 2017 Regional hydro Master Plan stresses the need for increased synergies and transboundary planning for hydropower capacity growth in the region. Such an approach is also aimed at promoting services such as flood mitigation for all stakeholders. Nevertheless, there is widespread dissent amongst other stakeholders who condemn the construction of more dams due to their environmental impact, particularly in “No-go” zones that are crucial to the survival of rare flora and fauna as well as unique landscapes. Instead, NGOs such as
Riverwatch and EuroNature are cal-ling for more solar and wind deve-lopment in the Balkans2. With such conflicting stances, the future of hydropower development in the EU remains to be seen.
Spain has snatched the top spot from former frontrunner Italy with 11 200 jobs in the hydropower sector in 2017. This is coupled with a turnover of "!1!070 million, a slight decrease from the previous year. Note that between April and Decem-ber 2017, droughts have plagued the Iberian Peninsula leading to extremely low water reserves. This has led to a dramatic decline of 37% in hydro reserves in compa-rison to 2016 levels. Accordingly, the run-of-river potential sunk by 53%. An increased frequency of droughts, and consequently lower hydro reserves, would mean that Spain might miss its 2020 renewable share targets despite the RES growth it experienced during the previous year. Small hydro capacity may have a part to play in achieving this target as well. These unfavourable wea-ther conditions may impact the
job market for hydro should they persist during the coming years.
Italy, who led the pack in 2016 with a grand total of 13 400!FTE, has seen a decline in the number of jobs retained in 2017 to 10 800 with a turnover of "!1 420 million. The future of hydropower in Italy has now shifted towards low- output micro-hydro plants, as an amalgamation of factors such as low economic and technical com-mitments, as well a call for less impact on the environment, loom in the background of the industry. However, the importance of hydropower in Italy should not be downplayed. In 2016, 67% of the
An
dr
itz
energy derived from renewable sources was from hydropower and the total installed capacity stood at 22!298!MW. Thus, while most of the ‘key sites’ for hydropower are being utilized (leading according to some to the ‘closure’ of this sec-tor), it remains a mainstay in the energy mix of the country.
Holding on to third place, France has managed to once again secure
its spot in the top three countries for employment in the hydropower sector despite a 3% decline in the number of!FTEs. France had 9 900 jobs within the hydropower sec-tor. Its turnover was "!1 480 mil-lion, which is higher than that of Spain and Italy. The total installed capacity for France should remain stable over the years, around 25 000 to 26 000 MW. Hydropower plays a role in the country by balancing its
energy supply; present-day energy supply garnered from hydropower is one that is flexible which allows for manipulation to meet fluctua-ting demand. In 2017, 85!MW of additional capacity was installed in France bringing the total ins-talled capacity in the country to 25!706!MW.
1. https://www.hydropower.org/sites/
default/files/publications-docs/
iha_2018_hydropower_status_
report_4.pdf
2. https://www.pveurope.eu/News/
Markets-Money/More-PV-and-
wind-to-save-Balkan-rivers?utm_
source=newsletter&utm_
medium=email&utm_cam-
paign=20181214_New+business+mo
dels+for+O%26M%2C+push+for+stor
age+in+UK%2C+mo

Socio-economic indicators
EUROBSERV !ER " THE STATE OF RENEWABLE ENERGIES IN EUROPE " #$%& EDITIONEUROBSERV !ER " THE STATE OF RENEWABLE ENERGIES IN EUROPE " #$%& EDITION
116 117
Employment (direct and indirect jobs)
Turnover (in ! m")
2016 2017 2016 2017
Spain 10"900 11"200 1"080 1"070
Italy 13"400 10"800 1"760 1"420
France 10"200 9"900 1"460 1"480
Sweden 4"800 4"700 940 950
Austria 4"800 4"600 770 790
Germany 5"200 4"600 650 650
Portugal 3"800 4"200 260 290
Romania 4"400 3"400 240 240
Bulgaria 2"900 2"300 120 120
United Kingdom 2"200 2"300 240 250
Greece 1"700 2"000 150 140
Czechia 1"700 1"500 110 110
Croatia 1"600 1"400 90 90
Finland 1"200 1"200 190 190
Slovakia 1"300 1"200 90 90
Poland 1"300 1"100 100 100
Latvia 1"100 1"000 50 50
Slovenia 900 800 60 60
Lithuania 800 700 30 30
Luxembourg 500 500 70 70
Belgium 400 400 80 80
Ireland 200 300 20 30
Hungary < 100 100 < 10 <10
Cyprus < 100 <100 < 10 <10
Denmark < 100 <100 < 10 <10
Estonia < 100 <100 < 10 <10
Malta < 100 <100 < 10 <10
Netherlands < 100 <100 < 10 <10
Total EU 28 75"900 70"700 8"620 8"360
Source: EurObserv’ER 2018
Off
ice
nat
ion
al d
u t
ou
ris
me
Luxe
mbo
urg
Employment and turnover
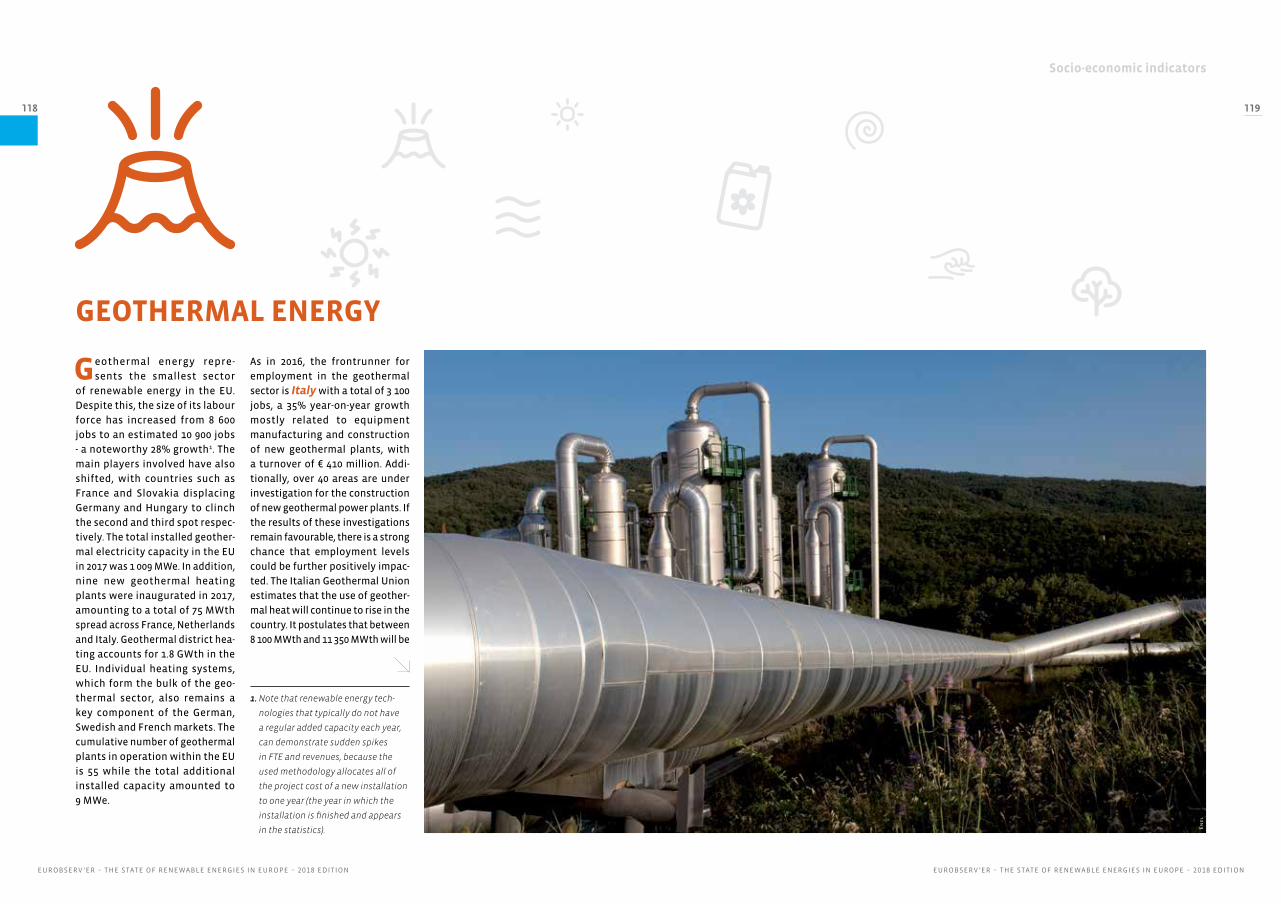
Socio-economic indicators
EUROBSERV !ER " THE STATE OF RENEWABLE ENERGIES IN EUROPE " #$%& EDITIONEUROBSERV !ER " THE STATE OF RENEWABLE ENERGIES IN EUROPE " #$%& EDITION
118 119
GEOTHERMAL ENERGY
Geothermal energy repre-sents the smallest sector
of renewable energy in the EU. Despite this, the size of its labour force has increased from 8 600 jobs to an estimated 10 900 jobs - a noteworthy 28% growth1. The main players involved have also shifted, with countries such as France and Slovakia displacing Germany and Hungary to clinch the second and third spot respec-tively. The total installed geother-mal electricity capacity in the EU in 2017 was 1 009 MWe. In addition, nine new geothermal heating plants were inaugurated in 2017, amounting to a total of 75!MWth spread across France, Netherlands and Italy. Geothermal district hea-ting accounts for 1.8 GWth in the EU. Individual heating systems, which form the bulk of the geo-thermal sector, also remains a key component of the German, Swedish and French markets. The cumulative number of geothermal plants in operation within the EU is 55 while the total additional installed capacity amounted to 9!MWe.
As in 2016, the frontrunner for employment in the geothermal sector is Italy with a total of 3 100 jobs, a 35% year-on-year growth mostly related to equipment manufacturing and construction of new geothermal plants, with a turnover of "!410 million. Addi-tionally, over 40 areas are under investigation for the construction of new geothermal power plants. If the results of these investigations remain favourable, there is a strong chance that employment levels could be further positively impac-ted. The Italian Geothermal Union estimates that the use of geother-mal heat will continue to rise in the country. It postulates that between 8 100!MWth and 11!350!MWth will be
1. Note that renewable energy tech-
nologies that typically do not have
a regular added capacity each year,
can demonstrate sudden spikes
in!FTE and revenues, because the
used methodology allocates all of
the project cost of a new installation
to one year (the year in which the
installation is finished and appears
in the statistics). Enel

Socio-economic indicators
EUROBSERV !ER " THE STATE OF RENEWABLE ENERGIES IN EUROPE " #$%& EDITIONEUROBSERV !ER " THE STATE OF RENEWABLE ENERGIES IN EUROPE " #$%& EDITION
120 121
Employment (direct and indirect jobs)
Turnover (in ! m")
2016 2017 2016 2017
Italy 2"300 3"100 310 410
France 600 2"500 90 360
Hungary 1"200 700 60 40
Slovakia 100 700 10 50
Denmark 300 600 50 100
Germany 1"200 500 150 70
Portugal < 100 400 < 10 30
Belgium < 100 200 < 10 40
Bulgaria 200 200 < 10 10
Romania 200 200 10 10
Croatia < 100 100 < 10 10
Lithuania < 100 100 < 10 10
Netherlands 500 100 70 10
Poland 200 100 10 10
Slovenia 100 100 < 10 10
Austria < 100 <100 10 10
Cyprus < 100 <100 < 10 <10
Czechia < 100 <100 < 10 <10
Estonia < 100 <100 < 10 <10
Finland < 100 <100 < 10 <10
Greece < 100 <100 < 10 <10
Ireland < 100 <100 < 10 <10
Latvia < 100 <100 < 10 <10
Luxembourg < 100 <100 < 10 <10
Malta < 100 <100 < 10 <10
Spain < 100 <100 < 10 <10
Sweden < 100 <100 < 10 10
United Kingdom < 100 <100 < 10 <10
Total EU 28 8"600 10"900 950 1"300
Source: EurObserv’ER 2018
Employment and turnover
2. https://www.euroheat.org/news/
new-geothermal-district-heating-sys-
tem-started-operation-slovakia/
reached by 2050 in terms of overall installed capacity.
With 2 500 jobs, France has overta-ken Germany to get the second top spot in terms of employment with a turnover valued at "!360 million. However, this promising develop-ment does not imply that the sector is performing at its optimal level. A study conducted by the Interna-tional Conference on Mutual Eco-nometrics (PIPAME) suggests that there is potential for more cohesion
between French offices, ministries and associations.
Slovakia’s geothermal market made an astounding leap with the level of employment in the industry jumping from 100!FTE in 2016 to 700!FTE in 2017. Turnover values also increased from "!10 to "!50 million within the same time period. This unprecedented growth is related to the gradual phase out of the coal and mining sector and political action taken
to utilize the country’s natural resources in an ecological way, resulting in a new geothermal energy installation coming online to supply heat to buildings in Velky Meder2.
Jose
f R
eite
r

Socio-economic indicators
EUROBSERV !ER " THE STATE OF RENEWABLE ENERGIES IN EUROPE " #$%& EDITIONEUROBSERV !ER " THE STATE OF RENEWABLE ENERGIES IN EUROPE " #$%& EDITION
122 123
HEAT PUMPS
The total heat pump (HP) market increased by 4.4% in 2017 with
34.4 million HP units sold in the EU. The number of units sold was, however, less than in 2016. Approxi-mately a third of this was used to cover heating needs in countries with colder climates while the remaining two-thirds were used for cooling purposes in countries where hot summers are prevalent. The lower heat pump sales led to a plunge of nearly 24% in the number of jobs EU wide with the final num-ber standing at 191 700!FTE. Growth could have been more significant if not for the slump in the Italian market- the biggest heat pump market in the EU. Correspondingly, revenues have also decreased from "!30 200 million in 2016 to "!22!730 million in 20171. The demand for heat pump units for summer coo-ling needs is the main driver of HP sales in France, Spain and Portugal.
Making its way to 1st place, Spain snatched the title of the country with the greatest number of jobs from former frontrunner Italy. With 56 600!FTE in 2017, the country has seen a dip by about 7.4% as compa-red to the previous year, the result
of less units domestically installed in comparison to 2016. It holds 28% of all the jobs in the HP sector in the EU. Turnover amounted to "!5!330 million in 2017, a compa-ratively small decrease from 2016 levels of "!5 800 million.
Sliding down to the second spot, Italy has encountered a decline in the number of jobs from 94 000!FTE in 2016 to 41 700!FTE in 2017. This was accompanied by a contraction in the turnover from "!12 280 mil-lion to "!5 490 million within the same time period. A reason for this could be that the Italian market has become saturated following record levels of growth in 2016 (55.4%). A 6.6% fall in the number of aerothermal HP2 units sold and stable geothermal (ground source) HP sales in 2017 could be attribu-ted to this3.
Moreover, the higher investment costs of heat pumps compared to conventional electric heaters is a deterrent for growth- and it must be noted that the electricity-to-gas price ratio has fluctuated over the
Stie
bel
Eltr
on

Socio-economic indicators
EUROBSERV !ER " THE STATE OF RENEWABLE ENERGIES IN EUROPE " #$%& EDITIONEUROBSERV !ER " THE STATE OF RENEWABLE ENERGIES IN EUROPE " #$%& EDITION
124 125
Employment (direct and indirect jobs)
Turnover (in ! m")
2016 2017 2016 2017
Spain 60"800 56"600 5"800 5"330
Italy 94"000 41"300 12"280 5"440
France 32"800 36"200 4"630 5"310
Netherlands 3"600 6"800 450 870
Portugal 7"400 13"800 440 860
Germany 14"500 9"300 1"920 1"350
Sweden 10"400 5"100 2"110 1"030
Finland 4"500 4"700 700 740
Poland 2"200 3"000 140 220
Czechia 1"800 2"600 110 180
Estonia 2"100 1"700 120 120
United Kingdom 1"800 1"700 170 170
Denmark 2"100 1"500 340 270
Belgium 1"500 1"400 280 270
Austria 1"900 1"300 300 220
Greece 1"400 1"200 110 100
Slovenia 500 900 30 60
Bulgaria 3"900 700 130 40
Hungary 500 400 20 20
Ireland 400 300 40 40
Lithuania 400 300 10 10
Romania 300 200 10 10
Slovakia 100 200 <10 20
Croatia <100 <100 <10 <10
Cyprus <100 <100 <10 <10
Latvia <100 <100 <10 <10
Luxembourg <100 <100 <10 <10
Malta <100 <100 <10 <10
Total EU 28 249"400 191"700 30"200 22"730
Source: EurObserv’ER 2018
course of the year. These factors coupled with a lack of knowledge in the supply chain, have led to end-users’ hesitating to invest in HPs. The information gap implies that many remain unaware of the advantages of HPs that could be exploited. Nevertheless, the future for HP is not entirely bleak.
Currently, three mechanisms exist in Italy that should help boost the HP industry in the long run. These include grants such as “white cer-tificates” which are distributed proportional to energy savings derived from HPs, tax rebates for replacing older systems, and cash grants for installing HPs in the
place of older technologies. Hybrid systems which combine gas boilers and aerothermal heat pumps are a relatively new form of technology that is also gaining traction.
France, on the other hand, has attained a slight growth over the year with 36 500!FTE garnered in 2017, a 11.3% year-on-year increase. This positive change is also mir-rored in the rise of turnover from "!4 630 million to "!5 350 million. According to EurObserv’ER, the 2017 French ASHP market was 9% up on its 2016 level (487 090 units sold in 2017), with 10% growth for air/water HPs (81 700 units sold in 2017) and 9% for air/ air HPs (405!390 units sold in 2017). Thermal regula-tions brought about in 2012 have proven advantageous for the 2017 construction market recovery. Increasing consumer awareness on the benefits of HPs has also moti-vated many to approach specialists and stable price levels have boosted confidence in the technology.
Stie
bel
Eltr
on
Employment and turnover
1. It must be noted that the market
data presented in this document
from Italy, Spain and France are
not directly comparable to other
countries as they include heat
pumps whose principal function is
cooling. This approach is in line with
the EU RES Directive
2. Aerothermal HPs include air-air, air-
water and exhaust air HPs.
3. https://www.eurobserv-er.org/pdf/
eurobserver-heat-pumps-barometer-
2018-en/
4. https://www.eurobserv-er.org/pdf/
eurobserver-heat-pumps-barometer-
2018-en/

Socio-economic indicators
EUROBSERV !ER " THE STATE OF RENEWABLE ENERGIES IN EUROPE " #$%& EDITIONEUROBSERV !ER " THE STATE OF RENEWABLE ENERGIES IN EUROPE " #$%& EDITION
126 127
BIOGAS
Within the EU, the estimation of the biogas job market
marginally contracted by approxi-mately 5% in 2017 as compared to 2016; going from 76 300 to 72! 400! FTE. Likewise, the total turnover fell from "!7 640 million to "!7!520 million within the same time period. The main reason for this decline since 2011 is the apprehensiveness of many EU states to the use of energy crops. Consequently, investments in the biogas market have shrunk.
Germany takes the lead with its labour force of 35 000!FTE, a slight dip of 2% as compared to 2016 levels. Altogether, this accounts for 48% of the total!FTE related to
Ag
riv
alo
r
biogas in the EU in 2017. Turnover levels stood at "!4 190 million, a small rise from the previous year ("!4 120 million in 2016). While the market appears to be stable, a threat looms in the distance for many German biogas operators. There are no flexible state regu-lations that allow for the feeding into the grid with biogas. As for equipment manufacturers, many local companies are beginning to rely on export of their products to keep their businesses afloat. Due to cutbacks for renewable energy, the number of biogas companies has shrunk dramatically from 400 in 2012 to 250 today. In 2018, only 137 biogas plants were built, in contrast to the 196 built in 2016. However,
hope is not lost for the German bio-gas industry if measures are taken for the implementation of a more flexible compensation scheme and opportunities to diversify (e.g. by feeding biogas into the public gas network).
With 8 400!FTEs and a turnover of "! 800 million, the United Kingdom has secured the second place in terms of employment in the EU. This, however, should not mask the fact that both the number of!FTE and turnover has dropped by almost 30% in the period between 2016-2017 – a contrast to the 24% growth experienced between 2015 and 2016. There are 550 anaerobic digestion plants currently in opera-tion in the UK, of which 85 directly inject biomethane into the grid. Like Germany, the future of biogas in the UK seems to be precarious, with less support expected from feed-in tariffs by April 2019.
Turning to more positive develop-ments, Italy has enjoyed a stable biogas sector with the number of employed individuals rea-ching 8!100 FTE with a turnover of "!840!million
Employment (direct and indirect jobs)
Turnover (in ! m)
2016 2017 2016 2017
Germany 35"700 35"000 4"120 4"190
United Kingdom 11"800 8"400 1"120 800
Italy 8"000 8"100 880 840
Czechia 4"300 4"500 240 270
France 1"800 2"400 220 290
Poland 3"100 2"300 160 100
Spain 1"300 1"600 90 120
Greece 800 1"300 40 70
Latvia 800 900 40 40
Croatia 600 800 30 50
Denmark 300 700 50 120
Lithuania 800 700 20 30
Netherlands 800 700 120 110
Portugal 800 700 30 30
Bulgaria 800 600 30 30
Finland 400 600 50 80
Hungary 1"500 600 70 30
Belgium 400 500 100 130
Slovakia 600 500 40 40
Austria 500 400 80 60
Romania 200 300 <10 10
Ireland 300 200 30 20
Cyprus <100 100 <10 10
Estonia <100 100 <10 <10
Luxembourg <100 100 10 10
Slovenia 200 100 20 10
Sweden <100 100 <10 10
Malta <100 <100 <10 <10
Total EU 28 76"300 72"400 7"640 7"520
Source: EurObserv’ER 2018
Employment and turnover

Socio-economic indicators
EUROBSERV !ER " THE STATE OF RENEWABLE ENERGIES IN EUROPE " #$%& EDITIONEUROBSERV !ER " THE STATE OF RENEWABLE ENERGIES IN EUROPE " #$%& EDITION
128 129
Employment within the EU in the biofuels sector has increased
from 205 100 to 230 400!FTE, a 12% year-on-year growth1. The turno-ver increased from "!13!110!mil-lion in 2016 to "!13!810 in 2017. According to EurObserv’ER, the consumption of biofuels surged in 2017 even though regulations that placed a cap of 7% on the amount of biofuels obtained from food was implemented. Across the board, all biofuel sectors grew in 2017 but biodiesel (including HVO synthetic biodiesel) gained the most traction with 10% growth on its 2016 level. It must be noted that the methodology used to evaluate the biomass industry covers biomass supply activities, i.e. in the agricultural sector. Thus, the leading countries in terms of employment are not necessarily the largest biofuel consumers such as France and Germany, but more notably Member States with large share of agricultural areas such as Romania, Hungary, Lithua-nia and Poland.
Based on the modelling approach used, Romania’s contribution to the biofuels sector has shown
BIOFUELS
incredible growth in the past year. In 2017, the cumulative employment in Romania reached 34!300!FTE as compared to 2016 levels of 23 800!FTE. Turnover in 2017 reached "!960 million.
The number of!FTE fell in Poland from 34 800 in 2016 to 31 400 in 2017 while the turnover dropped from "!1 310 million to "!1,110 million.
Spain has seen remarkable growth 2017 as compared to 2016. The num-ber of!FTE rose from 15 100 to 26!600 while the turnover went from "!900 million to "!1,590 million. Spain remains the 4th largest consumer of biofuels in the EU with a total consumption of 1 280!ktoe, a 15.4% rise. A reason for this is that distri-butors are legally obliged to 5% of biofuels in the energy mix in 2017 (4.3% in 2016). The share of energy content should gradually increase to 6% in 2018, then to 7% in 2019 and 8.5% in 2020.
Of interest, are France and Ger-many. The former had the second highest employment rate in the biofuels sector in 2016. Howe-ver, within the span of one year,
the number of!FTE in France has dropped from 33 200 to 24 400, caused by a lack of investments in new production capacity . Never-theless, according to the Ministry for Ecological and Inclusive Tran-sition’s Statistics Office, biofuel consumption grew by 7.7% and reached 3!335!ktoe in 2017. In Ger-many, the biofuel consumption has remained stable for the past three years, with a slight increase in consumption by 1.2% in 2017, but employment dropped from 21 800!FTE in 2016 to 15 500!FTE in 2017.
Maa
rten
Fee
nst
ra
/ N
este
Oil
1. Please note that the results have to
be interpreted with caution as the
production capacity for biofuels
were obtained from data from Epure
and EBB instead of Eurostat. Because
of this, production of bioethanol
for industrial or for food purposes
is now also included. For biodiesel,
it is assumed that only half of the
production capacity as provided
by EBB is active, based on the total
installed production capacity and
actual production in 2016 according
to EBB.
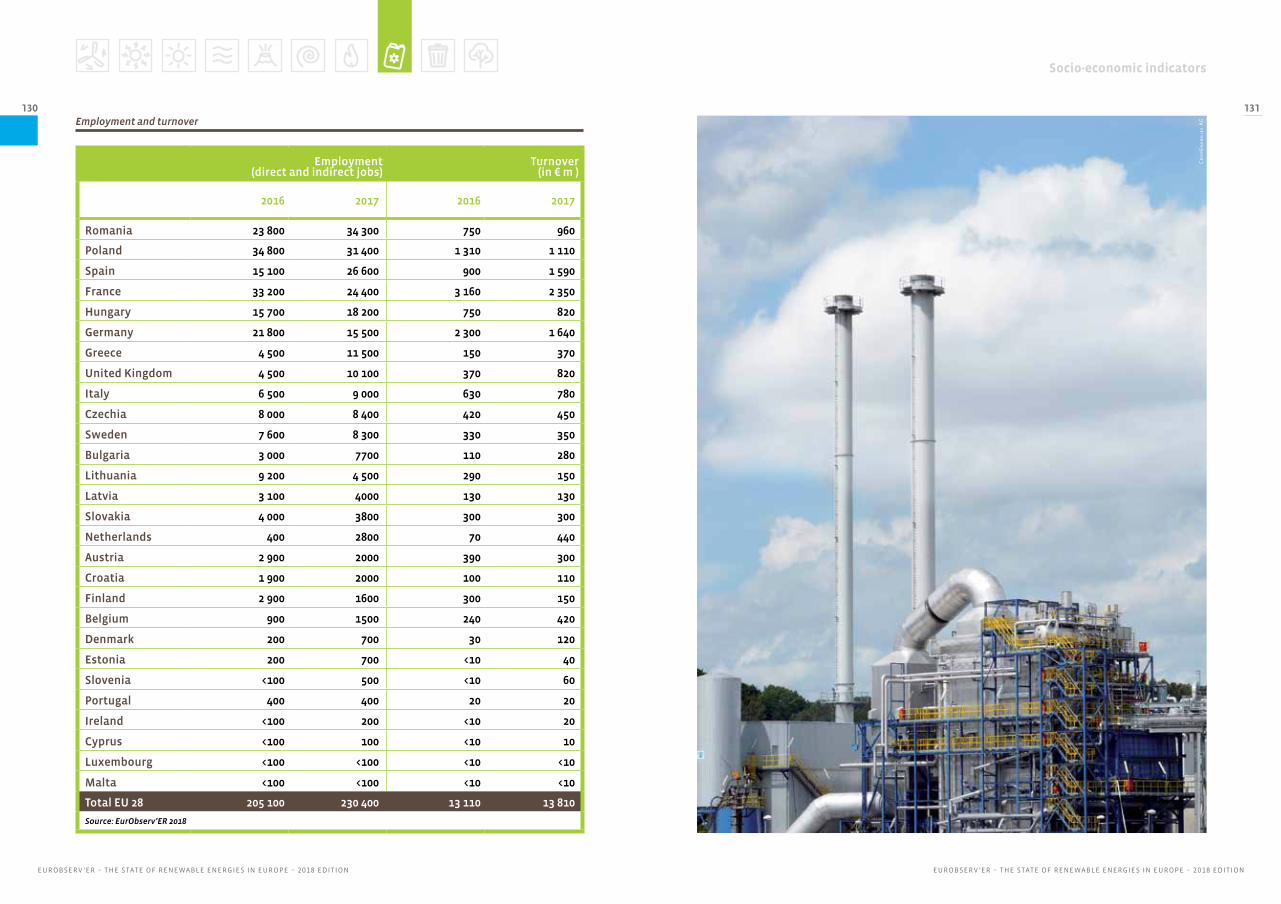
Socio-economic indicators
EUROBSERV !ER " THE STATE OF RENEWABLE ENERGIES IN EUROPE " #$%& EDITIONEUROBSERV !ER " THE STATE OF RENEWABLE ENERGIES IN EUROPE " #$%& EDITION
130 131
Employment (direct and indirect jobs)
Turnover (in ! m")
2016 2017 2016 2017
Romania 23"800 34"300 750 960
Poland 34"800 31"400 1"310 1"110
Spain 15"100 26"600 900 1"590
France 33"200 24"400 3"160 2"350
Hungary 15"700 18"200 750 820
Germany 21"800 15"500 2"300 1"640
Greece 4"500 11"500 150 370
United Kingdom 4"500 10"100 370 820
Italy 6"500 9"000 630 780
Czechia 8"000 8"400 420 450
Sweden 7"600 8"300 330 350
Bulgaria 3"000 7700 110 280
Lithuania 9"200 4"500 290 150
Latvia 3"100 4000 130 130
Slovakia 4"000 3800 300 300
Netherlands 400 2800 70 440
Austria 2"900 2000 390 300
Croatia 1"900 2000 100 110
Finland 2"900 1600 300 150
Belgium 900 1500 240 420
Denmark 200 700 30 120
Estonia 200 700 <10 40
Slovenia <100 500 <10 60
Portugal 400 400 20 20
Ireland <100 200 <10 20
Cyprus <100 100 <10 10
Luxembourg <100 <100 <10 <10
Malta <100 <100 <10 <10
Total EU 28 205"100 230"400 13"110 13"810
Source: EurObserv’ER 2018
Cro
pEn
erg
ies
AGEmployment and turnover

Socio-economic indicators
EUROBSERV !ER " THE STATE OF RENEWABLE ENERGIES IN EUROPE " #$%& EDITIONEUROBSERV !ER " THE STATE OF RENEWABLE ENERGIES IN EUROPE " #$%& EDITION
132 133
RENEWABLE MUNICIPAL WASTE
Renewable municipal waste remains a small RE sector in
the European renewable energy mix. According to the EurOb-serv’ER estimations presented here, the RMW sector is worth "! 4! 750 million and maintains 35!600 full time jobs.
Overall there has been a 30% increase in the number of full-time employment jobs in the EU from 2016 to 2017 in the waste-to-energy sector1.
The UK clinched the top spot this year after expanding its capacity of waste-to-energy plants. With the number of! FTE totalling 10 800, mostly due to the build of new plants in 2017, the industry gave rise to a turnover of "!1 140 million as compared to the previous year ("!270 million). According to EurOb-serv’ER allocation method, 30% of!FTE in the municipal solid waste market in the EU in 2017 could be found in the UK. This rapid growth knocked former leader Germany down to second place. A rise in the number of waste-to-energy plants (from 37 in 2016 to 40 in 2017) cou-pled with a focus on increasing
efficiency of plants have enabled the UK to increase its renewable energy output in the municipal waste sector2.
Sliding down to 2nd place with 18% of the municipal solid waste jobs in the EU, Germany has managed to retain 6 300!FTE, a slight downturn from the 7 000 jobs in 2016. The tur-nover within the same timeframe was "!1 020 million, a slight drop from the previous year ("!1 030 mil-lion in 2016).
The municipal waste industry has not invested in new capacity in 2017 in Italy. While the country held the 3rd place in 2016 with 15% of all RMW jobs in the sector in the EU, this has since changed, and the number of!FTEs have drop-ped to 2!500 in 2017, accounting for only 7% of all RMW jobs in the EU. The sudden decrease in!FTE should be interpreted carefully, as the losses occurred due to a lack of construction related activities in 2017 as opposed to 2016. The employment in operational and maintenance activities or in the supply chain of municipal waste did not change.
1. Note that renewable energy tech-
nologies can demonstrate sudden
spikes in!FTE and revenues, because
the used methodology allocates the
project costs of a new installation
to one year (the year in which the
installation is finished and appears
in the statistics).
2. http://www.tolvik.com/wp-content/
uploads/Tolvik-UK-EfW-Statis-
tics-2017.pdf Bear in mind that the
statistics here do not only talk about
MSW but also residual waste.
Employment (direct and indirect jobs)
Turnover (in ! m)
2016 2017 2016 2017
United Kingdom 2"300 10"800 270 1"140
Germany 7"000 6"300 1"030 1"020
Belgium 300 3"200 60 590
France 4"000 2"600 550 350
Italy 3"800 2"500 500 320
Austria 200 1"600 30 270
Netherlands 2"000 1"500 290 230
Spain 700 1"100 80 120
Sweden 900 800 160 160
Czechia 200 700 10 50
Ireland < 100 700 < 10 70
Poland < 100 700 < 10 50
Denmark 500 600 110 130
Portugal 500 500 40 40
Finland 700 400 120 70
Hungary 1"000 400 40 20
Greece < 100 100 < 10 10
Lithuania 300 100 < 10 <10
Luxembourg < 100 100 < 10 10
Romania < 100 100 < 10 <10
Slovakia < 100 100 < 10 <10
Bulgaria < 100 <100 < 10 <10
Croatia < 100 <100 < 10 <10
Cyprus < 100 <100 < 10 <10
Estonia < 100 <100 < 10 <10
Latvia < 100 <100 < 10 <10
Malta < 100 <100 < 10 <10
Slovenia < 100 <100 < 10 <10
Total EU 28 25"700 35"600 3"430 4"750
Source: EurObserv’ER 2018
Employment and turnover

Socio-economic indicators
EUROBSERV !ER " THE STATE OF RENEWABLE ENERGIES IN EUROPE " #$%& EDITIONEUROBSERV !ER " THE STATE OF RENEWABLE ENERGIES IN EUROPE " #$%& EDITION
134 135
According to EurObserv’ER, solid biomass heat consump-
tion increased by 1.1 !Mtoe in 2017, 1.4% more than in 2016, to reach a 79.9 !Mtoe . On the other hand, the demand for electricity derived from solid biomass grew by 2.9% and was fuelled, in particular, by converted coal-fired power plant in countries such as the UK, Fin-land and Denmark. The number of FTE in the EU related to biomass increased by approximately 4% in 2017 and stood at 364 800 at the end of the year while the tur-nover recorded ("!34 550 million) increased by 8% as compared to 2016 levels1.
Germany retained the top spot in terms of employment in the biomass sector with 44 900 FTE, with an increase in employment of around 6% when compared to the 42 500 FTE in 2016. A total of 10.7! TWh of electricity was produced from solid biomass by Germany in 2017, a year-on-year decline of 0.1 TWh. The primary energy production of solid bio-mass in the country amounting to 12.0!!Mtoe in 2017, a small increase from 11.9 !Mtoe in 2016. Major ope-
SOLID BIOMASS
rators of biomass plants based in Germany include E.on and Zellstoff Stendal. The biomass sector has encountered lukewarm responses to the biomass tendering process. New facilities are said to be hinde-red by a lack of financial support while legal constraints placed on older facilities made bidding on them ‘unattractive’2.
An
dre
as T
eich
man
n F
oto
gr
afie
1. The sector solid biomass comprises
different technologies that cover
different end-user sectors: energy
(biomass CHP, co-firing), industry (boi-
lers), and households (pellet boilers
and stoves). Note that the available
data for biomass consumption by
households was very limited, which
resulted in unrealistic 2017 estimates
for FTE related to biomass stoves and
boilers for some countries. For these
countries the FTE results for employ-
ment related to biomass stoves and
boilers of 2016 were used.
2. https://www.endswasteandbioe-
nergy.com/article/1445017/poor-res-
ponse-germanys-first-biomass-tender

Socio-economic indicators
EUROBSERV !ER " THE STATE OF RENEWABLE ENERGIES IN EUROPE " #$%& EDITIONEUROBSERV !ER " THE STATE OF RENEWABLE ENERGIES IN EUROPE " #$%& EDITION
136 137
Employment (direct and indirect jobs)
Turnover(in ! m)
2016 2017 2016 2017
Germany 42"500 44"900 5"110 5"630
Italy 32"600 35"800 2"540 2"550
France 35"400 33"900 4"090 3"990
Finland 25"400 26"800 4"320 4"860
Poland 26"100 25"900 1"010 1"000
Spain 18"400 20"800 770 1"030
Latvia 21"800 20"700 720 770
Sweden 18"700 20"700 4"090 4"460
United Kingdom 12"600 15"000 1"090 1"230
Croatia 15"000 14"400 380 280
Hungary 12"000 13"300 350 420
Czechia 11"400 12"300 690 840
Romania 11"400 11"400 330 320
Denmark 8"500 10"500 1"450 1"890
Slovakia 8"700 9"000 340 350
Austria 8"600 8"700 1"740 1"630
Bulgaria 9"600 8"700 270 280
Portugal 6"500 8"000 580 670
Estonia 10"000 8"000 560 490
Netherlands 3"900 4"800 480 550
Lithuania 4"700 3"600 260 240
Greece 3"400 2"600 150 170
Belgium 1"000 2"000 260 590
Slovenia 2"300 1"500 130 110
Ireland 1"700 1"200 200 160
Luxembourg <100 100 <10 20
Cyprus <100 <100 <10 <10
Malta <100 <100 <10 <10
Total EU 28 352"500 364"800 31"940 34"550
Source: EurObserv’ER 2018
Italy ends up in second place with an estimated 35 800 FTE and a tur-nover of "!2 550 million in 2017. This represents a 10% year on year increase in FTE. With companies such as the EPH group entering the biomass industry in Italy and acquiring smaller businesses3, employment in the country is expected to continue to increase. Primary energy production of bio-mass increased from 7.2 !Mtoe in 2016 to 7.7 !Mtoe in 2017 while gross inland consumption increased from 8.4 !Mtoe to 9.0 !Mtoe within the same time period. This growth is also reflected in the gross electri-city production from solid biomass which amounted to 4 193 TWh in 2017, a moderate annual growth of 1.6%. As part of its renewables
strategy, Italy plans promote new investments through incentivising power generation and stimulating competition- and in the case of bio-mass, maintaining existing power generation from bioenergy sources without disrupting the agricultural sector chain4.
France is in third place with 33 900 FTE in 2017 and a turnover of "!3 990 million. This is a slight decline of 4% and 2% respectively compared to 2016 levels. A slower pace in wood pellet output leading to a reliance on imports and a slump in residential heating needs could be potential underlying reasons. According to the Observation and Statistics Service, France’s total domestic consumption of solid
biomass (which includes its Over-seas Territories) contracted slightly - sliding down from 11 !Mtoe in 2016 to 10.8 !Mtoe in 2017. It is postula-ted that the French biomass sector will pick up in the coming years as a consequence of the National Low Carbon Strategy (SNBC) and its Multiannual Energy Programme (PPE) with funding of "!1.6 billion for almost 4 000 projects totalling 2 million toe.
Or
sted
Employment and turnover
3. https://www.eppowereurope.cz/en/
tiskove-zpravy/eph-group-enters-bio-
mass-business-italy/
4. https://www.mise.gov.it/images/
stories/documenti/BROCHURE_ENG_
SEN.PDF

Socio-economic indicators
EUROBSERV !ER " THE STATE OF RENEWABLE ENERGIES IN EUROPE " #$%& EDITIONEUROBSERV !ER " THE STATE OF RENEWABLE ENERGIES IN EUROPE " #$%& EDITION
138 139
CONCLUSION
Based on the turnover estimations by country, 15 out of 28-member states either increased or retained their industrial turnover. These 15 member states (Belgium, Cyprus, Czechia, Denmark, Finland, Germany, Greece, Hungary, Ireland, Malta, Portugal, Romania, Slovakia, Spain and the United Kingdom) together grew by 15.1!billion euro. And 13 countries showed a decline, cumulating to 9.7 billion euro: Austria, Bulgaria, Croa-tia, Estonia, France, Italy, Latvia, Lithuania, Luxem-bourg, the Netherlands, Poland, Slovenia and Sweden.
As mentioned in the methodology section at the start of the socio-economic chapter, the EurObserv’ER employment and turnover estimates are based on an evaluation of the economic activity of each renewable sector covered, which is then expressed into full-time equivalent (FTE) employment. The estimated FTE and turnover for each country-technology combination are therefore directly correlated to the changes in the amount of yearly installed capacity (MW) obser-ved per country-technology combination. The model does not take into account the lead time required to build new capacity, nor does it include the ability of companies to withstand short periods of time with unfavourable market conditions. The estimated yearly FTE and revenues reported may therefore appear more volatile than observed by national statistics offices or renewables associations.
Similar as in the 2016 edition of ‘The State of Renewable Energies in Europe’ the EurObserv’ER
team has used a new employment modelling approach to estimate the number of FTEs initiated from renewable investments, operation and maintenance activities, production and trading of equipment and biomass feedstock. According to this approach, the number of renewable energy jobs in the EU in 2017 amounted to 1.45 million. This was, overall, compa-rable to the labour force in 2016 with an increase of just over 1%, corresponding to 18 500 jobs.
Technologies for which the 2017 estimates were lower than that of 2016 (which implies a contraction in the number of jobs) include: PV which decreased from 95! 900 to 90 800 (-5.3%), heat pumps which decreased from 249 400 to 191 700 (-23.1%), biogas which decreased from 76 300 to 72 400 (-5.1%), hydro-power which decreased from 75 900 to 70 700 (-6.9%) and solar thermal which decreased from 29 000 to 21!900 (-24.5%). On the other hand, several technologies saw an expansion in the number of FTEs created over the past year: wind power increased from 309!000 to 356!700 (+15.4%), solid biomass increased from 352!500 to 364 800 (+1.3%), biofuels rose from 205 100 to 230!400 (+12.3%), geothermal increased from 8 600 to 10 900 (+26.7%) and municipal solid waste saw job figures rise from 25 700 to 35 600 (+38.5%).
With a 2.7% growth, Germany remained the largest player in terms of renewable energy induced employ-ment in 2017, with290 700 FTE. Jobs in the wind sec-tor were especially abundant, totalling 140 800 FTE. Coming in second place was Spain with 168 800 jobs, an astounding year-on-year growth of 19.7%. This boost can be attributed to a rise of 58% in employment within the wind power sector (+ 13 700 FTE). Retai-ning the third spot from the previous year is France with 140 700 FTE, where the main labour force can be found in the heat pump sector (25.7% of all jobs in the renewable sector). Taking the last slot of the top four countries is the United Kingdom which showed positive growth leading to a total of 131!400 FTE at the end of the year (22.3% up from 2016). Most labour in the country can be found in the wind power sector which has seen continuous growth since 2015.
Turning to economic activity, the combined turnover for the 10 renewable energy sectors covered in the 28 EU member states amounted to 154.7 billion euro in 2017, 3.6% higher than 2016. This indicates positive investment activities as this rise occurs despite falling technology costs and political hesitation in many EU member states. The turnover for wind ("48.0 billion, equivalent to 31% of the total EU RES sector turno-ver), solid biomass ("34.6 billion, 22%) and heat pump ("22.7 billion, 15%) were the top 3 in terms among all the technologies.

Socio-economic indicators
EUROBSERV !ER " THE STATE OF RENEWABLE ENERGIES IN EUROPE " #$%& EDITIONEUROBSERV !ER " THE STATE OF RENEWABLE ENERGIES IN EUROPE " #$%& EDITION
140 141
Country total Biomass Wind Heat pumps Biofuels PV Biogas !"#ro Solar thermal Waste Geothermal
Germany 283$100 42$500 121$700 14$500 21$800 27$100 5$200 35$700 6$400 7$000 1$200
Italy 179$000 32$600 6$300 94$000 6$500 10$700 13$400 8$000 1$400 3$800 2$300
France 143$100 35$400 18$800 32$800 33$200 5$200 10$200 1$800 1$100 4$000 600
Spain 141$000 18$400 23$500 60$800 15$100 2$200 10$900 1$300 8$000 700 <100
United Kingdom 107$400 12$600 42$900 1$800 4$500 29$000 2$200 11$800 200 2$300 <100
Poland 81$800 26$100 11$400 2$200 34$800 1$500 1$300 3$100 1$100 <100 200
Sweden 47$900 18$700 4$900 10$400 7$600 300 4$800 <100 <100 900 <100
Romania 44$900 11$400 2$500 300 23$800 1$800 4$400 200 200 <100 200
Denmark 43$000 8$500 26$600 2$100 200 1$200 <100 300 3$200 500 300
Finland 39$200 25$400 3$500 4$500 2$900 400 1$200 400 <100 700 <100
Netherlands 37$600 3$900 21$500 3$600 400 4$700 <100 800 100 2$000 500
Hungary 35$200 12$000 800 500 15$700 2$000 <100 1$500 400 1$000 1$200
Czechia 30$500 11$400 900 1$800 8$000 1$700 1$700 4$300 400 200 <100
Latvia 27$400 21$800 <100 <100 3$100 <100 1$100 800 <100 <100 <100
Portugal 26$800 6$500 6$400 7$400 400 700 3$800 800 200 500 <100
Austria 24$000 8$600 1$700 1$900 2$900 1$300 4$800 500 2$000 200 <100
Bulgaria 23$200 9$600 600 3$900 3$000 800 2$900 800 1$300 <100 200
Croatia 20$500 15$000 900 <100 1$900 <100 1$600 600 100 <100 <100
Greece 18$300 3$400 3$700 1$400 4$500 1$100 1$700 800 1$500 <100 <100
Lithuania 18$300 4$700 1$600 400 9$200 300 800 800 <100 300 <100
Slovakia 15$500 8$700 <100 100 4$000 400 1$300 600 <100 <100 100
Estonia 14$600 10$000 1$600 2$100 200 200 <100 <100 <100 <100 <100
Belgium 9$500 1$000 2$300 1$500 900 2$400 400 400 200 300 <100
Ireland 7$300 1$700 4$200 400 <100 <100 200 300 100 <100 <100
Slovenia 4$800 2$300 <100 500 <100 300 900 200 200 <100 100
Luxembourg 1$500 <100 200 <100 <100 <100 500 <100 <100 <100 <100
Cyprus 1$000 <100 <100 <100 <100 <100 <100 <100 100 <100 <100
Malta 1$000 <100 <100 <100 <100 100 <100 <100 <100 <100 <100
Total EU 28 1$427$400 352$500 309$000 249$400 205$100 95$900 75$900 76$300 29$000 25$700 8$600Source: EurObserv’ER 2018
2016 EMPLOYMENT DISTRIBUTION BY SECTOR

Socio-economic indicators
EUROBSERV !ER " THE STATE OF RENEWABLE ENERGIES IN EUROPE " #$%& EDITIONEUROBSERV !ER " THE STATE OF RENEWABLE ENERGIES IN EUROPE " #$%& EDITION
142 143
Country total Wind Biomass Heat pumps Biofuels PV Hydro %&o'(s Solar thermal Waste Geothermal
Germany 35$500 16$060 5$110 1$920 2$300 3$400 650 4$120 760 1$030 150
Italy 21$420 950 2$540 12$280 630 1$400 1$760 880 170 500 310
France 17$850 2$790 4$090 4$630 3$160 710 1$460 220 150 550 90
Spain 12$750 2$820 770 5$800 900 220 1$080 90 980 80 <10
United Kingdom 10$580 4$490 1$090 170 370 2$810 240 1$120 10 270 <10
Sweden 8$740 1$010 4$090 2$110 330 60 940 <10 20 160 <10
Denmark 7$370 4$600 1$450 340 30 200 <10 50 530 110 50
Finland 6$300 520 4$320 700 300 80 190 50 <10 120 <10
Netherlands 4$740 2$680 480 450 70 560 <10 120 10 290 70
Austria 4$120 280 1$740 300 390 190 770 80 330 30 10
Poland 3$690 790 1$010 140 1$310 90 100 160 70 <10 10
Belgium 1$950 450 260 280 240 440 80 100 30 60 <10
Portugal 1$930 500 580 440 20 40 260 30 10 40 <10
Czech Republic 1$780 60 690 110 420 110 110 240 20 10 <10
Romania 1$610 150 330 10 750 90 240 <10 <10 <10 10
Hungary 1$460 50 350 20 750 90 <10 70 20 40 60
Greece 1$120 300 150 110 150 90 150 40 110 <10 <10
Latvia 1$000 <10 720 <10 130 <10 50 40 <10 <10 <10
Estonia 840 90 560 120 <10 10 <10 <10 <10 <10 <10
Slovakia 840 <10 340 <10 300 20 90 40 <10 <10 10
Bulgaria 780 30 270 130 110 30 120 30 40 <10 <10
Ireland 780 440 200 40 <10 <10 20 30 10 <10 <10
Lithuania 710 60 260 10 290 10 30 20 <10 <10 <10
Croatia 700 50 380 <10 100 <10 90 30 <10 <10 <10
Slovenia 310 <10 130 30 <10 20 60 20 <10 <10 <10
Luxembourg 180 30 <10 <10 <10 10 70 10 <10 <10 <10
Cyprus 100 <10 <10 <10 <10 <10 <10 <10 <10 <10 <10
Malta 100 <10 <10 <10 <10 <10 <10 <10 <10 <10 <10
Total EU 28 149$250 39$250 31$940 30$200 13$110 10$730 8$620 7$640 3$380 3$430 950Source: EurObserv’ER 2018
2016 TURNOVER BY SECTOR (!M)

Socio-economic indicators
EUROBSERV !ER " THE STATE OF RENEWABLE ENERGIES IN EUROPE " #$%& EDITIONEUROBSERV !ER " THE STATE OF RENEWABLE ENERGIES IN EUROPE " #$%& EDITION
144 145
Country total Biomass Wind Biofuels Heat pumps PV Biogas !"#ro Solar thermal Waste Geothermal
Germany 290$700 44$900 140$800 15$500 9$300 29$300 35$000 4$600 4$500 6$300 500
Spain 168$800 20$800 37$200 26$600 56$600 5$500 1$600 11$200 8$100 1$100 <100
France 140$700 33$900 18$500 24$400 36$200 9$300 2$400 9$900 1$000 2$600 2$500
United Kingdom 131$400 15$000 69$900 10$100 1$700 12$900 8$400 2$300 200 10$800 <100
Italy 129$900 35$800 7$500 9$000 41$300 11$200 8$100 10$800 600 2$500 3$100
Poland 73$900 25$900 8$000 31$400 3$000 1$100 2$300 1$100 300 700 100
Romania 53$000 11$400 2$100 34$300 200 900 300 3$400 <100 100 200
Denmark 50$200 10$500 34$200 700 1$500 1$100 700 <100 200 600 600
Sweden 43$100 20$700 2$700 8$300 5$100 500 100 4$700 <100 800 <100
Finland 40$300 26$800 4$100 1600 4$700 700 600 1$200 <100 400 <100
Hungary 36$000 13$300 800 18$200 400 1$300 600 100 200 400 700
Portugal 33$100 8$000 3$100 400 13$800 1$500 700 4$200 500 500 400
Czechia 32$500 12$300 900 8$400 2$600 1$300 4$500 1$500 200 700 <100
Netherlands 28$700 4$800 5$800 2800 6$800 6$000 700 <100 100 1$500 100
Latvia 27$200 20$700 <100 4000 <100 <100 900 1$000 <100 <100 <100
Greece 25$200 2$600 3$100 11$500 1$200 1$300 1$300 2$000 2$000 100 <100
Austria 23$500 8$700 2$000 2000 1$300 1$600 400 4$600 1$200 1$600 <100
Bulgaria 22$700 8$700 500 7700 700 600 600 2$300 1$300 <100 200
Croatia 20$300 14$400 1$100 2000 <100 100 800 1$400 200 <100 100
Belgium 17$800 2$000 5$500 1500 1$400 3$000 500 400 100 3$200 200
Slovakia 15$900 9$000 <100 3800 200 200 500 1$200 100 100 700
Estonia 12$200 8$000 1$200 700 1$700 100 100 <100 <100 <100 <100
Lithuania 10$700 3$600 500 4$500 300 100 700 700 <100 100 100
Ireland 9$700 1$200 6$500 200 300 <100 200 300 100 700 <100
Slovenia 4$300 1$500 <100 500 900 100 100 800 100 <100 100
Cyprus 1$500 <100 200 100 <100 500 100 <100 100 <100 <100
Luxembourg 1$400 100 100 <100 <100 100 100 500 <100 100 <100
Malta 1$200 <100 <100 <100 <100 300 <100 <100 100 <100 <100
Total EU 28 1$445$900 364$800 356$700 230$400 191$700 90$800 72$400 70$700 21$900 35$600 10$900Source: EurObserv’ER 2018
2017 EMPLOYMENT DISTRIBUTION BY SECTOR

Socio-economic indicators
EUROBSERV !ER " THE STATE OF RENEWABLE ENERGIES IN EUROPE " #$%& EDITIONEUROBSERV !ER " THE STATE OF RENEWABLE ENERGIES IN EUROPE " #$%& EDITION
146 147
Country total Wind Biomass Heat pumps Biofuels PV Hydro %&o'(s Solar thermal Waste Geothermal
Germany 39$180 20$040 5$630 1$350 1$640 4$010 650 4$190 580 1$020 70
France 18$430 2$860 3$990 5$310 2$350 1$310 1$480 290 130 350 360
Spain 15$080 4$340 1$030 5$330 1$590 500 1$070 120 970 120 <10
Italy 14$400 1$120 2$550 5$440 780 1$450 1$420 840 70 320 410
United Kingdom 13$100 7$360 1$230 170 820 1$310 250 800 10 1$140 <10
Denmark 9$170 6$310 1$890 270 120 190 <10 120 30 130 100
Sweden 7$690 620 4$460 1$030 350 90 950 10 10 160 10
Finland 6$860 630 4$860 740 150 120 190 80 <10 70 <10
Austria 4$090 350 1$630 220 300 260 790 60 200 270 10
Belgium 3$820 1$100 590 270 420 570 80 130 30 590 40
Netherlands 3$790 830 550 870 440 730 <10 110 10 230 10
Poland 3$350 660 1$000 220 1$110 80 100 100 20 50 10
Portugal 2$380 320 670 860 20 90 290 30 30 40 30
Czechia 2$090 70 840 180 450 100 110 270 10 50 <10
Romania 1$790 160 320 10 960 60 240 10 <10 <10 10
Hungary 1$480 50 420 20 820 60 <10 30 10 20 40
Greece 1$320 230 170 100 370 90 140 70 130 10 <10
Ireland 1$070 700 160 40 20 10 30 20 10 70 <10
Latvia 1$050 <10 770 <10 130 <10 50 40 <10 <10 <10
Slovakia 900 <10 350 20 300 20 90 40 <10 <10 50
Bulgaria 880 30 280 40 280 30 120 30 50 <10 10
Estonia 790 80 490 120 40 <10 <10 <10 <10 <10 <10
Croatia 650 70 280 <10 110 <10 90 50 10 <10 10
Lithuania 530 30 240 10 150 <10 30 30 <10 <10 10
Slovenia 350 <10 110 60 60 10 60 10 <10 <10 10
Luxembourg 180 20 20 <10 <10 10 70 10 <10 10 <10
Cyprus 130 20 <10 <10 10 30 <10 10 10 <10 <10
Malta 110 <10 <10 <10 <10 20 <10 <10 <10 <10 <10
Total EU 28 154$660 48$040 34$550 22$730 13$810 11$190 8$360 7$520 2$410 4$750 1$300Source: EurObserv’ER 2018
2017 TURNOVER BY SECTOR (!M)

Socio-economic indicators
EUROBSERV !ER " THE STATE OF RENEWABLE ENERGIES IN EUROPE " #$%& EDITIONEUROBSERV !ER " THE STATE OF RENEWABLE ENERGIES IN EUROPE " #$%& EDITION
148 149
RES DEVELOPMENT IMPACTON FOSSIL FUEL SECTORS
The deployment of renewable energy technologies has an impact on the economic activity in the fossil
fuel based energy sector.
For the second time in the EurObserv’ER barometer project, the socio-economic chapter includes a dedica-ted indicator to take the effects of the growing shares
of renewables on the European fossil fuel sector into account. In this year’s edition, eighteen countries are evaluated (Austria, Belgium, Czechia, Germany, Spain, France, Italy, the Netherlands, Denmark, Fin-land, Greece, Ireland, Luxembourg, Poland, Portugal, Romania, Sweden and United Kingdom). The next edition of ‘The State of Renewable Energy in Europe’
1. In our methodology, the employment affected by reduced
use of natural gas is assumed to be negligible. It is not
likely that installations for natural gas extraction, conver-
sion and transports are taken out of operation due to the
uptake of renewables on the short term. O&M staffing of
the existing installations is not likely to be affected by
reduced gas demand.
2. Note that solid biomass consists for a large part of fuel
wood used by households, which is often not obtained via
official retail channels. Solid biomass consumption there-
fore does not fully contribute to formal employment.
Employment (direct and indirect jobs)
Effect on fossil sectors in O&M and fuel production activities only direct jobs
Adjusted employment
Germany 290$700 56$072 234$628
Spain 168$800 22$651 146$149
France 140$700 18$297 122$403
United-Kingdom 131$400 19$159 112$241
Italy 129$900 23$056 106$844
Poland 73$900 21$024 52$876
Romania 53$000 50$648 2$352
Danemark 50$200 3$075 47$125
Sweden 43$100 6$450 36$650
Finland 40$300 3$476 36$824
Portugal 33$100 4$187 28$913
Czech Republic 32$500 6$998 25$502
Netherlands 28$700 2$497 26$203
Greece 25$200 6$181 19$019
Austria 23$500 9$410 14$090
Belgium 17$800 3$228 14$572
Ireland 9$700 1$190 8$510
Luxembourg 1$400 931 469
TOTAL 1$293$900 258$530 1$035$370Source: EurObserv’ER 2018
0
50 000
100 000
150 000
200 000
250 000
300 000
Ger
man
y
Spai
n
Fran
ce
Un
ited
-Kin
gdo
m
Ital
y
Po
lan
d
Ro
man
ia
Dan
emar
k
Swed
en
Fin
lan
d
Po
rtu
gal
Cze
ch R
epu
bli
c
Net
her
lan
ds
Gre
ece
Au
stri
a
Bel
giu
m
Irel
and
Luxe
mb
ou
rg
Effect on fossil sectors in O&M and fuel production activities (only direct jobs)
Adjusted employment
will have a complete coverage of the European Union Member States.
The results presented here are for 2017 and evaluate the impact of renewables on the fossil fuel sector. The impact is estimated for the following six subsectors: power generation, mining, oil for power generation, refining, heat production and extraction and supply of crude oil and natural gas. The results are expressed in direct jobs only. Our approach only covers the effects on operation and maintenance (O&M) and fuel pro-duction activities (effects on O&M are assumed to be proportional to the reduced/avoided production). It must be noted that reduced construction activities of new conventional plants are not considered. The presented impact on the fossil fuel sector therefore does not give the full picture.
The graph shows that the impact on the fossil fuel sec-tor varies significantly between Member States. The relative impact on the fossil sector, when compared to the total employment, is of a completely different nature in Luxembourg and Romania than it is in Den-mark and the United Kingdom. The reason for this lies in the difference in composition of the fossil fuel sector and in the type of renewable technology that is deployed. Countries that have coal mining activities
are more susceptible to the influence of renewables development than countries that import coal for power generation, as can be seen in, for example, the significant impact of renewables on the fossil fuel sector of Czechia, Germany, Romania and Spain.
The type of renewable technology deployed is also an important factor. Technologies that use feedstock (biogas, solid biomass, biofuels and MSW) generate a relatively high amount of jobs per MW. Therefore, development of employment in the production of feedstock for such renewable technologies results in a proportionally smaller impact on the fossil fuel sector than the development of e. g. wind industry.
Source : EurObserv’ER 2018. Note: The effect of renewables on operation, maintenance and fuel production activities in fossil fuel sectors. The impact of renewables on investment-related employment and indirect employment is not considered.
Details of RES development effect on fossil sectors for 18 European countries (figures for 2017)
1
Details of RES development effect on fossil sectors for 18 European countries (figures for 2017)
1

Investment indicators
150 151
EUROBSERV !ER " THE STATE OF RENEWABLE ENERGIES IN EUROPE " #$%& EDITION
to the data in the previous overview baro-meters. The reason is that the database evolves continuously. This means that, whe-never information on investment deals in previous years is found, it is added to the database to make it as comprehensive as possible. Hence, the investment figures for 2016 presented in last year’s edition and this edition naturally differ.
The second part starts to analyse invest-ment in RE technology by providing ven-ture capital and private equity (VC/PE) investment data as derived from BNEF and other sources for all RES for the EU as a whole in order to capture the dynamics of the EU market for new technology and pro-ject developing companies. Then, RES stock indices are constructed which cover the largest European firms for the major RES. This indicator captures the performance of RES technology companies, i.e. companies that develop / produce the RES components needed for RES plants to function. The data used for the construction of the indices is collected from the respective national stock exchanges as well as public databases. In addition, YieldCos, i.e. infrastructure assets, e.g. renewable energy plants, where the ownership is offered on public markets, will be included in this chapter.
In this chapter, EurObserv’ER presents indi-cators that shed light on the financing side of RES. In order to show a comprehensive picture, the investment indicators cover two broader aspects: • The first group of indicators relates to
investment in the application of RE tech-nologies (e.g. building power plants).
• The second group of indicators shifts the focus towards the development and the production of the technologies themselves (e.g. producing solar modules).
First of all, investments in new built capacity for all RES sectors in all EU member states are covered under asset finance. Asset finance data is derived from the Bloomberg New Energy Finance (BNEF) data base as well as other data sources and covers utility-scale investments in renewable energy, i.e. invest-ment in power plants. Furthermore, average investment expenditures per!MW of capacity are compared to main EU trading partners In order to capture the involvement of the public sector in RES financing, information on national and EU-wide financing pro-grammes for RES will be presented.
It should be mentioned that the data on asset finance and VC/PE investment pres-ented in this edition cannot be compared
INVESTMENTINDICATORS

Investment indicators
152 153
EUROBSERV !ER " THE STATE OF RENEWABLE ENERGIES IN EUROPE " #$%& EDITION
Asset finance covers all investment into utility-scale renewable energy generation projects. It covers wind, solar PV, CSP, solid biomass, biogas, and waste-to-energy projects with a capacity of more than 1!MW and investments in biofuels with a capacity of more the one million litres per year. Furthermore, the underlying data is deal-based and for the invest-ment indicators presented here, all completed deals in 2016 and 2017 were covered. This means that for all included projects the financial deal was agreed upon and finalised, so the financing is secured. Note that this does not give an indication when the capacity will be added. In some cases the construction starts immediately, while in several cases a financial deal is signed for a project, where construction starts several months (or sometimes years) later. Hence, the data of the associated capacity added shows the estimated capacity added by the asset finance deals closed in the respective year. This capacity might be added either already in the respective year or in the following years. In addition to investments in RES capacity in the Member States, an overview of invest-ment expenditures per!MW of RES capacity will be calculated for the EU and main trading partners in order to compare investment costs.
Asset finance is differentiated by three types: balance-sheet finance, non-recourse project finance, and bonds and other instruments. In the first case, the respective power plant is financed from the balance-sheet of typically a large energy company or a utility. In this case the utility might borrow money from a bank and is – as company – responsible to pay back the loan. Non-recourse project finance implies that someone provides equity to a single purpose company (a dedicated project company) and this project company asks for additional bank loans. Here, only the project company is responsible to pay back the loan and the project is largely separated from the balance sheet of the equity provider (sponsor). Finally, the third type of asset finance, new / alternative financing mechanisms are captured as bonds (that are issued to finance a project), guarantees, leasing, etc. These instruments play so far a very minor role in the EU, particularly in comparison to the US, where the market for bond finance for RES projects is further developed. Nevertheless, these instruments are captured to monitor their role in the EU.
Investment in Renewable Energy Capacity
Methodological note
In this section, the EurObserv’ER investment indica-tors focus on investment in RES capacity, i.e. invest-ments in utility-size RES power plants (asset finance). Hence, an overview of investments in capacity across RES in the EU Member States is provided.
Furthermore, average investments costs per!MW of capacity are calculated for the EU and compared with main EU trading partners. Finally, information in public financing programmes for RES is presented.
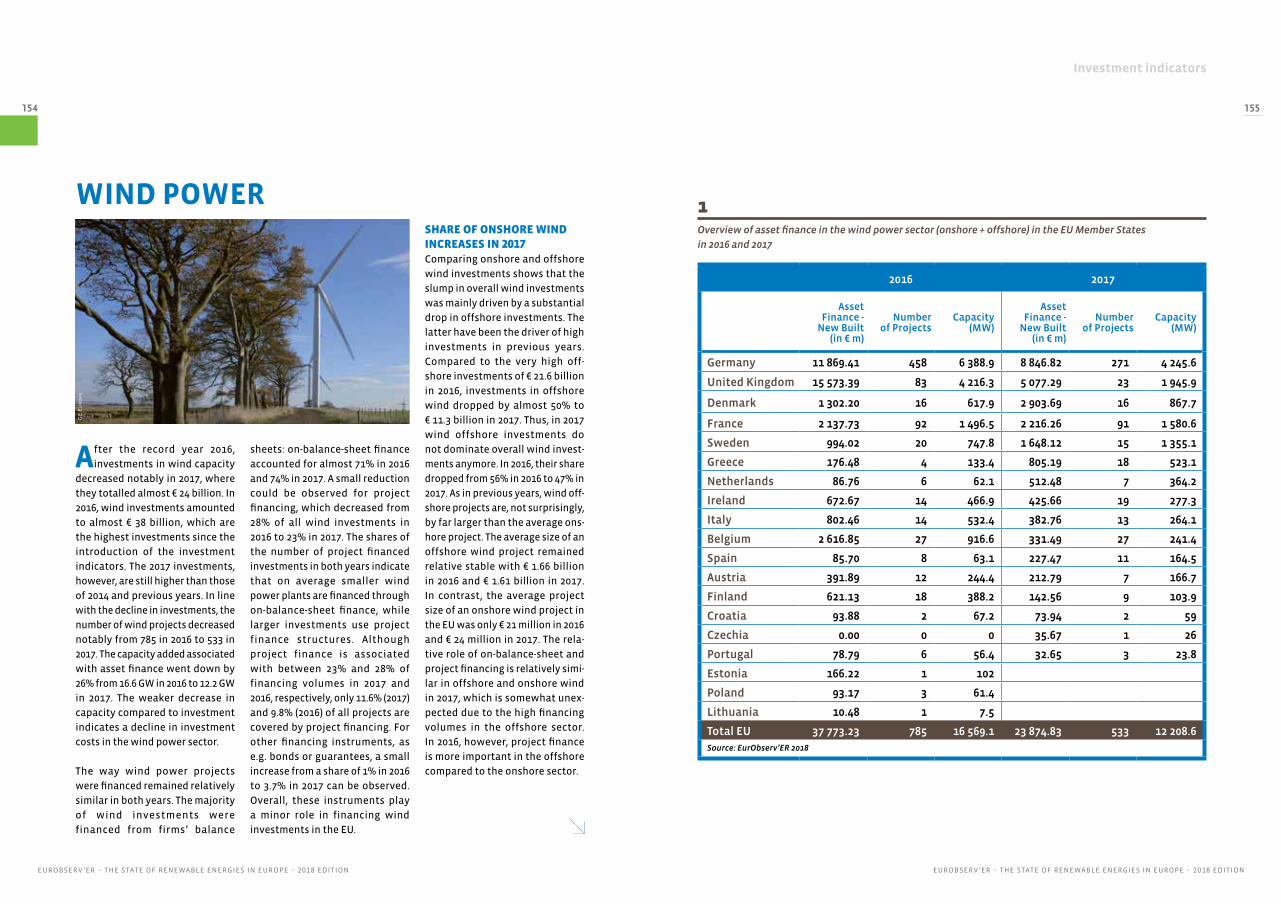
Investment indicators
EUROBSERV !ER " THE STATE OF RENEWABLE ENERGIES IN EUROPE " #$%& EDITIONEUROBSERV !ER " THE STATE OF RENEWABLE ENERGIES IN EUROPE " #$%& EDITION
154 155
After the record year 2016, investments in wind capacity
decreased notably in 2017, where they totalled almost !"24 billion. In 2016, wind investments amounted to almost !"38 billion, which are the highest investments since the introduction of the investment indicators. The 2017 investments, however, are still higher than those of 2014 and previous years. In line with the decline in investments, the number of wind projects decreased notably from 785 in 2016 to 533 in 2017. The capacity added associated with asset finance went down by 26% from 16.6"GW in 2016 to 12.2"GW in 2017. The weaker decrease in capacity compared to investment indicates a decline in investment costs in the wind power sector.
The way wind power projects were financed remained relatively similar in both years. The majority of wind investments were financed from firms’ balance
sheets: on-balance-sheet finance accounted for almost 71% in 2016 and 74% in 2017. A small reduction could be observed for project financing, which decreased from 28% of all wind investments in 2016 to 23% in 2017. The shares of the number of project financed investments in both years indicate that on average smaller wind power plants are financed through on-balance-sheet finance, while larger investments use project finance structures. Although project finance is associated with between 23% and 28% of financing volumes in 2017 and 2016, respectively, only 11.6% (2017) and 9.8% (2016) of all projects are covered by project financing. For other financing instruments, as e.g. bonds or guarantees, a small increase from a share of 1% in 2016 to 3.7% in 2017 can be observed. Overall, these instruments play a minor role in financing wind investments in the EU.
SHARE OF ONSHORE WIND INCREASES IN !"#$Comparing onshore and offshore wind investments shows that the slump in overall wind investments was mainly driven by a substantial drop in offshore investments. The latter have been the driver of high investments in previous years. Compared to the very high off-shore investments of !"21.6 billion in 2016, investments in offshore wind dropped by almost 50% to !"11.3 billion in 2017. Thus, in 2017 wind offshore investments do not dominate overall wind invest-ments anymore. In 2016, their share dropped from 56% in 2016 to 47% in 2017. As in previous years, wind off-shore projects are, not surprisingly, by far larger than the average ons-hore project. The average size of an offshore wind project remained relative stable with !"1.66 billion in 2016 and !"1.61 billion in 2017. In contrast, the average project size of an onshore wind project in the EU was only !"21 million in 2016 and !"24 million in 2017. The rela-tive role of on-balance-sheet and project financing is relatively simi-lar in offshore and onshore wind in 2017, which is somewhat unex-pected due to the high financing volumes in the offshore sector. In 2016, however, project finance is more important in the offshore compared to the onshore sector.
WIND POWER
2016 2017
Asset Finance!-
New Built (in " m)
Number of Projects
Capacity (MW)
Asset Finance!-
New Built (in " m)
Number of Projects
Capacity (MW)
Germany 11 869.41 458 6 388.9 8 846.82 271 4 245.6
United Kingdom 15 573.39 83 4 216.3 5 077.29 23 1 945.9
Denmark 1 302.20 16 617.9 2 903.69 16 867.7
France 2 137.73 92 1 496.5 2 216.26 91 1 580.6
Sweden 994.02 20 747.8 1 648.12 15 1 355.1
Greece 176.48 4 133.4 805.19 18 523.1
Netherlands 86.76 6 62.1 512.48 7 364.2
Ireland 672.67 14 466.9 425.66 19 277.3
Italy 802.46 14 532.4 382.76 13 264.1
Belgium 2 616.85 27 916.6 331.49 27 241.4
Spain 85.70 8 63.1 227.47 11 164.5
Austria 391.89 12 244.4 212.79 7 166.7
Finland 621.13 18 388.2 142.56 9 103.9
Croatia 93.88 2 67.2 73.94 2 59
Czechia 0.00 0 0 35.67 1 26
Portugal 78.79 6 56.4 32.65 3 23.8
Estonia 166.22 1 102
Poland 93.17 3 61.4
Lithuania 10.48 1 7.5
Total EU 37 773.23 785 16 569.1 23 874.83 533 12 208.6Source: EurObserv’ER 2018
Overview of asset finance in the wind power sector (onshore + offshore) in the EU Member States in 2016 and 2017
1
GE
Euro
pe

Investment indicators
EUROBSERV !ER " THE STATE OF RENEWABLE ENERGIES IN EUROPE " #$%& EDITIONEUROBSERV !ER " THE STATE OF RENEWABLE ENERGIES IN EUROPE " #$%& EDITION
156 157
Capacity added associated with offshore investments fell from 5.2"GW in 2016 to 3.05"GW in 2017. This corresponds to a decline by 41%, which is less than the drop in investment and thus indicating that the investments cost also declined for offshore wind. In 2016, average expenditure per"MW of offshore capacity was almost !"4.2 million compared to only !"3.7 million in 2017. In the case of onshore, invest-ment costs are as expected subs-tantially lower. They marginally declined from !"1.42 million in 2016 to !"1.38 million in 2017.
HIGHEST INVESTMENTS IN THE UK AND GERMANY DUE TO OFFSHOREIn 2017, Germany retook the lead in wind investments from the UK, while both countries remain the two biggest players in this sector. Both countries, however, experienced substantial drops in investment between the two
years. In Germany, wind invest-ments totalled !"8.8 billion in 2017 compared to !"11.9 billion in 2016. In the UK, the slump in wind invest-ments was particularly dramatic. Investments dropped from very impressive !"15.6 billion in 2016 to around one third of this amount in 2017, namely !"5.1 billion. The high 2016 investments in the UK were almost entirely driven by five very large offshore investments total-ling !"13.5 billion. In Germany, off-shore also plays a very important role, but remains at a relatively stable level around !"4.5 billion in both years.
DENMARK TAKES THIRD PLACEDenmark saw a particularly high upsurge in wind investments. Investments increased from already noteworthy !"1.3 billion in 2016 to impressive !"2.9 billion in 2017. With this increase Denmark is ranked third in the EU. The high invest-
ments in 2017 are mainly driven by the offshore sector, where Denmark saw investments of !"2.54 billion. Sweden saw a similarly drastic increase in wind investments, which increased from almost !"1 billion in 2016 to !"1.65 billion in 2017. As the number of projects declined in Sweden, this increase in investment was driven by substantially larger projects in 2017
In France, investments in the wind sector remained at a very high level. Asset finance increased from !"2.14 billion in 2016 to !"2.22"bil-lion in 2017. The number of pro-jects also remained stable in both years. This positive trend ensures that France is the fourth largest player with respect to wind invest-ments in 2017.
Three other Member states expe-rienced high and increasing invest-ments in wind power plants. In Greece investments more than quadrupled from !" 176 million in 2016 to almost !"805 million in 2017. An even higher increase in wind investments could be obser-ved in the Netherlands, where asset finance amounted to !"512 million in 2017 compared to only !"87 million in the previous year. In contrast to Greece, this upsurge in investment was driven by large wind projects. Finally also Spain experienced a good year 2017, where wind investments totalled !"227 million. In 2016, only !"86"mil-lion were invested into wind capa-city in Spain.
Share of different types of asset finance in the wind power sector (onshore + offshore) in the EU in 2016 and 2017
2016 2017
Asset Finance!-
New Built
Number of Projects
Asset Finance!-
New Built
Number of Projects
Balance Sheet 70.84% 89.17% 73.64% 87.43%
Project Finance 28.02% 9.81% 22.63% 11.63%
Bond/Other 1.14% 1.02% 3.72% 0.94%
Total EU 100.0% 100.0% 100.0% 100.0%Source: EurObserv’ER 2018
2
2016 2017
Asset Finance!-
New Built (in " m)
Number of Projects
Capacity (MW)
Asset Finance!-
New Built (in " m)
Number of Projects
Capacity (MW)
Germany 4 630.99 3 1231 4 432.32 4 1 061
United Kingdom 13 535.72 5 2 819.5 4 273.89 1 1 386
Denmark 1 045.50 2 434 2 542.98 1 604.8
France 0.00 0 0 5.05 1 1.2
Belgium 2 283.49 2 678.7
Finland 108.16 1 40
Total EU 21 603.85 13 5 203.2 11 254.23 7 3 053Source: EurObserv’ER 2018
Overview of asset finance in the wind power sector offshore in the EU Member States in 2016 and 2017
3
Share of different types of asset finance in the wind power sector offshore in the EU in 2016 and 2017
2016 2017
Asset Finance!-
New Built
Number of Projects
Asset Finance!-
New Built
Number of Projects
Balance Sheet 65.72% 69.23% 79.83% 71.43%
Project Finance 34.28% 30.77% 20.17% 28.57%
Bond/Other 0.00% 0.00% 0.00% 0.00%
Total EU 100.0% 100.0% 100.0% 100.0%Source: EurObserv’ER 2018
4
Finally, wind investments in Croa-tia remained relatively stable between the two years. In 2016, !"94 million were invested in Croa-tian wind capacity compared to
!" 74 million in the subsequent year. In Czechia, one wind project saw financial close in 2017 and amounted to !"36 million.
DECREASING INVESTMENTS IN SEVERAL MEMBER STATESThe most dramatic drop in invest-ments could be observed in Belgium, where investment slum-ped from !"2.6 billion in 2016 to !"331"million in 2017. This decline, however, should not be over over-rated as it is mainly due to two very large offshore wind invest-ments in 2016. Thus, when only considering on-shore, the trend is relatively stable. In Finland, asset finance dropped significantly from !"621"million in 2016 to only !"143 million in 2017. In Ireland, Italy, Austria, and Portugal wind investments dropped less drama-tically. Finally, Estonia, Poland, and Lithuania only saw wind invest-ments in 2016.

Investment indicators
EUROBSERV !ER " THE STATE OF RENEWABLE ENERGIES IN EUROPE " #$%& EDITIONEUROBSERV !ER " THE STATE OF RENEWABLE ENERGIES IN EUROPE " #$%& EDITION
158 159
PV INVESTMENTS STABILISEAfter a continuous downward trend in solar PV investments in the last years, investments in utility-scale PV (>1"MW) totalled !"2.05"billion in 2017. This is a 7% decline relative to the 2016 invest-ments of !"2.2 billion. The num-ber of new investments fell at a
When analysing investments in solar PV, two points are
particularly important to be kept in mind. First of all, asset finan-cing only contains utility-scale investments. Hence, all small-scale investments as rooftop installa-tions, which make up the largest share in PV installations in most of
the EU countries, are not included in the asset finance data. As in the last editions, EurObserv’ER reports, in addition to utility-scale PV investments by Member State, overall EU investments in small-scale PV installations, i.e. PV installations with capacities below 1"MW.
PHOTOVOLTAIC
higher rate, namely by 16% from 293 solar PV investments in 2016 to 246 in 2017. This indicates that the average project size increased between the two years. An average PV project in 2016 amounted to !"7.53 million compared to !"8.3"mil-lion in 2017. Similar to overall asset
finance for PV power plants, the associated capacity added also dropped, however, with a lower magnitude, namely from 1.98"GW in 2016 to 1.96"GW in 2017. This indi-cates that the investment costs of PV dropped marginally between the two years. In 2016, investment
expenditures per"MW of PV capa-city were on average !"1.11 million compared to !"1.04 million in 2017. This corresponds to a decrease in investment costs by 6%. This decline in costs, however, is wea-
2016 2017
Asset Finance!-
New Built (in " m)
Number of Projects
Capacity (MW)
Asset Finance!-
New Built (in " m)
Number of Projects
Capacity (MW)
France 478.69 52 430.0 614.36 75 585.4
United Kingdom 1 253.96 185 1 152.4 353.77 59 339.0
Germany 232.47 33 175.9 336.89 53 314.5
Netherlands 85.39 14 79.0 287.97 30 269.7
Portugal 0.00 0 0 206.27 1 221
Spain 5.02 1 4.6 83.68 8 77.4
Denmark 41.39 1 37.9 68.15 3 64.7
Poland 0.00 0 0 43.91 2 41.0
Italy 72.09 2 66.1 20.14 3 18.8
Hungary 0.00 0 0 14.35 6 13.4
Greece 4.79 1 4.4 10.29 3 9.6
Finland 0.00 0 0 3.86 1 3.6
Austria 0.00 0 0 3.43 1 3.2
Sweden 2.95 1 2.7 1.61 1 1.5
Cyprus 14.61 2 13.4
Belgium 13.96 1 12.8
Total EU 2 205.33 293 1 979.3 2 048.66 246 1 962.9
Source: EurObserv’ER 2018
Overview of asset finance in the PV sector in the EU member states in 2016 and 2017 (PV Plants)
1
Sun
Po
wer

Investment indicators
EUROBSERV !ER " THE STATE OF RENEWABLE ENERGIES IN EUROPE " #$%& EDITIONEUROBSERV !ER " THE STATE OF RENEWABLE ENERGIES IN EUROPE " #$%& EDITION
160 161
the UK. After the very high 2016 investments of !"1.25 billion, UK PV investments dropped to only !"354"million in 2017, such that the UK is ranked second in 2017.
After continuous reductions in most of the previous years, German investments show a positive trend again. PV investments in Germany grew from !"232 million in 2016 to !"337 million in 2017, which corres-ponds to an increase by 45%. Ano-ther Member State with a notable increase in investments is the Netherlands, where investments increased from only !"85 million in 2016 to !"289 million in 2017.
After having experienced high PV investments in the past, Italian PV investments are on a very low level and keep declining. In 2016, only !"72 million were invested into utility-scale PV, while 2017 invest-ments decreased even further to only !"20 million. In the rest of the EU Member States, where invest-ment were recorded, the numbers of projects and the investments volumes are rather low. Across most of these countries, there were increases in investments, as Poland or Denmark, while in some countries investments declined between the two years.
2016 2017
Asset Finance!-
New Built
Number of Projects
Asset Finance!-
New Built
Number of Projects
Balance Sheet 80.37% 83.96% 78.34% 80.49%
Project Finance 19.63% 16.04% 21.37% 19.11%
Bond/Other 0.00% 0.00% 0.29% 0.41%
Total EU 100.0% 100.0% 100.0% 100.0%Source: EurObserv’ER 2018
2016 2017
Investment (in " m) Capacity (MW) Investment
(in " m)Capacity
(in MW)
Total EU 3 949.30 5 584 3 702.53 5 978Source: EurObserv’ER 2018
Overview of asset finance in the PV sector in the EU in 2016 and 2017 (commercial and residential PV) Share of different types of asset finance in the PV sector in the EU 2016 and 2017 (PV Plants)
32
Pic
jum
bo
ker than the considerable decline between 2015 and 2016 reported in the last edition.
With respect to the sources of finance for PV power plants, there is no substantial change obser-vable. In both years, the majority of PV power plants were financed through on-balance-sheet finan-cing. Between 2016 and 2017, the share of balance sheet financed PV investments decreased marginally from 80% in 2016 to 78% in 2017, while the share of non-recourse project financing rose from almost 17% to 21%. Bonds or other finan-cing mechanisms were not used for PV investments in 2016 and only played a negligible role in 2017.
As in previous years, investments in small-scale PV superseded utility-scale PV investments. Between the two years, however, investments dropped marginally. While small-scale PV investments
totalled almost !"4 billion in 2016, they amounted to !"3.7 billion in 2017. This corresponds to a decline by around 6%. In spite of this slight decrease in investment volumes, the associated capacity added actually increased between 2016 and 2017, namely from 5.6"GW to almost 6"GW, which indicates a considerable drop of the invest-ment expenditures per"MW, which dropped by 12%.
FRANCE WITH HIGHEST INVESTMENTS IN !"#$, DECLINE IN UK INVESTMENTSSince 2012, there has been a strong concentration of PV investments in the UK. In 2017, however, this picture seems to have changed: France has taken over the first rank in utility-scale PV investments in the EU. After already very high 2016 investments totalling !"479 million, asset finance even increased to !"614 million in 2017. The rever-sed situation can be observed for

Investment indicators
EUROBSERV !ER " THE STATE OF RENEWABLE ENERGIES IN EUROPE " #$%& EDITIONEUROBSERV !ER " THE STATE OF RENEWABLE ENERGIES IN EUROPE " #$%& EDITION
162 163
In the biogas sector, the fol-lowing four types of biogas
utility-scale investments are tracked: (i) electricity generation (new) – new built biogas plants with 1"MWe or more that generate electricity, (ii) electricity genera-tion (retrofit) – converted power plants such that they can (at least partly) use biogas (also includes refurbished biogas plants), (iii) heat – biogas power plants with a capacity of 30"MWth or more generating heat, and (iv) combi-ned heat & power (CHP) – biogas power plants with a capacity of 1"MWe or more the generate elec-tricity and heat. In addition to power plants for heating and/or electricity that use biogas, there are also plants that do not pro-duce electricity, but rather pro-duce biogas (biomethane plants), which is injected into the natural gas grid. The latter are by far the
BIOGASminority in the data. However, to allow for distinguishing between these two types of biogas invest-ments, two tables are presented, one with asset finance for biogas power plants and one for facilities producing biogas.
INVESTMENTS IN BIOGAS POWER DECLINEAsset finance for biogas – inclu-ding biogas power plants as well as biogas production plants – remained marginally declined. In 2016, overall !"113 million were invested compared to !" 85 mil-lion in 2017. The relative impor-tance of biogas power plants and biogas production plants changed considerably between the two years. Investments in biogas power plants fell conside-rably between the two years. In 2016, !"113 million were invested in biogas power plants compa-
red to only !" 10 million in the subsequent year. The associated capacity added of these invest-ments fell slightly weaker from 31.8" MW in 2015 to 4" MW. This indicates that the investment costs of biogas plants seemed to decline between the two years namely from !"3.55"million per"MW to !"2.47 million per"MW in 2017. This change in investment expen-ditures per"MW of biogas capacity, however, should be interpreted with care due to the very few observations, in particular in 2017, where only two investments could be observed.
In contrast to the investments in biogas power plants, investments in biogas production plants were only observed in 2017. In that year, one relatively large investment of
2016 2017
Asset Finance!-
New Built (in " m)
Number of Projects
Capacity (m3/hr)
Asset Finance!-
New Built (in " m)
Number of Projects
Capacity (m3/hr)
Denmark 0.00 0 0 75.03 1 3139.27
Total EU 0.00 0 0 75.03 1 3139.27
Source: EurObserv’ER 2018
2016 2017
Asset Finance!-
New Built (in " m)
Number of Projects
Capacity (MW)
Asset Finance!-
New Built (in " m)
Number of Projects
Capacity (MW)
United Kingdom 102.38 7 28.6 9.88 2 4
France 10.46 3 3.2
Total EU 112.84 10 31.8 9.88 2 4.0
Source: EurObserv’ER 2018
Overview of asset finance in the biogas sector in the EU member states in 2016 and 2017 (biomethane)
O!er!"e# o$ %sset &'%'ce "' t(e b"o)%s sector "' t(e E* +e+ber st%tes "' 2016 %', 2017 (b"o)%s p-%'ts)
2
1
Nas
keo
En
viro
nn
emen
t

Investment indicators
EUROBSERV !ER " THE STATE OF RENEWABLE ENERGIES IN EUROPE " #$%& EDITIONEUROBSERV !ER " THE STATE OF RENEWABLE ENERGIES IN EUROPE " #$%& EDITION
164 165
Share of different types of asset finance in the biogas sector in the EU in 2016 and 2017 (biogas plants)
2016 2017
Asset Finance!-
New Built
Number of Projects
Asset Finance!-
New Built
Number of Projects
Balance Sheet 72.64% 90.00% 100.00% 100.00%
Project Finance 27.36% 10.00% 0.00% 0.00%
Bond/Other 0.00% 0.00% 0.00% 0.00%
Total EU 100.0% 100.0% 100.0% 100.0%Source: EurObserv’ER 2018
!"75 million was performed. The associated capacity of the biogas production plant is 3139"m3/hr. Thus, this investment is the main driver for the overall relatively marginal decline in overall biogas investments.
The way biogas power plants were financed changed between 2016 and 2017. In 2016, 73% of all invest-ments were financed from balance sheets, while the remaining 27% used project finance. As only 10% of all plants used project finance, project financed investments were on average larger than those financed from balance sheets, which is the typical observation that can often be made across RES. In 2017, all biogas power plants as well as the biogas production plant were on-balance-sheet financed.
INVESTMENTS MAINLY IN DENMARK AND THE UKOnly the UK saw biogas invest-ments in both years. In 2016, the UK dominated the investments in bio-gas power plants with !"102 million that went into 7 new plants with an aggregate capacity added of 28.6"MW. In 2017, only !"9.9 million were invested in the UK. Another Member State with investments in 2016 was France with three rather small investments totalling !"10.5"million with an associated capacity added of 3.2"MW. Finally, the !"75 million investment in a bio-gas production facility occurred in Denmark.
3
AB
En
erg
y
Rem
i V
ilag
gi
/ Te
rre
d’i
nfo

Investment indicators
EUROBSERV !ER " THE STATE OF RENEWABLE ENERGIES IN EUROPE " #$%& EDITIONEUROBSERV !ER " THE STATE OF RENEWABLE ENERGIES IN EUROPE " #$%& EDITION
166 167
Similar to the solid biomass data, the asset financing data
on waste-to-energy data includes four types of utility-scale invest-ments: (i) electricity generation (new) – new built plants with 1" MWe or more that generate electricity, (ii) heat – thermal plants with a capacity of 30"MWth or more generating heat, and (iii) combined heat & power (CHP) –power plants with a capacity of 1"MWe or more to generate elec-tricity and heat. Another element to note is that waste to energy plants burn municipal waste, which is conventionally deemed to include a 50% share of waste from renewable origin. This part presents investments related to plants, not to the production of renewable waste used for energy production.
RENEWABLE MUNICIPAL WASTEDROP IN WASTE INVESTMENTSOverall EU investments in the waste-to-energy sector dropped significantly between the two years. In 2016, !"1.1 billion were invested in waste-to-energy plants compared to only !"164 million in 2017. The number of waste-to-energy projects reaching financial close dropped from 10 projects in 2016 to 2 projects in 2017. The average project size also declined from, on average, !"110 million to !"82"million.
Similarly, the capacity added asso-ciated with investments is notably larger in 2016 with 224"MW com-pared to 27"MW in 2017. Thus, the investment cost increased notably between the two years, namely from !"5 million per"MW in 2016 to !"6"million in 2017, which, howe-ver, should be interpreted with care. A main driver of the relati-
vely low costs in 2016 is that the largest plant in that year (70MW) is a retrofit of an existing power plant, which typically involves significantly less expenditures per"MW compared to new built plants.
In 2016, the shares of on-balance-sheet (42%) and project financed (58%) investments are relatively balanced. In that year, the average size of project financed invest-ments was significantly larger than those financed from balance sheets, which is the typical obser-vation that can often be made across RES. In 2017 all waste pro-jects used balance-sheet financing.
In the previous years, the UK typi-cally dominated waste-to-energy investments. This is still true for 2016, where all investments were conducted in that country. In 2017,
however, only a small investment of !"8 million was recorded in the UK. The by far largest investment of !"156 million was conducted in Lithuania.
Share of different types of asset finance in the waste sector in the EU in 2016 and 2017
2016 2017
Asset Finance!-
New Built
Number of Projects
Asset Finance!-
New Built
Number of Projects
Balance Sheet 42.00% 70.00% 100.00% 100.00%
Project Finance 58.00% 30.00% 0.00% 0.00%
Bond/Other 0.00% 0.00% 0.00% 0.00%
Total EU 100.0% 100.0% 100.0% 100.0%Source: EurObserv’ER 2018
2016 2017
Asset Finance!-
New Built (in " m)
Number of Projects
Capacity (MW)
Asset Finance!-
New Built (in " m)
Number of Projects
Capacity (MW)
Lithuania 0.00 0 0 155.91 1 24
United Kingdom 1104.46 10 223.9 8.15 1 3.3
Total EU 1104.46 10 223.9 164.06 2 27.30Source: EurObserv’ER 2018
Overview of asset finance in the waste sector in the EU member states in 2016 and 2017
2
1
EDF

Investment indicators
EUROBSERV !ER " THE STATE OF RENEWABLE ENERGIES IN EUROPE " #$%& EDITIONEUROBSERV !ER " THE STATE OF RENEWABLE ENERGIES IN EUROPE " #$%& EDITION
168 169
This technology uses geother-mal energy for heating and/
or electricity generation. Before discussing the asset financing for geothermal plants in the EU, the types of investments included in the underlying data have to be dif-ferentiated. The data includes four types of geothermal investments, namely: (i) conventional geother-mal energy, (ii) district heating, (iii) combined heat and power (CHP), and (iv) enhanced geothermal sys-tems. Geothermal energy has a strong regional focus in the EU. The largest user of geothermal energy by far is Italy, although other EU countries also use this energy source to a certain extent.
INCREASING GEOTHERMAL INVESTMENTS IN THE EUIn 2017, !"131 million were invested in geothermal capacity in the EU. This is an increase by 64% com-pared to the 2016 investments of !"80"million. Thus, in 2017, invest-ments reached the relatively high level of 2015, which was subs-tantially higher than in previous years, where often small or no investments in geothermal were observed in the EU. The number of new geothermal projects increased from 3 to 4, which indicates that the average project size increased between the two years, namely from !"26.5 million per geother-mal plant in 2016 to !"32.7 million in 2017. The associated capacity increased at a slower pace from 46"MW to 66"MW. Thus, the average
where !"125 million were invested in 3 geothermal plants. Further-more, the Netherlands are the only Member State with investments in both years. In 2016, however, asset finance was at a notably lower level with !"19 million. The only other country with geothermal investments in 2017 is Hungary with a rather small investment of !"5.4 million. The highest invest-ments in 2016 were conducted in Germany, where !"53 million were invested into a 26"MW geothermal plant. In the same year, !"8 million were invested in Portugal into a 4"MW plant.
2016 2017
Asset Finance!-
New Built (in " m)
Number of Projects
Capacity (MWth)
Asset Finance!-
New Built (in " m)
Number of Projects
Capacity (MW)
Netherlands 18.75 1 16 125.48 3 63
Hungary 0.00 0 0 5.38 1 2.7
Germany 52.73 1 26 0.00 0 0
Portugal 8.11 1 4 0.00 0 0
Total EU 79.59 3 46 130.86 4 66Source: EurObserv’ER 2018
O!er!"e# o$ %sset &'%'ce "' t(e )eot(er+%- sector "' t(e E* +e+ber st%tes "' 2016 %', 2017
1
2Share of different types of asset finance in the geothermal sector in the EU in 2016 and 2017
2016 2017
Asset Finance!-
New Built (in " m)
Number of Projects
Asset Finance!-
New Built (in " m)
Number of Projects
Balance Sheet 76.44% 66.67% 0.00% 0.00%
Project Finance 23.56% 33.33% 100.00% 100.00%
Bond/Other 0.00% 0.00% 0.00% 0.00%
Total EU 100.0% 100.0% 100.0% 100.0%Source: EurObserv’ER 2018
GEOTHERMAL ENERGY
EDF
investment expenditures margi-nally increased from !" 1.73"mil-lion per"MW in 2016 to !"2 million per"MW in 2017.
The way geothermal projects are financed changed notably between the two years. In 2016, more than 76% of investments used on-balance-sheet finance, while only 24% were project financed. The picture changed completely in 2017, where all geothermal plants used project finance. In both years, bonds and other financing instru-ments did not play any role in geo-thermal investments.
THE NETHERLANDS DOMI%NATE !"#$ INVESTMENTSThe Netherlands dominate geo-thermal investments in 2017,

Investment indicators
EUROBSERV !ER " THE STATE OF RENEWABLE ENERGIES IN EUROPE " #$%& EDITIONEUROBSERV !ER " THE STATE OF RENEWABLE ENERGIES IN EUROPE " #$%& EDITION
170 171
30"MWth or more generating heat, and (iv) combined heat & power (CHP) – biomass power plants with a capacity of 1"MWe or more that generate electricity and heat.
SLUMP IN BIOMASS INVESTMENTS2016 has been a very strong year with respect to asset finance for uti-lity-scale biomass. EU-investments totalled more than !"5 billion. These investments are notably higher than in most of the previous years. In 2017, however, biomass invest-ment slumped by almost 87% to only !" 679 million. The capacity
added fell at almost the identical rate. While the capacity added associated with 2016 investments totalled 1.7"GW, capacity added in 2017 only amounted to 208"MW. The number of biomass projects, howe-ver, only fell by 55% from 20"projects in 2016 to 9 projects in 2017. Thus, the very high investments in 2016 were mainly driven by, on average, very large investments. In fact, the average biomass project in 2017 was !"75 million compared to !"253 million in the previous year. Investment cost per"MW marginally increased from !"3 million per"MW in 2016 to !"3.3 million in 2017.
The way biomass power plants are financed did not change notably between the two years. In both years, the majority of biomass projects were on-balance-sheet financed with shares around 72% in both years. The remainder of all biomass plants used project finance. In both years, the size of project financed investments was on average significantly larger than those financed from balance sheets, which is the typi-
cal observation that can often be made across RES.
DIVERSE DEVELOPMENTS ACROSS THE EUIn 2016, by far the largest invest-ments in biomass capacity could be observed in the UK and, in par-ticular, the Netherlands. In the UK, !"1.26 billion were invested and in the Netherlands almost !" 2.4 billion. In line with these large investment sums, the asso-
ciated capacity additions in both countries were quite large, namely 801"MW in the Netherlands and 408"MW in the UK. A notable diffe-rence between the two countries is the low number of biomass pro-jects in the Netherlands, namely two very large investments.
Overall, there are only few Mem-ber States that saw investments
Asset financing for solid biomass discussed here solely includes
investment into solid biomass power plants. Hence, there are no investments in biomass pro-duction capacity in the data. The data contains four types of bio-mass utility-scale investments: (i) electricity generation (new) – new built biomass plants with 1"MWe or more that generate electricity, (ii) electricity generation (retrofit) – converted power plants such that they can (at least partly) use biomass (also includes refurbished biomass plants), (iii) heat – biomass power plants with a capacity of
SOLID BIOMASS
2016 2017
Asset Finance!-
New Built (in " m)
Number of Projects
Capacity (MW)
Asset Finance!-
New Built (in " m)
Number of Projects
Capacity (MW)
Denmark 666.23 1 150.0 163.26 1 25.0
Italy 57.33 1 22.8 121.28 1 30.0
Portugal 0.00 0 0 104.82 1 30.0
Finland 145.09 1 170.0 91.21 1 30.7
United Kingdom 1 258.95 10 408.0 86.69 2 35.1
Spain 0.00 0 0 84.30 1 46.0
Croatia 0.00 0 0 24.80 1 5.0
Sweden 0.00 0 0 2.57 1 6.0
Netherlands 2 381.96 2 801.0
Lithuania 338.11 1 87.6
France 124.67 2 28.8
Estonia 64.49 1 21.4
Germany 21.00 1 6.4
Total EU 5 057.84 20 1 696.0 678.93 9 207.8Source: EurObserv’ER 2018
O!er!"e# o$ %sset &'%'ce "' t(e so-", b"o+%ss sector "' t(e E* .e+ber St%tes "' 2016 %', 2017
1
Erik
Wes
tber
g

Investment indicators
EUROBSERV !ER " THE STATE OF RENEWABLE ENERGIES IN EUROPE " #$%& EDITIONEUROBSERV !ER " THE STATE OF RENEWABLE ENERGIES IN EUROPE " #$%& EDITION
172 173
in both years. Furthermore, almost all countries with investments in 2017, with the exception of the UK, saw only one biomass invest-ment in that year, respectively. The largest investment of !"163"million was recorded in Denmark, fol-lowed by Italy with !"121 million and Portugal with !"105 million. While no biomass investments happened in Portugal in 2016, !"57 million were invested in Italy and even !"666"million in Denmark. The fourth country with investments in the two years, next to Denmark, Italy, and the UK, is Finland where !"145"million were invested in 2016 and !"91 million in 2017.
The remainder of the Member States experienced investments in only one of the two years. Spain, Croatia, and Sweden saw bio-mass investments only in 2017. In contrast, only in 2016 there were biomass investments in Lithua-nia, France, Estonia, and Germany. Among those, the very high invest-ment of !"338 million in Lithuania is particularly noteworthy.
2Share of different types of asset finance in the solid biomass sector in the EU in 2016 and 2017
2016 2017
Asset Finance!-
New Built (in " m)
Number of Projects
Asset Finance!-
New Built (in " m)
Number of Projects
Balance Sheet 72.51% 75.00% 72.14% 77.78%
Project Finance 27.49% 25.00% 27.86% 22.22%
Bond/Other 0.00% 0.00% 0.00% 0.00%
Total EU 100.0% 100.0% 100.0% 100.0%Source: EurObserv’ER 2018
Bad
eno
va A
G &
Co
Siem
ens
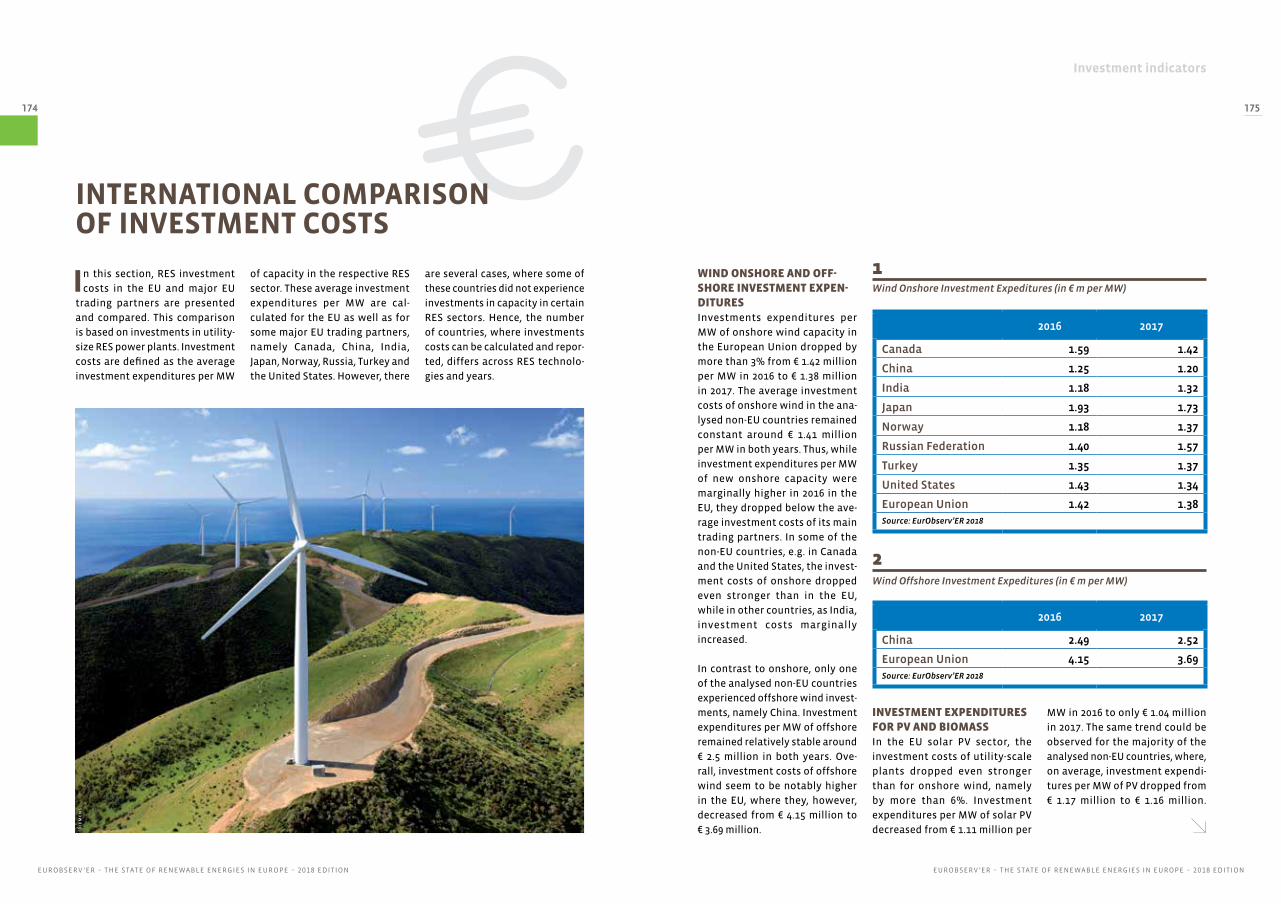
Investment indicators
EUROBSERV !ER " THE STATE OF RENEWABLE ENERGIES IN EUROPE " #$%& EDITIONEUROBSERV !ER " THE STATE OF RENEWABLE ENERGIES IN EUROPE " #$%& EDITION
174 175
In this section, RES investment costs in the EU and major EU
trading partners are presented and compared. This comparison is based on investments in utility-size RES power plants. Investment costs are defined as the average investment expenditures per MW
of capacity in the respective RES sector. These average investment expenditures per MW are cal-culated for the EU as well as for some major EU trading partners, namely Canada, China, India, Japan, Norway, Russia, Turkey and the United States. However, there
INTERNATIONAL COMPARISON OF INVESTMENT COSTS
are several cases, where some of these countries did not experience investments in capacity in certain RES sectors. Hence, the number of countries, where investments costs can be calculated and repor-ted, differs across RES technolo-gies and years.
WIND ONSHORE AND OFF%SHORE INVESTMENT EXPEN%DITURESInvestments expenditures per MW of onshore wind capacity in the European Union dropped by more than 3% from !"1.42 million per MW in 2016 to !"1.38 million in 2017. The average investment costs of onshore wind in the ana-lysed non-EU countries remained constant around !" 1.41 million per MW in both years. Thus, while investment expenditures per MW of new onshore capacity were marginally higher in 2016 in the EU, they dropped below the ave-rage investment costs of its main trading partners. In some of the non-EU countries, e.g. in Canada and the United States, the invest-ment costs of onshore dropped even stronger than in the EU, while in other countries, as India, investment costs marginally increased.
In contrast to onshore, only one of the analysed non-EU countries experienced offshore wind invest-ments, namely China. Investment expenditures per MW of offshore remained relatively stable around !"2.5 million in both years. Ove-rall, investment costs of offshore wind seem to be notably higher in the EU, where they, however, decreased from !"4.15 million to !"3.69 million.
INVESTMENT EXPENDITURES FOR PV AND BIOMASSIn the EU solar PV sector, the investment costs of utility-scale plants dropped even stronger than for onshore wind, namely by more than 6%. Investment expenditures per MW of solar PV decreased from !"1.11 million per
MW in 2016 to only !"1.04 million in 2017. The same trend could be observed for the majority of the analysed non-EU countries, where, on average, investment expendi-tures per MW of PV dropped from !" 1.17 million to !" 1.16 million.
Wind Onshore Investment Expeditures (in / m0per0MW)
Wind Offshore Investment Expeditures (in / m0per0MW)
2016 2017
Canada 1.59 1.42
China 1.25 1.20
India 1.18 1.32
Japan 1.93 1.73
Norway 1.18 1.37
Russian Federation 1.40 1.57
Turkey 1.35 1.37
United States 1.43 1.34
European Union 1.42 1.38Source: EurObserv’ER 2018
2016 2017
China 2.49 2.52
European Union 4.15 3.69Source: EurObserv’ER 2018
1
2
Siem
ens
Investment indicators
EUROBSERV !ER " THE STATE OF RENEWABLE ENERGIES IN EUROPE " #$%& EDITIONEUROBSERV !ER " THE STATE OF RENEWABLE ENERGIES IN EUROPE " #$%& EDITION
176 177
Hence, in both years, investment costs for PV are below the average of the analysed non-EU economies and the EU investment cost advan-tage even increased in 2017.
In the EU biomass sector, the investment expenditures for one MW increased from !"2.98 million per MW in 2016 to !"3.27 million in 2017. These investment expen-ditures were higher than the ave-rage of the considered non-EU countries, which were !"2.42"mil-lion per MW in 2016 and !"2.12"mil-lion in 2017. The main driver of these low costs is China, where investment costs per MW of bio-mass capacity were significantly below !"2 million in both years.
Overall, the analysis shows a heterogeneous picture across RES technologies. In the two sectors with the highest investments in the EU, onshore wind and solar PV, investment costs per MW of capacity seem to be below the average of the considered non-EU countries. In addition to the lower absolute investment costs, these costs were still decreasing between 2016 and 2017 in the EU. For biomass and offshore wind, investment expenditures per MW seem to be higher in the EU. These results for biomass, however, have to be interpreted with care due to very few observations of biomass investments.
Solar PV Investment Expeditures (in / m0per0MW)
Biomass Investment Expeditures (in / m0per0MW)
2016 2017
Canada 1.09 1.11
China 1.16 1.08
India 0.90 0.94
Japan 1.63 1.53
Russian Federation 1.09 1.28
Turkey 1.09 1.07
United States 1.19 1.13
European Union 1.11 1.04Source: EurObserv’ER 2018
2016 2017
China 1.60 1.39
Japan 3.14 2.49
United States 2.52 2.47
European Union 2.98 3.27Source: EurObserv’ER 2018
3
4
DR

Investment indicators
EUROBSERV !ER " THE STATE OF RENEWABLE ENERGIES IN EUROPE " #$%& EDITIONEUROBSERV !ER " THE STATE OF RENEWABLE ENERGIES IN EUROPE " #$%& EDITION
178 179
To capture the involvement of the public sector in RES
financing, EurObserv’ER gathered information on national and EU-wide financing or promotion programmes. In general, public finance institutions can play an important role in catalysing and mobilising investment in renewable energy. There are numerous instruments which are used by these institutions, which are typically either state-owned or mandated by their national government or the European Union. The instruments range from providing subsidies/grants or equity to classic concessional lending (loans with favourable conditions / soft loans) or guarantees. The dominant instrument in terms of financial volume is concessional lending. The loans provided by public finance institutions are typically aimed at projects that have commercial prospects, but would not have happened without the public bank’s intervention.
In this section, an overview of public finance programmes for RES investments available in 2016 and/or 2017 is presented. This overview only contains programmes, where financial instruments, as debt / equity finance or guarantees, are offered. Grant and subsidy programmes are not covered in
this section, as they are tracked, next to other RES policies, in the EU EurObserv’ER Policy Files. Hence, this overview is complementary to the country profiles on RES policies and regulations. As the overview concentrates on dedicated RES financing programmes or funds focussing on RES, it might omit public finance institutions that provide RES financing without having explicitly set up a programme or dedicated fund. An example is the Nordic Investment Bank (NIB) that also offers loans for RES investments to its member countries, namely Denmark, Finland, Iceland, Norway, Sweden, Estonia, Latvia, and Lithuania. The overview comprises both programmes and funds that only provide finance for RES investments as well as those, which have other focus areas next to renewables, such as energy efficiency investments. An example of the latter is the Polish Sustainable Energy Financing Facility (PolSEFF#), where investments in energy efficiency measures for equipment, systems and processes or residential and commercial buildings play an important role.
OVERVIEW OF INSTITUTIONSThere are a number of public finance institutions with dedi-cated financing programmes for
PUBLIC FINANCE PROGRAMMES FOR RES INVESTMENTS
RES in the EU. These include, but are not limited to, the two Euro-pean public banks – the European Investment Bank (EIB) and the European Bank of Reconstruction and Development (EBRD) – as well as numerous regional and natio-nal public banks such as the KfW (Kreditanstalt für Wiederaufbau), or the Croatian Bank for Recons-truction and Development (HBOR). Furthermore, there are numerous funds, which provide financing for RES investments. These include EU-wide funds, such as the European Regional and Development Fund (ERDF) or the Cohesion Fund of the EIB, as well as national funds, as the Slovenian Environmental Public Fund (Eco-Fund) or the Lithuanian Environmental Invest-ment Fund (LEIF). Finally, there are also dedicated financing facilities that provide lending for RES invest-ments and typically also offer tech-nical assistance to private banks. Examples are the Polish Sustai-nable Energy Financing Facility (PolSEFF) or the Slovak Energy Efficiency and Renewable Energy Finance Facility (SLOVSEFF III) of the EBRD.
FINANCING SCHEMES AND INSTRUMENTSThe presented public finance programmes differ with respect to financing instruments used, financing amounts, and types of
final beneficiaries. Most of the pro-grammes and funds offer conces-sional financing. In some cases, also loan guarantees are offered.
There are also substantial dif-ferences in the way financing is provided for RES investments of the final beneficiaries. In many cases, as the KfW Renewable Energies Programme, direct len-ding is available, i.e. the borrower directly receives a loan from the public finance institution. The loans might also be tight to cer-tain conditions, e.g. that private banks also provide financing for the respective RES investment. In the KfW Programme Offshore Wind Energy, direct public loans are given in the framework of bank consortia, where private banks have to provide at least the same amount of debt financing. Alternatively, there are cases, where financing is provided indi-rectly, i.e. via a private partner institution. Such a structure is being used within EBRD’s Pol-SEFF that offers loans to SMEs for investments in sustainable energy technologies. PolSEFF, however, is not lending directly to SMEs, but rather provides credit lines to pri-vate partner banks, which then on lend to the final beneficiaries.
Finally, there are considerable differences in the financing
volumes across programmes. The KfW Funding Initiative Energy Transition, e.g., focuses on large-scale RES investments with loans ranging from !"25 to !"100 million. In contrast, the Polish programme PROSUMER focuses on micro-ins-tallations, e.g. small RES electri-city installations of up to 40 kWe. Overall, a wide variety of financing schemes, used instruments, and focused final borrowers can be observed in the EU.
It is possible that public involvement in financing RES projects in the EU will slow down in the next years, similar to other RES support mechanisms. One example is the Fondo Kyoto
of Cassa Depositi e Prestiti in Italy, which was removed from the overview as no budget was assigned for 2017. The need of public finance might decline as different RES technologies mature over the years. However, RES investments will remain highly dependent on services provided by capital markets. As they are typically characterised by high up-front and low operation costs, the cost structure of RES projects is dominated by capital costs.
Pix
abay

Investment indicators
EUROBSERV !ER " THE STATE OF RENEWABLE ENERGIES IN EUROPE " #$%& EDITIONEUROBSERV !ER " THE STATE OF RENEWABLE ENERGIES IN EUROPE " #$%& EDITION
180 181
Programme Involved Institutions / Agencies Country Date effective Targeted RES Sector Short Discription RES Financing Scheme
EIB European Regional and Development Fund (ERDF)
European Investment Bank (EIB) EU 28 2014Multiple RES (and other non-RES focus areas)
Provision of loans. guarantees. and equity for RES projects in all EU Member States
EIB Cohesion Fund European Investment Bank (EIB)
EU Member States with GNI per capita below 90% of EU average.
2014Multiple RES (and other non-RES focus areas)
Financial support (guarantees. loans. (quasi-) equity participation and other risk-bearing mechanisms).
Loan Programme Environmental Protection and Energy Fund (EPEEF) Croatia 2003 Multiple RESLoans. subsidies. financial assistance. and grants for RES (and environmental protection and waste management)
Loan Programme for Environmental Protection, Energy Efficiency and Renewable Energy
Croatian Bank for Reconstruction and Development (HBOR) Croatia 1992 Multiple RES Loans for RES investments
Loan guarantees for local initiatives for the construction of wind-energy plants
Energinet.dk Denmark 2009 Onshore Wind Provision of loan guarantees
Heat FundFrench Agency for Environment and Energy Management (ADEME)
France 2009Solar thermal. biomass. geothermal. biogas. waste heat and district heating
Subsidies for large RES heating installations
Funding Initiative Energy Transition Kreditanstalt für Wiederaufbau (KfW) Germany 2012 Multiple RES Loans for large scale RES investments
Programme Offshore Wind Energy Kreditanstalt für Wiederaufbau (KfW) Germany 2011 Offshore WindDirect loans of KfW in the framework of bank consortia for offshore wind
Renewable Energies Programme Kreditanstalt für Wiederaufbau (KfW) Germany 2009Solar photovoltaicSolar thermal
Loans for RES (with different conditions based on RES technology)
Market Incentive ProgrammeKreditanstalt für Wiederaufbau (KfW), Federal Ministry of Economic Affairs
Germany 1999Biomass. geothermal, solar PV
Soft loans for larger/commercial RES installations
Environment Innovation ProgramThe Federal Ministry for the Environment, Nature Conservation, Building and Nuclear Safety (BMUB); Kreditanstalt für Wiederaufbau (KfW)
Germany 1997 Multiple RESLoans / interest rate subsidies for large scale RES plants with demonstration character
The Lithuanian Environmental Investment Fund (LEIF) The Lithuanian Environmental Investment Fund (LEIF) Lithuania 1996 Multiple RES Soft loans for RES investments
Loans from the National Fund for Environmental Protection and Water Management
National Fund for Environmental Protection and Water Management (NFEPWM)
Poland 2015Biomass. geothermal, solar PV
Loans for RES investments
BOCIAN - support for distributed renewable energy sources
National Fund for Environmental Protection and Water Management (NFEPWM)
Poland 2014 Multiple RES Provision of soft loans for distributed RES
PROSUMER - programme supporting deployment of RES microinstallation
The National Fund for Environmental Protection and Water Management
Poland 2014 Multiple RESLoans for micro-installations of RES. Beneficiaries: individuals. housing associations and communities. local governments.
Polish Sustainable Energy Financing Facility - 2nd Edition (PolSEFF) European Bank for Reconstruction and Development (EBRD) Poland 2011 Multiple RES
Provision of credit lines that are available through partner banks
Slovak Energy Efficiency and Renewable Energy Finance Facility (SLOVSEFF III) European Bank for Reconstruction and Development (EBRD) Slovakia 2014 Multiple RES
Loans for RES investments (and energy effi-ciency)
Slovenian Environmental Public Fund (Eco-Fund) Slovenian Environmental Public Fund (Eco-Fund) Slovenia 2000 Multiple RES
Soft loans for RES projects of SMEs and large-scale companies
Commercial Loans to Start-up Energy Companies
Swedish Energy Agency Sweden 2006 Multiple RES Loans for start-up RES-companies
Energy Saving Scotland Small Business Loans scheme
Energy Saving Trust United Kingdom 1999 Multiple RES Soft loans for SMEs for RES measures
Public Finance Programmes for RES
1

Investment indicators
182 183
EUROBSERV !ER " THE STATE OF RENEWABLE ENERGIES IN EUROPE " #$%& EDITION
Investment in Renewable Energy Technology
Methodological note
VENTURE CAPITAL & PRIVATE EQUITYEurObserv’ER collects data investments of venture capital and private equity funds into renewable energy technology developing firms. Venture capi-tal (VC) focuses on very young start-up companies typically with high risks and high potential returns. Venture capital can be provided to back an idea of an entrepreneur before the business has started. It may be used to finalize technology development or to develop initial business concepts before the start-up phase. Venture capital can be also used in the subsequent start-up phase to finance e.g. product development and initial marketing or the expansion of a business. Basically, venture capital funds finance risky start-ups with the aim to sell the shares with a profit. Private equity (PE) is a type of equity that is not traded on stock markets. Generally, PE aims at more mature companies than VC and can be divided into two types. PE expansion capital is financing companies that plan to expand or restructure their operations or enter new mar-kets. While expansion capital is usually a minority investment, PE buy-outs are investments to buy a company. These investments are often accompa-
nied by large amount of borrowed money due to the usually high acquisition costs.
Summing up, venture capital investments target renewable energy technology firms at the start-up phase, while private equity aims at relatively mature companies. While VC investments are typi-cally small, private equity deals are usually larger. PE-buyouts are in general the by far largest deals since in such a deal a mature company is acqui-red. All these investments together shed a light on the activity of start-up und young renewable energy technology firms, while it is essential to distinguish between the typically large PE buy-outs and the other investments when analysing the VC/PE investments in the RES sectors. Hence, a breakdown of VC/PE investments by invest-ment stage will be provided to show a more com-prehensive picture. Overall, the trends in VC/PE investments have to be interpreted with care as the data coverage might not be perfect and due to the rather low amount of observations for VC/PE, potentially missing data might have a dilutive effect on the results.
PERFORMANCE OF RES TECHNOLOGY FIRMS AND ASSETS ON PUBLIC MARKETSThe RES indices are intended to capture the situa-tion and dynamics on the EU market for equipment manufacturers and project developers. The metho-dological approach is to include EU RES firms that are listed on stock markets and where the firms’ revenues were (almost) entirely generated by RES operations. Hence, there might be important large firms that are not included in the indices. The reason is that there are numerous (partly very large) companies that produce renewable energy technologies but are also active in other sectors (e.g. manufacturers producing wind turbines, but as well turbines for conventional power plants). These are not included since their stock prices might be largely influenced by their operations in other areas than RES. Furthermore, there is also a large group of small firms that are not listed on stock markets which hence are also not included here. For the sectoral indices, RES firms are allo-cated if they are only (or mainly) active in the res-pective sector. The final choice among the firms in each sector is done by the firm size measured in revenues. Hence, the indices contain the ten largest quoted RES firms in the EU in the respec-tive sector and year.
The indices are constructed as Laspeyres-Indices. The aim of a Laspeyres-Index is to show the aggregated price changes, since the weighting is used based on the base values. Hence, firms are weighted by their revenues in the respective previous period. In 2016, e.g., the firms are weighted by their 2015 revenues whereas in 2017, the 2016 revenues are applied. So the weighting is adjusted every year in order to keep the structure appropriate. The reason for this approach – in contrast to weighting the firms according to their market capitalisation – is that this approach reflects less the short term stock market fluctuations but rather focuses on long-term deve-lopments as it is in this analysis that concentrates on the development of two years. The top ten firms for the respective RES Technology Indices are selected and, if necessary replaced, based on their revenues.
Furthermore, EurObserv’ER collects and ana-lyses data on YieldCos. YieldCos are entities that own cash-generating infrastructure assets, e.g. renewable energy plants, where the ownership is offered on public markets. Hence, YieldCos are also listed on stock markets. As there are only very few YieldCos currently operational in the EU, the stock prices of these will be captured rather than constructing an index as in the case of RES firms.
The EurObserv’ER investment indicators also focus on investments related to the development and pro-duction of RES technologies as well as the perfor-mance of RES firms and assets. Hence, information
of venture capital and private equity investments is presented. Additionally, RES indices based on EU RES firms are constructed and the performance of YieldCos is tracked.

Investment indicators
EUROBSERV !ER " THE STATE OF RENEWABLE ENERGIES IN EUROPE " #$%& EDITIONEUROBSERV !ER " THE STATE OF RENEWABLE ENERGIES IN EUROPE " #$%& EDITION
184 185
Total venture capital (VC) and private equity (PE) investments
in renewable energy companies decreased between 2016 and 2017 by around 18%. In 2017, total VC/PE investments in the EU amounted to !"1.6 billion compared to !"2 billion in 2016. Thus, the development of VC/PE investments in the RES sec-tors runs against the overall posi-tive trend in VC/PE investments in the EU. According to the data of the European Private Equity and Venture Capital Association (EVCA), overall EU-wide VC/PE investments (covering all sectors) increased by around 29%.
BREAKDOWN OF VC/PE INVESTMENT STAGESFor this analysis, the overall VC/PE investments for all RES in the EU are disaggregated into four investment stages: (i) VC Early Stage, (ii) VC Late Stage, (iii) PE Expansion Capital, and (iv) PE
is the significant increase in the number of VC deals that almost doubled between the years. This indicates that, even though the overall volumes did not change a lot, there is an increasing innova-tive activity in the RES sectors, i.e. more young technology firms seek VC to launch or scale up a RES tech-nology company in the EU.
SOLAR DOMINATES VC/PE INVESTMENTSWhen taking a more detailed look at the respective renewable energy technologies, it should be poin-ted out that biogas, biomass, and waste-to-energy are not disaggre-gated. The main reason is that the data includes several companies that are either project developer active in at least two of these sec-tors or equipment developers/pro-ducers that provide technologies for two or more sectors.
In both years, VC/PE investments in the solar PV sector dominate all other RES sectors with respect to investment volumes. From 2016 to 2017, VC/PE investments into solar firms decreased from !"1.3"bil-lion to !"1.06 billion, whereas its share in total VC/PE investments remained very stable around 65%. The number of VC/PE deals in this sector even slightly increased. The relatively high investments in the solar PV sector, however, are largely driven by very large PE Buy-outs in both years. Thus, the innovative activities in the solar PV sector relative to other RES should not be over-interpreted.
VC/PE investments in the wind sector dropped notably from !"663"million in 2016 to !"267 million in 2017. The number of deals fell by one third. This decline in invest-ments can be largely explained by
Buy-outs. Early-stage venture capital is provided to early-stage / emerging young companies, e.g., for research and development in order to develop a product or business plan and make it mar-ketable. Late-stage VC is typically used to finance initial production capacities or marketing activities. PE is typically used in later stages of a firm’s life cycle. PE Expan-sion Capital is typically used by mature / established companies to expand their activities by, e.g., scaling-up production facilities. Finally, PE Buy-outs are invest-ments to buy (a majority of) a RES company and often imply high investments compared to the other PE and particularly VC deals.
This disaggregated analysis shows that the decrease in overall VC/PE investments was mainly driven by a decline of PE investments that fell by 20%, namely from !"1.77 bil-
VENTURE CAPITAL " PRIVATE EQUITY
lion in 2016 to !"1.42"billion in 2017. As also observed in previous years, PE Buy-outs have the largest share in overall VC/PE investments. Their share totalled 82% in 2016 and marginally increased to almost 86% in 2017. A similar pat-tern can also be observed for ove-rall VC/PE investments as reported by the EVCA, where the share of PE Buy-outs increased from 67% to more than 71% between the two years. PE Expansion Capi-tal declined even more, namely from !"118"million in 2016 to only !"21"million in 2017.
VC investments only fell by 7% from !" 231 million in 2016 to !"215"million in 2017. This decline was mainly driven by a reduction of early-stage VC from !"129 million to !"55 million. In contrast, late-stage VC increased notably from !"102 million to !"160 million. The most striking change, however,
a decrease of PE Buy-outs, which were the main driver of the higher number in 2016. VC investments were relatively stable in the wind sector between 2016 and 2017.
The only other sectors that expe-rienced VC/PE investments in both years are biogas, biomass, and waste. Furthermore, these are the only sectors that expe-rienced a notable increase in VC/PE investments, which increased tenfold between both years. In 2016, VC/PE investment in bio-gas, biomass, and waste totalled almost !"36 million compared to !" 348 million in 2017. The main driver of this increase, however, is one relatively large PE-Buyout deal totalling around !"300 million. Finally, the small hydro sector saw one rather small VC/PE investment of !"1.6 million in 2017.
2016 2017
Venture Capital!/ Private Equity
(in " m)
Number of Projects
Venture Capital!/ Private Equity
(in " m)
Number of Projects
Solar 1 307.86 18 1 057.70 19
Biogas, Biomass & Waste 32.13 4 308.09 12
Wind 663.25 9 266.95 6
Small Hydro 0.00 0 1.42 1
Total EU 2 003.24 31 1 634.15 38Source: EurObserv’ER 2018
2016 2017
Venture Capital!/ Private Equity
(in " m)
Number of Projects
Venture Capital!/ Private Equity
(in " m)
Number of Projects
VC Early Stage 128.69 8 54.70 16
VC Late Stage 102.49 7 160.44 12
PE Expansion Capital 118.48 7 21.45 2
PE Buy-out 1 653.57 9 1 397.57 8
Total EU 2 003.24 31 1 634.15 38Source: EurObserv’ER 2018
Venture Capital and Private Equity Investment in Renewable Energy per Technology in the EU in 2016 and 2017Venture Capital and Private Equity Investment in Renewable Energy per Investment Stage in the EU in 2016 and 2017
12

Investment indicators
EUROBSERV !ER " THE STATE OF RENEWABLE ENERGIES IN EUROPE " #$%& EDITIONEUROBSERV !ER " THE STATE OF RENEWABLE ENERGIES IN EUROPE " #$%& EDITION
186 187
PERFORMANCE OF RES TECHNOLOGY FIRMS AND RES ASSETS
In this section, EurObserv’ER presents indices based on RES
company stocks to capture the performance of RES companies, i.e. companies that develop / pro-duce the RES technology. The RES indices are an indicator of current and expected future performance of EU RES companies listed on stock markets. As in the last edi-tion, four indices are presented, i.e. a Wind, a Solar, a composite Bio-Energy Index, and an aggregate RES Index. The first three indices consist of 10 firms that are (almost) entirely active in the respective RES sectors. The latter is an aggre-gate index based on all RES firms included in the other indices. The Bio-Energy Index includes firms that are active in the biofuels, biogas, biomass, and / or the waste sector. All these firms are included in one joint index as these firms are active on several of these sectors, which would make an allocation of firms to only one specific sector almost impossible.
When analysing these indices it is essential to bear in mind that they only capture companies that are listed on stock exchanges. Entities that are owned by parent companies or limited liability companies (e.g. Enercon) are not listed on stock markets and hence not reflected. Furthermore, there are numerous companies that are
red to last edition is the removal of KTG Energie and BDI-BioEnergy International in the year 2017. These companies were replaced by EBIOSS Energy and Fluid. As these two new firms are based in Bulgaria and Poland, respectively, the variety of Member States is notably increased in this index. It is further noteworthy that the two by far largest companies with respect to revenues, Cropenergies and Verbio Bioenergie, are (mainly) active in the biofuels sector. More Member States are represented in the PV and the Wind Indices. The by far largest company in the Solar PV
Index is SMA Solar Technology AG, while in the Wind Index, the domi-nant company is Vestas.
HETEROGENEOUS DEVELOPMENTS ACROSS RES SECTORS IN !"#$The trends of the Wind and the Bio-Energy Indices were relatively similar for the most of 2016. The steady growth continued until the end of the year in the case of the Bio-Energy Index. In contrast, the Wind Index experienced a very strong increase in the second quar-ter of 2016 that was followed by a substantial drop in the fourth quar-
ter. At the end of 2016, the Wind Index was almost at the same level as at the beginning of the year. In contrast to these two indices, listed solar PV firms experienced a rather bad year 2016. Throughout the year, the Solar Index expe-rienced a continuous decline and closes at almost the same level as it started in the beginning of 2015. In the subsequent year, however, the development of all three indices is notably more heterogeneous.
Bio-energy Index RES Index Solar index Wind Index
0
200
250
150
100
50
2/1/2014
2/7/2014
2/1/2015
2/7/2015
2/1/2016
2/7/2016
2/1/2017
2/7/2017
29/12/2017
300
Evolution of the RES indices from 2014 to 2017
1
Pix
abay
not only active in RES. Examples are Abengoa, a Spanish company that is active in RES, but also in other fields as water treatment and conventional generation and hence does not satisfy the criteria of the RES indices. As in the last edition, the EURO STOXX 50 index is used to compare the performance of RES companies to the other sectors in the EU.
COMPOSITION OF RES INDICESAs in the last editions, some firms in the indices were replaced in this edition. As the indices cover all years since the based date and not just the last two years, as in older editions, the constellation of firms might change between years (all firms included in the indices are listed in detail in the footer of this section). A notable change compa-

Investment indicators
EUROBSERV !ER " THE STATE OF RENEWABLE ENERGIES IN EUROPE " #$%& EDITIONEUROBSERV !ER " THE STATE OF RENEWABLE ENERGIES IN EUROPE " #$%& EDITION
188 189
Overall, the Solar Index shows substantially different develop-ment compared to the other two RES indices in 2017, as it remains relatively stable on one level. At the end of the year it closes at almost the identical value as at the beginning of that year. Compared to previous years, however, the performance of listed PV firms is relatively low, as the index is with marginally above 50 points subs-tantially below the 100 points mark at the beginning of 2014. The sharp decline in May 2017 is driven by Solarworld that filed for insolvency in that month, which led to a subs-tantial decline on the share prices of this company.
The year 2017 can be divided into two main phases in the case of the Wind Index. The index experienced substantial growth up into the
second quarter of that year. At its peak, the index reached almost 268 points. Afterwards, however, listed firms in the wind sector experienced a noticeable decline in their performance on stock mar-kets. The drop of the index is parti-cularly strong at the beginning of the third quarter in 2017. Although the Wind Index marginally grows at the end of the year, it closes at 179 points and thus substantially below its value at the beginning of 2017.
Bio-energy firms performed exceptionally well at the beginning of 2017. The Bio-Energy Index grows substantially from around 180 points at the start of 2017 to more than 270 points at the end of the first quarter. In the subsequent months, the index fluctuates slightly above the 250 points mark
before it experiences another growth peak at the end of the third quarter and as a first index breaks through the 300 points mark. In spite of the decrease at the end of the year, Bio-Energy firms experienced a very good year 2017. Finally, it is noteworthy that this is the first year since 2014, where the Wind sector was not the best performing sector, but rather the bio energy sector.
The aggregate RES Index and the Wind Index differ in the level, but show very similar fluctuations. The reason is that the three RES Technology Indices are weighted by aggregate revenues in the respective sectors. As aggregate revenues are relatively high in the wind sector compared to the solar PV and bio-technology sectors – covering around 80%-85% of the
aggregate revenues generated by all RES firms in the indices – the Wind Index dominates the aggregate RES Index.
The level of the EURO STOXX 50 remains rather constant in 2016. In 2017, however, a positive trend can be observed, which indicates a rather good economic develop-ment in the EU. In 2016, the deve-lopment across RES sectors is similar to all other sectors in the
0
160
140
120
100
80
60
40
20
2/1/2014
2/7/2014
2/1/2015
2/7/2015
2/1/2016
2/7/2016
2/1/2017
2/7/2017
29/12/2017
Evolution of the Euro STOXX 50 index from 2014 to 2017
2
EU, while in 2017 the Bio-Energy sector even outperforms the ove-rall good state of the economy in the EU, whereas the Solar Index, and, the Wind Index show a relati-vely weaker picture. Overall, howe-ver, one should be careful to draw conclusions for the overall situa-tion of RES technology firms in the EU. As explained above, many important RES technology firms and developers are not listed on stock exchanges.
YIELDCOSYieldCos are own cash-generating infrastructure assets offered on public markets. These assets are RES plants with typically long-term energy delivery contracts with customers. The YieldCo concept is based on risk profile splitting, where the de-risked operational projects are bundled in a sepa-rate company and equity stakes
Dr
ax G
rou
p
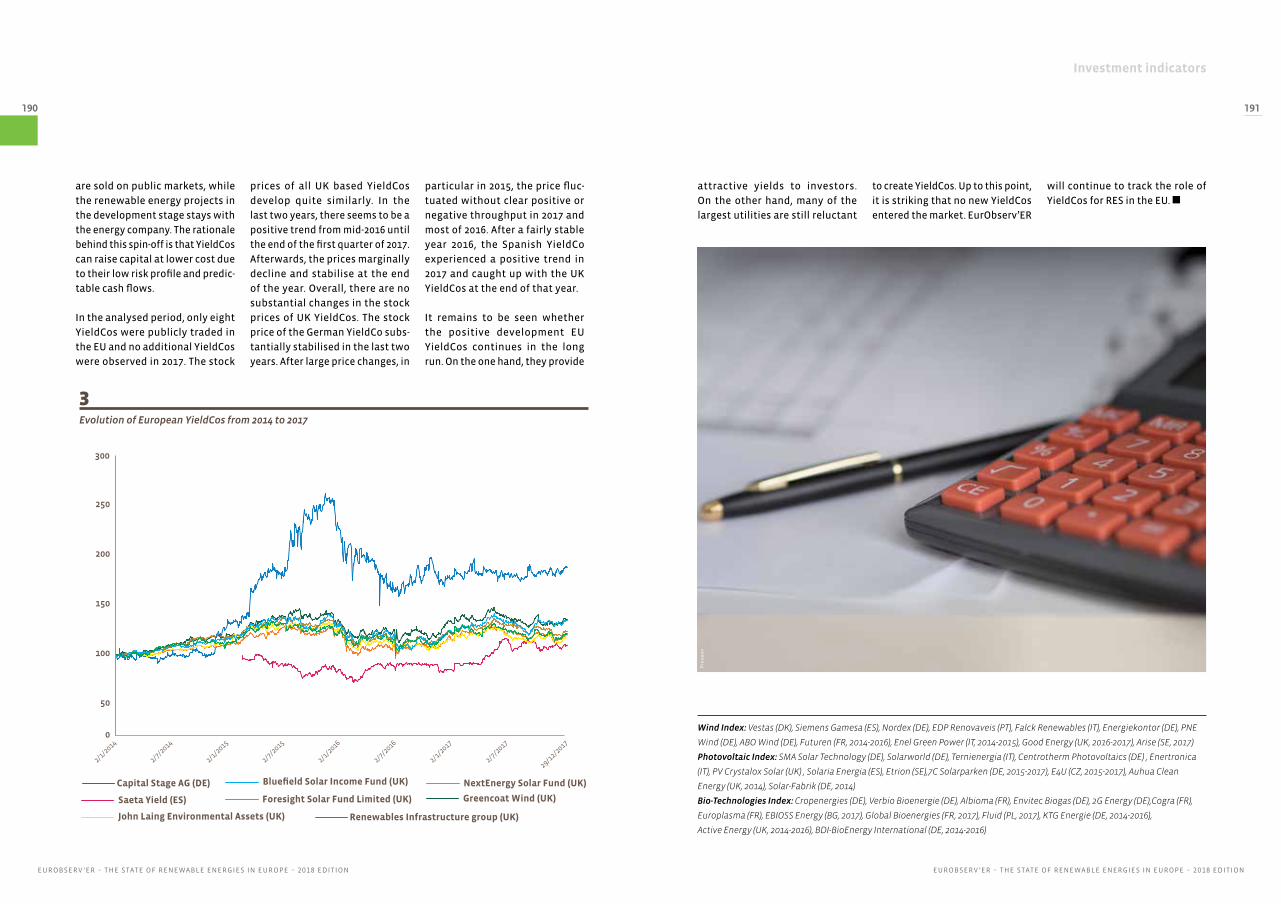
Investment indicators
EUROBSERV !ER " THE STATE OF RENEWABLE ENERGIES IN EUROPE " #$%& EDITIONEUROBSERV !ER " THE STATE OF RENEWABLE ENERGIES IN EUROPE " #$%& EDITION
190 191
are sold on public markets, while the renewable energy projects in the development stage stays with the energy company. The rationale behind this spin-off is that YieldCos can raise capital at lower cost due to their low risk profile and predic-table cash flows.
In the analysed period, only eight YieldCos were publicly traded in the EU and no additional YieldCos were observed in 2017. The stock
Wind Index: Vestas (DK), Siemens Gamesa (ES), Nordex (DE), EDP Renovaveis (PT), Falck Renewables (IT), Energiekontor (DE), PNE
Wind (DE), ABO Wind (DE), Futuren (FR, 2014-2016), Enel Green Power (IT, 2014-2015), Good Energy (UK, 2016-2017), Arise (SE, 2017)
Photovoltaic Index: SMA Solar Technology (DE), Solarworld (DE), Ternienergia (IT), Centrotherm Photovoltaics (DE) , Enertronica
(IT), PV Crystalox Solar (UK) , Solaria Energia (ES), Etrion (SE),7C Solarparken (DE, 2015-2017), E4U (CZ, 2015-2017), Auhua Clean
Energy (UK, 2014), Solar-Fabrik (DE, 2014)
Bio-Technologies Index: Cropenergies (DE), Verbio Bioenergie (DE), Albioma (FR), Envitec Biogas (DE), 2G Energy (DE),Cogra (FR),
Europlasma (FR), EBIOSS Energy (BG, 2017), Global Bioenergies (FR, 2017), Fluid (PL, 2017), KTG Energie (DE, 2014-2016),
Active Energy (UK, 2014-2016), BDI-BioEnergy International (DE, 2014-2016)
prices of all UK based YieldCos develop quite similarly. In the last two years, there seems to be a positive trend from mid-2016 until the end of the first quarter of 2017. Afterwards, the prices marginally decline and stabilise at the end of the year. Overall, there are no substantial changes in the stock prices of UK YieldCos. The stock price of the German YieldCo subs-tantially stabilised in the last two years. After large price changes, in
particular in 2015, the price fluc-tuated without clear positive or negative throughput in 2017 and most of 2016. After a fairly stable year 2016, the Spanish YieldCo experienced a positive trend in 2017 and caught up with the UK YieldCos at the end of that year.
It remains to be seen whether the positive development EU YieldCos continues in the long run. On the one hand, they provide
attractive yields to investors. On the other hand, many of the largest utilities are still reluctant
to create YieldCos. Up to this point, it is striking that no new YieldCos entered the market. EurObserv’ER
Saeta Yield (ES) Foresight Solar Fund Limited (UK)
Bluefield Solar Income Fund (UK)Capital Stage AG (DE)
Renewables Infrastructure group (UK)
NextEnergy Solar Fund (UK)
Greencoat Wind (UK)
John Laing Environmental Assets (UK)
0
50
100
150
200
250
300
2/1/2014
2/7/2014
2/1/2015
2/7/2015
2/1/2016
2/7/2016
2/1/2017
2/7/2017
29/12/2017
Evolution of European YieldCos from 2014 to 2017
3
will continue to track the role of YieldCos for RES in the EU.
Pix
abay

Investment indicators
192 193
EUROBSERV !ER " THE STATE OF RENEWABLE ENERGIES IN EUROPE " #$%& EDITION
INVESTMENT IN RENEWABLE ENERGY CAPACITYThe indicators on investment in renewable energy pro-jects capture asset finance for utility-scale renewable energy generation projects. Aggregating asset finance for all RES sectors shows that investment in energy generation capacity fell considerably between 2016 and 2017. After a record year 2016 with EU investments in RES capacity totalling !"46.3 billion, investments slumped to !"27 billion in 2017. In spite of this decline, the 2017 investment amount is still higher than invest-ments in 2014, i.e. prior to the two impressive years 2015 and 2016.
As in previous years, and thus not surprisingly, the by far highest investments, could be observed in the wind sector. In 2016, wind investments, including both onshore and offshore wind, reached an absolute record high since the introduction of the investment indicators, namely almost !"38 billion. Around 57% of these investments went into offshore capacity. In 2017, overall investments in wind capacity decreased by more than one third to almost 24 billion. In that year offshore investments were still a main driver in investments, however, with a lower share of 47%.
In contrast to the wind sector, asset finance for uti-lity-scale solar PV capacity remained relatively stable between the two years after a continuous downward trend in previous years. Investments into PV power plants totalled !"2.2 billion in 2016 and dropped by 7% to 2.05 billion in 2017. Similar to these investments in utility-scale PV, investments in small scale PV instal-lations also only dropped marginally, namely by 6% from !"4 billion in 2016 to !"3.7 billion in 2017. With respect to investments into capacity in the biomass sector, 2016 has been a very strong year. EU-invest-ments totalled more than !"5 billion. These invest-ments are notably higher than those in most of the previous years. In 2017, however, biomass investment slumped to !"679"million. In the geothermal sector, !"131"million were invested in capacity in the EU. This
is an increase by 64% compared to the 2016 invest-ments of !"80 million. Both years’ investments were substantially higher than those in previous years, where often small or no investments in geothermal were observed in the EU.
As in the last editions, investment costs for utility-scale RES capacity in the EU were compared to selec-ted trading partners of the EU, namely China, Canada, India, Japan, Norway, Russia, Turkey and the United States. The analysis of investment costs shows a hete-rogeneous picture across RES technologies in the EU. In two very large RES sectors in the EU, onshore wind and solar PV, investment costs per MW of capacity in the EU seem to be below the average of the consi-
dered non-EU countries. Investments expenditures per MW of onshore wind capacity in the European Union dropped by more than 3% from !"1.42 million per MW in 2016 to !"1.38 million in 2017. In the EU solar PV sector, the investment costs of utility-scale plants dropped even stronger, namely by more than 6% from !"1.11"million per MW in 2016 to only !"1.04 million in 2017. For biomass and offshore wind, investment expenditures per MW in the EU seem to be higher than in the analysed non-EU countries. The results for offshore wind and biomass, however, have to be interpreted with care due to rather few observations for these investments.
VENTURE CAPITAL & PRIVATE EQUITYTotal venture capital (VC) and private equity (PE) invest-ments in renewable energy companies decreased between 2016 and 2017 by around 18%. In 2017, total VC/PE investments in the EU amounted to !"1.6 bil-lion compared to !"2 billion in 2016. This decrease in overall VC/PE investments was mainly driven by a decline of PE investments that fell by 20%, namely from !"1.77 billion in 2016 to !"1.42 billion in 2017, while VC investments only fell by 7% from !"231"million to !"215 million. In both years, VC/PE investments in the solar PV sector dominated all other RES sectors with respect to investment volumes.
The development of VC/PE investments in the RES sectors runs against the overall positive trend in VC/PE investments in the EU. According to the data of the European Private Equity and Venture Capital Associa-tion (EVCA), overall EU-wide VC/PE investments (cove-ring all sectors) increased by around 29%.
PERFORMANCE OF RES TECHNOLOGY FIRMS AND ASSETS ON PUBLIC MARKETS In order to capture the performance of RES technology companies, i.e. companies that develop / produce the RES components needed for RES plants to function, EurObserv’ER constructed several indices based on
RES company stocks. The three presented RES indices, the Wind Index, the Solar PV Index, and the Bio-Energy Index, comprise the ten largest quoted RES companies in the respective sectors. The latter includes firms that are active in the biofuels, biogas, biomass, and / or the waste sector.
The trends of the Wind and the Bio-Energy Indices were relatively similar and positive for the most of 2016. In contrast to these two indices, listed solar PV firms experienced a rather bad year 2016. Also in 2017, the Solar Index shows a substantially different deve-lopment as it remains relatively stable on one level. The Wind Index grew substantially until the second quarter of 2017. Afterwards, however, listed firms in the wind sector experienced a noticeable decline in their performance on stock markets. Bio-energy firms performed exceptionally well in 2017. In spite of a decline in the end of the year, it is noteworthy that this is the first year since 2014, where the Bio-Energy Index performs best and not the Wind Index. As in the previous editions, a non-RES stock index, the EURO STOXX 50, is captured in order to assess how RES companies perform relative to the whole market. In 2016, the development across RES sectors is similar to all other sectors in the EU, while in 2017 the Bio-Energy sector even outperforms the overall good state of the economy in the EU, while the Solar Index and the Wind Index show a relatively weaker picture.
In order to track the performance of RES assets on public markets, EurObserv’ER tracked the develop-ment of YieldCos in the EU. YieldCos are own cash-generating infrastructure assets, e.g. renewable energy plants, where the ownership is offered on public markets. In the anaysed period, only eight YieldCos were publicly traded in the EU, which overall performed rather well. Up to this point, it is striking that no new YieldCos entered the market. EurOb-serv’ER will continue to track the role of YieldCos for RES in the EU.
ON THE WHOLE
ES G
rou
p

194 195
Renewable energy costs, reference prices and competitiveness
EUROBSERV !ER " THE STATE OF RENEWABLE ENERGIES IN EUROPE " #$%& EDITIONEUROBSERV !ER " THE STATE OF RENEWABLE ENERGIES IN EUROPE " #$%& EDITION
The overarching question whether renewable technologies are competitive or not depends, among others, on the reference prices paid for energy. In some demand sectors in a num-ber of EU Member States various renewables are already competitive, and in some not yet.
In this section, levelised costs of energy (LCoE) are estimated for various renewable energy technologies and their cost competiti-veness is assessed by comparing the LCoE to reference prices. Complications are: firstly, there is not a ‘single technology cost’ (many factors determine the costs, notably locatio-nal and operational aspects, but also quality and financing characteristics); secondly the energy yield from various renewables differs widely across Europe; and finally, reference prices can vary significantly.
In the previous release of ‘The State of Renewable Energy in Europe’ (Edition 2017) competition between renewable energy sources and energy from conventional sources has been illustrated for the years 2005, 2010 and 2016. This was done by com-paring levelised costs of energy (LCoE) of renewables to reference prices. This sec-tion in the 2018 Edition brings two updates: firstly, input data for the LCoE calculation have been updated to be in line with the 2017 Edition of JRC’s publication ‘Cost develop-ment of low carbon energy technologies - Sce-nario-based cost trajectories to 2050’ (2018). Secondly, instead of 2016 data currently 2017 data are presented. The approximate historic costs in this chapter (for 2005 and 2010) have not been updated compared to the previous edition.
RENEWABLE ENERGYCOSTS, REFERENCEPRICES ANDCOMPETITIVENESS
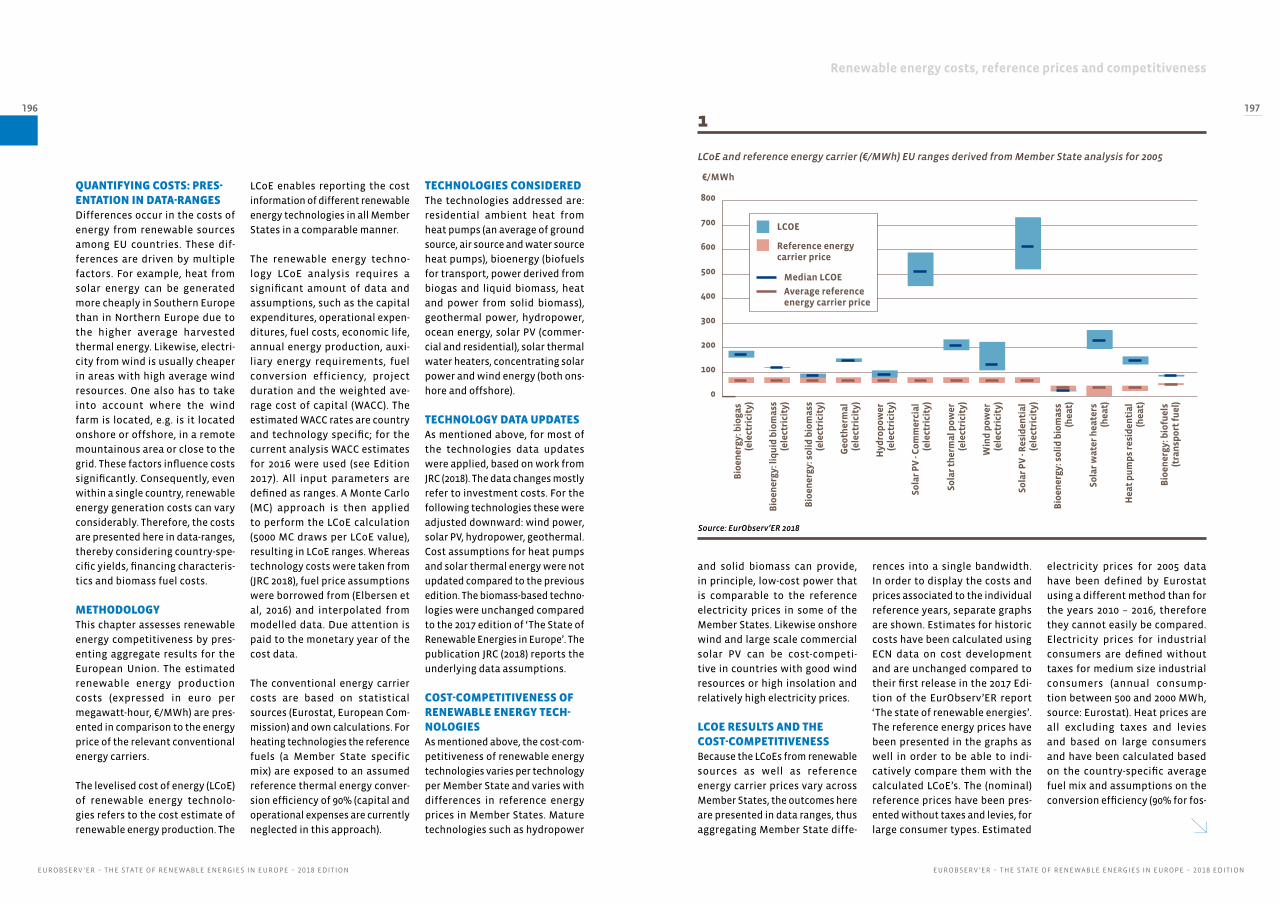
196 197
Renewable energy costs, reference prices and competitiveness
EUROBSERV !ER " THE STATE OF RENEWABLE ENERGIES IN EUROPE " #$%& EDITIONEUROBSERV !ER " THE STATE OF RENEWABLE ENERGIES IN EUROPE " #$%& EDITION
QUANTIFYING COSTS! PRES"ENTATION IN DATA"RANGESDifferences occur in the costs of energy from renewable sources among EU countries. These dif-ferences are driven by multiple factors. For example, heat from solar energy can be generated more cheaply in Southern Europe than in Northern Europe due to the higher average harvested thermal energy. Likewise, electri-city from wind is usually cheaper in areas with high average wind resources. One also has to take into account where the wind farm is located, e.g. is it located onshore or offshore, in a remote mountainous area or close to the grid. These factors influence costs significantly. Consequently, even within a single country, renewable energy generation costs can vary considerably. Therefore, the costs are presented here in data-ranges, thereby considering country-spe-cific yields, financing characteris-tics and biomass fuel costs. METHODOLOGYThis chapter assesses renewable energy competitiveness by pres-enting aggregate results for the European Union. The estimated renewable energy production costs (expressed in euro per megawatt-hour, !/MWh) are pres-ented in comparison to the energy price of the relevant conventional energy carriers.
The levelised cost of energy (LCoE) of renewable energy technolo-gies refers to the cost estimate of renewable energy production. The
LCoE enables reporting the cost information of different renewable energy technologies in all Member States in a comparable manner.
The renewable energy techno-logy LCoE analysis requires a significant amount of data and assumptions, such as the capital expenditures, operational expen-ditures, fuel costs, economic life, annual energy production, auxi-liary energy requirements, fuel conversion efficiency, project duration and the weighted ave-rage cost of capital (WACC). The estimated WACC rates are country and technology specific; for the current analysis WACC estimates for 2016 were used (see Edition 2017). All input parameters are defined as ranges. A Monte Carlo (MC) approach is then applied to perform the LCoE calculation (5000 MC draws per LCoE value), resulting in LCoE ranges. Whereas technology costs were taken from (JRC 2018), fuel price assumptions were borrowed from (Elbersen et al, 2016) and interpolated from modelled data. Due attention is paid to the monetary year of the cost data.
The conventional energy carrier costs are based on statistical sources (Eurostat, European Com-mission) and own calculations. For heating technologies the reference fuels (a Member State specific mix) are exposed to an assumed reference thermal energy conver-sion efficiency of 90% (capital and operational expenses are currently neglected in this approach).
TECHNOLOGIES CONSIDEREDThe technologies addressed are: residential ambient heat from heat pumps (an average of ground source, air source and water source heat pumps), bioenergy (biofuels for transport, power derived from biogas and liquid biomass, heat and power from solid biomass), geothermal power, hydropower, ocean energy, solar PV (commer-cial and residential), solar thermal water heaters, concentrating solar power and wind energy (both ons-hore and offshore).
TECHNOLOGY DATA UPDATESAs mentioned above, for most of the technologies data updates were applied, based on work from JRC (2018). The data changes mostly refer to investment costs. For the following technologies these were adjusted downward: wind power, solar PV, hydropower, geothermal. Cost assumptions for heat pumps and solar thermal energy were not updated compared to the previous edition. The biomass-based techno-logies were unchanged compared to the 2017 edition of ‘The State of Renewable Energies in Europe’. The publication JRC (2018) reports the underlying data assumptions. COST"COMPETITIVENESS OF RENEWABLE ENERGY TECH"NOLOGIESAs mentioned above, the cost-com-petitiveness of renewable energy technologies varies per technology per Member State and varies with differences in reference energy prices in Member States. Mature technologies such as hydropower
and solid biomass can provide, in principle, low-cost power that is comparable to the reference electricity prices in some of the Member States. Likewise onshore wind and large scale commercial solar PV can be cost-competi-tive in countries with good wind resources or high insolation and relatively high electricity prices.
LCOE RESULTS AND THE COST"COMPETITIVENESSBecause the LCoEs from renewable sources as well as reference energy carrier prices vary across Member States, the outcomes here are presented in data ranges, thus aggregating Member State diffe-
rences into a single bandwidth. In order to display the costs and prices associated to the individual reference years, separate graphs are shown. Estimates for historic costs have been calculated using ECN data on cost development and are unchanged compared to their first release in the 2017 Edi-tion of the EurObserv’ER report ‘The state of renewable energies’. The reference energy prices have been presented in the graphs as well in order to be able to indi-catively compare them with the calculated LCoE’s. The (nominal) reference prices have been pres-ented without taxes and levies, for large consumer types. Estimated
electricity prices for 2005 data have been defined by Eurostat using a different method than for the years 2010 – 2016, therefore they cannot easily be compared. Electricity prices for industrial consumers are defined without taxes for medium size industrial consumers (annual consump-tion between 500 and 2000 MWh, source: Eurostat). Heat prices are all excluding taxes and levies and based on large consumers and have been calculated based on the country-specific average fuel mix and assumptions on the conversion efficiency (90% for fos-
1
LCoE and reference energy carrier (!/MWh) EU ranges derived from Member State analysis for 2005
0
100
200
300
400
500
600
700
800
Median LCOE
Average reference energy carrier price
LCOE
Reference energy carrier price
!/MWh
Bio
ener
gy: b
ioga
s (e
lect
rici
ty)
Bio
ener
gy: l
iqu
id b
iom
ass
(ele
ctri
city
)
Bio
ener
gy: s
olid
bio
mas
s(e
lect
rici
ty)
Geo
ther
mal
(e
lect
rici
ty)
Hyd
ropo
wer
(e
lect
rici
ty)
Sola
r PV
- Co
mm
erci
al
(ele
ctri
city
)
Sola
r th
erm
al p
ower
(e
lect
rici
ty)
Win
d po
wer
(e
lect
rici
ty)
Sola
r PV
- R
esid
enti
al
(ele
ctri
city
)
Bio
ener
gy: s
olid
bio
mas
s (h
eat)
Sola
r wat
er h
eate
rs
(hea
t)
Hea
t pu
mps
resi
den
tial
(h
eat)
Bio
ener
gy: b
iofu
els
(tra
nsp
ort
fuel
)
Source: EurObserv’ER 2018

198 199
Renewable energy costs, reference prices and competitiveness
EUROBSERV !ER " THE STATE OF RENEWABLE ENERGIES IN EUROPE " #$%& EDITIONEUROBSERV !ER " THE STATE OF RENEWABLE ENERGIES IN EUROPE " #$%& EDITION
sil energy to heat, no investment or maintenance costs are consi-dered). Where data were missing, average EU-data were used.
Renewable electricityAs a result of the data update, small LCoE reductions have taken place in the 2017 data set. Cost reductions are most pro-nounced for wind energy, where the upper range, constituted by offshore wind power, has come down. Generally, the calculated average ranges for LCoE do not change much, but for individual renewable projects cost reduc-tions may be sharper than indica-ted here. The country variations
among Member States are mostly a result of differences in assumed yield (for solar energy and wind power) and financing conditions. The graphs depicted here show aggregate values for the European Union as a whole.
For electricity from deep geo-thermal energy all countries have estimated LCoE values displayed, although no realisations might have occurred in the period under consideration, and economical potential might be non-existent. Both solar PV variants are assu-med to have realised important cost reductions compared to 2005, making this technology
more and more competitive. In the residential sector, PV is in multiple countries competitive compared to residential electricity prices. Wind energy investment costs are assumed to have decreased rapidly since 2005, both for ons-hore and offshore, resulting in lower LCoE levels. For offshore wind wide ranges in realisation costs can be observed, and the JRC (2018) study reports a cost reduc-tion on both investment as well as O&M costs, and an increased operational lifetime.
Renewable heatFor the technologies producing heat, the LCoE for solid biomass
2LCoE and reference energy carrier (!/MWh) EU ranges derived from Member State analysis for 2010
Bio
ener
gy: b
ioga
s (e
lect
rici
ty)
Bio
ener
gy: l
iqu
id b
iom
ass
(ele
ctri
city
)
Bio
ener
gy: s
olid
bio
mas
s(e
lect
rici
ty)
Geo
ther
mal
(e
lect
rici
ty)
Hyd
ropo
wer
(e
lect
rici
ty)
Sola
r PV
- Co
mm
erci
al
(ele
ctri
city
)
Sola
r th
erm
al p
ower
(e
lect
rici
ty)
Win
d po
wer
(e
lect
rici
ty)
Sola
r PV
- R
esid
enti
al
(ele
ctri
city
)
Bio
ener
gy: s
olid
bio
mas
s (h
eat)
Sola
r wat
er h
eate
rs
(hea
t)
Hea
t pu
mps
resi
den
tial
(h
eat)
Bio
ener
gy: b
iofu
els
(tra
nsp
ort
fuel
)
0
100
200
300
400
500
600
700
800
!/MWh
Median LCOE
Average reference energy carrier price
LCOE
Reference energy carrier price
Source: EurObserv’ER 2018
is overlapping the reference heat range, indicating it is competitive in many countries. The LCoE range for solar water heaters and heat captured from ambient heat via heat pumps shows, according to the analysis, relatively high LCoE levels. Note that the LCoE’s for these systems refer to small-scale equipment. Scaling up to collec-tive systems, possibly in combi-nation with district heating, may decrease the costs.
Renewable transportLCoEs for biofuels for transport show quite a narrow range, above the reference transport fuel price levels.
Note to the figure: Overview of the LCoE assessment on a European Union level; ranges derive from technology cost ranges and Member State differentiation. The graph also presents, based on large consumer tariffs, the ranges of reference electricity, reference heat and reference transport fuel prices, all excluding taxes and levies. The LCoE ranges represent median values, the ranges were defined based on the interval between 25% and 75% of all values resulting from the Monte Carlo analysis. Data refer to the years 2005, 2010 and 2017 (monetary values of LCoE are defined in EUR2015) while reference energy costs are in nominal values.
3LCoE and reference energy carrier (!/MWh) EU ranges derived from Member State analysis for 2017
Bio
ener
gy: b
ioga
s (e
lect
rici
ty)
Bio
ener
gy: l
iqu
id b
iom
ass
(ele
ctri
city
)
Bio
ener
gy: s
olid
bio
mas
s(e
lect
rici
ty)
Geo
ther
mal
(e
lect
rici
ty)
Hyd
ropo
wer
(e
lect
rici
ty)
Sola
r PV
- Co
mm
erci
al
(ele
ctri
city
)
Sola
r th
erm
al p
ower
(e
lect
rici
ty)
Win
d po
wer
(e
lect
rici
ty)
Sola
r PV
- R
esid
enti
al
(ele
ctri
city
)
Bio
ener
gy: s
olid
bio
mas
s (h
eat)
Sola
r wat
er h
eate
rs
(hea
t)
Hea
t pu
mps
resi
den
tial
(h
eat)
Bio
ener
gy: b
iofu
els
(tra
nsp
ort
fuel
)
0
100
200
300
400
500
600
700
800
!/MWh
Median LCOE
Average reference energy carrier price
LCOE
Reference energy carrier price
Source: EurObserv’ER 2018
200 201
Avoided fossil fuel use and resulting avoided costs
EUROBSERV !ER " THE STATE OF RENEWABLE ENERGIES IN EUROPE " #$%& EDITIONEUROBSERV !ER " THE STATE OF RENEWABLE ENERGIES IN EUROPE " #$%& EDITION
Avoided fossil fuels represent conventional non-renewable energy carriers not consumed – both domestic and imported fuels – due to development and use of renewable energy. In this chapter, fossil fuels and non-renewable waste are collectively named fossil fuels. Avoided costs refer to the expenses that do not occur as a result of avoided fossil fuels. Thus, cumulative amounts of avoided fossil fuels multiplied by the corresponding fuel price levels observed in the various countries represent the avoided costs.
The amount of avoided fossil fuels have been analysed by the European Environ-ment Agency and presented in the report ‘Renewable energy in Europe 2018 - Recent growth and knock-on effects’, (EEA 2018). The fossil fuel types assumed to be substituted are transport fuels (diesel and gasoline), fuels used for heating (gaseous fuels, petro-leum products and non-renewable waste) and fuels used for the production of electri-city (a mix of gaseous, solid and oil products). This section makes use of the EEA data.
AVOIDED FOSSIL FUEL USE AND RESULTING AVOIDED COSTSLESS CONVENTIONAL ENERGY CARRIERS, AVOIDED BY RENEWABLE ENERGY
The avoided fossil fuel costs are based on the country specific fuel prices derived from multiple sources (Eurostat, European Commission, BP). The figure 1 highlights the fuel price ranges observed in the 28 EU Mem-ber States for 2016 and 2017 for five energy carriers: coal, diesel, gasoline, natural gas and oil. These five fuels are assumed to rea-sonably cover the fuels reported in (EEA, 2018). Note that non-renewable waste has not been priced here (usually the tariff set-ting of waste is a local issue and not so much driven by a global market).
Looking at the individual energy carriers and their ratios, it can be seen that fossil fuel prices in 2017 are slightly higher than the prices in 2016. The ranking remains unchan-ged with coal being the least expensive fuel (expressed in euro per tonne oil equivalent, and excluding taxes and levies), next natu-ral gas, followed by (heating) oil. Diesel and gasoline are the most expensive fuels.
Methodological note
• The focus of the analysis is on the national level, quantifying the avoided costs in the case where all fossil energy carriers are being purchased abroad. As a consequence, all fuel prices conside-red exclude taxes and levies.
• For countries producing their own fossil fuels the analysis is similar and no correction is made for the indigenous resources.
• The reference is a situation where no renewables at all are in place. Other studies often refer to the situa-tion in the year 2005 to compare with, but that is not being done here; we also convert the renewables status of 2005 to avoided fossil energy carriers.
• The avoided costs through the substitution of natural gas by synthetic natural gas (SNG) is not quantified explicitly.
• Only the impact on fossil fuel displacement is being addressed: in the electricity mix nuclear energy is not considered.
• Pricing non-renewable waste is not straight-forward; therefore this impact is not quantified in monetary terms.
• For liquid biofuels only the biofuels compliant with the Directive 28/EC/2009 are included.
• Data refer to values not normalised for hydro-power and wind power.
• Energy data [Mtoe] may vary from totals mentioned elsewhere in this EurObserv’ER Barometer because a different base data set was used. The 2017 esti-mates are proxies, borrowed from EEA (2018).

EUROBSERV !ER " THE STATE OF RENEWABLE ENERGIES IN EUROPE " #$%& EDITIONEUROBSERV !ER " THE STATE OF RENEWABLE ENERGIES IN EUROPE " #$%& EDITION
202 203
Avoided fossil fuel use and resulting avoided costs
In 2016 and 2017 renewable energy substituted around 315!Mtoe and
322 Mtoe of fossil fuels respecti-vely. These figures correspond to an avoided annual cost of " 84.6!bil-lion for EU28 collectively in 2016, increasing to " 93.5 billion in 2017. The largest financial contributions derive from renewable electricity and renewable heat (at approxima-tely equal contributions together representing about 90% of the avoided expenses).
AVOIDED FOSSIL FUEL USE & AVOIDED COSTS PER TECH!NOLOGYThe use of renewable electricity contributed to 62% of the total
0
200
400
600
800
1 000
0
M!/Mtep
2016 2017
Coal Diesel Gasoline Natural Gas Oil
Fossil fuel prices ranges in the European Union (excluding taxes and levies)
1
Source: Eurostat, European Commission, BP 2018
Source: EurObserv’ER 2018 based on EEA data
0
50 000
100 000
150 000
200 000
250 000
300 000
350 000
2016 2017
Avoided by renewable electricity
Avoided by renewable heating
Avoided by renewable transport fuels
Avoided fossil fuels per sector (ktoe)
2
Pix
abay

EUROBSERV !ER " THE STATE OF RENEWABLE ENERGIES IN EUROPE " #$%& EDITIONEUROBSERV !ER " THE STATE OF RENEWABLE ENERGIES IN EUROPE " #$%& EDITION
204 205
Avoided fossil fuel use and resulting avoided costs
avoided fossil fuels (in terms of energy, the share is equal for 2016 and 2017). This is followed by renewables in the heating and cooling sector contributing to 33% (both years) of the total avoided fossil fuels and the remaining share was substituted through renewable transport fuels (4.3% in 2016 and 4.5% in 2017, only fuels compliant with Directive 2009/28/EC are included). In monetary terms, the avoided costs were "!42.8 billion in 2016 and " 47.2 bil-lion in 2017 in the electricity sector. Second, renewable heat contribu-ted to avoided costs reaching to " 34.5 billion in 2016. In 2017 this increased to " 37.3 billion. Third is renewable transport fuels which contributed to avoided costs of "!7.3 billion in 2016 and " 9.0 billion in 2017. For correctly interpreting these results it is important to take into account a number of metho-dological notes, see the text box in the beginning of this chapter.
While the penetration of renewable energy (expressed in avoided fossil fuels) expanded by approximately 2.3% from 2016 to 2017, the cumula-tive effect of the avoided fossil fuel expenses is, with a 10.5% increase (from 84.6 to " 93.5 billion) more pronounced. Reason for this is the increasing fossil fuel prices in 2017 compared to 2016.
Among the RES technologies, solid biomass for heating purposes avoided the purchase of fossil fuels at an amount of " 31.8 billion in 2017 (" 29.5 billion in 2016). Next, hydropower has been responsible
Coal
Diesel
Natural Gas
Gasoline
Oil
Non-renewable waste
37%
1%2%22%
4%
35%
2016 (total 314.9 Mtoe)
37%
1%2%22%
4%
35%
Coal
Diesel
Natural Gas
Gasoline
Oil
Non-renewable waste
2017 (total 322.1 Mtoe)
EU substituted fossil fuels during 2016 and 2017
4
29.5%
17.9%
6.7%
2.2%2.6%
3.7%
5.3%
5.7%
11.1%
2016 (total ! 84.6 billion)
Biodiesels (compliant)
Hydropower excluding pumping (not normalized)
Solide Biomass(electricity)
Solid biomass (heat)
Onshore wind (not normalized)
Solar photovoltaic
Renewable energy from heat pumpsOffshore wind (not normalized)Other
31.8%
18%
7.4%
2.8%2.9%
4.1%
6%
7.1%
13.4%
2017 (total ! 93.5 billion)
Biodiesels (compliant)
Hydropower excluding pumping (not normalized)
Solide Biomass(electricity)
Solid biomass (heat)
Onshore wind (not normalized)
Solar photovoltaic
Renewable energy from heat pumpsOffshore wind (not normalized)Other
Avoided fossil fuel costs in EU 28 through renewables in 2016 and 2017
3
Source: EurObserv’ER (2018) based on EEA data
Source: EurObserv’ER (2018) based on EEA data
for " 18.0 billion in 2017 (" 17.9 bil-lion in 2016). Onshore wind is third in the row with " 13.4 billion in 2017 (" 11.1 billion in 2016).
In a graphical manner, in a gra-phical manner, graph!3 shows how each technology contributes to the total avoided costs.
The largest share of avoided fossil fuels comes from natural gas (37% for both 2016 and 2017), followed by solid fuels (mainly coal, 35% for both 2016 and 2017). Next are oil products, with a contribution of 22% in both 2016 and 2017. The remaining fuels (transport fuels and non-renewable waste) cover the remaining share (together 5% in both years).
AVOIDED FOSSIL FUELS & EXPENSES PER MEMBER STATEAt Member State level, the avoided costs have been estimated as dis-played in the table. Note that there is a strong correlation between the avoided amount and the size of a country.
As can be expected, the avoided cost follow the fuel price develop-ment: with fossil fuel prices higher in 2017 compared to 2016, almost all counties show a similar pattern.
Four Member States show a decreasing trend in avoided fossil fuels expenses due to decreased renewable energy deployment in 2017 compared to 2016. These countries are France, Hungary,

EUROBSERV !ER " THE STATE OF RENEWABLE ENERGIES IN EUROPE " #$%& EDITIONEUROBSERV !ER " THE STATE OF RENEWABLE ENERGIES IN EUROPE " #$%& EDITION
206 207
Avoided fossil fuel use and resulting avoided costs
!"#.$
!%%."
%&"'%&"(
DE SE FR IT ES UK AT FI PL
RO
DK PT
CZ
NL
BE EL HU BG
HR LV SK SI IE LT EE LU CY
MT
UE-28
)(.#
'!.$
!#." !).$
!!.$
!%.$
!".$
!".#
%*.#
%)."
"$.( %".(
").!
"'.#
"#.$
").!
""."
"".#
"&.#
$.#
*.) $.#
*.*
(.#
).'
).(
#.) ).%
#.'
)."
#.#
#.%
!.!
!.!
!.!
!."
!.%
!.&
%.&
%.)
%.%
%.%
%.!
%."
".*
%.&
".(
".*
".%
".%
&.!
&.!
&.%
&.%
&.&
&."
!".# $%
.&
'()#'()*
SE DE
FR IT ES UK
DK FI AT
PL
PT
RO BE
CZ
NL EL HU SI LV SK HR
BG IE LT EE CY
LU MT
UE-28
)'.$
)#.%
)(.$ )'
.!
)).%
)).'
!.*
!.#
*.(
*.%
&.'
&."
"." &.)
%.$ ".!
%.! ".'
'." '.!
'.)
'.(
).!
).!
).%
).&
).'
).%
(.$ ).'
(.$
).(
).(
(.$
(.!
(.!
(.#
(.!
(.*
(.*
(.*
(.*
(.#
(.*
(.&
(.#
(."
(.&
(.%
(."
(.)
(.)
(.)
(.)
(.(
(.(
Source: EurObserv’ER (2018) based on EEA data. Note: For 2017 proxy data are used.
Source: EurObserv’ER (2018) based on EEA data. Note: For 2017 proxy data are used.
Avoided fossil fuels per country (Mtoe)
Avoided expenses per country (billion euro)
5
6

EUROBSERV !ER " THE STATE OF RENEWABLE ENERGIES IN EUROPE " #$%& EDITIONEUROBSERV !ER " THE STATE OF RENEWABLE ENERGIES IN EUROPE " #$%& EDITION
208 209
Avoided fossil fuel use and resulting avoided costs
110
241
Gross inland coal consumption in 2016
Avoided (Mtoe)
Actual (Mtoe)
117
383
Gross inland gas consumption in 2016
Avoided (Mtoe)
Actual (Mtoe)
Contributions per fuel 2016 compared to total
7
Source: Eurostat (2018) based on EEA data
Italy and Portugal. All other countries had higher avoided fossil fuel expenses in 2017 com-pared to 2016, of which four even at lower amounts of avoided fossil fuels: Bulgaria, Greece, Spain and Romania. See also the methodo-logical notes.
The data have been displayed gra-phically in the figures 5 and 6.
Next, figure 7 indicates how the amounts of estimated avoided fuel relate to the total EU-28 fuel use. The relevant parameter for com-paring the avoided fuel use with is the primary energy consumption, which indicates the gross inland consumption excluding all non-energy use of energy carriers (e.g. natural gas used not for combus-tion but for producing chemicals). For the transport fuels a compari-son is not possible because these are not primary fuels (but instead secondary fuels). Reference year depicted is 2016, because this period regards final data (and not estimates).
Pix
abay

Indicators on innovation and competitiveness
210 211
EUROBSERV !ER " THE STATE OF RENEWABLE ENERGIES IN EUROPE " #$%& EDITION
Regarding RET, R&D investments spur inno-vations in RET, which are often measured by the number or share of patent applications in the respective technology field. How well the R&D output translates into a strong mar-ket position, i.e. competitiveness in RET, is measured for example by the trade share in RET products. These three indicators are depicted in the following chapters: R&D expenditures (public & private) showing the efforts or investments of countries w.r.t. RET, patent applications reflecting the out-put of R&D efforts and finally trade shares in RET displaying how competitive a country is in RET products.
The Energy Union strives to provide a secure, sustainable, affordable energy supply by increasing renewable energy uses, energy efficiency, internal energy market integration and competitiveness. Wiser energy use, the European Commis-sion states, is both a spur for new jobs and growth, and an investment in the future of Europe. Economic theory underpins this understanding. Expenditures for research and development are seen as investments into new or better processes, products or services that might create new markets or increase market shares and strengthen com-petitiveness of firms, sectors and nations.
INDICATORS ON INNOVATION AND COMPETITIVENESS

Indicators on innovation and competitiveness
212 213
EUROBSERV !ER " THE STATE OF RENEWABLE ENERGIES IN EUROPE " #$%& EDITION
R&D Investments
Methodological approach
In general, investments into R&D and innovation are commonly seen as the basis for technological changes and hence competitiveness. Therefore, they are an important factor for or driver of economic growth. From a macro-economic perspective, R&D invest-
ments can be viewed as a major indicator to measure innovative performance of economies or innovation systems. The indicator is able to display the position of a country in international competition with regard to innovation.
1. IEA. International Energy Agency RD&D Online Data
Service. Available from: http://www.iea.org/statistics/
RDDonlinedataservice/
2. A. Fiorini, A. Georgakaki, F. Pasimeni, E. Tzimas, “Moni-
toring R&D in Low-Carbon Energy Technologies”, EUR
28446 EN (2017). Available from: https://setis.ec.europa.
eu/related-jrc-activities/jrc-setis-reports/monitoring-ri-
low-carbon-energy-technologies
Overall, R&D expenditures are financed by private and public resources, while R&D is performed by both, business (private), government and higher education sector (public). This differentiation into financing (grey area) and performing (white area) is depicted in Figure 1. In this section, we will analyze public and private R&D expenditures of a selected set of countries with regard to renewable energy technologies, i.e. research investments origina-ting from the public sector (see light grey area in
For this report, the data on public and private R&D investment were provided by JRC SETIS. Its R&D data relies on IEA statistics , which collects and depicts national R&D investments. They address 20 of the EU Member States with varying regularity and gra-nularity of technology detail. However, there is a 2-year time delay in reporting for most Member States, thus data is available for 2016, while only a few are available in 2017. For the data on private R&D, the time delay is even longer (2012 and 2013) as JRC’s assessment is based on patent data. The methodology is described in more detail in the JRC Science for Policy Report “Monitoring R&D in Low Carbon Energy Technologies: Methodology for the R&I indicators in the State of the Energy Union Report, - 2016 Edition”. Data gaps are supplemented
Figure!1) as well as from the business sector are taken into account (see dark grey area in Figure 1).
R&D investments from the public sector are sup-posed to spur innovation in the private sector. Although the specific returns to public-sector R&D investments are largely unknown, the basic idea is to create follow-up investments from the private sector and generate spill-over effects.
Total R&D spending
Financing sectors Business Government
Performing sectors Business Government Higher education
Sectors by financing and performing of R&D
1
by the Member States through the SET Plan Steering Group or through targeted data mining.Besides providing absolute figures for R&D expen-ditures (Euro) of the given countries, the share of R&D expenditures on GDP (%) is calculated to get an impression of the relative size of a country’s investments in RET technologies.
PUBLIC R&D INVESTMENTSPublic R&D investments are depicted by RE technologies.
PRIVATE R&D INVESTMENTSPrivate R&D investments are depicted by RE technologies. Data are only available for the countries of the EU!28 in 2013 and 2014.

Indicators on innovation and competitiveness
EUROBSERV !ER " THE STATE OF RENEWABLE ENERGIES IN EUROPE " #$%& EDITIONEUROBSERV !ER " THE STATE OF RENEWABLE ENERGIES IN EUROPE " #$%& EDITION
214 215
In the field of solar energy, the EU! 28 is the largest player in
terms of national R&D invest-ment, although the data are not complete for 2017. The U.S, Korea (value from 2016) and Japan fol-low the EU!28. Table 1 displays a stagnation in national R&D invest-ments in the US, while the figures decrease for Japan and the EU!28. Figures for China as well as some other countries are not available.
Within the EU!28, there are four countries with significant public R&D investments, namely Ger-many, France (value for 2016), and with a gap the Netherlands (value for 2016) and the UK. In 2016, Ger-many, the Netherlands, France and the UK are responsible for 75% of the R&D in-vestments of the EU!28 (2016). In Germany, public R&D expenditures have increased between 2016 and 2017, while the value for the UK has decreased. For France and the Netherlands, data for 2017 is not yet available.
When looking at the normalization of the R&D figures by GDP (share of Public R&I expenditures by GDP), the share of the EU!28 is low, espe-cially compared to Korea (in 2016). However, as data are still incom-plete in 2017 a general trend can-not yet be seen. In 2017, the EU!28 reveals slightly lower figures than Japan, but still higher figures than the United States. Within the EU, Austria, Estonia and Finland have the largest budget share for solar energy, followed by Denmark, France, Germany and the Nether-lands.
In wind energy, Japan scores first with regard to public R&D
spending, followed by the U.S., which has increased its public spending between 2016 and 2017, and the EU!28 (although data for many countries is not available in 2017). Within the EU!28, it is once again Germany, Denmark as well as Spain (2016) and the Netherlands with the largest public R&D budget (2016). This can be explained by the fact that main players among the wind power manufacturers are located in these EU countries. In terms of GDP shares, the values are by far largest for Denmark, followed by Norway, Japan and Korea (2016).
SOLAR ENERGYWIND ENERGYPublic R&D Exp.
(in ! m)Share of Public R&D
Exp. by GDP
2016 2017 2016 2017
EU!2
8
Germany 78.5 99.2 0.0027% 0.0034%
France 62.7 n.a. 0.0029% n.a.
Netherlands 16.9 n.a. 0.0025% n.a.
United Kingdom 14.5 10.0 0.0007% 0.0005%
Spain 14.0 n.a. 0.0013% n.a.
Austria 12.4 n.a. 0.0039% n.a.
Sweden 10.0 5.4 0.0024% 0.0012%
Denmark 8.5 5.9 0.0032% 0.0022%
Finland 6.4 n.a. 0.0033% n.a.
Belgium 4.9 n.a. 0.0012% n.a.
Slovakia 1.2 0.2 0.0016% 0.0002%
Estonia 0.6 0.6 0.0034% 0.0033%
Poland 0.6 n.a. 0.0001% n.a.
Czechia 0.4 n.a. 0.0002% n.a.
Total EU 231.4 121.2 0.0017% 0.0009%
Oth
er C
ou
ntr
ies
United States 98.4 103.1 0.0006% 0.0006%
Japan 54.6 48.1 0.0012% 0.0011%
Korea 50.5 n.a. 0.0039% n.a.
Switzerland 48.1 48.1 0.0099% 0.0098%
Australia 30.8 33.8 n.a. n.a.
Norway 14.6 17.5 0.0041% 0.0048%
Canada 12.3 29.7 0.0009% 0.0020%
Turkey 1.5 2.4 0.0002% 0.0003%
New Zealand 0.0 0.1 n.a. n.a.
Note: a value of 0 indicates a share or expenditures below 0.0000% or below 500 000 Euros expenditures. Source: JRC SETIS, Eurostat, WDI Database
Public R&D Exp. (in ! m)
Share of Public R&D Exp. by GDP
2016 2017 2016 2017
EU!2
8
Germany 49.6 75.0 0.0017% 0.0026%
Denmark 22.7 20.6 0.0086% 0.0077%
Spain 19.9 n.a. 0.0018% n.a.
Netherlands 13.9 n.a. 0.0021% n.a.
United Kingdom 9.3 6.9 0.0004% 0.0003%
France 6.9 n.a. 0.0003% n.a.
Belgium 2.7 n.a. 0.0007% n.a.
Sweden 2.5 1.8 0.0006% 0.0004%
Finland 2.0 n.a. 0.0010% n.a.
Austria 1.9 n.a. 0.0006% n.a.
Poland 0.2 n.a. 0.0000% n.a.
Czechia 0.1 n.a. 0.0001% n.a.
Total EU 131.7 104.2 0.0010% 0.0007%
Oth
er C
ou
ntr
ies
Japan 190.1 154.3 0.0042% 0.0036%
United States 66.5 108.7 0.0004% 0.0006%
Korea 26.9 n.a. 0.0021% n.a.
Norway 17.2 12.6 0.0048% 0.0035%
Canada 4.1 2.9 0.0003% 0.0002%
Switzerland 2.5 2.5 0.0005% 0.0005%
Australia 0.3 0.2 n.a. n.a.
Turkey 0.1 0.3 0.0000% 0.0000%
New Zealand 0.0 0.0 n.a. n.a.
Note: a value of 0 indicates a share or expenditures below 0.0000% or below 500 000 Euros expenditures. Source: JRC SETIS, Eurostat, WDI Database
PUBLIC R&D INVESTMENTSPUBLIC R&D INVESTMENTS
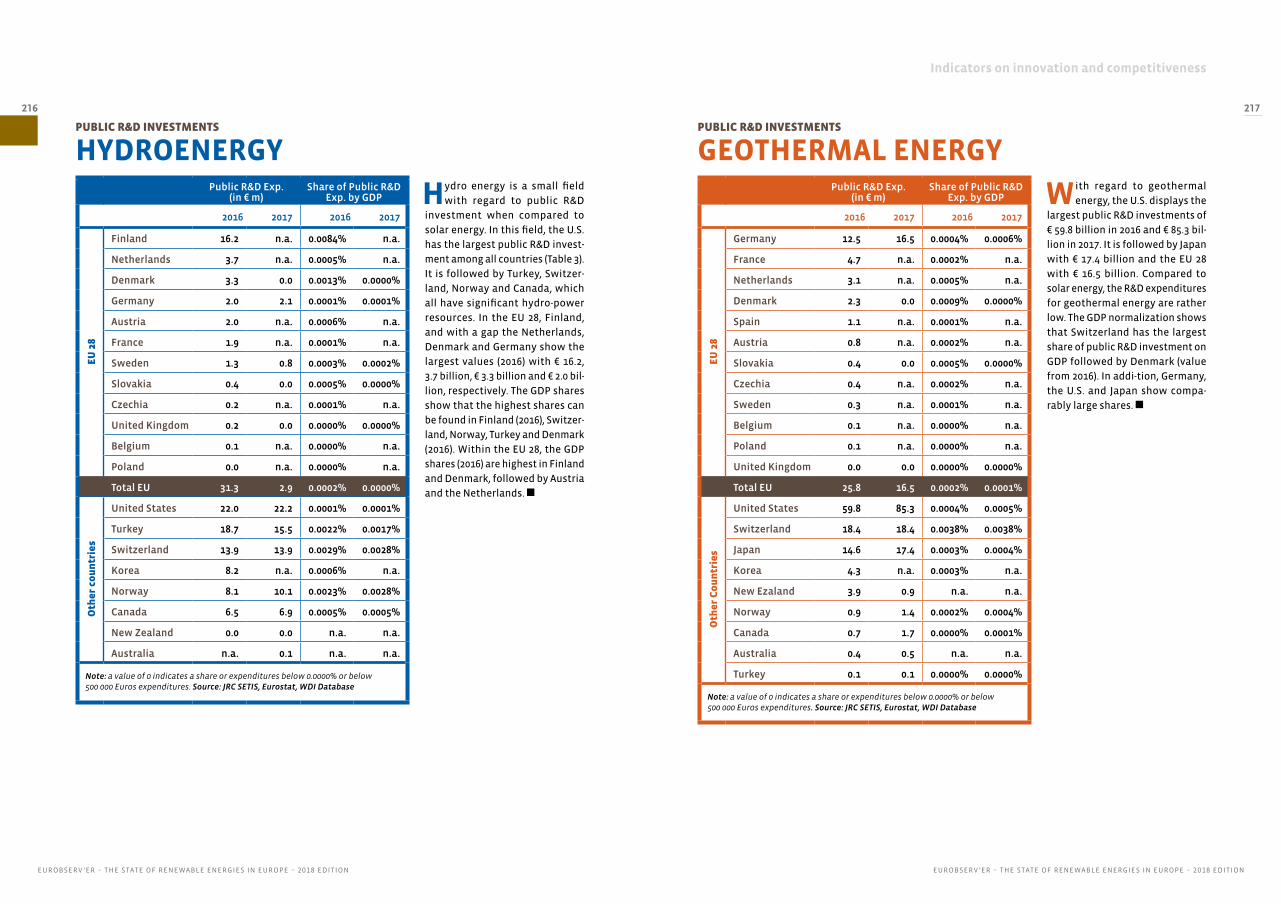
Indicators on innovation and competitiveness
EUROBSERV !ER " THE STATE OF RENEWABLE ENERGIES IN EUROPE " #$%& EDITIONEUROBSERV !ER " THE STATE OF RENEWABLE ENERGIES IN EUROPE " #$%& EDITION
216 217
With regard to geothermal energy, the U.S. displays the
largest public R&D investments of "!59.8 billion in 2016 and "!85.3 bil-lion in 2017. It is followed by Japan with "!17.4 billion and the EU!28 with "!16.5 billion. Compared to solar energy, the R&D expenditures for geothermal energy are rather low. The GDP normalization shows that Switzerland has the largest share of public R&D investment on GDP followed by Denmark (value from 2016). In addi-tion, Germany, the U.S. and Japan show compa-rably large shares.
Hydro energy is a small field with regard to public R&D
investment when compared to solar energy. In this field, the U.S. has the largest public R&D invest-ment among all countries (Table 3). It is followed by Turkey, Switzer-land, Norway and Canada, which all have significant hydro-power resources. In the EU!28, Finland, and with a gap the Netherlands, Denmark and Germany show the largest values (2016) with "!16.2, 3.7 billion, "!3.3 billion and "!2.0 bil-lion, respectively. The GDP shares show that the highest shares can be found in Finland (2016), Switzer-land, Norway, Turkey and Denmark (2016). Within the EU!28, the GDP shares (2016) are highest in Finland and Denmark, followed by Austria and the Netherlands.
GEOTHERMAL ENERGYHYDROENERGYPublic R&D Exp.
(in ! m)Share of Public R&D
Exp. by GDP
2016 2017 2016 2017
EU!2
8
Germany 12.5 16.5 0.0004% 0.0006%
France 4.7 n.a. 0.0002% n.a.
Netherlands 3.1 n.a. 0.0005% n.a.
Denmark 2.3 0.0 0.0009% 0.0000%
Spain 1.1 n.a. 0.0001% n.a.
Austria 0.8 n.a. 0.0002% n.a.
Slovakia 0.4 0.0 0.0005% 0.0000%
Czechia 0.4 n.a. 0.0002% n.a.
Sweden 0.3 n.a. 0.0001% n.a.
Belgium 0.1 n.a. 0.0000% n.a.
Poland 0.1 n.a. 0.0000% n.a.
United Kingdom 0.0 0.0 0.0000% 0.0000%
Total EU 25.8 16.5 0.0002% 0.0001%
Oth
er C
ou
ntr
ies
United States 59.8 85.3 0.0004% 0.0005%
Switzerland 18.4 18.4 0.0038% 0.0038%
Japan 14.6 17.4 0.0003% 0.0004%
Korea 4.3 n.a. 0.0003% n.a.
New Ezaland 3.9 0.9 n.a. n.a.
Norway 0.9 1.4 0.0002% 0.0004%
Canada 0.7 1.7 0.0000% 0.0001%
Australia 0.4 0.5 n.a. n.a.
Turkey 0.1 0.1 0.0000% 0.0000%
Note: a value of 0 indicates a share or expenditures below 0.0000% or below 500 000 Euros expenditures. Source: JRC SETIS, Eurostat, WDI Database
Public R&D Exp. (in ! m)
Share of Public R&D Exp. by GDP
2016 2017 2016 2017
EU!2
8
Finland 16.2 n.a. 0.0084% n.a.
Netherlands 3.7 n.a. 0.0005% n.a.
Denmark 3.3 0.0 0.0013% 0.0000%
Germany 2.0 2.1 0.0001% 0.0001%
Austria 2.0 n.a. 0.0006% n.a.
France 1.9 n.a. 0.0001% n.a.
Sweden 1.3 0.8 0.0003% 0.0002%
Slovakia 0.4 0.0 0.0005% 0.0000%
Czechia 0.2 n.a. 0.0001% n.a.
United Kingdom 0.2 0.0 0.0000% 0.0000%
Belgium 0.1 n.a. 0.0000% n.a.
Poland 0.0 n.a. 0.0000% n.a.
Total EU 31.3 2.9 0.0002% 0.0000%
Oth
er c
ou
ntr
ies
United States 22.0 22.2 0.0001% 0.0001%
Turkey 18.7 15.5 0.0022% 0.0017%
Switzerland 13.9 13.9 0.0029% 0.0028%
Korea 8.2 n.a. 0.0006% n.a.
Norway 8.1 10.1 0.0023% 0.0028%
Canada 6.5 6.9 0.0005% 0.0005%
New Zealand 0.0 0.0 n.a. n.a.
Australia n.a. 0.1 n.a. n.a.
Note: a value of 0 indicates a share or expenditures below 0.0000% or below 500 000 Euros expenditures. Source: JRC SETIS, Eurostat, WDI Database
PUBLIC R&D INVESTMENTSPUBLIC R&D INVESTMENTS

Indicators on innovation and competitiveness
EUROBSERV !ER " THE STATE OF RENEWABLE ENERGIES IN EUROPE " #$%& EDITIONEUROBSERV !ER " THE STATE OF RENEWABLE ENERGIES IN EUROPE " #$%& EDITION
218 219
In terms of public R&D invest-ment, biofuels is the largest field
within renewables. This is mostly due to strong commitment of the U.S., with the largest investment of more than "!600 billion in 2017. Other countries in this analysis depict much lower public R&D investments, all below "! 50!bil-lion, except for the EU! 28 as a whole. The U.S. is followed by the EU!28, Canada and Japan. Within the EU! 28, the largest national R&D investments can be obser-ved in France (2016), Germany, the UK and Sweden. With regard to the GDP shares, Finland (2016) shows the largest value, followed by Sweden, Canada, Switzerland and the Netherlands. Also Slova-kia showed large shares in 2016. Albeit large absolute investments in biofuels, the U.S. display only mediocre shares, yet with an increasing tendency between 2016 and 2017.!
BIOFUELSPublic R&D Exp.
(in ! m)Share of Public R&D
Exp. by GDP
2016 2017 2016 2017
EU!2
8
France 73.3 n.a. 0.0035% n.a.
Germany 37.2 32.7 0.0013% 0.0011%
United Kingdom 33.6 0.1 0.0016% 0.0014%
Netherlands 25.6 n.a. 0.0038% n.a.
Sweden 24.6 13.8 0.0058% 0.0032%
Finland 13.1 n.a. 0.0068% n.a.
Austria 11.1 n.a. 0.0035% n.a.
Denmark 9.6 4.9 0.0037% 0.0018%
Slovakia 7.2 0.1 0.0092% 0.0001%
Belgium 6.7 n.a. 0.0017% n.a.
Spain 4.4 n.a. 0.0004% n.a.
Poland 2.8 n.a. 0.0006% n.a.
Czechia 2.0 n.a. 0.0012% n.a.
Estonia 0.4 n.a. 0.0020% n.a.
Total EU 251.6 80.4 0.0018% 0.0006%
Oth
er C
ou
ntr
ies
United States 477.1 605.1 0.0028% 0.0035%
Canada 54.2 41.5 0.0039% 0.0028%
Japan 33.0 39.3 0.0007% 0.0009%
Switzerland 18.7 18.7 0.0039% 0.0038%
Korea 17.1 n.a. 0.0013% n.a.
Norway 13.2 17.2 0.0037% 0.0047%
Australia 4.5 3.9 n.a. n.a.
Turkey 0.6 1.2 0.0001% 0.0001%
New Zealand 0.0 0.6 n.a. n.a.
Note: a value of 0 indicates a share or expenditures below 0.0000% or below 500 000 Euros expenditures. Source: JRC SETIS, Eurostat, WDI Database
PUBLIC R&D INVESTMENTS
Ocean energy is a comparably small field when interpreted
alongside public R&D investment. Here, the U.S. shows the largest values followed by the EU! 28, although many data points are missing. In 2017, the EU!28 expen-ditures have decreased, while the U.S. expenditures have increased. The gap between the EU!28 and the U.S. thus has enlarged between 2016 and 2017. Besides the U.S., it rather seems that the investments of the EU in total and of other countries have decreased between 2016 and 2017 except for Norway and Canada. The GDP shares show the largest values for Norway, the UK and Sweden.
OCEAN ENERGYPublic R&D Exp.
(in ! m)Share of Public R&D
Exp. by GDP
2016 2017 2016 2017
EU!2
8
United Kingdom 16.4 17.7 0.0008% 0.0008%
Sweden 4.4 2.4 0.0010% 0.0006%
France 4.4 n.a. 0.0002% n.a.
Spain 0.7 n.a. 0.0001% n.a.
Belgium 0.3 n.a. 0.0001% n.a.
Netherlands 0.0 n.a. 0.0000% n.a.
Denmark 0.0 0.7 0.0000% 0.0002%
Czechia 0.0 n.a. 0.0000% n.a.
Poland 0.0 n.a. 0.0000% n.a.
Total EU 26.1 20.7 0.0002% 0.0001%
Oth
er c
ou
ntr
ies
United States 40.2 49.5 0.0002% 0.0003%
Japan 7.9 4.7 0.0002% 0.0001%
Korea 5.6 n.a. 0.0004% n.a.
Norway 2.4 3.4 0.0007% 0.0009%
Canada 1.4 2.2 0.0001% 0.0001%
Australia 1.0 1.8 n.a. n.a.
New Zealand 0.3 0.0 n.a. n.a.
Turkey 0.0 0.0 0.0000% 0.0000%
Note: a value of 0 indicates a share or expenditures below 0.0000% or below 500 000 Euros expenditures. Source: JRC SETIS, Eurostat, WDI Database
PUBLIC R&D INVESTMENTS
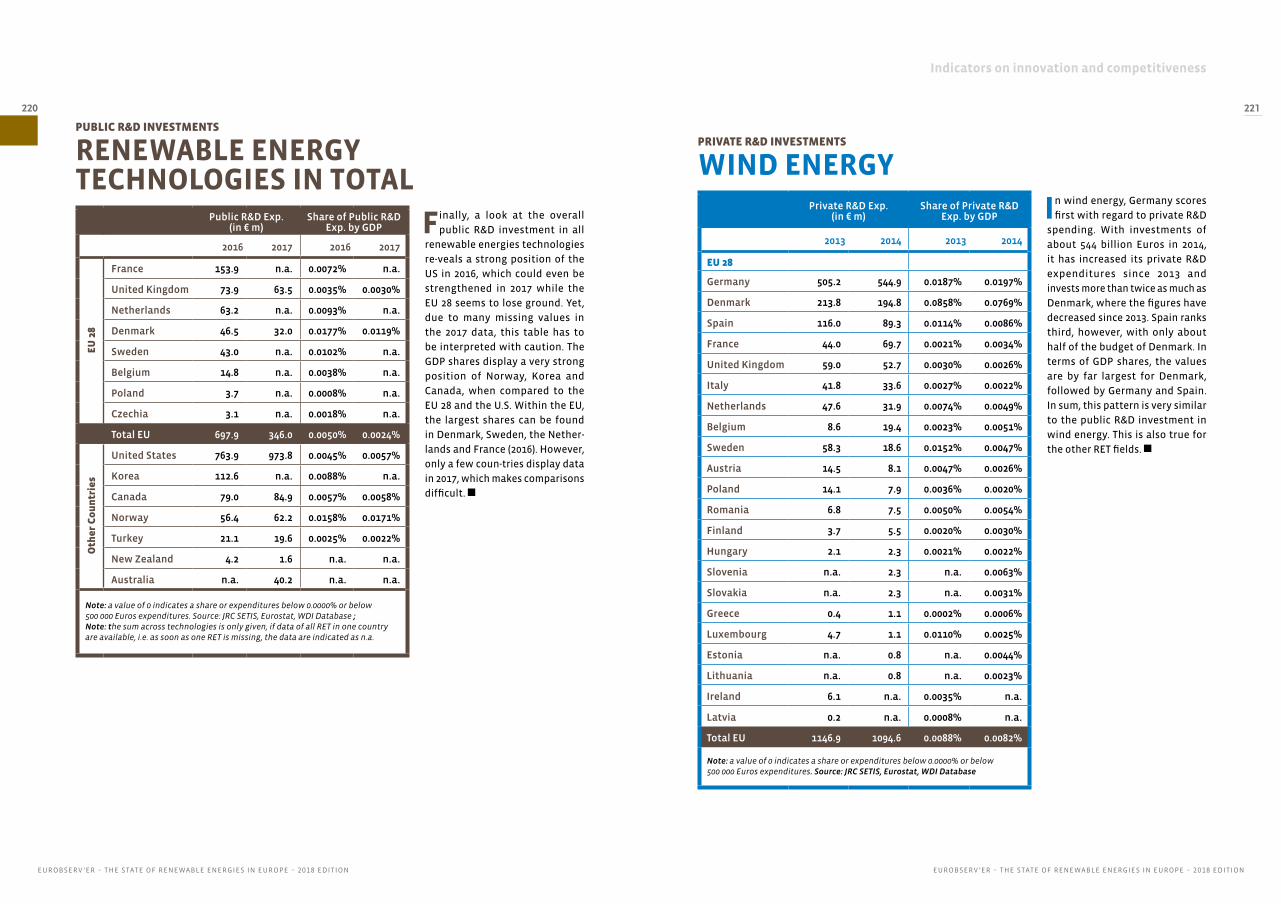
Indicators on innovation and competitiveness
EUROBSERV !ER " THE STATE OF RENEWABLE ENERGIES IN EUROPE " #$%& EDITIONEUROBSERV !ER " THE STATE OF RENEWABLE ENERGIES IN EUROPE " #$%& EDITION
220 221
Finally, a look at the overall public R&D investment in all
renewable energies technologies re-veals a strong position of the US in 2016, which could even be strengthened in 2017 while the EU!28 seems to lose ground. Yet, due to many missing values in the 2017 data, this table has to be interpreted with caution. The GDP shares display a very strong position of Norway, Korea and Canada, when compared to the EU!28 and the U.S. Within the EU, the largest shares can be found in Denmark, Sweden, the Nether-lands and France (2016). However, only a few coun-tries display data in 2017, which makes comparisons difficult.
RENEWABLE ENERGYTECHNOLOGIES IN TOTAL
Public R&D Exp. (in ! m)
Share of Public R&D Exp. by GDP
2016 2017 2016 2017
EU!2
8
France 153.9 n.a. 0.0072% n.a.
United Kingdom 73.9 63.5 0.0035% 0.0030%
Netherlands 63.2 n.a. 0.0093% n.a.
Denmark 46.5 32.0 0.0177% 0.0119%
Sweden 43.0 n.a. 0.0102% n.a.
Belgium 14.8 n.a. 0.0038% n.a.
Poland 3.7 n.a. 0.0008% n.a.
Czechia 3.1 n.a. 0.0018% n.a.
Total EU 697.9 346.0 0.0050% 0.0024%
Oth
er C
ou
ntr
ies
United States 763.9 973.8 0.0045% 0.0057%
Korea 112.6 n.a. 0.0088% n.a.
Canada 79.0 84.9 0.0057% 0.0058%
Norway 56.4 62.2 0.0158% 0.0171%
Turkey 21.1 19.6 0.0025% 0.0022%
New Zealand 4.2 1.6 n.a. n.a.
Australia n.a. 40.2 n.a. n.a.
Note: a value of 0 indicates a share or expenditures below 0.0000% or below 500 000 Euros expenditures. Source: JRC SETIS, Eurostat, WDI Database ; Note: the sum across technologies is only given, if data of all RET in one country are available, i.e. as soon as one RET is missing, the data are indicated as n.a.
PUBLIC R&D INVESTMENTS
In wind energy, Germany scores first with regard to private R&D
spending. With investments of about 544 billion Euros in 2014, it has increased its private R&D expenditures since 2013 and invests more than twice as much as Denmark, where the figures have decreased since 2013. Spain ranks third, however, with only about half of the budget of Denmark. In terms of GDP shares, the values are by far largest for Denmark, followed by Germany and Spain. In sum, this pattern is very similar to the public R&D investment in wind energy. This is also true for the other RET fields.
WIND ENERGYPRIVATE R&D INVESTMENTS
Private R&D Exp. (in ! m)
Share of Private R&D Exp. by GDP
2013 2014 2013 2014
EU!28 ! ! ! !
Germany 505.2 544.9 0.0187% 0.0197%
Denmark 213.8 194.8 0.0858% 0.0769%
Spain 116.0 89.3 0.0114% 0.0086%
France 44.0 69.7 0.0021% 0.0034%
United Kingdom 59.0 52.7 0.0030% 0.0026%
Italy 41.8 33.6 0.0027% 0.0022%
Netherlands 47.6 31.9 0.0074% 0.0049%
Belgium 8.6 19.4 0.0023% 0.0051%
Sweden 58.3 18.6 0.0152% 0.0047%
Austria 14.5 8.1 0.0047% 0.0026%
Poland 14.1 7.9 0.0036% 0.0020%
Romania 6.8 7.5 0.0050% 0.0054%
Finland 3.7 5.5 0.0020% 0.0030%
Hungary 2.1 2.3 0.0021% 0.0022%
Slovenia n.a. 2.3 n.a. 0.0063%
Slovakia n.a. 2.3 n.a. 0.0031%
Greece 0.4 1.1 0.0002% 0.0006%
Luxembourg 4.7 1.1 0.0110% 0.0025%
Estonia n.a. 0.8 n.a. 0.0044%
Lithuania n.a. 0.8 n.a. 0.0023%
Ireland 6.1 n.a. 0.0035% n.a.
Latvia 0.2 n.a. 0.0008% n.a.
Total EU 1146.9 1094.6 0.0088% 0.0082%
Note: a value of 0 indicates a share or expenditures below 0.0000% or below 500 000 Euros expenditures. Source: JRC SETIS, Eurostat, WDI Database

Indicators on innovation and competitiveness
EUROBSERV !ER " THE STATE OF RENEWABLE ENERGIES IN EUROPE " #$%& EDITIONEUROBSERV !ER " THE STATE OF RENEWABLE ENERGIES IN EUROPE " #$%& EDITION
222 223
In the field of solar energy within the EU!28, Germany is the largest
player in terms of national R&D investment. Although the figures have decreased between 2013 and 2014, they still are at a very high level compared to the other EU!28 countries. Germany is followed by France, where the private R&D expenditures for solar energy tech-nologies also have decreased since 2013. The UK and the Netherlands score at ranks three and four wit-hin this comparison, followed by Austria and Italy.
When looking at the normalization of the R&D figures by GDP, Germany has the largest share though it has decreased in 2014 due to decreases in absolute figures (in terms of pri-vate R&D but also in terms of GDP). Germany is followed by Austria, where the share has increased due to the growth in absolute figures. The Netherlands score third, fol-lowed by Lithuania and Cyprus. In all these countries, the shares of public R&D in GDP are above 0.01% for solar energy technologies. Com-pared to public R&D spending in 2016/17, private R&D investments in solar energy are significantly higher in 2013/14.
Compared to solar energy, hydro energy is also a rather
small field with regard to private R&D investment. But private R&D investments in 2013/14 are larger than public investments in 2016/17 (at least for the EU!28 countries). France has the largest private R&D investment among the countries in our comparison. It is followed by Germany, which also has signifi-cant private R&D investments in hydro power. These two countries are followed by the UK and Austria where private R&D expenditures exceeds 5 billion, although there has been a decrease between 2013 and 2014 in Austria. Italy also showed large expenditures in 2013, but they have massively decreased in 2014. For the year 2013, we can also see that Slovakia, Poland and the Netherlands displays signifi-cant private R&D spending. The GDP shares, however, show a dif-ferent ranking: The highest shares can be found in Slovakia (2013) and Slovenia and Croatia (2013). Fur-thermore, Austria shows compa-rably high (but decreasing) shares. The countries that have shown large absolute values, i.e. France, Germany and the UK, score in the midfield.
SOLAR ENERGY HYDROPOWERPRIVATE R&D INVESTMENTS PRIVATE R&D INVESTMENTS
Private R&D Exp. (in ! m)
Share of Private R&D Exp. by GDP
2013 2014 2013 2014
EU!28 ! ! ! !
Germany 1031.4 808.0 0.0382% 0.0293%
France 232.1 205.5 0.0113% 0.0099%
United Kingdom 129.7 117.1 0.0067% 0.0058%
Netherlands 76.2 80.3 0.0119% 0.0123%
Austria 31.5 76.2 0.0103% 0.0246%
Italy 160.1 74.8 0.0104% 0.0048%
Spain 101.2 67.9 0.0099% 0.0066%
Sweden 22.7 34.0 0.0059% 0.0087%
Ireland 5.9 18.3 0.0033% 0.0095%
Finland 33.7 14.9 0.0180% 0.0080%
Belgium 40.5 14.8 0.0108% 0.0039%
Poland 31.0 13.1 0.0079% 0.0032%
Romania 1.3 7.0 0.0010% 0.0050%
Luxembourg 1.6 4.4 0.0038% 0.0097%
Czechia 5.4 3.5 0.0034% 0.0022%
Lithuania n.a. 3.5 n.a. 0.0106%
Portugal 6.4 3.5 0.0038% 0.0021%
Denmark 17.6 2.2 0.0070% 0.0009%
Cyprus n.a. 1.8 n.a. 0.0100%
Greece 4.8 n.a. 0.0026% n.a.
Croatia 0.6 n.a. 0.0015% n.a.
Hungary 3.2 n.a. 0.0032% n.a.
Latvia 0.6 n.a. 0.0032% n.a.
Total EU 1937.7 1550.7 0.0148% 0.0117%
Source: JRC SETIS, Eurostat, WDI Database
Private R&D Exp. (in ! m)
Share of Private R&D Exp. by GDP
2013 2014 2013 2014
EU!28 ! ! ! !
France 37.2 32.4 0.0018% 0.0016%
Germany 31.3 25.3 0.0012% 0.0009%
United Kingdom 7.9 9.7 0.0004% 0.0005%
Austria 8.8 5.0 0.0029% 0.0016%
Spain 3.8 3.4 0.0004% 0.0003%
Poland 5.1 2.3 0.0013% 0.0006%
Slovenia n.a. 2.3 n.a. 0.0063%
Finland 3.0 1.8 0.0016% 0.0010%
Czechia 0.7 1.7 0.0005% 0.0011%
Netherlands 5.3 1.1 0.0008% 0.0002%
Italy 26.1 0.8 0.0017% 0.0000%
Belgium 2.5 n.a. 0.0007% n.a.
Denmark 1.3 n.a. 0.0005% n.a.
Greece 0.8 n.a. 0.0005% n.a.
Croatia 2.5 n.a. 0.0058% n.a.
Ireland 1.3 n.a. 0.0008% n.a.
Romania 3.4 n.a. 0.0025% n.a.
Slovakia 5.1 n.a. 0.0071% n.a.
Total EU 146.1 85.8 0.0011% 0.0006%
Source: JRC SETIS, Eurostat, WDI Database

Indicators on innovation and competitiveness
EUROBSERV !ER " THE STATE OF RENEWABLE ENERGIES IN EUROPE " #$%& EDITIONEUROBSERV !ER " THE STATE OF RENEWABLE ENERGIES IN EUROPE " #$%& EDITION
224 225
In geothermal energy, the pri-vate (as well as the public) R&D
expenditures are much lower than within solar energy. Once again, Germany can be found to have the largest private R&D investments of "!33.2!billion in 2014, but the expen-ditures have decreased since 2013. It is followed by Sweden, France, Italy and the UK (2013) all with less than "!20 billion of private R&D expenditures, though especially Sweden, France and the UK have increased their ex-penditures, while in Poland a decrease can be observed between 2013 and 2014. The GDP normalization shows that Sweden has the largest share of private R&D investment on GDP (across all countries in our com-parison), which has even grown quite significantly between 2013 and 2014. It is followed by Austria, the Netherlands and Germany all with similar shares. However, it has to be kept in mind that many data points are missing in the table, which might blur the ranking.
In biofuels, which is the third largest field in terms of private
R&D investments after solar ener-gy and wind technologies, Ger-many clearly shows the largest investment with nearly "!159!bil-lion in 2014. Denmark shows the second largest private R&D invest-ment in this field, although it has decreased in 2013 while an increase could be observed in Germany. All other countries in this compari-son have values below "!100 bil-lion of private R&D investment. France scores third with "!87!bil-lion, followed by the UK and the Netherlands with " 40 billion and "!36 billion, respectively. In sum, however, it can be found that the private R&D expenditures within biofuels have decreased between 2013 and 2014, which is reflected in decreasing figures for the EU!28 as a whole. With regard to the GDP shares, Denmark is leading in 2014, followed by Luxembourg, Finland, Slovenia and Slovakia.
GEOTHERMAL ENERGY BIOFUELSPRIVATE R&D INVESTMENTS PRIVATE R&D INVESTMENTS
Private R&D Exp. (in ! m)
Share of Private R&D Exp. by GDP
2013 2014 2013 2014
EU!28 ! ! ! !
Germany 40.5 33.2 0.0015% 0.0012%
Sweden 9.6 19.3 0.0025% 0.0049%
France 3.2 15.5 0.0002% 0.0007%
Italy 0.8 11.9 0.0001% 0.0008%
Netherlands 5.0 8.9 0.0008% 0.0014%
Austria n.a. 6.0 n.a. 0.0019%
Denmark n.a. 2.3 n.a. 0.0009%
Poland 7.7 1.5 0.0020% 0.0004%
Finland n.a. 0.5 n.a. 0.0003%
Spain 4.8 n.a. 0.0005% n.a.
United Kingdom 10.8 n.a. 0.0006% n.a.
Total EU 82.4 99.2 0.0006% 0.0007%
Source: JRC SETIS, Eurostat, WDI Database
Private R&D Exp. (in ! m)
Share of Private R&D Exp. by GDP
2013 2014 2013 2014
EU!28 ! ! ! !
Germany 127.0 159.1 0.0047% 0.0058%
Denmark 118.3 101.0 0.0474% 0.0399%
France 52.5 86.9 0.0026% 0.0042%
United Kingdom 34.7 40.1 0.0018% 0.0020%
Netherlands 54.4 36.2 0.0085% 0.0056%
Finland 26.2 35.0 0.0140% 0.0188%
Italy 33.5 29.7 0.0022% 0.0019%
Poland 34.6 12.3 0.0088% 0.0030%
Sweden 25.3 11.3 0.0066% 0.0029%
Czechia 10.0 9.7 0.0064% 0.0060%
Hungary 10.6 8.9 0.0105% 0.0085%
Slovakia 1.8 8.9 0.0025% 0.0121%
Luxembourg 4.4 8.8 0.0103% 0.0196%
Spain 36.0 8.7 0.0035% 0.0008%
Slovenia n.a. 4.5 n.a. 0.0123%
Belgium 10.4 3.3 0.0028% 0.0009%
Austria 14.1 1.1 0.0046% 0.0004%
Estonia 2.6 n.a. 0.0157% n.a.
Ireland 2.8 n.a. 0.0016% n.a.
Portugal 1.4 n.a. 0.0008% n.a.
Romania 8.8 n.a. 0.0066% n.a.
Total EU 609.5 565.6 0.0047% 0.0043%
Source: JRC SETIS, Eurostat, WDI Database

Indicators on innovation and competitiveness
EUROBSERV !ER " THE STATE OF RENEWABLE ENERGIES IN EUROPE " #$%& EDITIONEUROBSERV !ER " THE STATE OF RENEWABLE ENERGIES IN EUROPE " #$%& EDITION
226 227
Ocean energy is also one of the comparably smaller field in
terms of private R&D investment. Here, also Germany shows the largest values in 2014, closely fol-lowed by the UK and France. Fin-land and Sweden score at ranks four and five, respectively. Howe-ver, also in this field many data points are missing. In 2014, the investments for ocean energy have increased for the EU!28 as a whole, although the UK shows declining figures. The growth can mostly be attributed to increasing invest-ments in Germany as well as Fin-land and France. The largest GDP shares in comparison can be found for Finland and Ireland, followed by Slovenia, Sweden, Luxembourg and the UK.
A final look at the private R&D investment in all renewable
energies technologies shows a strong position of Germany in 2013 and 2014. Although the German pri-vate R&D investments in RET tech-nologies have decreased in 2014 it still is in the top position. Large private R&D in-vestments in RET can also be found in France, which scores second on this indicator. As for the other countries, for which data is available, the UK (2013) and Spain (2013) have similar invest-ments levels, which also counts for the Netherlands and Italy. The GDP shares also display a quite strong position of Germany, although the decreasing trends in absolute investments are also reflected in the share. Yet, as for the public R&D investments, this table has to be inter-preted with caution due to many missing values in the data.
OCEAN ENERGY RENEWABLE ENERGYTECHNOLOGIES IN TOTAL
PRIVATE R&D INVESTMENTS PRIVATE R&D INVESTMENTS
Private R&D Exp. (in ! m)
Share of Private R&D Exp. by GDP
2013 2014 2013 2014
EU!28 ! ! ! !
Germany 35.4 46.3 0.0013% 0.0017%
United Kingdom 45.4 43.4 0.0023% 0.0022%
France 29.2 31.4 0.0014% 0.0015%
Finland 15.4 20.6 0.0082% 0.0110%
Sweden 20.8 19.6 0.0054% 0.0050%
Ireland 5.3 14.5 0.0030% 0.0075%
Spain 12.1 11.5 0.0012% 0.0011%
Italy 9.9 9.5 0.0006% 0.0006%
Denmark 2.7 3.3 0.0011% 0.0013%
Netherlands 15.9 3.2 0.0025% 0.0005%
Portugal n.a. 2.4 n.a. 0.0014%
Slovenia n.a. 2.4 n.a. 0.0067%
Austria n.a. 1.3 n.a. 0.0004%
Luxembourg n.a. 1.2 n.a. 0.0027%
Romania n.a. 0.5 n.a. 0.0003%
Belgium 2.8 n.a. 0.0007% n.a.
Greece 1.5 n.a. 0.0008% n.a.
Total EU 196.6 211.0 0.0015% 0.0016%
Note: a value of 0 indicates a share or expenditures below 0.0000% or below 500 000 Euros expenditures. Source: JRC SETIS, Eurostat, WDI Database
Private R&D Exp. (in ! m)
Share of Private R&D Exp. by GDP
2013 2014 2013 2014
EU!28 ! ! ! !
Germany 1770.8 1616.8 0.0656% 0.0586%
France 398.2 441.4 0.0194% 0.0213%
Netherlands 204.4 161.7 0.0319% 0.0248%
Italy 272.2 160.3 0.0177% 0.0104%
Austria n.a. 97.5 n.a. 0.0315%
Finland n.a. 78.3 n.a. 0.0420%
Spain 274.0 n.a. 0.0268% n.a.
United Kingdom 287.5 n.a. 0.0148% n.a.
Total EU 4119.1 3606.7 0.0316% 0.0271%
Note: a value of 0 indicates a share or expenditures below 0.0000% or below 500 000 Euros expenditures ; Note 2 : the sum across technologies is only given, if data of all RET in one country are available, i.e. as soon as one RET is missing, the data are indicated as n.a. Source: JRC SETIS, Eurostat, WDI Database

Indicators on innovation and competitiveness
EUROBSERV !ER " THE STATE OF RENEWABLE ENERGIES IN EUROPE " #$%& EDITIONEUROBSERV !ER " THE STATE OF RENEWABLE ENERGIES IN EUROPE " #$%& EDITION
228 229
PUBLIC AND PRIVATE R&DCONCLUSIONS
Due to missing data, especially for China but also for other
non-European countries with regard to private R&D expendi-tures, it is difficult to draw conclu-sions. China is currently the largest investor in RET installations (wind and solar power), followed by the US. Thus, it is expected to show also significant financial alloca-tions for R&D. Furthermore, China is the main exporter in PV as well
as in hydro power. Based on the assumption of strengthening competitiveness through innova-tion, China is supposed to allocate significant financial resources for R&D to these technologies as well.
Nevertheless, it can be stated that many countries have specialized in certain technology fields within RET technologies. This can be found for public as well as for
private R&D investments (see Figure 1 and Figure 2):
• So far, the EU!28 (2016/17) scores first in public solar energy R&D spending, above the U.S., Japan and Korea, while data for China is not available. Within Europe, especially Germany, France, the Netherlands and the UK have the largest public R&D investments. For private R&D investments, only data for the EU!28 countries are available (2013/2014). Here, it can be shown that Germany scores first in terms of national R&D investment, followed by France, the UK and the Netherlands.
• With regard to geothermal energy, the U.S. ranks first, although many countries have been found to be active here. When looking at the share of public R&D investments on GDP, especially Switzerland and Denmark stick out. The figures for private R&D expendi-tures show that Germany has the largest private R&D investments of "!33.3!billion in 2015 but the expen-ditures have decreased since 2013. Germany is followed by Sweden, France, Italy and the UK (2013).
• In hydro energy, which is a com-parably small field with regard to public R&D investment, the EU ranks first (2016), followed by the U.S. which can be explained by its geo graphical position, i.e. large hydro power resources. It is followed by Turkey, Switzerland, Norway and Canada. Within the EU!28, Finland, the Netherlands, Denmark and Germany show the
largest public investments. As for the private R&D investments, France shows the largest values among the countries in our com-parison (EU!28 only). It is followed by Germany, the UK and Austria, who have significant private R&D investments in hydro power.
• Within biofuels, the U.S. clearly shows the largest investment
with more than "!600 billion in 2017, which constitutes a rise in investment since 2016. The other countries in our comparison have much lower public R&D invest-ments (all below "! 50! billion, except for the EU!28 as a whole). As for the private investment, Germany scores first with nearly
Source: JRC SETIS, Eurostat, WDI Database
Public R&D spending by technologies and selected countries in 2016, (in ! m)
1
Germany Denmark France Spain EU United States
Japan Korea
Windenergy
Solarenergy
Oceanenergy
Hydroenergy
Geothermalenergy
Biofuels
0
100
200
300
400
500
Siem
ens

Indicators on innovation and competitiveness
EUROBSERV !ER " THE STATE OF RENEWABLE ENERGIES IN EUROPE " #$%& EDITIONEUROBSERV !ER " THE STATE OF RENEWABLE ENERGIES IN EUROPE " #$%& EDITION
230 231
Source: JRC SETIS, Eurostat, WDI Database
Private R&D spending by technologies and selected countries in 2014, in mio Euro
2
Windenergy
Solarenergy
Oceanenergy
Hydroenergy
Geothermalenergy
Biofuels
0
500
1000
1500
2000
Germany Denmark France EU
"! 159 billion in 2017. Denmark shows the second largest private R&D investment in this field. All other (EU! 28) countries in our comparison have values below "!100 billion.
• In wind energy, Japan scores first with regard to public R&D spen-ding in 2016, followed by the EU!28 and the U.S, while in 2017, the EU!28 ranks third (although data for many countries is not available here in 2017). With regard to private R&D spending, Germany scores first followed by Denmark, which scores second on this indicator. Spain ranks third, however, with only about half of the budget of Denmark.
• In ocean energy – also a rather small field in terms of public R&D – the U.S. shows the largest values followed by the EU!28. In 2017, the EU!28 expenditures have decreased (based on available data), while the U.S. expenditures have increased. This is also due to increasing public R&D investments of the U.S. Concerning private R&D investments, Germany shows the largest values in 2013 closely fol-lowed by the UK and France as well as Finland and Sweden.
• Regarding all renewables, Ger-many, France, the UK and also the Netherlands, Denmark and Spain should be mentioned. These are countries that have significant
public R&D investment in nearly all RET fields.
• Overall, the data shows that private R&D financing by far exceeds public R&D financing. Thus, it supports the theoretical assessments, saying that public R&D spending can be seen as a driver for private R&D investments.
Siem
ens
AG

Indicators on innovation and competitiveness
232 233
EUROBSERV !ER " THE STATE OF RENEWABLE ENERGIES IN EUROPE " #$%& EDITION
Patent Filings
Methodological approach
The technological performance of countries or inno-vation systems in general is commonly measured by patent filings as well as patent grants, which can be viewed as the major output indicators for R&D pro-cesses. Countries with a high output of patents are assumed to have a strong technological competitive-ness, which might be translated into an overall macroe-
conomic competitiveness. Patents can be analyzed from different angles and with different aims, and the methods and definitions applied for these analyses do differ. Here, we focus on a domestic, macro-economic perspective by providing information on the techno-logical capabilities of economies within renewable energies technologies.
1. EPO. Worldwide Patent Statistical Database (PATSTAT),
European Patent Office. Available from: https://www.epo.
org/searching-for-patents/business/patstat.html#tab1
2. EPO and USPTO. Cooperative Patent Classification (CPC),
European Patent Office & United States Trademark
and Patent Office. Available from http://www.
cooperativepatentclassification.org/index.html
3. Patents allow companies to protect their research and
innovations efforts. Patents covering the domestic
market only (single patent families), provide only a
protection at the domestic level, while patents filed
at the WIPO or the EPO provide a protection outside
the domestic market (i.e. they are forwarded to other
national offices), and hence signal an international
competitiveness of the company.
4. A. Fiorini, A. Georgakaki, F. Pasimeni, E. Tzimas, “Moni-
toring R&D in Low-Carbon Energy Technologies”, EUR
28446 EN (2017). Available from: https://setis.ec.europa.
eu/related-jrc-activities/jrc-setis-reports/monitoring-ri-
low-carbon-energy-technologies
The patent data for this report were provided by JRC SETIS. The data originate from the EPO Worldwide Patent Statistical Database (PATSTAT)1. A full dataset for a given year is completed with a 3.5!year delay. Thus, data used for the assess-ment of indicators have a 4-year delay. Estimates with a 2-year lag are provided at EU level only. The data specifically address advances in the area of low carbon energy and climate mitigation technologies (Y-code of the Cooperative Patent Classification (CPC)2). Datasets are processed by JRC SETIS to eliminate errors and inconsistencies. Patent statistics are based on the priority date, simple patent families3 and fractional counts of submissions made both to national and inter-national authorities to avoid multiple counting of patents. Within the count of patent families, filings at single offices, also known as “singletons” are included. This implies that the results regar-
domestic markets and specialties in their patent systems, e.g. China, Japan and Korea. Thus, these results might wrongly signal a strong internatio-nal competitiveness.For the analyses of patents in different renewable energy technologies, not only the number of filings but also a specialization indicator is pro-vided. For this purpose, the Revealed Patent Ad-vantage (RPA) is estimated, which builds on the works by Balassa (Balassa 1965), who has created this indicator to analyse international trade. Here the RPA indicates in which RET fields a country is strongly or weakly represented compared to the total patent applications in the field of energy technologies. Thus, the RPA for country i in field RET measures the share of RET patents of country i in all energy technologies compared to the RET world share of patents in all energy technologies. If a country i’s share is larger than the world share, country i is said to be specialised in renewable energies within its energy field. The data were transformed, so values between 0 and 1 imply a below average interest or focus on this renewable technology, while values above 1 indicate a posi-tive specialization, i.e. a strong focus on this RET compared to all energy technologies. It should be
ding the global technological competitiveness could be biased towards countries with large
noted that the specialization indicator refers to energy technologies, and not to all technologies. This makes the indicator more sensitive to small changes in RET patent filings, i.e. it displays more ups and downs, and depicts small numbers in renewable patents as large specialisation effects if the patent portfolio in energy technologies is small, i.e. the country is small. To account for this size effect of the country or economy and to make patent data more comparable between countries, patent filings per GDP (in trillion ") are depicted as well. The methodology is described in more detail in the JRC Science for Policy Report “Monitoring R&D in Low Carbon Energy Technologies: Methodology for the R&D indicators in the State of the Energy Union Report, - 2016 Edition”.4

Indicators on innovation and competitiveness
EUROBSERV !ER " THE STATE OF RENEWABLE ENERGIES IN EUROPE " #$%& EDITIONEUROBSERV !ER " THE STATE OF RENEWABLE ENERGIES IN EUROPE " #$%& EDITION
234 235
In contrast to hydro energy and biofuels, in wind energy the EU!28
as a group is at a similar patenting level as China. However, the EU!28 has slightly lost ground in 2014 while China has increased its patent activities in wind energy technolo-gies. Korea scores third, followed by
WIND ENERGY Number of
patent familiesPatent
specializationPatents per ! trillion GDP
2013 2014 2013 2014 2013 2014
EU!28 ! ! ! ! ! !
Germany 268 258 2.2 2.3 99.2 93.6
Denmark 98 89 11.1 11.2 394.8 349.4
Spain 48 40 5.8 6.0 46.9 38.4
France 22 30 0.6 0.9 10.8 14.5
United Kingdom 28 23 1.5 1.4 14.3 11.7
Netherlands 23 14 1.9 1.3 36.3 22.3
Italy 21 10 2.1 1.4 13.6 6.6
Sweden 23 8 2.1 0.9 58.9 19.1
Belgium 5 7 1.4 2.7 12.3 19.7
Romania 5 7 4.1 7.2 34.7 52.7
Poland 11 7 2.0 1.5 28.4 16.1
Austria 6 3 1.0 0.4 20.9 10.2
Finland 2 3 0.3 0.4 12.0 13.4
Hungary 1 1 2.0 4.0 9.9 9.5
Slovenia 0 1 0.0 2.1 0.0 27.7
Slovakia 1 1 2.0 4.6 13.9 13.6
Estonia 0 1 0.0 5.1 0.0 38.5
Greece 0 1 0.8 7.0 1.1 2.7
Luxembourg 2 1 3.0 0.6 51.5 11.1
Lithuania 0 0 0.0 2.3 0.0 10.1
Bulgaria 0 0 0.0 0.0 0.0 0.0
Cyprus 0 0 0.0 0.0 0.0 0.0
Czechia 0 0 0.0 0.0 0.0 0.0
Croatia 0 0 0.0 0.0 0.0 0.0
Ireland 3 0 2.5 0.0 14.2 0.0
Latvia 2 0 2.5 0.0 77.9 0.0
Malta 0 0 0.0 0.0 0.0 0.0
Portugal 0 0 0.0 0.0 0.0 0.0
Total EU"28 569 504 2.2 2.2 43.6 38.0
Other Countries
China 669 721 0.9 0.9 92.5 91.2
Korea 268 277 1.2 1.1 272.6 260.8
Japan 215 199 0.5 0.5 55.2 54.4
United States 222 156 1.0 0.9 17.7 11.9
Rest of the world 103 79 n.a. n.a. 0.0 0.0
Note: the value 0 signals that there is no patent application. Note: Single patent families (singletons) have been included. Source: JRC SETIS, Eurostat, WDI Database.
Germany, Japan, the United States and Denmark. This strong position of Europe is mostly borne out of the strong position of two European countries, namely Germany and Denmark, who together are res-ponsible for nearly 69% of all Euro-pean patents within wind energy.
Continues overleaf
Yet, also Spain, France, the UK, the Netherlands and Italy have filed a significant number of patents wit-hin this field in 2014.
In terms of patents per GDP in wind energy, Denmark is the leading country with the largest value in this comparison. It is followed by Korea, Germany, China and Japan. Romania, Estonia and Spain are above the EU! 28 average but behind China.
With regard to the patent speciali-zation, especially Denmark shows a large value, implying that wind energy can be seen as an important factor within its domestic energy technology portfolio. Large values can also be found for Romania, Greece, and Spain. Germany also shows an above average speciali-zation (as is the EU!28 in general), yet it is not as strongly pronounced as in the case of Denmark and the other mentioned countries. This is due to the fact that Germany in general files a large number of patents in energy technologies so the effect of wind energy patents on its portfolio is not that pro-nounced. Jo
rrit
Lo
usb
erg
/ L
ager
wey

Indicators on innovation and competitiveness
EUROBSERV !ER " THE STATE OF RENEWABLE ENERGIES IN EUROPE " #$%& EDITIONEUROBSERV !ER " THE STATE OF RENEWABLE ENERGIES IN EUROPE " #$%& EDITION
236 237
In the field of solar energy, China has the highest number
of patents filed domestically or internationally and ranks third based on patents per GDP. Yet, it is rather closely followed by Japan, although Japan's patenting activity between 2013 and 2014 has decreased (as opposed to China). Korea scores third with regard to patent counting, with stagna-ting figures between 2013 and 2014. However, it by far ranks first when patents are related to GDP. The EU!28 as a total ranges behind Korea - with about half of the num-ber of patent filings - and ahead of the US, although the figures have been decreasing for both countries in 2014. Within Europe, Germany
SOLAR ENERGYNumber of
patent familiesPatent
specializationPatents per ! trillion GDP
2013 2014 2013 2014 2013 2014
EU!28 ! ! ! ! ! !
Germany 359 268 0.8 0.8 132.8 97.2
France 124 104 0.9 1.0 60.0 50.0
United Kingdom 53 45 0.8 0.9 27.1 22.5
Spain 48 43 1.6 2.1 47.0 42.0
Netherlands 37 38 0.9 1.1 57.7 58.6
Austria 12 25 0.5 1.1 37.9 80.1
Italy 48 20 1.3 0.9 31.3 12.8
Poland 17 15 0.8 1.1 42.6 36.5
Belgium 22 12 1.9 1.4 60.1 32.4
Sweden 8 10 0.2 0.4 19.6 26.1
Romania 5 6 1.1 1.7 34.7 39.6
Ireland 4 5 1.1 1.7 21.6 27.8
Finland 13 5 0.6 0.3 70.6 26.9
Portugal 3 3 2.7 2.1 17.9 18.9
Denmark 7 2 0.2 0.1 26.6 9.6
Lithuania 0 2 0.0 4.4 0.0 60.5
Latvia 3 2 1.5 5.9 167.0 97.4
Czechia 2 2 0.4 0.6 10.6 9.3
Luxembourg 1 1 0.2 0.5 11.8 27.8
Slovakia 1 1 0.6 1.5 13.9 13.6
Cyprus 0 1 0.0 0.7 0.0 28.6
Bulgaria 0 0 0.0 0.0 0.0 0.0
Estonia 0 0 0.0 0.0 0.0 0.0
Greece 2 0 1.6 0.0 8.1 0.0
Croatia 0 0 0.7 0.0 4.6 0.0
Hungary 1 0 0.6 0.0 9.9 0.0
Malta 0 0 0.0 0.0 0.0 0.0
Slovenia 0 0 0.0 0.0 0.0 0.0
Total EU"28 767 610 0.8 0.9 58.8 45.9
Other Countries
China 2 328 2 108 0.8 0.8 321.7 266.8
Japan 2 062 1 362 1.2 1.2 530.9 372.6
Korea 1 115 1 144 1.4 1.5 1 133.4 1 075.6
United States 575 455 0.7 0.8 45.7 34.6
Rest of the world 517 397 n.a. n.a. 0.0 0.0
Note: the value 0 signals that there is no patent application. Note: Single patent families (singletons) have been included. Source: JRC SETIS, Eurostat, WDI Database.
has filed the largest number of patents, followed by France, the UK, Spain and the Netherlands. Together with Latvia, Germany also ranks first regarding patents per GDP within the EU, followed by Austria and Lithuania. These diffe-rences in patent filings between the countries partly reflect dif-ferent domestic patenting precon-ditions or behaviour. For example, China has a large number of patent filings for the domestic market, while its number of patent appli-cations for the international mar-ket is lower.
When taking a closer look at the specialization indices of the res-pective countries, it can be found
Continues overleaf
that European countries are gene-rally more specialized in solar energy compared to other energy technology fields than the remai-ning countries in the analysis. The countries with the largest speciali-zation values are Latvia, Lithuania, Portugal, Spain, Ireland and Roma-nia. However, it has to be kept in mind that these countries have comparably low numbers of filings in general. Thus, a small number of filings in PV and a low number in filings for other energy technolo-gies could lead to a relative high specialisation value. Consequently, minor changes in their patenting activity in a given year can have large influence on the patent spe-cializations.
Vo
ltal
ia G
reec
e

Indicators on innovation and competitiveness
EUROBSERV !ER " THE STATE OF RENEWABLE ENERGIES IN EUROPE " #$%& EDITIONEUROBSERV !ER " THE STATE OF RENEWABLE ENERGIES IN EUROPE " #$%& EDITION
238 239
In hydro energy, the patenting figures are higher than in geo-
thermal energy. Here, especially China displays the largest number of patents. Japan, Korea and the EU!28 follow up but at a lower level than China. Korea has managed a growth in filings between 2013 and 2014, while the figures for the EU!28 decreased. Within Europe, Germany is responsible for 33% of all pa-tent filings within this field, while
HYDROENERGYNumber of
patent familiesPatent
specializationPatents per ! trillion GDP
2013 2014 2013 2014 2013 2014
EU!28 ! ! ! ! ! !
Germany 15 15 0.7 0.6 5.6 5.4
France 14 13 2.0 1.8 6.9 6.1
United Kingdom 3 4 0.9 1.1 1.6 2.1
Poland 6 4 5.6 3.5 15.3 8.7
Spain 3 3 1.6 2.2 2.4 3.1
Austria 3 2 2.6 1.2 10.9 6.5
Romania 2 1 10.8 4.4 17.4 7.2
Slovenia 0 1 0.0 9.4 0.0 27.7
Finland 1 1 0.9 0.6 6.2 4.2
Czechia 0 1 1.4 3.5 1.8 4.1
Netherlands 2 1 1.0 0.2 3.4 0.8
Italy 8 0 4.4 0.2 5.4 0.2
Belgium 1 0 1.6 0.0 2.7 0.0
Bulgaria 0 0 0.0 0.0 0.0 0.0
Cyprus 0 0 0.0 0.0 0.0 0.0
Denmark 1 0 0.3 0.0 2.0 0.0
Estonia 0 0 0.0 0.0 0.0 0.0
Greece 0 0 6.8 0.0 1.8 0.0
Croatia 1 0 69.3 0.0 22.9 0.0
Hungary 0 0 0.0 0.0 0.0 0.0
Ireland 1 0 2.6 0.0 2.8 0.0
Lithuania 0 0 0.0 0.0 0.0 0.0
Luxembourg 0 0 0.0 0.0 0.0 0.0
Latvia 0 0 0.0 0.0 0.0 0.0
Malta 0 0 0.0 0.0 0.0 0.0
Portugal 0 0 0.0 0.0 0.0 0.0
Sweden 0 0 0.0 0.0 0.0 0.0
Slovakia 2 0 21.6 0.0 27.9 0.0
Total EU"28 64 45 1.3 0.9 4.9 3.4
Other Countries
China 185 221 1.3 1.2 25.5 27.9
Japan 68 71 0.8 0.9 17.6 19.5
Korea 36 52 0.9 1.0 36.6 49.1
United States 10 7 0.2 0.2 0.8 0.5
Rest of the world 23 34 n.a. n.a. 0.0 0.0
Note: the value 0 signals that there is no patent application. Note: Single patent families (singletons) have been included. Source: JRC SETIS, Eurostat, WDI Database.
France is responsible for 28%. The UK, Poland, Spain, Austria, Romania, Slovenia, Finland, Czechia and the Netherlands also show a certain activity level.
In relation to its economic size, Korea and China reveal the highest patent filing figures per GDP, followed by Slovenia, Japan, Poland and Romania. However, it has to be stressed again that
Continues overleaf
these patents also include single domestic patent applications, an interpretation regarding the international competitiveness is therefore difficult.
The RPA indicator shows a high specialization for Slovenia, Roma-nia, Poland, the Czechia, Spain and France. However, except for France, this is based on a very low absolute number of filings.
Ro
lf S
turm
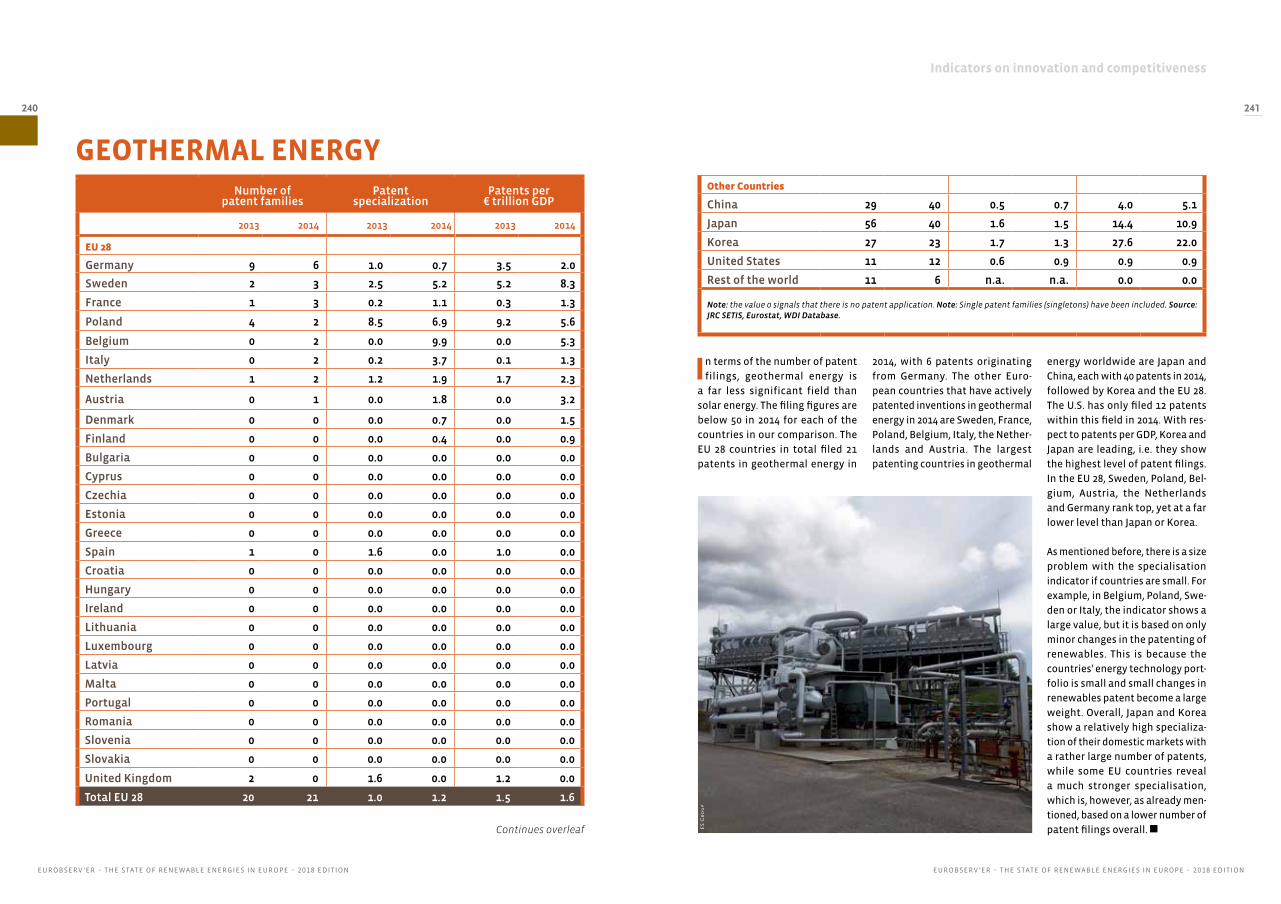
Indicators on innovation and competitiveness
EUROBSERV !ER " THE STATE OF RENEWABLE ENERGIES IN EUROPE " #$%& EDITIONEUROBSERV !ER " THE STATE OF RENEWABLE ENERGIES IN EUROPE " #$%& EDITION
240 241
In terms of the number of patent filings, geothermal energy is
a far less significant field than solar energy. The filing figures are below 50 in 2014 for each of the countries in our comparison. The EU!28 countries in total filed 21 patents in geothermal energy in
GEOTHERMAL ENERGYNumber of
patent familiesPatent
specializationPatents per ! trillion GDP
2013 2014 2013 2014 2013 2014
EU!28 ! ! ! ! ! !
Germany 9 6 1.0 0.7 3.5 2.0
Sweden 2 3 2.5 5.2 5.2 8.3
France 1 3 0.2 1.1 0.3 1.3
Poland 4 2 8.5 6.9 9.2 5.6
Belgium 0 2 0.0 9.9 0.0 5.3
Italy 0 2 0.2 3.7 0.1 1.3
Netherlands 1 2 1.2 1.9 1.7 2.3
Austria 0 1 0.0 1.8 0.0 3.2
Denmark 0 0 0.0 0.7 0.0 1.5
Finland 0 0 0.0 0.4 0.0 0.9
Bulgaria 0 0 0.0 0.0 0.0 0.0
Cyprus 0 0 0.0 0.0 0.0 0.0
Czechia 0 0 0.0 0.0 0.0 0.0
Estonia 0 0 0.0 0.0 0.0 0.0
Greece 0 0 0.0 0.0 0.0 0.0
Spain 1 0 1.6 0.0 1.0 0.0
Croatia 0 0 0.0 0.0 0.0 0.0
Hungary 0 0 0.0 0.0 0.0 0.0
Ireland 0 0 0.0 0.0 0.0 0.0
Lithuania 0 0 0.0 0.0 0.0 0.0
Luxembourg 0 0 0.0 0.0 0.0 0.0
Latvia 0 0 0.0 0.0 0.0 0.0
Malta 0 0 0.0 0.0 0.0 0.0
Portugal 0 0 0.0 0.0 0.0 0.0
Romania 0 0 0.0 0.0 0.0 0.0
Slovenia 0 0 0.0 0.0 0.0 0.0
Slovakia 0 0 0.0 0.0 0.0 0.0
United Kingdom 2 0 1.6 0.0 1.2 0.0
Total EU"28 20 21 1.0 1.2 1.5 1.6
Other Countries
China 29 40 0.5 0.7 4.0 5.1
Japan 56 40 1.6 1.5 14.4 10.9
Korea 27 23 1.7 1.3 27.6 22.0
United States 11 12 0.6 0.9 0.9 0.9
Rest of the world 11 6 n.a. n.a. 0.0 0.0
Note: the value 0 signals that there is no patent application. Note: Single patent families (singletons) have been included. Source: JRC SETIS, Eurostat, WDI Database.
2014, with 6 patents originating from Germany. The other Euro-pean countries that have actively patented inventions in geothermal energy in 2014 are Sweden, France, Poland, Belgium, Italy, the Nether-lands and Austria. The largest patenting countries in geothermal
Continues overleaf
energy worldwide are Japan and China, each with 40!patents in 2014, followed by Korea and the EU!28. The U.S. has only filed 12 patents within this field in 2014. With res-pect to patents per GDP, Korea and Japan are leading, i.e. they show the highest level of patent filings. In the EU!28, Sweden, Poland, Bel-gium, Austria, the Netherlands and Germany rank top, yet at a far lower level than Japan or Korea.
As mentioned before, there is a size problem with the specialisation indicator if countries are small. For example, in Belgium, Poland, Swe-den or Italy, the indicator shows a large value, but it is based on only minor changes in the patenting of renewables. This is because the countries' energy technology port-folio is small and small changes in renewables patent become a large weight. Overall, Japan and Korea show a relatively high specializa-tion of their domestic markets with a rather large number of patents, while some EU countries reveal a much stronger specialisation, which is, however, as already men-tioned, based on a lower number of patent filings overall. ES
Gro
up
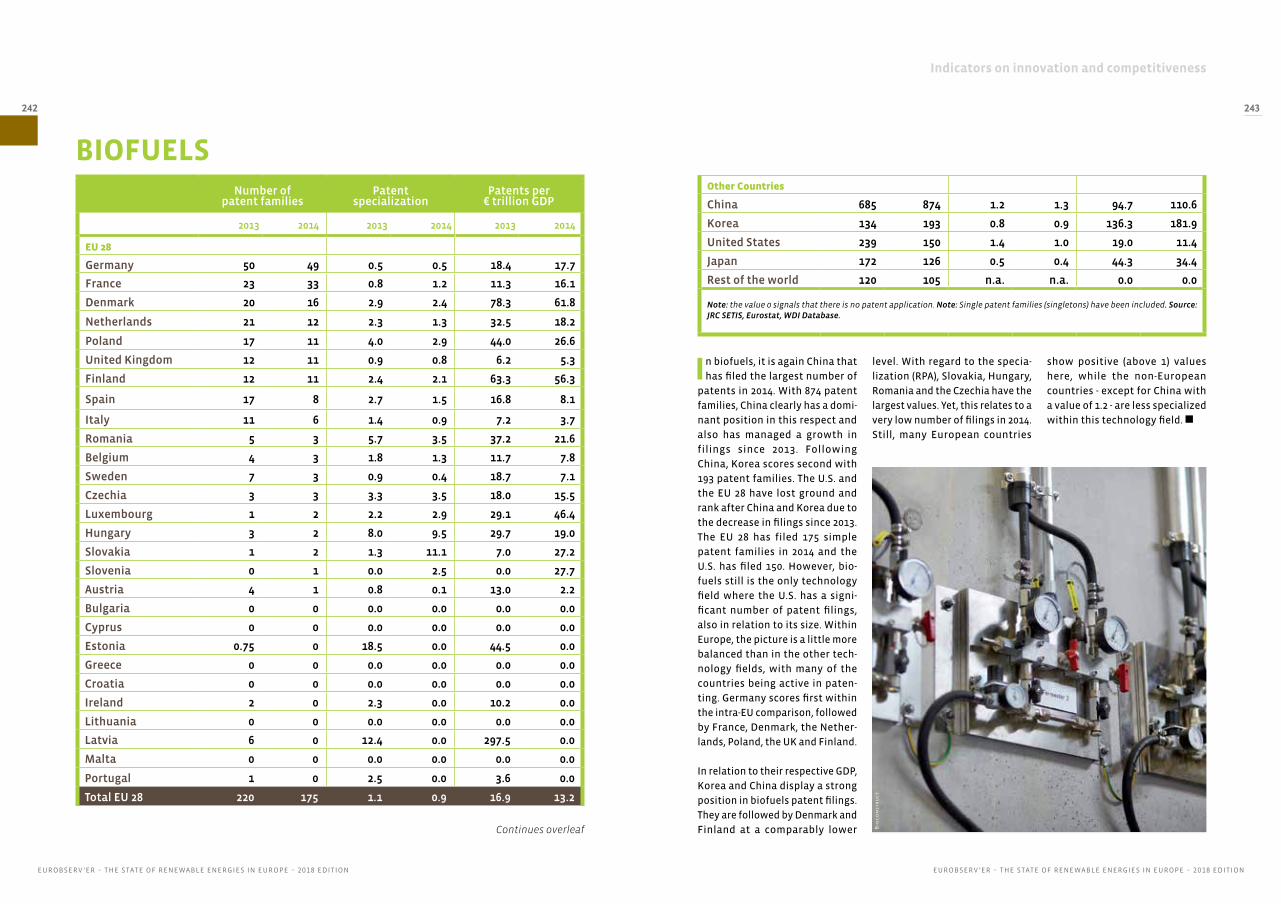
Indicators on innovation and competitiveness
EUROBSERV !ER " THE STATE OF RENEWABLE ENERGIES IN EUROPE " #$%& EDITIONEUROBSERV !ER " THE STATE OF RENEWABLE ENERGIES IN EUROPE " #$%& EDITION
242 243
In biofuels, it is again China that has filed the largest number of
patents in 2014. With 874 patent families, China clearly has a domi-nant position in this respect and also has managed a growth in filings since 2013. Following China, Korea scores second with 193!patent families. The U.S. and the EU!28 have lost ground and rank after China and Korea due to the decrease in filings since 2013. The EU! 28 has filed 175 simple patent families in 2014 and the U.S. has filed 150. However, bio-fuels still is the only technology field where the U.S. has a signi-ficant number of patent filings, also in relation to its size. Within Europe, the picture is a little more balanced than in the other tech-nology fields, with many of the countries being active in paten-ting. Germany scores first within the intra-EU comparison, followed by France, Denmark, the Nether-lands, Poland, the UK and Finland.
In relation to their respective GDP, Korea and China display a strong position in biofuels patent filings. They are followed by Denmark and Finland at a comparably lower
BIOFUELSNumber of
patent familiesPatent
specializationPatents per ! trillion GDP
2013 2014 2013 2014 2013 2014
EU!28 ! ! ! ! ! !
Germany 50 49 0.5 0.5 18.4 17.7
France 23 33 0.8 1.2 11.3 16.1
Denmark 20 16 2.9 2.4 78.3 61.8
Netherlands 21 12 2.3 1.3 32.5 18.2
Poland 17 11 4.0 2.9 44.0 26.6
United Kingdom 12 11 0.9 0.8 6.2 5.3
Finland 12 11 2.4 2.1 63.3 56.3
Spain 17 8 2.7 1.5 16.8 8.1
Italy 11 6 1.4 0.9 7.2 3.7
Romania 5 3 5.7 3.5 37.2 21.6
Belgium 4 3 1.8 1.3 11.7 7.8
Sweden 7 3 0.9 0.4 18.7 7.1
Czechia 3 3 3.3 3.5 18.0 15.5
Luxembourg 1 2 2.2 2.9 29.1 46.4
Hungary 3 2 8.0 9.5 29.7 19.0
Slovakia 1 2 1.3 11.1 7.0 27.2
Slovenia 0 1 0.0 2.5 0.0 27.7
Austria 4 1 0.8 0.1 13.0 2.2
Bulgaria 0 0 0.0 0.0 0.0 0.0
Cyprus 0 0 0.0 0.0 0.0 0.0
Estonia 0.75 0 18.5 0.0 44.5 0.0
Greece 0 0 0.0 0.0 0.0 0.0
Croatia 0 0 0.0 0.0 0.0 0.0
Ireland 2 0 2.3 0.0 10.2 0.0
Lithuania 0 0 0.0 0.0 0.0 0.0
Latvia 6 0 12.4 0.0 297.5 0.0
Malta 0 0 0.0 0.0 0.0 0.0
Portugal 1 0 2.5 0.0 3.6 0.0
Total EU"28 220 175 1.1 0.9 16.9 13.2
Other Countries
China 685 874 1.2 1.3 94.7 110.6
Korea 134 193 0.8 0.9 136.3 181.9
United States 239 150 1.4 1.0 19.0 11.4
Japan 172 126 0.5 0.4 44.3 34.4
Rest of the world 120 105 n.a. n.a. 0.0 0.0
Note: the value 0 signals that there is no patent application. Note: Single patent families (singletons) have been included. Source: JRC SETIS, Eurostat, WDI Database.
level. With regard to the specia-lization (RPA), Slovakia, Hungary, Romania and the Czechia have the largest values. Yet, this relates to a very low number of filings in 2014. Still, many European countries
Continues overleaf
show positive (above 1) values here, while the non-European countries - except for China with a value of 1.2!- are less specialized within this technology field.
Bio
con
stru
ct

Indicators on innovation and competitiveness
EUROBSERV !ER " THE STATE OF RENEWABLE ENERGIES IN EUROPE " #$%& EDITIONEUROBSERV !ER " THE STATE OF RENEWABLE ENERGIES IN EUROPE " #$%& EDITION
244 245
Ocean energy is also a compa-rably small field in terms of the
number of patent families, but the general trends are also mirrored by these figures here, i.e. China scores first, followed by Europe, Korea, Japan and the U.S. Germany is the largest applicant within this tech-nology field within Europe. The UK scores second, France third.
Korea is strong in patent filings per GDP. Due to their small size, Finland and Ireland range before Japan while countries with a high number of filings (China, Japan, United Kingdom or Germany) show a lower ranking due to their eco-nomic size.
The UK also shows a large specia-lization within this field but due to the size factor some smaller countries score higher. However, there are many countries in Europe where positive specializations with regard to ocean energy can be found.
OCEAN ENERGYNumber of
patent familiesPatent
specializationPatents per ! trillion GDP
2013 2014 2013 2014 2013 2014
EU!28 ! ! ! ! ! !
Germany 17 24 0.6 0.8 6.3 8.7
United Kingdom 19 19 4.8 4.4 9.6 9.4
France 15 13 1.8 1.5 7.4 6.2
Finland 7 9 4.8 5.4 35.5 45.8
Spain 9 9 4.9 4.9 8.3 8.2
Sweden 8 8 3.7 3.6 21.8 20.3
Ireland 2 6 9.3 21.2 11.3 28.6
Italy 4 4 2.0 2.0 2.8 2.6
Poland 1 3 0.8 2.1 2.6 6.2
Denmark 1 1 0.6 0.7 4.7 5.5
Netherlands 7 1 2.9 0.5 11.5 2.0
Portugal 2 1 22.8 7.9 8.9 5.9
Slovenia 0 1 0.0 7.9 0.0 27.7
Austria 0 1 0.0 0.3 0.0 1.6
Luxembourg 0 1 0.0 2.3 0.0 11.1
Romania 0 0 0.0 0.7 0.0 1.4
Belgium 2 0 2.5 0.0 4.6 0.0
Bulgaria 0 0 0.0 0.0 0.0 0.0
Cyprus 0 0 0.0 0.0 0.0 0.0
Czechia 0 0 0.0 0.0 0.0 0.0
Estonia 0 0 0.0 0.0 0.0 0.0
Greece 1 0 12.0 0.0 3.6 0.0
Croatia 0 0 0.0 0.0 0.0 0.0
Hungary 0 0 0.0 0.0 0.0 0.0
Lithuania 0 0 0.0 0.0 0.0 0.0
Latvia 0 0 0.0 0.0 0.0 0.0
Malta 0 0 0.0 0.0 0.0 0.0
Slovakia 0 0 0.0 0.0 0.0 0.0
Total EU"28 94 99 1.7 1.7 7.2 7.4
Other Countries
China 165 219 1.0 1.0 22.7 27.7
Korea 50 92 1.1 1.4 51.0 86.3
Japan 51 49 0.5 0.5 13.2 13.5
United States 33 23 0.7 0.5 2.6 1.7
Rest of the world 42 27 n.a. n.a. 0.0 0.0
Note: the value 0 signals that there is no patent application. Note: Single patent families (singletons) have been included. Source: JRC SETIS, Eurostat, WDI Database.
Continues overleaf Mic
hea
l Sm
ith
/ R
utg
ers
Un
iver
sity
/
Inst
itu
te O
f M
arin
e A
nd
Co
asta
l Sc
ien
ces

Indicators on innovation and competitiveness
EUROBSERV !ER " THE STATE OF RENEWABLE ENERGIES IN EUROPE " #$%& EDITIONEUROBSERV !ER " THE STATE OF RENEWABLE ENERGIES IN EUROPE " #$%& EDITION
246 247
A final look at the patenting figures in all renewable ener-
gies technologies shows that China has filed the largest number of patents in 2014, followed by Japan, Korea, the EU!28 and the U.S.. Wit-hin the EU!28, a strong position of Germany can be observed, which has also been found at the input side, i.e. in terms of R&D invest-ments. Comparably large numbers of patents in RET can also be found in France, Denmark, Spain, the UK and the Netherlands. In terms of patents per GDP, Korea has the top position, followed by China and Japan. The EU!28 is in the (upper) midfield as well as the U.S. Within Europe, Denmark, Germany and Finland reach the largest number of patents per GDP.
RENEWABLE ENERGYTECHNOLOGIES IN TOTAL
Number of patent families
Patents per ! trillion GDP
2013 2014 2013 2014
EU!28 ! ! ! !
Germany 718 620 265.8 224.6
France 199 195 96.8 94.1
Denmark 126 108 506.4 427.8
Spain 125 103 122.4 99.8
United Kingdom 117 102 59.8 51.0
Netherlands 92 68 143.0 104.1
Italy 93 42 60.5 27.2
Poland 56 40 142.1 99.6
Austria 25 32 82.7 103.8
Sweden 48 32 124.2 80.9
Finland 35 28 187.6 147.5
Belgium 34 25 91.4 65.2
Romania 17 17 123.9 122.5
Ireland 11 11 60.1 56.4
Czechia 5 5 30.4 28.9
Luxembourg 4 4 92.3 96.4
Portugal 5 4 30.4 24.8
Slovenia 0 4 0.0 110.7
Slovakia 5 4 62.8 54.3
Hungary 5 3 49.6 28.5
Lithuania 0 2 0.0 70.6
Latvia 11 2 542.4 97.4
Estonia 1 1 44.5 38.5
Cyprus 0 1 0.0 28.6
Greece 3 1 14.7 2.7
Bulgaria 0 0 0.0 0.0
Croatia 1 0 27.4 0.0
Malta 0 0 0.0 0.0
EU"28 Total 1734 1453 132.9 109.4
Other Countries
China 4060 4182 561.0 529.3
Japan 2624 1847 675.6 505.2
Korea 1630 1783 1657.6 1675.8
United States 1090 802 86.7 61.1
Rest of the world 815 647 n.a. n.a.
Note: the value 0 signals that there is no patent application. Note: Single patent families (single-tons) have been included. Source: JRC SETIS, Eurostat, WDI Database.
Continues overleaf Fran
ce H
ydro
Éle
ctr
icit
é

Indicators on innovation and competitiveness
EUROBSERV !ER " THE STATE OF RENEWABLE ENERGIES IN EUROPE " #$%& EDITIONEUROBSERV !ER " THE STATE OF RENEWABLE ENERGIES IN EUROPE " #$%& EDITION
248 249
Across nearly all fields in renewable energies technolo-
gies, the Asian countries display the highest patenting activities in absolute and relative (GDP) num-bers when including patent filings that refer only to the domestic market (singletons) (see Figure 3). It is mostly China that scores first in the number of patent families within the sample, although Korea often scores first when looking at
CONCLUSIONS
EnB
w
Note: potentially biased due to the inclusion of single patent families (singletons). Source: JRC SETIS, Eurostat, WDI Database.
Number of patent families by countries and RET, 2014
3
Germany Denmark France Spain EU UnitedStates
JapanChina Korea
Windenergy
Solarenergy
Oceanenergy
Hydroenergy
Geothermalenergy
Biofuels
0
500
1000
1500
2000
2500
patents per GDP. Europe takes a middle position between the Asian countries and the U.S.; but apart from wind technologies it is closer to the U.S. than to the Asian countries. Besides the tech-nology field solar energy, the U.S. is not very active in patenting RET technologies. Relative to other countries, biofuels is the only field where the U.S. can score a rank among the top four in terms
of patent counts. Within the EU!28, it is mostly Germany that files the largest number of patents. Howe-ver, this is due to its size - in terms of patenting per GDP, Denmark ranks first in Europe.
Germany is also one of the few countries that show a certain activity level across all renewable energy technology fields, while most other countries are specia-
lized in only one or two RET tech-nologies. Denmark and Spain, for example, show remarkable filing figures in wind energy, while the UK is most patent active in ocean energy.
Regarding RE technologies, solar energy has the largest number of patent filings in the EU and world-
wide, followed by wind energy. In contrast to the large R&D invest-ments into biofuels, the patent statistics show relatively modest results for biofuels. Regarding ocean energy, in terms of patents and R&D spending it is less signi-ficant, despite its resource and technological development poten-tials.!

Indicators on innovation and competitiveness
250 251
EUROBSERV !ER " THE STATE OF RENEWABLE ENERGIES IN EUROPE " #$%& EDITION
International Trade
Methodological approach
The analysis of trade and trade-flows has become an important topic in trade economics because it is under-stood that an increase in trade generally benefits all trading partners. According to the mainstream in international trade theories, the international trade of goods occurs because of comparative advantages. The different advantages in manufacturing goods between two countries lead to trade. However, empirical data revealed that not only factor endowment but also the
technological capabilities of a country affect its export performance. Consequently, firms that develop new products or integrate superior technology, will domi-nate the export markets of these products. In sum, it can be stated that innovation is positively correlated with ex-post performance. This is why a closer look is taken at the export performance. It is considered as an important output indicator of innovative performance within renewable energies technologies.
1. The HS 2017 codes used for the demarcation are:
Photovoltaics (85414090), wind energy (85023100)
and hydroelectricity (84101100, 84101200, 84101300,
84109000). For biofu-els, the codes (22071000, 22072000)
are based on the classification by JRC SETIS in A. Fiorini,
A. Georgakaki, F. Pasimeni, E. Tzimas, “Monitoring R&I in
Low-Carbon Energy Technologies”, EUR 28446 EN (2017),
doi: 10.2760/447418.
To depict trade, not only the absolute (export) advantage in terms of global export shares is ana-lysed but also net exports, i.e. exports minus imports of a given country. It reveals whether there is a sur-plus generated by exporting goods and services. Moreover, a closer look is taken at the compara-tive advantage, which refers to the relative costs of one product in terms of a country vis-à-vis ano-ther country. While early economists believed that absolute advantage in a certain product category would be a necessary condition for trade, it has been shown that international trade is mutually bene-ficial under the weaker condition of comparative advantage (meaning that productivity of one good relative to another differs between countries). The analysis of trade-flows has thus become an impor-tant topic in trade economics where the most
cator by normalising it to an interval ranging from -100 to +100 in contrast to the RPA. Further, the RCA refers to all product groups traded, while the RPA indicator refers to energy technologies.The RCA has to be interpreted in relation to the remaining portfolio of the country and the world share. For example, if countries only have a mini-mal (below average) share of renewable energies within their total trade portfolio, all values would be negative. In contrast, some countries e.g. DK, JP, CN and ES have in relation to all exported goods an above average share of RET in their export portfolio.The analysis looks at renewable energies exports as a whole, but also at the disaggregated RET fields. These fields comprise photovoltaics (PV),
widely used indicator was the Revealed Compara-tive Advantage (RCA) developed by (Balassa 1965) because an increase in trade benefits all trading partners under very general conditions. Thus, the RCA is a very valuable indicator to analyse and des-cribe specialisation in certain products or sectors.The share of a country i’s RET exports is compa-red to the world’s (sum of all other countries) RET export share. The RET shares itself show RET exports in relation to all exports. Therefore, the RCA for country i measures the share of e.g. wind power technology exports of country i compared to the world’s share of wind power technology exports. If a country i’s share is larger than the world share, country i is said to be specialised in this field. The tanhyp-log transformation does not change this general interpretation but it symmetrises this indi-
wind energy and hydroelectricity and biofuels for the reporting year 2017. The export data were extracted from the UN Comtrade database. The fields were identified based on a selection of Har-monized System Codes (HS 2017).

Indicators on innovation and competitiveness
EUROBSERV !ER " THE STATE OF RENEWABLE ENERGIES IN EUROPE " #$%& EDITIONEUROBSERV !ER " THE STATE OF RENEWABLE ENERGIES IN EUROPE " #$%& EDITION
252 253
With regard to the export shares in all four selected
renewable energies technolo-gies, China has the largest values in 2016 with slightly above 25%. However, in 2017, we see an increase in export shares of the EU-28 from 23% to 29%, while decreasing shares of China could be observed in last year's report of this series. Among the single countries, the U.S., Germany, Ja-pan, Denmark and the Nether-lands (value from 2016) have the largest shares after China. It can be found that all of the observed countries have increased their RET exports in 2017, with the U.S. and Japan having the largest growth rates. This might be due to the declining shares of China that have been observed between 2015 and 2016. The countries with the smallest shares in comparison are Albania, Cyprus, New Zealand,
ALL RES Share of technology
on global exportsNet exports
(in ! m)Export
specialisation (RCA)
2016 2017 2016 2017 2016 2017
EU!28 ! ! ! ! ! !
Germany 7.74% 11.46% 1801 419 -10 -6
Denmark 4.55% 5.53% 2690 1704 97 95
Spain 1.90% 3.64% 971 939 5 30
United-Kingdom 0.64% 1.63% -1255 -994 -89 -67
Italy 0.75% 1.30% -175 -160 -88 -83
Belgium 0.82% 1.29% 139 70 -81 -77
Hungary 0.53% 1.03% 127 111 -22 8
Czechia 0.38% 0.63% 5 -15 -77 -70
Sweden 0.23% 0.48% -186 -116 -88 -75
Poland 0.29% 0.45% -149 -149 -90 -89
Portugal 0.20% 0.38% 7 12 -51 -31
Croatia 0.06% 0.29% -28 3 -40 67
Slovenia 0.13% 0.22% 29 21 -29 -9
Slovakia 0.13% 0.22% 25 25 -87 -83
Luxemburg 0.08% 0.19% 1 6 -8 47
Bulgaria 0.06% 0.13% 0 1 -76 -58
Ireland 0.06% 0.13% -66 -35 -99 -98
Estonia 0.04% 0.09% 11 8 -60 -39
Lithuania 0.04% 0.08% -9 -7 -87 -82
Romania 0.05% 0.05% -133 -138 -97 -98
Finland 0.02% 0.04% -162 -107 -100 -99
Latvia 0.01% 0.03% -28 -24 -93 -86
Greece 0.04% 0.02% -223 -229 -90 -99
Cyprus 0.00% 0.00% -5 -6 -100 -99
Austria 0.59% n.a. 8 n.a. -43 n.a.
France 1.53% n.a. 196 n.a. -62 n.a.
Malta 0.00% n.a. -9 n.a. -100 n.a.
The Netherlands 2.23% n.a. -309 n.a. -24 n.a.
Total EU-28 (incl. Intra-EU trade) 23.08% 29.32% 3273 1339 -36 -25
Other Countries ! ! ! !
United States 6.52% 13.27% -6459 -3317 -34 3
Japan 5.67% 10.37% -1270 -592 31 52
Canada 0.56% 0.94% -777 -912 -90 -87
India 0.43% 0.69% -2772 -2624 -88 -74
Norway 0.01% 0.50% -77 -132 -100 -48
Switzerland 0.13% 0.27% -270 -227 -99 -98
Russia 0.17% 0.24% -120 -195 -98 -99
Turkey 0.03% 0.05% -3395 -3446 -100 -100
New Zealand 0.01% 0.01% -26 -30 -100 -100
Albania 0.00% 0.00% -10 -5 -100 n.a.
China 25.48% n.a. 7345 n.a. 56 n.a.
Rest of the world 37.92% 44.33% 4412 -1104 23 37
Note: the value 0 indicates that shares or net exports are smaller than 0.005% or 500 000 Euro. Source: EurObserv’ER 2018 based on data from UN - COMTRADE - exchange rate : OECD / MEI
Greece, Latvia, Finland, Turkey, Ro-mania, Lithuania and Estonia.
The above mentioned trends, however, can be quantified when looking at the net exports, i.e. the exports of an economy minus its imports. This can be interpreted as a trade balance and aims at answering the question whether a country is exporting more than it is importing and vice versa. This indicator reveals that China has a very positive trade balance (value for 2016). The value is also highly positive for the EU-28, while it is negative for the U.S. Many Euro-pean countries show positive trade balances, e.g. Denmark, Spain, Ger-many, Hungary, Belgium, Slova-kia, Slovenia and Portugal. These countries are exporting more RET goods than they are importing. The countries with the most negative trade balances are Turkey, the U.S., Continues overleaf
India, the UK, Canada and Japan. Although Japan has positive export shares, it still imports more RET related goods than it exports – in monetary terms.
In a final step, the export specialization (RCA) was analyzed. With regard to this indicator, Denmark shows the largest values, i.e. goods related to RET technologies have a large weight in Denmark's export portfolio. Positive specialization values can also be found for China (2016), Croatia, Japan, Luxembourg, Spain, Hungary and the U.S. while all other countries (besides the "rest of the world" group) show a negative specialization with regard to goods related to RET technologies in 2017.

Indicators on innovation and competitiveness
EUROBSERV !ER " THE STATE OF RENEWABLE ENERGIES IN EUROPE " #$%& EDITIONEUROBSERV !ER " THE STATE OF RENEWABLE ENERGIES IN EUROPE " #$%& EDITION
254 255
In wind power, it is clearly Den-mark that has the largest export
shares with 42%. It is followed by Germany, with export shares of nearly 25%. This implies that two thirds of worldwide exports in wind technologies originate from these two countries. When including Spain with a value of 24%, nearly 90% of all exported goods related to wind technologies come from these three EU-28 countries. In total, the EU-28 is responsible for a share of 94%. The Chinese export shares in 2016 are comparably small with 7.9% (2016). China is fol-lowed by Norway, Portugal and the United States.
This pattern can also be found in the trade balance. Here, the largest values can also be found for Den-mark, Spain , Germany and China (2016), although the value for China is comparably smaller than for the other three countries.
WIND ENERGY
With regard to the RCA, it can be observed that Denmark, Spain, Por-tugal, Norway, Estonia, Croatia and Germany are highly specialized in trade with wind technology rela-ted goods. China, on the other hand, has a negative export specia-lization in wind technology related goods in 2016; its focus seems to be more clearly on PV technologies.
Continues overleaf
Share of technology on global exports
Net exports (in ! m)
Export specialisation
(RCA)
2016 2017 2016 2017 2016 2017
EU!28 ! ! ! ! ! !
Denmark 41.80% 41.52% 2809 1800 100 100
Germany 29.32% 24.51% 1783 871 84 61
Spain 15.24% 23.64% 1007 970 97 97
Portugal 1.53% 2.36% 97 103 90 91
Estonia 0.33% 0.54% 22 24 89 89
Croatia 0.00% 0.38% -22 -11 -100 79
Ireland 0.14% 0.38% -18 9 -95 -81
Belgium 0.69% 0.35% 26 -3 -86 -98
Poland 0.06% 0.28% -20 12 -100 -96
Greece 0.35% 0.13% -195 -164 59 -62
United-Kingdom 0.08% 0.09% -301 -625 -100 -100
Italy 0.04% 0.08% -52 -20 -100 -100
Lithuania 0.02% 0.08% -5 2 -97 -82
Romania 0.01% 0.03% 1 1 -100 -99
Czechia 0.03% 0.02% 2 1 -100 -100
Finland 0.00% 0.00% -118 -71 -100 -100
Luxemburg 0.00% 0.00% 0 0 n.a. -100
Latvia 0.00% 0.00% 0 0 n.a. -100
Sweden 0.01% 0.00% -65 -33 -100 -100
Hungary 0.00% 0.00% 0 0 -100 -100
Bulgaria 0.00% 0.00% -1 0 -100 -100
Slovenia 0.00% 0.00% 0 0 n.a. -100
Cyprus 0.00% 0.00% 0 0 -100 n.a.
Slovakia 0.00% 0.00% 0 0 n.a. n.a.
Austria 0.00% n.a. -7 n.a. -100 n.a.
France 0.45% n.a. -54 n.a. -96 n.a.
Malta 0.00% n.a. -1 n.a. -100 n.a.
The Netherlands 1.13% n.a. 51 n.a. -73 n.a.
Total EU-28 (incl. Intra-EU trade) 93.03% 91.49% 4727 4951 78 75
Other Countries ! ! ! !
Norway 0.00% 3.76% -3 -46 -100 90
United States 0.22% 1.21% -98 -134 -100 -98
India 0.11% 0.34% 1 11 -99 -93
Canada 0.14% 0.02% -86 -247 -99 -100
Turkey 0.02% 0.01% -797 -223 -100 -100
Russia 0.00% 0.01% -16 -36 -100 -100
Japan 0.00% 0.01% -67 -153 -100 -100
Switzerland 0.01% 0.01% -11 0 -100 -100
New Zealand 0.02% 0.00% -2 0 -98 -100
China 7.87% n.a. 529 n.a. -49 n.a.
Rest of the world 0.38% 0.23% -2467 -1336 -100 -100
Note: the value 0 indicates that shares or net exports are smaller than 0.005% or 500 000 Euro. Source: EurObserv’ER 2018 based on data from UN - COMTRADE - exchange rate : OECD / MEI

Indicators on innovation and competitiveness
EUROBSERV !ER " THE STATE OF RENEWABLE ENERGIES IN EUROPE " #$%& EDITIONEUROBSERV !ER " THE STATE OF RENEWABLE ENERGIES IN EUROPE " #$%& EDITION
256 257
Again, in photovoltaics, the top position of China can be
confirmed. In 2016, more than 31% of worldwide exports in PV origi-nate from China. The next largest countries in this respect are Japan (15%), Germany (10.5%) and the U.S. (9%) in 2017. In sum, the EU-28 countries reach a share of 15.8%. Since the values of Germany lies at 10.5%, Germany is responsible for two thirds of the worldwide exports of the EU-28 countries.
With regard to net exports in PV, positive values can only be found for China (2016), Croatia and Luxembourg. All other countries in this comparison are importing more PV technologies than they export. The most negative trade balance can be found for the U.S., followed by Turkey and India. These countries are thus highly dependent on imports from
PHOTOVOLTAIC
other countries with regard to PV technologies. These trends are also reflected in the RCA values. Croatia is the country that is most highly specialized in goods related to PV, followed by Japan, Luxemburg, China (2016) and Ger-many, although the specialization value is negative in the case of Germany. !
Continues overleaf
Share of technology on global exports
Net exports (in ! m)
Export specialisation
(RCA)
2016 2017 2016 2017 2016 2017
EU!28 ! ! ! ! ! !
Germany 5.22% 10.55% 273 -92 -46 -14
Italy 0.67% 1.33% -118 -133 -90 -82
United-Kingdom 0.32% 0.80% -810 -304 -97 -91
Czechia 0.29% 0.57% -51 -48 -85 -75
Belgium 0.30% 0.52% -100 -112 -97 -96
Croatia 0.07% 0.35% -2 19 -24 75
Luxemburg 0.10% 0.28% 3 9 18 71
Poland 0.24% 0.25% -89 -136 -93 -96
Spain 0.12% 0.20% -56 -79 -99 -99
Slovenia 0.10% 0.16% 3 -4 -53 -40
Hungary 0.07% 0.15% -143 -176 -98 -95
Denmark 0.05% 0.12% -48 -11 -98 -96
Sweden 0.07% 0.10% -38 -41 -99 -99
Ireland 0.04% 0.10% -4 -2 -100 -99
Portugal 0.03% 0.07% -66 -73 -98 -96
Lithuania 0.04% 0.07% -1 -10 -87 -85
Slovakia 0.06% 0.07% -17 -22 -97 -98
Finland 0.02% 0.06% -41 -35 -99 -98
Romania 0.01% 0.04% -97 -85 -100 -99
Estonia 0.00% 0.01% -9 -15 -100 -98
Latvia 0.01% 0.01% -6 -4 -97 -99
Greece 0.00% 0.01% -10 -12 -100 -100
Bulgaria 0.00% 0.01% -24 -30 -100 -100
Cyprus 0.00% 0.00% -4 -6 -100 -99
Austria 0.30% n.a. -137 n.a. -81 n.a.
France 0.71% n.a. -194 n.a. -90 n.a.
Malta 0.00% n.a. -8 n.a. -100 n.a.
The Netherlands 1.52% n.a. -212 n.a. -56 n.a.
Total EU-28 (incl. Intra-EU trade) 10.39% 15.80% -2004 -1400 -82 -70
Other Countries ! ! ! !
Japan 7.36% 15.01% -817 -53 52 74
United States 4.35% 9.30% -7813 -4758 -64 -32
Canada 0.54% 0.97% -155 -163 -91 -86
India 0.24% 0.49% -2740 -2559 -96 -86
Switzerland 0.12% 0.34% -175 -132 -99 -96
Russia 0.04% 0.07% -132 -168 -100 -100
Turkey 0.02% 0.03% -2489 -3158 -100 -100
New Zealand 0.00% 0.00% -20 -19 -100 -100
Norway 0.01% 0.00% -17 -21 -100 -100
Albania 0.00% 0.00% 0 0 n.a. n.a.
China 31.36% n.a. 6852 n.a. 69 n.a.
Rest of the world 45.58% 58.00% 7305 833 40 58
Note: the value 0 indicates that shares or net exports are smaller than 0.005% or 500 000 Euro. Source: EurObserv’ER 2018 based on data from UN - COMTRADE - exchange rate : OECD / MEI

Indicators on innovation and competitiveness
EUROBSERV !ER " THE STATE OF RENEWABLE ENERGIES IN EUROPE " #$%& EDITIONEUROBSERV !ER " THE STATE OF RENEWABLE ENERGIES IN EUROPE " #$%& EDITION
258 259
In biofuels (which comprises ethyl alcohols with a strength of
80!degrees or more as well as other spirits “denatured”), a different picture emerges. Here, the U.S. fol-lowed by the EU-28 score the top position. In 2017, more than 70% of worldwide exports in biofuels originate from these two regions. Yet, also here a decline since 2016 becomes obvious for the EU, while the U.S. enlarged its export acti-vities within this field. The next largest countries in terms of trade shares are the Netherlands (2016 value), France (2016 value) the UK, Hungary and Germany. Regarding net exports in biofuels, the large positive value for the U.S. implies that the U.S. is exporting far more biofuel related technologies than they import. The next largest trade balance can be found for France (2016), Hungary and Belgium, while the most negative trade
BIOFUELS
balance can be found for Canada, Japan, China (2016) and Germany. These countries are thus highly dependent on imports from other countries with regard to biofuels. These trends are also reflected in the RCA values. Hungary is the country that is most highly specia-lized in goods related to biofuels, followed by the Netherlands (2016), the USA, France (2016), Bulgaria and Sweden.
Continues overleaf
Share of technology on global exports
Net exports (in ! m)
Export specialisation
(RCA)
2016 2017 2016 2017 2016 2017
EU!28 ! ! ! ! ! !
United-Kingdom 3.46% 6.25% -153 -66 26 48
Hungary 4.50% 5.54% 267 286 96 94
Germany 3.71% 5.13% -343 -395 -69 -70
Belgium 4.97% 5.12% 209 173 58 34
Sweden 1.66% 2.44% -70 -40 55 57
Spain 0.95% 1.97% -13 31 -57 -29
Poland 0.93% 1.41% -42 -25 -30 -27
Slovakia 0.81% 1.01% 43 47 45 34
Italy 0.69% 0.83% -85 -72 -90 -92
Czechia 0.69% 0.65% 14 -4 -39 -69
Bulgaria 0.49% 0.61% 22 26 79 71
Latvia 0.07% 0.14% -7 -4 -9 29
Lithuania 0.06% 0.12% -3 1 -75 -61
Ireland 0.10% 0.07% -43 -42 -97 -99
Denmark 0.01% 0.05% -70 -83 -100 -99
Romania 0.09% 0.04% -48 -57 -90 -99
Portugal 0.03% 0.02% -26 -19 -99 -100
Estonia 0.01% 0.02% -2 -1 -94 -95
Slovenia 0.01% 0.01% -4 -4 -100 -100
Croatia 0.01% 0.01% -5 -7 -99 -100
Luxemburg 0.00% 0.00% -1 -1 -100 -100
Greece 0.01% 0.00% -17 -20 -100 -100
Cyprus 0.00% 0.00% -1 -1 -100 -100
Finland 0.00% 0.00% -1 0 n.a. n.a.
Austria 1.58% n.a. 60 n.a. 49 n.a.
France 7.88% n.a. 402 n.a. 73 n.a.
Malta 0.00% n.a. -1 n.a. -100 n.a.
The Netherlands 8.97% n.a. -153 n.a. 82 n.a.
Total EU-28 (incl. Intra-EU trade) 41.66% 31.46% -71 -277 22 -18
Other Countries ! ! ! !
United States 29.60% 39.00% 1439 1546 82 80
Canada 0.96% 1.41% -485 -490 -74 -72
India 1.34% 1.10% -87 -111 -22 -46
Russia 0.65% 0.90% 41 48 -77 -84
Switzerland 0.04% 0.02% -63 -69 -100 -100
Japan 0.01% 0.02% -387 -407 -100 -100
Turkey 0.01% 0.01% -53 -57 -100 -100
New Zealand 0.00% 0.00% -2 -2 -100 -100
Norway 0.00% 0.00% -41 -38 -100 -100
Albania 0.00% 0.00% -2 0 -99 n.a.
China 0.35% n.a. -346 n.a. -100 n.a.
Rest of the world 25.38% 26.08% 98 -381 -17 -14
Note: the value 0 indicates that shares or net exports are smaller than 0.005% or 500 000 Euro. Source: EurObserv’ER 2018 based on data from UN - COMTRADE - exchange rate : OECD / MEI

Indicators on innovation and competitiveness
EUROBSERV !ER " THE STATE OF RENEWABLE ENERGIES IN EUROPE " #$%& EDITIONEUROBSERV !ER " THE STATE OF RENEWABLE ENERGIES IN EUROPE " #$%& EDITION
260 261
In hydro-power the picture is more balanced than in the case
of PV and wind energy. The larg-est export shares within the EU-28 can be observed for Italy (14%), Ger-many (10%), the Czechia (7%), Slo-venia (6%) and Spain (5%). In sum, the EU-28 is responsible for half of the worldwide exports within the field. This share has increased since 2016, although the shares of Aus-tria and France are missing where 9% and 5%, respectively, of export shares in hydroelec-tricity could be found in 2016.
As a single country, China shows a dominant position with a value of 24% (2016), although it is less pro-nounced than in PV. In addition, the U.S. and to a certain extent also India show compa-rably large values with 13% and 8% shares in global trade, respectively. The largest positive net export values
HYDROPOWER
within the EU-28 are displayed for Italy, Germany, the Czechia, Slo-venia and Spain. Yet, the largest value globally can be found for China (2016). India as well as the U.S. also shows a positive trade balances.
The specialization values in hydroelectricity depict a quite positive picture for Europe, where eight EU-28 members have a positive RCA value (this increases to ten when taking the 2016 values of France and Austria into account). China also shows a positive value in 2016, but its specialization in PV is still higher. However, regarding the non-European countries it is India that is most specialized.
Continues overleaf
Share of technology on global exports
Net exports (in ! m)
Export specialisation
(RCA)
2016 2017 2016 2017 2016 2017
EU!28 ! ! ! ! ! !
Italy 7.46% 13.69% 80 65 73 83
Germany 9.08% 9.95% 89 35 5 -19
Czechia 3.65% 7.24% 40 35 85 92
Slovenia 2.69% 6.44% 30 29 99 100
Spain 3.24% 4.54% 34 17 53 49
Belgium 0.39% 2.12% 4 12 -95 -48
United-Kingdom 1.34% 1.97% 9 1 -59 -56
Bulgaria 0.36% 1.42% 4 6 64 94
Romania 1.20% 0.88% 10 2 79 38
Portugal 0.52% 0.69% 2 1 36 27
Croatia 0.20% 0.43% 1 1 67 83
Poland 0.11% 0.26% 1 1 -98 -96
Sweden 0.22% 0.22% -13 -2 -89 -94
Hungary 0.24% 0.17% 3 1 -76 -94
Estonia 0.00% 0.13% 0 1 -100 0
Slovakia 0.24% 0.09% 0 0 -61 -97
Finland 0.04% 0.09% -3 -1 -98 -95
Denmark 0.03% 0.05% -1 -2 -99 -99
Lithuania 0.02% 0.01% 0 0 -98 -99
Ireland 0.00% 0.01% -1 -1 -100 -100
Greece 0.00% 0.00% 0 -34 -100 -100
Luxemburg 0.00% 0.00% -1 -1 -100 -100
Latvia 0.00% 0.00% -15 -16 -100 -100
Cyprus 0.00% 0.00% 0 0 n.a. n.a.
Austria 9.06% n.a. 91 n.a. 98 n.a.
France 5.52% n.a. 41 n.a. 51 n.a.
Malta 0.00% n.a. 0 n.a. n.a. n.a.
The Netherlands 0.35% n.a. 4 n.a. -97 n.a.
Total EU-28 (incl. Intra-EU trade) 45.99% 50.38% 410 149 31 28
Other Countries ! ! ! !
United States 4.68% 13.39% 13 29 -60 4
India 4.54% 7.53% 54 35 76 89
Japan 0.87% 5.65% 0 22 -92 -3
Russia 3.38% 2.78% -13 -39 55 -8
Switzerland 1.43% 2.16% -20 -25 -30 -15
Canada 1.46% 2.15% -51 -11 -49 -46
Turkey 0.60% 1.46% -56 -8 -39 10
Norway 0.41% 0.40% -16 -26 -33 -64
New Zealand 0.06% 0.16% -3 -8 -88 -60
Albania 0.00% 0.00% -8 -5 n.a. n.a.
China 24.40% n.a. 311 n.a. 53 n.a.
Rest of the world 12.19% 13.95% -524 -220 -72 -65
Note: the value 0 indicates that shares or net exports are smaller than 0.005% or 500 000 Euro. Source: EurObserv’ER 2018 based on data from UN - COMTRADE - exchange rate : OECD / MEI
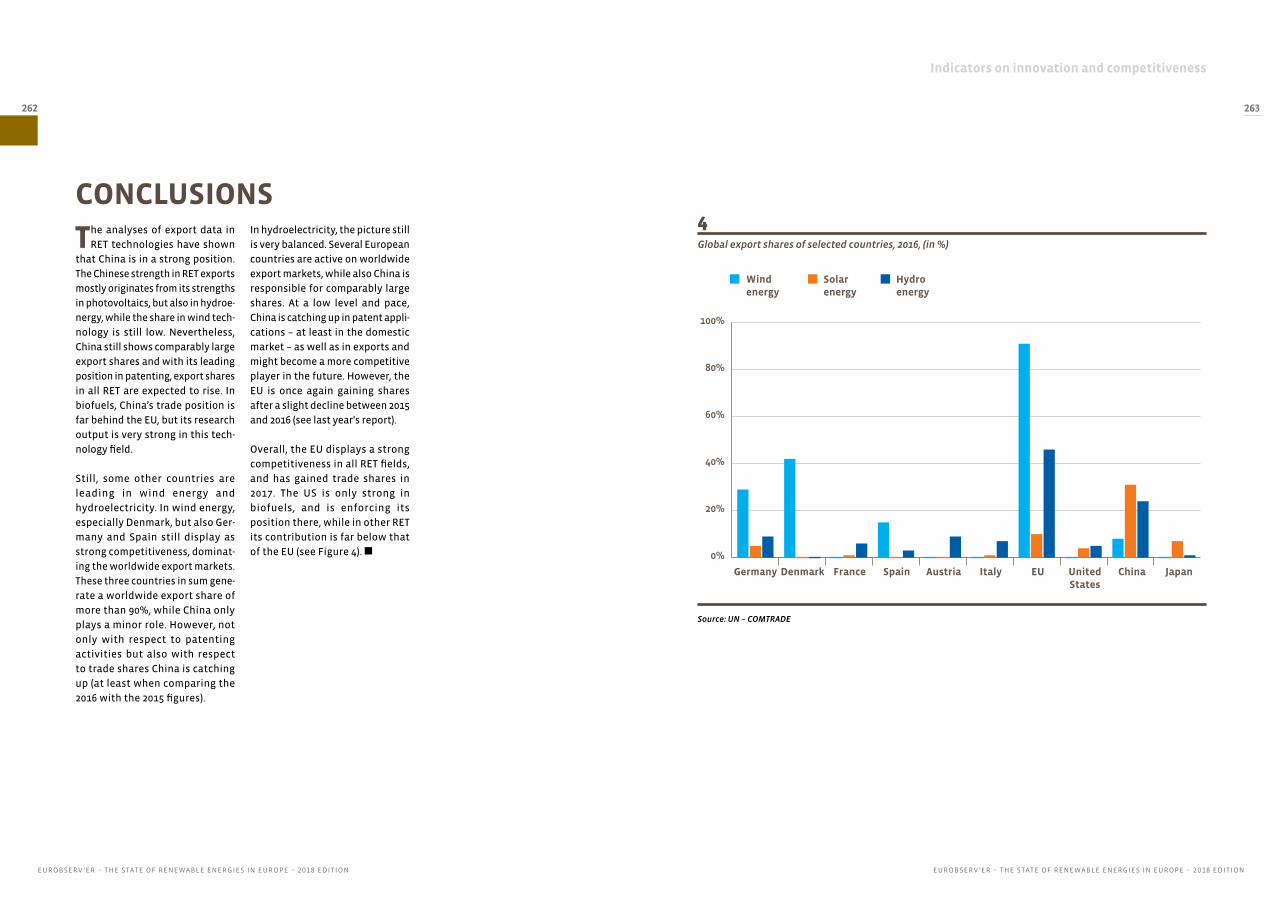
Indicators on innovation and competitiveness
EUROBSERV !ER " THE STATE OF RENEWABLE ENERGIES IN EUROPE " #$%& EDITIONEUROBSERV !ER " THE STATE OF RENEWABLE ENERGIES IN EUROPE " #$%& EDITION
262 263
The analyses of export data in RET technologies have shown
that China is in a strong position. The Chinese strength in RET exports mostly originates from its strengths in photovoltaics, but also in hydroe-nergy, while the share in wind tech-nology is still low. Nevertheless, China still shows comparably large export shares and with its leading position in patenting, export shares in all RET are expected to rise. In biofuels, China’s trade position is far behind the EU, but its research output is very strong in this tech-nology field.
Still, some other countries are leading in wind energy and hydroelectricity. In wind energy, especially Denmark, but also Ger-many and Spain still display as strong competitiveness, dominat-ing the worldwide export markets. These three countries in sum gene-rate a worldwide export share of more than 90%, while China only plays a minor role. However, not only with respect to patenting activities but also with respect to trade shares China is catching up (at least when comparing the 2016 with the 2015 figures).
CONCLUSIONSIn hydroelectricity, the picture still is very balanced. Several European countries are active on worldwide export markets, while also China is responsible for comparably large shares. At a low level and pace, China is catching up in patent appli-cations – at least in the domestic market – as well as in exports and might become a more competitive player in the future. However, the EU is once again gaining shares after a slight decline between 2015 and 2016 (see last year's report).
Overall, the EU displays a strong competitiveness in all RET fields, and has gained trade shares in 2017. The US is only strong in biofuels, and is enforcing its position there, while in other RET its contribution is far below that of the EU (see Figure 4).
Source: UN – COMTRADE
Global export shares of selected countries, 2016, (in %)
4
Germany Denmark France Spain Austria Italy ChinaUnitedStates
EU Japan
Windenergy
Solarenergy
0%
20%
40%
60%
80%
100%
Hydroenergy

264 265
Indicators on the flexibility of the electricity system
EUROBSERV !ER " THE STATE OF RENEWABLE ENERGIES IN EUROPE " #$%& EDITIONEUROBSERV !ER " THE STATE OF RENEWABLE ENERGIES IN EUROPE " #$%& EDITION
example, in situations of a simultaneous increase in demand and decrease in wind power a steep positive ramp is needed.
The mechanisms work as follows: based on forecasts of load and vRE generation plants, the remaining generation capacity is sche-duled at the day-ahead market. However, sudden changes in the supply-demand-balance, be it an unexpected decline or increase in vRE generation, or changes in load, challenge a system’s flexibility. To adjust the system to changes in vRE sup-ply and demand, different mechanisms are applicable. A mismatch could indeed be adjusted by increasing demand or decrea-sing generation (down-flexibility), or vice versa, by decreasing demand and increa-sing generation (up-flexibility). Also, unex-pected changes within one country could
Balancing of electricity supply and load is nothing new as conventional resources may fail unexpectedly and demand cannot be perfectly forecasted. Increasing vola-tile renewable energy (vRE) production e.g. wind and solar power makes balancing of generation (and load) more difficult as more adjustments are needed to ensure system sta-bility. For example, an unexpected decrease in load and simultaneously increasing wind power generation above the estimated value, requires additional flexibility adjustments. To mitigate deviations in load and power genera-tion, several flexibility options are possible. Initially, when variable renewable energy from wind power and PV plants were low, small adjustments of generation by flexible generation capacities were sufficient. Howe-ver, with increasing shares of wind or solar power this becomes more challenging. For
INDICATORS ON THE FLEXIBILITY OF THE ELECTRICITY SYSTEM
Flexibility needs of the power system
1
Source: EurObserv’ER 2018. Note: residual load is the difference between load and vRE electricity generation.
thc hc
residual loadforecasted
residual loadactual
up-flexibility:increase generation
& decrease loaddown-flexibility:
increase load& decrease generation
MW Supply Load
Downflexibility
Upflexibility
• flexible generation• flexible transmission• flexible market• flexible operation

EUROBSERV !ER " THE STATE OF RENEWABLE ENERGIES IN EUROPE " #$%& EDITION
267
Indicators on the flexibility of the electricity system
266
EUROBSERV !ER " THE STATE OF RENEWABLE ENERGIES IN EUROPE " #$%& EDITION
In a first step, situations are identified in which high flexibility in the system is required. These situations are called critical hours (hc) and are defined as hours in which the difference between forecasted and actual load and vRE generation is the largest. Thus, critical hours are those hours in which either fore-casted vRE generation is larger and forecasted load is smaller than actual (up-flexibility), or forecasted vRE generation is smaller and forecasted load is larger than actual (down-flexibility). In the first case, addi-tional power is needed either through ramping-up of dispatchable power plants, power transmission via interconnectors, via short term power trading within intraday markets as well as adjustments of operational power reserves or load. The second case, called down-flexibility, entails curtailing especially of renewable power. The latter might reduce sustai-nability and cost efficiency of generation, but it is feasible in many situations. In the first case, ram-ping-up is limited by technical requirements which differ between type of fuel, plant and modernisation status. Thus, up-flexibility is of particular interest. In the following, up-flexibility within the power system is analyzed during the identified critical hours1.
To depict the flexibility of a power system in criti-cal hours four indicators are employed that cover generation, transmission, intraday market and operational balancing. A detailed description of the methodological approach can be found under: www.eurobserv-er.org • Generation flexibility: actual used generation in the
critical hours is compared to the available flexible dispatchable power generation capacity of the res-pective countries. The available flexible capacity is defined as availability of capacities within 15 min,
i.e. all capacities that could be made available for generation adjustments within 15 min are included (up-flexibility). Thus, it depicts the technically avai-lable flexibility of the system to adjust to a situation where generation and demand are in imbalance.
• Transmission flexibility: actual exports or imports in the critical hours are compared to the available transmission capacity. Ideally, available transmis-sion capacity is a benchmarked transfer capacity at the borders. But due to data restrictions, the available transmission capacity is defined as the maximum import capacity of a country in the res-pective year.
• Market flexibility: actual intraday trade volumes in the critical hours are compared to the available maximum traded volume in the respective year. The indicator shows how far or close the intraday mar-ket in a critical situation is to the maximum traded volume, thus it shows how severe the situation is.
• Operational flexibility: actual used secondary and tertiary reserve volumes in the critical hours are compared to the maximum reserve in the respec-tive year. It is employed as a proxy for the available/contracted reserve volume.
1. Due to restriction in data availability, for 2017 no
critical hours are defined for Malta therefore it is not
further considered in this flexibility analysis. While for
Austria, the Czechia, Croatia, Hungary, Luxembourg, the
Netherlands, Poland and the United Kingdom critical
hours are defined on the basis of incomplete data sets.
In addition, data on actual generation, transmission,
intraday and reserve market are limited from case to
case for several EU countries. These limitations are
indicated at the respective chapter or figure.
Methodological note
RESULTS
In the following, the results depicted in this overview illus-trate those situations in which up-flexibility is needed, since it is constraining to guarantee energy supply. The shown blue bars visua-lize the relation of running flexible capacity during the critical hour to the estimated available flexible capacity, i.e. the percentage of used capacity within the identified critical hour. The closer the bar is to the 100% line (orange line) the
lower the remaining range of flexi-bility in the system.
GENERATION FLEXIBILITYTo measure up-flexibility, we cal-culate the share of the used dis-patchable generation capacity in critical hours to the estimated available total flexible generation. Thus, in each power system of the Member States, the available total flexible generation is estimated for all available generation tech-
nologies of the energy generation system. It is then weighted based on the ramp-up times and compa-red to the actual running flexible capacities in the critical hours of each country. The results are depic-ted in Figure 2.
Overall, all EU Member States have a sufficient range of flexibility in their generation. Even though the
be compensated by cross-border transfers, and via short-term market or demand side adjustments. Thus, not only the supply side but also the demand side, the transmission infrastructure between countries and the markets sets the framework for flexibility in the power system. All these options become
increasingly important for successfully inte-grating RE in the power system. To depict how flexible a system is, a set of indicators is applied that depict the use of flexible generation and transmission flexibility as well as the operational and market flexibi-lity (see Figure 1)
Generation flexibility in critical hours in 2016 and 2017
2
0
50
100
Flexible generation in critical hoursto available flexible generation in 2016 (%)
AT
BE
BG
CY CZ DE
DK
EE ES FI FR GR
HR
HU
IE IT LT LV NL
PL PT RO
SE SI SK UK
0
50
100
AT
BE
BG
CY CZ DE
DK
EE ES FI FR GR
HR
HU
IE IT LT LV NL
PL PT RO
SE SI SK UK
Flexible generation in critical hoursto available flexible generation in 2017 (%)
Source: EurObserv’ER 2018 - own assessment based on ENTSO-E data downloaded 10/2018. Note: no data for HR, LU and MT. Incomplete Data for BG, EE, GR, HU, NL, PT, SE and UK.

EUROBSERV !ER " THE STATE OF RENEWABLE ENERGIES IN EUROPE " #$%& EDITIONEUROBSERV !ER " THE STATE OF RENEWABLE ENERGIES IN EUROPE " #$%& EDITION
268 269
Indicators on the flexibility of the electricity system
number of countries (11) using more than 50% of their flexible generation capacity rose in 2017 compared to 2016 (5), none of them got close to the critical threshold, i.e. the 100% line. Lithuania, Portu-gal and Romania used hydro pump technology in those hours which were complemented by gas power plants. But in some countries even during critical hours, the existing generation technologies domi-nate the structure of the genera-tion mix: in France nuclear power,
Transmission up-flexibility in critical hours in 2016 and 2017
3
0
50
100
AT
BE
BG
CZ DE
DK
EE ES FI FR GR
HR
HU
IT LT LV NL
PL PT RO
SE SI SK UK
Transmission in critical hours to maximum transmission/a in 2016 (%)
0
50
100
AT
BE
BG
CZ DE
DK
EE ES FI FR GR
HR
HU
IT LT LV NL
PL PT RO
SE SI SK UK
Transmission in critical hours to maximum transmission/a in 2017 (%)
Source: EurObserv’ER 2018 - own assessment based on ENTSO-E data downloaded 10/2018. Note: no data for CY, IE, LU and MT. Incomplete Data for HU, PL, RO, SK and UK.
in Czechia lignite and nuclear power, and in Poland coal as well as lignite. Whereas Estonia, Latvia and Sweden show higher levels of used flexible capacities in 2017 than in 2016, Denmark, Finland and Italy remain below the 25%-level.
TRANSMISSION FLEXIBILITYTo illustrate the available flexibility through cross-border exchanges, the hourly import flows in critical hours are compared to the maxi-mum hourly import flows wit-
hin the respective year. Figure 3 shows the up-flexibility (imports) needed in critical hours during 2016 and 2017. The closer the bars approach the 100% line (orange line), the more available capacity of the interconnectors has been used in the critical hours, i.e. the more severe the situation was.
In 2016 and 2017, the flexibility of the power system with respect to
Pix
abay

EUROBSERV !ER " THE STATE OF RENEWABLE ENERGIES IN EUROPE " #$%& EDITIONEUROBSERV !ER " THE STATE OF RENEWABLE ENERGIES IN EUROPE " #$%& EDITION
270 271
Indicators on the flexibility of the electricity system
Market flexibility in critical hours in 2016 and 2017 Operationaly flexibility in critical hours in 2016 and 2017
4 5
0
50
100
Intraday volume traded in critical hours compared to maximum volume/a in 2016 (%)
AT
CZ DE
DK
EE ES FI FR LT LV NL
PL PT SE
0
50
100
Reserves used in critical hours compared to maximum reserves/a for up-flexibility in 2016 (%)
AT
BE
CZ DE
DK
EE ES FI FR HU
LT LV NL
PL PT RO
SE SI SK UK
0
50
100
AT
CZ DE
DK
EE ES FI FR HR
HU
IT LT LU LV NL
PL PT SE SI
Intraday volume traded in critical hours compared to maximum volume/a in 2017 (%)
0
50
100
AT
BE
CZ DE
DK
EE ES FI FR HU
IT LT LU LV NL
PL PT RO
SE SI SK UK
Reserves used in critical hours compared to maximum reserves/a for up-flexibility in 2017 (%)
Source: EurObserv’ER 2018 - own assessment based on data of power exchanges downloaded 10/2018. Note: in 2017 no intraday market was available in BG, CY, GR, IE, MT and SK. No data for BE, RO and UK. In 2016 also no data for HR, HU, IT and SI. Incomplete Data for NL. AT, DE and LU have a common market, but different critical hours.
Source: EurObserv’ER 2018 - own assessment based on ENTSO-E data downloaded 10/2018. Note: no data for BG, CY, GR, IE, HR, LU and MT. No data for IT in 2016. Trading conditions (e.g. time slots, contract volume, gate closure) vary among countries.
transmission has been broadly underemployed in the EU, except for United Kingdom where the import flows almost reached the maximum value in the critical hour – as in the year before. EU-wide, on average around 43% of the yearly maximum values were used for up-flexibility in extreme situations in both investigated years. Large countries such as Ger-many, France and Italy are in gene-ral characterized by high cross border flows. While Italy reaches
of hourly traded power volume wit-hin a year. The closer the blue bar to the orange line (100% line), the more the intraday market served as a mechanism for adjustments. Data is not available for all EU Member States.
The depicted market flexibility indicators vary between 2017 and 2016. In 2017 the highest electricity trading volume in all considered intraday markets was reached within the common German, Aus-
two thirds and France increases to around half of its interconnector capacity share in 2017, Germany lowered its power imports during their critical hours down to 16% of their top value. Finland and Poland kept their relatively high transmission flexibility share in 2017 while this indicator declined for Denmark and Sweden. Bulgaria used low transfer capacity during the analyzed critical hours in 2017 but reached shares of almost 50% in 2016. Similar, Estonia is also
trian and Luxembourgish power exchange. During critical hours the greatest value of the indica-tor was obtained in Germany in both periods. In contrast the Cze-chia, Estonia, Spain and Sweden had high shares of used market flexibility in 2016 and low ones in 2017. While Denmark, Finland, France and Portugal remained with their share in the lower half of its intraday volume, Croatia and Poland have not used any intraday trading to compensate unexpected
less active in terms of transmis-sion during their critical hours in 2017. Thus, many countries still have a large available potential for up-flexibility through cross-border transmission in their cri-tical hours.
MARKET FLEXIBILITYMarket flexibility is based on the traded intraday volumes as depic-ted in Figure 4. The bars show the market volume within the critical hours compared to the maximum
changes in load or vRE generation in 2017. This can be explained by the fact that Croatia just opened their intraday market in 2017. Poland’s share in 2016 -one third of its market volume- was already low, and further decreased in 2017.
OPERATIONAL FLEXIBILITYOperational flexibility is repre-sented by the reserve market. Here the activated reserves of power wit-

EUROBSERV !ER " THE STATE OF RENEWABLE ENERGIES IN EUROPE " #$%& EDITIONEUROBSERV !ER " THE STATE OF RENEWABLE ENERGIES IN EUROPE " #$%& EDITION
272 273
Indicators on the flexibility of the electricity system
hin the critical hours are compared to the maximum hourly volume per annum. This ratio is considered as a proxy for the remaining available flexibility volume. The bars in Figure 5 depict the shares of actual acti-vated reserves in the critical hours to the maximum available hourly volumes. The closer the bars to the orange line (100% line), the more the system relies on the operatio-nal flexibility potential in critical situations.
In general, the reserve market provides only a small share of the overall generation capacity as reserves, because the costs of holding reserve power are mostly higher than the average spot mar-ket electricity prices. Thus, there is a strong incentive to keep the use of reserves at minimum.
For 2016 and 2017, on average 40% and 32% of the maximum possible reserve power was used during critical hours, but it varies stron-gly among countries. For example, Italy used about 6% (2017) of the maximum operational reserves in the critical hours. However, it cannot be concluded that the contracted reserve volume could be cut down, because unexpected outages of conventional genera-tion capacities or network pro-blems (in addition to critical hours defined by this report) are still potential challenges to the power system, especially for countries with high loads such as Germany, France, Italy and Great Britain.
In 2017, Sweden reaches 94% of its balancing capacity and displays an increasing use of its reserve
power. Portugal and Lithuania have lowered their balancing needs during critical hours signi-ficantly. Although Italy along with Germany display the highest reserve volumes, only less than half of their potentials were acti-vated during the critical hours in 2017. For Romania, the same situa-tion applies as in 2016, i.e. it does not use its reserves to increase generation. Similarly, Lithuania and Czechia also didn’t use their up-flexibility potential of balan-cing power during their critical hours in 2017.
Oli
vier
Gu
err
in /
RTE
2010
CONCLUSIONS
Overall, in critical hours all countries dispose of suffi-cient flexibility in their system. Countries with low or high vRE shares do not display a pattern regarding the use of flexibility mechanism, rather the use of those flexibility mechanisms depends on various country spe-cific characteristics. Following the starting point of this chapter, stating that increasing vRE shares of wind and solar power make suc-cessful balancing of power supply and load more difficult, some final comparisons can be made.
Subsequently, the power system of those countries, in which the share of installed vRE capacities to total generation capacities is the highest, are of special interest of this analysis. Among them are
Germany, Denmark and the United Kingdom, which display high vRE shares in decreasing order (see Figure 6). In contrast, countries with a low share of vRE such as Latvia, Hungary and Slovakia are supposed to display a small use of flexibility mechanisms.
Figure 7 illustrates the pattern of flexibility options within the cri-tical hours of countries with high and low shares of installed vRE capacity. Both groups use flexibi-lity options during critical hours, but by differing degrees.
While in the United Kingdom, as a country with a high vRE share (34%), transmission flexibility is mainly used, Slovakia displays a similar pattern but at a lower level of use. Even though Denmark and
Hungary are characterized by high and low vRE shares, respectively, both countries demonstrate rather low levels of up-flexibility usage with respect to all four indicators. Latvia compensates unexpected changes in load and supply by generation flexibility and intraday market flexibility and Germany relies on the intraday market as an outstanding mechanism to balance volatile RE generation. It has to be noted that in Slovakia no intraday market exists, and for the United Kingdom market data were not accessible.
For a further analysis, the flexibi-lity option patterns of Germany, Spain, France and Italy in critical hours – as defined before - are
Share of volatile renewable energies (installed capacities) in 2017
6
0
25
50
Installed vRE capacities to net generating capacities in 2017 (%)
AT
BE
BG
CY CZ DE
DK
EE ES FI FR GR
HR
HU
IE IT LT LU LV NL
PL PT RO
SE SI SK UK
Source: EurObserv’ER 2018 - own assessment based on ENTSO-E data (download 10/2018).
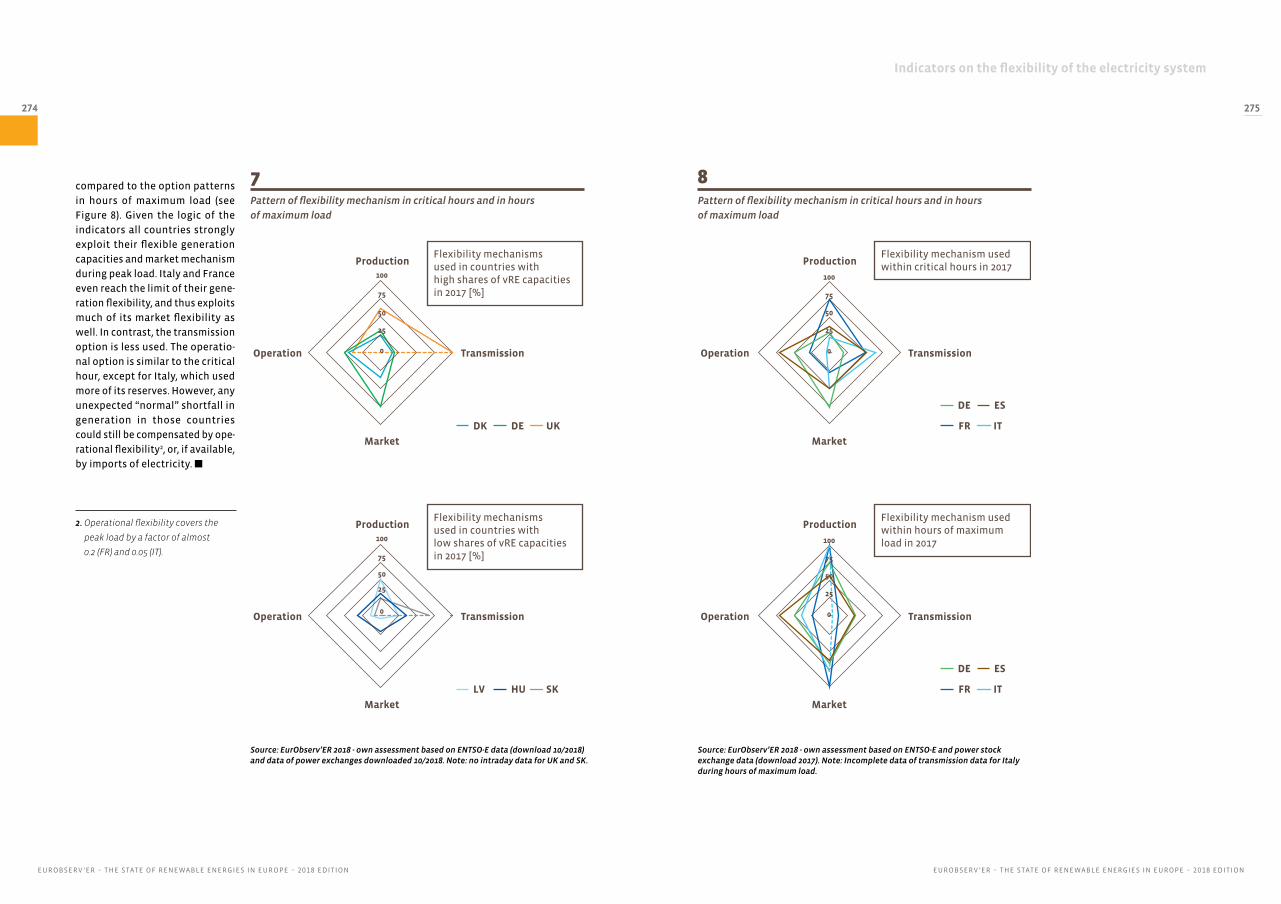
EUROBSERV !ER " THE STATE OF RENEWABLE ENERGIES IN EUROPE " #$%& EDITIONEUROBSERV !ER " THE STATE OF RENEWABLE ENERGIES IN EUROPE " #$%& EDITION
274 275
Indicators on the flexibility of the electricity system
compared to the option patterns in hours of maximum load (see Figure 8). Given the logic of the indicators all countries strongly exploit their flexible generation capacities and market mechanism during peak load. Italy and France even reach the limit of their gene-ration flexibility, and thus exploits much of its market flexibility as well. In contrast, the transmission option is less used. The operatio-nal option is similar to the critical hour, except for Italy, which used more of its reserves. However, any unexpected “normal” shortfall in generation in those countries could still be compensated by ope-rational flexibility2, or, if available, by imports of electricity.
Pattern of flexibility mechanism in critical hours and in hours of maximum load
Pattern of flexibility mechanism in critical hours and in hours of maximum load
7 8
Source: EurObserv’ER 2018 - own assessment based on ENTSO-E data (download 10/2018) and data of power exchanges downloaded 10/2018. Note: no intraday data for UK and SK.
Source: EurObserv’ER 2018 - own assessment based on ENTSO-E and power stock exchange data (download 2017). Note: Incomplete data of transmission data for Italy during hours of maximum load.
2. Operational flexibility covers the
peak load by a factor of almost
0.2 (FR) and 0.05 (IT).
DK DE
TransmissionOperation
Production
Market
UK
100
Flexibility mechanisms used in countries with high shares of vRE capacities in 2017 [%]75
50
0
25
DE ES
FR
TransmissionOperation
Production
Market
IT
100
Flexibility mechanism used within critical hours in 2017
75
50
25
0
TransmissionOperation
Production
Market
100
Flexibility mechanisms used in countries with low shares of vRE capacities in 2017 [%]75
50
0
25
LV HU SK
DE ES
FR
TransmissionOperation
Production
Market
IT
Flexibility mechanism used within hours of maximum load in 2017100
75
50
25
0

Sources
276 277
EUROBSERV !ER " THE STATE OF RENEWABLE ENERGIES IN EUROPE " #$%& EDITION
• Kleinwasserkraft Österreich – Small Hydro Association Austria (www.kleinwasserkraft.at)
• Lebensministerium – Federal Ministry of Agriculture, Forestry, Environment and Water Management (www.lebensministerium.at)
• Nachhaltig Wirtschaften (www.nachhaltigwirtschaften.at)
• Österreichischer Biomasse-Verband – Austrian Biomass Association (www.biomasseverband.at)
• OeMAG – Energy Market Services (www.oekb.at/en/energy-market/oemag/)
• ProPellets Austria – Pellets Association Austria (www.propellets.at)
• PV Austria – Photovoltaic Austria Federal Association (www.pvaustria.at)
• Statistik Austria – Bundesanstalt Statistik Österreich (www.statistik.at)
• Umweltbundesamt – Environment Agency Austria (www.umweltbundesamt.at)
• Vienna University of Technology (www.tuwien.ac.at)
BELGIUM• ATTB – Belgium Thermal Technics Association
(www.attb.be/index-fr.asp)• APERe – Renewable Energies Association
(www.apere.org)• BioWanze – CropEnergies (www.biowanze.be)• Cluster TWEED – Technologie wallonne énergie
environnement et développement durable (www.clusters.wallonie.be/tweed)
• CWaPE – Walloon Energy Commission (www.cwape.be)
• ICEDD – Institute for Consultancy and Studies in Sustainable Development (www.icedd.be)
• SPF Economy – Energy Department – Energy Observatory (www.economie.fgov.be)
• ODE – Sustainable Energie Organisation Vlaanderen (www.ode.be)
• Valbiom – Biomass Valuation ASBL (www.valbiom.be)• VEA – Flemish Energy Agency
(www.energiesparen.be)• VWEA – Flemish Wind Energy Association
(www.vwea.be)• Walloon Energie Portal (www.energie.wallonie.be)
• PV Employment (www.pvemployment.org)• PVPS – IEA Photovoltaic Power Systems
Programme (www.iea-pvps.org)• REN 21 – Renewable Energy Policy Network
for the 21st Century (www.ren21.net)• Renewable Energy Magazine
(www.renewableenergymagazine.com)• RES Legal (www.res-legal.eu)• Solar Heat Europe (http://solarheateurope.eu/)• Solarthermal World (www.solarthermalworld.org)• Sun & Wind Energy (www.sunwindenergy.com)• TNO, the Netherlands Organisation for applied
scientific research (https://www.tno.nl/en)• WWO - World Meteorological Organization
(https://public.wmo.int)• WWEA – World Wind Energy Association
(www.wwindea.org)• WWF – World Wild Life Fund (www.wwf.org)
AUSTRIA• AEE Intec – Institute for Sustainable Technologies
(www.aee-intec.at)• Austria Solar – Austrian Solar Thermal Industry
Association (www.solarwaerme.at)• ARGE Biokraft – Arbeitsgemeinschaft Flüssige
Biokraftstoffe (www.biokraft-austria.at)• Kompost & Biogas Verband – Austrian Biogas
Association (www.kompost-biogas.info)• BIOENERGY 2020+ (www.bioenergy2020.eu)• Bundesverband Wärmepumpe Austria – National
Heat-Pump Association Austria (www.bwp.at)• BMLFUW – Bundesministerium für Land- und
Forstwirtschaft, Umwelt und Wasserwirtschaft / Federal Ministry of Agriculture, Forestry, Environment and Water Management (www.bmlfuw.gv.at)
• BMVIT – Federal Ministry for Transport, Innovation and Technology (www.bmvit.gv.at)
• Dachverband Energie-Klima – Umbrella Organization Energy-Climate Protection (www.energieklima.at)
• E-Control – Energie Control (www.econtrol.at)• EEG (Energy Economics Group) / Vienna University
of Technology (www.eeg.tuwien.ac.at)• IG Windkraft – Austrian Wind Energy Association
(www.igwindkraft.at)
EUROPEAN AND INTERNATIONAL ORGANISATIONS, PRESS• AEBIOM – European Biomass Association
(www.aebiom.org)• Becquerel Institute (becquerelinstitute.org)• Biofuels Digest (www.biofuelsdigest.com)• Bloomberg
(www.bloomberg.com)• BNEF – Bloomberg New Energy Finance
(www.bnef.com)• BP/Quandl (www.quandl.com/data/BP/coal_prices)• EAFO – European Alternative Fuels Observatory
(www.eafo.eu) • CEWEP – Confederation of European Waste-to-
Energy Plants (www.cewep.eu)• EBA – European Biogas Association
(www.european-biogas.eu)• EBB – European Biodiesel Board
(www.ebb-eu.org)• European Biofuels Technology Platform
(www.biofuelstp.eu) • EC – European Commission (www.ec.europa.eu)• EC – European Commission Directorate General for
Energy and Transport (https://ec.europa.eu/info/energy-climate-change-environment_en)
• EGEC – European Geothermal Energy Council (www.egec.org)
• EHPA – European Heat Pump Association (www.ehpa.org)
• EIB – European Investment Bank (www.eib.org)
• SPE – Solar Power Europe (www.solarpowereurope.org) formerly EPIA
• ePURE – European Renewable Ethanol (www.epure.org)
• ESTELA – European Solar Thermal Electricity Association (www.estelasolar.org/)
• EU-OEA – European Ocean Energy Association (www.eu-oea.com)
• European Energy Innovation (www.europeanenergyinnovation.eu)
• European Commission, Weekly Oil Bulletin (www.ec.europa.eu/energy/en/data-analysis/weekly-oil-bulletin)
• Eurostat – Statistique européenne/European Statistics (www.ec.europa.eu/eurostat/fr) Accessed Mid February 2018
• Eurostat SHARES 2016 (Short Assesment of Renewable Energy Sources) (ec.europa.eu/eurostat/fr/web/energy/data/shares)
• European Union (www.ec.europa.eu/energy/)• EVCA – European Private Equity and Venture
Capital Association (www.evca.eu)• Know-RES (www.knowres-jobs.eu/en)• RGI – Renewables Grid Initiative
renewables-grid.eu/• Fi Compass (www.fi-compass.eu)• WindEurope (https://windeurope.org)
formerly EWEA• GEA – Geothermal Energy Association
(www.geo-energy.org)• GeoTrainNet (http://geotrainet.eu/)• GWEC – Global Wind Energy Council
(www.gwec.net)• IEA – International Energy Agency (www.iea.org)• IEA – RETD: Renewable Energy Technology
Deployment (www.iea-retd.org)• IEPD – Industrial Efficiency Policy Database
(www.iepd.iipnetwork.org)• Horizon 2020
(https://ec.europa.eu/programmes/horizon2020/)• ISF/UTS Institute for Sustainable Futures/
University of Technology Sydney (www.isf.uts.edu.au)
• JRC – Joint Research Centre, Renewable Energy Unit (www.ec.europa.eu/dgs/jrc/index.cfm)
• IRENA – International Renewable Energy Agency (www.irena.org)
• IWR – Institute of the Renewable Energy Industry (www.iwr.de)
• National Renewable Energy Action Plans (NREAPs) Transparency Platform on Renewable Energy (www.ec.europa.eu/energy/en/topics/renewable-energy)
• NIB – Nordic Investment Bank (www.nib.int)• OEC – Ocean Energy Council
(www.oceanenergycouncil.com)• OEC – OOECD/IEA Statistics Manual (2005)• Photon International – Solar Power Magazine
(www.photon.info)
SOURCES

Sources
278 279
EUROBSERV !ER " THE STATE OF RENEWABLE ENERGIES IN EUROPE " #$%& EDITION
• AFPG – Geothermal French Association (www.afpg.asso.fr)
• CDC – Caisse des Dépôts (www.caissedesdepots.fr)• Club Biogaz ATEE – French Biogas Association
(www.biogaz.atee.fr)• DGEC – Energy and Climat Department
(www.industrie.gouv.fr/energie)• Enerplan – Solar Energy organisation
(www.enerplan.asso.fr)• FEE – French Wind Energy Association
(www.fee.asso.fr)• France Énergies Marines
(www.france-energies-marines.org)• In Numeri – Consultancy in Economics and
Statistics (www.in-numeri.fr)• Observ’ER – French Renewable Energy
Observatory (www.energies-renouvelables.org)• OFATE – Office franco-allemand pour la transition
énergétique (enr-ee.com/fr/qui-sommes-nous.html)• SVDU – National Union of Treatment and Recovery
of Urban and Assimilated Waste (www.incineration.org)
• SER – French Renewable Energy Organisation (www.enr.fr)
• SDES – Observation and Statistics Office – Ministry of Ecology (www.statistiques.developpement-durable.gouv.fr)
• UNICLIMA – Syndicat des industries thermiques, aérauliques et frigorifiques (www.uniclima.fr/)
GERMANY• AA – Federal Foreign Office
(energiewende.diplo.de/home/) • AEE – Agentur für Erneuerbare Energien –
Renewable Energy Agency (www.unendlich-viel-energie.de)
• AGEB – Arbeitsgemeinschaft Energiebilanzen (www.ag-energiebilanzen.de)
• AGEE-Stat – Working Group on Renewable Energy Statistics (www.erneuerbare-energien.de)
• AGORA Energiewende – Energy Transition Think Tank (www.agora-energiewende.de)
• BAFA – Federal Office of Economics and Export Control (www.bafa.de)
• BBE – Bundesverband Bioenergie (www.bioenergie.de)
• BBK – German Biogenous and Regenerative Fuels Association (www.biokraftstoffe.org)
• B.KWK – German Combined Heat and Power Association (www.bkwk.de)
• BEE – Bundesverband Erneuerbare Energie – German Renewable Energy Association (www.bee-ev.de)
• BDEW – Bundesverband der Energie und Wasserwirtschaft e.V (www.bdew.de)
• BDW – Federation of German Hydroelectric Power Plants (www.wasserkraft-deutschland.de)
• BMUB – Federal Ministry for the Environment, Nature Conservation and Nuclear Safety (www.bmub.bund.de/en/)
• BMWi – Federal Ministry for Economics Affairs and Energy (www.bmwi.de/Navigation/EN/Home/home.html)
• BWE – Bundesverband Windenergie – German Wind Energy Association (www.wind-energie.de)
• BSW-Solar – Bundesverband Solarwirtschaft – PV and Solarthermal Industry Association (www.solarwirtschaft.de)
• BWP – Bundesverband Wärmepumpe – German Heat Pump Association (www.waermepumpe.de)
• Bundesnetzagentur – Federal Network Agency (www.bundesnetzagentur.de)
• Bundesverband Wasserkraft – German Small Hydro Federation (www.wasserkraft-deutschland.de)
• BVES – German Energy Storage Association (www.bves.de)
• CLEW – Clean Energy Wire (www.cleanenergywire.org)
• Dena – German Energy Agency (www.dena.de)• DGS – EnergyMap Deutsche Gesellschaft für
Solarenergie (www.energymap.info)• DBFZ – German Biomass Research Centre
(www.dbfz.de)• Deutsche WindGuard GmbH (www.windguard.de)• DEWI – Deutsches Windenergie Institut
(www.dewi.de)• EEG Aktuell (www.eeg-aktuell.de)• EEX – European Energy Exchange (www.eex.com) • Erneuerbare Energien
(www.erneuerbare-energien.de)• Fachverband Biogas – German Biogas Association
(www.biogas.org)• Fraunhofer-ISE – Institut for Solar Energy System
(www.ise.fraunhofer.de/)
BULGARIA• ABEA – Association of Bulgarian Energy Agencies
(www.abea-bg.org)• APEE Association of Producers of Ecological
Energy (www.apee.bg/en)• Bulgarian Wind Energy Association
(www.bgwea.eu)• CL SENES BAS – Central Laboratory of Solar Energy
and New Energy Sources (www.senes.bas.bg)• EBRD – Renewable Development Initiative
(www.ebrd.com)• Invest Bulgaria Agency
(www.investbg.government.bg)• NSI – National Statistical Institute (www.nsi.bg)• SEC – Sofia Energy Centre (www.sec.bg)• SEDA – Sustainable Energy Development Agency
(www.seea.government.bg)
CYPRUS• Cyprus Institute of Energy (www.cyi.ac.cy)• MCIT – Ministry of Commerce, Industry and
Tourism (www.mcit.gov.cy)• CERA – Cyprus Energy Regulatory Authority
(www.cera.org.cy)
CROATIA• Croatian Bureau of Statistics
(www.dzs.hr/default_e.htm)• University of Zagreb (www.fer.unizg.hr/en)• HEP – Distribution System Operator (www.hep.hr)• HROTE – Croatian Energy Market Operator
(www.hrote.hr)• Croatian Ministry of Economy (www.mingo.hr/en)
CZECHIA• MPO – Ministry of Industry and Trade – RES
Statistics (www.mpo.cz)• ERU – Energy Regulatory Office (www.eru.cz)• CzBA – Czech Biogas Association (www.czba.cz)• CZ Biom – Czech Biomass Association
(www.biom.cz)• Czech Wind Energy Association (www.csve.cz/en)
DENMARK• DANBIO – Danish Biomass Association
(www.biogasbranchen.dk)• Danish Wind Industry Association
(www.windpower.org/en)
• Energinet.dk – TSO (www.energinet.dk)• ENS – Danish Energy Agency (www.ens.dk)• PlanEnergi (www.planenergi.dk)• SolEnergi Centret – Solar Energy Centre Denmark
(www.solenergi.dk)
ESTONIA• EBU – Estonian Biomass Association (www.eby.ee)• Espel – MTÜ Eesti Soojuspumba Liit
(www.soojuspumbaliit.ee)• EWPA – Estonian Wind Power Association
(www.tuuleenergia.ee/en) • Ministry of Finance (www.fin.ee)• Ministry of Economics (www.mkm.ee)• MTÜ – Estonian Biogas Association• STAT EE – Statistics Estonia (www.stat.ee)• TTU – Tallinn University of Technology
(www.ttu.ee)
FINLAND• Finbio – Bio-Energy Association of Finland
(www.bioenergia.fi)• Finnish Board of Customs (www.tulli.fi/en)• Finnish Biogas Association
(biokaasuyhdistys.net)• Finnish Energy – Energiateollisuus (energia.fi/)• Metla – Finnish Forest Research Institute
(www.metla.fi)• Statistics Finland (www.stat.fi)• SULPU – Finnish Heat Pump Association
(www.sulpu.fi)• Suomen tuulivoimayhdistys – Finnish Wind Power
Association (www.tuulivoimayhdistys.fi)• TEKES – Finnish Funding Agency for Technology
and Innovation (www.tekes.fi/en)• Teknologiateollisuus – Federation of Finnish
Technology Industries (www.teknologiateollisuus.fi)
• University of Eastern Finland (www.uef.fi)• VTT – Technical Research Centre of Finland
(www.vtt.fi)
FRANCE• ADEME – Environment and Energy Efficiency
Agency (www.ademe.fr)• AFPAC – French Heat Pump Association
(www.afpac.org)

Sources
280 281
EUROBSERV !ER " THE STATE OF RENEWABLE ENERGIES IN EUROPE " #$%& EDITION
• CDP – Cassa depositi e prestiti (www.cassaddpp.it)• COAER ANIMA – Associazione costruttori di
apparecchiature ed impianti aeraulici (www.coaer.it)
• Consorzio italiano biogas – Italian Biogas Association (www.consorziobiogas.it)
• Energy & Strategy Group – Dipartimento diIngegneria gestionale, politecnico di Milano (www.energystrategy.it)
• ENEA – Italian National Agency for New Technologies (www.enea.it)
• Fiper – Italian Producer of Renewable Energy Federation (www.fiper.it)
• GIFI – Gruppo imprese fotovoltaiche italiane (www.gifi-fv.it/cms)
• GSE – Gestore servizi energetici (www.gse.it)• ISSI – Instituto sviluppo sostenible Italia • ITABIA – Italian Biomass Association
(www.itabia.it)• MSE – Ministry of Economic Development
(www.sviluppoeconomico.gov.it)• Ricerca sul sistema energetico (www.rse-web.it)• Terna – Electricity Transmission Grid Operator
(www.terna.it)• UGI Unione geotermica italiana
(www.unionegeotermica.it)
LATVIA• CSB – Central Statistical Bureau of Latvia
(www.csb.gov.lv)• IPE – Institute of Physical Energetics
(www.innovation.lv/fei)• LATbioNRG – Latvian Biomass Association
(www.latbionrg.lv)• LBA – Latvijas Biogazes Asociacija
(www.latvijasbiogaze.lv)• LIIA – Investment and Development Agency
of Latvia (www.liaa.gov.lv) • Ministry of Economics (www.em.gov.lv)
LITHUANIA• EA – State Enterprise Energy Agency (www.ena.lt/en)• LAIEA – Lithuanian Renewable Resources Energy
Association (www.laiea.lt) • LBDA – Lietuvos Bioduju Asociacija
(www.lbda.lt)• LEEA – Lithuanian Electricity Association
(www.leea.lt)• LEI – Lithuanian Energy Institute (www.lei.lt)
• LHA – Lithuanian Hydropower Association (www.hidro.lt)
• Lietssa (www.lietssa.lt)• LITBIOMA – Lithuanian Biomass Energy
Association (www.biokuras.lt)• LIGRID AB – Lithuanian Electricity Transmission
System Operator (www.litgrid.eu)• LS – Statistics Lithuania (www.stat.gov.lt)• LWEA – Lithuanian Wind Energy Association
(www.lwea.lt)
LUXEMBURG• Enovos (www.enovos.eu)• NSI Luxembourg – Service central de la statistique
et des études économiques• STATEC – Institut national de la statistique et des
études économiques (www.statec.public.lu)
MALTA• WSC – The Energy and Water Agency
(https://energywateragency.gov.mt)• MEEREA – Malta Energy Efficiency & Renewable
Energies Association (www.meerea.org)• MIEMA – Malta Intelligent Energy Management
Agency (www.miema.org)• Ministry for Energy and Health (energy.gov.mt)• MRA – Malta Resources Authority
(www.mra.org.mt)• NSO – National Statistics Office (www.nso.gov.mt)• University of Malta – Institute for Sustainable
Energy (www.um.edu.mt/iet)
NETHERLANDS• Netherlands Enterprise Agency (RVO) (www.rvo.nl)• CBS – Statistics Netherlands (www.cbs.nl)• CertiQ – Certification of Electricity (www.certiq.nl)• ECN – Energy Research Centre of the Netherlands
(www.ecn.nl)• Holland Solar – Solar Energy Association
(www.hollandsolar.nl)• NWEA – Nederlandse Wind Energie Associatie
(www.nwea.nl)• Platform Bio-Energie – Stichting Platform
Bio-Energie (www.platformbioenergie.nl)• Stichting Duurzame Energie Koepel
(www.dekoepel.org)• Vereniging Afvalbedrijven – Dutch Waste
Management Association (www.verenigingafvalbedrijven.nl)
• Fraunhofer-IWES – Institute for Wind Energy and Energy System Technology (www.iwes.fraunhofer.de/en.html)
• FNR – Fachagentur Nachwachsende Rohstoffe – Agency for Sustainable Resources (international.fnr.de/)
• FVEE –!Forschungsverbund Erneuerbare Energien!– Renewable Energy Research Association (www.fvee.de)
• GTAI – Germany Trade and Invest (www.gtai.de)• GtV – Bundesverband Geothermie
(www.geothermie.de)• GWS – Gesellschaft für Wirtschaftliche
Strukturforschung (www.gws-os.com/de)• KfW – Kreditanstalt für Wiederaufbau
(www.kfw.de)• RENAC – Renewables Academy AG (www.renac.de)• UBA – Federal Environmental Agency
(Umweltbundesamt) (www.umweltbundesamt.de)• UFOP – Union for the Promotion of Oil and Protein
plants e.V (www.ufop.de) • VDB – German Biofuel Association
(www.biokraftstoffverband.de)• VDMA – German Engineering Federation
(www.vdma.org)• WI – Wuppertal Institute for Climate, Environment
and Energy (www.wupperinst.org)• ZSW – Centre for Solar Energy and Hydrogen
Research Baden-Württemberg (www.zsw-bw.de)
GREECE• CRES – Center for Renewable Energy Sources and
Saving (www.cres.gr)• DEDDIE – Hellenic Electricity Distribution Network
Operator S.A. (www.deddie.gr)• EBHE – Greek Solar Industry Association
(www.ebhe.gr)• HELAPCO – Hellenic Association of Photovoltaic
Companies (www.helapco.gr)• HELLABIOM – Greek Biomass Association c/o CRES
(www.cres.gr)• HWEA – Hellenic Wind Energy Association
(www.eletaen.gr)• Ministry of Environment, Energy
and Climate Change (www.ypeka.gr)• Small Hydropower Association Greece
(www.microhydropower.gr)• LAGIE – Operator of Electricity Market S.A.
(www.lagie.gr)
HUNGARY• Energiaklub – Climate Policy Institute
(www.energiaklub.hu/en)• Energy Centre – Energy Efficiency, Environment
and Energy Information Agency (www.energycentre.hu)
• Ministry of National Development (www.kormany.hu/en/ministry-of-national-development)
• Hungarian Heat Pump Association (www.hoszisz.hu)
• Magyar Pellet Egyesület – Hungarian Pellets Association (www.mapellet.hu)
• MBE – Hungarian Biogas Association (www.biogas.hu)
• MGTE – Hungarian Geothermal Association (www.mgte.hu/egyesulet)
• Miskolci Egyetem – University of Miskolc Hungary (www.uni-miskolc.hu)
• MMESZ – Hungarian Association of Renewable Energy Sources (https://hipa.hu/renewable)
• Naplopó Kft. (www.naplopo.hu)• SolarT System (www.solart-system.hu)
IRELAND• Action Renewables (www.actionrenewables.org)• EIRGRID (www.eirgridgroup.com/)• IRBEA – Irish Bioenergy Association (www.irbea.org)• Irish Hydro Power Association (www.irishhydro.com)• ITI – InterTradeIreland (www.intertradeireland.com)• IWEA – Irish Wind Energy Association
(www.iwea.com)• REIO – Renewable Energy Information Office
(www.seai.ie/Renewables/REIO)• SEAI – Sustainable Energy Authority of Ireland
(www.seai.ie)
ITALY• AIEL – Associazione Italiana Energie Agroforestali
(www.aiel.cia.it)• ANEV – Associazione Nazionale Energia del Vento
(www.anev.org)• FIPER – Associazione Produttori Energia da Fonti
Rinnovabili (www.fiper.it)• Assocostieri – Unione produttorri biocarburanti
(www.assocostieribiodiesel.com)• Assosolare – Associazione nazionale dell’industria
solar fotovoltaica (www.assosolare.org)• Assotermica (www.anima.it/ass/assotermica)

Sources
282 283
EUROBSERV !ER " THE STATE OF RENEWABLE ENERGIES IN EUROPE " #$%& EDITION
• IDAE – Institute for Diversification and Saving of Energy (www.idae.es)
• INE – Instituto nacional de estadística (www.ine.es)
• Ministry of Industry, Tourism and Trade (www.minetad.gob.es)
• OSE – Observatorio de la sostenibilidad en España (www.forumambiental.org)
• Protermosolar – Asociación española de la industria solar termoeléctrica (www.protermosolar.com)
• Red eléctrica de Espana (www.ree.es)
UNITED KINGDOM• ADBA – Anaerobic Digestion and Biogas
Association – Biogas Group (UK) (www.adbiogas.co.uk)
• BHA – British Hydropower Association (www.british-hydro.org)
• BSRIA – The Building Services Research and Information Association (www.bsria.co.uk/)
• BEIS – Department for Business, Energy & Industrial Strategy (https://www.gov.uk/government/statistics/energy-trends-section-6-renewables)
• DUKES – Digest of United Kingdom Energy Statistics (www.gov.uk/government)
• GSHPA – UK Ground Source Heat Pump Association (www.gshp.org.uk)
• HM Revenue & Customs (www.hmrc.gov.uk)• National Non-Food Crops Centre
(www.nnfcc.co.uk)• MCS – Microgeneration Certification Scheme
(www.microgenerationcertification.org)• Renewable UK – Wind and Marine Energy
Association (www.renewableuk.com)• Renewable Energy Centre
(www.TheRenewableEnergyCentre.co.uk)• REA – Renewable Energy Association (www.r-e-a.net)• RFA – Renewable Fuels Agency (www.data.gov.uk/
publisher/renewable-fuels-agency)• Ricardo AEA (www.ricardo-aea.com)• Solar Trade Association (www.solar-trade.org.uk)• UKERC – UK Energy Research Centre
(www.ukerc.ac.uk)
SLOVAKIA• ECB – Energy Centre Bratislava Slovakia
(www.ecb2.sk)• Ministry of Economy of the Slovak Republic
(www.economy.gov.sk)• SAPI – Slovakian PV Association (www.sapi.sk)• Slovak Association for Cooling and Air
Conditioning Technology (www.szchkt.org)• SK-BIOM – Slovak Biomass Association
(www.4biomass.eu/en/partners/sk-biom)• SKREA – Slovak Renewable Energy Agency, n.o.
(www.skrea.sk)• SIEA – Slovak Energy and Innovation Agency
(www.siea.sk)• Statistical Office of the Slovak Republic
(portal.statistics.sk)• The State Material Reserves of Slovak Republic
(www.reserves.gov.sk/en)• Thermosolar Ziar ltd (www.thermosolar.sk)• URSO – Regulatory Office for Network Industries
(www.urso.gov.sk)
SLOVENIA• SURS – Statistical Office of the Republic of
Slovenia (www.stat.si)• Eko sklad – Eco-Fund-Slovenian Environmental
Public Fund (www.ekosklad.si)• ARSO – Slovenian Environment Agency
(www.arso.gov.si/en/)• JSI/EEC – The Jozef Stefan Institute – Energy
Efficiency Centre (www.ijs.si/ijsw)• Tehnolo"ka platforma za fotovoltaiko –
Photovoltaic Technology Platform (www.pv-platforma.si)
• ZDMHE – Slovenian Small Hydropower Association (www.zdmhe.si)
SWEDEN• Avfall Sverige – Swedish Waste Management
(www.avfallsverige.se)• Energimyndigheten – Swedish Energy Agency
(www.energimyndigheten.se)• SCB – Statistics Sweden (www.scb.se)• SERO – Sveriges Energiföreningars Riks
Organisation (www.sero.se)• SPIA – Scandinavian Photovoltaic Industry
Association (www.solcell.nu)• Energigas Sverige (www.energigas.se)• Uppsala University (www.uu.se/en/)
• Bosch & Van Rijn (www.windstats.nl)• Stichting Monitoring Zonnestroom
(www.zonnestroomnl.nl)
POLAND• CPV – Centre for Photovoltaicsat Warsaw
University of Technology (www.pv.pl)• Energy Regulatory Office (www.ure.gov.pl)• Federation of Employers Renewable Energy Forum
(www.zpfeo.org.pl)• GUS – Central Statistical Office (www.stat.gov.pl)• IEO EC BREC – Institute for Renewable Energy
(www.ieo.pl)• IMinistry of Energy, Renewable and Distributed
Energy Department (https://www.gov.pl/web/energia)
• National Fund for Environmental Protection and Water Management (www.nfosigw.gov.pl)
• SPIUG – Polish heating organisation (www.spiug.pl/)
• PBA – Polish Biogas Association (www.pba.org.pl)• PGA – Polish Geothermal Association
(www.pga.org.pl)• PIGEO – Polish Economic Chamber of Renewable
Energy (www.pigeo.org.pl)• POLBIOM – Polish Biomass Association
(www.polbiom.pl)• PORT PC – Polska Organizacja Rozwoju Technologii
Pomp Ciep#a (www.portpc.pl)• POPiHN – Polish Oil Industry and Trade
Organisation (www.popihn.pl/)• PSG – Polish Geothermal Society
(www.energia-geotermalna.org.pl)• PSEW – Polish Wind Energy Association
(www.psew.pl)• TRMEW – Society for the Development of Small
Hydropower (www.trmew.pl)• THE – Polish Hydropower Association (PHA)
(www.tew.pl)
PORTUGAL• ADENE – Agência para a energia (www.adene.pt)• APESF – Associação portuguesa de empresas de
solar fotovoltaico (www.apesf.pt)• Apisolar – Associação portuguesa da indústria
solar (www.apisolar.pt)• Apren – Associação de energies renováveis
(www.apren.pt)
• CEBio – Association for the Promotion of Bioenergy (www.cebio.net)
• DGEG – Direcção geral de energia e geologia (www.dgeg.pt)
• EDP – Microprodução (www.edp.pt)• SPES – Sociedade portuguesa de energia solar
(www.spes.pt)
ROMANIA• CNR-CME – World Energy Council Romanian
National Committee (www.cnr-cme.ro)• ECONET Romania (www.econet-romania.com/)• ENERO – Centre for Promotion of Clean and
Efficient Energy (www.enero.ro)• ICEMENERG – Energy Research and Modernising
Institute (www.icemenerg.ro)• ICPE – Research Institute for Electrical Engineering
(www.icpe.ro)• INS – National Institute of Statistics (www.insse.ro)• Romanian Wind Energy Association (www.rwea.ro)• RPIA – Romanian Photovoltaic Industry
Association (rpia.ro)• University of Oradea (www.uoradea.ro)• Transelectrica (www.transelectrica.ro)
SPAIN• AEE – Spanish Wind Energy Association
(www.aeeolica.org)• AEBIG – Asociación española de biogás
(www.aebig.org)• AIGUASOL – Energy Consultant
(www.aiguasol.coop)• APPA – Asociación de productores de energías
renovables (www.appa.es)• ASIF – Asociación de la Industria Fotovoltaica
(www.asif.org)• ASIT – Asociación solar de la industria térmica
(www.asit-solar.com)• ANPIER – Asociación nacional de productores-
inversores de energías renovables (www.anpier.org)
• AVEBIOM – Asociación española de valorización energética de la biomasa (www.avebiom.org/es/)
• CNMC – Comisión nacional de los mercados y la competencia (www.cnmc.es)
• FB – Fundación Biodiversidad (www.fundacion-biodiversidad.es)
• ICO – Instituto de crédito oficial (www.ico.es)

Sources
284 285
EUROBSERV !ER " THE STATE OF RENEWABLE ENERGIES IN EUROPE " #$%& EDITION
• Svensk Solenergi – Swedish Solar Energy Industry Association (www.svensksolenergi.se)
• Svensk Vattenkraft – Swedish Hydropower Association (www.svenskvattenkraft.se)
• Svensk Vindenergi – Swedish Wind Energy (www.svenskvindenergi.org)
• Swentec – Sveriges Miljöteknikråd (www.swentec.se)
• SVEBIO – Svenska Bioenergiföreningen / Swedish Bioenergy Association (www.svebio.se)
• SKVP – Svenska Kyl & Värmepumpföreningen (skvp.se/) (formely SVEP)
• European Commission, Weekly Oil Bulletin, https://ec.europa.eu/energy/en/data-analysis/weekly-oil-bulletin
• BP http://tools.bp.com/energy-charting-tool OECD/IEA Statistics Manual (2005)
• Eurostat, http://ec.europa.eu/eurostat• Renewable energy in Europe 2018, European
Environment Agency (EEA) - https://www.eea.europa.eu/publications/renewable-energy-in-europe-2018
• Aghion, P./Howitt, P. (1993): A model of growth through creative destruction. In: Foray, D./Freeman, C. (eds.): Technology and the wealth of Nations. London: Pinter Publisher, 145-172.
• Balassa, B. (1965): Trade Liberalisation and Revealed Comparative Advantage, The Manchester School of Economics and Social Sciences, 33, 99-123.
• Dosi, G./Soete, L. (1983): Technology Gaps and Cost-Based Adjustment: Some Explorations on the Determinants of International Competitiveness, Metroeconomica, 35, 197-222.
• Dosi, G./Soete, L. (1991): Technical Change and International Trade. In: Dosi, G./Freeman, C./Nelson, R./Silverberg, G./Soete, L. (eds.): Technical Change and Economic Theory. London: Pinter Publishers, 401-431.
• Freeman, C. (1982): The Economics of Industrial Innovation. London: Pinter Publishers.
• Grupp, H. (1998): Foundations of the Economics of Innovation - Theory, Measurement and Practice. Cheltenham: Edward Elgar.
• Krugman, P. (1979): A Model of Innovation, Technology Transfer, and the World Distribution of Income, Journal of Political Economy, 87, 253-266.
• Leamer, E.E. (1980): The Leontief Paradox, Reconsidered, Journal of Political Economy, 88, 495-503.
• Leontief, W. (1953): Domestic Production and Foreign Trade; The American Capital Position Re-Examined, Proceedings of the American Philosophical Society, 97, 332-349.
• Martinez, C. (2011): Patent families: When do different definitions really matter?, Scientometrics, 86, 39-63.
• Moed, H.F./Glänzel, W./Schmoch, U. (eds.) (2004): Handbook of Quantitative Science and Technology Research. The Use of Publications and Patent Statistics in Studies of S&T Systems. Dordrecht: Kluwer Academic Publisher.
• Nelson, R.R./Romer, P.M. (1996): Science, Economic Growth, and Public Policy. In: Smith, B.L.R./Barfield, C.E. (eds.): Technology, R&D, and the Economy. Washington D.C.: The Brookings Institution.
• Posner, M.V. (1961): International Trade and Technical Change, Oxford Economic Papers, 13, 323-341.
• Romer, P.M. (1990): Endogenous Technological Change, Journal of Political Economy, 98, S71-S102.
• Vernon, R. (1966): International Investment and International Trade in the Product Cycle, Quarterly Journal of Economics, 80, 190-207.
• Vernon, R. (1979): The Product Cycle Hypothesis in a New International Environment, Oxford Bulletin of Economics & Statistics, 41, 255-267.
• European Commission, Weekly Oil Bulletin, https://ec.europa.eu/energy/en/data-analysis/weekly-oil-bulletin
• BP http://tools.bp.com/energy-charting-tool OECD/IEA Statistics Manual (2005)
• Eurostat, http://ec.europa.eu/eurostat• Renewable energy in Europe 2018, European
Environment Agency (EEA) - https://www.eea.europa.eu/publications/renewable-energy-in-europe-2018
• Elbersen, B., Staritsky, I., Hengeveld,G., Jeurissen, L., Lesschen, J.P. Panoutsou C. (2016): Outlook of spatial biomass value chains in EU28. Deliverable 2.3 of the Biomass Policies project.
• JRC, 2018, Tsiropoulos I., Tarvydas, D., Zucker, A., Cost development of low carbon energy technologies - Scenario-based cost trajectories to 2050, 2017 Edition, EUR 29034 EN, Publications Office of the European Union, Luxembourg, 2018, ISBN 978-92-79-77479-9, doi:10.2760/490059, JRC109894
• Eurostat, http://ec.europa.eu/eurostat (2018)
REFERENCES FOR AVOIDED FOSSIL FUEL USE AND RESULTING AVOIDED COSTS
REFERENCES FOR THE INDICATORS ON INNOVATION AND COMPETITIVENESS
REFERENCES FOR RENEWABLE ENERGY COSTS, REFERENCE PRICES AND COMPETITIVENESS

286 287
EUROBSERV !ER " THE STATE OF RENEWABLE ENERGIES IN EUROPE " #$%& EDITION
EUROBSERV!ER BAROMETERS ONLINE
All EurObserv’ER barometers can be downloaded in PDF format at the following address:
www.eurobserv-er.org

288
EUROBSERV !ER " THE STATE OF RENEWABLE ENERGIES IN EUROPE " #$%& EDITION
For more extensive information pertaining to the EurObserv’ER barometers, please contact:
Diane Lescot, Frédéric TuilléObserv’ER 146, rue de l’UniversitéF – 75007 ParisTél.: + 33 (0)1 44 18 73 53Fax: + 33 (0)1 44 18 00 36E-mail: [email protected]: www.energies-renouvelables.org
Schedule for the 2019 EurObserv’ER barometers
Wind power >> February 2019
Photovoltaic >> April 2019
Solar thermal & CSP >> June 2019
Biofuels >> September 2019
Ocean energies >> November 2019
Solid biomass >> December 2019
INFORMATION
Editorial director: Vincent Jacques le SeigneurDeputy editor-in-chief: Timothée BongrainEditorial coordination: Romain DavidEditors: Observ’ER (FR), ECN part of TNO (NL), RENAC (DE), Frankfurt School of Finance and Management (DE), Fraunhofer ISI (DE) and Statistics Netherlands (NL)Translation: Odile Bruder, Shula TennenhausGraphic design: Lucie Baratte/kaleidoscopeye.comProduction: Marie Agnès Guichard, Alice GuillierPictograms: bigre! et Lucie Baratte/kaleidoscopeye.comCover photo credit: EDF - Marc DidierPrinted by Imprimerie Graphius, March 2019ISSN 2555-0195

O%&'()’ER146, rue de l’Université
F–75007 ParisTél. : +33 (0)1 44 18 00 80
www.energies-renouvelables.org
O!"#$%’ER146, rue de l’Université
F–75007 ParisTél. : +33 (0)1 44 18 00 80
www.energies-renouvelables.org


