NASA Contractor Report 2951 Effects of Grazing Flow on the Steady-State Flow Resist and Acoustic Impedance of Thin Porous-Faced Liners :a A. S. Hersh and B. Walker CONTRACT NAS 1 - 143 10 JANUARY 19 7 8
Transcript
NASA Contractor Report 2951
Effects of Grazing Flow on the Steady-State Flow Resist and Acoustic Impedance of Thin Porous-Faced Liners
:a
A. S. Hersh and B. Walker
CONTRACT NAS 1 - 143 10 JANUARY 19 7 8
I" - TECH LIBRARY KAFB, NM
NASA Contractor Report 2951
Effects of Grazing Flow on the Steady-State Flow Resistance and Acoustic Impedance of Thin Porous-Faced Liners
A. S. Hersh and B. Walker Hersh Acoustical Engineering Chatsworth, California
Prepared for Langley Research Center under Contract NAS 1- 14 3 l o
3.1 Experimental Apparatus ........................... 17 3.2 Test Results ..................................... 18 3.3 Derivation o f Semi-Empirical Prediction Model .... 19
4 . ACOUSTIC IMPEDANCE TESTS .............................. 22 4.1 Two-Microphone Method and Test Set-up ............ 22 4.2 Test Results ..................................... 24 4.3 Derivation of Non-Grazing Flow Impedance Predic-
tion Model ....................................... 26 5 . CONCLUSIONS ........................................... 29
5.1 Steady-State Flow Resistance ..................... 30 5.2 Acoustic Impedance ............................... 30 REFERENCES ............................................ 32 TABLES ................................................ 34 FIGURES ............................................... 40 APPENDIX A . Correction t o Measured Incident Sound
Pressure Level Due to Acoustic Radiation From the Test Specimen ................... 72
iii
SUMMARY
The results of an investigation of the effects of grazing flow on the steady-state flow resistance and acoustic impedance of seven Feltmetal and three Rigimesh thin porous-faced liners are presented. A state-of-the-art review of previous nongrazing flow studies is also presented. The steady-state flow resistance of the ten specimens were measured using standard fluid mechanical experimental techniques. The acoustic impedance was measured us- ing the two-microphone method. The principal findings of the study are (1) the effects of grazing flow were measured and found to be small, ( 2 ) small differences were measured between steady- state and acoustic resistance, ( 3 ) a semi-empirical model'was derived that correlated the steady-state resistance data of the seven Feltmetal liners and the face-sheet reactance of both the Feltmetal and Rigimesh liners.
These findings suggest that nongrazing flow steady-state flow resistance tests could provide considerable insight into the acoustic behavior of porous liners in a grazing flow environment.
1. INTRODUCTION
Sound absorbent treatments consisting of cavity-backed por- ous faced liners are currently being used to control internally generated machinery noise. For application to the inlet and ex- haust ducting of jet engines, the efficient design of the liner should incorporate the effects of both high grazing flow veloci- ties and intense sound pressure levels. Unfortunately, there have been few investigations of the effects of grazing flow and sound pressure on the relationship between the liner impedance and its construction (i.e., sheet thickness, porosity, fiber diameter, etc). The purpose of this report is to describe the results of a fundamental investigation of the effects of grazing flow and sound pressure on the steady-state flow resistance (here- in referred to for brevity as d.c. resistance) and the specific acoustic impedance (i.e., resistance and reactance) of ten cavity- backed porous-faced specimens. The acoustic measurements were made using the two-microphone method. This method was used by Hersh and Walker' to study the effects of grazing flow and sound pressure level on the'impedance of isolated orifices.
Feder and Dean2 studied experimentally the effects of graz- ing flow and sound pressure on the d.c. resistance and acoustic impedance of a variety of acoustic liner configurations including porous-faced liners. The acoustic measurements were conducted using an impedance tube. They concluded that the d.c. and a.c. resistance increased and the reactance decreased with increasing grazing flow velocity and sound pressure level. The correlation between the d.c. and a.c. resistance for three porous-faced mat- erials at a fixed grazing flow speed and sound pressure level was found to be generally poor; the a.c. resistance values were con- sistantly higher (e.g., an a.c. value of 600rayls vs. a d.c. value
of about 37ORayls for a Feltmetal specimen) than the correspond- ing d.c. values. Feder and Dean did not interpret their results physically.
P. Dean3 used the two-microphone method to measure the effects of grazing flow on the impedance of cavity-backed per- forates and porous faced liners. His results were in contrast with Feder and Dean’s results in that the acoustic resistance of some materials did not change while other decreased with increas- ing grazing flow; the reactance i n c r e a s e d with increasing grazing flow. Dean offered no explanation. Plumblee, et. a14 also in- vestigated experimentally the effects of grazing flow on porous- face materials using the two-microphone method. Since the graz- ing flow speeds never exceeded 15 m/sec., they found no signifi- cant change in impedance. None of these studies investigated the nonlinear behavior o f porous-faced materials.
The present understanding of the connection between porous material properties and a.c. and d.c. impedance for nongrazing flow is reviewed in Section 2 . The results of an experimental and analytical investigation of the d.c. resistance and the a.c. impedance of ten porous-faced liners are described in Section 3 and 4 respectively. The major findings of the report are summar- ized in Section 5.
DEFINITION OF SYMBOLS
Symbol Definition
A cross-section area, (meter2) a
b
C
Cf CO
average spacing between fissures (meters) ; also constant average slit height of fissure (meters); also constant speed of sound (meters/second) skin friction coefficient numerical coefficient (see E q . 9)
CD drag coefficient D
f
diameter of porous specimen (meters); also drag (Newtons) frequency (Hz)
g gravitational constant (meters/seconds2) H height of duct containing specimen (meters) h complex wave number within porous material
(meter<’)
2
Definition
material permeability constant (meters2) material hydraulic conductivity constant (meter/se,cond) ; also compressibility mod- ulus ( = - ap'/2pf-1/Newtons/meters2) thickness of porous specimen (meters); also length scale characterizing interac- tion between cylinders (meters); also depth of cavity (meters) length scale characterizing thickness of unsteady viscous layer (meters) material structure factor (ratio of effec- tive density of the air in the pore space to the actual density po of the air) material specific internal area (meters') number of fibers or capillaries static pressure upstream o f specimen (Newtons/meter2) static pressure in test section (Newtons/ meter') total pressure in test section (Newtons/ meter2) material porosity steady-state pressure (Newtons/meters2) acoustic pressure (Newtons/meters2) pressure drop across specimen (N/m2) volume flow, (meters3/second) average hydraulic radius (meters) acoustic resistance (Rayls-mks) steady-state flow resistance (Rayls-mks) Reynolds number radial distance '(meters) spacing between cylinders (meters) time(seconds) material tortuosity longitudinal component of velocity (meters/ second) test section speed (meters/second) volume of cavity (meters3)
Po
Symbol
k K
L
Lch
m
M N
PS
PT
P P P' AP Q
Rac Rdc Re r S
R
t T U
vm v
3
Definition
average flow speed incident to porous mat- erial (meters/second) acoustic velocity (meters/sec) reactance (Rayls-mks) axial and/or longitudinal coordinate (meters) normal and/or lateral coordinate (meters) width of test section containing specimen (meters) ; characteristic (complex) impedance of porous material (Rayls-mks) constant defined by Eq. (46) constant; also attenuation constant (metergl) probability distribution function constant; also phase constant(degrees/meters )
average cylinder diameter (meters); also average pore diameter (meters) parameter defined by Eq. (26) steady-state and acoustic density (kilograms/ meters3) velocity potential (meters2/second) ratio of specific heat of air material thickness (meter) wall shear stress (Newtons/meter2) sound wavelength (meters) phase change across specimen (degrees) fluid coefficient of viscosity (kilograms/ second/meter) fluid kinematic viscosity (meters2/second) radian frequency (Hz) effective compressibility of the air within the porous material (Newtons/meters2)
Symb o 1
VD
r P , P ’
Y Y T
V
w
IC
Subscripts
( 10 ( )c inc cav S
t
denotes open quantity denotes closed quantity incident cavity along stream tube direction face-sheet
4
Superscripts Definition
( 1 ' denotes acoustic quantity
2. REVIEW OF D.C. AND A.C. IMPEDANCE PREDICTION MODELS
In contrast to the sparse number of investigations of the effects' of grazing flow on the d.c. and a.c. impedance of porous- faced materials, there have been a large number of investigations of their nongrazing flow behavior. A review of the more impor- tant papers is given below to provide background information necessary to place in perspective the results of the present in- vestigation. The d.c. models are described in Section 2.1 followed by the a.c. models in Section 2.2.
2.1 D.C. Models
The review of the d.c. resistance models is divided into linear and nonlinear parts. The linear models represent varia- tions and/or refinements of Darcy's Law'. Darcy was the first to establish a linear connection between the deriving pressure gradient Ap across a porous specimen and the average flow speed VD approaching the specimen. For sufficiently high average speeds, the connection between Ap and VD is nonlinear due to a quadratic relation between Ap and VD. Most of the details of the various models described below are based on the excellent review by Bear6.
2.1.1 Linear Models
In 1856 Darcy investigated the flow of water in vertical homogeneous sand filters in connection with the fountains of the city of Dijon, France. From his experiments, he concluded that the volume rate of flow Q through. the filter was proportional to the product of the cross-sectional area of the filter A and the pressure difference across i.t (Ap) and inversely proportional to the filter length (L) leading to the relationship
where the constant K is called the material hydraulic conductiv- ity, p is the density of the water and g is the gravitational constant. Later researchers separated the influence of the ma- terial from that of the fluid by defining K = pgk/p where p is the viscosity of the fluid and k is the specific permeability of the porous material. Substituting this expression for K into Eq. (1) yields the modern form of Darcy's Law,
5
I
where VD is the average flow speed approaching the porous mater- ial.
A particularly attractive and straight-forward application of Darcy's Law is to model a porous material as a collection of straight capillary tubes. Applying Hagen-Poisseuille's law to the flow through a capillary tube of radius 6, Scheidegger' de- rived the following connection between VD and Ap,
Comparing Eqs. (2) and ( 3 ) , the permeability constant k = 62/32 for a capillary tube. If there are N tubes per unit cross- section of the model (normal to the direction of flow) then the porosity P = N(.rrS2/4) and the filter speed through the porous material is
What is important in Eq. ( 4 ) is that the filter speed is propor- tional to the product of the square of the average tube diameter 6 2 and the material porosity P; the coefficient 1/32 is obviously unimportant.
Scheidegger generalized the capillary model described above by replacing the porous material with a distribution of capillar- ies of different diameters. He introduced the quantity a(6)dB to represent the fraction of capillaries having radii between 6 and 6+d6. Assuming that the volume occupied by these capillaries parallel, say, to the Xi direction, is 1/3PAxia(b)d6 per unit cross-section, the average filter speed VD is Xi
where VD (6) is the average speed in the capillaries of diameter 6 given 6$ Eq. ( 3 ) . Comparing Eqs. ( 5 ) and (2) yields for the permeability constant
6
Scheidegger also generalized the above model by permitting -the capillary tubes to be tortuous (i.e., non-straight) and of var- iable diameter. He proposed the following expression for k,
Here T is the "tortuosity" factor defined as the ratio of the length of the actual flow to the thickness of the porous material.
Irmay' applied the capillary model to predict the resistance of narrow fissures (i.e., slits of constant width), a fractured rock being the closest application of his approach. Irmay derives the following expression Eor the permeability,
k = a' P3/12 (1 -P)'=Pb2/12
where b is the average slit height of the fissure and a is the average spacing between fissures. Here the material porosity P = b/(a+b).
In 1927, Kozenyg applied the concept of hydraulic radius R to connect the permeability constant k to the material properties. Defining R as the ratio of volume of a conduit to its wetted sur- face area, he derived R = P/M, where M is the specific surface area of the porous material. Using this definition, R may be interpreted as the average hydraulic radius of quite complicated flow channels. By solving the Navier-Stokes equations for all channels passing through a cross-section normal to the flow, Kozeny derived the following expression for the material permea- bility constant k,
where co is a numerical coefficient called Kozeny's constant (co = 0 . 5 , 0 . 5 6 2 , 0.597, 0 .667 for a circle, square, equilateral trlangle, and rectangle respectively).
Recently theoretical estimates of the permeability constant have been derived using a drag model. The idea here is that the pressure drop through a material is related to internal shear (tangential) and normal (pressure) stresses by assuming that a porous material can be modelled as a collection of closely packed
7
spheres. For example, Rumer and Dr inke r" and l a t e r Rumerll d e r i v e d t h e f o l l o w i n g e x p r e s s i o n f o r t h e m a t e r i a l p e r m e a b i l i t y c o n s t a n t ,
where d i s t h e p o r o u s m a t e r i a l a v e r a g e d i a m e t e r , X i s a c o e f f i - c i e n t t h a t t a k e s i n t o a c c o u n t t h e e f f e c t s o f n e i g h b o r i n g s p h e r e s ( f o r a s i n g l e s p h e r e i n a n i n f i n i t e f l u i d X = 37r) and B i s a shape f a c t o r ( 6 = 7 ~ / 6 f o r a s p h e r e ) .
Ibe ra l l12 a s sumed t ha t h igh ly po rous ma te r i a l s cou ld be model led as a c o l l e c t i o n o f r a n d o m l y o r i e n t a t e d c i r c u l a r c y l i n d r i - c a l f i b e r s o f t h e same d iame te r . He then de r ived an expres s ion f o r t h e m a t e r i a l p e r m e a b i l i t y by assuming t h a t t h e p r e s s u r e d r o p necessa ry t o ove rcome t he v i scous d rag i s l i n e a r l y a d d i t i v e f o r a l l o f t h e f i b e r s . The i d e a h e r e i s t h a t t h e a v e r a g e s p e e d i s s u f f i c i e n t l y l o w , t h e p r e s s u r e d r o p a c r o s s t h e m a t e r i a l i s equal t o t h e v i s c o u s d r a g o f t h e f i b e r s . S i n c e I b e r a l l i g n o r e d i n t e r - a c t i o n s b e t w e e n f i b e r s , h i s a n a l y s i s i s r e s t r i c t e d t o l a r g e s e - pa ra t ion d i s t ances be tween f i be r s and hence t o h igh po ros i ty m a t e r i a l s .
I b e r a l l assumed t h a t g i v e n n f i b e r s o f u n i t l e n g t h p e r uni t volume, n/3 o f them w i l l b e o r i e n t a t e d p e r p e n d i c u l a r t o t h e l o c a l u p s t r e a m v e l o c i t y VD. Using Lamb's13 c a l c u l a t i o n o f t h e d r a g p e r u n i t l e n g t h f o r a c y l i n d e r p e r p e n d i c u l a r t o a s t ream, I b e r a l l d e r i v e d t h e f o l l o w i n g e x p r e s s i o n f o r a c r o s s a specimen
where 6 i s t h e a v e r a g e r a d i u s o f t h e f i b e r s . and (21 ) t he pe rmeab i l i t y k i s
k = 3 P d 2 . 2- Ln (Re) 16 (1 - P) 4 - ln (Re)
t h e p r e s s u r e d r o p
(11)
Comparing Eqs. (11)
(12)
Equation (12) i s unusual because it shows t h a t t h e m a t e r i a l p e r - m e a b i l i t y i s n o t o n l y a f u n c t i o n o f t h e m a t e r i a l p r o p e r t i e s b u t i s a l s o a f u n c t i o n o f the f l u i d i n e r t i a t h r o u g h t h e R e y n o l d s number . Sche idegger7 sugges ts tha t the d rag theory may r e p r e s e n t a g e n e r a l i z a t i o n o f Darcy 's Law.
8
I
2 . 1 . 2 Nonlinear Models
F o r t h e l i n e a r r e l a t i o n s h i p b e t w e e n Ap and V t o b e v a l i d , the Reynolds number cha rac t e r i z ing t he f l ow th rougg t he po rous m a t e r i a l must be extremely small . A s used here , the Reynolds number i s d e f i n e d a s Re = VDG/PV where VD/P i s t h e a v e r a g e v e l o c i t y i n t h e m a t e r i a l a n d 6 the average pore d iameter of t h e m a t e r i a l . The Reynolds number can be i n t e r p r e t e d a s a measu re o f t he r e l a - t ive impor tance be tween iner t ia and v i scous forces . To show t h i s , c o n s i d e r f l o w o v e r a n i s o l a t e d c y l i n d e r o f r a d i u s 6 . By n o n d i m e n s i o n a l i z i n g a l l l e n g t h c h a n g e s b y t h e c y l i n d e r d i a m e t e r 6 and a l l v e l o c i t y c h a n g e s by t h e Zoea2 ups t r eam ve loc i ty VD/P, i t f o l l o w s t h a t t h e o r d e r - o f - m a g n i t u d e o f a t y p i c a l n o n l i n e a r term puau/ax i s ( p / 6 ) ( V D / P ) ~ a n d t h a t t h e o r d e r - o f - m a n i t u d e o f a t y p i c a l s h e a r s t r e s s t e r m i s p a 2 u / a y 2 - p v D 3 / V P Q . The r a t i o of t h e n o n l i n e a r i n e r t i a l t o v i scous t e rms i s VD&/PV=Re.
I t i s c l e a r t h a t t h e f l o w w i t h i n a porous mater ia l cannot be accurately modelled by a c o l l e c t i o n o f s t r a i g h t , c o n s t a n t a r e a , c a p i l l a r y t u b e s . A more r e a l i s t i c model would have t o i n c o r p o r - a t e b o t h t w i s t i n g f u l l y t h r e e - d i m e n s i o n a l m o t i o n w i t h t h e f l u i d a c c e l e r a t i n g a n d d e c e l e r a t i n g w i t h i n t h e m a t e r i a l . R e c o g n i z i n g t h i s S c h e i d e g g e r b e l i e v e s t h a t t h e o n s e t o f n o n l i n e a r i t y f i r s t occu r s due t o Zaminar f low tu rn ing and f l u i d a c c e l e r a t i o n s and d e c e l e r a t i o n s . A t h i g h e r s p e e d s , n o n l i n e a r l o s s e s a r i s e d u e t o turbuZenee g e n e r a t e d w i t h i n t h e p o r o u s m a t e r i a l . A c c o r d i n g t o t h e r e v i e w b y B e a r , i n i t i a l d e v i a t i o n s f r o m D a r c y ' s l i n e a r l a w occur for Reynolds number a s low a s Re = 0 . 1 . The d e v i a t i o n s i n c r e a s e f o r i n c r e a s i n g R e y n o l d s number. These deviat ions are b e l i e v e d t o a r i s e f rom the onse t o f l amina r non l inea r i ty a s d i s - cussed above. The onse t o f t u rbu lence gene ra t ed non l inea r i ty does not occur unt i l Reynolds numbers between 60 t o 1 5 0 . I n g e n e r a l , t h e f o l l o w i n g r e l a t i o n s h i p b e t w e e n Ap and VD c h a r a c t e r - i z e t h e d . c . r e s i s t a n c e ,
Here a i s p r o p o r t i o n a l t o 1-1 and i ndependen t o f t he f l u id dens i ty p and b i s p r o p o r t i o n a l t o p and independent of 1-1.
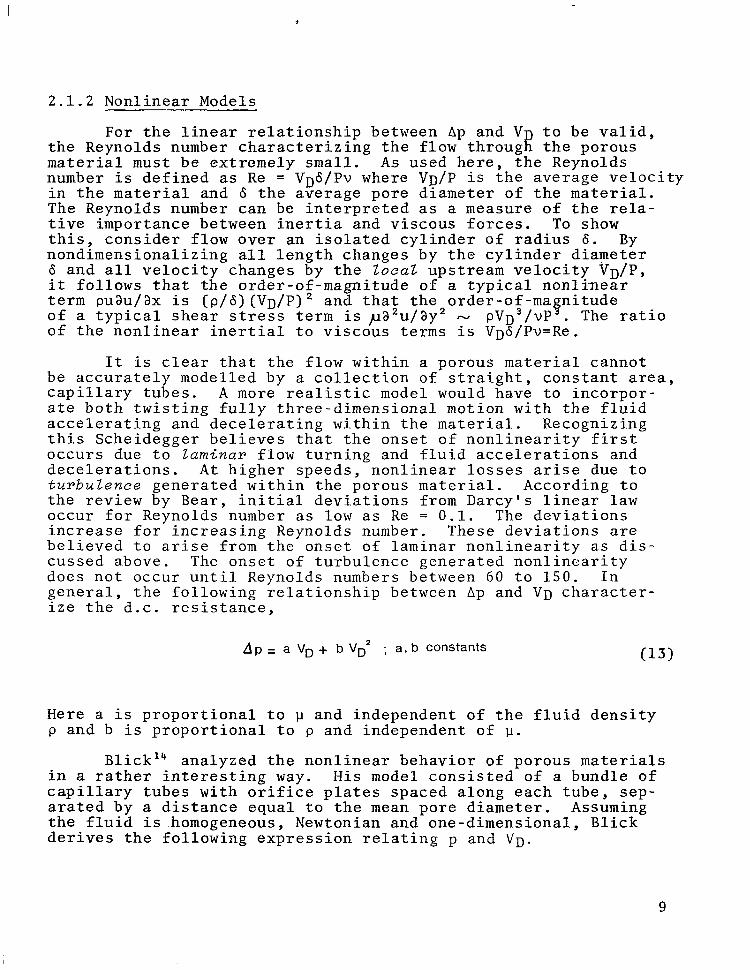
Bl ick14 ana lyzed t he non l inea r behav io r o f po rous ma te r i a l s i n a r a t h e r i n t e r e s t i n g way. H i s model c o n s i s t e d o f a bundle o f c a p i l l a r y t u b e s w i t h o r i f i c e p l a t e s s p a c e d a l o n g e a c h t u b e , s e p - a r a t e d by a d i s t a n c e e q u a l t o t h e mean pore d iameter . Assuming t h e f l u i d i s homogeneous, Newtonian and one-dimensional, Blick d e r i v e s t h e f o l l o w i n g e x p r e s s i o n r e l a t i n g p and VD.
9
where cf is the skin friction coefficient of the flow along the tube walls of constant diameter 6, Re=VD6/vP is the diameter based Reynolds number and CD is the drag coefficient of the ori- fice plate. Blick’s model 1s important because it shows quali- tatively the nature and form of nonlinear pressure losses. For a detailed discussion of other models, the reader is referred to the review by Bear.
This review o f flow nonlinearity concludes by quoting from Bear’s review. “Cheaveteau and T h i r r i ~ t ~ ~ p e r f o r m e x p e r i m e n t s in severaZ two-dimens ionaZ modeZs tha t permi t v i s u a 2 o v s e r v a t i o n s of s t r e a m Z i n e s a n d s t r e a k z i n e s . In a t y p i c a Z m o d e l , w h i c h h a s t h e shape o f a c o n d u i t t h a t d i v e r g e s a n d c o n v e r g e s a Z t e r n a t e Z y , t h e y o b s e r v e s t r e a k z i n e s . For Re<2, t h e fZow obeys Darcy’s law and t h e s t r e a m Z i n e s r e m a i n f i x e d . As Re i n c r e a s e s , s t r e a m Z i n e s s t a r t t o s h i f t and f i x e d e d d i e s b e g i n t o a p p e a r in t h e d i v e r g i n g a r e a s o f t h e modeZ. They become Zarger a s Re i n c r e a s e s . A t Re=75 t u r b u Z e n c e a p p e a r s a n d s t a r t s t o s p r e a d o u t a s Re i n c r e a s e s . TurbuZence covers some 5 0 % of t he fZow domain a t Re=l lS and 100% of it a t Re=180. The d e v i a t i o n f r o m D a r c y ’ s Zaw is o b s e r v e d a t Re=2-3 . Thus t he dev ia t ion f rom Darcy ’ s l aw a s t h e v e l o c i t y i n - c r e a s e s i s a s s o c i a t e d w i t h g r a d u a l s h i f t i n g of streamZines due t o t h e c u r v a t u r e o f t h e m i c r o s c o p i c s o Z i d waZZs of t h e p o r e space . I’
2.2 Acoustic Models
Despite widespread application o f porous materials as sound absorbers, surprisingly little fundamenta l research has been con- ducted in the past twenty years to understand their acoustic be- havior. Most of the recent research has been applications orien- tated in the sense that existing parameters used to define the important physical properties, namely structure factor, bulk mod- ulus of compressibility and dynamic flow resistance are measured or assumed known. The results of three investigations are re- viewed below representing the pioneering work of Scott16, Zwikker and Kosten17 and Morse1*. These three are believed to adequately summarize the state-of-the-art. None of the investigators consid- ered the acoustic nonlinear behavior of porous materials.
Scott was one o f the first to be concerned with the propa- gation o f acoustic disturbances in porous materials. He assumed the porous material to be homogeneous, isotropic and sufficiently large in extent s o that reflected waves were negligible. He
10
further assumed that the porous material consisted of very many small fibers or particles packed together so as to leave between them interconnected air-spaces or pores of irregular shape. De- fined in this way, the linearized equations of motion for sound waves propagating through the pore space are obtained. The lin- earized conservation of momentum equation becomes
where m is the ratio of the effective density of the air in the pore space to the actual density po of the air (called the struc- ture factor by other 'investigators), p' is the acoustic pressure, Ra.c. is a dynamic resistance constant analogous to the d.c. resistance used in Darcy's law, P is the material porosity and VD is the vector velocity approaching the porous material. The corresponding linearized mass conservation equation is given by
By introducing the acoustic velocity potent'ial vD=grad I$, Scott derives the following linearized wave equation
with
The quantity h is the complex propagation constant within the mat- erial and K is the effective compressibility of the air in the pore spaces. By introducing the complex density p ' defined as
h 2 K p ' r - P W 2
11
S c o t t d e r i v e d t h e wave e q u a t i o n i n a f o r m s i m i l a r t o t h e wave e q u a t i o n i n f r e e s p a c e . The r e m a i n d e r o f h i s p a p e r d e s c r i b e s t h e u s e o f a p robe t ube t o measu re t he r ea l and imag ina ry pa r t s o f t h e p r o p a g a t i o n c o n s t a n t h . W r i t i n g h = D - i a , t h e d e c a y o f i n t e n s i t y w i t h d i s t a n c e p r o v i d e s a measurement of the a t tenua- t i o n c o n s t a n t a. The co r re spond ing change i n phase o f t he a c o u s t i c p r e s s u r e w i t h d i s t a n c e p r o v i d e s a measuremnt of the wavelength , and therefore o f 6. With h s p e c i f i e d , t h e complex d e n s i t y p ' follows immediately from Eq. (19 ) .
Scot t compares h i s theory wi th measurements o f a v a r i e t y o f rock -woo l po rous s amples o f d i f f e ren t t h i cknesses . A t f = 2 0 0 H z , he conc ludes t ha t fo r a r o c k wool sample, the effec- t i v e d e n s i t y o f t h e a i r t r a p p e d w i t h i n t h e p o r e s was roughly twice i t s f r e e a i r v a l u e ; it dec reased t o about 1 .32 a t f = 4 0 0 0 Hz. His measurements a lso showed t h a t a t f = 2 0 0 H z , t h e dynamic r e s i s t a n c e was equa l t o i t s d . c . v a l u e . The speed o f sound var ied f rom c o / y a t low f r e q u e n c i e s t o co a t t h e h i g h e r f r e q u e n c i e s , t h u s i n d i c a t i n g t h a t low frequency sound propagat- e s i s o t h e r m a l l y and h i g h f r e q u e n c y a d i a b a t i c a l l y . S c o t t ' s paper i s obvious ly impor tan t . H i s d e s i r e t o r ecas t t he sound p ropaga - t i o n e q u a t i o n s i n a f o r m e q u i v a l e n t t o t h a t i n f r e e s p a c e i s u n d e r s t a n d a b l e . U n f o r t u n a t e l y , i n t h e p r o c e s s o f f o r c i n g t h e ana logy , he a s we l l a s Zwikker and Kosten may have induced work- e r s i n t h e f i e l d i n t o b e l i e v i n g t h a t t h e e f f e c t i v e mean d e n s i t y of sound waves propagat ing in porous mater ia ls i s a f u n c t i o n o f t h e s t r u c t u r e f a c t o r m y p o r o s i t y P , f l ow r e s i s t ance Rdec , and f requency w . I n r e a l i t y t h e mean d e n s i t y o f t h e a i r i s c o n s t a n t s ince t he a i r can be cons ide red i ncompress ib l e . Whi l e m y P , r and w a f f e c t t h e s o u n d p r e s s u r e , d e n s i t y a n d v e l o c i t y , t h e y do n o t a f f e c t mean d e n s i t y . T h i s i s most e v i d e n t a t low f r e q u e n c i e s where t h e a . c . r e s i s t a n c e i s e q u a l t o t h e d . c . f l o w r e s i s t a n c e . A t t h e low p a r t i c l e s p e e d s , g e n e r a t e d by the sound waves, the i n c i d e n t s o u n d d r i v i n g p r e s s u r e c a n n o t i n c r e a s e t h e a i r - d e n s i t y - c l e a r l y t h e p r o c e s s i s incompress ib l e . Thus i n t e r p r e t a t i o n s o t h e r t h a n i n c r e a s e s i n t h e f l u i d mean d e n s i t y a r e r e q u i r e d .
In 1 9 4 9 , Zwikker and Kosten published their famous book e n t i t l e d , Sound A b s o r b i n g M a t e r i a l s , w h i c h d e a l t i n p a r t w i t h t h e connec t ion be tween t he quan t i t i e s h and p ' a n d t h e m a t e r i a l s t r u c - t u r a l p r o p e r t i e s . Zwikker and Kosten (herein referred t o Z 6 K) i n t roduced t he fo l lowing a s sumed so lu t ion desc r ib ing t he p ropaga - t i o n o f a plane sound wave i n a homogeneous i s o t r o p i c medium ex- t end ing t o i n f i n i t y ,
p' (x, t)=Ae - a x + i (u t -ax )
1 2
where a i s t h e a t t e n u a t i o n c o n s t a n t o f the sound wave, B=w/c i s the co r re spond ing phase cons t an t ( c is t h e p h a s e v e l o c i t y o f t h e sound wave i n t h e m a t e r i a l ) a n d A i s a n a r b i t r a r y a m p l i t u d e . A second cons tan t is d e f i n e d , c a l l e d W, t h e c h a r a c t e r i s t i c (complex) impedance o f t h e i n f i n i t e e x t e n t m a t e r i a l , W=p' ( x , t ) / v x ' ( x , t ) . Here vx'(x,t) i s t h e s o u n d p a r t i c l e s p e e d i n t h e x - d i r e c t i o n w i t h i n t h e m a t e r i a l . W i s def ined as -where K=(ap ' /ap t ) /po i s r e l a t e d t o t h e complex speed o f sound i n t h e m a t e r i a l . W i s com- p l e x due t o i n t e r n a l m a t e r i a l damping of the p ropagat ing sound wave; it d e n o t e s t h a t a c o u s t i c d e n s i t y v a r i a t i o n s w i t h i n t h e m a t - e r i a l a r e n o t i n p h a s e w i t h t h e d r i v i n g p r e s s u r e v a r i a t i o n . There are two l i m i t i n g c a s e s i n w h i c h p ' a n d p t v i b r a t e i n p h a s e w i t h o t h e r . I n t h e f i rs t limit, the sound f requency i s s u f f i - c i e n t l y low t h a t t h e t r a n s m i s s i o n o f h e a t t o and from t h e s o l i d frame i s rapid enough s o t h a t t h e e n c l o s e d a i r i s k e p t a t c o n s t a n t t empera tu re ( i so the rma l ca se ) . A t h i g h f r e q u e n c i e s , t h e t r a n s - miss ion of hea t i s s o slow t h a t t h e a i r v i b r a t e s a d i a b a t i c a l l y . Between t h e s e limits h y s t e r e s i s , o c c u r r i n g b e t w e e n t h e i n s t a n t a n - eous hea t ing and cool ing o f t h e a i r by t he sound f i e ld and t he s u b s e q u e n t t r a n s f e r o f h e a t t o and f r o m t h e m a t e r i a l , r e s u l t s i n a frequency dependent complex propagat ion constant .
The c o n t i n u i t y a n d momentum conserva t ion equat ions govern- ing the mot ion o f t h e sound waves a r e , r e s p e c t i v e l y ,
where P i s t h e m a t e r i a l p o r o s i t y , Rac t h e m a t e r i a l a . c . r e s i s t a n c e and m t h e s t r u c t u r e c o n s t a n t . F o r low f r e q u e n c y o s c i l l a t i o n s (-<<1) Ra.c.ERd.c. The q u a n t i t y R d a c . f o l l o w s from Poise- u i l l e ' s law governing the behavior of s t e a d y - s t a t e f l o w i n c a p i l - l a ry t ubes , name ly
where 6 i s t h e a v e r a g e m a t e r i a l p o r e r a d i u s . Fo r high f requency o s c i l l a t i o n s (->>I) , -
1 3 !
- . -.- , "
Z 6 K o f f e r t h e f o l l o w i n g i n t e r p r e t a t i o n o f t h e t e r m m/P t h a t m u l t i p l i e s t h e d e n s i t y po o f t h e f ree a i r i n t h e momentum equa t ion . They s p l i t t h e f a c t o r i n t o two p a r t s , m and 1 / P . The q u a n t i t y m i s t h o u g h t t o c o n s i s t o f two par ts , one of which i s r e l a t e d t o t h e i n t e r n a l f r i c t i o n o f t h e a i r , t h e o t h e r t o t h e I
o r i e n t a t i o n o f t h e m a t e r i a l p o r e s . A t h i r d p a r t a l s o e x i s t s , t h e i n e r t i a o f t h e s t r u c t u r a l m a t e r i a l , b u t Z 6 K f e e l t h a t i n m o s t c a s e s t h i s e f f e c t i s small.
O f t h e v a r i o u s c o n t r i b u t o r s t o m t h e p o r e o r i e n t a t i o n i s the mos t impor tan t . Z 6 K show t h a t it c o n t a i n s t h e f a c t o r ( l / cos20) . Fo r r andomly o r i en ta t ed po res m-3. Accord ing t o ex- pe r imen t s , m has va lues ly ing be tween 3 and 7 . By i n t r o d u c i n g the appa ren t ( complex ) dens i ty de f ined a s
t h e e q u a t i o n s o f m o t i o n f o r a t r a v e l i n g wave i s b r o u g h t i n t o t h e un ive r sa l fo rm,
where
Zwikker and Kosten’s book i s a n a c c u r a t e s t a t e - o f - t h e - a r t summary o f t h e a c o u s t i c a l u n d e r s t a n d i n g o f p o r o u s m a t e r i a l s through 1 9 4 9 . Fo l lowing Sco t t , t he au tho r s chose t o c a s t t h e form o f t h e e q u a t i o n s o f m o t i o n i n t o a universa l form - i . e . , s i m i l a r i n form t o t h e e q u a t i o n s o f m o t i o n d e s c r i b i n g t h e p r o p a g a t i o n o f sound i n a i r . Thus t h e i r i n t e r p r e t a t i o n s s u f f e r t h e same l i m i t a - t i o n s a s t h o s e o f S c o t t .
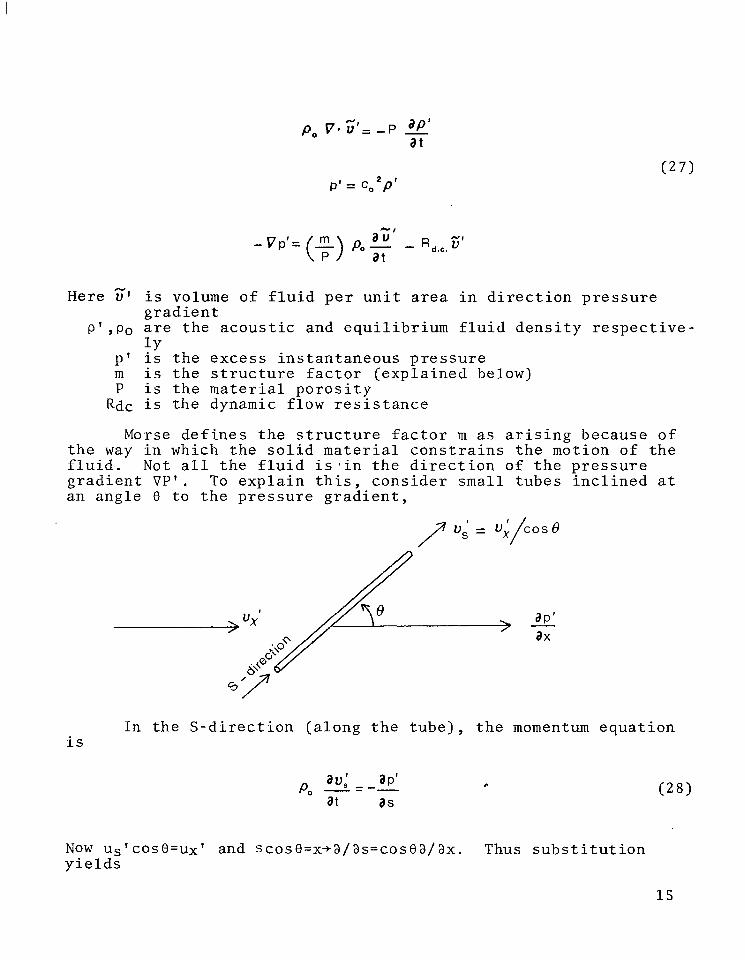
Morse extends the approach adopted by Zwikker 6 Kosten ( f i r s t g l r e sen ted by Ray le igh )” and by S c o t t , Morse and B o l t 2 ’ , Beranek 6 o t h e r s t o model t he p ropaga t ion o f sound i n g ranu la r media. He assumes tha t a l l of t he g ra ins have rough ly t he same d iame te r . He d e r i v e s t h e f o l l o w i n g e q u a t i o n s g o v e r n i n g t h e sound motion i n t h e g r a n u l a r m a t e r i a l ,
1 4
.. .
Here z1 i s volume o f f l u i d p e r u n i t a r e a i n d i r e c t i o n p r e s s u r e g r a d i e n t
1 Y p ' , p o a r e t h e a c o u s t i c a n d e q u i l i b r i u m f l u i d d e n s i t y r e s p e c t i v e -
p ' i s t h e e x c e s s i n s t a n t a n e o u s p r e s s u r e m i s t h e s t r u c t u r e f a c t o r ( e x p l a i n e d below) P i s t h e m a t e r i a l p o r o s i t y
Rdc i s the dynamic f l o w r e s i s t a n c e
Morse d e f i n e s t h e s t r u c t u r e f a c t o r m a s a r i s i n g b e c a u s e o f t h e way i n wh ich t he so l id ma te r i a l cons t r a ins t he mo t ion o f t h e f l u i d . Not a l l t h e f l u i d i s a i n t h e d i r e c t i o n o f t h e p r e s s u r e g r a d i e n t V P ' . To e x p l a i n t h i s , c o n s i d e r s m a l l t u b e s i n c l i n e d a t an angle 0 t o t h e p r e s s u r e g r a d i e n t ,
I n t h e S - d i r e c t i o n ( a l o n g t h e t u b e ) , t h e momentum equa t ion i s
Now us'cosO=uxl and s c o s ~ = x ~ ~ / ~ s = c o s e ~ / a x . Thus s u b s t i t u t i o n y i e l d s
1 5
A v e r a g i n g t h e t u b e s o v e r a l l p o s s i b l e a n g l e s a s s u m i n g t h a t a l l t h e t u b e s a r e o r i e n t a t e d u n i f o r m l y i n d i r e c t i o n , t h e p r o b a b i l i t y t h a t a g i v e n t u b e l i e s b e t w e e n t h e s p h e r i c a l a n g l e s e, e+de and $, @+d$ i s u n i t y , t h e n
Thus, m=3. Morse d o e s n o t a l l o w f o r i n e r t i a l c o u p l i n g b e t w e e n t h e motion of the porous mater ia l and i t s e f f e c t o n t h e a i r .
Assuming a p l ane wave s o l u t i o n o f t h e form p ' (x,t)-edmt-kx) Morse shows that k=(m/co) Jm-iRdcP/Pow. Assuming f u r t h e r t h a t RdcP/Poc<l, t h e p r o p a g a t i o n c o n s t a n t k may b e w r i t t e n
Thus t h e a b s o r p t i o n ( a ) and sound propagat ion speed (c) w i t h i n t h e m a t e r i a l f o l l o w s i m m e d i a t e l y t o be
a = R d . C . P / 2 p, CO2 G- /
C l e a r l y , t h e s t r u c t u r e f a c t o r m(m>l) a s d e f i n e d a b o v e r e s u l t s i n a reduced sound propagat ion speed. Obviously m i n c l u d e s h e a t t r a n s f e r e f f e c t s ( i s o t h e r m a l , a d i a b a t i c ) n o t e x p l i c i t l y d i s c u s s e d b y Morse.
Morse p roceeds t o connec t t he dynamic r e s i s t ance Rdc t o t h e known a c o u s t i c b e h a \ i o r i n small t u b e s . A t l ow f requencies where the acous t i c Reyno lds number Ra=-<<l ~ R ~ , = 8 v m / P 6 ~ . I n - s e r t i n g Rdc i n t o Eq. (31) shows t h a t a-&? % h igh f r equenc ie s where Ra>>l , R a c = m m / P b . The a b s o r p t i o n a i s a l s o p r o p o r t i o n - a l t o 4%. Morse c o n c e n t r a t e s o n l y on t h e h i h f requency case. He a n a l y s e s a v a i l a b l e d a t a t o show t h a t a- 2" vRdc.
1 6
Morse's paper i s a t t r a c t i v e b e c a u s e h e d o e s n o t i d e n t i f y t h e q u a n t i t y m/P a s i n c r e a s i n g t h e e f f e c t i v e d e n s i t y o f t h e a i r t rapped wi th in the porous mate-k ia l as do Scot t and Z G K . I n - s t e a d , h e i n t e r p r e t s m t o a f f e c t t h e m a g n i t u d e o f t h e p r e s s u r e g rad ien t because o f l a t e r a l f l u i d m o t i o n i n d u c e d by t h e s t r u c t u r e n o t i n t h e d i r e c t i o n o f t h e p r e s s u r e g r a d i e n t . The p o r o s i t y P i s obv ious and r equ i r e s no exp lana t ion . Morse i n t e r p r e t s t h e e f f ec t ive speed o f sound c i n t h e m a t e r i a l t o b.e c=co/&where co i s i t s a d i a b a t i c v a l u e i n f r e e a i r ( r e c a l l t h a t Morse c o n s i - d e r s o n l y t h e h i g h f r e q u e n c y s o l u t i o n ) . W h i l e t h i s i n t e r p r e t a - t i o n i s v a l i d a t h i g h f r e q u e n c i e s , it is i n c o r r e c t a t l o w f r e - quencies where in co shou ld be r ede f ined a s co /y ( t he i so the rma l sound speed) .
3. STEADY-STATE FLOW RESISTANCE TESTS
Many i n v e s t i g a t o r s h a v e shown t h a t i n t h e a b s e n c e o f g r a z - i ng f l ow, t he d . c . and a . c . r e s i s t ances o f po rous ma te r i a l s a r e e q u a l ( e . g . , s e e t h e s t u d y by Zorumski and P a r r o t t 2 2 ) . F o r a p p l i c a t i o n t o t h e a i r c r a f t i n d u s t r y , i t i s o f i n t e r e s t t o d e t e r - mine w h e t h e r t h i s e q u i v a l e n c y i s s t i l l v a l i d i n t h e p r e s e n c e o f a g raz ing f l ow. Accord ing ly , d . c . f l ow r e s i s t ance t e s t s were conducted wi th the porous- faced l iner spec imens .
Table I summar izes t he manufac tu re r s ' p r ed ic t ed acous t i c proper t ies . Spec imens # 1 - 7 were made f r o m F e l t m e t a l f i b e r m e t a l s and specimens # 8 - 1 0 f r o m R i g i m e s h s t a i n l e s s s t e e l w i r e c l o t h . Photographs enlarged t o i l l u s t r a t e t h e d e t a i l e d s t r u c t u r e of typical Fel tmetal and Rigimesh specimens are shown i n F i g . 1.
3 .1 Exper imenta l ~~ Apparatus
The e f f ec t s o f g raz ing f l ow were s tud ied expe r imen ta l ly i n t h e HAE wind t u n n e l shown i n F i g u r e 2 . The t e s t s e c t i o n , made from . 0 1 2 7 m e t e r s t h i c k t r a n s p a r e n t a c r y l i c s h e e t , h a s a remov- a b l e s i d e - w a l l c o n t a i n i n g t h e t e s t s p e c i m e n . The p o r o u s t e s t m a t e r i a l was backed by a c y l i n d r i c a l t u b e o f d iameter .0508 mete r s ; it was s e c u r e d a n d f l u s h m o u n t e d t o t h e t e s t s e c t i o n s i d e wall by means of t h r e e s e t s c r e w s . Flow th rough t he s ide b ranch was c o n t r o l l e d by means o f b l o w e r s u s e d i n t h e s u c t i o n mode ( i . e . , f r o m t h e t e s t s e c t i o n i n t o t h e s i d e b r a n c h ) o r b l o w i n g mode ( i . e . , f r o m t h e s i d e b r a n c h i n t o t h e t e s t s e c t i o n ) . The s ide b ranch volume flow r a t e was monitored by means o f sha rp - e d g e o r i f i c e s . By a c c u r a t e l y m e a s u r i n g t h e p r e s s u r e d r o p a c r o s s t h e o r i f i c e s w i t h C h a r l e s Merriam Company c a l i b r a t e d s l a n t mano- me te r s , vo lume f low r a t e s a s low a s 8.5 x l G 5 c u b i c meters p e r second were r eco rded .
T e s t s e c t i o n s p e e d s up t o 9 1 . 4 4 meters/second were measured. The v e l o c i t y p r o f i l e f o r Vm=85.6 meters / second, i s shown i n F i g u r e 3 . A s shown, the boundary l ayer i s t u r b u l e n t - measurements
1 7
showed it t o b e t u r b u l e n t f o r a l l t e s t s p e e d s c o n s i d e r e d . F o r d i s t a n c e s l ess than . 00051 me te r s f rom the t unne l wa l l , t he da t a i n d i c a t e s t h a t t h e f l o w i s s e p a r a t e d d u e t o i n t e r a c t i o n b e t w e e n the boundary l ayer p robe and wall . The d a t a m a t c h e s c l o s e l y t h e c l a s s i c a l 1 / 7 t h v e l o c i t y law p ro f i l e fo r . 00051 me te r s<y< .00762 me te r s .
The d . c . r e s i s t a n c e R o f a t yp ica l spec imen mounted a s shown i n t h e lower p a r t o f F i g u r e 2 i s d e f i n e d a s t h e r a t i o o f t h e p r e s s u r e d r o p Ap a c r o s s t h e m a t e r i a l t o t h e a v e r a g e ( w i t h i n t h e .0508 meter d iameter tube) ve loc i ty VD,
The p res su re d rop was measu red d i r ec t ly f rom a c a l i b r a t e d C h a r l e s Merriam s l a n t manometer. The average speed was c a l c u l a t e d u s i n g s t a n d a r d ASME t echn iques23 f rom the p re s su re d rop measu remen t s a c r o s s t h e o r i f i c e s ( o r i f i c e d i a m e t e r s o f . 0 0 6 3 5 m e t e r s , 0 1 2 7 metersand . 0 1 9 0 5 meterswere used t o ex tend t he u se fu l r ange o f VD from a minimum of .04 t o a maximum of 1 0 me te r s / second) .
3 .2 Tes t Resul t s
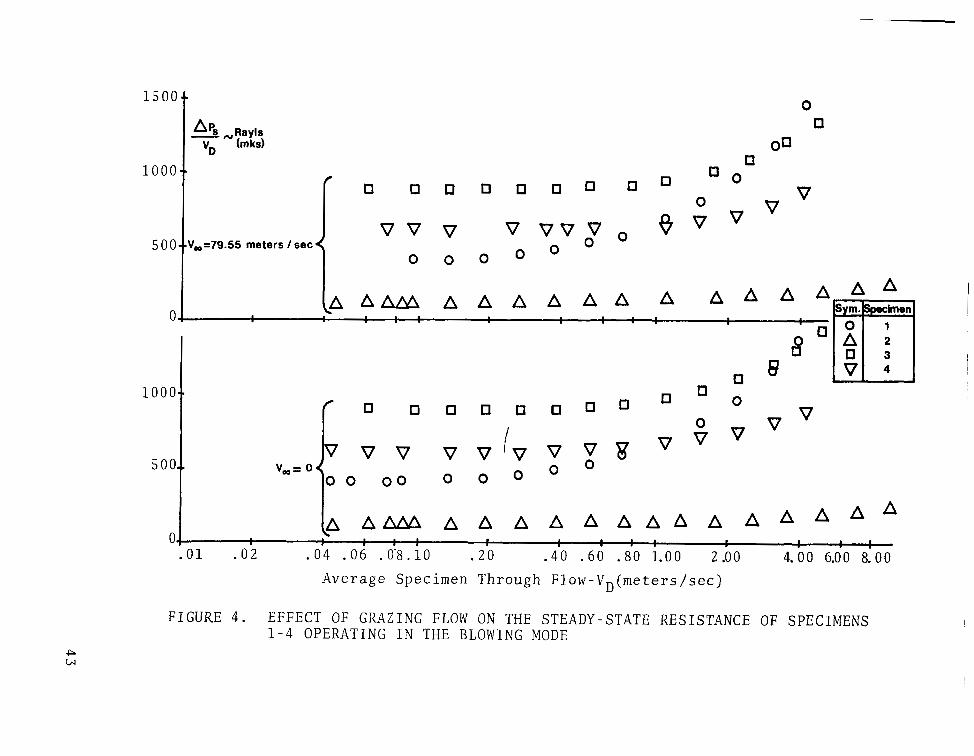
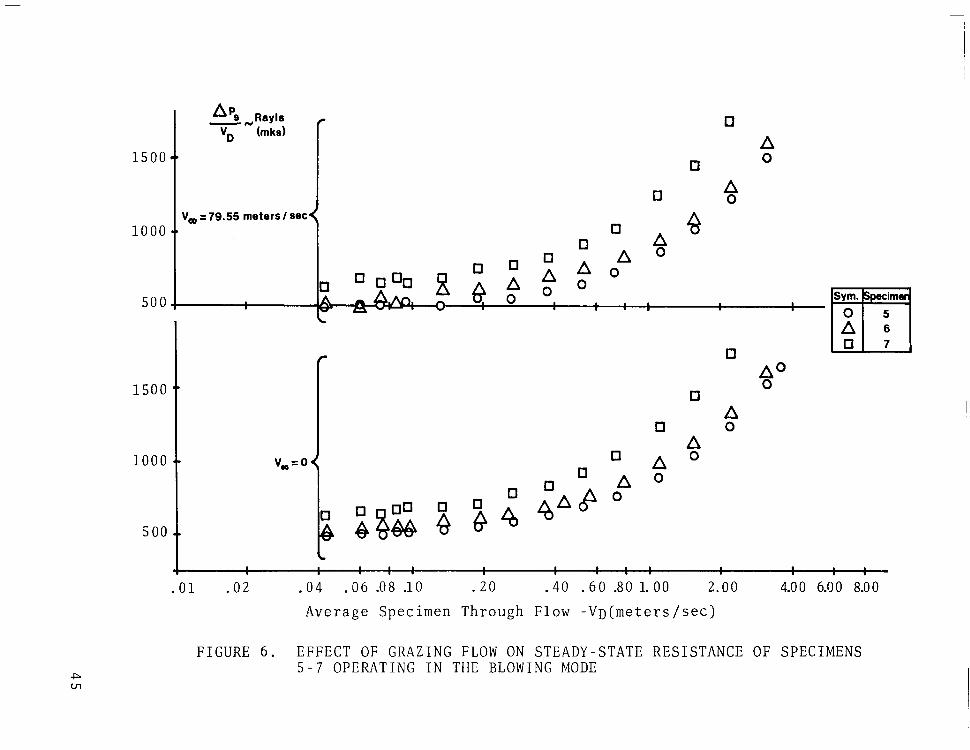
F igu res 4 - 9 summarize t h e e f f e c t s o f g r a z i n g f l o w on t h e d . c . f l o w r e s i s t a n c e o f t h e t e n s p e c i m e n s o p e r a t i n g i n b o t h t h e s u c t i o n and blowing mode. In agreement wi th the d i scuss ion pre- ceeding Eq. ( 1 3 ) , t h e d a t a c a n b e a c c u r a t e l y p r e s e n t e d by t h e e m p i r i c a l c u r v e f i t
The var ious measured values of a and b a r e t a b u l a t e d i n T a b l e 11. Inspec t ion of Table I 1 shows t h a t , i n g e n e r a l , t h e r e a r e o n l y sma l l d i f f e rences be tween t he b lowing and suc t ion da t a . Fu r the r , t h e e f f e c t s o f g r a z i n g f l o w a r e a l s o shown t o be smal l . Most o f t h e d i f f e r e n c e s a r e o f t h e o r d e r o f 2 0 % o r l e s s . These d i f f e r - e n c e s a r e c o n s i d e r e d s m a l l r e l a t i v e t o t h e e f f e c t s o f g r a z i n g f l o w on t h e d . c . r e s i s t a n c e s of o r i f i c e s a s m e a s u r e d by Feder and Dean.
The m e a s u r e d n e g l i g i b l e d i f f e r e n c e s i n f l o w r e s i s t a n c e f o r t he spec imens ope ra t ing i n t he b lowing and suc t ion modes i n d i c a t e t h a t t h e m a t e r i a l p e r m e a b i l i t y i s i s o t r o p i c i n t h e a x i a l d i r e c t i o n . Flow n o n l i n e a r i t y i s shown t o become i m p o r t a n t f o r VD'Z meters / second for specimens 2 , 3, 4 , 8 , 9 and 1 0 f o r V ~ > . 3 0 m e t e r s / s e c o n d for specimens 1, 5 , 6 and 7 ( r eca l l f rom Tab le I t h a t t h e s e
specimens should be equivalent). This is reflected in the various values of the coefficient b summarized in Table'II. Since b is a measure of the importance of flow nonlinearity, following the arguments of Scheidigger, it is a function of the area changes associated with the various pore diameters. The idea here is that relatively large pressure gradients are re- quired to balance the relatively large convective velocity gradients which arise from abrupt changes in internal pore diameter cross-sectional areas.
Specimen 1, 5, 6 and 7 should, in principle, exhibit roughly the same steady-state flow resistance behavior. Clear- ly , the data characterizing specimens 5 and 6 are reasonably close - the coefficients a and b are within 20%. The corres- ponding coefficients characterizing specimens 1 and 7, however, are quite different. These differences are probably associated with the variability inherent with their manufacture. The de- tails of this variability are not well understood nor documented.
The negligible changes in flow resistance with grazing flow require special comment. A small positive pressure drop APs=Ps-Pm induced across the specimen by the grazing flow was observed. The flow control valves across the side branch were closed so that there was zero mean flow across the specimen. According to the investigations by first Beavers and Joseph24 and later Taylor25, the observed pressure drop arises because of a local recirculating (vortical) flow induced across the speci- men. A sketch showing the vortical flow pattern is shown in Fig. 10. The recirculating flow is driven and maintained by steady-state shear stresses transferred across the porous sur- face. Figure 11 shows the effect o f correcting the data by subtracting this pressure drop from the measured blowing data (adding for the suction data) for the data o f Specimen # 4 . With- out this correction, the flow resistance would increase without limit as VD+O as indicated in Fig. 11 (in the suction mode, it would decrease without limit). Table 111 summarizes the measured pressure drops APs in meters of water across the ten specimens at a grazing flow speed of Vcp=79.6 meters/second. The measure- ments showed that (APs) is linearly proportional to the test sec- tion head (PT-PJ where PT is the test section total pressure and Pm is the test section static pressure.
3 . 3 Derivation of Semi-EmDirical Prediction Model
A simplified prediction model of the nongrazing linear d.c. resistance of thin porous-faced liners is derived. The intent here is to correlate the linear d.c. resistance data. It is under- stood because of the variations inherent in the manufacturing pro- cess that only an approximate correlation is possible. The photo- graphs of the Feltmetal specimens,shown in Figure 1, suggest that
19
they can be modelled as a collection of small diameter cylinders. A model of the Rigimesh specimens w.il1 not be derived because of the very limited number of specimens supplied by the manufac- turer. To simplify the model, the following assumptions are made. The cylinders have mean diameter 6. They are aligned perpendicular to the incident flow VD as shown in Fig. 1. The specimen has zero thickness, that is, all the cylinders are as- sumed to lie on a plane surface - this treats the specimen sur- face as a momentum sink in a manner similar to that proposed by Zorumski and Parrott. The cylinders are separated by an average center-to-center spacing S as shown schematically in Figure 1. Here the specimen is placed in a duct of width W and height H with incident flowVDas shown. The parameters H, N and 6 are related as follows
H N N S for N >>1 ( 3 3 )
Consistent with the liner zero thickness assumption, the porosity P is defined as the ratio of the open area A, to the total area AT,
Substituting E q . (33) into E q . (34) and assuming N large yields the following approximate estimate o f the porosity,
P N 1 - d/s ( 3 5 )
The d.c. resistance is calculated by assuming that the cy- linders act as a momentum sink. From momentum balance considera- tions, the following relationship exists between the pressure drop Ap across the specimen and the drag force due to the cylin- ders,
A p . H W = ND ( 3 6 )
where N is the total number of cylinders (of width W) and D is the drag force on each cylinder. Now assume for very slow upstream average speeds VD, that the cylinder drag is proportional to the
2 0
skin friction shear stresses T~ where
L J
Here ( t / P ) is the local pore velocity incident to the cylinder and Lch is a measure of the thickness of the viscous shear layer normal to the cylinder surface. For very low Reynolds number flows, the characteristic length Lch for an isolated cylinder is the diameter 6. For collections of closely spaced cylinders, how- ever, Lch must be a function of the separation parameter S. Thus for S/6>>l, Lch=6 and for S/6<1, Lch=f(S/6). Here S / 6 may be thought of as an interaction parameter. The following simplified empirical relationship is suggested,
For S/6>>1, Lch'6. F o r S/6<<1, Lch=aS where a is a constant that must be determined from experimental data. Hopefully, a will be independent of specimen geometry. Combining Eq. (37) and Eq. (38) and substituting into Eq. (35 ) yields
Substituting Eqs. ( 3 3 ) and ( 3 4 ) into Eq. (39) and solving for the ratio AP/VD yields
The following form of the d.c. flow resistance model is written as
where CY and 6 are unknown constants.
The results of applying E q . (41) to determine the constants a and 6 are summarized in the fifth column of Table IV. The best
21
fi t t o t h e d a t a o c c u r r e d w i t h a = 0 . 8 ; t h e a v e r a g e v a l u e o f @av=1864.
The model c o r r e l a t e s t h e F e l t m e t a l d a t a q u i t e wel l ove r a wide r ange o f po ros i t i e s ( 0 . 4 5 t o 0 . 9 7 ) , c y l i n d e r d i a m e t e r s ( 4 ~ 1 0 ' ~ t o 10" me te r s ) and d : c . r e s i s t ances (115 t o 8 9 0 Rayls-mks). No p a r t i c u l a r s i g n i f i c a n c e i s a t t a c h e d t o t h e v a l u e s o f c1 and f.3. The p o r o s i t y v a l u e s shown i n T a b l e I V were es t imated by computing the r e l a t i v e d e n s i t i e s o f t h e s p e c i m e n s . T h i s i n - vo lved sub t r ac t ing ou t t he we igh t o f t he s c reens and we igh ing the spec imens and measur ing the i r vo lume. The agreement between m a n u f a c t u r e r s e s t i m a t e d p o r o s i t i e s a n d m e a s u r e d p o r o s i t i e s a r e q u i t e c l o s e .
No a t t empt was made t o model t h e n o n l i n e a r b e h a v i o r o f t h e specimens. The r e a s o n f o r t h i s i s tha t spec imens # 2 , 3 and 4 were j u s t b a r e l y e n t e r i n g t h e n o n l i n e a r r e g i m e a t t h e h i g h e r t e s t f i l t e r s p e e d s . B a s e d o n t h e f l o w v i s u a l i z a t i o n t e s t s performed by Chauveteau and Thi r r io t ( see Sec t ion 2 .1) , nonl inear devia- t i ons f rom Darcy ' s law were observed a t v a l u e s of Reynolds number Re=VD6/Pv between 2 and 3 . Us ing t hese va lues of Re, t h e l a s t column i n T a b l e I V shows t h e v a l u e s o f f i l t e r speedvD correspond- i n g t o Re=2 and 3 . Comparing these v a l u e s w i t h t h e o b s e r v e d v a l u e s o f VD r e p r e s e n t i n g t h e o n s e t o f n o n l i n e a r i t y ( t h e s i x t h column i n T a b l e IV) i n d i c a t e f a i r l y good agreement with Chauve- t e a u a n d T h i r r o t ' s c r i t e r i a . A c c e p t i n g C h a u v e t e a u a n d T h i r r i o t ' s c r i t e r i a , it i s c l ea r t h a t t h e o n s e t o f n o n l i n e a r i t y c a n b e e x - t e n d e d t o v e r y h i g h a v e r a g e s p e e d s VD by u s ing po rous ma te r i a l s made o f v e r y s m a l l f i b e r d i a m e t e r s .
4 . ACOUSTIC IMPEDANCE TESTS
I n t h e p r e v i o u s s e c t i o n , t h e e f f e c t s o f g raz ing f l ow on t h e d .c . res i s tance o f t en porous- faced mater ia l s were measured and found t o be neg l ig ib l e . In t h i s Sec t ion , t he two-mic rophone method i s u s e d t o m e a s u r e t h e e f f e c t s o f g r a z i n g flow, sound p r e s - s u r e l e v e l a n d f r e q u e n c y o n t h e a c o u s t i c r e s i s t a n c e a n d r e a c t a n c e o f t h e same ten spec imens . The t e s t appa ra tus and t he two-mic ro - phone method i s d e s c r i b e d i n S e c t i o n 4 . 1 . The t e s t r e s u l t s a re summarized i n S e c t i o n 4 . 2 . A non-g raz ing f l ow semi -empi r i ca l impedance pred ic t ion i s d e r i v e d i n S e c t i o n 4 .3 . The model i s u s e d t o c o r r e l a t e t h e n o n g r a z i n g t e s t d a t a o f S e c t i o n 4 . 2 .
4 . 1 Two-Microphone Method and Test Se t -up
The a c o u s t i c r e s i s t a n c e , t o t a l r e a c t a n c e , a n d f a c e - s h e e t r eac t ance o f t he t e s t spec imens were measu red u s ing t he two mic- rophone method described by Dean3. The method r e q u i r e s t h e specimens t o be cav i ty-backed . F igure 1 2 shows a schemat ic o f t h e t e s t s e t - u p a n d t h e i n s t r u m e n t a t i o n u s e d . The a c o u s t i c r e s i s t ance and r eac t ance o f cav i ty -backed spec imens can be
2 2
d e s c r i b e d by t h e f o l l o w i n g e x p r e s s i o n s
SPL (inc)- SPL (cav) sin4 20 1 sin(%)
where SPL( inc ) -SPL(cav) r ep resen t s t he sound p re s su re l eve l d i f - f e r e n c e ( i n dB) be tween the inc ident and cav i ty sound f ie lds and $I r e p r e s e n t s t h e c o r r e s p o n d i n g p h a s e d i f f e r e n c e . The q u a n t i e s w, L and c r e p r e s e n t t h e s o u n d r a d i a n f r e q u e n c y , c a v i t y d e p t h a n d f l u i d sound speed respec t ive ly . The above measurements are ob- t a i n e d by f lu sh moun t ing one mic rophone a t t he cav i ty base and t h e o t h e r f l u s h w i t h t h e s i d e w a l l s c o n t a i n i n g t h e o r i f i c e a s shown in F igu re 1 2 . I t i s i m p o r t a n t t o l o c a t e t h e i n c i d e n t mic- r o p h o n e s u f f i c i e n t l y f a r f r o m t h e s p e c i m e n t o a v o i d n e a r f i e l d e f f e c t s . The m i c r o p h o n e s h o u l d b e l o c a t e d s u f f i c i e n t l y c l o s e , however, s o t h a t t h e s e p a r a t i o n d i s t a n c e i s s m a l l r e l a t i v e t o t h e incident sound wavelength. This i s n e c e s s a r y t o i n s u r e a c c u r a t e measurements of the incident sound wave ampli tude and phase. A d i s c u s s i o n o f t h e e r r o r s a s s o c i a t e d w i t h u s i n g t h e t w o - m i c r o p h o n e method i s contained in Appendix A .
A schematic of t h e i n s t r u m e n t a t i o n u s e d t o c o n d u c t t h e e x - per iments i s shown i n F i g u r e 1 3 . To gene ra t e i nc iden t sound p r e s s u r e l e v e l s up t o 1 5 0 dB, a J B L type 2480 d r i v e r c a p a b l e o f p roduc ing i n excess o f 1 0 watts o f r e l a t i v e l y “ c l e a n ” a c o u s t i c power i s used a s t he sound sou rce . . The .OS08 meter d iameter d r i v e r t h r o a t i s c o u p l e d t o t h e t e s t s e c t i o n by means o f a .0508 meter t o . l o 1 6 meters d iameter exponent ia l expans ion , J B L t y p e H-93. Sound p r e s s u r e l e v e l s i n e x c e s s o f 1 5 0 dB e x c e e d t h e i n p u t c a p a b i l i t y o f t h e GR-1560-P42 preamp. A 1 0 dB microphone a t tenu- a to r , GR Type 1962-3200 has been added, which extends the
23
measurement range accordingly.
The s i g n a l g e n e r a t e d by the Heath 1G-18 aud io gene ra to r i s a m p l i f i e d by the McIntosh MC2100 1 0 0 wa t t / channe l power a m p l i f i e r t o power t h e J B L d r i v e r . The a u d i o g e n e r a t o r p r o v i d e s a t r a c k i n g s i g n a l f o r t h e AD-YU Synchronous F i l te r and phase meter sys tem. The 1036 system f i l t e r s t h e two mic rophone i npu t s igna l s t o t he t r a c k i n g s i g n a l f r e q u e n c y w i t h a bandwidth of 5 H z . The AD-YU Type 524A4 Phase Meter reads phase angle be tween the s igna ls i ndependen t o f s igna l ampl i tudes . The phase ang le ou tpu t i s d i s p l a y e d on t h e AD-YU Type 2 0 0 1 d i g i t a l v o l t m e t e r . A General Radio-1565 1 / 1 0 o c t a v e f i l t e r t o g e t h e r w i t h a Heath Type 1M2202 DVM i s u s e d t o r e c o r d t h e o u t p u t s i g n a l s f rom each o f t he two microphones. Also the two s i g n a l s a r e o b s e r v e d on a TEK 5 3 3 O s c i l l o s c o p e t o v i s u a l l y n o t e a p p r o x i m a t e p h a s e a n d d i s t o r t i o n e f f e c t s .
The ou tpu t o f t he i nc iden t mic rophone channe l o f t he syn - c h r o n o u s f i l t e r i s used a s a c o n t r o l v o l t a g e f o r a n a u t o m a t i c l e v e l c o n t r o l a m p l i f i e r . T h i s c o n t r o l a m p l i f i e r a d j u s t s t h e d r i v e l e v e l t o t h e power a m p l i f i e r i n s u c h a way a s t o k e e p t h e i n c i d e n t l eve l cons t an t , i ndependen t o f f r equency and ampl i tude r e sponse i r r e g u l a r i t i e s i n t h e l o u d s p e a k e r a n d t u n n e l .
A s a convenience, a t r i p l e ganged 5 dB p e r s t e p l a d d e r a t t e n u a t o r i s u s e d t o s i m u l t a n e o u s l y i n c r e a s e t h e power a m p l i f i e r d r i v e l e v e l a n d d e c r e a s e t h e s y n c h r o n o u s f i l t e r i n p u t s i g n a l s s o t h a t t h e c o n t r o l l o o p o f t h e a u t o m a t i c l e v e l c o n t r o l a m p l i f i e r a lways has the same ga in . This has the added advantage keeping t h e l e v e l s a t t h e AD-YU F i l t e r i n p u t c o n s t a n t f o r a l l t e s t i n g l e v e l s . S i n c e t h e AD-YU F i l t e r d i s p l a y s a small ampl i tude-phase dependency , t h i s au tomat i c l eve l con t ro l improves accu racy a s we l l a s s p e e d o f d a t a a c q u i s i t i o n . A p h a s e t r a c k i n g t e s t o f b o t h m i - c rouhones mounted f lush in the wind tunnel wal l ind ica ted accura te p h a s e t r a c k i n g w i t h i n + O . 2' over a sound p re s su re l eve l r ange o f 70-150 dB.
4 . 2 Test R e s u l t s
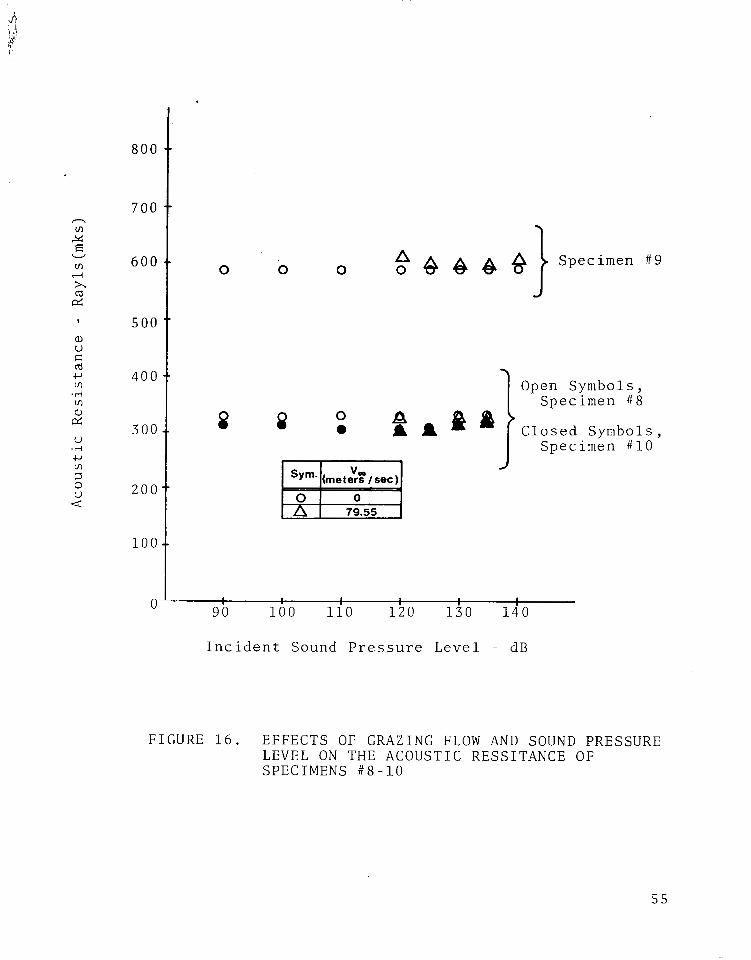
F igu res (14 ) - (16 ) summar ize t he e f f ec t s o f g raz ing f l ow and s o u n d p r e s s u r e l e v e l on t h e a c o u s t i c r e s i s t a n c e o f s p e c i m e n s # 1 - 1 0 . Grazing fZow i s shown t o i n c r e a s e onZy negZ ig ibZy t he z e ro g r a z i n g f l o w r e s i s t a n c e d a t a . Only g raz ing f l ow da t a co r re spond- i n g t o i n c i d e n t s o u n d p r e s s u r e l e v e l s g r e a t e r t h a n 1 1 0 - 1 2 0 dB a r e p r e s e n t e d t o i n s u r e a n a d e q u a t e s i g n a l - t o - n o i s e r a t i o . I n a g r e e - ment w i t h t h e s t e a d y - s t a t e f l o w r e s i s t a n c e d a t a , t h e z e r o g r a z i n g f l o w d a t a show t h a t n o n l i n e a r i t y e f f e c t s a r e i m p o r t a n t o n l y f o r t he F ibe rme ta l FM 134 po rous ma te r i a l - specimens #1, 5 , 6 and 7 . N o n l i n e a r i t y e f f e c t s are unimpor tan t for spec imens # 2 , 3, 4 , 8 , 9 and 1 0 .
2 4
The effects of grazing flow and sound pressure level on the acoustic reactance of specimens #1-10 are summarized in Figures (17)-(25). In all cases, the porous face-sheet reac- tance and total system reactance (i.e., face-sheet and cavity reactance) are either unaffected or changed by only small (but measurable-like 10% differences) amounts from their zero graz- ing flow, low sound pressure level values. The frequency at which the reactance measurements were conducted requires special comment. For each specimen tested, the frequency of the inci- dent sound field was selected s o that at zero grazing flow and at an incident sound pressure level of 90 dB, the phase shift across the specimen face-sheet was ninety degrees. Under these coditions, the total reactance of each specimen was zero corres- ponding to resonance.
Figures ( 2 6 ) -(31) summarize the acoustic response of speci- mens #1, 2 and 7 to variations of frequency. In general, meas- urements show that the acoustic resistance is independent of frequency as shown, for example, in Figure 26. Specimens # 2 and 7 show, however, an interesting dip in resistance in the neighbor- hood of 700-750 Hz. The dip occurs regardless of the amplitude of the incident sound or the speed o f the grazing flow. Impact measurements showed that mechanical resonance corresponding to the first resonant clamped mode occurred at 1550 Hz for specimen #1, 730 Hz for specimen # 2 , and 360 Hz for specimen #7. This accounts for the observed resistance dips for specimens # 2 and 7- it corresponds to the excitation of the simple-harmonic fundamen- tal mechanical resonance of the porous face-sheet material of specimen # 2 and possibly to a higher harmonic of specimen #7. The dip in resistance physically corresponds to the sound par- ticle field converting less mechanical energy into heat within the porous material.
The corresponding variation with frequency of the face- sheet and total reactance of specimens #1, 2 and 7 are shown in Figures (29) thru (31). Figure 29 shows that both the face-sheet and total reactance of specimen #1 to increase almost linearly with frequency. Figures 30 and 31, however, show the face-sheet reactance of specimens # 2 and 7 to increase abruptly at the fre- quency corresponding to mechanical resonance. The total reac- tance of these specimens were only slightly perturbed at mechani- cal resonance. This is more clearly shown in Figure 32 which shows the sound pressure amplitude ratio across the specimen to increase significantly for specimen # 2 with virtually no increases for specimen #1 and 7. Figure 3 2 also shows that specimen # 2 experiences a large phase change between 700-750 Hz; however, specimens #1 and 7 do not.
To support the nongrazing flow two-microphone test results, the impedance of the ten porous samples were measured in a 1.83 meter long, .OS08 meter diameter impedance tube. Since the
2 5
impedance method i s well known it w i l l n o t b e d e s c r i b e d h e r e i n . The impedance tube t e s t d a t a a r e compared with the nongrazing f low d .c . res is tance and two-microphone impedance tes t data in Table V. Here t h e t w o - m i c r o p h o n e d a t a a r e c o r r e c t e d f o r a c o u s t i c r a d i a t i o n f r o m t h e s p e c i m e n s u s i n g t h e m e t h o d d e s c r i b e d i n A p p i n - d i x A . Comparison of t h e d . c . a n d a . c . r e s i s t a n c e i s g e n e r a l l y qu i t e good . To f i r s t o r d e r , d . c . a n d a . c . r e s i s t a n c e s a r e e q u a l . Comparison of the reactance data between the two-microphone and impedance tube measurement methods i s o n l y f a i r . I t i s extremely d i f f i c u l t t o m e a s u r e a c c u r a t e l y u s i n g a n i m p e d a n c e t u b e t h e r e a c - tance o f a specimen whose res is tance i s c l o s e t o P C . Thus t h e two-microphone method of measuring reactance i s b e l i e v e d t o be super ior to the impedance tube method.
4 .3 Derivat ion of Non-Grazing Flow Impedance Predict ion Model ~-
A- p r e d i c t i o n model i s de r ived o f t he impedance o f t h in p o r o u s - f a c e d c a v i t y - b a c k e d l i n e r s . S i n c e t h e l i n e r t h i c k n e s s i s very small compared to the sound wavelength, the model w i l l be d e r i v e d u s i n g t h e c o n c e p t s o f lumped e lements ( i .e . , t h e s l u g - mass model). This method was used by R a y l e i g h l ' i n d e r i v i n g t h e impedance of the Helmholtz resonator . Rayleigh 's approach i s non-f lu id mechanica l bu t g ives the ac tua l acous t ic impedance c h a r a c t e r i s t i c s f o r l o w s o u n d p r e s s u r e l e v e l s ( i . e . , t h e " l i n e a r " impedance regime) when an empi r i ca l end co r rec t ion i s added t o the s lug mass .
Rayle igh der ived the fo l lowing express ion for the impedance o f a s i n g l e o r i f i c e o f d i a m e t e r d and t h i ckness T backed by a c a v i t y o f l e n g t h L ,
where P i s d e f i n e d a s t h e r a t i o of o r i f i c e a r e a t o s e c t i o n a l a r e a . The impedance defined by Eq. (44) f e r e n c e d t o t h e c a v i t y c r o s s - s e c t i o n a l a r e a . The impedance de- f i n e d by Eq. (44) can be used to model the impedance of the p o r o u s m a t e r i a l s b y r e p l a c i n g t h e o r i f i c e a . c . r e s i s t a n c e w i t h t h e d . c . r e s i s t a n c e o f Eq. (41) with cc=O.8 and f3=1865 ( t h e d a t a d e s c r i b e d i n S e c t i o n 4 . 2 showed t h i s t o be a good approx i - mation) and by r e w r i t i n g d=@D ( f o r t h e c y l i n d r i c a l c a v i t y shown i n F i g u r e 1 2 , P=(d /D)2) l eads t o t h e f o l l o w i n g e s t i m a t e ,
26
" .
Here t h e c o n s t a n t 0 .85 i n E q . (44 ) i s r ep laced w i th an unknown (hope fu l ly ) cons t an t E to be de te rmined from expe r imen ta l da t a . The v a r i o u s v a l u e s o f E computed using Eq. (45) and the two- microphone measured values of face-sheet reactance are summar- i z e d i n T a b l e V I . With the except ion of spec imens # 5 , 6 and 7 , E i s s e e n t o b e c o n s t a n t w i t h a v e r a g e v a l u e ~ ~ ~ ' 0 . 5 2 indepen- den t o f spec imen p rope r t i e s f o r bo th the Fe l tmeta l and Rig imesh specimens. The l a c k of agreement between specimens # 5 , 6 and 7 and the remaining specimens cannot be explained. The e x c e l l e n t agreement among the remaining specimens is encouraging and sugges t s t ha t spec imens # 5 , 6 and 7 (which should be equivalent t o specimen #1) may be imprope r ly f ab r i ca t ed by the manufac tu re r .
The f i n a l e x p r e s s i o n f o r t h e f a c e - s h e e t r e a c t a n c e , v a l i d f o r a l l t e n s p e c i m e n s , i s
The s u b s t i t u t i o n f o r t h e F e l t m e t a l s p e c i m e n s o f t h e d . c . f o r t h e a . c . r e s i s t a n c e i s v a l i d o n l y f o r low f r e q u e n c i e s . A p h y s i c a l e x p l a n a t i o n f o r t h e low f r e q u e n c y r e s t r i c t i o n i s d e s - cr ibed below.
The s t e a d y s t a t e model d e s c r i b e d i n S e c t i o n 3 . 3 w i l l now be extended to unsteady f l o w s . What i s r e q u i r e d i s a r easonab le e s t i m a t e o f t h e f l u c t u a t i n g d r a g o f a c y l i n d e r immersed i n a sound p re s su re f i e ld . I t i s assumed t h a t most o f t h e f o r c e s e x e r t e d by a n o s c i l l a t i n g s o u n d f i e l d on a c y l i n d e r o c c u r i n t h e f o r m o f f l u c t u a t i n g w a l l s h e a r s t r e s s e s T ~ . Thus , the d rag force p e r u n i t c y l i n d e r l e n g t h i s ba lanced by a s h e a r f o r c e p e r u n i t c y l i n d e r l e n g t h g i v e n by
Here 1-1 i s t h e f l u i d c o e f f i c i e n t o f v i s c o s i t y , 6 i s t h e c y l i n d e r d i ame te r , Lch i s t h e e x t e n t t o wh ich t he uns t eady shea r s t r e s ses d i f f u s e l a t e r a l l y from t h e c y l i n d e r s u r f a c e a n d v x f i s the ampl i - t u d e o f t h e f l u c t u a t i n g s o u n d p a r t i c l e v e l o c i t y .
An o rde r -o f -magn i tude e s t ima te o f t he h igh f r equency so lu - t i o n t o Eq. ( 4 7 ) i s descr ibed be low. The e s t i m a t e s t a r t s w i t h the boundary - l aye r app rox ima t ions t o t he momentum e q u a t i o n f o r an uns t eady f l ow pas t a s t a t i o n a r y c y l i n d e r ,
2 7
The boundary-layer assumptions require that the lateral region of unsteady diffusion of vorticity be small w.r.t the cylinder radius. Physically this requires high frequency sound oscilla- tions. Linearizing Eq. (48), and solving for the pressure grad- ient yields
a PI a v I a 2 U ; - = - P x_ + P - dX at dY
( 4 9 )
Far from the surface of the cylinder (see sketch), that is for sufficiently large values of y, the particle velocity must satis- fy the following boundary conditions,
where v' is the amplitude of the sound particle velocity field. The corresponding sound pressure field becomes,
Since the pressure is transmitted through the boundary-layer with- out change (this is one of the major benefits of boundary-layer theory), Eq. (49) may be rewritten as
The solution to Eq. ( 5 2 ) that satisfied the boundary condition given by Eq. (50) and the no-slip wall boundary conditions, vx' = 0 at y=O, is
2 8
( 5 3 )
An e s t i m a t e o f t h e f l u c t u a t i n g d r a g Dl follows from Eq. (53) upon s u b s t i t u t i o n i n t o Eq. (47) t o y i e l d
Comparing Eq. (54 ) a n d ( 4 7 ) , t h e c h a r a c t e r i s t i c t h i c k n e s s Lch of t h e f l u c t u a t i n g s h e a r s t r e s s i s
F o r Eq. ( 5 5 ) t o be v a l i d , t h e c h a r a c t e r i s t i c l e n g t h Lch<<B, t h e cy l inde r d i ame te r . Th i s res t r ic ts the f requency f t o t h e f o l l o w - ing reg ime,
S u b s t i t u t i n g t h e maximum v a l u e s o f B=10-4meter (Specimens #1, 5 , 6 , 7 ) from Table I V i n t o Eq. ( 5 6 ) , f must exceed the minimum v a l u e ( f o r t h e t e n s p e c i m e n s ) o f f > > 2 4 0 Hz . S i n c e t h e f r e q u e n c i e s a t which specimens #1, 5 , 6 and 7 were t e s t ed neve r exceeded f=1200 H z , t he e f f ec t s o f f r equency shou ld be sma l l i n acco rd w i th the measurements shown i n F igu re 26 . Thus i n l i g h t o f t h e a b o v e ana lys i s , t he ag reemen t be tween a . c . and d . c . r e s i s t ances i s t o be expected. A t v e r y h i g h f r e q u e n c i e s , h o w e v e r , t h e a . c . r e s i s t a n c e should become much l a r g e r t h a n t h e d . c . r e s i s t a n c e .
5. CONCLUSIONS
The r e s u l t s o f t h i s s t u d y h a v e i m m e d i a t e a p p l i c a t i o n t o t h e c o n t r o l o f i n t e r n a l l y g e n e r a t e d n o i s e w i t h i n j e t e n g i n e s . S t e a d y - s t a t e and acous t i c t e s t s were performed on seven Fel tmetal and t h r e e R i g i m e s h p o r o u s l i n i n g m a t e r i a l s . The p r i n c i p a l f i n d i n g s o f t h i s s t u d y are summarized i n t e r m s o f t h e m a t e r i a l s t e a d y - s t a t e and acous t i ca l behav io r .
2 9
5.1 Steady-State Flow Resistance
(1) The effects of grazing flow on the resistance of thin porous-faced liners were measured and found to be generally small except for specimen # 7 .
( 2 ) The data for the seven Feltmetal specimens were corre- lated in terms of a semi-empirical fluid mechanical model that treated the porous material as a collection of interacting small cylinders. The correlation, shown below, is not general but does indicate the qualitative behavior of the resistance in terms of the material and medium (air) properties.
(3) The nonlinear behavior of the specimens was correlat- ed in terms of a fiber diameter based Reynolds number Re=VDb/Pv. In general, the onset of nonlinearity occurred when Re ranges from 2 to 3. Both the data and the correlation indicate that small diameter fibers delay nonlinearity to higher specimen through flow speeds.
5.2 Acoustic Impedance
(1) The effects of grazing flow on the resistance and reactance of thin porous-faced liners were measured and found to be generally small.
(2) A simple lumped element model was derived which correlated the face-sheet reactance of the ten specimens. The correlation, shown below, was derived by treating the porous material as an equivalent orifice of area PA where A is the cavity backing area and P is the material porosity,
A simple prediction expression for the impedance of the seven Feltmetal specimens was derived based on the substitution for sufficiently low frequencies of the a.c. resistance by the d.c. resistance. An analysis presented in Section 4.3 showed that the a.c. and d.c. resistances are approximately equivalent for frequencies f<<v/Z.rr&' where v is the kinematic viscosity of the fluid and 6 is the mean diameter of the Feltmetal material. The resulting expression is
30
An impor t an t f i nd ing o f t h i s s t u d y i s t h a t a g r e a t d e a l c a n b e l e a r n e d a b o u t t h e a c o u s t i c p r o p e r t i e s o f po rous l i n ing ma te r - i a l s i n a j e t engine duct environment by the much s imple r s tudy o f t h e i r n o n g r a z i n g f l o w , s t e a d y - s t a t e f l o w r e s i s t a n c e b e h a v i o r .
31
REFERENCES
1. Hersh, A. S . and Walker, B . , "The Acoust ic Behavior o f Helmholtz Resonators Exposed to High Speed Grazing Flows", A I M Paper No. 76-536, A I M 3rd AeroAcous t ics Conference , J u l y , 1 9 7 6 .
2 . Feder , E . and Dean, L . W . , "Analy t ica l and Exper imenta l S t u d i e s f o r P r e d i c t i n g N o i s e A t t e n u a t i o n i n A c o u s t i c a l l y Treated Ducts for Turbo Fan Engines", NASA CR-1373, 1 9 6 9 .
3. Dean, P . D . , r ' A n I n S i t u Method of Wall Acoustic Impedance Measurements i n Duct Flow", J o u r n a l o f Sound and V i b r a t i o n , 1 9 7 4 , Vol . 34, 97-130.
4 . Plumblee, H . E . J r . , Dean, P. D . , Wynne, G . A . , and Burr in , R. H. , "Sound P ropaga t ion i n and Rad ia t ion f rom Acous t i ca l ly Lined Flow Ducts: A Comparison of Experiment and Theory", NASA CR-2306, Oct. 1973.
5 . Darcy, H. "Les Foun ta ines Pub l iques de l a V i l l e de D i jon" Dalmont, P a r i s , 1 8 5 6 .
6 . Bear, J . , "Dynamics o f Fluids in Porous Media" , American E l s e v i e r P u b l i s h i n g Company, N . Y . , N . Y . , 1 9 7 2 .
7 . Scheidegger , A. E . The Phys i c s of F Z o w Through Porous Media, 2nd e d . , U n i v e r s i t y o f Toronto Press , Toronto , 1 9 6 9 .
8 . Irmay, S . , "On t h e T h e o r e t i c a l D e r i v a t i o n o f Darcy and Forcheimer Formulas", Trans. Amer. Geophys. Union. No. 4 . , V-39, 7 0 2 - 7 0 7 (1958).
9 . Kozeny, J . , "Uker K a p i l l a r e L e i t u n g d e s Wassers i n Boden", S i t zungober , Ahod. Wiss. Wien., V. 136 , 2 7 1 - 3 0 6 (1927).
1 0 . Rumer, R. R. and Drinkar , P . A . , "Res i s t ance t o Laminar Flow through Porous Media", Proc. Amer. SOC. C i v i l Eng. NO. HY5, V. 9 2 , 1 5 5 - 1 6 4 (1966).
11. Rumer, R . R . , R e s i s t a n c e t o FZow Through Porous Media i n F Z o w Through Porous Media ( R . J . M. dewies t , Ed) , Academic P r e s s , New York, 1 9 6 9 .
1 2 . I b e r a l l , A. S . , "Pe rmeab i l i t y o f Glass Wool and Other High- ly Po rous Media", J. Res. Nat. Bus. Stand, V 4 5 , 398-406 (1950).
13 . Lamb, H . , Hydrodynamics, 6th Ed., Cambridge Univ. Press, London (1932).
32
14.
15.
16.
17.
18.
19.
20.
21.
22.
23.
24.
25.
Blick, E. F., "Capillary Orifice Model for High Speed Flow Through Porous Media I f, EC" Process Design and Develop- ment, No. 1, V. 5, 90-94 (1966).
Cheavetau, G. and C. Thirriot, "Regimes d'e'coulement en milieu poreux et limite de la loi de Darcy", LaHouille Blanche, No. 1, V. 22, 1-8 (1967).
Scott, R. A . , 1946 Proceedings of the Physical Society 58, 165-183, "The Absorption of Sound in a Homogeneous Porous Medium", also 1946 Proceedings of the Physical Soci.ety 58, 358-368, "The Propagation of Sound Between Walls o f Porous Material".
C. Zwikker and C. W. Kosten, Sound Absorbent Materials, Elsvier Publishing Company, Inc., New York, 1949.
Morse, R. W., "Acoustic Propagation in Granular Media", J. Acoust. SOC. Am. V. 24, NO. 6, 696-700 (1952).
Rayleigh, Theory of Sound, The Macmillan Company, New York, VOl. 11.
Morse, R. W. and Bolt, R. H., "Sound Waves in Rooms", Revs. Modern Phys. V. 16, N. 2, 69-150 (1944).
Beranek, L. L., "Acoustical Properties of Sound Absorbing Materials", J. Acoust. SOC. Am., V. 19, No. 4, 556-568 (1947).
Zorumski, W. E. and Parrott. T. L.. "Nonlinear Acoustic Theory for Rigid Porous Materials"; NASA TND-6196, June 1971.
"Fluid Meters", American Society of Mechanical Engineers, Part 1 - 4th Edition, New York, 1937.
Beavers, G. S. and Joseph, D. D., "Boundary Conditions at a Naturally Permeable Wall", J. Fluid Mech., V. 39, 197-207 (1967) . Taylor, G. I., "A Model for the Boundary Condition of a Porous Material, Part I", J. Fluid Mech., V. 49, Part 2, 319-326 (1971).
33
TABLE I. SUMMARY OF MANUFACTURERS PREDICTED ACOUSTIC PROPERTIES
Spec. Trade Name (Nominal) NLF* Average Porosity Average # or Predicted 500/20 Thickness Pore
Identifica- Resistance (meters) Diameter t ion (Rayls-mks) (meters)
I n c i d e n t S o u n d P r e s s u r e L e v e l - dB
FIGURE 1 9 . E F F E C T OF GRAZING FLOW A N D SOUND PRESSURE L E V E L ON PHASE ANGLE CHANGE ACROSS THE F A C E - SHEET OF SPECIMENS # 1 - 4
58
1 . 3 -.
1 . 2 - -
1 . 0
1 . 0
0 o a 1...= 0 Specimen # 7
0
9 0 1 0 0 1 1 0 1 2 0 1 3 0 1 4 0 1 5 0 I
Open symbols, V,=O Closed symbols, V,= 85.65 meterslsec
A
A A A
A A A
A A A A
c Specimen # 6
7
J I
I I
I I
I I 1 I
I I I
9 0 1 0 0 1 1 0 1 2 0 1 3 0 1 4 0 1 5 0
Incident Sound Pressure Level - dB
FIGURE 2 0 . EFFECT OF GRAZING FLOW AND SOUND PRESSURE LEVEL ON FACE-SHEET REACTANCE OF SPECIMENS # 5 - 7
5 9
0 0 0 S p e c i m e n #7 0 o o O o J
A A
A A A A ~
0 0 0 0 S p e c i m e n #5 O O O O
I n c i d e n t S o u n d P r e s s u r e L e v e l - dB
FIGURE 2 1 . E F F E C T OF GRAZING FLOW A N D SOUND PRESSURE LEVEL O N THE TOTAL ACOUSTIC REACTANCE OF SPECIMENS #5-7
6 0
9 1..
90" M
a 0 0 0 0
I
Specimen # 7
8 9.. c, Q) Q) A
I
0
I I
cn 90 1 0 0 1 1 0 1 2 0 1 3 0 I 1 4 0 1 5 0 a, U cd
F4
c a, E
.A
a,
cn !a U Spec imen # 6
9 0 A A v) A A A A A
r/)
0 k U I 4 9 0 1 0 0 110 1 2 0 1 3 0 140 1 5 0 Q)
c Do
cd c U . . a a a a,
c cd
a
9 1" v) Open symbols, V, = O
Closed symbols, V, = 85.65 meterslsec
90" Specimen #5
0 0 0 0 0
8 9.- 0 0 0 1 I I
90 1 0 0 1 1 0 1 2 0 1 3 0 1 4 0 1 5 0
I n c i d e n t Sound Pressure L e v e l - dB
FIGURE 2 2 . EFFECT O F G R A Z I N G FLOW A N D ' SOUND PRESSURE LEVEL ON THE PHASE ANGLE CHANGE ACROSS THE F A C E - S H E E T O F S P E C I M E N S # 5 - 7
6 1
. 7 0 .' ..= . 0 Specimen # 1 0
R . 6 0 0 0 3
- - 0 Q \ 0 0 o n w x . s o - 1 I
I I u 9 0 1 0 0 1 1 0 1 2 0 1 3 0 1 4 0 1 5 0
a, u c cd
0 cd a p:
c, 1 . 0 4
c, 1.00 a, a, c [/)
. 9 0 u cd I c4
a a, N .r( d cd
0 .I+ vr c
. 7 0
. 6 6 - 7 4 1
a c 0
.r(
1
~~ A Open symbols, V,= 0 Closed symbols, V,=85.65 metershec A
A A Specimen #9 A
I I
I I
L 1 I
I I
I I
I 1
9 0 1 0 0 1 1 0 1 2 0 1 3 0 1 4 0 1 5 0
0 0 0 0
0
0 Specimen # 8
g o
I I I I I ~ " " I A I 1 I I
9 0 1 0 0 1 1 0 1 2 0 1 3 0 1 4 0 1 5 0
Incident Sound Pressure Level - dB
FIGURE 2 3 . EFFECT OF GRAZING FLOW AND SOUND PRESSURE LEVEL ON THE FACE-SHEET REACTANCE OF SPECIblENS # 8 - 1 0
6 2
10
.. 5
J=
0
- 5 ”
- -
-lo*
10
- 5
-10
40
20”
0 ”
0 0 0 Specimen # 8
0 A
1
A
0 0 0 0
A
0
A
0
I I
I I
I I I I
90 100 110 120 130 140
Incident Sound Pressure Level - dB
FIGURE 24. EFFECT OF GRAZING FLOW AND SOUND PRESSURE LEVEL ON THE TOTAL REACTANCE OF SPECIblENS #8-10
#10
63
9 4
9 2
9 0
9 1
90
8 9
92
9 1
0
0 0 0
0 0 0
Specimen # 1 0
I I I
I I
I I
I I
9 0 1 0 0 1 1 0 1 2 0 1 3 0 1 4 0 1 5 0 1" I
A I Open symbols, V, = 0 Closed symbols, V, = 85.65 meters/sec
~~ ~
A A A
A
A A A A A A A A I
J
S p e c i m e n # 9
9 0 100 110 1 2 0 1 3 0 1 4 0
0
0
0 0 0 0
0 0 0 0 0 0
1 5 0
S p e c i m e n # 8
90
I n c i d e n t S o u n d P r e s s u r e Level - dB
FIGURE 2 5 . EFFECT OF G R A Z I N G FLOW AND S O U N D PRESSURE LEVEL O N PHASE ANGLE CHANGE ACROSS THE FACE-SHEET OF SPECIMENS # 8 - 1 0
6 4
al V d cd
I n c i d e n t Sound Frequency - Hz
F I G U R E 2 6 . EFFECT OF V A R I A T I O N OF FREQUENCY ON THE A C O U S T I C R E S I S T A N C E O F S P E C I b I E N #1
65
140..
1 2 0 ”
looI 8 0
4 0
0 0
Sym. SPL (inc) v,
dB (meters/sec)
0 0 90
A 86.26 135 A
0 135
I
A A
A A 0 0
A 8
I I I 1 I I
I
0 400 500 600 7 0 0 8 0 0 900 1000
Incident Sound Frequency - Hz
FIGURE 27. EFFECT OF VARIATION OF FREQUENCY ON THE ACOUSTIC RESISTANCE OF SPECIMEN # 2
66
3 8 1 360
Sym. SPL(inc) "ea dB (meters /sed
0 0 90
A A
0 135
86.26 135
A
A
8 A 0
0
0
460 50'0 6 0 b ' 7 b 0 8 0 0 9 6 0 1 0 0 0
Incident Sound Frequency - Hz
FIGURE 28. EFFECT OF VARIATION OF FREQUENCY ON THE ACOUSTIC RESISTANCE OF SPECIMEN # 7
6 7
2 0 0 t V rd
c: a,
4 4 0 0 cd w b 0 t n u l '
94=~ B ' Specimen Face-Sheet and
b Cavity Reactance A
0 i; A "
SPL(inc) V, Syrn. dB (meters /sec
0
86.26 135 A 135 A
0 90
0
d rj w u rj
c: c,
1 0 0 0 0 A A Specimen Face-Sheet Reactance
a a,
s A A I
I 4010 500 6 b 0 7 0 0 8 0 0 9 0 0 1 0 0 0 cn 0 I I I
I I
I I
1 I
Q)
V
L rd Incident Sound Frequency - Hz
FIGURE 29. EFFECT OF VARIATION OF FREQUENCY ON THE ACOUSTIC REACTANCE OF SPECIMEN #1
2 0 0
0 8 0 0 9 0 0 1 0 0 0
2 0 0 0
0 4 0 0 0
1 6 0 t
SPL(inc) v, Sym. dB (meters/sec)
0 0 '1 35 A 0 90
135 86.26 A
1 0 0 -
s 0-
Spec ia l Face -Shee t and Cavi ty Reac tance
A A
6 0 t
A
A o A A
a A 0
- A i
a 0 Specimen Face-Sheet Reactance
0 0
400 500 6 0 0 7 0 0 8 0 0 9 0 0 1 0 0 0
I n c i d e n t Sound Frequency - Hz
FIGURE 3 0 . EFFECT OF VARIATION OF FREQUENCY ON THE ACOUSTIC REACTANCE OF SPECIMEN # 2
6 9
4: E v
2 0
- 20
0" A
0 I I 1 I 0 4 d P A - 4 0 0 5 0 0 7 8 0 0 9 0 0 1 0 0 0
0" Face-Shee t and Cavi ty Reac tance
160-
140-
1 2 0-
100-
8 0-
Sym. SPL(inc) v, dB A (rneters/sec)
-
86.26 135 A 0 A 0 90 0
0 A o a 135
0014 0
OA* 0 A
A A A A A A
B o Face -Shee t Reac tance 0
" A 2 O A
A A 0
0 I I I I I I
4 0 0 5 0 0 6 0 0 700 8 0 0 9 0 0 1 0 0 0
I n c i d e n t Sound Frequency - Hz
FIGURE 31. EFFECT OF V A R I A T I O N OF FREQUENCY ON THE REACTANCE OF SPECIMEN t 7
7 0
. "
4 "
3 "
2 - -
1 "
A A
A
A AA
A A A
A A
A
1 4 0
1 2 0
100
8 0
6 0
40
4 0 0 5 0 0
0
0 0 0
0 0
AA A
0
O o13 O u A 0 A
A
A
A
A
I3 0
0
8
A ~1 I
-0 I I I I
I I I 1
7 0 0 800 900 1000 I n c i d e n t Sound F r e q u e n c y - IIz
F I G U R E 3 2 . E F F E C T O F F R E Q U E N C Y V A R I A T I O N ON T H E P R E S S U R E R A T I O S AND PHASE CHANGES A C R O S S S P E C I M E N S 1, 2 G 7
7 1
APPENDIX A
CORRECTION TO MEASURED INCIDENT SOUND PRESSURE LEVEL DUE TO ACOUSTIC RADIATION FROM THE TEST SPECIMEN
To measure the acous t ic impedance of a s h e e t o f porous ma te r i a l backed by a cavi ty us ing the two-microphone method, it i s n e c e s s a r y t o a c c u r a t e l y d e t e r m i n e t h e d i f f e r e n c e i n s o u n d pressure l eve l and phase be tween a microphone mounted f lush with t h e s u r f a c e o f t h e t e s t specimen and another mounted a t t h e b a c k o f t h e r e s o n a t o r c a v i t y . A s h a s b e e n p o i n t e d o u t i n S e c t i o n 4 . 1 , i t i s n e c e s s a r y t o mount t h e " i n c i d e n t " m i c r o p h o n e s u f f i - c i e n t l y f a r f rom the t es t spec imen s o t h a t i t i s n o t i n f l u e n c e d by the hydrodynamic near f ie ld .
The t y p i c a l b e h a v i o r o f h i g h l y r e s i s t i v e s p e c i m e n s was a s f o l l o w s . The f requency o f t h e i n c i d e n t s o u n d f i e l d was ad- j u s t e d t o resonance which cor responds to a r e l a t i v e p h a s e a c r o s s the specimen $ = 9 0 d e g r e e s . D u r i n g t h i s a d j u s t m e n t t h e i n c i d e n t s o u n d p r e s s u r e l e v e l was s e t a t 9 0 dB; $ was o b s e r v e d t o d e - c r ease mon i ton ica l ly w i th i nc reas ing sound p re s su re l eve l . Th i s was the u sua l r e sponse o f h igh ly r e s i s t i ve po rous spec imens . However, f o r p a r t i c u l a r l y low r e s i s t a n c e s p e c i m e n s , $ was ob- s e r v e d t o i n i t i a l l y i n c r e a s e b y s e v e r a l d e g r e e s w i t h i n c r e a s i n g s o u n d p r e s s u r e l e v e l b e f o r e d e c r e a s i n g . A d d i t i o n a l l y , it was n o t e d t h a t i n t h e r a n g e o f t h i s a n o m a l o u s p h a s e b e h a v i o r , i n - c r e a s i n g t h e d r i v e l e v e l t o t h e l o u d s p e a k e r b y 5 dB would r e - s u l t i n somewhat g r e a t e r t h a n 5 dB i n c r e a s e i n t h e m e a s u r e d i n c i - d e n t s o u n d p r e s s u r e l e v e l .
Th i s can be exp la ined i n terms o f a c o u s t i c r a d i a t i o n f r o m t h e t e s t s a m p l e a s f o l l o w s : L e t Q be the inward volume veloci ty i n t h e o r i f i c e o r p o r o u s s a m p l e , PC,, be t h e c a v i t y s o u n d p r e s - s u r e , Pint b e t h e i n c i d e n t s o u n d p r e s s u r e , (ZD) = (RD) + (XD) b e t h e s p e c i f i c a c o u s t i c i m p e d a n c e o f t h e s a m p l e , n o r m a l i z e d t o t h e c a v i t y d i a m e t e r D , L b e t h e c a v i t y d e p t h , a n d r be t he d i s t a n c e f r o m t h e a c o u s t i c c e n t e r o f t h e s p e c i m e n t o t h e " i n c i - dent" measur ing loca t ion .
f o r t h t h e e i u t w i l l be assumed. We t h e r e ? o r e h a v e , f o r t h e volume v e l o c i t y
F o r s i n u s o i d a l e x c i t a t i o n Pint = P i ceiut , where hence-
7 2
and from mass conserl fation and adiabatic compr
- ~-
ession,
. 4 p c 2 Q Pcav 21 - Qdt = -I
T D ~ L O
Combining Eqs. ( A - 1 ) and ( A - 2 ) ,
The radiated pressure Pr for a small source in a plane surface is given by
P O Q e - ~ c . o r Pr(r)=- i -
2 7rr
Combining Eqs. (A-1) and (A-4)
( A - 4 )
Therefore, the total sound pressure Pt at the incident microphone will be given by
Unfortunately, this otherwise convenient expression includes RD and XD, which we are attempting to measure, and an iterative calculation is required to correct for the effect. Transposing we have
7 3
o r
where
A =
and
(A- 9 )
(A- 10)
Thus,
s p ~ ~ = SPLt - 10 log (1 + A * -F 2 AcosB)
(A-11)
The i t e r a t i v e c a l c u l a t i o n p r o c e e d s a s f o l l o w s :
1. Use SPLt-SPLi and @t -@i to de t e rmine on i n i t i a l v a l u e o f RD and XD.
2 . Use t h e s e v a l u e s o f RD and XD i n Eqs. ( A - 8 ) t h r u (A-11) t o de te rmine a f i r s t i t e r a t i o n v a l u e o f SPLi and @.
7 4
3 . C a l c u l a t e new v a l u e s o f RD and XD.
4 . Repeat s teps 2 and 3 u n t i l t h e a n s w e r s f rom two s u c c e s s f u l i t e r a t i o n s a r e e q u a l w i t h i n t h e d e s i r e d a c c u r a c y ( 0 . 1 % re - q u i r e s o n l y 3 - 4 i t e r a t i o n s ) .
R e s u l t s o f t h i s c o r r e c t i o n p r o c e d u r e f o r l o w s o u n d p r e s s u r e l e v e l d a t a from porous samples 1 through 1 0 a r e shown i n T a b l e A - 1 . Note t h a t f o r e a c h c a s e , ASPL is lower than measured, I$ i s h igher than measured , R / p c i s s l i g h t l y h i g h e r t h a n m e a s u r e d and X / p c i s more pos i t i ve t han measu red .
7 5
TABLE A - 1 SUMMARY OF CORRECTED IMPEDANCES TO TEN POROUS SPECIMENS
Vo3 = 0 ; S P L ( i n c ) = 9 0 dB
Sample Meas Meas I n i t I n i t Cor r Cor r Cor r Cor r @ i c R / P C X / P C # ASPL @ i c R / PC X/ PC ASPL
1. Report No: 2. Government Accession No. 3. Recipient’s C a t a l o g No.
NASA CR-2951 I 4. Title and Subtitle I 5. Report Date
Effects o f Grazing Flow on the Steady-State Flow 6. Performing Organization Code Resistance and Acoustic Impedance o f T h i n Porous-Faced
January 1978
Liners _ _ _ 7. Author(s1
-
8. Performing Organlzation Report No.
A. S. Hersh & B. Walker _~_. - . .. - .. -_ ..- 10. Work Unit No.
9. Performing Organization Name and Address
Hersh Acoustical Engineering
Chatsworth, CA 91311 9545 Cozycroft Avenue
11. Contract or Grant No.
NAS1-14310 13. Type of Report and Period Covered
12. Sponsoring Agency Name and Address
National Aeronautics and Space Administration Contractor Report 14. Sponsoring Agency Code
Washington, DC 20546
Final Report, Project Manager, Tony L . Parrott, Acoustics Branch, Acoustics and Noise Reduction Divis ion, NASA Langley Research Center, Hampton, VA 23665
1 15. Supplementary Notes
-~
16. Abstract
The resu l t s of an investigation of the ef fec ts of grazing flow on the steady- s t a t e flow resistanceand acoustic impedance of seven Feltmetal and three Rigimesh t h i n porous-faced liners are presented. A s ta te-of- the-ar t review of previous nongrazing flow studies i s also presented. The steady-state flow resistance of the ten specimens a re measured u s i n g standard f luid mechanical experimental techniques. The acoustic impedance was measured using the two-microphone method. The principal findings of the study are ( 1 ) t he e f f ec t s of grazing flow were measured and found t o be small, ( 2 ) small differences were measured between steady- s t a t e and acoust ic res is tance, ‘(3) a semi-empirical model was derived that correlated the steady-state resistance data of the seven Feltmetal liners and the face-sheet reactance of b o t h the Feltmetal and Rigimesh l iners .
These findings suggest that nongrazing flow steady-state flow res t e s t s could provide considerable insight i n t o the acoustic behavior of i n a grazing flow environment.
i stance porous 1 i ners
7. Key Words (Suggested by Author(s)l 18. Distribution Statement . ”~ .