49
THE STRANGERS NEXT DOOR J. D. Payne University Educators for Global Engagement April 13-14, 2012
| Date post: | 26-Dec-2015 |
| Category: |
Documents |
| Upload: | adelia-holt |
| View: | 215 times |
| Download: | 0 times |
THE STRANGERS NEXT DOOR
J. D. PayneUniversity Educators for Global Engagement
April 13-14, 2012

Contact Information:
J. D. [email protected]@jd_paynewww.jdpayne.orgwww.northamericanmissions.org502-897-4498


Samuel and Young Cho
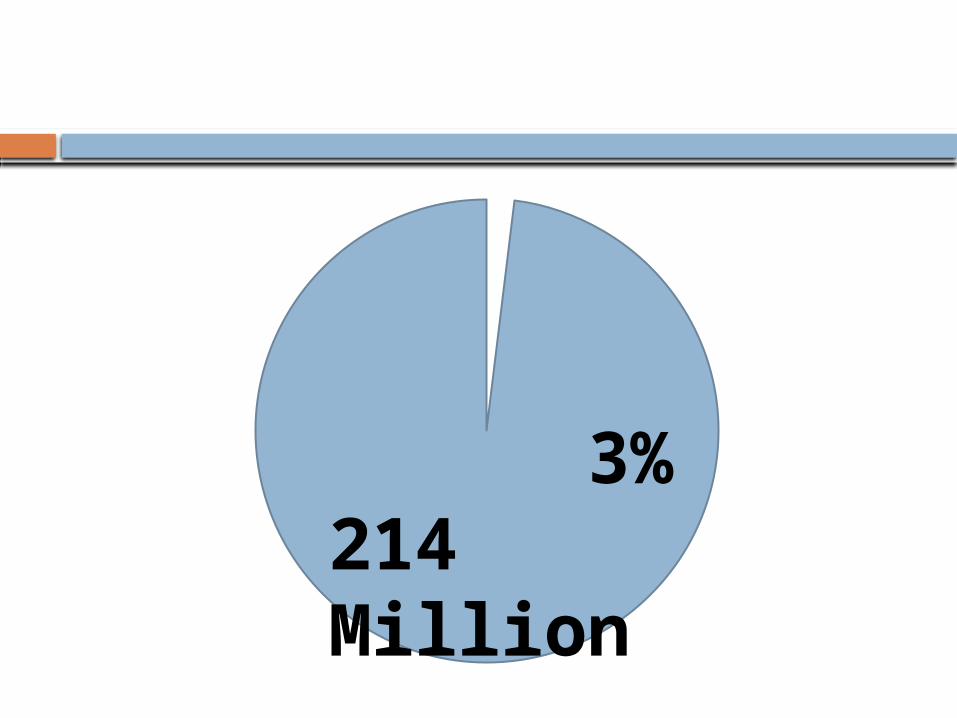
3%214 Million
Terminology
MigrationMigrantImmigrationEmigrationRefugeeAsylum Seeker

Migration and Kingdom Perspective

The Divine Maestro
and the Push-Pull Factors
Theological Assumption
Missiological Assumption
Migration and Kingdom Perspective

What in the World is God Doing?

The largest nationalities granted British citizenship in 2010 were Indian (29,405), Pakistani (22,054), Filipino (9,429), Bangladeshi (7,966), and Chinese (7,581).
The proportions of babies born to mothers from outside the UK recently reached a record high of 24.7%. In the Newham community in east London, the area with the highest proportion of such births exceeded 75% with Pakistan, Poland, and India topping the list for the mothers’ countries of origin.

Are Mr. Singh and Auntie the
Strangers Next Door to You?

Global Migration Trends
Between 1990-2010, the more developed countries gained 45 million international migrants, an increase of 55%.
By 2010, Europe hosted almost 70 million international migrants, 1/3 of the global total. Asia hosted 61 million. Northern America hosted 50 million.

Global Migration Trends
The increase of migrant stock between 2000-2010 was the highest in Northern America (24%), Europe (21%), and Oceania (20%).
Between 2000-2010, nine countries gained over a million international migrants: United States (8.0 million), Spain (4.6 million), Italy (2.3 million), Saudi Arabia (2.2 million), the United Kingdom (1.7 million), Canada (1.6 million), the Syrian Arab Republic (1.3 million), Jordan (1 million), and the United Arab Emirates (1 million).

Global Migration Trends
In 2010, Asia hosted 10.9 million refugees, making up 66% of the global number of refugees. Africa with 2.6 million (16% of the global population); Europe with 1.6 million refugees (10%); Northern America with 730,000 refugees, and Latin America and the Caribbean hosting 530,000 refugees.
In 2005, countries with at least 20 million inhabitants where international migrants constituted high proportions of the population included Australia (20%), Canada (19%), France (11%), Germany (12%), Saudi Arabia (26%), Spain (11% ), Ukraine (15%), and the United States (13%).

Global Migration Trends
Between 2000-2007, the number of international students more than doubled to over 2 million. The main destination countries were the United States, the United Kingdom, Germany, France and Australia. The greatest percent increases occurred in New Zealand, Korea, the Netherlands, Greece, Spain, Italy, and Ireland.
In 2010, migrants comprised 14.2% of the total population of North America and 12.4% of Western Europe.
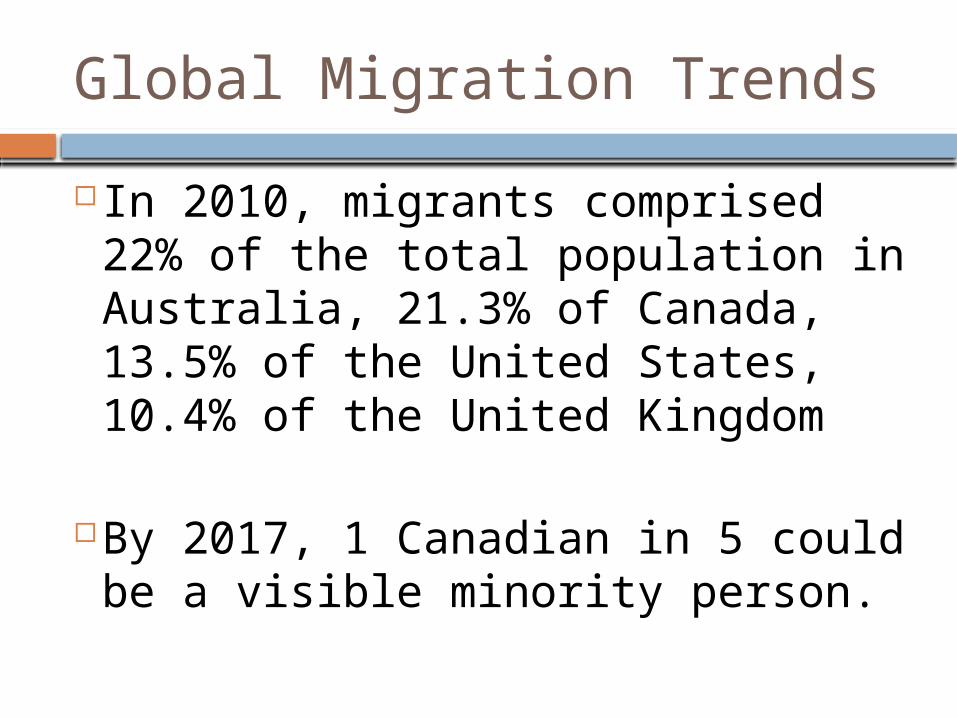
Global Migration Trends
In 2010, migrants comprised 22% of the total population in Australia, 21.3% of Canada, 13.5% of the United States, 10.4% of the United Kingdom
By 2017, 1 Canadian in 5 could be a visible minority person.

The UNHCR noted that in 2010:
There were 10.55 million refugees
There were 14.7 million internally displaced persons
There were 837,500 asylum seekers

The UNHCR noted that in 2010: Pakistan hosted the largest
number of refugees (1.9 million), followed by the Islamic Republic of Iran (1.1 million), the Syrian Arab Republic (1 million), and Germany (594,000)
Developing countries hosted 80% of the global refugee population

The UNHCR noted that in 2010: Asia had 54% of the global refugee
population, followed by Africa (23%), Europe (15%), and North America (4%)
Afghanistan was the largest country of origin of refugees (3 million), followed by Iraq (1.7 million), Somalia (770,000), the Democratic Republic of the Congo (477,000), and Myanmar (416,000)
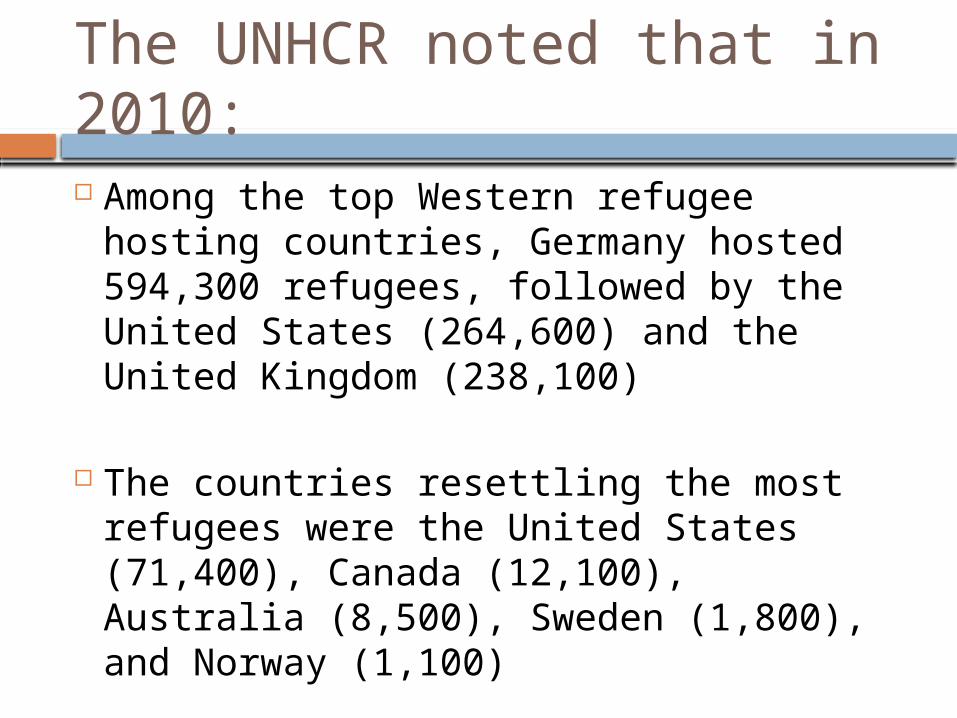
The UNHCR noted that in 2010: Among the top Western refugee hosting
countries, Germany hosted 594,300 refugees, followed by the United States (264,600) and the United Kingdom (238,100)
The countries resettling the most refugees were the United States (71,400), Canada (12,100), Australia (8,500), Sweden (1,800), and Norway (1,100)

The UNHCR noted that in 2010: The most sought-after destination for
asylum-seekers was South Africa, followed by the United States, France, Germany, and Sweden
Refugee and asylum-seekers were more often established in urban contexts
Among refugees and people in refugee-like situations, children comprised 44% of the population

2010 Refugee Arrivals to the U. S. by Country of Nationality
Iraq 18,016Burma 16,693 Bhutan 12,363 Somalia 4,884 Cuba 4,818 Iran 3,543 Congo, Democratic Republic 3,174 Eritrea 2,570 Vietnam 873 Ethiopia 668All other countries, including unknown
5,691
Total 73,293
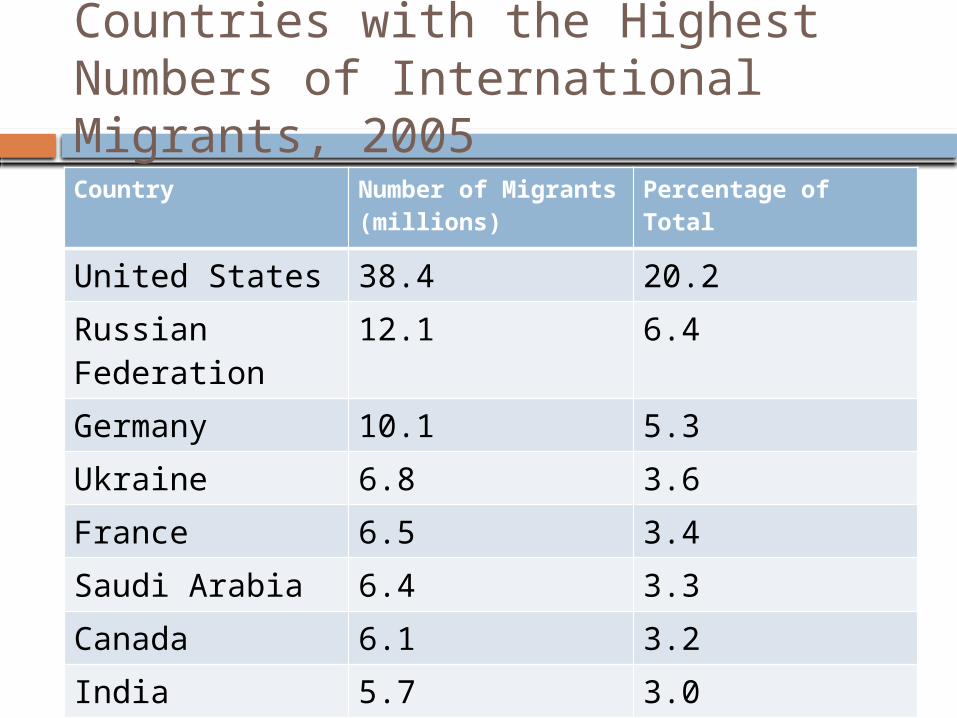
Countries with the Highest Numbers of International Migrants, 2005Country Number of
Migrants (millions)Percentage of Total
United States 38.4 20.2
Russian Federation
12.1 6.4
Germany 10.1 5.3
Ukraine 6.8 3.6
France 6.5 3.4
Saudi Arabia 6.4 3.3
Canada 6.1 3.2
India 5.7 3.0
United Kingdom 5.4 2.8

Countries with the Highest Numbers of International Migrants, 2010
Country Estimated number of international
migrants at mid-year, 2010
As Percentage of Global Total
United States 42,813,281 20Russian Federation
12,270,388 5.7
Germany 10,758,061 5Saudi Arabia 7,288,900 3.4Canada 7,202,340 3.4France 6,684,842 3.1United Kingdom 6,451,711 3Spain 6,377,524 3India 5,436,012 2.5Ukraine 5,257,527 2.5

The Strangers Next Door are from Where?
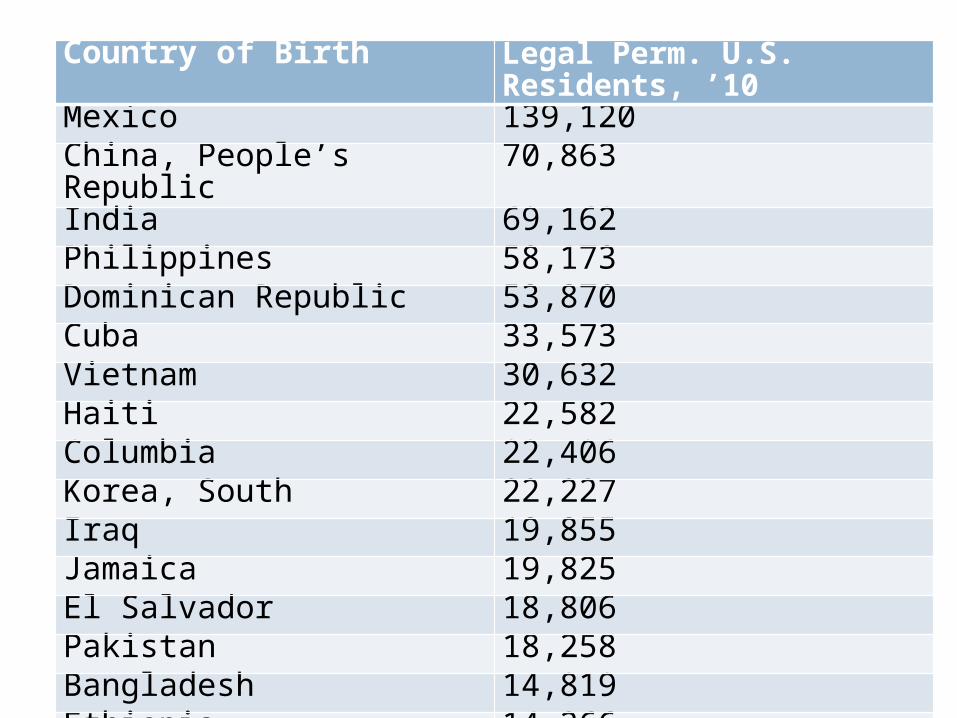
Country of Birth Legal Perm. U.S. Residents, ’10Mexico 139,120China, People’s Republic 70,863India 69,162Philippines 58,173Dominican Republic 53,870Cuba 33,573Vietnam 30,632Haiti 22,582Columbia 22,406Korea, South 22,227Iraq 19,855Jamaica 19,825El Salvador 18,806Pakistan 18,258Bangladesh 14,819Ethiopia 14,266
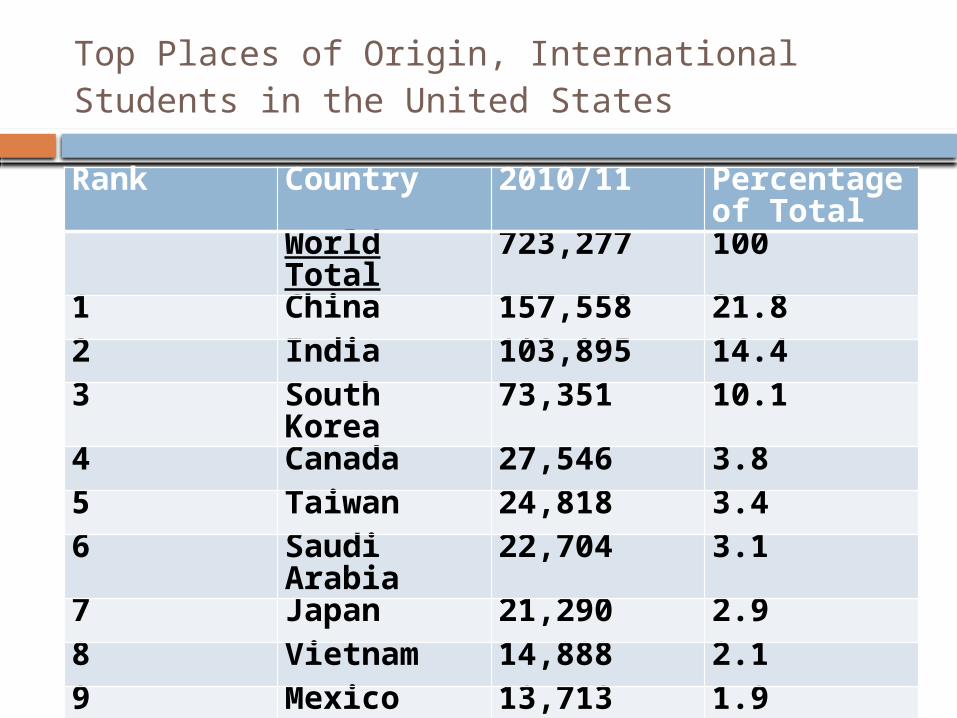
Top Places of Origin, International Students in the United States
Rank Country 2010/11 Percentage of Total
World Total 723,277 1001 China 157,558 21.82 India 103,895 14.43 South Korea 73,351 10.14 Canada 27,546 3.85 Taiwan 24,818 3.46 Saudi Arabia 22,704 3.17 Japan 21,290 2.98 Vietnam 14,888 2.19 Mexico 13,713 1.910 Turkey 12,184 1.7

The World’s Unreached in the West
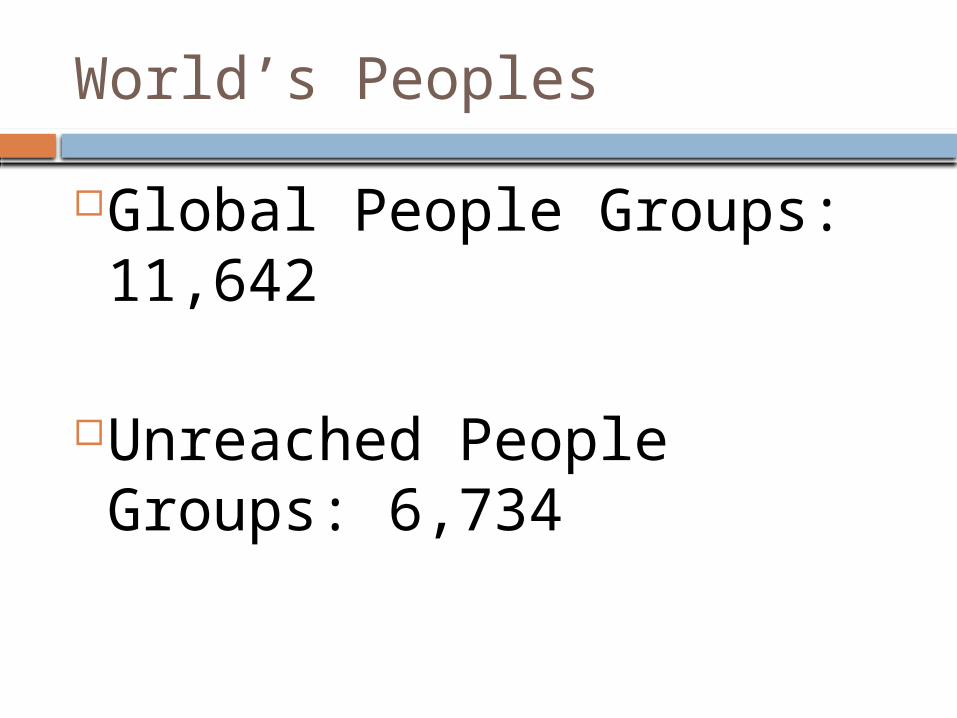
World’s Peoples
Global People Groups: 11,642
Unreached People Groups: 6,734

“Unreached”?
Mejra

Bosnian Locations in West
Est. Number
Canada 13,178
France 100
Germany 286,000
Ireland 888
Italy 29,000
United Kingdom 2,000
United States 108,924Source: Global Research, IMB

Jay

How Many UPGs in the West?

Country UPGs, Joshua Project
UPGs, Joshua Project (with Adherent % Removed)
UPGs, Global Research
Andorra 3 9 5
Australia 11 36 43
Austria 6 34 23
Belgium 10 26 34
Canada 41 132 180
Denmark 12 22 20
Finland 7 18 6
France 34 79 97
Germany 19 57 64
Greenland -- 3 1
Iceland 1 5 4
Ireland 4 13 10

Country UPGs, Joshua Project
UPGs, Joshua Project (with Adherent % Removed)
UPGs, Global Research
Italy 12 50 48
Liechtenstein 2 6 3
Luxembourg 2 13 10
Malta 3 7 5
Monaco 1 8 6
Netherlands 13 45 41
New Zealand 6 23 21
Norway 14 41 11
Portugal 5 16 22
San Marino -- 4 2
Spain 7 40 37
Sweden 8 38 28
Switzerland 6 21 18
United Kingdom 29 66 73
United States 73 242 361

Country UPGs, Joshua Project
UPGs, Joshua Project (with Adherent % Removed)
UPGs, Global Research
TOTAL: 329 1054 1173

How Many UPGs in the United States and Canada?
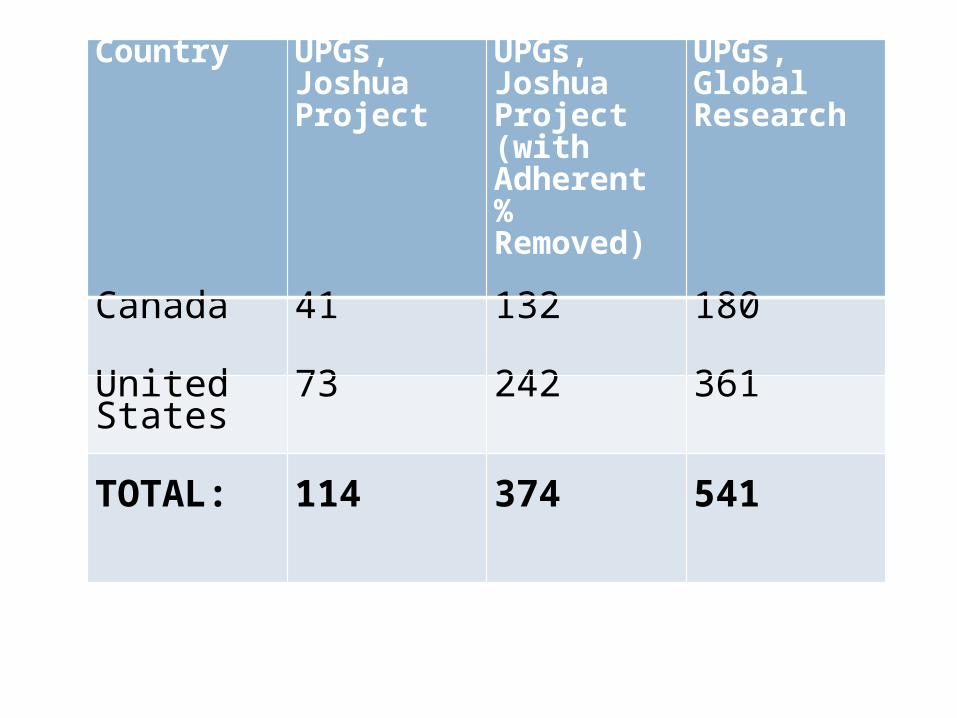
Country UPGs, Joshua Project
UPGs, Joshua Project (with Adherent % Removed)
UPGs, Global Research
Canada 41 132 180
United States
73 242 361
TOTAL: 114 374 541

Countries with the Largest
Numbers of UPGs

Rank Country Number of UPGs1 India 9412 China 3683 United States 3614 Brazil 1875 Canada 1806 Indonesia 1777 Mexico 1618 Sudan 1539 Congo, D. R. 15310 Nigeria 12111 Chad 11412 Cameroon 11413 Ethiopia 10814 Laos 10115 Tanzania 10016 France 9717 Nepal 9618 Pakistan 8719 South Sudan 8620 Colombia 79

THE STRANGERS NEXT DOOR
J. D. PayneUniversity Educators for Global Engagement
April 13-14, 2012


