journa l h om epa ge: www.elsev ier .com/ locate /socnet
he strength of family ties: A meta-analysis and meta-regression ofelf-reported social support and mortality
ran Shora,∗, David J. Roelfsb, Tamar Yogevc,d
Department of Sociology, McGill University, Room 713, Leacock Building, 855 Sherbrooke Street West, Montreal, Quebec H3A 2T7, CanadaDepartment of Sociology, University of Louisville, Louisville, KY, USAFaculty of Management, University of Haifa, Haifa, IsraelSaid Business School, Oxford University, Oxford, UK
r t i c l e i n f o
eywords:ocial supportamilyriendsortality
a b s t r a c t
Perceived social support has long been recognized as associated with better health and longevity. How-ever, important factors that may moderate this relationship have not been sufficiently explored. Theauthors used meta-analyses and meta-regressions to examine 178 all-cause mortality risk estimatesfrom 50 publications, providing data on more than 100,000 persons. The mean hazard ratio (HR) for
eta-analysiseta-regression
mortality among those with lower levels of perceived social support was 1.11 (95% confidence interval[CI]: 1.05, 1.17) among multivariate-adjusted HRs. Meta-regressions suggest that support from familymembers was more beneficial than support provided by friends, and that a moderate level of supportmay be enough to achieve positive results. The results also show that the importance of having supportincreases with age. No substantial difference was found between men and women with respect to therelationship between support and mortality.
“An ounce of blood is worth more than a pound of friendship”(Spanish proverb)
Social support typically refers to functions performed for thendividual by significant others (Umberson et al., 2010). The liter-ture (e.g., Lin and Westcott, 1991; Umberson and Montez, 2010)dentifies three main functions: Emotional support involves demon-trations of caring, esteem, encouragement and sympathy and theense that someone is loved and listened to. Informational supportefers to the provision of facts or advice which may help an individ-al solve problems or which guide the individual regarding possibleourses of action. Finally, instrumental support refers to offering orupplying help for material needs, practical tasks, and everydayroblems.
Over the last three decades, a growing number of studies haveocumented the association between self-reported social supportespecially emotional support) and various health and longevityutcomes. Initial research in the 1970s (e.g., Antonovsky (1972),erkman and Syme (1979), Cassel (1976), Cobb (1976), Hinkle1973), and Syme (1974)) set the stage for the creation of the theory
nd empirical analysis of networks, social support, isolation, andocial integration and their association with mortality (Berkman,986). Support has since been linked to better mental health
(Dalgard et al., 1995; Dressler, 1985; Mathiesen et al., 1999), tolower susceptibility to cancer (Ell et al., 1992; Hibbard and Pope,1993; Welin et al., 1992), infectious diseases (Cohen, 1991; Lee andRotheram-Borus, 2001; Patterson et al., 1996) and cardiovasculardiseases (Johnson and Hall, 1988; Lepore et al., 1993; Roy et al.,1998), and to lower overall and cause-specific mortality rates(Andre-Petersson et al., 2006; Berkman et al., 1992; Brummettet al., 2005; Hanson et al., 1989; Lyyra and Heikkinen, 2006; Zhanget al., 2007).
Other studies have demonstrated the influence of social rela-tionships on behavioral peer influences such as the consumptionof tobacco (Burg and Seeman, 1994), smoking cessation (Christakisand Fowler, 2008) and alcohol consumption (Rosenquist et al.,2010). Other effects of social relationships and networks includeobesity (Christakis and Fowler, 2007), weight-loss (Wing andJeffery, 1999), depression (Rosenquist et al., 2011), loneliness(Cacioppo et al., 2009), stress buffering (Berkman and Glass, 2000;Cohen, 2004), the spread of sexually transmitted or other infectiousdiseases (Bearman et al., 2004; Laumann and Youm, 1999; Meyerset al., 2003), and health related emotional states, such as opti-mism, happiness, depression, or suicidality (see review in Smithand Christakis, 2008).
Explanations for why social support is related to health out-
comes are diverse. First, some argue that social support (especiallyemotional) serves as a buffer and moderates the adverse healtheffects of stress and loneliness by providing active coping assis-tance and by fostering feelings of intimacy, attachment, control,
elf-worth, self-competence, and emotional sustenance (Barrera,000; Berkman et al., 2000; House, 2001; Uchino, 2006; Umbersont al., 2010; Umberson and Montez, 2010). Second, support wasound to promote positive health behaviors, including better adher-nce to medical treatment regimes, exercise, keeping a healthy diet,nd smoking cessation (Kaplan et al., 1994; Uchino, 2004, 2006;chino et al., 1996). This occurs either by way of actively regu-
ating one’s behaviors or by way of providing information aboutealthy practices (Cohen, 2004; Lyyra and Heikkinen, 2006). Third,esearch has shown that instrumental social support—for exampleuying food or providing transportation to medical appointmentsuring periods of illness—may be important in sustaining goodealth, especially among those who suffer from physical limita-ions (Bloom, 1990; Dupertuis et al., 2001; Schwarzer and Leppin,991).
Additional information on the association between social rela-ionships and health can be found in several prominent reviewse.g., Barrera, 2000; Berkman and Glass, 2000; Cohen and Syme,985; Smith and Christakis, 2008; Thoits, 1995). Such reviews indi-ate that spouses are the most studied dyad in the context of healthnd mortality. In particular a large body of research has focusedn divorce, widowhood and the hospitalization of a spouse (e.g.,hor et al., 2012a,b; Christakis and Allison, 2006; Christakis andwashyna, 2003; Elwert and Christakis, 2008; Subramanian et al.,008; Zivin and Christakis, 2007).
. Perceived (subjective) support vs. “objective” measuresf support
In the 1980s, research turned to modeling social supporthrough the examination of specific attributes of individuals’ socialetworks (Faber and Wasserman, 2002). A wide variety of net-ork attributes has been used to assess social support, including
ie strength, network size, centrality, density, reciprocity, tran-itivity, proximity and similarity (Faber and Wasserman, 2002;
alker et al., 1993). In their review of the social networks liter-ture, Smith and Christakis (2008) argue that the future of socialupport research continues to lie in the use of network measuresuch as these.
Two broad classes of support measures can be discerned fromhe network attributes listed above: perceived support measurese.g., strength, reciprocity) and “objective” support measures (e.g.,etwork size, density, proximity). Perceived social support haseen defined as “the extent to which an individual believes thatis/her needs for support, information, and feedback are fulfilled”Procidano and Heller, 1983: p. 2), as well as “the level of trust andonfidence in the availability of material and intangible assistancerom network members” (Uehara, 1990: p. 534). Self-reported, orerceived social support, is often assessed by asking individualso assess their ability to rely on others, having someone trustwor-hy to confide in, satisfaction with interactions and companionship,vailability and adequacy of emotional ties, and whether they recalleceiving tangible instrumental help with daily-life activities (e.g.,ndre-Petersson et al., 2006; Berkman et al., 1992; Brummett et al.,005; Penninx et al., 1997; Saito-Nakaya et al., 2006; Thong et al.,007).
In contrast, “objective” support refers to the presence of inter-ctions with persons who have the potential of providing socialupport. Objective support encompasses such diverse measuress participation in specific social or religious groups, counts ofarious types of members of an individual’s social network (e.g.,
umber of friends, children, siblings), and the frequency withhich an individual has contact with family and friends. Research
n the effect of proximity, for example, has determined that, whileroximity affects support generally, emotional and financial aid are
s 35 (2013) 626– 638 627
often provided effectively over large distances (Walker et al., 1993;Wellman and Wortley, 1990), and through internet and computersupported social networks have been found to be significant socialsupport providers (Hampton and Wellman, 2001, 2003; Wellmanand Gulia, 1997). In terms of network size, research has generallyfound that individuals with larger social networks receive moresocial support (Faber and Wasserman, 2002), both because ofthe direct effects of size and because of the diversity of supporttypes (emotional, instrumental, informational) that are likely tobe offered (see review in Plickert et al., 2007; Walker et al., 1993).
Both “subjective” and “objective” measures of support havestrengths and weaknesses. Research has found, for example, thatsubjective perceptions of social support may be influenced by one’spersonality, mood, or cultural upbringing (Lakey et al., 1996; Pierceet al., 1992; Procidano and Heller, 1983; Russell et al., 1997; Sarasonet al., 1991). But objective measures of support have their owndrawbacks. O’Reilly (1988: p. 869) points out that counts of net-work ties and other objective measures often capture multiplesupport dimensions, including “social participation, social isola-tion, state of personal well-being, and most often componentsof social networks”. Furthermore, studies have found that “sup-portive” social ties can sometimes encourage risky and unhealthybehaviors such as cigarette smoking, drug use, and reckless driving(Burg and Seeman, 1994; Uchino, 2006; Wills and Yaeger, 2003).Similarly, studies on negative social exchange suggest that somesocial relationships may actually add stress to a person’s life ratherthan reduce it, especially if the relationship is too demanding,insensitive and interfering, or if those with whom one is in contactsuffer from serious problems of their own (Edwards et al., 2001;Ruehlman and Karoly, 1991).
2. The present study
The present study focuses on the association between perceivedsocial support (instrumental, emotional, and informational) andall-cause mortality. The scope of the combined literatures on sub-jective and objective measures of support precludes a detailedanalysis of each within the same paper. The choice to focus solely onsubjective (perceived) support alone is driven by a desire to presentdepth rather than breadth.
This study is important for two main reasons. First, while themajority of existing studies report a positive effect of perceivedsocial support on longevity (e.g., Berkman et al., 1992; Helmert,2004; Nakanishi and Tatara, 2000; Walter-Ginzburg et al., 2005),about a third of the studies we surveyed found no significant effect,in particular when controlling for various demographic and behav-ioral factors (e.g., Gillum et al., 2008; Koenig, 1995; Okamoto et al.,2007; Oxman et al., 1995; Saito-Nakaya et al., 2006). We thus wishto explore whether the association remains significant even whencontrolling for other important explanatory factors.
Second, according to many of the field’s leading scholars (e.g.,Uchino, 2009; Umberson et al., 2010), the most pressing task instudying the association of social support and health today isidentifying and elucidating how social support affects health andmortality. In other words, it is essential to further explore the medi-ating and moderating factors (the “black box”) in this association.This process of understanding intervening mechanisms and therelative impact of each of these mechanisms on health outcomesis essential for designing effective interventions (Gottlieb, 2000;Seeman, 1996; Thoits, 1995, 2011). Hence, in the present study wefocus on the moderators of the social support-health association.
Both primary studies and meta-analysis methods are useful fortesting mediation and moderation hypotheses. However, a numberof possible social support moderators are more readily examinedusing the latter technique. For example, differences in cultural
6 etwor
nsgmbosmdl
dte22ecswr1rt
at(irlr
gbtSp1tvba
mraofrssiaoht
(WtpahiL
28 E. Shor et al. / Social N
orms and quality of medical care across time and between nationsuggest that the social support-health association may not be geo-raphically or temporally homogenous. While a new long-termulti-site primary study can be designed to test for interactions
etween social support and time or geographic region on healthutcomes, these tests are much more readily accomplished throughystematic comparisons of existing studies. Meta-analysis andeta-regression methods allow researchers to leverage recurring
ifferences between the sampling frames already examined in theiterature to explore important moderating and mediating factors.
A small number of meta-analytic reviews have already been con-ucted in the social support literature, including those that examinehe relationship between support and work-stress (Viswesvarant al., 1999), patient adherence to medical treatment (DiMatteo,004), and general health (Schwarzer and Leppin, 1989; Wang et al.,003). Of particular relevance is the meta-analysis of Holt-Lunstadt al. (2010), who examined associations between mortality out-omes and various social relationship measures, including socialupport. Looking predominantly at point estimates from modelsith the fewest statistical controls, Holt-Lunstad and co-workers
eported that low social support increased the risk of mortality (HR,.35; 95% CI, 1.22–1.49). Still, much remains unknown, especiallyegarding better-controlled models and potential moderators ofhe support-mortality relationship.
The present study offers an important addition to previous works it examines the heterogeneity in the support-mortality associa-ion stemming from differences in the identity of support providersfamily vs. friends vs. others); the degree to which support is lack-ng among those with lower levels of support (completely absent vs.elatively low); and the gender, age, health status, and geographicocation of the support recipient. We outline below the theoreticalelevance of these factors and the hypotheses associated with each.
Source of support: The literature on social support often sug-ests that support provided by family members and that providedy friends may have different consequences, both in terms of howhis support is perceived (Crohan and Antonucci, 1989; Rook, 1987;eeman and Berkman, 1988) and in terms of its mental-health andhysiological-health outcomes (Gallant et al., 2007; Matt and Dean,993; Potts, 1997). Generally, it is through one’s close relationshipshat one receives the greatest quantity of emotional aid, small ser-ices, and companionship (Wellman and Wortley, 1990), with theulk of support often coming from only a few strong ties (Wellmannd Frank, 2001; Wellman and Wortley, 1990).
Some scholars have suggested that support coming from friendsay be especially important, as friendships tend to be highly recip-
ocal (Wenger, 1990) and provide greater emotional support (Leend Ishii-Kuntz, 1987). Thoits (2011) further suggests that in timesf acute stress those who are very close to the individual (such asamily members) may be too emotionally invested in the person’secovery or even at times experience the person’s stressor them-elves. Furthermore, family members are often unfamiliar with thepecific demands of the stressor, as they have never experiencedt first hand, and therefore their information, advice, appraisals,nd encouragement may be relatively less effective. Friends, on thether hand, typically share similar characteristics and values, andence provide emotional and informational support more tailoredo the specific problem at hand (Miller and Darlington, 2002).
Other scholars, however, have argued that family membersespecially siblings, children, and spouses; see Wellman and
ortley, 1989, 1990) are more important for providing instrumen-al support (e.g., financial aid), assisting with practical tasks andhysical needs, and providing help during periods of illness. They
re also likely to be physically closer (often even living in the sameousehold), to feel a greater degree of commitment, and to be more
nvested in solving stress-causing problems (Dupertuis et al., 2001;aGreca et al., 1995; Primomo et al., 1990; Prohaska and Glasser,
ks 35 (2013) 626– 638
1996; Thoits, 2011). Extended kin, however, tend to provide lesssupport than closer family members (Wellman and Wortley, 1989).This idea that close family members may be especially importantin providing support is echoed in public notions on the importanceof family members in times of hardship. These notions are demon-strated by popular proverbs such as “In time of test, family is best”;“The family is a haven in a heartless world”; and most famously“Blood’s thicker than water, and when one’s in trouble best to seekout a relative’s open arms.” If that is indeed the case, we may expectthe protective health effects of family support to be greater thanthose of friends’ support.
Level of support: While most scholars agree that receiving sup-port is beneficial, it is not clear how much support one needs inorder for it to have a positive impact on health. In other words,is more always better? There may be a threshold level of sup-port which is enough to achieve positive outcomes, with additionalsupport beyond this threshold providing little benefit (or evenbecoming intrusive). Previous scholars have suggested that it iscomplete social isolation that is especially dangerous. Once this iso-lation is alleviated, even with a relatively low amount of supportand social relationships, additional supportive relationships mayproduce only negligible improvements in health and well-being(Brummett et al., 2001; House, 2001). If this is the case, we wouldexpect to observe increased rates of mortality primarily amongsocially-isolated persons.
Gender: Some former studies found that support is a signifi-cant predictor of improved health and survival in both men andwomen (Jylha and Aro, 1989; Seeman et al., 1993). Others, however,have argued that there are gender differences in the positive healtheffects of social support, with men enjoying these effects more thanwomen. This difference may be due to the fact that women oftenenjoy a wider range and more sources of social support than do men(Fuhrer et al., 1999b), thus making any additional support more sig-nificant for men. Indeed, the positive effects of support were oftenfound to be stronger in men than in women (House et al., 1982;Kaplan et al., 1988; Wilkins, 2003), though the opposite has alsobeen reported (Lyyra and Heikkinen, 2006).
Age: Many of the previous studies on social support and mortal-ity have focused on older-age persons (e.g., Andre-Petersson et al.,2006; Rodriguez-Artalejo et al., 2006; Rodriguez-Laso et al., 2007;Sato et al., 2007; Zhang et al., 2007). The (often implicit) assumptionbehind this choice is that the benefits of social support are espe-cially pronounced in older populations. This could be due to thefact that older people are more likely to suffer from loneliness andlack of intimacy, and therefore have more to gain from emotionalsupport. In addition, instrumental support, in particular assistancewith physical and medical needs is often required more at olderages. It is important to directly test these assumptions and assesswhether social support is indeed more beneficial for the elderly.
Medical conditions: Existing research has also examined theeffects of social support on the health and mortality of those suffer-ing from serious health conditions such as heart disease (Berkmanet al., 1992; Brummett et al., 2005; Burg et al., 2005; Rodriguez-Artalejo et al., 2006), kidney disease (Szeto et al., 2008; Thong et al.,2007), diabetes (Zhang et al., 2007), and cancer (Saito-Nakaya et al.,2006). These studies suggest that the beneficial effects of supportare especially important when one suffers from a life threaten-ing health condition, as this is when emotional and instrumentalsupport are most needed. If this is the case, we would expect anespecially heightened mortality risk among persons with low levelsof support and a serious pre-existing medical condition.
Cultural and geographic differences: Finally, cultural and geo-
graphic differences may also moderate the social support-mortalityassociation, though it remains unclear whether it is the socialaspects or the institutional aspects of culture that are more rele-vant. If the socio-cultural aspects are more important, one might
etwork
apAmsicttss
3
3
dposcWawlatalid
gcb
E. Shor et al. / Social N
rgue that lack of social support will have a greater effect on peo-le’s health and longevity in more traditional cultures (e.g., in Eastsian countries), where close family support (emotional and instru-ental) is considered part of the norm (especially at older ages;
ee Mason, 1992). However, if the institutional aspects are moremportant, support from friends and family members may be espe-ially crucial where institutional state support is weaker. Amonghe developed nations, support may therefore be especially impor-ant in the United States, because it lacks a universal healthcareystem and because welfare benefits may not be as generous as inome of the European nations (e.g., in Scandinavia).
. Materials and methods
.1. Search strategy and coding procedures
In June 2005 we conducted a search of electronic bibliographicatabases to retrieve all publications combining the concepts ofsychosocial stress, social isolation (including diverse measuresf social relationships such as social support, network size andocial participation), and all-cause mortality. We used 100 searchlauses for Medline, 97 for EMBASE, 81 for CINAHL, and 20 for
eb of Science (information on the search algorithms is avail-ble from authors upon request). Using this search as our base,e then iteratively searched (1) the bibliographies of eligible pub-
ications; (2) the lists of sources citing an eligible publication;nd (3) the sources identified as “similar to” an eligible publica-ion. We also consulted with experts in the field and conducteddditional searches for unpublished dissertations and other unpub-ished work. We exhausted the literature search and coding stagesn January 2009, after 3.5 years and 5 search iterations (for moreetails on these procedures see Roelfs et al., 2010, 2011a, 2013).
The two lead authors independently determined publication eli-ibility and extracted the data from the articles. Data were jointlyoded and publications were tracked throughout the process usingasic spreadsheets (see Section 1 of the Appendix A for full list
50 publication s inclu ded in meta -anal ysis of
social support and all-cause mortality
Abo ut 15,0 00 tit les
identi fied in
bibliograp hies of
coded publica tion s
1,57 0 publicat ions
identi fied by origina l
keyword sea rch
254 publica tions
tentat ively met st udy
incl usion criteria
22 publica tions
tentativel y met study
inclus ion criteria
145
exclu ded
8 excl uded 109
coded
14
code d
Total pool of 334 publications with m
relationships and all-cause
Keywor d Search
Fig. 1. Search strate
s 35 (2013) 626– 638 629
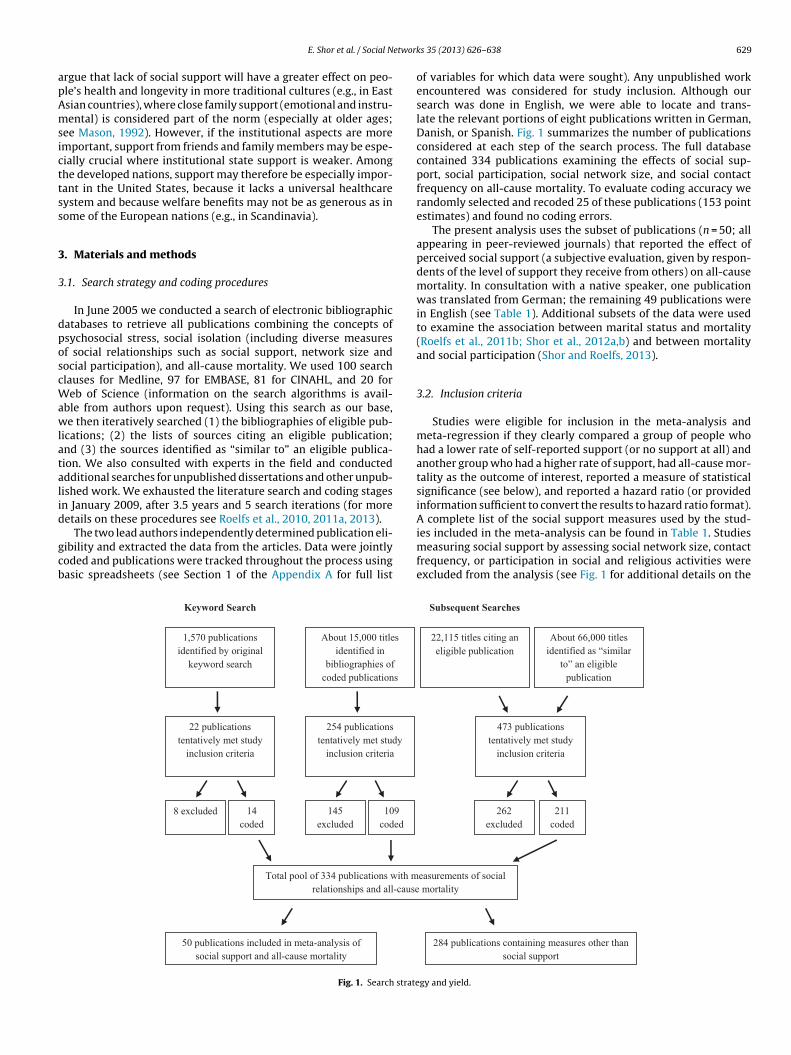
of variables for which data were sought). Any unpublished workencountered was considered for study inclusion. Although oursearch was done in English, we were able to locate and trans-late the relevant portions of eight publications written in German,Danish, or Spanish. Fig. 1 summarizes the number of publicationsconsidered at each step of the search process. The full databasecontained 334 publications examining the effects of social sup-port, social participation, social network size, and social contactfrequency on all-cause mortality. To evaluate coding accuracy werandomly selected and recoded 25 of these publications (153 pointestimates) and found no coding errors.
The present analysis uses the subset of publications (n = 50; allappearing in peer-reviewed journals) that reported the effect ofperceived social support (a subjective evaluation, given by respon-dents of the level of support they receive from others) on all-causemortality. In consultation with a native speaker, one publicationwas translated from German; the remaining 49 publications werein English (see Table 1). Additional subsets of the data were usedto examine the association between marital status and mortality(Roelfs et al., 2011b; Shor et al., 2012a,b) and between mortalityand social participation (Shor and Roelfs, 2013).
3.2. Inclusion criteria
Studies were eligible for inclusion in the meta-analysis andmeta-regression if they clearly compared a group of people whohad a lower rate of self-reported support (or no support at all) andanother group who had a higher rate of support, had all-cause mor-tality as the outcome of interest, reported a measure of statisticalsignificance (see below), and reported a hazard ratio (or providedinformation sufficient to convert the results to hazard ratio format).A complete list of the social support measures used by the stud-
ies included in the meta-analysis can be found in Table 1. Studiesmeasuring social support by assessing social network size, contactfrequency, or participation in social and religious activities wereexcluded from the analysis (see Fig. 1 for additional details on the
284 publ ica tions con tai ning measu res other than
social support
22,11 5 titles citing an
elig ible publication
About 66,000 titles
identifi ed as “similar
to” an el igible
publicatio n
473 pu blica tions
tentativel y met study
inclus ion criteria
262
excluded
211
code d
easure ments of so cial
mortality
Subsequ ent Searc hes
gy and yield.
630 E. Shor et al. / Social Networks 35 (2013) 626– 638
Table 1Studies included in the analyses.
Publication Data source Social support measure Country Years Sample size Mean HRa Number of HRs
Andre-Petersson et al. (2006) Men Born in 1914 Level of support (low vs. high) Sweden 1982–1996 414 1.36 1Berkman et al. (1992) EPESE Number of emotional support
sourcesUS 1982–1989 194 2.01 2
Brummett et al. (2005) MOSS 16-item Interpersonal SupportEvaluation List
US 1992–2002 2911 1.18 4
Burg et al. (2005) ENRICHD Level of support (low vs. high) US 1996–2002 1898 2.92 2Falk et al. (1992) Original data Availability/adequacy of
emotional supportSweden 1982–1989 500 1.53 2
Farmer et al. (1996) CCHP Receiving advice from relativesand others
US 1988–1992 596 1.98 3
Fry and Debats (2006) CSCOS Level of satisfaction withsupport received
Canada 1996–2002 380 1.42 4
Fuhrer et al. (1999a,b) PAQUID Level of satisfaction withsupport received
France 1988–1994 3777 0.93 8
Giles et al. (2005) ALSA Number of confidants Australia 1992–2002 1477 1.20 1Gillum et al. (2008) NHANES III Level of support (low vs. high) US 1988–2000 8450 0.92 1Gorkin et al. (1993) CAST-1 Level of support (low vs. high) US 1987–1988 1322 1.52 2Gustafsson et al. (1998) Original data Presence/absence of confidant Sweden 1986–1995 421 0.95 2Hanson et al. (1989) Men Born in 1914 Level (low vs. high)/adequacy
of supportSweden 1982–1987 500 1.48 6
Helmert (2004) LES of FIPR Level of personal support (lowvs. high)
Germany 1984–1998 7240 2.60 3
Helweg-Larsen et al. (2003) DANCOS Presence of someone to relyon/be around
Denmark 1987–1999 6693 1.13 2
Hibbard and Pope (1993) CHR Degree to which likes/feelssense of belonging
US 1970–1990 2502 1.12 2
Iwasaki et al. (2002) Komo-Ise study Number of reliable friends Japan 1993–2000 11,565 0.90 4Kaplan et al. (1994) KIHDRF study Availability/quality/satisfaction
with social supportFinland 1986–1992 2503 1.51 6
Kimmel et al. (1998) Original data Level of support (multi-factorscale)
US 1992–1996 295 1.25 1
Kimmel et al. (2000) Original data Level of support (multi-factorscale)
US 1992–1997 174 1.55 3
Koenig (1995) Original data Level of support (low vs. high) US 1987–1990 1011 0.94 1Liang et al. (1999) SHLSET Level of emotional and
instrumental support (low vs.high)
Taiwan 1989–1993 3505 1.22 1
Liang et al. (2000) SHLCAW Level of emotional support(low vs. high)
China 1991–1994 2765 1.13 1
Lyyra and Heikkinen (2006) Evergreen project Level of non-instrumentalsupport (low vs. high)
Finland 1990–2000 206 1.81 4
Mackenbach et al. (2005) GLOBE study Level of emotional support (intertiles)
Netherlands 1991–1998 5667 0.91 1
Maunsell et al. (1995) Original data Number of confidants Canada 1984–1992 224 1.79 10McClellan et al. (1993) Original data Presence of advising, social
interaction, material aid, andemotional support
US 1987–1988 249 0.65 14
Murata et al. (2005) Original data Presence of someone to counton during trouble times
Japan 1992–1999 1994 0.88 4
Murberg and Bru (2001) Original data Level of support (5-item and15-item scales)
Norway 1996–1998 119 1.14 3
Musick et al. (2004) ACL Number of confidants/level ofsupport
US 1986–1994 3617 1.06 2
Nakanishi and Tatara (2000) Original data Level of difficulty inrelationships
Japan 1992–1997 493 4.58 2
Nakanishi et al. (2003) Original data Level of difficulty inrelationships
Japan 1992–2001 741 4.29 6
Okamoto et al. (2007) Original data Level of support (low vs. high) Japan 1995–2001 784 0.57 2Oxman et al. (1995) Original data Number of confidants US 1989–1992 232 0.92 1Penninx et al. (1997) LASA Talking to others about
experiences and feelings/levelof loneliness
Netherlands 1992–1995 2829 1.14 4
Rodriguez-Laso et al. (2007) LSAL Presence of confidant/level ofemotional support (low vs.high)
Spain 1993–1999 1174 1.20 10
Romelsjo et al. (1992) Military records Presence of confidant Sweden 1969–1983 8168 0.89 2Rosengren et al. (1998) Original data Level of emotional support
(low vs. high)Sweden 1983–1995 717 1.87 1
Saito-Nakaya et al. (2006) Original data Number ofconfidants/satisfaction withconfidants (low vs. high)
Japan 1996–2004 238 1.02 6
Sato et al. (2007) Census, 1992 Level of emotional support(low vs. high)
Japan 1992–2004 637 0.99 8
Stimpson et al. (2007) HEPESE Can count on/talks aboutproblems with family/friends
US 1993–2000 1693 0.98 4
E. Shor et al. / Social Networks 35 (2013) 626– 638 631
Table 1 (Continued)
Publication Data source Social support measure Country Years Sample size Mean HRa Number of HRs
Szeto et al. (2008) Original data Level of support (MOS-SSS-Cscale)
China 2005–2005 167 1.01 1
Temkin-Greener et al. (2004) PACE Presence of instrumentalsupport giver
US 1998–1999 3138 1.24 1
Thong et al. (2007) NECOSAD-2 Level and adequacy ofemotional support, generalsupport, and companionship
Netherlands 1998–2005 528 0.94 14
Walter-Ginzburg et al. (2002) CALAS Presence of emotional support Israel 1989–1997 1340 0.87 2Walter-Ginzburg et al. (2005) CALAS Presence of emotional support
from children/non-familyIsrael 1989–1999 960 1.70 4
Welin et al. (2000) Original data Level of support (compositescale measure)
Sweden 1985–1997 275 1.60 2
Wilkins (2003) NPHS Presence of person to talk toabout feelings/concerns, tocount on during a crisis, getadvice from, and to make feelloved/cared for
Canada 1994–2001 2422 1.00 4
Wolinsky et al. (1995) LSOA Level of support (5-point scale) US 1983–1992 7527 1.18 2Zhang et al. (2007) LSOA Presence of emotional support
from children and level ofgeneral support (3-point scale)
US 1994–2000 1382 2.59 2
r andi
ic
3
trrrew(pmatwA
arlcwps(wnts(d
a2aWft
CI, 1.05–1.17; n = 121). These results show that, in studies control-ling for covariates, lower levels of emotional support are associatedwith an 11% higher risk of mortality.
a The mean HR was calculated with the low social support group in the numeratondicate a deleterious effect for low levels of support.
nclusion procedure). In total, the present study includes 50 publi-ations, which provided 178 point estimates for analysis.
.3. Methods
Statistical methods varied from study to study, necessitatinghe conversion of odds ratios, rate ratios, standardized mortalityatios, relative risks, and hazard ratios (HRs) into a common met-ic. All non-hazard-ratio point estimates were converted to hazardatios (the most frequently reported type). We used the standardrrors reported in the publications to calculate the inverse varianceeights. When not reported, standard errors were calculated using
1) confidence intervals, (2) t statistics, (3) �2 statistics, (4) exact-values, or (5) the midpoint of the p-value range. We sought toaximize the number of point estimates analyzed, capturing vari-
bility both between and within each publication. In cases wherehis caused a set of person-years to be represented more than once,e utilized a variance adjustment procedure (see Section 2 of theppendix A).
Two measures of study quality were adopted. First, we assigned 3-level subjective rating to each publication (individual studyatings are available upon request). Publications were rated asow quality if they contained obvious reporting or methodologi-al errors. Publications were rated as high quality if models wereell-specified and results were reported in detail. Second, we usedrincipal components factor analysis to construct a scale mea-ure (continuous, range = 0–10) using (1) the 5-year impact factorISI Web of Knowledge, 2009) of the journal in which the articleas published (missing values assigned a factor of 1); and (2) theumber of citations received per year since publication accordingo ISI Web of Knowledge. The Spearman correlation between theubjective rating and the factor-analysis-derived rating was lowrho = 0.296; p < 0.001), indicating that these two measures tappedifferent dimensions of quality.
Both Q-tests and I2 tests were used to assess the presencend magnitude of heterogeneity in the data (Huedo-Medina et al.,006). All analyses were calculated by maximum likelihood using
random effects model and matrix macros provided by Lipsey andilson (2001). The danger of selection bias was examined using a
unnel plot of the log HRs against sample size. Funnel plot asymme-ry was tested using weighted least squares regressions of the log
the high social support group in the denominator, so that results higher than 1.00
HRs on the inverse of the sample size (Moreno et al., 2009; Peterset al., 2006).
The following covariates were used in these analyses: (1) sourceof support1; (2) degree of support deficiency; (3) preexisting healthcondition; (4) proportion of respondents who were male; (5) meanage of sample at baseline, divided by 10; (6) age of the study (yearselapsed since the collection of baseline data), divided by 10; (7)geographic region; (8) sample size, log transformed; (9) a series ofvariables indicating the level of statistical adjustment; (10) subjec-tive quality rating (range = 1–3); and (11) the composite scale ofstudy quality.
4. Results
Table 2 provides descriptive statistics on the 178 mortalityrisk estimates included in this study (providing data on morethan 100,000 persons). Data were obtained from 50 studies pub-lished between 1989 and 2008 and covering 16 countries. Men andwomen are both well-represented in the dataset, as are variousage groups above the age of 40. The median of studies’ maximumfollow-up duration was 6.12 years. Of the HRs analyzed, 98% camefrom studies assigned a subjective quality rating of 2 (moderate)or 3 (high); the mean 5-year impact factor was 3.56; and the meannumber of citations received per year since publication was 4.12.
Table 3 presents the results of a number of meta-analyses (inaddition to sample size and heterogeneity information). All anal-yses were stratified by the level of statistical adjustment of therisk estimate. Persons with lower support levels had a significantlyhigher risk of death compared to those with higher support lev-els. The mean unadjusted HR was 1.19 (95% confidence interval[CI], 1.09–1.42; n = 44 HRs); the mean age-adjusted HR was 1.42(95% CI, 1.20–1.68; n = 9); and the mean HR among point esti-mates adjusted for age and additional covariates was 1.11 (95%
1 The three categories of this variable are (1) family members (including both fam-ily of origin and family of procreation), (2) friends, and (3) other people/unknown,as they were defined in the relevant articles from which data were extracted.
632 E. Shor et al. / Social Networ
Table 2Distribution of mortality risk estimates (n = 178) in the analysis by selected variables(%).
Variable Distribution
Source of supportFamily 25.3Friends 11.8Others/unknown 62.9
a All meta-analyses calculated by maximum likelihood using a random effects modelindicate situations where n ≤ 1 and meaningful mean HR could not be calculated.
b The number and type of covariates varies between studies.* p < 0.05.
** p < 0.01.*** p < 0.001.
ks 35 (2013) 626– 638
4.1. Subgroup meta-analyses and meta-regression analyses
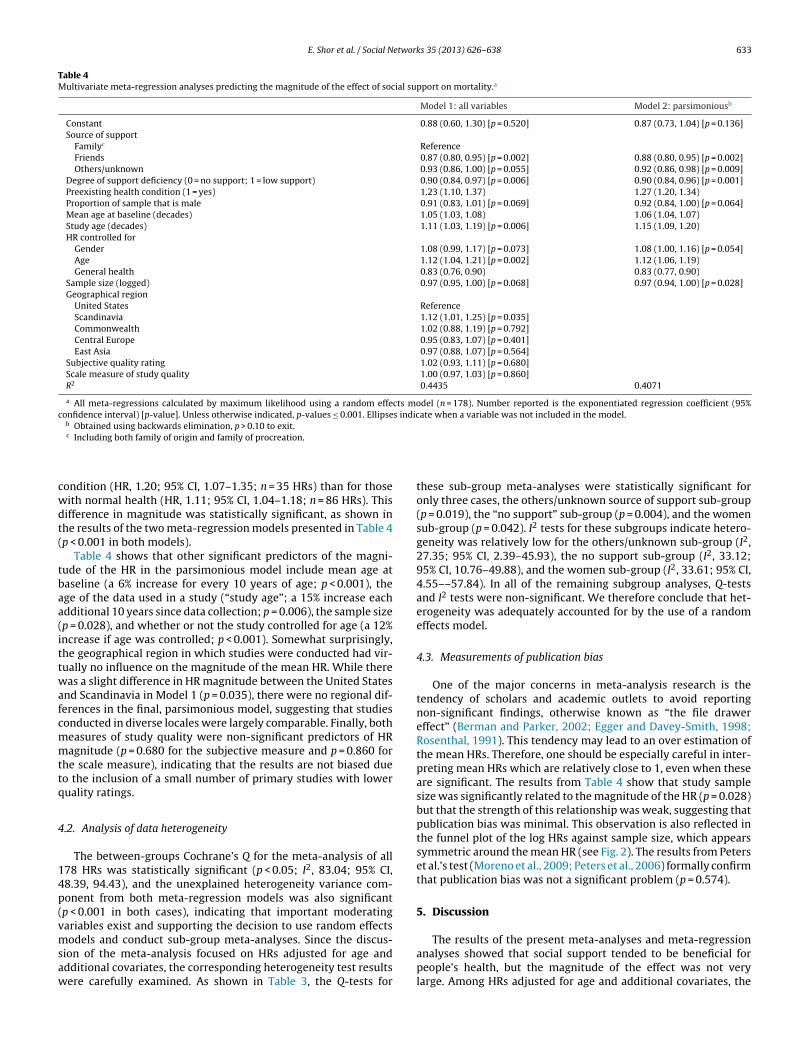
In the interest of presenting conservative results, from this pointforward the discussion of Table 3 will focus only on HRs adjusted forage and additional covariates (constituting over two thirds of theHRs in our study). A number of important findings emerge fromthis table. First, the source of emotional support is very importantin providing protective benefits for the individual. Individuals whoreceived less support from family members or no such support hada higher rate of death compared to those who received relativelyhigh levels of family support (HR, 1.15; 95% CI, 1.04–1.27; n = 34HRs). However, no similar effect was found when the source of emo-tional support was one’s friends. Table 4 presents the results of twometa-regression analyses, the first model including all the variablesin the analysis and the second including only those variables sig-nificant at p < 0.10. Both models show that, in comparison to familysources of support, the benefits of received support are lower whenthe support came from either friends (p = 0.002) or acquaintances(p = 0.009).
A second interesting finding presented in Table 3 is that low lev-els of support may be sufficient to prevent the deleterious effectsof support deficiency. Persons who reported low levels of supportdid not have a significantly higher risk of mortality compared tothose who enjoyed high levels of support (p = 0.089). However,those who reported no support at all had a significantly higherrisk when compared to those with high levels of support (HR, 1.17;95% CI, 1.09–1.25; n = 74 HRs). As shown by the meta-regressionresults presented in Table 4, the difference in the magnitude of theeffect between those who received no support at all and those whoreceived at least some support is statistically significant in bothModel 1 and Model 2 (p = 0.006 and p = 0.001 respectively).
Thirdly, Table 3 shows that lower support was associated withan increased risk of mortality for both women and men. The mag-nitude of the mean HR was approximately the same for women(HR, 1.13; 95% CI, 1.02–1.25; n = 29 HRs) and for men (HR, 1.09;95% CI, 1.00–1.19; n = 35). The results shown in Table 4 confirmthat there was no significant difference in risk between men andwomen (p = 0.069 in Model 1 and p = 0.064 in Model 2). Finally, the
results presented in Table 3 show that low social support was harm-ful regardless of one’s health status, but that the magnitude of theeffect was greater for those who suffered from a preexisting health
ative to those with higher levels of support.a
age only Adjusted for age and additional covariatesb
a All meta-regressions calculated by maximum likelihood using a random effects model (n = 178). Number reported is the exponentiated regression coefficient (95%confidence interval) [p-value]. Unless otherwise indicated, p-values ≤ 0.001. Ellipses indicate when a variable was not included in the model.
b Obtained using backwards elimination, p > 0.10 to exit.
cwdt(
tbaa(ittwafcmmttq
4
14p(vmsaw
c Including both family of origin and family of procreation.
ondition (HR, 1.20; 95% CI, 1.07–1.35; n = 35 HRs) than for thoseith normal health (HR, 1.11; 95% CI, 1.04–1.18; n = 86 HRs). Thisifference in magnitude was statistically significant, as shown inhe results of the two meta-regression models presented in Table 4p < 0.001 in both models).
Table 4 shows that other significant predictors of the magni-ude of the HR in the parsimonious model include mean age ataseline (a 6% increase for every 10 years of age; p < 0.001), thege of the data used in a study (“study age”; a 15% increase eachdditional 10 years since data collection; p = 0.006), the sample sizep = 0.028), and whether or not the study controlled for age (a 12%ncrease if age was controlled; p < 0.001). Somewhat surprisingly,he geographical region in which studies were conducted had vir-ually no influence on the magnitude of the mean HR. While thereas a slight difference in HR magnitude between the United States
nd Scandinavia in Model 1 (p = 0.035), there were no regional dif-erences in the final, parsimonious model, suggesting that studiesonducted in diverse locales were largely comparable. Finally, botheasures of study quality were non-significant predictors of HRagnitude (p = 0.680 for the subjective measure and p = 0.860 for
he scale measure), indicating that the results are not biased dueo the inclusion of a small number of primary studies with loweruality ratings.
.2. Analysis of data heterogeneity
The between-groups Cochrane’s Q for the meta-analysis of all78 HRs was statistically significant (p < 0.05; I2, 83.04; 95% CI,8.39, 94.43), and the unexplained heterogeneity variance com-onent from both meta-regression models was also significantp < 0.001 in both cases), indicating that important moderatingariables exist and supporting the decision to use random effects
odels and conduct sub-group meta-analyses. Since the discus-
ion of the meta-analysis focused on HRs adjusted for age anddditional covariates, the corresponding heterogeneity test resultsere carefully examined. As shown in Table 3, the Q-tests for
these sub-group meta-analyses were statistically significant foronly three cases, the others/unknown source of support sub-group(p = 0.019), the “no support” sub-group (p = 0.004), and the womensub-group (p = 0.042). I2 tests for these subgroups indicate hetero-geneity was relatively low for the others/unknown sub-group (I2,27.35; 95% CI, 2.39–45.93), the no support sub-group (I2, 33.12;95% CI, 10.76–49.88), and the women sub-group (I2, 33.61; 95% CI,4.55––57.84). In all of the remaining subgroup analyses, Q-testsand I2 tests were non-significant. We therefore conclude that het-erogeneity was adequately accounted for by the use of a randomeffects model.
4.3. Measurements of publication bias
One of the major concerns in meta-analysis research is thetendency of scholars and academic outlets to avoid reportingnon-significant findings, otherwise known as “the file drawereffect” (Berman and Parker, 2002; Egger and Davey-Smith, 1998;Rosenthal, 1991). This tendency may lead to an over estimation ofthe mean HRs. Therefore, one should be especially careful in inter-preting mean HRs which are relatively close to 1, even when theseare significant. The results from Table 4 show that study samplesize was significantly related to the magnitude of the HR (p = 0.028)but that the strength of this relationship was weak, suggesting thatpublication bias was minimal. This observation is also reflected inthe funnel plot of the log HRs against sample size, which appearssymmetric around the mean HR (see Fig. 2). The results from Peterset al.’s test (Moreno et al., 2009; Peters et al., 2006) formally confirmthat publication bias was not a significant problem (p = 0.574).
5. Discussion
The results of the present meta-analyses and meta-regressionanalyses showed that social support tended to be beneficial forpeople’s health, but the magnitude of the effect was not verylarge. Among HRs adjusted for age and additional covariates, the
that examined the effects of social participation in Africa, in South
Fig. 2. Funnel plot of hazard ratios (logged) vs. sample size.
isk of death for people with lower social support levels was 11%igher than the risk among those with higher levels of socialarticipation. While this effect is statistically significant, its mag-itude is lower than that found in another recent meta-analysisf social support and mortality (Holt-Lunstad et al., 2010), whicheported a 35% increase. The difference between these results andhose of the present study is likely the result of differences innclusion criteria. Holt-Lunstad and co-workers selected risk esti-
ates that were minimally-adjusted for covariates. The presenttudy included both minimally-adjusted risk estimates and thosehat were statistically-adjusted for potential confounders of theupport-mortality association. The comparison of the two sets ofisk estimates highlights the importance of controlling for eachespondent’s health status at baseline. The results presented inable 4 show that the mean HR among studies that controlled foraseline health was 17% lower when compared to those that didot (p < 0.001). Future studies should therefore make every efforto control, at the very least, for general health, age, and gendercontrolling for the latter two factors was also found to be impor-ant in the present study) in order to reduce bias when estimatinghe magnitude of the effect.
Furthermore, the magnitude of the effect was not uniform acrossll of the subgroups examined. One of the interesting findings com-ng out of our study is that while support from family memberslearly decreases people’s risk of mortality, support from friendsas not found to have a significant effect. These findings provide
acking for the common belief that support from family mem-ers is invaluable in times of need and is not easily replaced byupport from others. The support mechanisms provided primar-ly by family members, including discussions of health issues andymptoms (Brody et al., 1983; Stoller et al., 1997) and the provi-ion of physical and material assistance when one is ill (Dupertuist al., 2001; Friedman, 1993; Primomo et al., 1990), appear to bespecially important for people’s health and longevity.
That said, one needs to be careful in the interpretation of theseesults, especially regarding the non-significant effect of supportrom friends. First, the number of HRs classified as friends-onlyupport was relatively low (only 14 HRs). More than half of theoint estimates (73 out of 121 HRs adjusted for age and additionalovariates) did not report the specific source of support, and its possible that many of these were based primarily on supportrom friends. Given that the effect of support in this “unidentified-
ource” subgroup was comparable to the effect in the family-onlyupport group (a 15% higher risk for those with low support in bothases) it is quite possible that the effect of support from friends was
ks 35 (2013) 626– 638
more substantial than could be assessed in the present study. Suchcaution is warranted as previous research has often found that sup-port from friends had a substantial effect on morale and emotionalcoping (Dupertuis et al., 2001; LaGreca et al., 1995).
A second interesting finding has to do with the amount of sup-port provided. We found that even low levels of support wereenough to provide a protective effect, as there was no significantdifference between those with some support and those with moresubstantial support. This finding is in line with the theoretical sup-position of previous scholars (Brummett et al., 2001; House, 2001),who argued that the main dangers to one’s health come from socialisolation. Thus, even a moderately low amount of support may behelpful in alleviating feelings of isolation. However, one must becareful not to conclude that higher levels of support are redundantin terms of health outcomes. Substantial differences remain in howstudies assess support levels, and further research is needed thatdirectly compares various levels of support.
In accordance with our hypothesis, the support recipient’s levelof need is an important moderator of the support-mortality asso-ciation. First, we found that social support is especially beneficialat older ages, most likely because older people tend to suffer frommore health problems and need greater instrumental and emo-tional assistance as a result. As shown in Table 4, each ten yearincrease in the mean age of a sample was associated with a 6%increase in the mean HR (p < 0.001). In addition, we found that thelack of social support was more detrimental among those who suf-fered from a serious health condition (such as cancer, heart disease,and kidney disease) prior to the beginning of the study. As shown inTable 4, the mean HR was 27% higher for those with documentedhealth problems when compared to those with a normal healthdistribution (p < 0.001). These findings highlight the importance ofassessing support availability among older populations and thosewho suffer from serious illnesses. Health-care providers and socialwelfare advocates should pay special attention to these popula-tions, as they are the ones most likely to suffer if instrumental oremotional help are unavailable.
The findings of the present study also show that the lack ofsocial support is equally detrimental for both men and women.As shown in Table 4, no significant difference in the magnitudeof the mean HR exists between the two genders (p = 0.064). How-ever, this does not mean that there is no relationship betweengender and the likelihood that one will fall into the low social sup-port group. For example, Kalmijn (2007) showed that when parentsdivorce, the male partner tends to experience a more drastic reduc-tion in social support from their children than does the femalepartner. Nonetheless, the results of the present study show thatboth men and women suffer from being in the low social supportgroup.
Finally, in contrast to our hypothesis, there was very little dif-ference in the magnitude of the relative mortality risk betweenthe various geographical regions. We did not find support for theidea that a lack of social support would be especially detrimentalin those places with stronger norms of family support. Likewise,we did not find support for the supposition that a lack of sup-port would be more harmful in places with less universal healthcare or welfare systems. The findings suggest instead that the pos-itive effects of social support on health are quite universal acrosscultures and geographical locations. We need to be careful, how-ever, not to assume that the mechanisms linking social support andhealth outcomes are identical across cultures and regions. It shouldfurther be noted that almost none of the research reported in the lit-erature was conducted in developing nations. We found no studies
or Central Asia, or in South or Central America. It is important toconduct studies in these locales before concluding that the effectsof social participation are indeed uniform across cultures.
E. Shor et al. / Social Networks 35 (2013) 626– 638 635
Table A1Illustration of adjustments made to the inverse variance weights to correct for multiple reporting.
Study Gender Age Original inverse variance weight Corrected inverse variance weight
Study X Men only All ages 4 4Study X Women only All ages 2 2Study Y Men only 20–44 5 5Study Y Men only 45–65 7 7Study Y Men only 65+ 3 3Study Z Men only All ages 12 6Study Z Women only All ages 20 10Study Z Both men and women 20–44 16 8
2416
A
(pn(lmobmii(tfpal(dps(perbi
wmwu(gw(WalTwto
tatda
Study Z Both men and women 45–65
Study Z Both men and women 65+
ppendix A. Additional methodological information
Section 1: Variables for which data were sought: (1) Author names;2) author genders; (3) publication date; (4) publication title; (5)lace of publication; (6) characteristics of low support group (e.g.,ever-married persons); (7) characteristics of high support groupe.g., married persons); (8) characteristics shared by both high andow support groups; (9) percent of the sample that was male; (10)
inimum and maximum age; (11) mean age; (12) ethnicity; namef data source used; (13) geographic location of study sample; (14)aseline start date (day, month, year); (15) baseline end date (day,onth, year); (16) follow-up end date (day month, year); (17) max-
mum follow-up duration; (18) average follow-up duration; (19)nformation on timing of support loss relative to baseline start date;20) information on the structure of the follow-up period (e.g., werehere any gaps between the end of baseline and the beginning ofollow-up?); (21) statistical technique used; (22) total number ofersons analyzed in the publication; (23) total number of personsnalyzed for the specific effect size; (24) number of persons in theow support group; (25) number of deaths in the low support group;26) number of persons in the high support group; (27) number ofeaths in the high support group; (28) death rate in the low sup-ort group; (29) death rate in the high support group; (30) effectize; (31) confidence interval; (32) standard error; (33) t-statistic;34) Chi-square statistic; (35) minimum and maximum values for-value; (36) full list of control variables used; (37) date of dataxtraction; (38) subjective quality rating; (39) number of citationseceived by publication according to Web of Science; (40) num-er of citations received according to Google Scholar; (41) 5-year
mpact factor for place of publication.Section 2: Additional information on the adjustment of variance
eights: In cases where a given set of person-years was representedore than once, we utilized a variance adjustment procedurehich divides the variance weight by the number of times a partic-lar cohort appears in an analysis. For example, when a publicationsee hypothetical Study X in Table A1) reported mortality risks byender sub-groups alone the data requires no adjustment. Like-ise, when a study reported mortality risks by age group alone
see hypothetical Study Y) the data also requires no adjustment.hen a publication first reports mortality risks by gender and then
gain by age (see hypothetical Study Z) however, this creates a vio-ation of independence because each person is represented twice.o correct for this double-counting, each of the variance weightsas adjusted to half of its original value, thus preserving informa-
ion on the gender and age variables but counting each subject onlynce.
Variance adjustment was performed using a syntax designedo identify sample overlap in terms of gender, level of statistical
djustment, ethnicity, restrictions on the sampling frame (e.g., ifhe sample consisted of only veterans), age range, and follow-upuration. With respect to gender, for example, the syntax examinedll point estimates taken from studies using the same data source
12 8
(e.g., the 1960 U.S. census) and individually classified each pointestimate into one of three gender categories (men only, womenonly, and a gender mixture). If the point estimates correspond-ing to a single data source contained examples where men andwomen were analyzed separately and examples where men andwomen were analyzed together, we concluded that sample dupli-cation was present and the gender adjustment factor was set to 0.5.If, on the other hand, all point estimates corresponding to a partic-ular data source were of the same type (i.e., only men and womenseparately or only men and women together), we concluded thatsample duplication was not present with respect to gender and thegender adjustment factor was set to 1 (i.e., no adjustment to thevariance weight). The calculation of the remaining adjustment fac-tors for level of statistical adjustment, ethnicity, restrictions on thesampling frame, age range, and follow-up duration were structuredsimilarly. In the few instances when one or more point estimatescorresponding to a single data source matched on all six of the abovecriteria, we manually examined each case to determine where thesource of duplication lay and to subsequently determine a seventhand final adjustment factor.
The adjusted variance weight used in the meta-regressionswas calculated by taking the product of the original, unadjustedvariance weight and each of the seven adjustment factors. Theadjusted variance weight used in each of the meta-analyses wascalculated similarly, but did not include the adjustment factors cor-responding to the stratification variables used. For example, thecalculation of the adjusted variance weights for the meta-analysesthat were stratified by gender and statistical-adjustment-level didnot include the gender or the statistical-adjustment-level adjust-ment factors.
References
Andre-Petersson, L., Hedblad, B., Janzon, L., Stergren, P.-O., 2006. Social support andbehavior in a stressful situation in relation to myocardial infarction and mortal-ity: who is at risk? Results from prospective cohort study “Men Born in 1914,”Malmo, Sweden. International Journal of Behavioral Medicine 13, 340–347.
Antonovsky, A., 1972. Breakdown: a needed fourth step in the conceptual armamen-tarium of modern medicine. Social Science & Medicine 6, 537–544.
Barrera, M., 2000. Social support research in community psychology. In: Rap-paport, J., Seidman, E. (Eds.), Handbook of Community Psychology. KluwerAcademic/Plenum Publishers, New York, p. 215-245.
Bearman, P.S., Moody, J., Stovel, K., 2004. Chains of affection: the structure of adoles-cent romantic and sexual networks. American Journal of Sociology 110, 44–91.
Berkman, L., 1986. Social networks, support and health: taking the next step forward.American Journal of Epidemiology 123, 559–562.
Berkman, L.F., Glass, T., 2000. Social integration, social networks, social supportand health. In: Berkman, L.F., Kawachi, I. (Eds.), Social Epidemiology. OxfordUniversity Press, New York.
Berkman, L.F., Glass, T., Brissette, I., Seeman, T.E., 2000. From social integration tohealth: dukheim in the new millennium. Social Science & Medicine 51, 843–857.
Berkman, L.F., Leo-Summers, L., Horwitz, R.I., 1992. Emotional support and sur-
vival after myocardial infarction – a prospective, population-based study of theelderly. Annals of Internal Medicine 117, 1003–1009.
Berkman, L.F., Syme, S.L., 1979. Social networks, host-resistance, and mortality –9-year follow-up-study of alameda county residents. American Journal of Epi-demiology 109, 186–204.
loom, J.R., 1990. The relationship of social support and health. Social Science &Medicine 30, 635–637.
rody, E.M., Kleban, M.H., Moles, E., 1983. What older people do about their day-to-day mental and physical health symptoms. Journal of the American GeriatricsSociety 31, 489–498.
rummett, B.H., Barefoot, J.C., Siegler, I.C., Clapp-Channing, N.E., Lytle, B.L., Bosworth,H.B., Williams, R.B., Mark, D.B., 2001. Characteristics of socially isolated patientswith coronary artery disease who are at elevated risk for mortality. Psychoso-matic Medicine 63, 267–272.
rummett, B.H., Mark, D.B., Siegler, I.C., Williams, R.B., Babyak, M.A., Clapp-Channing,N.E., Barefoot, J.C., 2005. Perceived social support as a predictor of mortalityin coronary patients: effects of smoking, sedentary behavior, and depressivesymptoms. Psychosomatic Medicine 67, 40–45.
urg, M.M., Barefoot, J., Berkman, L., Catellier, D.J., Czajkowski, S., Saab, P., Huber, M.,DeLillo, V., Mitchell, P., Skala, J., Taylor, C.B., 2005. Low perceived social supportand post-myocardial infarction prognosis in the enhancing recovery in coronaryheart disease clinical trial: the effects of treatment. Psychosomatic Medicine 67,879–888.
urg, M.M., Seeman, T.E., 1994. Families and health: the negative side of social ties.Annals of Behavioral Medicine 16, 109–115.
acioppo, J.T., Fowler, J.H., Christakis, N.A., 2009. Alone in the crowd: the structureand spread of loneliness in a large social network. Journal of Personality andSocial Psychology 97, 977–991.
assel, J., 1976. The contribution of the social environment to host resistance. Amer-ican Journal of Epidemiology 104, 107–123.
hristakis, N.A., Allison, P., 2006. Mortality after the hospitalization of a spouse. TheNew England Journal of Medicine 354, 719–730.
hristakis, N.A., Fowler, J.H., 2007. The spread of obesity in a large social networkover 32 years. New England Journal of Medicine 357, 370–379.
hristakis, N.A., Fowler, J.H., 2008. The collective dynamics of smoking in a largesocial network. New England Journal of Medicine 358, 2249–2258.
hristakis, N.A., Iwashyna, T.J., 2003. The health impact of health care on families:a matched cohort study of hospice use by decedents and mortality outcomes insurviving, widowed spouses. Social Science & Medicine 57, 465–475.
obb, S., 1976. Social support as a moderator of life stress. Psychosomatic Medicine38, 300–314.
ohen, S., 1991. Social supports and physical health: symptoms, health behav-iors and infectious diseases. In: Cummings, E.M., Green, A.L., Karraker, K.H.(Eds.), Life-Span Developmental Psychology: Perspectives on Stress and Coping.Lawrence Erlbaum Associates, Inc, Hillsdale, NJ.
ohen, S., 2004. Social relationships and health. American Psychologist 59, 676–684.ohen, S., Syme, S.L., 1985. Social Support and Health. Academic, Orlando, FL.rohan, S.E., Antonucci, T.C., 1989. Friends as a source of social support in old age. In:
Adams, R.G., Blieszner, R. (Eds.), Older Adult Friendship: Structure and Process.Sage, Newbury Park, CA.
algard, O.S., Bjork, S., Tambs, K., 1995. Social support, negative life events andmental health. The British Journal of Psychiatry, 166.
iMatteo, M.R., 2004. Social support and patient adherence to medical treatment: ameta-analysis. Health Psychology 23, 207–218.
ressler, W., 1985. Extended family relationships, social support, and mental healthin a southern black community. Journal of Health and Social Behavior 26, 39–48.
upertuis, L.L., Aldwin, C.M., Bosse, R., 2001. Does the source of support matter fordifferent health outcomes? findings from the normative aging study. Journal ofAging and Health 13, 494–510.
dwards, K.J., Hershberger, P.J., Russell, R.K., Markert, R.J., 2001. Stress, negativesocial exchange, and health symptoms in university students. Journal of Amer-ican College Health 50, 75–79.
gger, M., Davey-Smith, G., 1998. Meta-analysis: bias in location and selection ofstudies. British Medical Journal 316, 61–66.
ll, K., Nishimoto, R., Mediansky, L., Mantell, J., Hamovitch, M., 1992. Social relations,social support and survival among patients with cancer. Journal of Psychoso-matic Research 36, 531–541.
lwert, F., Christakis, N.A., 2008. The effect of widowhood on mortality by thecauses of death of both spouses. American Journal of Public Health 98,2092–2098.
aber, A.D., Wasserman, S., 2002. Social support and social networks: syn-thesis and review. In: Levy, J.A., Pescosolido, B.A. (Eds.), Social Networksand Health: Advances in Medical Sociology. Elsevier Science, Amsterdam,pp. 29–72.
alk, A., Hanson, B.S., Isacsson, S.-O., Ostergren, P.-O., 1992. Job strain and mortality inelderly men: social network, support, and influence as buffers. American Journalof Public Health 82, 1136–1139.
armer, I.P., Meyer, P.S., Ramsey, D.J., Goff, D.C., Wear, M.L., Labarthe, D.R., Nichaman,M.Z., 1996. Higher levels of social support predict greater survival follow-ing acute myocardial infarction: the corpus christi heart project. BehavioralMedicine 22, 59–66.
riedman, M.M., 1993. Social support sources and psychological well-being in olderwomen with heart disease. Research in Nursing and Health 16, 405–413.
ry, P.S., Debats, D.L., 2006. Sources of life strengths as predictors of late-life mortality
and survivorship. International Journal of Aging and Human Development 62,303–334.
uhrer, R., Dufouil, C., Antonucci, T.C., Shipley, M.J., Helmer, C., Dartigues, J.F., 1999a.Psychological disorder and mortality in french older adults: do social relationsmodify the association? American Journal of Epidemiology 149, 116–126.
ks 35 (2013) 626– 638
Fuhrer, R., Stansfeld, S.A., Chemali, J., Shipley, M.J., 1999b. Gender, social relations andmental health: prospective findings from and occupational cohort (Whitehall IIStudy). Social Science & Medicine 48, 77–87.
Gallant, M.P., Spitze, G.D., Prohaska, T.R., 2007. Help or hindrance? How family andriends influence chronic illness self-management among older adults. Researchon Aging 29, 375–409.
Giles, L.C., Glonek, G.F.V., Luszcz, M.A., Andrews, G.R., 2005. Effect of social networkson 10 year survival in very old australians: the Australian longitudinal study ofaging. Journal of Epidemiology and Community Health 59, 574–579.
Gillum, R.F., King, D.E., Obisesan, T.O., Koenig, H.G., 2008. Frequency of attendance atreligious services and mortality in a US national cohort. Annals of Epidemiology18, 124–129.
Gorkin, L., Schron, E.B., Brooks, M.M., Wiklund, I., Kellen, J., Verter, J., Schoenberger,J.A., Pawitan, Y., Morris, M., Shumaker, S., 1993. Psychosocial predictors of mor-tality in the cardiac arrhythmia suppression trial-1 (cast-1). American Journalof Cardiology 71, 263–267.
Gottlieb, B.H., 2000. Selecting and planing support interventions. In: Cohen, S.,Underwood, L.G., Gottlieb, B.H. (Eds.), Social Support Measurement and Inter-vention: A Guide for Health and Social Scientists. Oxford University Press, NewYork, pp. 195–220.
Gustafsson, T.M., Isacson, D.G.L., Thorslund, M., 1998. Mortality in elderly men andwomen in a swedish municipality. Age and Ageing 27, 585–593.
Hampton, K., Wellman, B., 2001. Long distance community in the network soci-ety: contact and support beyond Netville. American Behavioral Scientist 45,476–495.
Hampton, K., Wellman, B., 2003. Neighboring in Netville: how the internet supportscommunity and social capital in a wired suburb. City and Community 2, 277–311.
Hanson, B.S., Isacsson, S.-O., Janzon, L., Lindell, S.-E., 1989. Social network and socialsupport influence mortality in elderly men: prospective population study of“Men Born in 1914,” Malmö, Sweden. American Journal of Epidemiology 130,100–111.
Helmert, U., 2004. Personal support and mortality: a cohort analysis of the NationalQuestionnaire Survey 1984–86. Sozial und Präventivmedizin 49, 318–327.
Helweg-Larsen, M., Kjoller, M., Thoning, H., 2003. Do age and social relations mod-erate the relationship between self-rated health and mortality among adultDanes? Social Science & Medicine 57, 1237–1247.
Hibbard, J.H., Pope, C.R., 1993. The quality of social roles as predictors of morbidityand mortality. Social Science and Medicine 36, 217–225.
Hinkle, L.E., 1973. The concepts of “stress” in the biological and social sciences.Science, Medicine and Man 1, 31–48.
Holt-Lunstad, J., Smith, T.B., Layton, J.B., 2010. Social relationships and mortality risk:a meta-analytic review. PLoS Medicine 7, 1–20.
House, J.S., 2001. Social isolation kills, but how and why? Psychosomatic Medicine63, 273–274.
House, J.S., Robbins, C., Metzner, H.L., 1982. The association of social relationshipsand activities with mortality: prospective evidence from the tecumseh commu-nity health study. American Journal of Epidemiology 116, 123–140.
Huedo-Medina, T.B., Sanchez-Meca, J., Marin-Martinez, F., 2006. Assessing hetero-geneity in meta-analysis: Q statistic or I2 index? Psychological Methods 11,193–206.
ISI Web of Knowledge, 2009. Journal Citation Reports http://wokinfo.com/products tools/analytical/jcr/
Iwasaki, M., Otani, T., Sunaga, R., Miyazaki, H., Xiao, L., Wang, N., Yosiaki, S., Suzuki,S., 2002. Social networks and mortality based on the Komo-Ise cohort study inJapan. International Journal of Epidemiology 31, 1208–1218.
Johnson, J.V., Hall, E.M., 1988. job strain, work place social support, andcardiovascular-disease – a cross-sectional study of a random sample of theSwedish working population. American Journal of Public Health 78, 1336–1342.
Jylha, M., Aro, S., 1989. Social ties and survival among the elderly in Tampere, Finland.International Journal of Epidemiology 18, 158–164.
Kalmijn, M., 2007. Gender differences in the effects of divorce, widowhood andremarriage on intergenerational support: does marriage protect fathers? SocialForces 85, 1079–1104.
Kaplan, G.A., Salonen, J.T., Cohen, R.D., Brand, R.J., Syme, S.L., Puska, P., 1988. socialconnections and mortality from all causes and from cardiovascular-disease –prospective evidence from Eastern Finland. American Journal of Epidemiology128, 370–380.
Kaplan, G.A., Wilson, T.W., Cohen, R.D., Kauhanen, J., Wu, M., Salonen, J.T., 1994.Social functioning and overall mortality – prospective evidence from the Kuopioischemic-heart-disease risk factor study. Epidemiology 5, 495–500.
Kimmel, P.L., Peterson, R.A., Weihs, K.L., Shidler, N., Simmens, S.J., Alleyne, S., Cruz, I.,Yanovski, J.A., Veis, J.H., Phillips, T.M., 2000. Dyadic relationship conflict, gender,and mortality in urban hemodialysis patients. Journal of the American Societyof Nephrology 11, 1518–1525.
Kimmel, P.L., Peterson, R.A., Weihs, K.L., Simmens, S.J., Alleyne, S., Cruz, I., Veis,J.H., 1998. Psychosocial factors, behavioral compliance and survival in urbanhemodialysis patients. Kidney International 54, 245–254.
Koenig, H.G., 1995. Use of acute hospital services and mortality among religious andnon-religious copers with medical illness. Journal of Religious Gerontology 9,1–22.
LaGreca, A.M., Auslander, W.F., Greco, P., Spetter, D., 1995. I get by with a little help
from my family and friends: adolescents’ support for diabetes care. Journal ofPediatric Psychology 20, 449–476.
Lakey, B., McCabe, K.M., Fisicaro, S.A., Drew, J.B., 1996. Environmental and personaldeterminants of support perceptions: three generalizability studies. Journal ofPersonality and Social Psychology 70, 1270–1280.
aumann, E.O., Youm, Y., 1999. Racial/ethnic group differences in the prevalenceof sexually transmitted diseases in the United States: a network explanation.Sexually Transmitted Diseases 26, 250–261.
ee, G.R., Ishii-Kuntz, M., 1987. Social interaction, loneliness and emotional well-being among the elderly. Research and Aging 1, 117–126.
ee, M., Rotheram-Borus, M.J., 2001. Challenges associated with increased sur-vival among parents living with HIV. American Journal of Public Health 91,1301–1309.
epore, S.J., Allen, K.A., Evans, G.W., 1993. Social support lowers cardiovascular reac-tivity to an acute stressor. Psychosomatic Medicine 55, 518–524.
iang, J., Bennett, J.M., Krause, N.M., Chang, M.C., Lin, H.S., Chuang, Y.L., Wu, S.C.,1999. Stress, social relations, and old age mortality in Taiwan. Journal of ClinicalEpidemiology 52, 983–995.
iang, J., McCarthy, J.F., Jain, A., Krause, N., Bennett, J.M., Gu, S.Z., 2000. Socioeconomicgradient in old age mortality in Wuhan, China. Journals of Gerontology Series B:Psychological Sciences and Social Sciences 55, S222–S233.
in, N., Westcott, J., 1991. Marital engagement/disengagement, social networks andmental health. In: Eckenrode, J. (Ed.), The Social Context of Coping. Plenum, NewYork, pp. 213–237.
ipsey, M.W., Wilson, D.B., 2001. Practical Meta-Analysis. Sage, Thousand Oaks, CA.yyra, T.M., Heikkinen, R.L., 2006. Perceived social support and mortality in older
people. Journals of Gerontology Series B: Psychological Sciences and Social Sci-ences 61, S147–S152.
ackenbach, J.P., Bos, V., Garssen, M.J., Kunst, A.E., 2005. Mortality among Non-Western migrants in The Netherlands. Nederlands Tijdschrift Voor Geneeskunde149, 917–923.
ason, K.O., 1992. Family change and support of the elderly in Asia: what do weknow? Asia Pacific Population Journal 7, 13–32.
athiesen, S., Tambs, K., Dalgard, O.S., 1999. The influence of social class. Strain andsocial support on symptoms of anxiety and depression in mothers of toddlers.Psychiatry and Psychiatric Epidemiology 34, 61–72.
att, G.E., Dean, A., 1993. Social support from friends and psychological distressamong elderly presons: moderator effects of age. Journal of Health and SocialBehavior 34, 187–200.
aunsell, E., Brisson, J., Deschenes, L., 1995. Social support and survival amongwomen with breast-cancer. Cancer 76, 631–637.
cClellan, W.M., Stanwyck, D.J., Anson, C.A., 1993. Social support and subsequentmortality among patients with end-stage renal disease. Journal of the AmericanSociety of Nephrology 4, 1028–1034.
eyers, L.A., Newman, M.E.J., Martin, M., Schrag, S., 2003. Applying network theoryto epidemics: control measures for Mycoplasma pneumoniae outbreaks. Emerg-ing Infectious Diseases 9, 204–210.
iller, R.J., Darlington, Y., 2002. Who supports? The providers of social support todual-parent families caring for young children. Journal of Community Psychol-ogy 30, 461–473.
oreno, S.G., Sutton, A.J., Ades, A.E., Stanley, T.D., Abrams, K.R., Peters, J.L., Cooper,N.J., 2009. Assessment of regression-based methods to adjust for publicationbias through a comprehensive study. BMC Medical Research Methodology 9, 2.
urata, C., Kondo, T., Hori, Y., Miyao, D., Tamakoshi, K., Yatsuya, H., Sakakibara,H., Toyoshima, H., 2005. Effects of social relationships on mortality among theelderly in a Japanese rural area: an 88-month follow-up study. Journal of Epi-demiology 15, 78–84.
urberg, T.A., Bru, E., 2001. Social relationships and mortality in patients with con-gestive heart failure. Journal of Psychosomatic Research 51, 521–527.
usick, M.A., House, J.S., Williams, D.R., 2004. Attendance at religious servicesand mortality in a national sample. Journal of Health and Social Behavior 45,198–213.
akanishi, N., Fukuda, H., Tatara, K., 2003. Changes in psychosocial conditions andeventual mortality in community-residing elderly people. Journal of Epidemi-ology 13, 72–79.
akanishi, N., Tatara, K., 2000. Relationship between social relations and mortal-ity of older Japanese people living alone. Journal of Clinical Geropsychology 6,213–222.
’Reilly, P., 1988. Methodological issues in social support and social networkresearch. Social Science and Medicine 26, 863–873.
kamoto, K., Harasawa, Y., Momose, Y., Sakuma, K., 2007. Risk factors for 6-yearmortality by gender in a Japanese elderly population. Archives of Gerontologyand Geriatrics 45, 335–341.
xman, T.E., Freeman, D.H., Manheimer, E.D., 1995. Lack of social participation orreligious strength and comfort as risk factors for death after cardiac surgery inthe elderly. Psychosomatic Medicine 57, 5–15.
atterson, T.L., Shaw, W.S., Semple, S.J., Cherner, M., McCutchan, J.A., Atkinson, J.H.,Grant, I., Nannis, E., 1996. Relationship of psychosocial factors to HIV progres-sion. Annals of Behavioral Medicine 18, 30–39.
enninx, B., vanTilburg, T., Kriegsman, D.M.W., Deeg, D.J.H., Boeke, A.J.P., vanEijk,J.T.M., 1997. Effects of social support and personal coping resources on mortal-ity in older age: the longitudinal aging study Amsterdam. American Journal ofEpidemiology 146, 510–519.
eters, J.L., Sutton, A.J., Jones, D.R., Abrams, K.R., Rushton, L., 2006. Comparison oftwo methods to detect publication bias in meta-analysis. Journal of the AmericanMedical Association 295, 676–680.
ierce, G.R., Sarason, B.R., Sarason, I.G., 1992. General and specific support expec-tations and stress as predictors of perceived supportiveness: an experimentalstudy. Journal of Personality and Social Psychology 63, 297–307.
lickert, G., Côté, R.R., Wellman, B., 2007. It’s not who you know, it’s how you knowthem: who exchanges what with whom? Social Networks 29, 405–429.
s 35 (2013) 626– 638 637
Potts, M.K., 1997. Social support and depression among older adults living alone:the importance of friends within and outside of a retirement community. SocialWork 42, 348–362.
Primomo, J., Yates, B.C., Woods, N.F., 1990. Social support for women during chronicillness: the relationship among sources and types to adjustment. Research inNursing and Health 13, 153–161.
Procidano, M.E., Heller, K., 1983. Measures of perceived social support from friendsand from family: three validation studies. American Journal of Community Psy-chology 11, 1–24.
Prohaska, T.R., Glasser, M., 1996. ‘Patients’ views of family involvement in medicalcare decisions and encounters. Research on Aging 18, 52–69.
Rodriguez-Artalejo, F., Guallar-Castillon, P., Herrera, M.C., Otero, C.M., Chiva, M.O.,Ochoa, C.C., Banegas, J.R., Pascual, C.R., 2006. Social network as a predictor of hos-pital readmission and mortality among older patients with heart failure. Journalof Cardiac Failure 12, 621–627.
Rodriguez-Laso, A., Zunzunegui, M.V., Otero, A., 2007. The effect of social relation-ships on survival in elderly residents of a southern European community: acohort study. BMC Geriatrics 7, 19.
Romelsjo, A., Kaplan, G.A., Cohen, R.D., Allebeck, P., Andreasson, S., 1992. Protectivefactors and social risk factors for hospitalization and mortality among youngmen. American Journal of Epidemiology 135, 649–658.
Roelfs, D.J., Shor, E., Davidson, K.W., Schwartz, J.E., 2010. War-related stress expo-sure and mortality: a meta-analysis. International Journal of Epidemiology 39,1499–1509.
Roelfs, D.J., Shor, E., Davidson, K.W., Schwartz, J.E., 2011a. Losing life and livelihood: asystematic review and meta-analysis of unemployment and all-Cause mortality.Social Science & Medicine 72, 840–854.
Roelfs, D.J., Shor, E., Kalish, R., Yogev, T., 2011b. The rising relative risk of mor-tality among singles: meta-analysis and meta-regression. American Journal ofEpidemiology 174, 379–389.
Roelfs, D.J., Shor, E., Falzon, L., Davidson, K.W., Schwartz, J.E., 2013. Meta-analysis forSociology – a measure-driven approach. Bulletin of Sociological Methodology117, 75–92.
Rook, K.S., 1987. Close relationships: ties that heal or ties that bind? Advances inPersonal Relationships 1, 1–35.
Rosengren, A., Orth-Gomer, K., Wilhelmsen, L., 1998. Socioeconomic differences inhealth indices. Social networks and mortality among Swedish men. A study ofmen born in 1933. Scandinavian Journal of Social Medicine 26, 272–280.
Rosenquist, J.N., Murabito, J., Fowler, J.H., Christakis, N.A., 2010. The spread of alcoholconsumption behavior in a large social network. Annals of Internal Medicine 152,426–433.
Rosenthal, R., 1991. Meta-analysis: a review. Psychosomatic Medicine 53, 247–271.Roy, M.P., Steptoe, A., Kirschbaum, C., 1998. Life events and social support as moder-
ators of individual differences in cardiovascular and cortisol reactivity. Journalof Personality and Social Psychology 75, 1273–1281.
Ruehlman, L.S., Karoly, P., 1991. With a little flak from my friends: developmentand perliminary validation of the text of negative social exchange (TENSE).Psychological Assessment 3, 97–104.
Russell, D.W., Booth, B., Reed, D., Laughlin, P.R., 1997. Personality, social networks,and perceived social support among alcoholics: a structural equation analysis.Journal of Personality 65, 649–692.
Saito-Nakaya, K., Nakaya, N., Fujimori, M., Akizuki, N., Yoshikawa, E., Kobayakawa,M., Nagai, K., Nishiwaki, Y., Tsubono, Y., Uchitomi, Y., 2006. Marital status, socialsupport and survival after curative resection in non-small-cell lung cancer. Can-cer Science 97, 206–213.
Sarason, B.R., Pierce, G.R., Shearin, E.N., Sarason, I.G., Waltz, J.A., Poppe, L., 1991.Perceived social support and working models of self and others. Journal of Per-sonality and Social Psychology 60, 273–287.
Sato, T., Kishi, R., Suzukawa, A., Horikawa, N., Saijo, Y., Yoshioka, E., 2007. Effectsof social relationships on mortality of the elderly: how do the influenceschange with the passage of time? Archives of Gerontology and Geriatrics 47,327–339.
Schwarzer, R., Leppin, A., 1989. Social support and health: a meta-analysis. Psychol-ogy and Health: An International Journal 3, 1–15.
Schwarzer, R., Leppin, A., 1991. Social support and health: a theoretical and empiricaloverview. Journal of Social and Personal Relationships 8, 99–127.
Seeman, T.E., 1996. Social ties and health: the benefits of social integration. Annalsof Epidemiology 6, 442–451.
Seeman, T.E., Berkman, L.F., 1988. Structural characteristics of social networks andtheir relationship with social support in the elderly: who provides support.Social Science & Medicine 26, 737–749.
Seeman, T.E., Berkman, L.F., Kohout, F., Lacroix, A., Glynn, R., Blazer, D., 1993. Inter-community variations in the association between social ties and mortality in theelderly. A comparative analysis of three communities. Annals of Epidemiology3, 325–335.
Shor, E., Roelfs, D.J., 2013. The longevity effects of religious and non-religious par-ticipation: a meta-analysis and meta-regression. Journal for the Scientific Studyof Religion 52, 120–145.
Shor, E., Roelfs, D.J., Bugyi, P., Schwartz, J.E., 2012a. Meta-analysis of marital dis-
solution and mortality: reevaluating the intersection of gender and age. SocialScience and Medicine 75, 46–59.
Shor, E., Roelfs, D.J., Curreli, M., Clemow, L., Burg, M.M., Schwartz, J.E., 2012b. Wid-owhood and mortality: a meta-analysis and meta-regression. Demography 49,575–606.
adults over an 8-year period. The Gerontologist 35, 150–161.
38 E. Shor et al. / Social N
mith, K.P., Christakis, N.A., 2008. Social networks and health. Annual Review ofSociology 34, 405–429.
timpson, J.P., Kuo, Y.-F., Ray, L.A., Raji, M.A., Peek, M.K., 2007. Risk of mortalityrelated to widowhood in older Mexican Americans. Annals of Epidemiology 17,313–319.
toller, E.P., Kart, C.S., Portugal, S.S., 1997. Explaining pathways of care taken byelderly people: an analysis of responses to illness symptoms. Sociological Focus30, 147–165.
ubramanian, S.V., Elwert, F., Christakis, N.A., 2008. Widowhood and mortalityamong the elderly: the modifying role of neighborhood concentration of wid-owed individuals. Social Science and Medicine 66, 873–884.
yme, S.L., 1974. Behavioral factors associated with the etiology of physical dis-ease: a social epidemiological approach. American Journal of Public Health 64,1043–1045.
zeto, C.-C., Chow, K.-M., Kwan, B.C.-H., Law, M.-C., Chung, K.-Y., Leung, C.-B., Li,P.K.-T., 2008. The impact of social support on the survival of Chinese peritonealdialysis patients. Peritoneal Dialysis International 28, 252–258.
emkin-Greener, H., Bajorska, A., Peterson, D.R., Kunitz, S.J., Gross, D., Williams, T.F.,Mukamel, D.B., 2004. Social support and risk-adjusted mortality in a frail olderpopulation. Medical Care 42, 779–788.
hoits, P.A., 1995. Stress, coping and social support processes: where are we? What’snext? Journal of Health and Social Behavior Extram Issue, 53–79.
hoits, P.A., 2011. Mechanisms linking social ties and support to physical and mentalhealth. Journal of Health and Social Behavior 52, 145–161.
hong, M.S.Y., Kaptein, A.A., Krediet, R.T., Boeschoten, E.W., Dekker, F.W.,Netherlands Cooperative Study, A., 2007. Social support predicts survival indialysis patients. Nephrology Dialysis Transplantation 22, 845–850.
chino, B.N., 2004. Social Support and Physical Health: Understanding the HealthConsequences of Relationships. Yale University Press, New Haven, CT.
chino, B.N., 2006. Social support and health: a review of physiological processespotentially underlying links to disease outcomes. Journal of Behavioral Medicine29, 377–387.
chino, B.N., 2009. Understanding the links between social support and physicalhealth: a life-span perspective with emphasis on the separability of perceivedand received support. Perspectives on Psychological Science 4, 236–255.
chino, B.N., Cacioppo, J.T., Kiecolt-Glaser, J.K., 1996. The relationship between socialsupport and psychological processes: a review with emphasis on underlyingmechanisms and implications for health. Psychological Bulletin 119, 488–531.
ehara, E., 1990. Dual exchange theory, social networks, and informal social support.American Journal of Sociology 96, 521–557.
mberson, D., Crosnoe, R., Reczek, C., 2010. Social relationships and health behavior
across life course. Annual Review of Sociology 36, 139–157.
mberson, D., Montez, J.K., 2010. Social relationships and health: a flashpoint forhealth policy. Journal of Health and Social Behavior 51, 54–66.
iswesvaran, C., Sanchez, J.I., Fisher, J., 1999. The role of social support in the processof work stress: a meta-analysis. Journal of Vocational Behavior 54, 314–334.
ks 35 (2013) 626– 638
Walker, M., Wasserman, S., Wellman, B., 1993. Statistical models for social supportnetworks. Sociological Methods & Research 22, 71–98.
Walter-Ginzburg, A., Blumstein, T., Chetrit, A., Modan, B., 2002. Social factors andmortality in the old-old in Israel: the CALAS study. Journals of Gerontology SeriesB: Psychological Sciences and Social Sciences 57, S308–S318.
Walter-Ginzburg, A., Shmotkin, D., Blumstein, T., Shorek, A., 2005. A gender-baseddynamic multidimensional longitudinal analysis of resilience and mortality inthe old–old in Israel: the cross-sectional and longitudinal aging study (CALAS).Social Science and Medicine 60, 1705–1715.
Wang, H.-H., Wu, S.-Z., Liu, Y.-Y., 2003. Association between social support andhealth outcomes: a meta-analysis. Kaohsiung Journal of Medical Sciences 19,345–351.
Welin, C., Lappas, G., Wilhelmsen, L., 2000. Independent importance of psychosocialfactors for prognosis after myocardial infarction. Journal of Internal Medicine247, 629–639.
Welin, L., Larsson, B., Svardsudd, K., Tibblin, B., Tibblin, G., 1992. Social network andactivities in relation to mortality from cardiovascular diseases, cancer and othercauses – a 12 year follow-up of the study of men born in 1913 and 1923. Journalof Epidemiology and Community Health 46, 127–132.
Wellman, B., Frank, K.A., 2001. Network capital in a multilevel world: getting supportfrom personal communities. In: Lin, N., Burt, R.S., Cook, K. (Eds.), Social Capital.Aldine De Gruyter, Hawthorne, New York, pp. 233–273.
Wellman, B., Gulia, M., 1997. Where does social support come from? Thesocial network basis of interpersonal resources for coping with stress. In:Maney, A. (Ed.), Social Conditions, Stress, Resources and Health. NIMH Press,Rockville, MD.
Wellman, B., Wortley, S., 1989. Brothers’ keepers: situating kinship relations inbroader networks of social support. Sociological Perspectives 32, 273–306.
Wellman, B., Wortley, S., 1990. Different strokes from different folks: communityties and social support. American Journal of Sociology 96, 558–588.
Wenger, G.C., 1990. The special role of friends and neighbors. Journal of Aging Studies4, 149–169.
Wilkins, K., 2003. Social support and mortality in seniors. Health Reports 14, 21–34.Wills, T.A., Yaeger, A.M., 2003. Family factors and adolescent substance use:
model and mechanisms. Current Directions in Psychological Science 12,222–226.
Wing, R.R., Jeffery, R.W., 1999. Benefits of recruiting participants with friends andincreasing social support for weight loss and maintenance. Journal of Consultingand Clinical Psychology 67, 132–138.
Wolinsky, F.D., Johnson, R.L., Stump, T.E., 1995. The risk of mortality among older
Zhang, X.P., Norris, S.L., Gregg, E.W., Beckles, G., 2007. Social support and mortalityamong older persons with diabetes. Diabetes Educator 33, 273–281.
Zivin, K., Christakis, N.A., 2007. The emotional toll of spousal morbidity and mortal-ity. American Journal of Geriatric Psychiatry 15, 772–779.