Volume 23 Issue 4 Fall 1983 Fall 1983 The Structure of International Steam Coal Markets The Structure of International Steam Coal Markets David S. Abbey Charles D. Kolstad Recommended Citation Recommended Citation David S. Abbey & Charles D. Kolstad, The Structure of International Steam Coal Markets, 23 Nat. Resources J. 859 (1983). Available at: https://digitalrepository.unm.edu/nrj/vol23/iss4/7 This Article is brought to you for free and open access by the Law Journals at UNM Digital Repository. It has been accepted for inclusion in Natural Resources Journal by an authorized editor of UNM Digital Repository. For more information, please contact [email protected], [email protected], [email protected].
Transcript
Volume 23 Issue 4 Fall 1983
Fall 1983
The Structure of International Steam Coal Markets The Structure of International Steam Coal Markets
David S. Abbey
Charles D. Kolstad
Recommended Citation Recommended Citation David S. Abbey & Charles D. Kolstad, The Structure of International Steam Coal Markets, 23 Nat. Resources J. 859 (1983). Available at: https://digitalrepository.unm.edu/nrj/vol23/iss4/7
This Article is brought to you for free and open access by the Law Journals at UNM Digital Repository. It has been accepted for inclusion in Natural Resources Journal by an authorized editor of UNM Digital Repository. For more information, please contact [email protected], [email protected], [email protected].
A common view is that the international coal market is reasonablycompetitive and that prices will tend towards long-run marginal costs.However, analyses of many commodities reveal the importance of marketimperfections and market power in explaining price formation and tradeflows. A review of the structure of the steam coal market suggests themarket is not perfectly competitive. Considering industrial concentration,market shares and government policy, it is possible to identify participantswith the potential to exercise market power. These include the Republicof South Africa, Australia, and Poland on the supply side and Japan andthe European Community on the demand side.
I. INTRODUCTION
Rising prices for oil and gas over the past decade have led to increasedworldwide demand for steam coal, which in turn has increased interna-tional steam coal trade. Two basic applied economics problems arise inexamining commodity trade, including coal. First, what are the deter-minants of trade flows and market shares for various producing andconsuming countries? A second problem, which in some sense is anextension of the first, concerns forecasting future trade and the effects ofgovernment policies on trade. The United States, for example, is anxiousto do as much as possible to enhance its coal export prospects. Addressingthese problems requires an understanding of how coal markets are struc-tured, what market power can be wielded by participants, and what factorsenter into production and consumption decisions.
The conventional wisdom is that the international coal market is com-petitive by virtue of abundant endowment and wide distribution of coalresources, and large numbers of consuming and importing nations. Forexample, the annual report of IEA Coal Research (a unit of Great Britain'sNational Coal Board) suggests that:
There is sufficient free competition in and between the four majorexporting countries [Australia, Canada, South Africa and the UnitedStates] for the price of coal to tend towards long run marginal cost.'
*Economics Group, Los Alamos National Laboratory and Department of Economics, University
of Illinois. Work sponsored by U.S. Department of Energy and conducted while both authors werewith the Economics Group of the Los Alamos National Laboratory in New Mexico.
However, market analyses of many other comodities traded internation-ally-notably crude oil and grain-reveal the inadequacy of the perfectcompetition market model in explaining trade patterns.2
Perfect competition requires complete information, free entry and exitof firms, and sufficient numbers of buyers and sellers so that individualactions don't affect prices. However, as a consequence of concentrationof buyers and sellers or government intervention, the exercise of powerto influence commodity trade flows and prices is not uncommon. Theobjective of this paper is to analyze the international steam coal marketin order to infer market conduct which in turn determines price levelsand trade patterns.
The analysis progresses in three stages. First, we review basic con-ditions and structure of the steam coal market to determine which actors-national governments, state traders, or private firms-are capable of wieldingmarket power. We address five aspects of the market: (a) geographicalstructure of supply, demand and transportation (including quality of coalresources, resources by mining type, and access to deepwater ports); (b)concentration among producers and consumers; (c) barriers to entry; (d)the structure of demand; and (e) government trade policies (includingformal economic blocs, preferred trading relations, and export and importquotas).
We conclude that potential power in steam coal trade rests with anumber of different actors: the European Economic Community and Ja-pan, by virtue of dominance in import demand; the Republic of SouthAfrica, due to low FOB-port coal costs, a domestic producer cartel, anda system of export licenses and quotas; Australia, owing to low FOB portcoal costs, export controls, and a relatively concentrated steam coal exportindustry; and Poland, through the force of a state monopoly and closeproximity to European markets. One might also include multi-nationalcorporations (MNCs), considering their superior technical capabilities andaccess to information concerning energy markets. Admittedly, this is noexclusive club. One might argue it is so large as to render any conceptof power to set prices meaningless. However, we offer some historicexamples of the exercise of market power in coal trade that suggestotherwise.
The second stage of the analysis is a qualitative description of theconduct of the actors in the steam coal market. First, we hypothesize theobjectives of the various actors (e.g., to maximize short-run profits orexport earnings). Then we consider strategies the actors might pursue in
2. See McCalla, Structural and Market Power Considerations in Imperfect Agricultural Markets,in IMPERFECT MARKETS IN AGRICULTURAL TRADE 9 (198 1); and Radetzki, Market Structureand Bargaining Power: A Study of Three International Mineral Markets, 6 RESOURCES POLICY115 (1978).
[Vol. 23
INTERNATIONAL STEAM COAL MARKETS
a multilateral framework-that is, when each actor with market poweris trying to anticipate actions and reactions of competitors. This qualitativeapproach provides some insight into alternative models of price formation;however, it is inconclusive by definition.
Finally, we provide a brief review of conventional market models ofimperfect competition-for example, various models of oligopoly andoligopsony, producer cartels, and so forth-in an effort to match one suchmodel with the observed market structure. Through this three step processwe develop a framework for quantitative analysis of the internationalsteam coal market.
II. BASIC MARKET CONDITIONS AND STRUCTURE
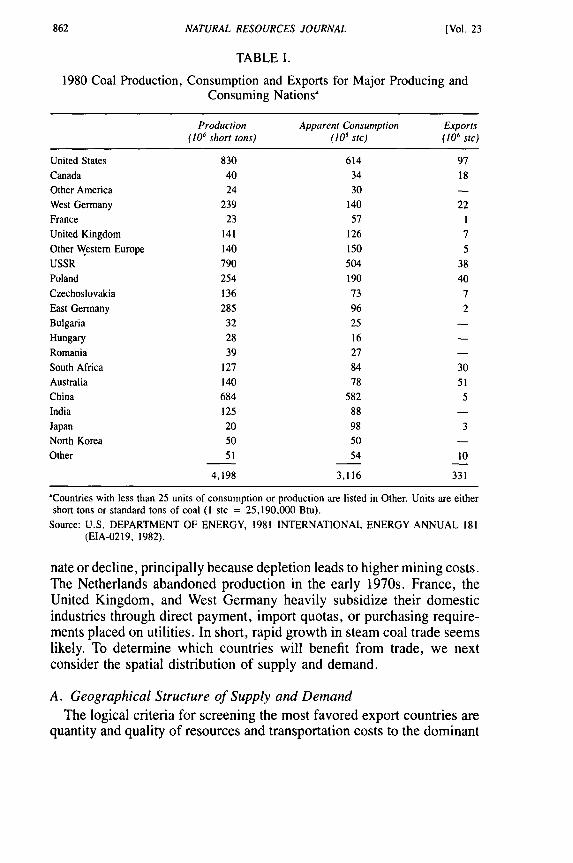
By way of introduction we present some background information oninternational coal use. Table I reports coal production and consumptionby country in 1980. Not surprisingly, consumption is concentrated heavilyin the industrial nations. The United States, the Soviet Union, and Chinaaccount for 55 percent of world consumption. These nations, with Polandand the United Kingdom, account for nearly two-thirds of world con-sumption. Most of the major consuming nations produce their domesticrequirements with the notable exceptions of France, East Germany, andJapan. Considering the bulk of coal, the relatively high proportion oftransportation costs in delivered costs, and the widespread global distri-bution of coal resources, the reliance on domestic supply is not surprising.
In 1980 trade of metallurgical and steam coal accounted for only 331million standard tons3 (about 11 percent of consumption). Historically,much of world coal trade has been overland trade to neighboring coun-tries-for example, from the western Soviet Union to eastern Europe,Poland to western Europe, and the United States to Canada (see Fig. 1).While little international data is available that distinguishes trade flowsby coal types, metallurgical coal, not steam coal, has clearly dominatedtrade.
One can make three broad judgments on the outlook for the internationalcoal market.4 First, considering forecasts of steel output and technologicalchange, trade of metallurgical coal is likely to stagnate or decline. Second,since delivered prices of steam coal to Europe and Japan are about halfthe energy equivalent price of crude oil or natural gas, rapid growth insteam coal demand is possible. Such growth depends on the future of oilprices and nuclear power--coal's major competition for electricity gen-eration. Third, coal production in many industrialized nations will stag-
3. As used in this report, a standard ton of coal is 25,190,000 Btu.4. See generally M. GASKIN, MARKET ASPECTS OF AN EXPANSION OF THE INTER-
NATIONAL STEAM COAL MARKET (lEA Coal Research, 1981).
October 1983]
862 NATURAL RESOURCES JOURNAL [Vol. 23
TABLE I.
1980 Coal Production, Consumption and Exports for Major Producing andConsuming Nations a
Production Apparent Consumption Exports(106 short tons) (106 stc) (106 stc)
United States 830 614 97
Canada 40 34 18Other America 24 30 -
West Germany 239 140 22France 23 57 1
United Kingdom 141 126 7Other Western Europe 140 150 5USSR 790 504 38Poland 254 190 40
South Africa 127 84 30Australia 140 78 5iChina 684 582 5India 125 88Japan 20 98 3North Korea 50 50 -
Other 51 54 10
4,198 3,116 331
'Countries with less than 25 units of consumption or production are listed in Other. Units are eithershort tons or standard tons of coal (I stc = 25,190,000 Btu).
Source: U.S. DEPARTMENT OF ENERGY, 1981 INTERNATIONAL ENERGY ANNUAL 181(EIA-0219, 1982).
nate or decline, principally because depletion leads to higher mining costs.The Netherlands abandoned production in the early 1970s. France, theUnited Kingdom, and West Germany heavily subsidize their domesticindustries through direct payment, import quotas, or purchasing require-ments placed on utilities. In short, rapid growth in steam coal trade seemslikely. To determine which countries will benefit from trade, we nextconsider the spatial distribution of supply and demand.
A. Geographical Structure of Supply and DemandThe logical criteria for screening the most favored export countries are
quantity and quality of resources and transportation costs to the dominant
INTERNATIONAL STEAM COAL MARKETS
00
.z,<2
z ,
'U
.0
0
n •o
LL
October 1983]
NATURAL RESOURCES JOURNAL
TABLE II.
Estimated World Coal Reserves(106 stc)
Percent PercentRecoverable World Total WorldReserves' Total Resources' Total
USSR 109,900 17.3 4,860,000 48.0
United States 177,588 27.9 2,570,398 25.4People's Republic of China 98,883 15.5 1,438,045 14.2Australia 27,353 4.3 262,134 2.6Federal Republic of Germany 34,419 5.4 246,800 2.4United Kingdom 45,000 7.1 163,576 1.6Poland 21,790 3.4 124,000 1.2Canada 9,381 1.5 115,352 1.1India 33,700 5.3 56,799 0.6South Africa 26,903 4.2 57,566 0.6
Other 52,012 8.1 231,834 2.3
World Total 636,929 100.00 10,126,504 100.0
'Amount of reserves in place that can be recovered under present local economic conditions usingavailable technology.
bTotal amount available in the earth that can be successfully exploited and used by man within the
foreseeable future.
Source: World Energy Conference Survey of Energy Resources, 1977, cited in NATIONAL COALASSOCIATION, INTERNATIONAL COAL: 1978 I-1 (1979).
import markets in the industrialized nations of Europe and East Asia.Table II shows estimated recoverable reserves and resources by country.The Soviet Union, China, and the United States possess 60 percent ofrecoverable reserves and 85 percent of resources. However, these en-dowments are less important than mine production and especially trans-portation costs, because coal resources are so abundant. For example,Botswana's reserves of hard coal-3.5 billion standard tons of coal whichappear in the "Other" category of Table II-are sufficient for more thana year of world consumption.
1. Resource Quality. With respect to coal quality, sulfur content lessthan 1.5 percent is a standard specification of internationally traded coal,calculated to meet environmental standards and obviate the installationof flue gas desulfurization equipment. Specification of heating value istypically over 10,000 Btu/lb and preferably in the range of 11,000-13,000 Btu/lb (in other words, bituminous coal). Lower quality coalserves domestic markets.
What accounts for the disinterest in sub-bituminous coal in the inter-national market? Consider first the situation of a country with a large
[Vol. 23
INTERNATIONAL STEAM COAL MARKETS
domestic coal market relative to export demand (such as the UnitedStates). Assume a simple competitive model with one source of supplyof bituminous and sub-bituminous coal and one point of consumption.Assume further that domestic delivered energy cost (for example, $/106
Btu) is the sole determinant of the price differential between bituminousand sub-bituminous coal. The costs of acquiring each coal type (measuredin thermal units) tend to equalize:
(P, + t/a, = (Pb + t)/ab, (1)
where a i is the heat content of coal i, t is the unit cost of transportation,and Pb and P, are the mine-mouth prices of bituminous and sub-bituminouscoal.
Suppose a new source of demand develops in a more distant (export)market served at unit transport cost, T (T > t). If export demand is smallin relation to domestic demand, or more precisely, if the export demandhas no effect on domestic prices, then, as shown by Equation 2, sub-bituminous or lower quality coal will not be used in the export market,since in equilibrium it will appear to be more costly than bituminous coal:
(Ps + T)/ot > (Pb + T)/ab . (2)
This suggests that if a large domestic market exists, prices of sub-bitu-minous coal will be set by domestic demand in such a way that the coalcannot compete with bituminous coal in distant markets.
Now consider the case where export demand determines mine-mouthprices. Transportation costs require a minimum price differential betweenbituminous and sub-bituminous coals. Equation 3 shows the value PS/Pbfor which Equation 2 is an equality:
P5 _ a T ) (3)Pb ab Pb ab
In interpreting this equation, consider first the case of mine-mouth con-sumption (T = 0). In such a case the ratio of mine-mouth coal prices isprecisely the ratio of heating values for the two coals. However, the largerthe ratio T/Pb, the larger the price penalty of low-grade coal. For Australiaand the Republic of South Africa to Japan, the ratio T/Pb is about 0.5.Assuming heating values of 9,000 Btu/l b for sub-bituminous and 12,000for Btu/lb for bituminous coal, the sub-bituminous coal supplier wouldreceive at best a mine-mouth price about 60 percent that of the bituminousproducer.
This analysis can extend to a comparison of countries competing tosupply coal. For a developing country, such as Chile, that is a potentialsupplier of low-quality coal, the ratio T/Pb is likely to be greater, makingthe price outlook even more bleak. Finally, when one considers that boiler
October 1983]
NATURAL RESOURCES JOURNAL
TABLE III.
Selected January 1982 Spot International Steam Coal and Shipping Prices(averaged, U.S. 1981 dollars/ton)
Price Ocean DeliveredFOB Port Freighta Price
U.S. east coast to NW Europe $59.50 9 68.50Poland to Italy 64.50 8 72.50South Africa to Europe 55.00 11 66.00
Australia to Europe 60.50 15 75.50U.S. east coast to Japan 59.50 21 80.50South Africa to Japan 55.00 10 65.00Australia to Japan 60.50 9 69.50
'This freight cost does not include demurrage charges (for ships waiting to load), which can besignificant.
Source: Coal Week International, January 20 and February 10, 1982.
equipment, flue gas cleaning, and solid waste disposal costs also increasewith lower quality coals, one understands the near-exclusive interest inbituminous coal in the international market.
Several factors determine the competitive position of bituminous coalsuppliers: the method of extraction (surface or underground); proximityof coal fields to demand centers and ports; and the extent of existingtransportation infrastructure (rail line capacity, port loading capacity, andport depth). The infrastructure criterion places new entrants to the inter-national market, especially developing countries, at substantial disad-vantage. In the remainder of this section, we provide brief characterizationsof the leading exporters.'
2. Spatial Distribution. Tables III and IV present estimates of steamcoal costs and delivered prices to Europe and Japan from the majorexporting nations. It is important to realize that Table III reflects priceswhereas Table IV is an estimate of costs. Single time-point deliveredprices are not necessarily indicative of competitive advantage because ofprice volatility (for example, in ocean charter rates), and especially be-cause FOB port prices are not necessarily representative of marginal costs.Nevertheless, it is apparent from Table IV that Poland and the Republicof South Africa have a great advantage in the European markets, and
5. For more thorough country reviews, see R. GREENE & J. GALLAGHER, FUTURE COALPROSPECTS: COUNTRY AND REGIONAL ASSESSMENTS (1980); ICF, INC., COAL RE-SERVES AND PRODUCTION IN EIGHT MAJOR, NON-U.S. COAL PRODUCING COUNTRIES(1978); and ICF, INC., COAL SUPPLY CURVES FOR AUSTRALIA, CANADA, AND SOUTHAFRICA (1980).
[Vol. 23
October 1983] INTERNATIONAL STEAM COAL MARKETS
TABLE IV.
Indicative Steam Coal Costs'(1979 U.S. $/ton)
Price Mine Price DeliveredFOB to FOB Port Ocean Port PriceMine Port Port Loading Freight Unloading Range Avg. $/MBtu
Source: U.S. DEPARTMENT OF ENERGY, COAL EXPORT STUDY 9 (1979) cited in C. WILSON,COAL: BRIDGE TO THE FUTURE 126 (Ballinger, 1980).
NATURAL RESOURCES JOURNAL
Australia and the Republic of South Africa have the lead in the PacificRim markets. Poland, of course, can deliver cheaply by rail to easternEuropean countries, and from Gdansk (with a 100,000-dwt vessel ca-pacity)6 and other ports to western Europe.
The coal fields of Transvaal in the Republic of South Africa are severalhundred miles by rail from the principal port at Richards Bay, whichpresently accommodates 160,000 dwt super-colliers. Dredging plans existto accommodate 250,000 dwt colliers. More importantly, mine productioncosts are exceptionally low. A U.S. coal industry analyst estimates SouthAfrican mine-mouth costs at $14.80/ton and rail and loading costs atabout $10/ton. 7 Considering the representative FOB port price of $50/ton shown in Table III, these costs imply an incredible profit at the mineof $26/ton.
Australia has vast bituminous coal fields within 100 miles of existingports in Queensland and New South Wales. Almost all Queensland pro-duction is by surface mining methods. New South Wales production isabout 75 percent underground. Hay Point, the largest port, can accom-modate 135,000 dwt colliers. Other ports--Gladstone, Newcastle, PortKembla, and Sydney-which are presently in the 60,000 dwt class, arebeing deepened to accommodate vessels in excess of 100,000 dwt.8
Those Canadian coal fields with potential in the export market occurin the Rocky Mountains region of Alberta and British Columbia. Ruggedterrain and faulted, steeply dipping seams make extraction of some re-sources quite difficult and expensive. Elsewhere, however, potential existsfor surface mining, with some seams up to twenty feet thick.9 Transpor-tation distances are about 700 miles to existing ports (with capacity greaterthan 150,000 dwt) in the Vancouver area.
Western U.S. coal reserves are mostly sub-bituminous. The bituminousreserves in Utah, Colorado, New Mexico, and Wyoming are roughly1,000 miles from the Pacific coast ports, which presently lack the capacityto handle large volumes of coal. On the east coast, the Appalachian coalfields are within several hundred miles of ports at Norfolk and Baltimore.In 1981, the U.S. coal industry had well over 100 million tons per year(MT/yr) excess capacity.' ° Existing U.S. rail capacity is adequate tohandle increased coal traffic, and, after a few difficult years, the portsseem to have adapted shipping terminals to the handling of steam coal.
6. Dwt = Dead weight tons, a measure of vessel capacity. Larger capacity vessels usually havea larger draft requiring deeper ports.
7. Price, The Coal Observer Treks to South Africa, COAL OBSERVER 12 (Feb. 1981).8. AUSTRALIA DEP'T. OF TRADE AND RESOURCES, AUSTRALIA'S MINERAL RE-
SOURCES: STEAMING COAL 8,9 (1980).9. ICF, INC. (1980), supra note 5, at 3-13.10. U.S. DEP'T. OF ENERGY, COAL PRODUCTION-1981 74 (1982).
[Vol. 23
INTERNATIONAL STEAM COAL MARKETS
A major problem in the eastern United States, aside from relatively highproduction costs, is that harbors are limited to colliers in the Panamaxclass (less than 60,000-70,000 dwt). Port dredging from current depthsof 40 feet to 60 feet or more is quite expensive and faces budget au-thorization battles and lengthy permit reviews.
The Soviet Union probably will not be an important factor in the worldmarket for steam coal. " Only six percent of Soviet reserves are in easternEurope where coal fields are heavily depleted. 2 In the Donets Basin, forexample, which contributes about 30 percent of Soviet output, the averageworking depth is below 500 metres and 80 percent of the seams are lessthan one metre thick. More remote Soviet fields in the Arctic and Asiasuffer from severe climatic conditions, making extraction and transpor-tation difficult and expensive. The Sourth Yakutia basin in the far Eastcurrently supplies coking coal and a small amount of steam coal to Japan(the contract calls for 85 million tons over about 20 years), but Pacificports are about 1,500 miles away by rail. (Slurry pipelines may providea promising transportation alternative.)
A few developing countries have potential to enter the export marketbefore the year 2000--Colombia, China, Indonesia, and perhaps India.However, for these countries more than for existing producers, port prox-imity is vital. Coal export development typically involves not only newmine construction as in industrialized countries, but new port and railconstruction. Furthermore, one may expect limited opportunities for econ-omies in freight cost through the handling of other commodities. Bot-swana is occasionally mentioned as a potential exporter. Certainly Botswanahas substantial strippable coal resources, but getting coal to Walvis Bayin Namibia requires 1,000 miles of railroad construction across the Ka-lahari Desert. 3
B. ConcentrationThe question of concentration concerns the number of producing and
consuming firms in importing and exporting countries, the role and num-ber of trading companies, and the market shares of trading countries.
1. Number of Firms by Country. There are many steam coal producersworldwide, although there is considerable range in producer competitionwithin individual exporting countries. For example, coal ownership, pro-Juction, and trading is by state monopoly in Poland. In developing coun-
11. See generally U.S. OFFICE OF TECHNOLOGY ASSESSMENT, TECHNOLOGY ANDSOVIET ENERGY AVAILABILITY (1981); and U.S. CENTRAL INTELLIGENCE AGENCY,.JSSR: COAL INDUSTRY PROBLEMS AND PROSPECTS (1980).
12. U.S. OFFICE OF TECHNOLOGY ASSESSMENT, supra note 11, at 84-86.13. Swersey, Emergent Coal Suppliers to the Atlantic Basin, available from the author at Exxon
vlinerals Co., New York (1981).
October 19831
NATURAL RESOURCES JOURNAL
TABLE V.
South African Export Allocations by Exporter (1981)
'Includes 2 Mt/yr allocation to Natal Assoc. Collieries, which is managed by the TCOA.bSelling organization for Amcoal, Graham Beck, and Duiker Exploration.
Source: Ellis, COAL, GOLD, AND BASE MINERALS OF SOUTHERN AFRICA 93 98 (June,1981).
tries, coal ownership is typically by state monopoly, though productionand trading rights may be leased or assigned to joint-venture partners. Inthe United States, there are hundreds of producers. Because of the morelimited number of producers in Australia and the Republic of South Africa,as well as their cost advantages noted above, these countries warrantspecial attention.
The South African coal mining scene is complicated by the presenceof domestic price controls and export licenses. Nonetheless, a high degreeof industrial concentration is evident. Collieries operated by six mininghouses-Anglo-American Corporation (Amcoal), General Mining UnionCorporation (GENCOR), Barlow Rand (Rand Mines), Johannesburg Con-solidated Investment Co., Lonhro South Africa, and Gold Fields of SouthAfrica-accounted for 92 percent of 1979 coal production. 4 All six aremembers of the Transvaal Coal Owners Association (TCOA), whosefunction is to assign production quotas and market and distribute membeioutput. 15 The TCOA is also the principal owner of the export terminal alRichards Bay. Table V shows export allocations under phase III of theexport development program (to be achieved by the mid-1980s). Allo-cations to the TCOA and individual TCOA members, totaling 28 Mt/yr,represent 63 percent of current export allocations. Three multinational
14. Cooperation Leads to Efficient Marketing, 1/2 MINING SURVEY 43 (1981).15. See Ellis, Coal Export-Staking Out the Issues, 29 COAL, GOLD, AND BASE MINERAL!
OF SOUTH AFRICA 93 (1981); and MINING SURVEY, supra note 14, at 53.
[Vol. 23
INTERNATIONAL STEAM COAL MARKETS
energy companies-Shell, BP, and Total-have most of the remainingexport allocations. They obtain coal from joint-venture projects withSouth African firms.' 6
Australia has a history of concentration in the coal industry.' 7 Withrapid growth in the Austrialian export market and the possibility of mi-nority foreign investment, one might expect increased competition. Agovernment compiled inventory lists 40 corporate ventures into the steamcoal export market.I" Yet, examination of this inventory reveals consid-erable corporate interlocking in joint ventures and suggests a pattern ofconcentration in Australian development that may be representative ofconcentration in the world market. 9
Consider the kinds of firms involved in Australian coal export projects.20
Domestic ownership is strongly represented by large mining houses (forexample, BHP, Peko-Wallsend, and MIM), and other conglomerates (CSRand White Industries). Multinational corporations engaged in resourceextraction have purchased major stakes in Australian coal firms or haveactive Australian subsidiaries. For example, Rio Tinto Zinc of Englandcontrols CRA, Ltd.; British Petroleum purchased Clutha in 1978; Shellowns 37 percent of Austen and Butta and 45 percent of Bellambi CoalCompany; and Arco owns 32.5 percent of R. W. Miller and 38 percentof Blair Athol. Finally, many of the projects involve investment by coalimporters, notably the general trading companies of Japan-Mitsui, Ma-rubeni, Mitsubishi, and C. Itoh; foreign coal consumers (for example,the Electric Power Development Company of Japan); and foreign coalproducers (for example, the French production monopoly, Charbonnagesde France).
In Table VI we report, by firm, potential 1990 Australian steam coalexports from projects currently in production or planned for development.Four firms account for 38 percent, eight firms for 60 percent, and 16firms for 80 percent of potential 1990 exports. When one considers in-tercorporate linking and communication through joint venture arrange-ments or interlocking directorates, the potential for oligopoly in Australianteam coal exports seems greater. For example CSR, the leading firm
with 15 percent of 1990 export potential, is involved in 23 percent (on
16. Coal Survey, Financial Mail, August 14, 1982, at 24.17. H. SADLER, ENERGY IN AUSTRALIA: POLITICS AND ECONOMICS 104-111 (1981).18. See AUSTRALIA DEP'T. OF TRADE AND RESOURCES, AUSTRALIAN COAL EXPORT
PROJECTS (1981).19. Ownership patterns in Australia are in a state of flux. In 1976 the Australian government
outlined requirements for a minimum of 50% Australian-owned equity in most natural resourceprojects including coal. The Foreign Investment Review Board has applied these guidelines flexiblyand Australian ownership is increasing, but the issues surrounding foreign ownership remain con-roversial. See Australian Economic Survey, 278 ECONOMIST 22 (October 31, 1981).
20. See generally: AUSTRALIA DEP'T. OF INDUSTRY AND COMMERCE, MAJOR MAN-UFACTURING AND MINING INVESTMENT PROJECTS (1981).
October 1983]
NATURAL RESOURCES JOURNAL
TABLE VI.
Concentration in the Australian Steam Coal Export Market-Projects for 1990 Production
'Steam coal projects currently in production or planned for development. Excludes projects with1990 potential less than I Mt/y. In joint ventures, output is apportioned to firms based on ownership.
bThe difference between Column A and B has to do with accounting for output from joint ventures.
In Column A, output is apportioned to firms based on the fraction of ownership or participation ina joint venture. In Column B, the entire output of a project is associated with the highest rankingparticipant.
Sources: DEPARTMENT OF TRADE AND MINERAL RESOURCES, AUSTRALIAN COAL EX-PORT PROJECTS (1981); DEPARTMENT OF INDUSTRY AND COMMERCE, MAJORMANUFACTURING AND MINING INVESTMENT PROJECTS (June 1981).
[Vol. 23
INTERNATIONAL STEAM COAL MARKETS
a tonnage basis) of the projects. Projects including at least one of thefour leading firms reported in Table VI-CSR, Shell, BHP and MIM-account for 49 percent of 1990 export potential. Projects including atleast one of the leading eight firms account for 76 percent of exportpotential. Referring to the United States, where relatively strict controlson interfirm cooperation and communication exist, Scherer states that:
When the leading four firms control 40 percent or more of totaloutput, it is fair to assume that oligopoly is beginning to rear itshead.2"
The 1990 steam coal export potential listed in Table VI exceeds 130Mt/yr. Considering that 1980 Australian steam coal exports were under10 Mt/yr (see Table VII), one might suspect that many of the projectswill not come to fruition. The point is that the structure of Australianindustry--concentration among suppliers and buyers and vertical andhorizontal integration-may influence the price and export market shareof Australian steam coal.
On the importing side,there is a worldwide trend to centralized nationalcoal purchasing. 2 The classic example is L'Association Technique deL'Importation de Charbonniere (ATIC), the French coal importing mon-opsony. Japan and Spain formed state corporations to coordinate coalimports and investigate overseas development projects. In Italy, SouthKorea, and Taiwan, national electric companies dominate import demandwith minimal competition if not cooperation from industrial importers(especially the cement industry). In Belgium, Denmark, and the Neth-erlands, utilities and other users have formed voluntary cooperatives topurchase steam coal. Of the major importers, Germany alone is char-acterized by fragmentary coal purchasing.
2. Market Shares by Country. There is no consistent source of steamcoal trade data with which to evaluate market shares by country. In TableVII we present estimates of steam coal exports excluding intra-Communistbloc trade. In 1979, Poland and the Republic of South Africa (with astate trading monopoly and domestic cartel, respectively) accounted forapproximately 60 percent of total exports listed. In 1980, Poland, theRepublic of South Africa, Australia, and the United States accounted forvirtually all exports listed.
To evaluate market shares of importing nations, we consider Australiangovernment forecasts of steam coal imports for 1985 and 1990 (TableVIII). Those forecasts, based on a country-by-country examination of-lectric utility capacity expansion and coal conversion plans, provide a
21. F. SCHERER, INDUSTRIAL MARKET STRUCTURE AND ECONOMIC PERFORM-ANCE 67 (1981).
'Exports to West only.bCalculated from Japanese steam coal imports.cTotal exports; the annual report of the National Coal Board suggests that exports were mostly for"steam raising."
Sources: (1) INTERNATIONAL COAL REVIEW 4 (May 12, 1982); (2) personal communication,Canadian Embassy in Washington; (3) COAL, GOLD AND BASE MINERALS IN SOUTH-ERN AFRICA 96 (June 1981); (4) COAL INDUSTRY QUARTERLY (Merril Lynch,December, 1981); (5) personal communication, British Information Services, Washington,D.C.
consistent, although probably optimistic, short- to mid-term projection.In east Asia, Japan dominates with about 50 percent of import demandin 1985 and over 40 percent of demand in 1990. In western Europe, nocountry alone is dominant. France accounts for 30 percent of projected1985 import demand, but only 15 percent of 1990 demand because ofan agressive nuclear program. Germany is the leader in 1990 with under20 percent of import demand. The ten countries of the European EconomicCommunity, however, account for almost 90 percent of 1985 importdemand and almost 80 percent of 1990 demand in western Europe.
In this section, we have evaluated concentration of coal producers andconsumers (number of firms and market shares) by country. We also notedthat the role of trading companies or market intermediaries is relevant tcmarket concentration. Rather than considering the role of such companiesexplicity, we advance to the next element of the structural analysis,barriers to entry. Evaluation of barriers to entry suggests the importanceof vertical and horizontal integration in coal trade and the market poweiof multi-national corporations.
[Vol. 23
INTERNATIONAL STEAM COAL MARKETS
TABLE VIII.
Projected Steam Coal Import Demand (106 tons/yr)
1980(actual, est.) 1985 1990
East AsiaJapan 8 25-29 39-52South Korea (ROK) - 9-11 18-21Taiwan 6 7-8 15-20Hong Kong 2 4-6 10-13Other Asia (8 countries) - 1-8 7-20
Source: AUSTRALIA DEPARTMENT OF TRADE AND RESOURCES, COAL DEMAND STUDY(June 1981): from country analyses of utility conversion and expansion plans and demandand conversion in other industries, especially cement.
C. Barriers to EntryThree important barriers to entry are relevant to the international coal
market: financial resources (export development projects may involvemulti-billion dollar investments), technical capability, and market infor-mation. These barriers are particularly effective against the solo entryinto the market of developing countries with attractive resources (Col-ombia, China, and Indonesia), resource owning firms with little produc-tion experience (e.g., White Industries in Australia), and coal producingfirms with little experience in the international market. At the same time,these barriers provide a market opportunity to multi-national corporations(MNCs). In fact, much of the literature on MNCs attributes to them two
October 1983]
NATURAL RESOURCES JOURNAL
important functions: reducing the costs of "arms-length" transactions(finding buyers and sellers, conducting negotiations, writing completecontracts), and increasing factor mobility (transferring technical and com-mercial "know-how" and capital).23
Vertical and horizontal integration typically characterize the activitiesof MNCs. The general trading companies in Japan provide the best ex-ample of vertical integration in coal trade. Reportedly, 65 percent ofJapan's large industrial company sector revolves around six industrialgroups (Mitsui, Mitsubishi, Marubeni, C. Itoh, Sumitomo Shoji, andNissho Iwai) .24 The general trading company establishes corporate policyand links the resource development, importing, processing, and marketingactivities of subsidiaries and affiliates. Although we have limited infor-mation concerning the activities of these general trading companies inthe international coal market, the Economist reports a tendency for theJapanese companies to bargain jointly with coking coal producers inAustralia.25
Some state coal and electricity production companies also have directforeign investments. Spain's Carboex recently purchased a 10 percentshare in Ashland Oil's coal unit. The purchase entitles Carboex to a steadysupply (0.8-1 Mt/yr) at "preferential prices." 26 The Italian government'sAGIP is a joint venture partner in an Australian mine. 7
A firm producing a similar product in different countries representshorizontal integration. Thus, in the international coal market one seesmining houses (for example, Rio Tinto Zinc, Anglo-American, and GE'sUtah International) and oil companies (for example, Arco, Shell, BP, andExxon) producing and investing in Canada, Australia, the Republic ofSouth Africa, the United States, and developing countries.
The entry of MNCs into the international coal market tends to increaseefficiency of economic activity; however, questions remain as to how themarket power of MNCs influences competition. While there is a longhistory of MNC involvement in mining projects in developing countries,it is worthwhile to consider a case study of the decisions leading to anagreement between the Colombian state company, Carbocol, and Intercor,
23. See, e.g., Caves, International Corporations: The Industrial Economics of Foreign Investment,38 ECONOMICA 1 (1971); Agmon & Hirsch, Multinational Corporations and the DevelopinsEconomies: Potential Gains in a World of Imperfect Markets and Uncertainty, 41 OXFORD BULLOF ECON. & STAT. 333 (1979); and Teece, The Multinational Enterprise: Market Failure anuMarket Power Considerations, 22 SLOAN MGMT. REV. 3 (1981).
24. Helou, Sogo Soshas and Japan's Foreign Economic Relations, 13 J. WLD. TRADE LAh257, 261 (1979).
25. ECONOMIST, supra note 19, at 15.26. Spain Authorizes Firm to Purchase 10% Stake in Unit of Ashland Oil, Wall St. J., March 9
1982, at 27.27. AUSTRALIA DEP'T. OF INDUSTRY AND COMMERCE, supra note 20.
[Vol. 23
INTERNATIONAL STEAM COAL MARKETS
a subsidiary of Exxon, to develop the northern area of El Cerrejon as anexport project."
In the mid 1970s, Colombia's state oil company, ECOPETROL, anda state industrial development institute, IFI, were competing for the rightsto develop El Cerrejon. In early 1976, the Ministry of Mines requesteddevelopment bids for El Cerrejon. In November 1976, Carbocol wascreated with 49 percent ownership by ECOPETROL, 40 percent by IFI,and 11 percent by other parts of the Ministry of Mines. In December1976, Carbocol signed a joint-venture agreement with Intercor providingequal sharing of investment costs and production, a 15 percent royaltyof Intercor production to the government, and for Intercor to operate theproject.
In his study of the project, Kline makes several important observations:first, ECOPETROL and Exxon had a history of cooperation in the oilindustry; second, there was little public debate about the type of contractto be used at El Cerrejon; third, the final contract is silent about theamount of production; and fourth, there are concerns about the transferpricing practices of Intercor as the operator of the mine, the railroad, andthe port.29 Kline does not claim that Carbocol could have done better,but rather notes the highly political atmosphere in which decisions weremade in Colombia and the lack of publicly available economic and fi-nancial analysis--conditions which favor the MNC.
D. Structure of DemandIn this section we discuss considerations in the consumer choice of
coal as a feedstock and the selection of sources of coal supply. Theprincipal substitutes for steam coal are oil, gas, and nuclear power. Theinterplay between the price of oil and coal can be appreciated from Figure2, where the cost of generated electricity is given as a function of theprice of fuel. Three curves are shown. Curve A roughly corresponds toa new baseload coal-fired power station. Curve B roughly correspondsto a new baseload oil (or natural gas) generating station, and Curve C toan existing oil-fired station. As can be seen from Table IV, delivered coalprices in Europe and Japan are about $2.70/106 Btu. Thus, coal provides-heaper electric power than a new oil plant that burns fuel at $4.25/106Btu or an existing oil plant that bums fuel at $4.70/106 Btu. Residualfuel oil prices (to U.S. electric utilities) have been about $5.00/106 BtuJuring the year ending in mid-1982.30 Coal is therefore a lower cost
28. See generally: Kline, The Coal of "El Cerrejon:" An Historical Analysis of Major ColombianPolicy Decisions and MNC Activities, 35 INTER-AMERICAN ECON. AFFAIRS 69 (198 1).
29. Id. at 85-89.30. U.S. DEP'T. OF ENERGY, MONTHLY ENERGY REVIEW 90 (Jan. 1983).
October 19831
NATURAL RESOURCES JOURNAL
70
60
50
00>- 40 -46.
O 30w-JLLJIL
SASSUMPTIONS:O I. FIXED CHARGE FACTOR IS 12% PER ANNUM.o 2. CAPACITY O+M HEAT RATE
CURVE FACTORM%) ($/1O 3 kWh) (Btu/kWh)
10 A 70 5 10200
B 80 2 9500C - 2 10500
o0
0 I 2 3 4 5 6 7
COST OF FUEL ($/IO6Btu)
FIGURE 2. The cost of generating electricity from oil and coal.
choice for Europe and Japan unless oil prices soften further. However,the relative youth of oil and gas boilers, high interest rates, and tightcapital markets retard the substitution of coal for oil and gas.
The economics of coal versus nuclear power are very close, dependingon expectations regarding construction schedules, fuel and capital costs,and interest rates. Thus political as much as economic factors explain thecontribution of nuclear power in different countries.
Considering the relatively high ratio of fuel input to energy produclcosts in the electricity sector3 1-the predominant user of steam coal-
31. An estimate of delivered coal prices (imported or subsidized domestic) in Europe is 15-2:mills/kWh (1977$). Capital and operating costs of electricity generation are in the range 20-25 millskWh. See A. BAKER & M. PRIOR, THE ECONOMICS OF ELECTRICITY FROM COALNUCLEAR AND WIND ENERGY 21,31 (lEA Coal Research, 1980).
[Vol. 23
INTERNATIONAL STEAM COAL MARKETS
one might expect coal buyers to select supplies exclusively on the basisof price. But, reliability of supply may also influence utility purchasingpractices. This is due to the volatility of coal markets32 and the charterof regulated or national utilities to supply reliable power. The extent towhich consumers address these concerns through the diversification ofsources of supply is unclear.
E. Government PolicyAt least four kinds of government policies affect trade patterns: the
formation of economic blocs, preferential trading patterns or embargoesbetween countries, export and import quotas and tariffs, and subsidies todomestic production.
Blocs or common markets are relevant to Europe with the EuropeanEconomic Community (EEC) and the eastern European Council of MutualEconomic Assistance (CMEA). The CMEA does not appear to have aformal energy trade policy. Maddock, however, describes the increasedenergy dependence of eastern European nations on the Soviet Union.33
The Soviet Union faces a difficult choice between hard currency earningsfrom oil and gas exports to the West and trade with CMEA partners.Maddock believes the Soviets will choose the latter course in return forincreased economic integration within CMEA. If this view prevails, onesees Polish and Soviet coal export potential as an erratic residual of CMEAsupply and demand.
The coal-related policies of the EEC are advisory. Nonetheless, ag-gregate steam coal import demand of EEC nations is significant in totalworld import demand. The EEC nations enjoy similar importance in wheattrade and have established a variable import levy on wheat imports. Carterand Schmitz argue that this tariff generates monopsony power and playsa critical role in wheat price formation for the EEC-an example thatcould be applied to steam coal imports.3"
Politically motivated embargoes have had little effect on coal trade. Afew relatively small importers, including Ireland, Sweden, and Finland,prohibit imports of South African coal.35 Preferential trade patterns may
32. Witness the virtual cessation of Polish exports in 1981, the recurrent labor strife in Australia,the port backlog and demurrage costs in U.S. ports in 1981, and the potentially explosive racialrelations of the Republic of South Africa.
33. Maddock, Energy and Integration: The Logic of Interdependence in the Soviet Union andEastern Europe, 12 J. COMMON MKT. STUDIES 21 (1980).
34. Carter & Schmitz, Import Tariffs and Price Formation in the World Wheat Market, 61 AM.J. AG. ECON 517 (1979).
35. AUSTRALIA DEP'T OF TRADE AND RESOURCES, COAL DEMAND STUDY, DRAFT:AN ANALYSIS OF CURRENT AND PROJECTED COAL IMPORT REQUIREMENTS OF MAJORPROSPECTIVE CONSUMING COUNTRIES FOR AUSTRALIAN COALS 3.6.2, 4.2.3, 4.5.3(1981).
October 1983]
NATURAL RESOURCES JOURNAL
have a modest effect on coal markets. The Japanese might, for example,favor U.S. coal to counter their massive trade surplus with the UnitedStates. However, it is unclear how such a national preference would betransferred to coal buyers.
Tariffs on coal trade are rare or nonexistent, but quotas are found amongexporters and importers. South Africa's export quota merits special at-tention. 36 South Africa has virtually no indigenous resources of petroleumand natural gas and depends on coal for about 80 percent of primaryenergy consumption. The South African Department of Mineral and En-ergy Affairs recently projected an increase in domestic coal consumptionfrom about 90 Mt/yr in 1980 to 740Mt/yr in 2020. In 1974, the govern-ment instituted an export quota allocated to individual companies, osten-sibly to preserve resources for long-term domestic use. In July 1981, thegovernment again increased the quota from 44 Mt/yr under phase III ofthe export program to 80 Mt/yr.37 The phase IV export levels are likelyto be reached by the early 1990s.
A variety of issues bear on the setting and distribution of the SouthAfrican quota. First, quota levels are justified by reference to coal reservelevels. The official reserve estimate doubled from 1976 to 1981. 38 Thus,the 80 million tons per year export level over 30 years represents lessthan five percent of official reserves. Second, criticism of the inefficiencyof domestic price controls may increase, though higher electricity priceswould have an adverse effect on the economics of extraction and pro-cessing of other traded commodities, notably gold and diamonds. Third,squabbling persists over the allocation of export licenses. A portion ofquotas has been awarded to MNCs to encourage the flow of oil to SouthAfrica. In addition, independent coal companies seek to enter the lucrativeexport market at the expense of the major mining houses. In any case,it seems reasonable to assume that the South African export quota is apotential vehicle to increase market power, rather than a mere constrainton industry.39
Many of the principal coal importing nations have protected domesticindustries in the past. Germany has a quota system that links imports ofcoal to consumption of domestic coal. France, West Germany, Belgium,Japan, and the United Kingdom subsidize domestic coal production by
36. See generally: South Africa's Coal Sector, Memo from American Consulate General, Johan-nesburg, Republic of South Africa to U.S. Department of State, (Feb. 5, 1982).
37. South Africa Export Quota Lifted, 297 MINING J. 185 (1981).38. Recoverable Coal Reserves Increased, 297 MINING J. 42 (1981).39. In July 1982, the Republic of South Africa allocated the phase IV quotas. Over half the
tonnage went to the TCOA or its major conglomerate members. A number of additional allocationswent to small producers, but reportedly with instructions to market cooperatively. See New SouthAfrican Export Quotas Bring in Wide Industry Participation, INT'L. COAL REPORT 2,3 (July 16,1982).
[Vol. 23
INTERNATIONAL STEAM COAL MARKETS
such practices as a state production monopoly, preferential purchasingby state utilities, or direct subsidies.4" Generally, domestic productionlevels are likely to remain flat due to limited opportunities for new mineopenings and political pressures against closing inefficient mines.
Aside from the four classes of government policy discussed above,there are a variety of other influences governments or nations may haveon trade. In Australia, the federal government must approve export con-tracts (prices and quantities), and the state coal boards must approve newmine openings. Federal government power has been used in slack marketsto compel producers to bargain jointly, and to counteract the market powerof buyers.4
In Japan, private industry and government often act in concert. Ozawa,for example, describes the Japanese system of "resource diplomacy"involving foreign aid grants and low interest loans from the Export-ImportBank of Japan to support resource development ventures initiated by theprivate sector."
In summary, the effect of government policy, in some cases, is tofurther diminish the competitive appearance of numbers of buyers (notablyin Japan and potentially in the EEC) and sellers (Australia and, especially,South Africa).
F. Summary of Market StructureIn the wide-ranging discussion above, we reviewed basic conditions
of the market and conventional elements of market structure as a meansto identify participants with potential to exercise market power. Table IXprovides a summary of this analysis. The upper part of the table is alaundry list of types of coal producers and consumers by country. Someof the elements of the market structure analysis-spatial distribution ofresources, barriers to entry, market shares, and government policy-provide a filter to identify the key actors in the market.
On the demand side, we reported a trend toward national coal buying.Yet, with the exception of Japan, most nations have a relatively smallshare of even regional markets. The nations of the EEC might, however,adopt a unified policy or strategy for coal development and purchasing.On the supply side, South Africa clearly has the appearance of an oli-gopolist enjoying very low production costs, a tight domestic producercartel, and government export licenses and quotas. Poland, with lowtransport costs to western Europe and a state trading monopoly, also
40. See generally GASKIN, supra note 4.41. Banbrick, Australian Mineral Commodity Marketing, 6 RESOURCES POLICY 166 (1980).42. Ozawa, Japan's New Resource Diplomacy: Government Backed Group Investment, 14 J.
WLD. TRADE LAW 3 (1980).
October 1983]
NATURAL RESOURCES JOURNAL
TABLE IX.
Structure of International Steam Coal Market
Types of Participants
ProducersProducer cartel (South Africa)Private firms (Canada, Australia, U.S.)
MNCs (throughout the world)
State monopolies (developing countries)
State monopolies (France and other importingnations)
Utility coal-buying co-ops (Holland, Belgiumand others)State importing or development companies(Japan, Spain, France and others)National utilities (France, Korea, Taiwan,Japan and others)
General trading companies (Japan)
* horizontal and vertical integrationgovernment policy (quotas, tariffs, andcommon markets)
* market shares (by firm or country)* spatial distribution of resources
ConsumersJapanEEC (potential)
represents a supplier with potential market power. Even with the possi-bility of foreign investment, the Australian steam coal export industry isrelatively concentrated. Mechanisms such as the federal export permitsystem, state ownership of railroads, and labor union power bolster theopportunities for Australia to exercise market power.
We have found no data to indicate the market share of individual MNCs.It is conceivable, however, that combined production of a MNC and itssubsidiaries in the United States, Canada, Australia, South Africa, anddeveloping countries, could represent a significant share of total trade.Finally, there is a remote possibility of a formal producer cartel.
Given the diverse elements of market structure, it is not surprising thatthis analysis reveals no neat, simple market structure such as a produceror consumer cartel. We are also far from ideal market conditions such aseasy entry and exit, factor mobility, many small buyers and sellers, andno institutional distortions. Caves calls the "essence of oligopoly ... the
[Vol. 23
INTERNATIONAL STEAM COAL MARKETS
recognition of market interdependence. "43 In other words, the marketstrategies (in terms of prices and quantities) of buyers and sellers areinterdependent. This seems to be a general, but accurate, characterizationof the international steam coal market. How strategies are formulated isthe subject of the next section.
III. MARKET CONDUCT
In the last section we were concerned with organizational characteristicsof the international steam coal market-that is, market structure. In thissection, we explore the pricing and production strategies of agents in-volved in the market-that is, market conduct. Following McCalla,"4 weconsider the objectives and strategies of the most important participantsin coal trade (as defined in Table IX).
A. ObjectivesThe objective of the TCOA (the producer cartel in South Africa) is to
maximize long-run cartel profits. In tandem, the South African govern-ment wants to maximize long-run producer earnings, but is also concernedwith the conservation of coal for domestic consumption for the very longrun.
Left to its own, Poland's state coal trading company would also attemptto maximize long-run profits or hard currency export earnings. But thedirection of the Polish economy seems closely bound to CMEA (theCouncil of Mutual Economic Assistance) and the Soviet Union, obscuringthe statement of Polish objectives.
The developing country monopolies presumably have multiple objec-tives: maximization of long-run rents from coal, information transfer andregional economic development, and substitution of coal for petroleumin domestic consumption to reduce oil imports or free oil for export.Domestic politics may also affect the operation of the state monopolies.
The MNCs are not only horizontally integrated in coal production, buttypically produce substitute energy commodities or other minerals. Energyproducing companies may also be vertically integrated with oil refineries,coal conversion complexes, and marketing and distribution networks.Thus, while MNCs attempt to maximize long-run profits, conflicting
43. Caves, supra note 23, at 1.44. McCalla, Strategies in International Agricultural Marketing: Public vs. Private Sector, in
INTERNATIONAL TRADE AND AGRICULTURE: THEORY AND POLICY 209 (1979). McCallaconducts a modified analysis of market structure, conduct, and performance in wheat and coarsegrain trade. After identifying the key actors in the market, McCalla characterizes their objectivesand discusses their potential strategies in a multi-lateral framework. His intent is to identify thedominant forces in market operation, especially price formation, and to develop hypotheses forempirical or theoretical testing.
October 1983]
NATURAL RESOURCES JOURNAL
objectives may exist among subsidiaries producing different products indifferent nations.
The Japanese, typical of some other consuming nations, face the con-flicting objectives of promoting coal substitution to reduce oil imports,minimizing fuel (and capital) costs, and ensuring reliability of supply. Itis worth noting that the Japanese strategy for economic developmentinvolves a shift from resource intensive basic industries, with heavydependence on imports of primary commodities, to high value-addedmanufacturing (knowledge-intensive) sectors. In that regard, Ozawa sug-gests that
Japan's primary goal in making overseas extractive investments isto stabilize its sources of supply. Profitability of a specific extractiveinvestment is rather a secondary consideration.45
However, whenever a national goal appears to conflict with private, profitmaximizing goals, it is important to ask how the national goal is conveyedto the private sector. Without such a mechanism, buyers may continueto act on the basis of private economic criteria.
B. StrategiesAt present, the strategies of the Republic of South Africa and Poland
seem most important to development of the steam coal market. An in-dustry analyst has suggested that the primary South African strategy isto set FOB port prices that will undersell the U.S. delivered price toEurope by a "few" dollars. 6 The analyst reported that until mid-1981,the Poles did the same. (This strategy is consistent with the prices reportedin Table III). Thus, South African and Polish output is determined byU.S. supply costs.
It is conceivable that the South Africans in particular could assume amore active price leadership role, affording greater discretion about outputlevels and, more importantly, deterring entry into the market of developingcountries and new producers in Australia, Canada, and the United States.Some evidence of such a role can be found in the 1982 agreement betweenthe TCOA and Japanese steelmakers that escalated soft coking coal pricesonly $2/t (3.6%) above the 1981 level.47 Coal Outlook reports that westernU.S. suppliers to Japan cannot compete with that price.48
46. Telephone conversation between David Abbey and Shirley Strzelecki, Editor, Coal WeekInt'l, February 17, 1982.
47. Of course the weakened position of the Sourth African currency (rand) is one explanation forthis modest price rise.
48. South African Price Affects West, 6 COAL OUTLOOK 12 (1982).
[Vol. 23
INTERNATIONAL STEAM COAL MARKETS
The pricing strategies of Australian producers may hinge on the op-portunities for informal cooperation among firms and the exercise ofexport controls by the federal government, as well as the escalation ofrail tariffs and the wage gains of labor unions. At present, Australiansteam coal exporters are seeking shares of the European market-forexample, by investing in ports and coal-fired ships to reduce transportationcosts. Competition in Europe may require lower FOB port prices thannecessary to compete in Japan (assuming price discrimination is not pos-sible). Some producers advocate abandonment of the European marketand concentration on the east Asia market with potentially higher profitmargins. Pursuit of such a strategy depends on the possibility of limitingcompetition and total exports.
For the developing countries, pursuit of joint venture agreements withMNCs or consumers seems necessary. Such agreements may requireinitially favorable terms for foreign investment, because there is certainlyno scarcity of investment opportunities. Nevertheless, foreign investmentprovides the host country with more thorough exploration of resources,the transportation infrastructure necessary for futher development (deep-draft ports and rail lines), and greater familiarity with international marketopportunities. Because Colombia's joint venture with Intercor commitsonly 15 Mt/yr, Colombia may pursue subsequent development indepen-dently. Developing countries such as China and Indonesia also may grantattractive terms for export projects but require fractions of mine outputto supply the domestic market.
The heterogeneity of activities and interests of vertically or horizontallyintegrated MNCs makes any discussion of strategy difficult. Nonetheless,we offer several important observations. First, corporate risks are mini-mized by investing in production capabilities in the world's most stableeconomies and by having spatially diverse production capability. Thus,Helleiner cites a United Nations' study that indicates that between 1970and 1973 over 80 percent of market-economy investment in mineralsexploration occurred in Australia, Canada, the Republic of South Africa,and the United States.49 Perhaps not surprisingly these are the dominantexporting countries in the international coal market. More recently, coalexploration and development activities of the MNCs have expanded todeveloping countries.
Second, and somewhat contradictory to the first point, is the fact thatMNCs with spatially diverse and multiproduct production capacity benefitmost from market instability."° Such organizations can react quickly to
49. Helleiner, StructuralAspects of Third World Trade: Some Trends and Prospects, 15 J. DEVEL.STUDIES 70 (1979).
50. McCalla, supra note 44, at 227.
October 1983]
NATURAL RESOURCES JOURNAL
changes in market conditions, to price changes, and technological de-velopments. Third, a proliferation of joint ventures amont MNCs in-creases market power and opportunities for collusion.
The strategies pursued by the Japanese government and trading com-panies may be representative of consumers in general. Most important,keen competition among suppliers is desirable. The Japanese do this inpart by advertising an intent to diversify supplies. Their actions in 1980and 1981 seem to have provoked a near frenzy among producers andreserve holders in the western United States that diminished within a year.The more effective strategy to promote competition of course is to reachjoint venture agreements with developing countries or potential producersin the United States, Canada, and Australia.
A subtle aspect of Japanese resource acquisition is what Ozawa callsthe system-focused strategy,5 which relates to the role of general tradingcompanies discussed earlier in the paper. In joint venture agreements, aJapanese subsidiary may be relatively generous in granting concessions.Yet the industrial group benefits in other ways, such as supply contractsfor capital goods. In addition, the Japanese retain control of the flow ofresources. With automated loading facilities, deep-water ports, and com-puter control of shipment rates and stockpiles, the Japanese achieve econ-omies in logistics that preserve the competitiveness of industry.
IV. MODELS OF IMPERFECT COMPETITION
The purpose of this section is to connect the highly institutional analysisof the previous sections with economic theories of imperfect competition.Our goal is to identify plausible behavioral theories for coal trade. Asindicated previously, it is probable that the United States in particularwill remain as a competitive fringe, no matter what structures and conductevolve in the remainder of the world. Australia, Poland and the Republicof South Africa have the potential to act non-cooperatively as oligopolistsor jointly as a cartel. Japan can act as a regional monopsonist in thePacific basin, because it is the dominant coal consumer in that region.Finally, European countries can form a buyer cartel, setting tariffs orquotas for the EEC as a whole. The potential for MNC market manip-ulation exists but is difficult to quantify, given our current state of in-formation.
Thus, a host of potential market structures exist with an even largerarray of potential strategies for pricing and output decisions. We are notsuggesting that any of these structures actually characterize the market;we only wish to explore potential structures. (The logical next step is to
51. Ozawa, supra note 45, at 68.
[Vol. 23
INTERNATIONAL STEAM COAL MARKETS
econometrically test hypotheses about market conduct.) We now turn toa brief review of theories of cartel and oligopoly/oligopsony operation.
A. CartelsConceptually, the most simple form of market manipulation involves
collusion or cooperation on the part of several market participants. Acartel can form on either the producer or consumer side, although we aremost accustomed to producer cartels. The behavior of natural resourcescartels has received renewed attention over the past decade, due princi-pally to the rise of OPEC. 2
As stated by Osborne,53 there are four internal decisions for carteloperation: location of the frontier of possible price and output levels forcartel participants (the contract surface); choice of price and output levelsfor cartel members (the sharing problem); and detection and deterrenceof cheating by cartel members. Osborne suggests that locating the contractcurve and detecting cheating are the principal problems facing a perfectcartel (i.e. where payments from one cartel member to another-side-payments-are possible). For a perfect cartel, joint revenue maximizationis the cartel objective. However, if side-payments are excluded (as wouldlikely be the case with an international coal cartel), the problem of de-termining the appropriate share of profits for each cartel member becomesmore significant.
If side payments are excluded and the product of the gains to eachmember from forming a cartel is maximized, one arrives at Nash's wellknown solution to the bargaining problem. But the Nash equilibrium isnot the sole solution to the bargaining problem. For instance, a simple(and thus enforceable) pricing rule (such as uniform price for all members)could result in another solution.
In summary, while there is no single solution to the cartel pricingproblem, the set of possible outcomes (that is, the bargaining set) can berestricted. If there are not large gains from cartel formation, then thebargaining set may be quite small. We have also suggested two possiblestrategies for operating a cartel: joint profit maximization and maximi-zation of gains from cartel formation.
In any case, a cartel is an unlikely model for the steam coal market.We mentioned previously the difficulty of side-payments in internationalmarkets involving nations as key actors. Scherere4 suggests some otherpractical problems. First, with non-homogeneity and spatial differentia-
52. Most recent work has involved case studies of cartels for oil or non-energy commodities. fora review, see C. KOLSTAD, D. ABBEY & R. BIVINS, MODELING INTERNATIONAL COALTRADE 34 (Los Alamos National Laboratory, 1983).
53. Osborne, Cartel Problems, 66 AM. ECON. REV. 835 (1976).54. F. SCHERER, supra note 21, at 199.
October 1983]
NATURAL RESOURCES JOURNAL
tion of products, coordination of policy is difficult, because it must addressnot only price but product specifications (for example, coal ash and sulfurcontent) and transportation costs. Second, secrecy and retaliation lags,as occur under long-term contracting, deter coordination among cartelmembers. Third, the lumpiness or infrequency of orders encourages mem-bers to undercut prices. Finally, industries characterized by high fixedcosts such as coal mining are susceptible to breakdowns of price disciplinein periods of slack demand.
B. Non-Cooperative EquilibriaWe now turn to the case where there is no collusion among the par-
ticipants in the coal market. In this category fall the extremes of perfectcompetition and monopoly or monopsony. In between lie oligopoly, oli-gopsony and bilateral oligopoly.
Since monopoly or monopsony are special cases of oligopoly andoligopsony, we consider oligopoly, oligopsony and bilateral oligopoly.Each of these cases involves a set of participants with the potential toexercise market power. Our analysis of how these participants interact islargely independent of whether they are consumers or producers, andthus for convenience, we concentrate on oligopoly models.
The oldest and best known model of oligopoly behavior derives fromCournot, who hypothesized that oligopolists determine output based onthe output levels of their opponents.55 The Nash equilibrium which resultsis often called a Cournot-Nash equilibrium. 6 Betrand hypothesized asimilar model with prices as the observed variable instead of quantities.In the 1930s von Stackelberg took a step forward suggesting that someoligopolists ("leaders") might react not only to their opponents' outputlevels but to how these output levels are affected by the leaders' actions.Bresnahan has recently synthesized these approaches into the concept ofa full information of "consistent conjectures" equilibrium where eacholigopolist reacts to his opponents' reaction functions.7
This variety of behavioral models is the principal obstacle to deter-minant analysis of oligopoly behavior. McCalla's classic model of duo-poly in world wheat markets makes a variety of assumptions about duopolyoperations which yield a unique set of prices and production levels. 8
55. For a review of models of oligopoly equilibria, see J. FRIEDMAN, OLIGOPOLY AND THETHEORY OF GAMES (1977).
56. The Nash equilibrium referred to here should not be confused with Nash's solution to thecartel bargaining problem.
57. Bresnahan, Duopoly Models with Consistent Conjectures, 71 AM. ECON. REV. 934 (1981).58. McCalla, A Duopoly Model of World Wheat Pricing, 48 J. FARM ECON. 711 (1966). See
also, Alaouze, Sturgess & Watson Oligopoly Pricing in the World Wheat Market, 60 AM. J. AG.ECON. 173 (1978).
[Vol. 23
INTERNATIONAL STEAM COAL MARKETS
MARGINAL COSTS
\ \DEMAND'MARGINAL REVENUE
q*( q
FIGURE 3. Hypothetical demand and marginal revenue curves faced by re-gional monopolists.
Most of the handful of other applied analyses assume only a Cournottype model."
C. Policies to Deter EntryA final issue requiring treatment is how oligopolists (if they exist) may
deter entry of competitors. We suggested previously that oligopolists willlikely be countries, or in the case of the EEC, a group of countries. Muchof the potential producer market power derives from a fortunate initialendowment of resources. Nevertheless, producing countries in particularface potential new competitors from developing countries.
One of the simplest ways to explain producer market manipulation isto view each regional monopolist as facing a kinked demand curve (Figure3). If production costs are in the vicinity of the kink, optimal (limit)pricing will be at or just below that of the competitive fringe (as indicatedin Figure 3). This result is consistent with the discussion in prior sectionswhich suggested that the Republic of South Africa prices a "few" dollarsbelow the United States (in delivered price terms). But limit pricing maynot be consistent with classic oligopoly models such as Cournot's. Implicit
59. See, e.g., Levhari & Mirman, The Great Fish War: An Example Using a Dynamic Cournot-Nash Solution, 11 BELL J. ECON. 322 (1980); and Salant, Imperfect Competition in the InternationalEnergy Market, 30 OPERATIONS RESEARCH 252 (1982).
October 1983]
NATURAL RESOURCES JOURNAL
in limit pricing is consideration of how one's opponents react to pricingactions in the vicinity of the kink.
Gaskins provides the first fully dynamic analysis of limit pricing strat-egies. 6 Gilbert and Goldman treat the case of dynamic limit pricing foran exhaustible resource cartel. 6 Salant explores in detail limit pricingstrategies for the OPEC cartel, which faces a "backstop" alternative tooil.6 2 Spence proposes an alternate theory to explain deterrence to entryof competitors.6 3 He suggests that excess capacity on the part of oligo-polistic firms can be an effective deterrent because the potential entrantfaces competition which has the capacity to reduce potential profits tozero. On the other hand, Scherer observes the common occurrence ofnew entry and capacity expansion leading to the breakdown of oligo-polist's market shares.'
V. CONCLUSIONS
In Parts II and III we identified those actors in the international steamcoal market with the potential to exercise market power-at a minimum,the Republic of South Africa, Poland, Japan, Australia, and the EuropeanEconomic Community. Unfortunately, the discussion of strategies andmarket conduct in general was speculative or inconclusive.
The review of theories of imperfect competition in the last sectionsuggested the applicability of non-cooperative models of oligopoly andoligopsony to the steam coal market. However, that review was likewiseinconclusive, because of the variety of imperfect market models and thedifficulty in reducing this variety based on specific characteristics of thesteam coal market.
The challenge for the future is to compare implications of behavioralmodels for pricing and production decisions with data on market pricesand trade flows: in other words, to test hypotheses about market conduct. 65
Such research is complicated by a dearth of data due to the youth of thesteam coal market. However, data are slowly becoming available onhistoric prices and flows for steam coal, and some engineering estimateshave been made of production relations for steam coal. Although testing
60. Gaskins, Dynamic Limit Pricing: Optimal Pricing Under Threat of Entry, 3 J. ECON. THE-ORY 306 (1971).
61. Gilbert & Goldman, Potential Competition and the Monopoly Price of an Exhaustible Re-source, 17 J. ECON. THEORY 319 (1978).
62. Salant, Staving off the Backstop: Dynamic Limit-Pricing with a Kinked Demand Curve, in I1ADVANCES IN THE ECONOMICS OF ENERGY AND RESOURCES 187 (1979).
63. Spence, Entry, Capacity, Investment and Oligopolistic Pricing, 8 BELL J. ECON. 534 (1977).64. F. SCHERER, supra note 21, at 252.65. For some exploratory work on this line see C. KOLSTAD, D. ABBEY & R. BIVINS, supra
note 52, and C. KOLSTAD and D. ABBEY, THE EFFECT OF MARKET CONDUCT ON IN-TERNATIONAL COAL TRADE (Los Alamos National Laboratory, 1983).
[Vol. 23
INTERNATIONAL STEAM COAL MARKETS
hypotheses about market conduct taxes current econometric capabilities,methods are becoming available.'
Our basic conclusion, derived from structural analysis, is that the in-ternational steam coal market does not appear to be perfectly competitive.This finding has wide-ranging policy implications, from the U.S. Gov-ernment's interest in increasing coal exports to the western European andJapanese efforts to reduce dependence on imported oil and gas. We hopethat further research can define a specific model of market operation tobe used for quantitative policy analysis.
66. For a brief review see Bresnahan, Identificaton of Market Power (1981) (unpublished paper,Econ. Dept., Stanford Univ.).