* Forthcoming to Economic Development and Cultural Change. **This paper is a revised version of a part of my dissertation ( “A Study of Japanese Ricemarket Liberalization” [Ph.D.diss., University of Chicago, 1993] ). I thank my thesis advisers; Yair Mundlak, Nancy Stokey and especially D. Gale Johnson who suggested the original ideas shown in this paper. I thank Chaw-hisa Tu for providing me with Taiwanese data and useful discussion on the Taiwanese economy. I am grateful to two anonymous referees for their helpful comments on the earlier version of this paper. The Structure of Rice Production in Japan and Taiwan * Hiroshi FUJIKI** Kyoto Institute of Economic Research, Kyoto University Sakyo, Kyoto, 606-01, Japan
Transcript
* Forthcoming to Economic Development and Cultural Change.
**This paper is a revised version of a part of my dissertation ( “A Study of
Japanese Ricemarket Liberalization” [Ph.D.diss., University of Chicago, 1993]).
I thank my thesis advisers; Yair Mundlak, Nancy Stokey and especially D. Gale
Johnson who suggested the original ideas shown in this paper. I thank Chaw-hisa
Tu for providing me with Taiwanese data and useful discussion on the Taiwanese
economy. I am grateful to two anonymous referees for their helpful comments
on the earlier version of this paper.
The Structure of Rice Production in Japan and Taiwan*
Hiroshi FUJIKI**
Kyoto Institute of Economic Research,
Kyoto University
Sakyo, Kyoto, 606-01, Japan
1
The Structure of Rice Production in Japan and Taiwan
Hiroshi FujikiKyoto Institute of Economic Research, Kyoto University
I. Introduction
This paper points out the failure of Japanese agricultural policy through an
international comparison with Taiwanese agricultural policy. More specifically,
the paper focuses on a comparison between Taiwanese rice production costs and
those in the Non-Hokkaido region of Japan. There are many similarities between
Taiwanese rice production and rice production in the Non-Hokkaido region of
Japan; the farm size distribution, the variety of rice produced, and the degree of
mechanization. It is also well known that the average cost of Japanese rice
production decreases with farm size, as Hayami and Kawagoe for example, have
shown.1 But Taiwanese rice production costs remain almost constant with
respect to the scale of operation as Kuroda has confirmed.2 This paper argues
that differing the government policies throughout the process of mechanizing rice
production in these two very similar economies is one of the major reasons why we
find such a difference in the cost structure of production. The Taiwanese
government encourages contract farming, and succeeded in separating the land
2
owner and the tiller. On the other hand, the Japanese government has encouraged
large scale tenant farming since 1970, and particularly since 1980, but could not
achieve this objective due to inconsistent policies to restrain the separation of land
owner and the tiller. Given the unsatisfactory results of Japanese agricultural
policy which has focused large scale tenancy farming, the introduction of efficient
contract farming would be another beneficial policy option for Japanese rice
production in the Non-Hokkaido region.
The organization of this paper is as follows. Section II shows some
statistical evidence that justifies my assertion. Section III reports the results of
quantitative analysis. Section IV concludes the paper with some policy
implications.
II. Some Statistical Evidence
The Japanese and Taiwanese economies have many characteristics in common. In
both economies the farm size distribution is skewed to the left, and part-time farm
households are prevalent after the success of industrialization. Other similarities
are found in the variety of rice produced, price supports, farmland regulations, and
post World War II farmland reforms.
The major objective of land reform laws were to prevent the concentration of
farmland towards a small number of absentee landlords as was often the case with
the rural villages in Japan in the 1940s. The 1952 Japanese Agricultural Land
Law stressed the principle that “farmland should be owned by those who actually
cultivate it.” The law imposed the upper limit on the ownership of farmland (3 ha
3
in the Non-Hokkaido regions and 12 ha in the Hokkaido region), and kept the rent
on a low level to help small scale tenant farmers. The law also determined that in
principle landlords could not terminate land lease contract apart from the case
where their tenants refused to pay rent for no reason. In Taiwan, the 1949 37.5
Percent Rent Reduction Act, the sale of public land, and the 1953 Land-to-the-tiller
Act played the same role as the 1952 Japanese Agricultural Law did. As a result,
the land lease contract became uncommon in both Japan and Taiwan, unlike in
many other countries in Asia, North America, and Europe, and we found huge
number of small scale owner-tiller farms in those two economies..
Both Japanese and Taiwanese land reforms were believed to be the most
successful reforms ever taken in anywhere in the Asian countries, although they
were guided by the American strategies against possible communist revolution.3
Reflecting those farmland regulations, the farm size distribution in Taiwan and the
Non-Hokkaido region of Japan is almost identical even in 1985 as can be seen in
Table 1.
However, there are many important differences between these two
economies: the price level for rice, the rice production costs, and in particular, the
ownership of machinery. Table 2 shows the area of rice harvest per machine in both
economies.4 The Japanese statistics are for rice producing farms only, but the
Taiwanese statistics are for machines held by all farm households, therefore the area
of rice harvest per machines in Taiwan could be underestimated. Nonetheless, the
average tractor in Taiwan works more than ten times as large an area as does the
average tractor in Japan. Table 2 shows that even in the Hokkaido region of
4
Japan, where large scale farming prevails for historical reasons as can be seen in
Table 1, the average tractor in Taiwan works more than twice as large an area.
This observation does not simply reflect the fact that Taiwanese farms use labor
intensive techniques. By 1990, 98 percent of rice production was accomplished
by machinery in Taiwan. Moreover, as can be seen in Table 3, in 1990, Taiwanese
rice production required farmers to spend 238 hours in 1 ha of paddy field on
average, while Japanese farmers in the Non-Hokkaido region spent 456 hours in 1
ha of paddy on average, and throughout the process of economic development,
Taiwanese farmers have worked shorter hours than Japanese farmers.5
In short, Taiwanese farms utilize a relatively small number of machines more
efficiently than Japanese farms in the Non-Hokkaido region, given an almost
identical farm size distribution. This fact could be explained by Taiwanese
governmental policy.
The Taiwanese government encouraged the mechanization of farms by
organizing “custom farming” teams, which were groups of young and able farmers
who purchased machinery and worked for those who did not have it.6 As a result,
small land owners were encouraged to turn over their land to full-time farm
households and received non-farm job opportunities. Readers might wonder if the
same division of labor could have been achieved through the land lease contract.
However, the Taiwanese government did not abolish the 37.5 Percent Rent
Reduction Act, therefore the production of rice based on tenant farming was not a
profitable business. Moreover, the 37.5 Percent Rent Reduction Act essentially
determined that the landlords could not terminate the land lease contract in most
5
cases, therefore farmers were not willing to lend their land. Hence Taiwanese
government did their best to convince farmers that the contractual farming and
custom farming were not subject to the provisions of the 37.5 Percent Rent
Reduction Act.7 For example, the Agricultural Development Statue in 1973
stressed that the contractual farming system was not regarded as a tenancy system.
In 1983, the 37.5 Percent Rent Reduction Act was amended to give entrusted
farming and custom farming a stronger legal basis. Those policies were consistent
with the idea of maintaining the social values of small family farm while
compensating for its economic weakness through governmental and co-operative
actions.8 As a result, despite the fact that the farmland market did not work well,
Taiwanese farms achieved efficient production of rice by the custom farming
without changing the farm size distribution. Table 4 shows that in 1990, 77
percent of filed preparation, 72 percent of transplanting, and 83 percent of
harvesting were done by custom farming team.
On the other hand, Japanese governmental policy after the revision of the
Agricultural Land Law in 1970, and in particular the 1980 Farmland Utilization
Promotion Law, was aimed at concentrating farm land towards relatively large
scale farms via land lease agreements. This objective was not successfully achieved.
One reason for this failure was that the Japanese government could not give up the
owner-tiller principle discussed in the 1952 Agricultural Land Law completely as
Honma points out.9 Moreover, other factors which raised the transaction cost of
land lease contracts, including the scattered ownership of irregularly shaped
paddies and favorable treatment of the inheritance tax for the owner-tiller, make it
6
difficult to popularize land lease contracts. Therefore, small farm owners have
tried to cultivate their own paddies while exploiting the merits of being an owner-
tiller and trying buy their own machine. The artificially elevated price of rice and
the increase in non-farm income has helped their desire come true. As a result, the
Japanese counterpart to custom farming, “contract farming,” is not as common as it
is in Taiwan, as can be seen in Table 4. “Contract farming” in Japan usually means
that the larger farms, agricultural cooperative associations, or Agricultural
Production Organizations take care of particular stages of rice production using
machinery for the sake of other farms. Note that the Japanese contract farming is
based on the bilateral agreement between the parties who want to use their
machines efficiently and the farms who find it difficult to conduct some stages of
rice production by themselves for some reason. Since such an opportunities are
scattered over the rural communities, it is hard to match the demand for contract
farming with the supply of contract farming. It is clear in Table 4 that most of the
Japanese farms in the Non-Hokkaido regions do not utilize contract farming.
Therefore, given the inactive farmland market, excessive investment to the
machines leads to the observation that the machine cost, labor cost, and primary
cost (total cost of production of rice minus by product) per 1 ha of paddy decreases
with farm size as can be seen in Table 5.
It has been suggested that the promotion of large-scale farming is one of the
most promising ways to achieve efficient rice production in the Non-Hokkaido
region of Japan, but there is no way to compete with the large-scale farming in the
U.S., where 100 ha rice farms are typical. I argue that although Japanese rice
7
production may never occur at the large scale of U.S. farms, Japanese farms in the
Non-Hokkaido region could be at least as efficient as Taiwanese farms via contract
farming. This is because the two economies have many things in common, apart
from the fact that small Japanese farms invests too much in agricultural machines.
I shall further argue that contract farming, in addition to the large scale tenancy
system, is one important way to restore the efficiency of Japanese rice production,
and I will show some evidence to support my argument in the next section.
III. Some Quantitative Evidence
A. Basic Results
Many Japanese researchers point out that the introduction of machines, whose
speed of operation depends upon the size of paddies, into small and irregularly
shaped paddies leads to a decreasing unit costs of rice production as the total area
in rice cultivation in the cross section of farms increases, as we have seen in Table 5.
This is because larger farms tend to use large, fast machines in relatively larger
paddies. For example, Hayami and Kawagoe used Japanese national average data
from The Kome Seisanhi Cyosa [Survey of Rice Production Costs] between 1951-
55, 56-60, 61-65, 66-70, 71-75, 76-80 and 81-85 to estimate the following
equation ( 1 ):
ln( ) ln( )Real Primary Cost of Production Outputit it ita a e= + ⋅ +0 1 . ( 1 )
Here, subscript i represents the farm size category of the grouped average data.
For example, 0.3-0.5 ha farms, 0.5-1.0 ha farms, and so forth. Primary cost is the
8
total rice production costs net of the value of by products. Output is measured by
kg of brown rice unit. This specification assumes that the factor prices relevant
for the rice production are constant within Japan. Therefore, cross sectionally, it
is impossible to identify the effect of factor prices on the cost function. This
assumption is reasonable given the situation where agricultural cooperatives dictate
the sale of agricultural implements and materials used for the rice production.
According to Hayami and Kawagoe, the cost elasticity of scale, a1, was 0.918,
0.919, 0.923, 0.869, 0.820, 0.786 and 0.774 respectively for the periods from
1951-55, 56-60, 61-65, 66-70, 71-75, 76-80 and 81-85. That is, the cost
elasticity of scale fell over time as Japan introduced larger machines. Hayami and
Kawagoe argued that this was the result of a land market imperfection, because the
efficient techniques used by the large-scale farms did not prevail on all farms.
In the previous section I pointed out that Taiwanese farms are as small as
Japanese farms and subject to several regulations, but their mechanization was
based on “custom farming” teams. In such a situation, neither small farm size nor
farmland regulations can be the source of economies of scale if the argument of
Hayami and Kawagoe is right; i.e., a1 should be close to one if we estimate
equation ( 1 ) using Taiwanese data.
We will verify this conjecture by estimating equation ( 2 ):
ln( ) ln( )Real Primary Cost of Production Outputit t it ita a e= + ⋅ +1 , ( 2 )
where at shows the time effect in year t using grouped average data on farms with
less than 0.5 ha, 0.5-0.75 ha, 0.75-1.0 ha, 1.0-1.5 ha, and more than 1.5 ha of rice
cultivation between 1985-1991 as found in Taiwanese rice cost survey statistics.
9
Japanese average data on the farms in the Non-Hokkaido region, where the farm
size distribution is almost identical to that of Taiwan, from 1986-1991 in groups of
farm size of less than 0.3 ha, 0.3-0.5 ha, 0.5-1.0 ha, 1.0-1.5 ha, 1.5-2.0 ha, 2.0-2.5
ha, 2.5-3.0 ha, 3.0-4.0 ha, 4.0-5.0 ha, and more than 5.0 ha of rice cultivation was
used for the sake of comparison.10 My sample period is long enough to compare
Taiwanese mechanized production and Japanese medium sized mechanized
production. I first estimate equation ( 2 ) cross sectionally in each economy for
every year, and then estimate the pooling model which utilizes all of the data to test
the hypothesis that the parameters a1 and at are constant over time. I also
estimate a restricted model holding a1 constant over time while allowing at to
change. I further estimate a random effects model. The estimations use the
square root of the sample size to compute each group mean as a weight. 11 The
results are shown in Table 6.
For the Non-Hokkaido regions of Japan, cross sectional estimates of a1 are in
the range of 0.73-0.78, and those models explain about 99 % of the variation in the
real primary cost for each year. The pooling model that holds both a1 and at
constant over time yields an a1 estimate of 0.7569. However, the F-value testing
the constancy of a1 and at over time is large enough for us to reject the pooling
model. The model which restricts a1 to be constant over time but allows at to
vary yields an a1 estimate of 0.7555. The F-value testing the constancy of a1 over
time against the cross sectional model is 0.9237, and we accept the null hypothesis
of constant a1. The random effects model estimates a1 to be 0.7556. The value
of the LM test statistic is large enough for us to reject the null hypothesis of the
10
pooling model compared to the random effects model at zero percentage point as
the p-value shows. But the value of Hausman test statistic which compares the
random effects model against the restricted model is too small to allow rejection of
random effects model the as p-value shows.
Overall consideration suggests that the relevant model is the random effects
model for the Non-Hokkaido region of Japan, and that a plausible value for a1 is
0.755. The results are consistent with those of Hayami and Kawagoe, and we do
not find any significant structural changes in Japanese rice production after 1985.
For Taiwan, cross sectional estimates of equation (2) in each year are in the
range of 0.97-1.03, and those models explain about 99 % of the variation in the real
primary cost for each year. The estimates suggest that the Taiwanese rice
production technology yields close to constant returns to scale. The Pooling
model that holds both a1 and at constant over time yields an a1 estimate of 0.9939.
However, the F-value testing the null hypothesis of constancy of a1 and at is large
enough for us to reject this pooling model at zero percent level of significance.
The model which restricts a1 to be constant over time but allows at to vary yields
an a1 estimate of 1.0002. The F-value testing the restricted model versus the
cross sectional model is 2.5678, and I accept the null hypothesis of constancy of a1
over time only at the 4 % level. The random effects model also suggests that a1 is
0.9996, but in the case of Taiwan, the statistically preferred model is the restricted
model since the Hausman test statistic for the random effects model is large enough
for us to reject the null hypothesis of the random effects model. The finding that
the production technology of rice in Taiwan exhibits constant returns to scale is
11
consistent with the results of Kuroda, who estimates a translog cost function using
Taiwanese data from the years 1976-1993, and finds that the elasticity of cost with
respect to scale is one.
In summary, given almost the same farm size distribution, Japanese rice
production in the Non-Hokkaido region is characterized as exhibiting increasing
returns to scale but the Taiwanese economy exhibits constant returns to scale.
Since the source of increasing returns to scale in Japan is the inefficient usage of
machines as we have seen in Table 5, it is reasonable to find that Taiwanese rice
production, which utilizes the machinery efficiently though custom farming,
exhibits constant returns to scale technology.
To check the robustness of my results shown in Table 6, I show the results of
regression equation (2) using total cost, which adds rent and capital interest to
primary cost, rather than primary cost as a dependent variable following Hayami
and Kawagoe. The results are summarized in Table 7. Although the estimates
of a1 are slightly larger than those shown in Table 6, the qualitative results are
robust to the choice of cost measure.
B. Results based on Agricultural Production Organizations data
Readers might want to see the Japanese rice production costs under contract
farming. To this end, recent Japanese statistics from Agricultural Production
Organizations, which become available after 1991, are useful. An Agricultural
Production Organization can be a joint production organization of farms, or a union
of farms which works together on some particular stages of rice production on
12
behalf of member farms. Therefore, the production costs of Japanese Agricultural
Production Organizations are a good proxy for the cost of production via contract
farming. Using data from Agricultural Production Organizations during the
period from 1991-1994, we estimate equation ( 2 ) once again. For the sake of
comparison, we estimate the same equation using Japanese farm data in the Non-
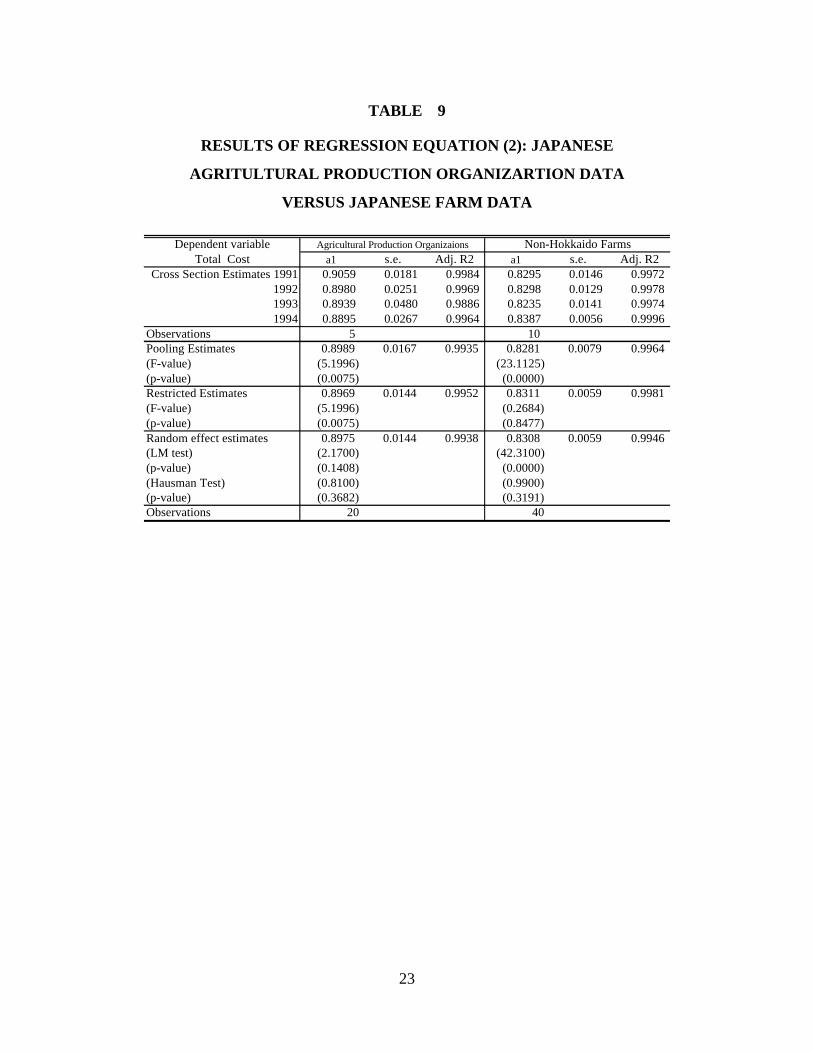
Hokkaido region of Japan. The results are summarized in Tables 8 and 9. Note
that the number of Agricultural Production Organizations surveyed to compile this
statistics are not available, hence the estimations are done by OLS.
The Agricultural Production Organizations data yield cross sectional
estimates for a1 in the range from 0.83-0.85 by using primary cost, and in the range
from 0.89-0.91 by using total cost. The pooling model estimates holding both a1
and at constant over time yield an a1 estimate of 0.8415 and the F-value of testing
the null hypothesis of constancy of a1 and at over time is small enough for
acceptance of this null hypothesis for primary cost. The restricted model holding a1
constant but allowing at to vary over time yields an a1 estimate of 0.8385. The
F-value testing the restricted model against the cross sectional estimates is 0.0562,
and we accept the null hypothesis of constancy of a1. The random effects model
also suggests that a1 is 0.8409, and the statistically preferred model is the random
effects model since the Hausman test statistic is so small. The LM statistic also
supports the pooling model. The overall results suggest that the value of a1 in the
presence of contract farming is 0.83-0.84 for the primary cost, although the
estimates are smaller than one. The plausible value of a1 for the total cost is close
to 0.90, but the estimates are still smaller than one.
13
Note that the results using farm data from 1991-1994 shown in Tables 8 and
9 suggest that the relevant model is the random effects model, and a plausible value
for a1 is 0.764 using primary cost and 0.831 using total cost, which are almost the
same as the estimate of a1 obtained from the 1985-1991 data.
In summary, we could not find evidence of constant returns to scale using
data from Japanese Agricultural Production Organizations. However, the
evidence suggests that the introduction of contract farming would help to restore
the efficiency of rice production in the sense that it increases the value of a1 in
equation ( 2 ). Therefore, I argue that it makes sense to expand contract farming
in the Non-Hokkaido regions of Japan.
IV. Policy Implications
The sustained efficiency in the rice production during the process of substituting
machines for agricultural labor in Taiwan seems to be relevant for the Non-
Hokkaido region of Japan. Small farm size per se will not be a source of
inefficiency as long as the separation of owner and tiller can be achieved through
machine sharing or contract farming. The Japanese government should change
any legal or institutional treatments that have induced farmers to be owner-tillers as
long as it is useful to reduce the rice production costs. The local agricultural
committee, the agricultural cooperative associations, and local government can
give the information on the demand and supply of contract farming as well as land
market to every farmer. If the entry of joint stock companies in the agricultural
production were allowed, those information would be very valuable. Such reform
14
might result in the prevalence of both contract farming and land lease contract.
However, contract farming is more flexible than land lease contract because
farmers can choose the particular stages of production which they would like to ask
someone to work for them. We may be able to restore the efficiency of
production of rice in the Non-Hokkaido regions of Japan in each stage of the
production of rice if we encourage the contract farming. At least we are sure that
contract farming is one of the promising way to achieve the aim of policy, and we
have no reason to stick to the large scale tenant system alone.
Given the acceptance of the GATT Uruguay Round accord, it is hard to
imagine a situation where the Japanese government could set the domestic price of
rice at an artificially high level at their will. The Japanese government sustained
the high price of rice through the acreage control program, but the application of a
uniform rate of acreage control independent of farm size is counterproductive given
the huge disparity in the average cost of production with respect to farm size. If a
reduction in the price of rice is necessary, the acreage control program per se is not
compatible with this national objective. If it is still difficult to concentrate farm
land towards large scale farms via land lease agreements, the Japanese government
should also encourage contract farming in the Non-Hokkaido region, and reduce
both the cost of production of relatively small farms and price of rice.
15
TABLE 1
FARM SIZE DISTRIBUTION IN 1985
Farm size Non-Hokkaido Taiwan Hokkaido
0 - 0.5 ha 43.4% 41.9%
0.5 - 1.0 ha 27.7% 30.7%0 - 1.0 ha 10.0%1.0 - 2.0 ha 20.6% 20.1%2.0 - 3.0 ha 5.4% 4.7%1.0 - 3.0 ha 14.6%3.0 - 5.0 ha 2.1% 1.9% 14.6%5.0 + ha 0.4% 0.6%5.0 - 10.0 ha 23.8%10.0 - 20.0 ha 14.6%20.0 + ha 12.8%Number of Farms 4,120,000 771,000 109,000
Sources: The Agriculture Census 1985; Taiwan Food Statistics Book 1986,
p.15.
16
TABLE 2
THE AREA IN RICE HARVEST PER MACHINE
Machine type Non-Hokkaido Taiwan Hokkaido All Japan(1990) (1990) (1990) (1990)
Tractor and power tillers 0.53 ha 4.67 ha 2.11 ha 0.56 haPower rice planters 1.04 ha 11.30 ha 4.64 ha 1.10 haCombines 1.62 ha 28.18 ha 5.31 ha 1.71 ha
Note: Power rice planters include less than 2, 2-4, and more than 6 row types.