THE STUDY FOR BASIC INFORMATION ON THE HOUSING SECTOR IN VIETNAM FINAL REPORT February 2014 JAPAN INTERNATIONAL COOPERATION AGENCY (JICA) NIKKEN SEKKEI RESEARCH INSTITUTE URBAN RENAISSANCE LINKAGE CO., LTD. 1R JR 14-011
Transcript
THE STUDY
FOR
BASIC INFORMATION ON THE HOUSING
SECTOR
IN VIETNAM
FINAL REPORT
February 2014
JAPAN INTERNATIONAL COOPERATION
AGENCY (JICA)
NIKKEN SEKKEI RESEARCH INSTITUTE
URBAN RENAISSANCE LINKAGE CO., LTD. 1R
JR
14-011
THE STUDY
FOR
BASIC INFORMATION ON THE HOUSING
SECTOR
IN VIETNAM
FINAL REPORT
February 2014
JAPAN INTERNATIONAL COOPERATION
AGENCY (JICA)
NIKKEN SEKKEI RESEARCH INSTITUTE
URBAN RENAISSANCE LINKAGE CO., LTD.
THE STUDY FOR BASIC INFORMATION ON THE HOUSING SECTOR IN VIETNAM
FINAL REPORT
i
Contents
1. BACKGROUND AND OBJECTIVES OF THE STUDY.......................................................................... 1-1
1.1 Background of the Study ...................................................................................................................... 1-1
1.2 Objectives and Themes of the Study..................................................................................................... 1-2
1.3 Study Area ............................................................................................................................................ 1-3
2. STUDY APPROACH ................................................................................................................................. 2-1
2.1 Questionnaire Survey and Interviews conducted jointly with Local Assistants ................................. 2-1
2.2 Demand Forecast based on Existing Available Statistical Data or the Like ....................................... 2-1
2.3 Study on Relocation Issues and Redevelopment Approach for the Port Area on the Basis of
Interviews with the Authorities .......................................................................................................... 2-1
2.4 Study Procedure ................................................................................................................................. 2-2
(4) Social Housing.................................................................................................................................. 3-9
3.4 Other Principal Laws .......................................................................................................................... 3-12
(1) The Land Law................................................................................................................................. 3-12
(2) The Construction Law .................................................................................................................... 3-13
(3) The Law on Urban Planning ........................................................................................................... 3-13
(4) The Investment Law, the Enterprise Law ....................................................................................... 3-13
(5) The Real Estate Business Law........................................................................................................ 3-13
(6) Building Code on Regional and Urban Planning and Rural Residential Planning ......................... 3-14
3.5 Land and Housing............................................................................................................................... 3-14
(1) Land Use......................................................................................................................................... 3-14
(2) State Institutions regulating Land ................................................................................................... 3-14
(3) Land Use Control............................................................................................................................ 3-16
(4) Process from Housing Planning to Construction Permission.......................................................... 3-17
(5) Obtaining Land Use Right Certificate (LURC) .............................................................................. 3-18
(6) Housing-related Taxes and their Use .............................................................................................. 3-19
(2) Size of Housing Units ....................................................................................................................... 4-1
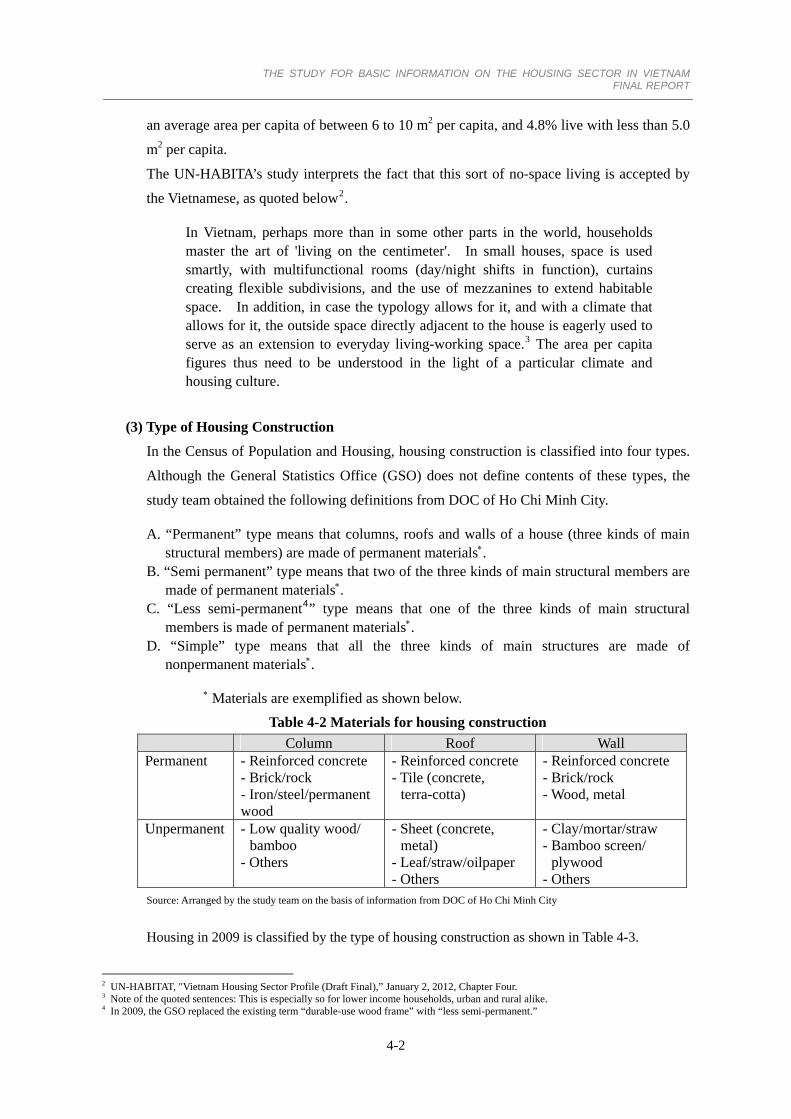
(3) Type of Housing Construction .......................................................................................................... 4-2
(4) Age of Housing ................................................................................................................................. 4-3
(5) Housing Production .......................................................................................................................... 4-3
(6) Actors of Housing Development....................................................................................................... 4-4
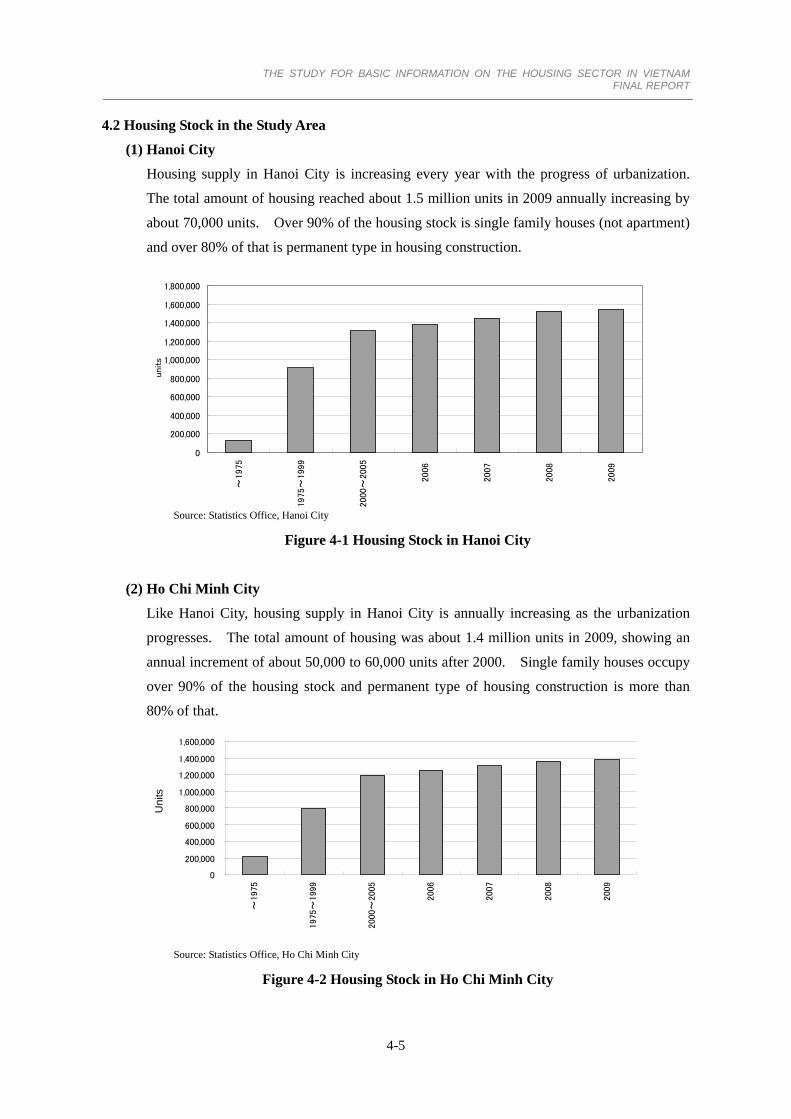
4.2 Housing Stock in the Study Area .......................................................................................................... 4-5
(1) Hanoi City......................................................................................................................................... 4-5
(2) Ho Chi Minh City ............................................................................................................................. 4-5
(3) Vinh Phuc Province .......................................................................................................................... 4-6
(4) Binh Duong Province ....................................................................................................................... 4-6
(1) Land Supply for Housing in Urban Area .......................................................................................... 4-7
(2) Land Market ..................................................................................................................................... 4-7
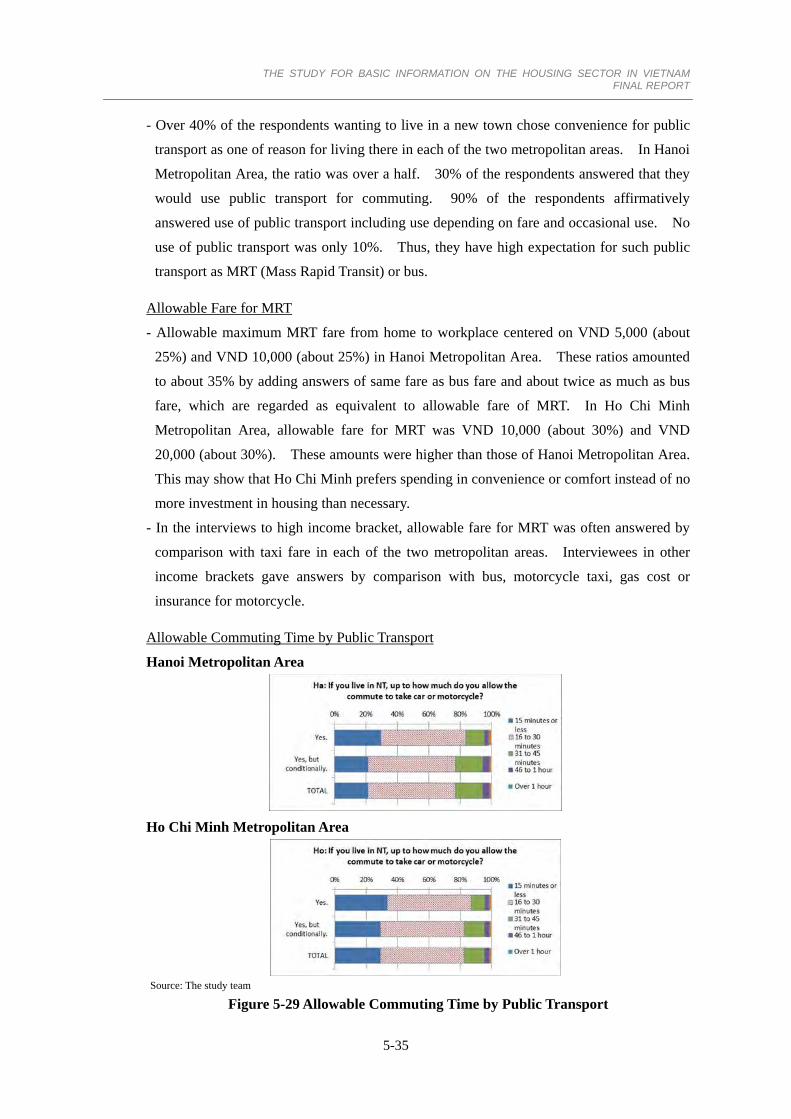
5.4 Demands for Suburban New Town connected with City Center by Public Transport ........................ 5-30
(1) Results of the Questionnaire Surveys ............................................................................................. 5-30
(2) Interviews to Salespersons, Housing Mangers and Residents about Existing New Town.............. 5-37
(3) Further Inquiries as to Concern about New Town after Questionnaire Surveys ............................. 5-41
5.5 Interviews about Housing for Low Income Brackets ......................................................................... 5-43
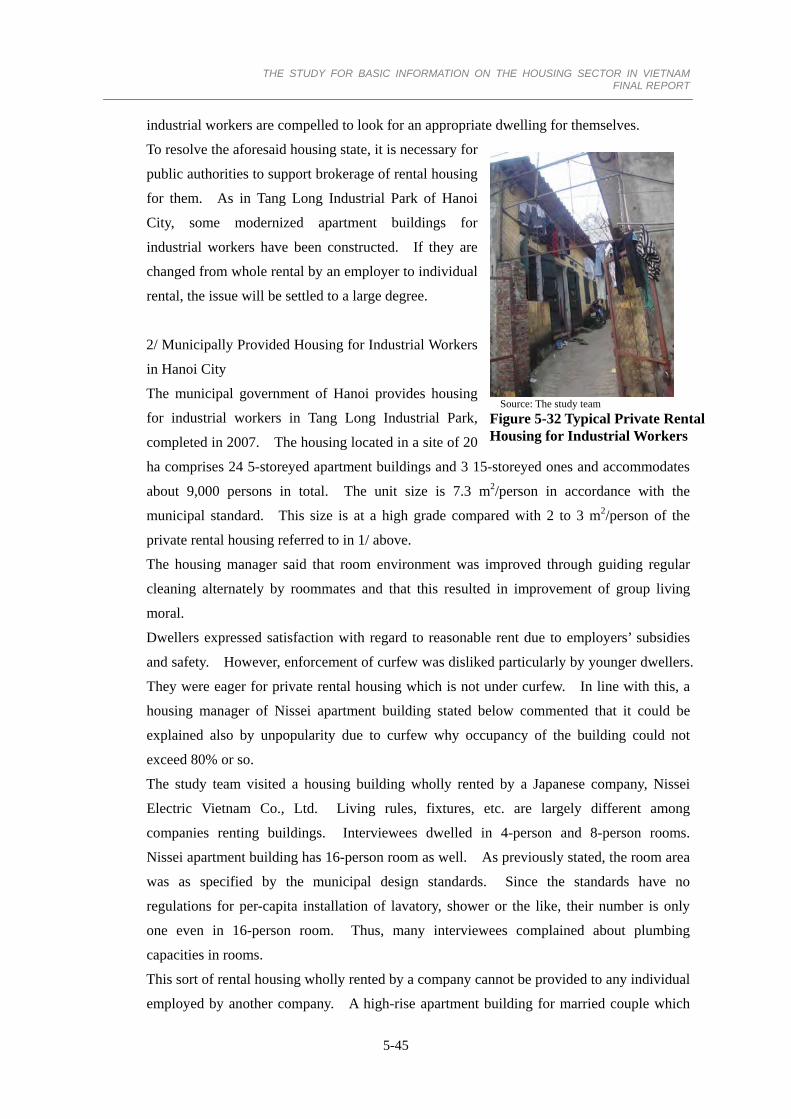
(1) Housing for Industrial Workers....................................................................................................... 5-43
(2) Social Housing................................................................................................................................ 5-48
6. LONG-TERM PERSPECTIVE OF HOUSING DEMANDS (ESTIMATION OF PURCHASABILITY
BASED ON POPULATION AND HOUSEHOLDS IN FUTURE).......................................................... 6-1
6.1 Procedure for Estimation of Population and Household Number......................................................... 6-1
(1) Objectives of Estimation................................................................................................................... 6-1
(2) Available Statistical Data for Estimation .......................................................................................... 6-1
(3) Subdivision of the Estimation Area .................................................................................................. 6-2
6.2 Outline of Procedures for Estimation ................................................................................................... 6-7
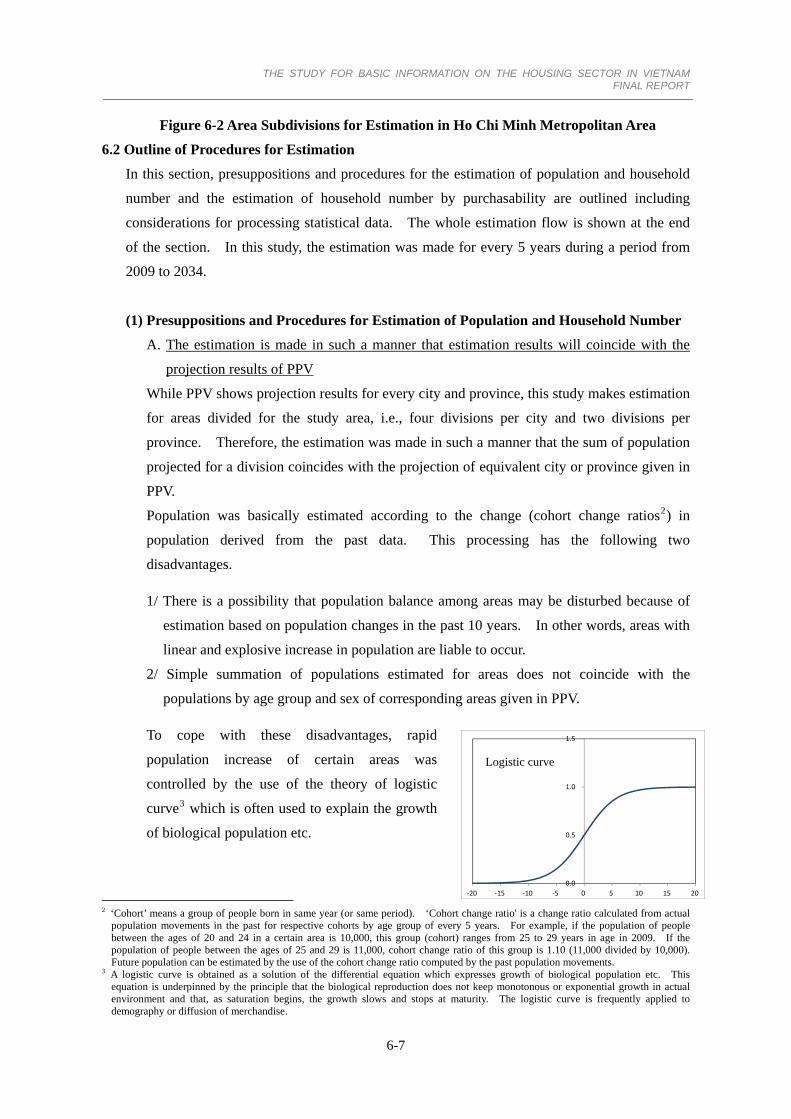
(1) Presuppositions and Procedures for Estimation of Population and Household Number .................. 6-7
(2) Presuppositions and Procedures for Estimation of Household Number by Purchasability............... 6-9
(3) Flow of the Estimation.................................................................................................................... 6-12
(1) Hanoi City....................................................................................................................................... 6-13
(2) Vinh Phuc Province ........................................................................................................................ 6-20
(3) Ho Chi Minh City ........................................................................................................................... 6-26
(4) Binh Duong Province ..................................................................................................................... 6-33
6.4 Conclusion of Long-term Perspective on Housing Demands ............................................................. 6-39
(1) Housing Demands of Higher Income Earners ................................................................................ 6-39
(2) Housing Demands of the 3rd and 4th Quintiles .............................................................................. 6-41
(3) Housing Demands of Brackets to be publically supported ............................................................. 6-42
7.1 Housing Supply in the Urban Central Area .......................................................................................... 7-1
7.2 Present Relocation of Port Facilities..................................................................................................... 7-1
7.3 Issues to be settled for Promotion of Relocation .................................................................................. 7-3
(1) Shortage of Finances for Relocation................................................................................................. 7-3
(2) Lack of Port-oriented Infrastructure in New Ports............................................................................ 7-4
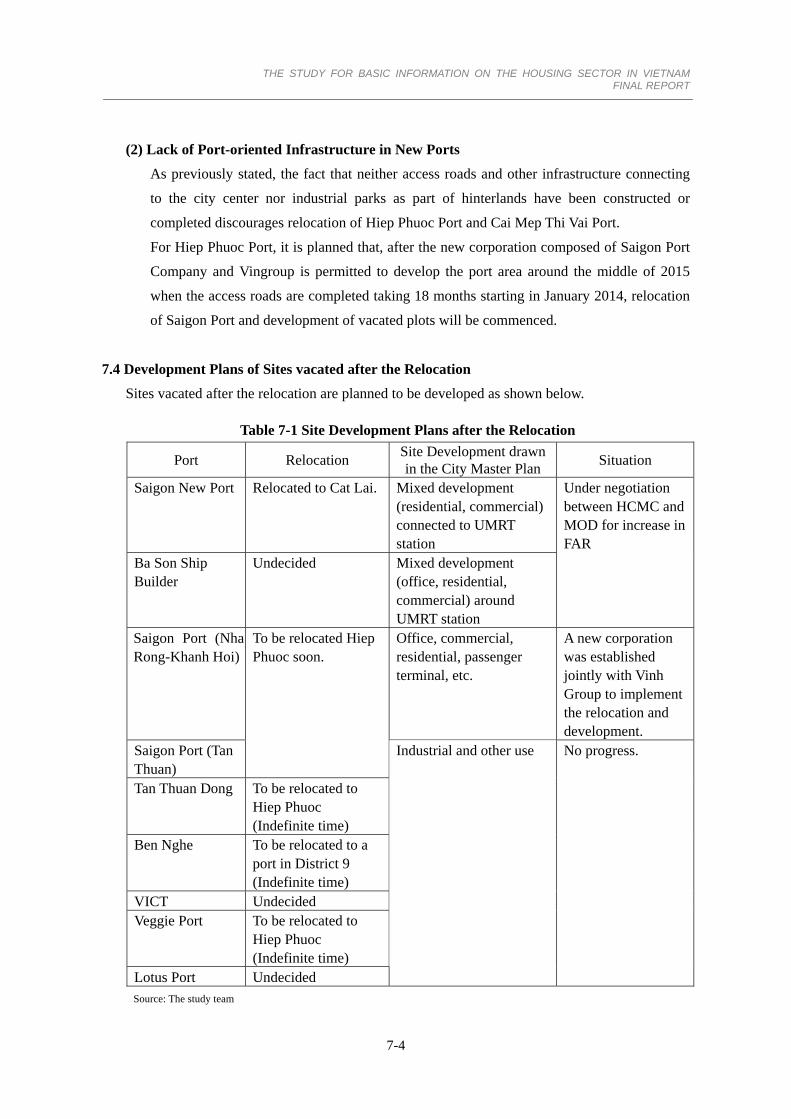
7.4 Development Plans of Sites vacated after the Relocation..................................................................... 7-4
THE STUDY FOR BASIC INFORMATION ON THE HOUSING SECTOR IN VIETNAM
FINAL REPORT
iv
7.5 Redevelopment Principles of Urban Central Vacancy generated by Relocation of Port....................... 7-5
8. ITEMIZED MATTERS TO WHICH EXPERIENCES IN JAPAN CAN BE APPLIED............................ 8-1
8.1 Summary of Housing Issues in Major Cities of Vietnam...................................................................... 8-1
8.2 Matters to be resolved by the Use of Expertise, Experience and Technology of Japan ........................ 8-2
(1) Suggestion about Government Housing Policy ................................................................................ 8-2
(2) Proposal for processing Redevelopment of the City Center ............................................................. 8-4
(3) Support for Technological Introduction in addressing the Issues ..................................................... 8-4
8.3 Matters to which Japan is expected to offer ODA Support in Housing Development.......................... 8-5
(1) Requests from Vietnam..................................................................................................................... 8-5
(2) Matters to which Japan is expected to offer ODA Support............................................................... 8-6
THE STUDY FOR BASIC INFORMATION ON THE HOUSING SECTOR IN VIETNAM
FINAL REPORT
v
Figure
Figure 1-1 Study Area................................................................................................................................. 1-3
Figure 2-1 Overall Study Procedure ........................................................................................................... 2-2
Figure 3-1 Townhouses prevailing in Vietnam ........................................................................................... 3-4
Figure 3-2 Process from Housing Planning to Construction Permission.................................................. 3-18
Figure 4-1 Housing Stock in Hanoi City .................................................................................................... 4-5
Figure 4-2 Housing Stock in Ho Chi Minh City ......................................................................................... 4-5
Figure 4-3 Housing Stock in Vinh Phuc Province ...................................................................................... 4-6
Figure 4-4 Housing Stock in Binh Duong Province ................................................................................... 4-6
Figure 4-5 High Class Apartments recently Constructed.......................................................................... 4-12
Figure 5-1 Distribution of Samples for Hanoi Metropolitan Area .............................................................. 5-4
Figure 5-2 Distribution of Samples for Ho Chi Minh Metropolitan Area .................................................. 5-5
Figure 5-3 Attributes of Respondents: Number of Household Members.................................................... 5-7
Figure 5-4 Attributes of Respondents: Number of Generations in Household ........................................... 5-8
Figure 5-5 Attributes of Respondents: Type of Household......................................................................... 5-8
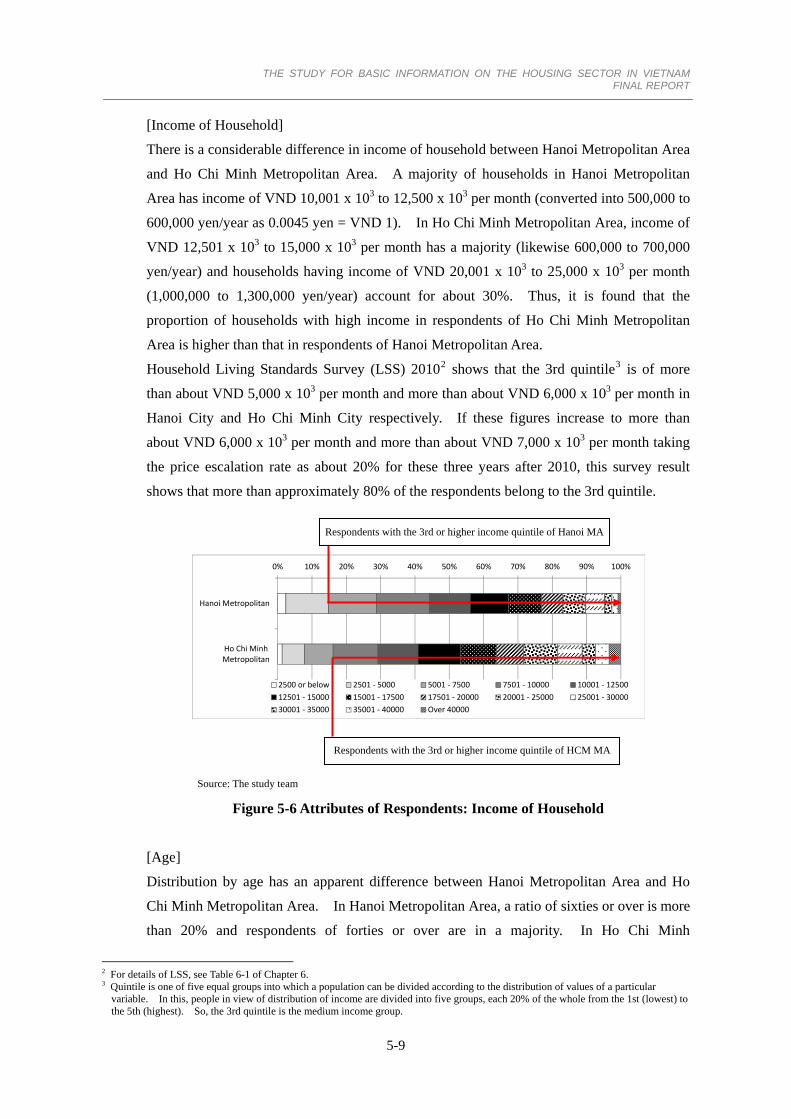
Figure 5-6 Attributes of Respondents: Income of Household..................................................................... 5-9
Figure 5-7 Attributes of Respondents: Age............................................................................................... 5-10
Figure 5-8 Attributes of Respondents: Sex ............................................................................................... 5-10
Figure 5-9 Attributes of Respondents: Employment Status ...................................................................... 5-11
Figure 5-10 Attributes of Respondents: Commuting ................................................................................ 5-11
Figure 5-11 Attributes of Respondents: Commuting Time ....................................................................... 5-11
Figure 5-12 Location Map of Interview Visits.......................................................................................... 5-18
Figure 5-13 Price and Size of Housing purchased in Past Five Years ...................................................... 5-20
Figure 5-14 Distribution of Price and Size of Housing by Income Quintile (Hanoi Metropolitan Area) . 5-21
Figure 5-15 Distribution of Price and Size of Housing by Income Quintile (Ho Chi Minh
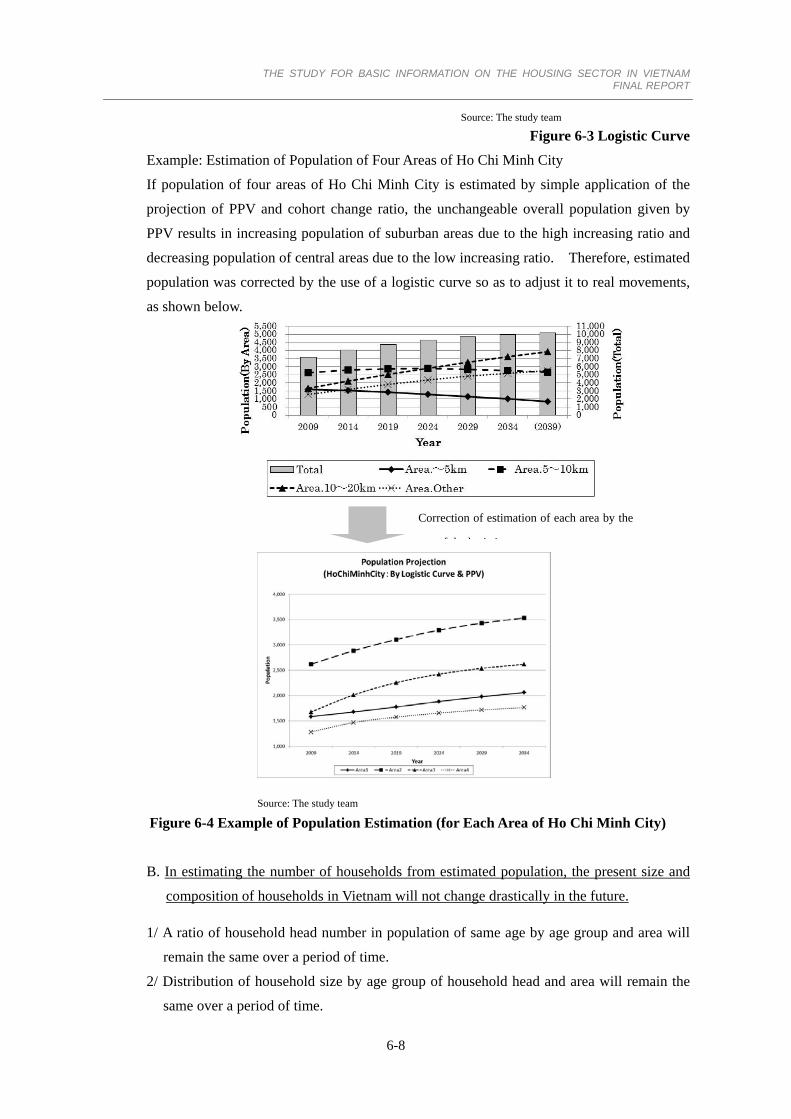
Figure 6-4 Example of Population Estimation (for Each Area of Ho Chi Minh City)................................ 6-8
Figure 6-5 Flow of the Estimation............................................................................................................ 6-12
Figure 6-6 Population Pyramid of Hanoi City (2009) .............................................................................. 6-14
Figure 6-7 Population Projection of Hanoi City ....................................................................................... 6-15
Figure 6-8 Population Pyramid by Area of Hanoi City ............................................................................ 6-16
Figure 6-9 Household Number of Hanoi City .......................................................................................... 6-17
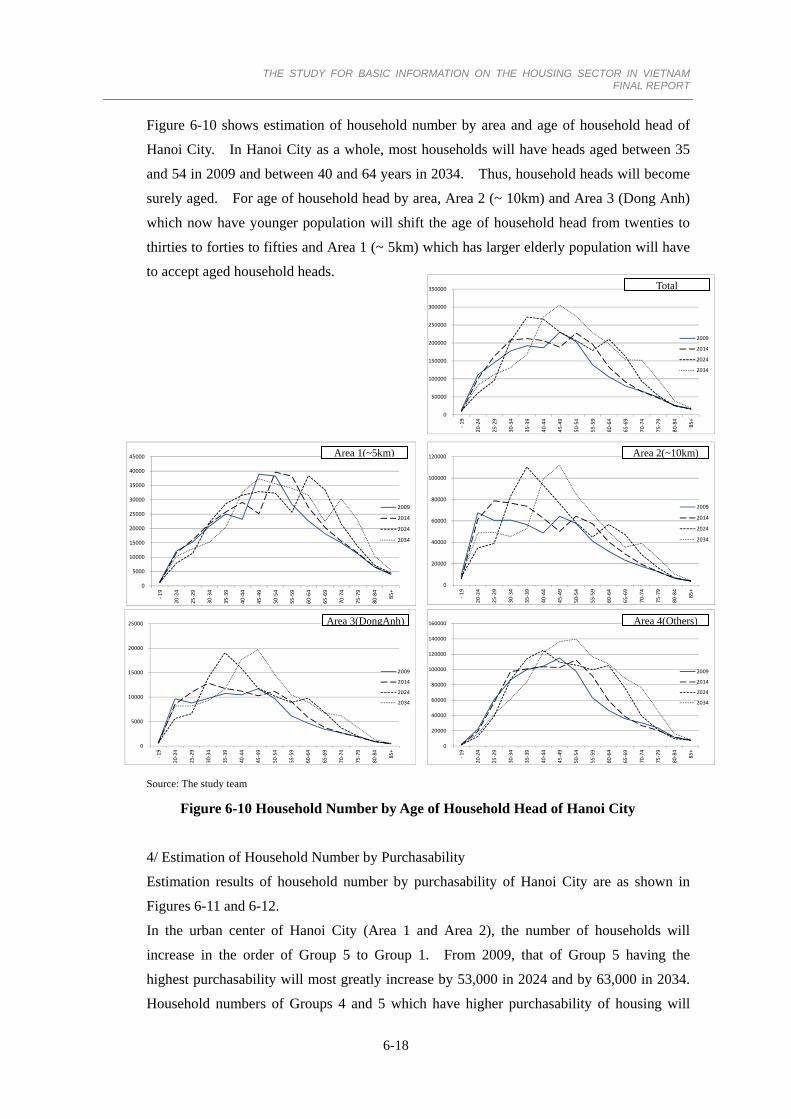
Figure 6-10 Household Number by Age of Household Head of Hanoi City ............................................ 6-18
Figure 6-11 Household Number by Purchasability of Urban Center (Areas 1 and 2) of Hanoi City........ 6-19
Figure 6-12 Household Number by Purchasability of Outskirts (Areas 3 and 4) of Hanoi City .............. 6-19
Figure 6-13 Population Projection of Vinh Phuc Province ....................................................................... 6-22
Figure 6-14 Population Pyramid by Area of Vinh Phuc Province ............................................................ 6-23
Figure 6-15 Household Number of Vinh Phuc Province .......................................................................... 6-24
Figure 6-16 Household Number by Age of Household Head of Vinh Phuc Province .............................. 6-25
Figure 6-17 Household Number by Purchasability of Vinh Phuc Province.............................................. 6-25
Figure 6-18 Population Projection of Ho Chi Minh City.......................................................................... 6-27
Figure 6-19 Population Pyramid by Area of Ho Chi Minh City ............................................................... 6-29
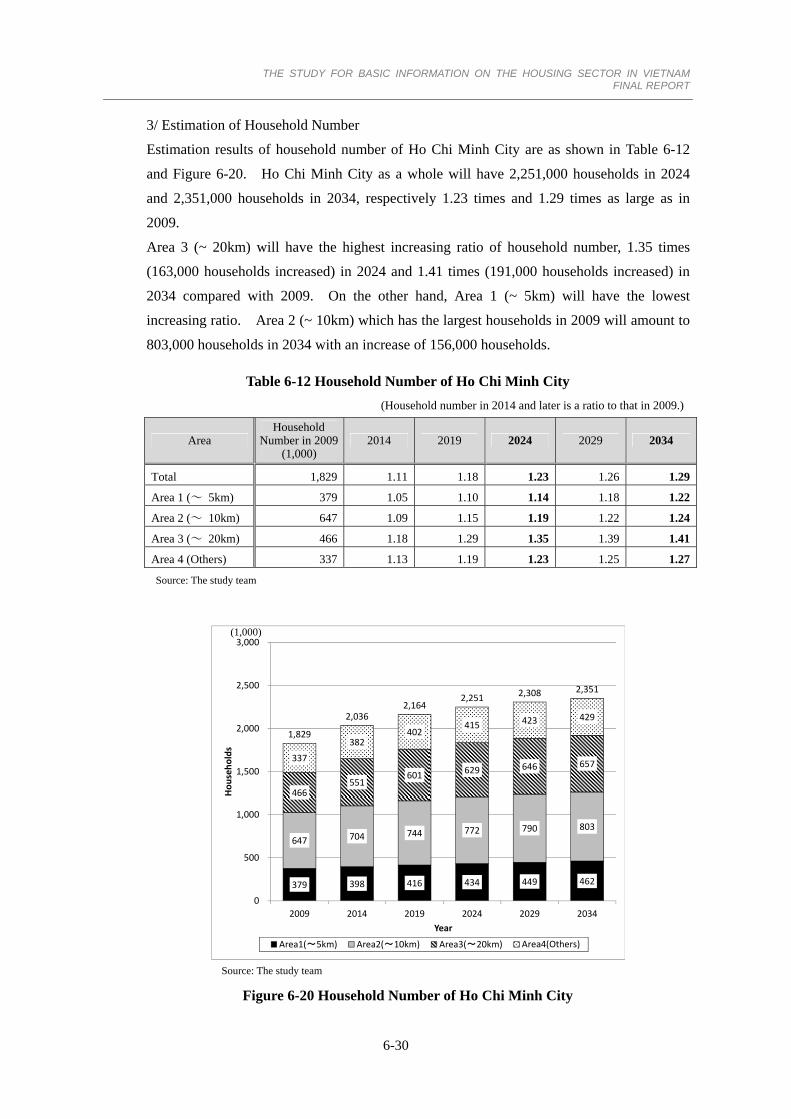
Figure 6-20 Household Number of Ho Chi Minh City ............................................................................. 6-30
Figure 6-21 Household Number by Age of Household Head of Ho Chi Minh City................................. 6-31
Figure 6-22 Household Number by Purchasability of Urban Center (Areas 1, 2 and 3) of Ho Chi
Minh City ......................................................................................................................................... 6-32
Figure 6-23 Household Number by Purchasability of Outskirts (Area 4) of Ho Chi Minh City .............. 6-32
Figure 6-24 Population Projection of Binh Duong Province .................................................................... 6-34
THE STUDY FOR BASIC INFORMATION ON THE HOUSING SECTOR IN VIETNAM
FINAL REPORT
vii
Figure 6-25 Population Pyramid by Area of Binh Duong Province ......................................................... 6-36
Figure 6-26 Household Number of Binh Duong Province ....................................................................... 6-37
Figure 6-27 Household Number by Age of Household Head of Binh Duong Province ........................... 6-38
Figure 6-28 Household Number by Purchasability of Binh Duong Province........................................... 6-38
Figure 6-29 Temporal Change of Supplies from Urban Renaissance Agency of Japan............................ 6-41
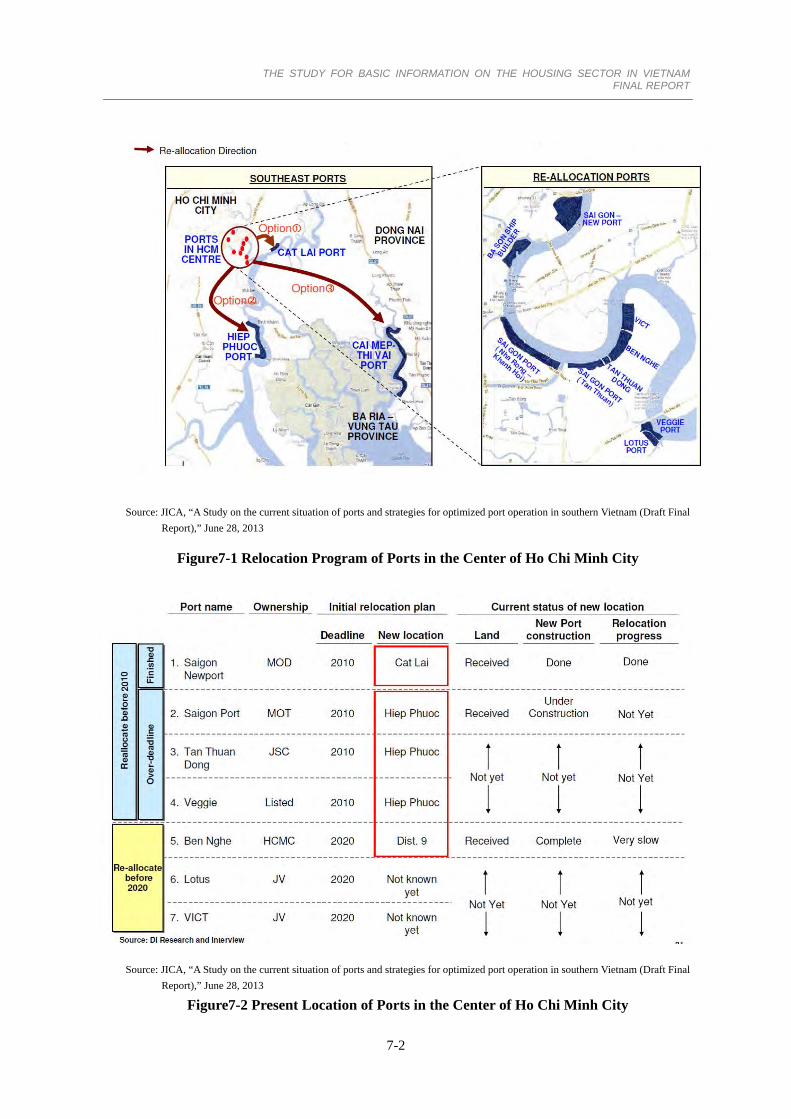
Figure7-1 Relocation Program of Ports in the Center of Ho Chi Minh City .............................................. 7-2
Figure7-2 Present Location of Ports in the Center of Ho Chi Minh City ................................................... 7-2
Table
Table 1-1 Population Composition of Study Area ...................................................................................... 1-4
Table 3.1 Housing State and Basic Service by Region ............................................................................... 3-1
Table 3-2 Housing State and Basic Service by City Class.......................................................................... 3-2
Table 3-3 Targets given in the National Housing Development Strategies until 2020 and with a vision
Table 3-4 Central Level Institutions involved in Land Management........................................................ 3-15
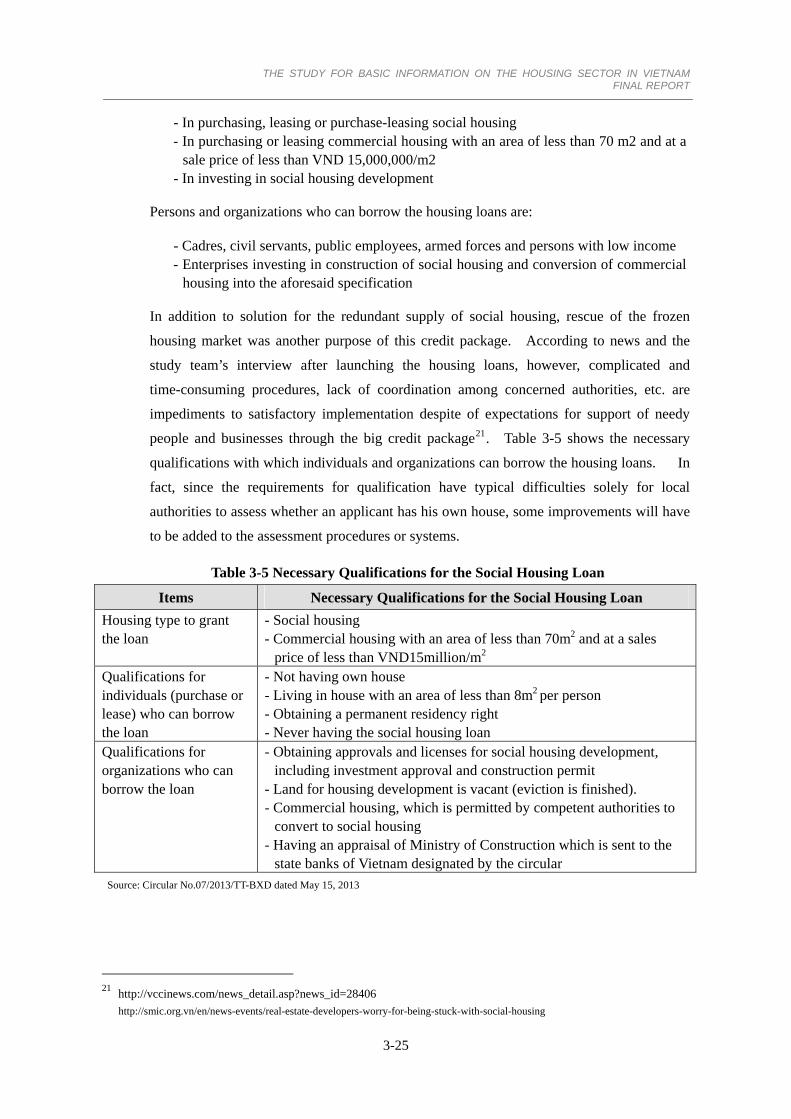
Table 3-5 Necessary Qualifications for the Social Housing Loan ............................................................ 3-25
Table 3-6 Criteria for the Housing Development Program in Hanoi (Period 2012 to 2020, and aiming
for 2030)........................................................................................................................................... 3-26
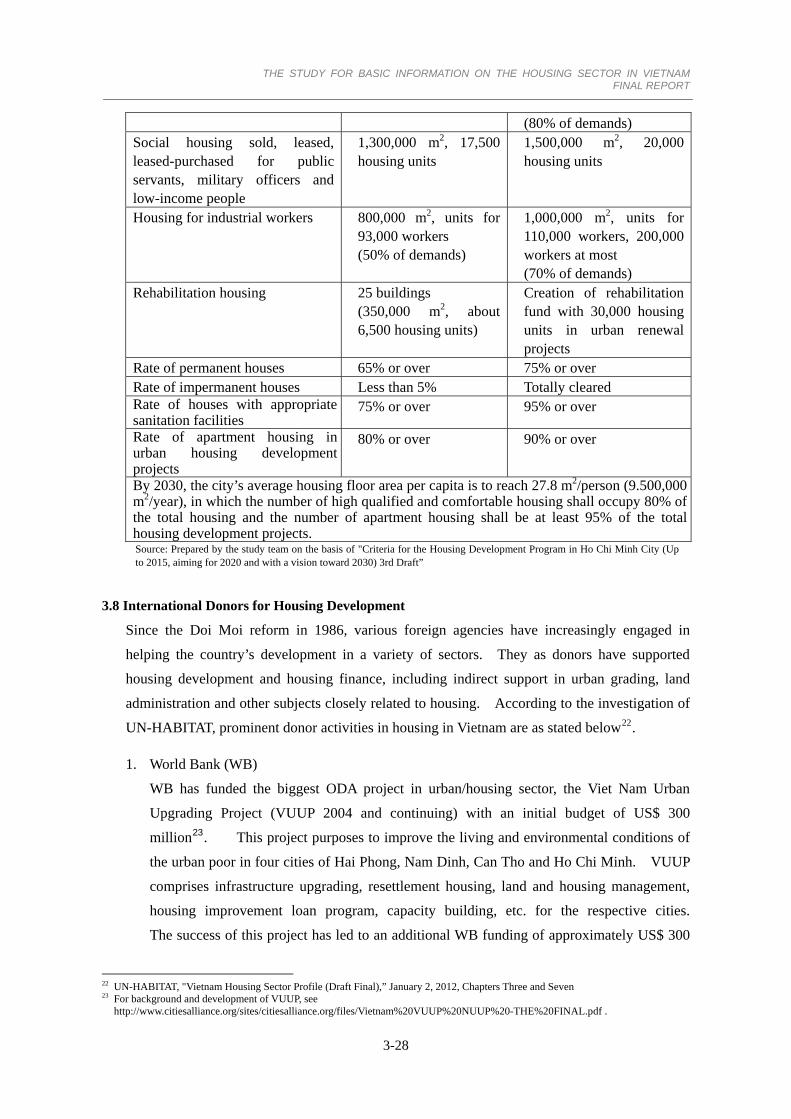
Table 3-7 Criteria for the Housing Development Program in Ho Chi Minh City (Up to 2015, aiming
for 2020 and with a vision toward 2030) [3rd Draft] ....................................................................... 3-27
Table 4-1 The Number of Households with Housing in 1999 and 2009..................................................... 4-1
Table 4-2 Materials for housing construction ............................................................................................. 4-2
Table 4-3 Type of Housing Construction in 2009....................................................................................... 4-3
Table 4-4 Urban Housing Stock and Production by Housing Construction in 1999 and 2009................... 4-3
Table 5-1 Specified Districts and Size of the Questionnaire Surveys......................................................... 5-3
Table 5-2 Collection Result of the Questionnaires for Hanoi Metropolitan Area....................................... 5-6
Table 5-3 Collection Result of the Questionnaires for Ho Chi Minh Metropolitan Area ........................... 5-6
Table 5-4 Total Number of Samples to be analyzed ................................................................................... 5-7
Table 5-5 Interviewees of Group A........................................................................................................... 5-13
Table 5-6 Interviewees of Group B........................................................................................................... 5-13
Table 5-7 Articles taken up in the Interviews ........................................................................................... 5-14
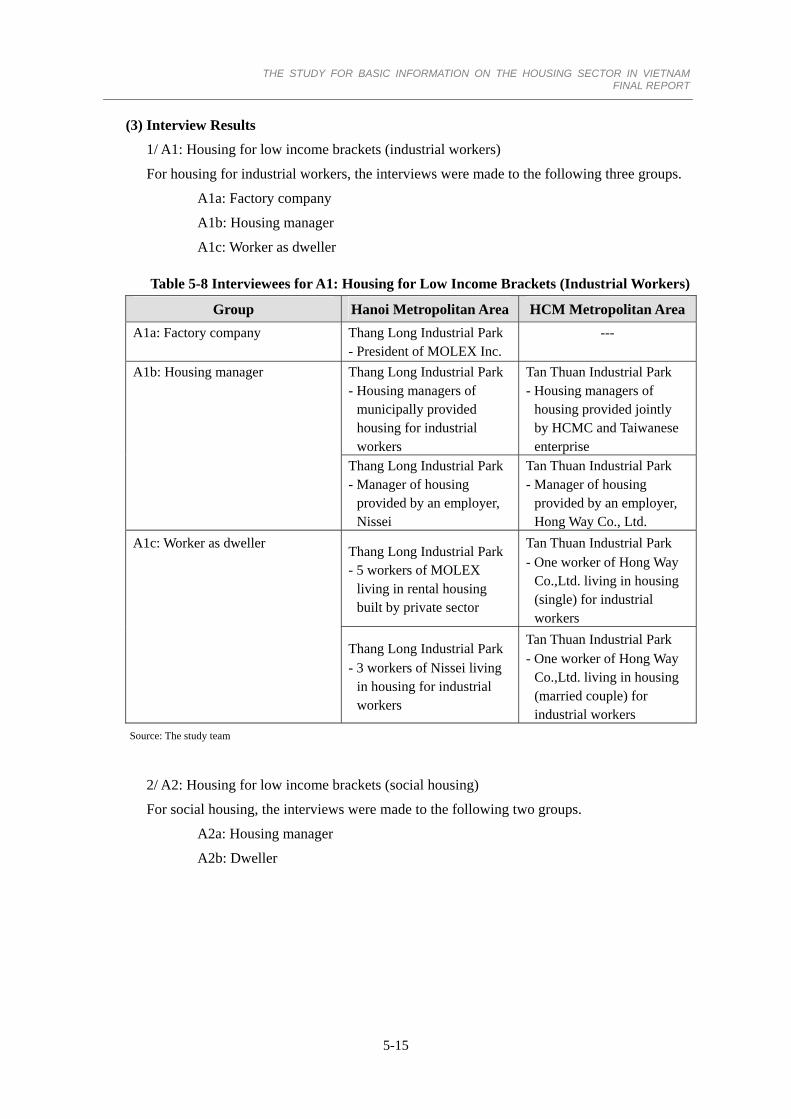
Table 5-8 Interviewees for A1: Housing for Low Income Brackets (Industrial Workers) ........................ 5-15
Table 5-9 Interviews for A2: Housing for Low Income Brackets (Social Housing)................................. 5-16
Table 5-10 Interviewees for A3: Home Buyer in a New Town................................................................. 5-16
Table 5-11 Housing Purchase by Income Quintile.................................................................................... 5-21
Table 5-12 Housing Desirability by Income Quintile ............................................................................... 5-25
THE STUDY FOR BASIC INFORMATION ON THE HOUSING SECTOR IN VIETNAM
FINAL REPORT
viii
Table 5-13 Interviews to Salespersons, Housing Mangers and Residents about Existing New Town...... 5-39
Table 5-14 Further Interviews as to Concern about New Town................................................................ 5-41
Table 5-15 Interviews as to Housing for Industrial Workers .................................................................... 5-43
Table 5-16 Interviews as to Social Housing ............................................................................................. 5-48
Table 6-1 Quantile Range of Annual Household Incomes (LSS 2010) .................................................... 6-11
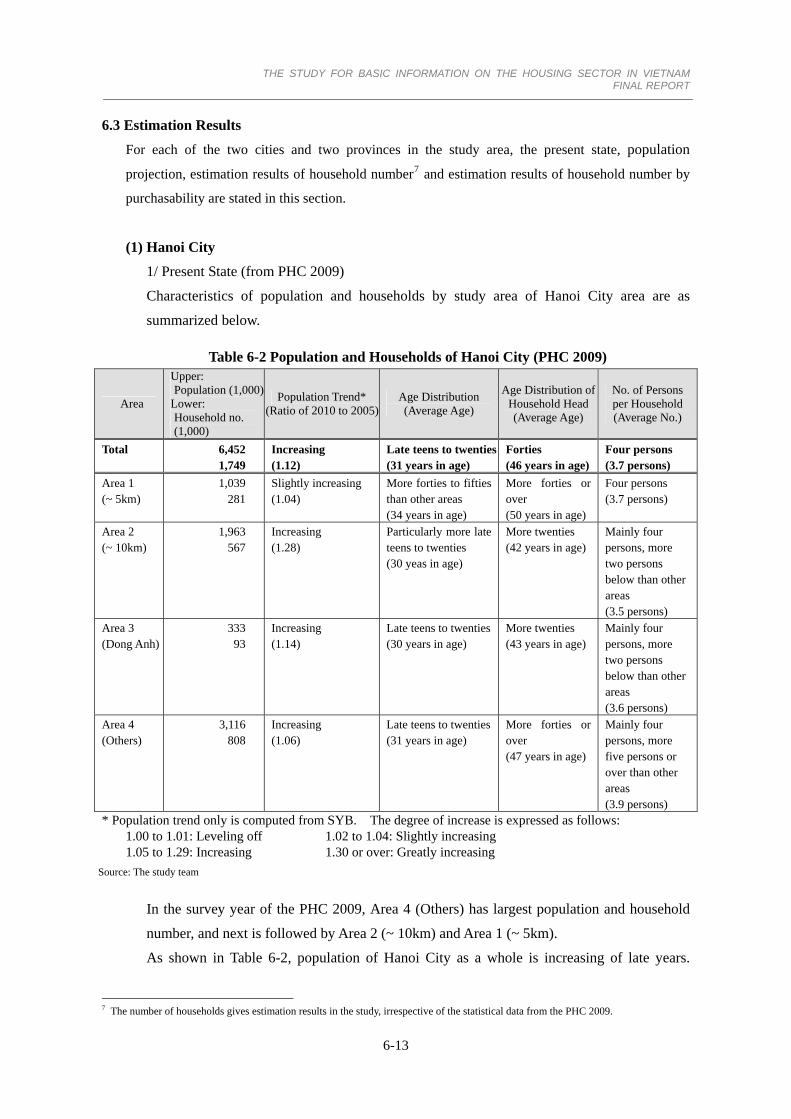
Table 6-2 Population and Households of Hanoi City (PHC 2009) ........................................................... 6-13
Table 6-3 Population Projection of Hanoi City......................................................................................... 6-15
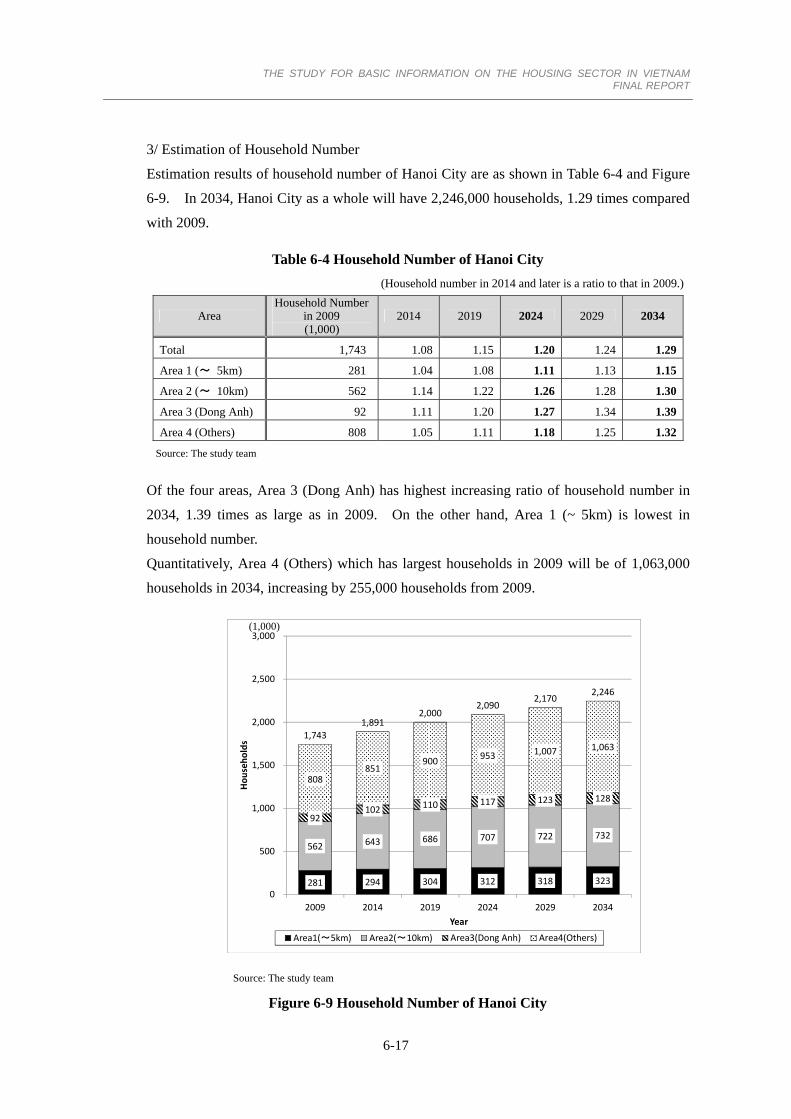
Table 6-4 Household Number of Hanoi City ............................................................................................ 6-17
Table 6-5 Household Number by Area and Purchasability of Hanoi City ................................................ 6-20
Table 6-6 Population and Households of Vinh Phuc Provice (PHC 2009) ............................................... 6-20
Table 6-7 Population Projection of Vinh Phuc Province .......................................................................... 6-21
Table 6-8 Household Number of Vinh Phuc Province.............................................................................. 6-24
Table 6-9 Household Number by Area and Purchasability of Vinh Phuc Province .................................. 6-26
Table 6-10 Population and Households of Ho Chi Minh City (PHC 2009).............................................. 6-26
Table 6-11 Population Projection of Ho Chi Minh City ........................................................................... 6-28
Table 6-12 Household Number of Ho Chi Minh City .............................................................................. 6-30
Table 6-13 Household Number by Area and Purchasability of Ho Chi Minh City................................... 6-33
Table 6-14 Population and Households of Binh Duong Provice (PHC 2009) .......................................... 6-33
Table 6-15 Population Projection of Binh Duong Province...................................................................... 6-35
Table 6-16 Household Number of Binh Duong Province......................................................................... 6-37
Table 6-17 Household Number by Area and Purchasability of Binh Duong Province ............................. 6-39
Table 6-18 Estimated Change of Housing Demands (the 5th Quintile).................................................... 6-40
Table 6-19 Estimated Change of Housing Demands (the 3rd and 4th Quintiles) ..................................... 6-41
Table 6-20 Estimated Change of Housing Demands (the 1st and 2nd Quintiles) ..................................... 6-43
Table 6-21 Quantile Range of Annual Household Incomes (LSS 2010) .................................................. 6-43
Table 7-1 Site Development Plans after the Relocation.............................................................................. 7-4
THE STUDY FOR BASIC INFORMATION ON THE HOUSING SECTOR IN VIETNAM
FINAL REPORT
ix
Abbreviations
ADB Asian Development Bank
BRT bus rapid transit
DOC Department of Construction
DONRE Department of Natural Resources and Environment
GSO General Statics Office
HIFU Ho Chi Minh City Investment Fund for Urban Development
HTF Housing Transaction Floor
JICA Japan International Cooperation Agency
LRT light rail transit
LSS Household Living Standards Survey
LURC
land use right certificate
LURRO
Land Use Right Registration Office
MARD
Ministry of Agriculture and Rural Development
MOC
Ministry of Construction
MOD Ministry of National Defense
MOF
Ministry of Finance
MOJ
Ministry of Justice
MONRE
Ministry of Natural Resources and Environment
MOT Ministry of Transport
MPI
Ministry of Planning and Investment
NT New Town
ODA
official development assistance
PHC Population and Housing Census
THE STUDY FOR BASIC INFORMATION ON THE HOUSING SECTOR IN VIETNAM
FINAL REPORT
x
PPV Population Projections for Vietnam
RETF Real Estate Transaction Floor
SYB Statistics Year Book
UN-HABITAT
United Nations Human Settlements Programme
VAA Viet Nam Architects Association
VUPDA Vietnam Urban Planning and Development Association
VUUP Viet Nam Urban Upgrading Project
THE STUDY FOR BASIC INFORMATION ON THE HOUSING SECTOR IN VIETNAM FINAL REPORT
1. BACKGROUND AND OBJECTIVES OF THE STUDY 1.1 Background of the Study
In Vietnam, as urban economies grow since the 1990s when the Doi Moi economic reform was
right on track, urban population and area are rapidly increasing and expanding. In particular,
Hanoi Metropolitan Area and Ho Chi Minh Metropolitan Area, the two largest urban areas in
Vietnam have been confronted with serious urban issues, such as chronic traffic congestion,
environmental pollution and housing shortage, because of unexpected population flow from the
surrounding rural area and urban expansion. Of these issues, the housing problem in the two
metropolitan areas reveals the fact that, in addition to general imbalance between housing
demand and supply, the supply of affordable housing is remarkably below the demand as a
result of housing development shifted toward the middle to high income brackets1.
In the 1990s, most of public and private houses were disposed or sold to people as part of the
Doi Moi reform. It is considered that these houses will have to be reconstructed by
decrepitude or alternation of resident generations in the near future. Major cities in Vietnam
will collect still more people irrespective of the present lower position in urbanization ratio
among other Asian countries2. Thus, the dwelling shortage will undoubtedly become a great
social issue in Vietnam.
In “the Strategy for Socio-economic Development Strategy for 2011 to 2020” (formulated in
January 2011), the state government of Vietnam declares that, while strengthening the housing
structure and increasing the floor area per capita, effective use of land as resources should be
realized by serving investors’ interests in the real estate market steadily developed. Then, the
Ministry of Construction (MOC) issued “the National Housing Development Strategy toward
2020, Vision of 2030” in November 2011, setting up the target of housing construction, and in
April 2012 directed the peoples’ committees of provinces and cities to prepare their own local
strategies in line with “the National Housing Development Strategy.” In fact, realization of
these strategies and targets is expected by placing great reliance on housing development in
which private enterprises including foreign ones invest.
Any of rapidly growing countries in Asia has been involved in various issues in environment
and urban management which are similar to those Japan had experienced and overwhelmed in
past. These countries hold great expectations for transfer of experience and expertise which
Japan had learned and tackled during the economic progress.
Recognizing that Japan as a bridge nation to Asia should comprehensively and strategically
develop business in the Asian region, the Government of Japan states as follows in "On the New
Growth Strategy: Blue Print for revitalizing Japan” (Cabinet Decision dated June 18, 2010). 1 The Comprehensive Urban Development Programme in Hanoi Capital City publicized by JICA in March 2007 shows that the lowest
price range of housing in Hanoi is ten times as much as the mean income of citizens as a result of the housing market research conducted in 2005.
2 According to World Bank, "Vietnam Urbanization Review: Technical Assistance Report,” 2011, p. 159, only 5% of citizens in Hanoi City have funds for purchasing housing.
1-1
THE STUDY FOR BASIC INFORMATION ON THE HOUSING SECTOR IN VIETNAM FINAL REPORT
We will develop and provide infrastructure that builds on the environmental technologies that are Japan's strengths as a package throughout the Asian region. We will work to lessen the environmental burden accompanying the economic growth of Asian countries and make use of Japanese technology and experiences as a sustainable growth engine for Asia. Specifically, government and the private sector will work together to provide assistance in building infrastructure such as high-speed rail and urban transport, water supply, and energy, and in the development of cities that are in harmony with the environment. At the same time, we will expand business opportunities for Japanese enterprises that have sophisticated civil engineering and construction technologies. Additionally, we will advance the mutual recognition of architect qualifications and support the development of the Japanese construction industry in Asia.
Under the said situation, some private enterprises in Japan started to study how to realize
environment-oriented cities in Vietnam. In effect, however, they has elicited the fact that there
are hardly found available basic information and data, such as socio-economic indices and
demand forecast of housing sector in Vietnam, which are necessary for judgment of appropriate
investment. The lack of information and data is a fatal issue also for the government of
Vietnam which urges the housing policy to satisfy the pressing demand for affordable housing
in urban area.
In addition, the central area of major cities in Vietnam has not realized redevelopment to such a
degree as expected for housing demand, and consequently remains insufficient in housing
supply. The port area in the central area of Ho Chi Minh City which is to be functionally
relocated downstream has redevelopment plans provided with residential area. Because of
incomplete institutional system for redevelopment or delay in construction of new port facilities
and access roads, however, relocation of the existing port facilities and redevelopment for new
urban usage have not progressed very far. Thus, it is another serious theme how to implement
the urban redevelopment.
1.2 Objectives and Themes of the Study
Objectives of this study are to quantitatively and qualitatively explore the nature of housing
demand and supply in central parts of Hanoi Metropolitan Area (Hanoi City and Vinh Phuc
Province) and Ho Chi Minh Metropolitan Area (Ho Chi Minh City and Binh Duong Province)
where appropriate housing is obtained neither in sufficient amounts nor at affordable prices, and
then to select and organize the explored basic information so as to be used for housing
development in both the metropolitan areas and other urban areas in Vietnam.
With the aforesaid objectives, the study comprises the following five themes:
- To grasp administrative policies of housing development applicable to Vietnam, Hanoi
Metropolitan Area and Ho Chi Minh Metropolitan Area and their implementation and
progress.
1-2
THE STUDY FOR BASIC INFORMATION ON THE HOUSING SECTOR IN VIETNAM FINAL REPORT
- To research and analyze the state of housing shortage, housing development by public and
private sectors, housing demand and preferences by income bracket and occupation, tenure
type, etc. by means of questionnaire and interview.
- To update the results attained in the Comprehensive Urban Development Programme in Hanoi
Capital City (JICA, March 2007) and supplement them as deemed necessary for future
development of housing market.
- To study a basic redevelopment plan and its implementation approach concerning housing
construction in the port area of Ho Chi Minh City, which is taken up as a model of housing
construction in the existing central area of a major city.
- To prepare a report which can be used by both Vietnam and Japan as a collection of essential
information for housing development and construction in major cities of Vietnam.
1.3 Study Area
The study area is composed of central parts of Hanoi City and Vinh Phuc Province in Hanoi
Metropolitan Area and Ho Chi Minh City and Binh Duong Province in Ho Chi Minh
Metropolitan Area, as shown in Figure 1-1. The central parts were extracted from
comparatively densely populated area. Concretely, they comprise urban districts3 of Hanoi
City and Ho Chi Minh City, Vinh Yen City and Phuc Yen City of Vinh Phuc Province, and Thu
Dau Mot City, Thaun An District and Di An District of Binh Duong Province.
Ho Chi Minh Metropolitan Hanoi Metropolitan Area
Central Part of Hanoi City
Central Part of Ho Chi Minh Ci
Binh Duong Prov.
Vinh Phuc Prov.
Ho Chi Minh C.Hanoi C.
Study Area
Source: JICA Study Team
Figure 1-1 Study Area
3 Centrally run cities and provinces of Vietnam have the administrative divisions of urban district (Quận) for urban area and district
(Huyện), district-level town (Thị xã) and provincial city (Thành phố trực thuộc tỉnh) for rural area.
1-3
THE STUDY FOR BASIC INFORMATION ON THE HOUSING SECTOR IN VIETNAM FINAL REPORT
1-4
Table 1-1 Population Composition of Study Area
(persons)
Ba Dinh District 225,910 Vinh Yen City 94,294 Distr ict 1 180,225 Thu Dau Mot City 222,845Hoan Kiem D. 147,334 Phuc Yen City 91,790 Go Vap District 522,690 Di An Distict 298,515Tay Ho D rict 130,639 Tan Binh District 421,724 Thuan An District 375,571Lon
istg Bien . 226 D ,913 Tan Phu District 398,102
Cau Giay strict 225Di ,643 Phu Nhuan District 174,535Dong Da D trict 370.117 Distr ict 3 190is ,553Hai Ba Trung D. 295.726 Distr ict 10 230,345Hoang Ma . 335i D ,509 Distr ict 11 226,854Thanh Xua D. 223n ,694 Distr ict 4 180,980Ha Dong D trict 233,136 Distr ict 5 171,452
* A rati to population of the study area to that of the whole city or province
7,162,864 1,481,55
is
4
o
0
1,935,528 4,252,492
Administrative Division Administrative Division
451,909 999,786Ho Chi Minh Cit
6,y
Ho Chi Minh Metropolitan Area
8,644,414
Binh Duong Province
Hanoi Metropolitan Area
7,451,695
anoi CitH y Vinh Phuc Province
Source: Kết quả toàn bộ Tổng điều tra Dân số và Nhà ở Việt Nam năm 2009
THE STUDY FOR BASIC INFORMATION ON THE HOUSING SECTOR IN VIETNAM FINAL REPORT
2. STUDY APPROACH 2.1 Questionnaire Survey and Interviews conducted jointly with Local Assistants
Questionnaires and interviews were conducted in order to grasp factual basis housing state and
future housing demands in Hanoi and Ho Chi Minh Metropolitan Areas which form part of the
objectives of the study. These surveys were carried out jointly with local assistants who
comprise Prof. Pham Thuy Loan of National University of Civil Engineering and Lecturer
Nguyen Thi Bich Hong of University of Economics Ho Chi Minh City. They advised the
study team on determination of the questionnaire design and survey manner so as to be adapted
to local conditions.
In addition to conventional survey manner, the study team adopted the Web research in order to
more precisely grasp intention of younger generation of Vietnam in view of the fact that the
nation’s population is mostly occupied by thirties or lower. The Web research is easy to
quickly verify answers of younger generation to a great extent1. The study team made
screening for twenties and thirties, family structure (single, pair, child raising) and income from
monitors registered in the Web research system.
2.2 Demand Forecast based on Existing Available Statistical Data or the Like
The amount of income is one of decisive factors to largely affect housing demand. Viewed
from previous experiences of the study team, however, it is very difficult to grasp precise
information on the income in Vietnam. Nevertheless, it is said that the Comprehensive Urban
Development Programme in Hanoi Capital City (JICA, implemented in 2005, issued in March
2007) figured out the comparatively correct amount of income through careful interviews.
Therefore, results of the questionnaire survey and prediction of future income primarily got in
the present study were corrected by analytically comparing the results of the aforesaid JICA
programme with the Census data in the same year.
Statistical data books published by General Statistical Office (GSO) and local statistical offices
in the study area and statistical data available through web sites were used to estimate
projection of population and household number.
The study team was advised as necessary by a specialist in Japan so as to scientifically heighten
reliability of estimation got through insufficient data.
2.3 Study on Relocation Issues and Redevelopment Approach for the Port Area on the Basis of
Interviews with the Authorities
For the relocation and redevelopment of the port area of Ho Chi Minh City, the study team
clarified issues and obstacles of the relocation on the basis of interviews with the authorities and
1 In Ho Chi Minh City, 80% of households with more than the mean annual income have personal computers and most of them lives near
the city center.
2-1
THE STUDY FOR BASIC INFORMATION ON THE HOUSING SECTOR IN VIETNAM FINAL REPORT
2-2
studied how to encourage redevelopment of the port area as a model case of housing supply.
Stage Itemized Tasks Report
IC/R: Inception Report IT/R: Interim Report DF/R: Draft Final Report F/R: Final Report
July2013
August
Sept.
Oct.
Workin
Japan
2ndFieldSurve
y
Nov.
Dec.2013
Prepa-ration
Workin
Japan
1stFieldSurve
y
Preparation of the Draft Final Report (DF/R)
Collection and organization ofinformatio
Preparation of the InceptionRe
Housing demand surve
IC/R
F/R
DF/R
Preparation of the Final Report (F/R)
IT/R
n
Preparation of the Interim Report (IT/R)
port (IC/R)
Field Survey (1)
Collectionof basichousinginformation
Survey forhousingpolicies
Survey forhousingdevelopment
Survey forhousingfinancingsystem
Survey forrelocation inthe port areaof HCMC
Setting up housing issues and subjects to be supported by Japan
Drawing issues of housing development and policies in Vietnam
Drawing issues of redevelopment in the port area of HCMC
Ascertaining matters available for Japan's experience and expertise
Studying housing development matters to be supported by Japan's ODA
Field Survey (2)
Discussion with relevant authorities and JICA offices
Supplementary survey
Analysis and arrangement of survey results
Predicting affordable housing demand and clarifying issues to be taken up
Predicting housing demand of middle to high income brackets and clarifying issues to be taken upStudying urban redevelopment of the port area in HCMC as a promotion model
y
Preparationforquestionnairesurvey
Questionnairesurvey
Interviews
Analysis ofquestionnairesurvey andinterviews
2.4 Study Procedure
Figure 2-1 shows the overall study procedure arranged by individual tasks.
Figure 2-1 Overall Study Procedure
Projectionofpopulationby area andincome
THE STUDY FOR BASIC INFORMATION ON THE HOUSING SECTOR IN VIETNAM FINAL REPORT
3. HOUSING POLICY 3.1 General View of Housing in Vietnam
As statistically found, the share of permanent houses1 increased noticeably across the nation
during a period from 1999 to 2009. For example, permanent houses in Red River Delta region
where Hanoi City is located represented the highest increase of 56.1% (from 21.3% in 1999 to
77.4 %). For living infrastructure service also, dramatic improvements were brought in access
to safe water, sanitation facilities and electricity provision. However, there has been a
somewhat widening regional disparity according to much stronger improvements in living
environment particularly in Special Cities2, such as Hanoi City and Ho Chi Minh City in which
permanent houses have been generalized with high conveniences.
Table 3.1 Housing State and Basic Service by Region
Northern Midlands
Red River DeltaNorth Central/Central Coast
Central Highlands
Southeast Mekong River
Delta
Households in dwellings made of permanent materials (%)
2009 47.6 77.4 57.5 29.9 39.7 20.4
1999 7.7 21.3 8.9 5.1 13.6 7.1
2009-1999 39.9 56.1 48.6 24.8 26.1 13.3
Households with access to safe water (%)
2009 61.5 98.3 89.7 78.5 97.1 77.9
1999 60.6 92.1 86.6 81.0 95.7 43.8
2009-1999 0.9 6.2 3.1 -2.5 1.4 34.1
Households with access to sanitation facilities (%)
2009 26.1 60.4 47.3 46.5 89.9 42.4
1999 6.2 18.8 14.7 8.6 14.1 15.4
2009-1999 19.9 41.6 32.6 37.9 75.8 27.0
Households with access to electricity (%)
2009 87.1 99.7 97.3 93.0 98.2 95.1
1999 61.4 97.9 83.5 57.0 84.8 55.2
2009-1999 25.7 1.8 13.8 36.0 13.4 39.9
Source: General Static Office (Cited from World Bank, "Vietnam Urbanization Review: Technical Assistance Report,” 2011, p.57)
1 In the Census of Population and Housing, housing construction is classified into four types. Permanent houses refer to ones with
columns and walls made of durable materials, such as concrete. For details, see Section 4.1. 2 For classification of cities, see Section 3.1.
3-1
THE STUDY FOR BASIC INFORMATION ON THE HOUSING SECTOR IN VIETNAM FINAL REPORT
Table 3-2 Housing State and Basic Service by City Class
Special Cities Class I City Class II City Class III City Class IV City
Households in dwellings made of permanent materials (%)
2009 72.7 39.1 41.2 45.1 29.9
1999 25.4 14.0 8.4 9.2 6.4
2009-1999 47.3 25.1 32.8 35.9 23.5
Households with access to safe water (%)
2009 98.8 88.8 91.0 85.3 72.8
1999 96.5 71.0 88.6 73.7 61.4
2009-1999 2.3 17.8 2.4 11.6 11.4
Households with access to sanitation facilities (%)
2009 87.9 66.2 59.3 50.7 46.3
1999 21.9 28.1 18.8 12.0 12.8
2009-1999 66.0 38.1 40.5 38.7 33.5
Households with access to electricity (%)
2009 99.7 98.8 96.8 96.0 93.4
1999 98.6 84.1 81.3 71.3 66.9
2009-1999 1.1 14.7 15.5 24.7 26.5
Source: General Static Office (Cited from World Bank, "Vietnam Urbanization Review: Technical Assistance Report,” 2011, p.57)
For Hanoi, the following four modes of housing production are reported3.
1. Formal large green field development by private or semi-private developers along major primary road networks planned by the government (New urban zone)
2. Formal plot by plot development along existing roads by individuals or small developers 3. Building individual traditional townhouses on farmland by farmers or small contractors 4. Infill of individual traditional townhouses in existing settlements
In Hanoi, the area occupied by traditional townhouses4 represents over 64% of the total built-up
area. A large area of floor space is likely to be produced every year by the vertical extension
of town houses, which are now often about 2 or 3 stories but which are often extended up to 6
or even 7 stories in areas of high demand because of increasing land prices and shortage of new
floor space. In addition, this type of vertical extension inclines to reduce the need for city
suburban expansion in adjacent agricultural areas.
3 World Bank, "Vietnam Urbanization Review: Technical Assistance Report,” 2011, pp. 119-120 4 As known from the given percentage, a townhouse is the most typical housing type in Vietnam. The townhouse almost touching a next house has independent structure by itself and, where facing the main street, is usually provided with commercial use on the ground floor (See Figure 3-1). In the questionnaire survey conducted in this study, the housing was classified into six types: townhouse (referred to as detached house (shophouse)), traditional house (constructed before 1945), villa (See the footnote of Section 3.3(3).), medium-rise (4 to 6 stories), high-rise apartment, and super-high-rise apartment (20 stories or over). For housing photos by type, see the questionnaire of Appendix 2. This classification is as adopted in the Comprehensive Urban Development Programme in Hanoi Capital City by JICA stated in the footnote of Section 1.1 and was ascertained by local specialty assistants.
3-2
THE STUDY FOR BASIC INFORMATION ON THE HOUSING SECTOR IN VIETNAM FINAL REPORT
In a report, housing in Ho Chi Minh City is broadly classified into the following categories5.
1. Temporary shelters 2. Old town houses without car access (located in informal subdivision, or former villages
absorbed by the city) 3. New townhouses located either facing main vehicular streets or in newer formal
subdivisions with vehicular streets 4. Apartments 5. Villas6 on individual lots
In Ho Chi Minh City, it can be observed that the lowest income groups are usually living in the
older part of the housing stock. The said housing is old 3- to 4-storied townhouses, typically
on 3m x 18m or 5m x 18m lots facing a 1 to 3 meter street. As with Hanoi City, the number of
units in this housing type can increase only through vertical extension or subdivision of the
existing floor space. Every year a number of these types of units disappear because of street
widening. Households whose income have increased are liable to move to larger, better
located houses, vacating the older and less desirable part of the housing stock and making it
thus available to poorer households. In Ho Chi Minh City, it is noticeably found that a large
number of migrants to the city obtain their own housing near workplaces in suburban areas.
The said sort of housing is small with insufficient infrastructure services.
By and large, Vietnamese cities have managed to enable supply of housing to meet the needs of
middle and high income groups in such large housing development as observed in advanced
countries. On the other hand, much of housing demand for low income groups has been met
in the following original ways.
1. Small contractors construct traditional townhouses where land is available within the city or in its immediate periphery.
2. Government facilitates densification through the extension of the road network to integrate former villages close to the city.
3. While the existing housing stock is incrementally upgraded and maintained by individuals (including the increase in floor area ratio by vertical extension), infrastructure and services are upgraded by the government.
In this connection, Vietnam as a lower-income and rapidly urbanizing country has very few
urban slums when compared with cities in countries which have even higher incomes, such as
India, the Philippines, Indonesia and Brazil. Some of the reasons for this outcome are
explained as follows according to another study7.
1. The tolerance of small plot sizes, thereby letting people trade-off location for floor space (in many case floor space as small as 25 m2)
2. A permissive attitude toward floor area ratio increases, which has enabled an increase in the
5 World Bank, "Vietnam Urbanization Review: Technical Assistance Report,” 2011, p.122 6 For villas, see the footnote of Section 3.3(3). 7 World Bank, "Vietnam Urbanization Review: Technical Assistance Report,” 2011, p.123
3-3
THE STUDY FOR BASIC INFORMATION ON THE HOUSING SECTOR IN VIETNAM FINAL REPORT
supply of floor space without the need for more land 3. The incorporation and densification of peri-urban villages into the urban fabric 4. Investment in primary/trunk infrastructure near these urbanizing villages (with
communists then investing in incremental improvements within the village) 5. The dynamism of the efficient and entrepreneurial low-cost, self-help and small contractor
construction sector 6. The very accepting attitude of Vietnamese people to inter-generational co-habitation in rural
and urban areas, in part derived from the history of people-friendly socialist practices
Source: The study team
Figure 3-1 Townhouses prevailing in Vietnam
3.2 Approach after the Doi Moi Reform
From the national foundation to 1986 of the Doi Moi reform shifting to the socialist-oriented
market economy, there were no in-depth, elaborated housing policies. Housing was regarded
as a necessary social good rather than a valuable commodity. Government programs in
housing were limited to building and subsidizing rental housing for state cadres and workers
with low incomes and redistribution of urban units which had been in the hands of those deeded
enemies of the state. These housing programs, however, resulted in providing only a third of
needed units for government employees 8 . The vast majority of families had to house
themselves with no government intervention or support.
Under the Doi Moi reform, as the centrally planned command economy was progressively
transformed into the socialist-oriented market economy, the role of housing changed from social
goods to commodities. In the 1990s the government abandoned the state-led housing
subsidization and, in stead, started to encourage individuals and organizations to construct
housing and establish the housing market9. Principal legislation enacted in those days is as
enumerated below:
- Housing Ordinance in 1991, which ensured people's housing ownership, encouraged all individuals and organizations to maintain and develop housing stock, and gave people's right to build, upgrade, rent and sell housing.
8 UN-HABITAT, "Vietnam Housing Sector Profile (Draft Final),” January 2, 2012, Chapter Two 9 In fact, the abandonment of state-led housing subsidization came from deterioration of existing subsidized housing and avoidance of its complete renovation rather than development of housing market. ibid. Chapter Four
3-4
THE STUDY FOR BASIC INFORMATION ON THE HOUSING SECTOR IN VIETNAM FINAL REPORT
- The Constitution of 1992, which ensured people's long tern and stable land use rights, rights to own houses and theoretic rights to reside where they want.
- Decision No.118/TTg, dated November 27, 1992, which abandoned state housing subsidization, including housing allowances on salaries of state employees.
- The Land Law of 1993, which confirmed land use rights, allowed allocation of leasehold land for housing to individuals and households, enabled people to develop housing for themselves, ensured exchange, transfer, lease and inheritance of Land Use Right Certificates (LURC) and use of LURC in mortgage collateral, and provided land with prices as stipulated by the State. Later, the Land Law of 1998 allowed LURC to be used for sub-lease and capital contributions as well.
- Decree No.61/CP, dated July 5, 1994, which allowed organizations and individuals to rent, sell, obtain LURC to invest in housing, including selling state-owned housing to existing tenants.
After entering the 2000s, the Land Law was revised in 2001 and 2003, the Housing Law, the
Investment Law, and the Enterprise Law were issued in 2005 and the Real Estate Business Law,
in 2006 respectively. These laws were enacted as principal legislation for sound establishment
of the housing market.
It seemed that policies of housing for low incomers characterized by public employees had been
disregarded as the Doi Moi reform continued its progress. In 2005, however, the Housing Law
provided requirements for social housing for low-income people. In Resolution No.18/NQ-CP
dated April 20, 2009, the government elaborated a social housing development mechanism in
which housing for workers of industrial parks, students and urban low-income people should be
advanced. Implementation of the same Resolution was detailed by Decisions Nos. 65, 66 and
67 almost concurrently formulated. These Decisions sets a target to ensure housing units for
60% of students in need of living space and 50% of industrial park workers in need by 2015.
No concrete target has been set for urban low-income housing.
In 2013, VND 30,000 billion credit package has been started to support investors or people who
want to borrow money with low interest in order to accelerate redundant supply of social
housing and ride out the recession of housing market.
As for the legislated national program, Socio-economy Development Strategy for 2011 to 2020
was approved by the 11th Congress of Vietnam Communist Party in January 2011. For the
field of housing, the Strategy states as follows:
Have policies to strongly develop housing for people, especially for policies targeted people and those with low income. (Partly omitted) Well implement programs on housing support to the poor and policy targeted people, housing for inhabitants in storm and flood areas; to reasonably arrange inhabitants to ensure the security in areas hit by flood, areas with collapsed mountains, riverside and coastline.
Following the Socio-economy Development Strategy for 2011 to 2020, the National Housing
Development Strategies until 2020 and with a vision toward 2030 was launched in 2011 as
3-5
THE STUDY FOR BASIC INFORMATION ON THE HOUSING SECTOR IN VIETNAM FINAL REPORT
pointed out below10:
- To develop a stable, open and transparent housing market to make the availability and affordability of housing for all people.
- To prioritize the development of rental housing both commercial and public rental housing; changing perceptions of people in renting house other than own the house.
- To implement social housing program for the poor and low-income people. - To Increase the housing area per capita to 29 m2/person in urban areas by 2020.
The targets set up in the National Housing Development Strategies until 2020 and with a vision
toward 2030 are summarized in Table 3-3.
Table 3-3 Targets given in the National Housing Development Strategies until 2020 and
with a vision toward 2030
Items 2015 2020
Housing area per capita Approx. 22 m2/person Approx. 25 m2/person In urban areas 26 m2/person 29 m2/person In rural areas 19 m2/person 22 m2/person
Minimum housing area 6 m2/person 8 m2/person Minimum area of social housing for low-income people in urban areas (mainly apartment houses)
10,000,000 m2 12,500,000 m2
Accommodations for college students, university students, apprenticeship school and vocational training school students
Approx. 60% of students in need
Approx. 80% of students in need
Accommodations for workers in industrial area
Approx. 50% of workers in need
Approx. 70% of workers in need
Housing improvement in rural areas
Approx. 400 thousand households
Approx. 500 thousand households
Rate of permanent houses Approx. 62% Approx. 70% In urban areas 65% 75% In rural areas 60% 65%
Rate of impermanent houses Below 5% Totally cleared Rate of houses with appropriate sanitation facilities
70% 90%
In urban areas 95% 100% In rural areas 50% 80%
Rate of apartment housing in housing development projects in Hanoi and Ho Chi Minh Cities*
80% or over 90% or over
Rate of apartment housing in housing development projects in Grade I and Grade II cities11
50% or over 60% or over
10 The Housing Law (Article 135) and Decree No.71/2010/ND-CP (Article 73) stipulate that the government shall release national
housing development orientation as foundation for further detail policies satisfying demand of housing improvement on the basis of the Socio-economic Development Program.
11 All cities (strictly urban centers) in Vietnam are classified into Special Grade, Grades I through V according their size and function, as provided by Decree No.42/2009/ND-CP on the Grading of Urban Centers, issued on May 7, 2009. Special Grade cities include centrally run cities with urban districts, rural districts and satellite urban centers, Grades I and II cities are centrally run cities with urban
3-6
THE STUDY FOR BASIC INFORMATION ON THE HOUSING SECTOR IN VIETNAM FINAL REPORT
Rate of apartment housing in housing development projects in Grade III cities
30% or over 40% or over
Rate of rental housing in total housing in Grade III or higher cities
20% or over 30% or over
By 2030, try to achieve the national average housing area per capita with approximately 30 m2/person and the minimum housing area with at least 12 m2/person.
* Also in the Housing Law (Article 24), rate of apartment housing in housing development projects is specified as 60% or over for Special Grade cities (including Hanoi and Ho Chi Minh Cities), 40% or over for Grades I and II cities, and 20% or over for Grade III cities, all of which are somewhat lower than those given in the National Housing Development Strategies until 2020 and with a vision toward 2030.
3.3 Outline of the Housing Law
(1) General
The Housing Law which was issued on November 29, 2005 and enforced on July 1, 2006
mortgage, management, state governance, conflict settlement, etc. of housing and houses as
a whole.
After abandonment of the state-led housing subsidization policy, housing policies had been
comprehensively elaborated and formulated by the Housing Law at last. Article 23 of the
Housing Law states objectives of housing development as itemized below:
Article 23 Objectives of housing development 1. Housing development is investment in new construction, rebuilding or improvement
in order to increase living area. 2. Housing development shall ensure living place suitable with the ability of different
income earners and the socio-economic conditions of the country or of each locality and step by step improve living conditions for all, promote formation and development of real estate market, and contribute to development of urban and rural areas which become civilized and modernized in consistency with identity of the national culture.
3. Housing development shall reflect the policy of abolishment of subsidies and socialization of housing on the basis of a regime of the State create conditions in terms of long-term credits at an appropriate rate of interest, identify responsibilities of people who have needs for creating a house, of People's Committees at all levels, and of communities of residents to look after and improve housing.
To detail and implement the Housing Law, Decree No.71/2010/ND-CP was issued on June
23, 2010 in stead of Decree No.90/2006/ND-CP formulated right after enforcement of the
Housing Law.
districts and rural districts and possibly attached urban centers, and provincial cities with wards and communes.
3-7
THE STUDY FOR BASIC INFORMATION ON THE HOUSING SECTOR IN VIETNAM FINAL REPORT
(2) 4 Types of Housing
The housing is classified into the following four types depending on purposes (Article 33 of
the Housing Law, Article 3 of Decree No.71/2010/ND-CP):
- Commercial housing: Housing built by organizers or individuals of any economic sector for sale or lease to meet the market demand and under the market mechanism
- Individual housing: Housing built by households or individuals - Social housing: Housing built by public sector, organizations or individuals for
subject specified in Articles 53 and 54 of the Housing Law for rent, purchase or lease-purchase12
- Official housing: Housing built by the government for lease for assignment or rotation state employees defined in Article 60 of the Housing Law
The Housing Law provides requirements for investors, residents, finance, design standards,
etc. for each of these four types of housing.
(3) Commercial Housing
Investors in commercial housing development comprise the following (Article 12 of Decree
No.71/2010/ND-CP):
1. Domestic enterprises established and operating under the Enterprise Law 2. Wholly foreign-owned enterprises, joint-venture enterprises, and enterprises of
overseas Vietnamese conducting investment activities in Vietnam under the Investment Law.
3. Cooperatives established and operating under the Cooperative Law
In addition, to be registered as an investor in commercial housing development, the amount
of equity capital for project implementation is required to account for at least 15% of the
project's total investment for development area of less than 20 ha and at least 20% of the
total investment for development area of 20 ha or over (ibid.).
Capital sources for development of commercial housing are limited to the following (Article
38 of the Housing Law):
1. Capital of investors 2. Capital contributed by a joint venture or business co-operation with other
organizations and individuals 3. Loans provided by credit institutions 4. Payment made in advance by parties which have the need for purchase or lease of
housing 5. Capital raised from other sources in accordance with relevant law
An investor can raise capital by payment made in advance by people who wishes to
12 Lease-purchase (also translated into rent-buy or installment purchase) of social housing means advance payment of a certain sum of
money by the lessee-purchaser of that housing as agreed upon in the contract, who will pay the remaining amount as a rental on a monthly or periodical basis. Upon the expiration of the lease-purchase term, the lessee-purchaser who has fully paid the rental will be granted a house ownership certified by a competent agency (Article 3 of Decree No.71/2010/ND-CP).
3-8
THE STUDY FOR BASIC INFORMATION ON THE HOUSING SECTOR IN VIETNAM FINAL REPORT
purchase or lease housing, only in the case where design of that housing has been approved
by a competent authority and construction of the foundation has been completed. The total
amount of capital by advance payment cannot exceed 70% of the total contract value of
housing (Article 39 of the Housing Law).
For size of commercial housing, each of housing unit of an apartment has to have a
minimum floor area of 45 m2 and that of side-by-side housing, 50 m2 with frontage of 5 m
or over in width. Villas13 cannot have more than three storey not exceeding 50% in
building cover ratio (Article 40 of the Housing Law).
(4) Social Housing
The Housing Law and Decree 71/2010/ND-CP detailing and guiding the implementation of
the housing law have promulgated institutional requirements for social housing. Probably
to encourage or ensure provision of social housing, however, Decree No.188/2013/ND-CP
on construction and management of social housing has been issued on November 20, 2013
(to be enforced on January 10, 2014). Consequently Articles 31 through 40 and other
articles related to construction of social housing of the Decree 71/2010/ND-CP have been
deleted. According to the Decree No.188/2013/ND-CP (hereinafter called Decree No.188),
the provision of social housing is outlined as follows:
The development of social housing is classified into the following three types (Article 4 of
Decree No.188).
1. Social housing constructed by the state with state or local budget; apartments of commercial housing purchased as social housing by the state; apartments of commercial housing transferred as social housing from private sector construction under BT contracts
2. Social housing invested or constructed for purchase or lease by various economic sectors. This type can be granted subsidies or preferences by the state.
3. Social housing invested or constructed for purchase or lease by households or individuals. This type can be granted subsidies or preferences by the state.
Persons entitled to purchase, lease, or lease-purchase social housing are provided as follows
(Article 14 of Decree No.188):
1. Revolution hero legally authorized 2. Civil servants, public employees or cadres of administrative organizations and the
communist party, salaried by the state budget 3. Professional army men/women or the like in people’s armed forces, salaried by the
state budget 4. Workers in industrial parks, economic zones, export processing zones, high-tech
13 An urban villa means a detached house (or a building originally built as a house but currently used for another purpose) with its own
yard garden, fence, and entrance, no more than 3 main floors and at least three sides looking to the yard or garden, built on an area not exceeding in building cover ratio, and located in a functional zone in the urban master plan approved by a competent authority (Article 3 of Decree No.71/2010/ND-CP).
3-9
THE STUDY FOR BASIC INFORMATION ON THE HOUSING SECTOR IN VIETNAM FINAL REPORT
zones, industrial factories or handicrafts facilities 5. Low-income earners (persons not required to pay income tax) or members of poor
households (persons classified as poor according to the Prime Minister’s regulations) in urban areas
6. Persons under social custody (certified by the People’s Committee of living place) or lonely or homeless elderly persons
7. Persons who have returned official-duty houses 8. Students of public and non-public universities, colleges, vocational schools, trade
schools, and vocational institutions for workers professional secondary schools, vocational colleges and vocational intermediate schools entitled to lease houses during their study period
9. Households or individuals who are beneficiaries of resettlement policies, but could not be resettled (certified by a provincial level People’s Committee)
Persons entitled to purchase, lease, or lease-purchase social housing invested by the state
budget have to meet the legal requirements for management of state-owned housing. On
the other hand, persons to purchase, lease or lease-purchase social housing invested with
non-state capital have to satisfy the following requirements (Article 14 of Decree No.188):
1. Having no house under their ownership, having a house under his/her ownership with an average floor area of less than 8 m2/person, or having an old, degraded house without any support from the state in the form of land or housing
2. As a purchaser, having a permanent or temporary house with at least one year's social insurance in a province where a social housing development project is carried out
3. As a lease-purchaser, paying the first installment of 20% of the house value and the residual amount under the contract
Where formulating and approving master plans on land use, urban centers, industrial parks,
etc., provincial level People's Committees have to determine and allocate land areas to build
social housing. In developing commercial housing in Grade III or higher cities, the
investor is required to allocate 20% of the total land area or the total floor area approved by
competent authorities to social housing construction area irrespective of the amount of the
total land area and to directly make investments in social housing on the said land or floor.
However, where 20% of the total land area is withdrawn by the state to construct social
housing from the government budget and the investor does not with to invest in social
housing, the said land has to be transferred to the People’s Committee of the province where
the project is located. If the project of commercial housing uses less than 10ha of land, the
investor instead of putting aside 20% of the whole land for social housing may transfer a number
of housing units, the value of which is equivalent to the value of 20% of the land according to
the land price imposed by a provincial level People's Committee, to the state as social housing,
or pay the amount of money equivalent to the value of 20% of the land according to the said land
price in order to build up the local social housing fund (Article 6 of Decree No.188).
3-10
THE STUDY FOR BASIC INFORMATION ON THE HOUSING SECTOR IN VIETNAM FINAL REPORT
Investors in social housing development are granted the following incentives (Article 12 of
Decree No.188).
1. Exemption from land use levy and land rent for area of approved social housing development projects
2. Preferential value-added tax rate under the Law on Value-added Tax 3. Exemption from or reduction of enterprise income tax under the Law on Enterprise
Income Tax 4. Loan interest support in specified credit loans 5. Whole state financial support for constructing technical infrastructure beyond the
plot for social housing, and whole or partial local government financial support for compensation, land clearance, technical infrastructure and social infrastructure within that plot
6. Non-appraisal provision of model designs of social housing prepared by competent authorities
7. For social housing for lease of industrial park workers with rent, without rent or with house rent not exceeding the rent rate of social housing prescribed by provincial level People’s Committees, construction cost or rent is calculated as reasonable expenses in production costs upon calculating enterprise income taxes.
8. Permission of borrowing investment resources by using planned social housing as collateral
9. Permission of issuing a corporate bond guaranteed by the state government
Where social housing is developed with non-state capital, investors are granted whole
financial support for infrastructure construction by a provincial level People’s Committee
and allowed to sell social housing if more than 5 years pass after commencement of lease.
For design standards of apartment buildings as social housing with non-state budget
resources in urban areas, the floor area of each housing unit is 30 to 70 m2 without
restriction on the number of stories. Investors may increase building coverage ratio and
floor area ratio by 1.5 times as large as that prescribed in applicable regulations so far as
plans are approved by competent authorities. The floor area of each unit of a low-rise
terraced house must not exceed 70m2 (Article 7 of Decree No.188).
While Article 6 of Degree No.188 requires to secure social housing for workers in industrial
parks, export processing zones, economic zones, etc. whether existing or planned, Decree
No.164/2013/ND-CP issued on November 12, 2013, enforced on January 1, 2014
concerning industrial parks, export processing zones and economic zones provides that
investors which newly construct an industrial park or provincial level People’s Committees
shall keep or allocate land of housing for workers.
As introduced on the basis of the Decree No.188/2013/ND-CP, requirements for
construction of social housing have been strengthened for realization of late. After
sufficiently understanding contents of the Decree No.188/2013/ND-CP, it is deemed
necessary to watch actual application of that degree from now on.
3-11
THE STUDY FOR BASIC INFORMATION ON THE HOUSING SECTOR IN VIETNAM FINAL REPORT
By and large, the social housing conceived in the Housing Law differs from subsidized
housing before the Doi Moi reform in the following regards.
1. Apart from the state budget, there are capitals mobilized from other sources. 2. Instead of equal distribution, social housing is provided to persons in need. 3. Social housing is not only rented, but also sold. 4. Rents or selling prices are needed to redeem investment capital and expenditure for
management, maintenance and repair. 5. The government exempts investors from land use levy and land rent and reduces
relevant taxes in order to make investment cost less.
In the Housing Law, social housing has the following differences from commercial housing.
1. Persons who want to use social housing are certified with regard to eligibility and their use is allowed subject to relevant authorities’ approval. Commercial housing has no such restrictions.
2. The total area of social housing is 30 to 70 m2, while that of commercial housing has no limitation on size.
3. Rents or selling prices of social housing are controlled by the authorities, but those of commercial housing are decided by a contract between an investor and a user.
4. Investors in social housing development get profit in conformity with the regulations, but profit from commercial housing development is not limited in amount.
3.4 Other Principal Laws
(1) The Land Law
The Constitution of Vietnam states:
Article 17 The land falls under the ownership of the entire people.
Article 18 The state assumes the unified administration of land according to overall planning and in conformity with the law and allocates land to organizations and individuals for stable long-term use. Organizations and individuals who use the land are duty-bound to ensure its protection, replenishment, rational exploitation and economical utilization.
The Land Law revised in 2003 is a fundamental law concerning state management of land.
The law regulates land use rights, recovery, allocation, lease, transfer, compensation,
inheritance and mortgage of land, rights and obligations of land users, land pricing,
formulation of land use plans, land disputes, etc., all of which are deeply related to housing
development. The Land Law was firstly enacted in 1987 and, after amendment of the
Constitution in 1992 following the Doi Moi reform, revised in 1993, 1998, 2001 and 2003.
Articles 4, 10, 48, 49, 52, 123, etc. of the Land Law were modified by Law
No.38/2009/QH/12 amending and supplement a number of articles of the laws concerning
3-12
THE STUDY FOR BASIC INFORMATION ON THE HOUSING SECTOR IN VIETNAM FINAL REPORT
capital construction investment. The Land Law further revised has been issued in
November 2013 to take effect in July 2014.
(2) The Construction Law
The Construction Law issued on the same day as the Land Law stipulates fundamental
requirements for construction master planning for regional, urban and rural areas and
construction activities. The Construction Law has close relation to housing development
with respect to design, construction permission, contractor selection, resettlement, etc.
Articles 19 through 27 concerning urban planning were deleted by enactment of the Law on
Urban Planning in 2009. Articles 7, 40, 43, 54, 55, 59, etc. of the Construction Law were
modified by Law No.38/2009/QH/12 amending and supplement a number of articles of the
laws concerning capital construction investment.
(3) The Law on Urban Planning
The Law on Urban Planning enacted in 2009 prescribes hierarchy of urban planning,
appraisal and approval of urban plans, urban management, etc. to regulate urban
development which had been wholly dealt with by the Construction Law. Even in
constructing an individual building including a house, the Law on Urban Planning requires
its spatial plan and functions to coincide with the planning framework and detailed plans
previously formulated by the authorities.
In this connection, the Capital Law which reconfirms roles of the capital of Vietnam and
provides basic construction requirements has been enforced since July 1, 2013. It is noted
that this law regulates land use so as to curb the influx of people from rural areas to Hanoi.
(4) The Investment Law, the Enterprise Law
Where urban development or construction activities are carried out as an investment project
in Vietnam, an investor, whether domestic or foreign has to work on the project subject to
investment certification required by the Investment Law. The Investment Law enacted in
2005 prescribes forms of investment, kind of investment business, procedures, rights and
obligations of investors, etc. in carrying out investment activities by the use of capital in the
form of tangible or intangible assets. The Enterprise Law concurrently enacted provides
basic requirements for types, registration, establishment, operation, etc. of enterprises. The
Enterprise Law is applied also to foreign investors carrying out investment activities in
Vietnam. Law No.38/2009/QH/12 amending and supplement a number of articles of the
laws concerning capital construction investment revised Article 170 of the Enterprise Law.
(5) The Real Estate Business Law
3-13
THE STUDY FOR BASIC INFORMATION ON THE HOUSING SECTOR IN VIETNAM FINAL REPORT
The Real Estate Business Law enacted in 2006 regulates real estate business activities,
particularly scope of housing development business, rights and obligations of organizations
and individuals working in real estate transactions, and so on.
(6) Building Code on Regional and Urban Planning and Rural Residential Planning
This building code enacted in 2008 is national technical standards relating to space plans,
land preparation, drainage, water supply, sewerage, waste disposal, power supply, etc. for
facilities to be constructed in urban areas and rural areas. Construction plan for buildings
including housing is permitted subject to satisfaction to the requirements of the building
code. For example, the building code provides that the minimum area of residential
unit-based land is 8 m2/person and that the average occupancy of residential unit-based land
for the whole city cannot exceed 50 m2/person (Clause 2.4.2 of the Building Code).
3.5 Land and Housing
(1) Land Use
In Vietnam, land is the property of the entire people and its use is subject to the exclusive
administration by the state (Articles 17 and 18 of the Constitution, Article 5 of Land Law).
Prior to the Doi Moi reforms in 1986 by which a socialist command economy was
transformed to a socialist market economy, private property rights were not formally
recognized by the government and there was no market for urban land. In this earlier
period of Vietnam’s urban development it self had been slow.
The first Land Law of Vietnam was enacted by the National Assembly in 1988, a revised
Land Law was promulgated in 1993, replaced by the 1998 Land Law and, most recently,
2003 Land Law. These stages of significant reforms have improved property rights. The
concepts of land rights and the trading and pricing of land and of its registration, planning
and taxation were formulated in the reform process.
The rights and obligations of both land users and state agencies were laid out, and after the
2003 Land Law land has been considered as a commodity which can be openly traded.
The concept of land rights was concretized by the system of issuing LURCs (land use rights
certificates)14, which became the foundation of formal market exchange as well as the
means to tax and mortgage land and property holdings.
(2) State Institutions regulating Land
The Vietnamese government has constructed quite a large and bureaucratic structure for the
14 In Decree No.88/2009/ND-CP issued in October 2009, it was provided that LURC (Red Book) shall be unified into house certificate (Pink Book) which identifies ownership of the physical structure subject to the possession of LURC. The unified certificate called Land Use Right, House and Assets attached to Land Ownership Certificate is issued on responsibility of Department of Natural Resources and Environment (DONRE). Previously DONRE issued Red Book, while Pink Book was issued by Department of Construction (DOC).
3-14
THE STUDY FOR BASIC INFORMATION ON THE HOUSING SECTOR IN VIETNAM FINAL REPORT
planning, management and administration of urban land. Land and planning issues are
complicatedly treated by a number of ministries and bodies, including those responsible for
natural resources, the administration of justice, construction, agriculture, finance and local
government (See Table 3-4).
The Ministry of Natural Resources and Environment (MONRE) is the apex institution
regarding land which develops land policies and is also the main regulator of land
management bodies. In particular, MoNRE performs the following duties which are
implemented through its local level branches of districts and provinces.
- Drafting and guiding land use strategies, planning regulations, policies and regulations
on land management and land use and land surveying/registration
- Evaluating land use plans prepared by Ministries and Agencies of the government or
People’s Committees before submitting them to the government for approval; and
reporting to the government the land allocation, land lease and land appropriation within
the control of the government
- Drafting and submitting the decree to be approved by the government; promulgating
decisions, circulars or instructions for supplying the contents of guidance; inspecting
land use and managing the branches, regions, organization and citizens
- Investigating, surveying, measuring, estimating and classifying lands; establishing land
administration maps and records and land registry; issuing land use right certificates,
land leasing and land appropriation
Table 3-4 Central Level Institutions involved in Land Management
Institution Functions
Ministry of Natural Resources and Environment, MONRE
- Nation-wide land use planning - Land legislation - Land valuation - Land disputes - Environmental protection
Ministry of Construction, MOC - Nation-wide urban planning - Urban land use planning - Housing construction - Housing disputes - Real Estate Law development
State Bank - Regulates bank interest rates - Determines lending and debt security
policies for banks Ministry of Planning and Investment, MPI
- Approval of plans for capital investment
- Preparation of industrial parks - Economic planning
Ministry of Agriculture and Rural - Management of Agricultural and
3-15
THE STUDY FOR BASIC INFORMATION ON THE HOUSING SECTOR IN VIETNAM FINAL REPORT
Development, MARD unused land Ministry of Finance, MOF - Land taxation and fee collection
- Managing State land - Financing State land management
Ministry of Justice、MOJ - Dispute resolution - Land legislation - Drafting real estate industry decrees
Source: The study team
The Ministry of Construction (MOC) is another important central level agency in regard to
land. MOC is responsible for physical planning, housing and real estate markets, public
works, and construction management. In particular, MOC undertakes the following
functions which relate to land for housing:
- Drafting and proposing long-term plans and implementation measures for construction, housing, public works, construction materials; master plans for larger urban areas
- Evaluating and approving master plans and construction designs - Overseeing urban public works (including roads, water supply, drainage, lighting, etc.) - Licensing construction activities on all lands - Supervising land uses based on the Housing Law
Although the central government has a supervisory or guiding role in urban land matters, it
is the people’s committees at the local levels that are the ultimately responsible executing
agencies and each tier has roles and responsibilities for the management of urban land
within its jurisdiction. This is part of the decentralization policies of the government from
the 1990s onward.
(3) Land Use Control
Urban Planning in Vietnam has an extensive legal and regulatory framework mostly on the
responsibility of the MOC and its local departments (Department of Construction, DOC).
Adjusted Orientation of Master Plan for Development of Vietnam Urban System toward
2025, Vision of 2050 formulated in 2009 gives national guidelines with respect to
population targets of cities, limit growth of Hanoi and Ho Chi Minh Cities including
migration from peri-urban areas. According to these national guidelines, provinces and
cities establish master plans for horizons of 5 to 10 years. City master plans are prepared
on the basis of local ones by DOCs, which define the guidelines for urban development,
infrastructure and living environment. They are mapped on a 1/10,000 to 1/25,000 scale
depending on the classification of cities.
Furthermore, zoning plans are formulated on a 1/5,000 or 1/2,000 scale and detailed plans
are drawn out on a 1/500 scale and provide the basis for all constructions including
housing, public buildings, parks, infrastructure and other provisions or facilities. Approved
3-16
THE STUDY FOR BASIC INFORMATION ON THE HOUSING SECTOR IN VIETNAM FINAL REPORT
detailed plans are the basis for setting up investment projects, choosing and approving
construction locations, issuing planning certificates, deciding on land allocation, and issuing
construction permits. Planning certificates stipulated what developers have to follow when
preparing an investment or construction project. Construction permits are issued mainly
for individual building construction.
On the other hand, there are land use plans at the provincial level comprising both urban and
rural areas. These are prepared by the relevant DONRE (Department of National
Resources and Environment), local level authorities of MONRE and forwarded to the
Provincial Peoples Committee for review and acceptance, are further reviewed at ministerial
level (MONRE), and finally returned to the local level for final approval before adoption.
DONRE also prepare annual land use plans to be approved by the Provincial Peoples
Committees, in order to set survey fees for plot mapping, verify land-use rights, etc.
DONREs are also responsible for operating “one-stop” mechanisms for land allocation, land
leasing, issuance of LURCs, and land mortgages. At both the district and ward/commune
levels MONRE supervises cadastral offices which report to the people’s committees at these
levels. Cadastral officials assist households in land transactions and in obtaining LURCs.
The people’s committees and cadastral officials monitor land areas, land categories, and land
transactions. Each year the people’s committees of wards/communes have to submit a
local land use plan based on land use demand to the relevant DONRE.
As described above, there is a dualism of responsibilities between the MOC and MONRE,
with the former responsible for spatial plans and construction permitting, whereas the latter
is responsible for land use control and the functioning of land titling and mapping.
Although there is technical linking at each level and through the people’s committees, such
an arrangement requires considerable coordination in act.
(4) Process from Housing Planning to Construction Permission
When an investor intends to construct housing in a plot, he has to institutionally follow the
process from planning to construction permission as shown in Figure 3-2.
Where the statutory detailed plan covering the plot in question has been drawn up and
approved by the people’s committee, the authorities issue a planning certificate to the
investor together with the planning conditions contained in the existing detailed plan. The
investor modifies the detailed plan as necessary and submits it to the authorities together
with the housing investment plan for approval. After approved, the investor makes
implementation design to receive a construction permit from the authorities.
Where the statutory detailed plan has not been prepared by the authorities yet, the investor is
required to get approval of the investment plan and receive the planning certificate. Then
he has to draw out the detailed plan and, after it has been approved by the authorities, make
3-17
THE STUDY FOR BASIC INFORMATION ON THE HOUSING SECTOR IN VIETNAM FINAL REPORT
implementation design to receive a construction permit.
In either case of the above, where no zoning plan covering the project site or plot has been
authorized, the investor has to prepare it as with detailed plan.
It should be noted that the detailed plan is prepared and modified on behalf of the authorities
before being authorized by them. The aforesaid process does not include functions of
DONRE with regard to land use. In addition, it should be taken into account that the
timing of investment approval will vary depending on whether the land use right is available
or to what degree the investment plan is matured.
(1) Where the detailed plan has been formulated
(2) Where no detailed plan has been formulated
Preparation and approval of detailed plan
Implementation design
Issuance of planning certificate
Approval of investment plan
Approval of investment plan
Implementation design
Modification and approval of detailed plan
Issuance of planning certificate
Construction permission Construction permission
Source: The study team
Figure 3-2 Process from Housing Planning to Construction Permission
(5) Obtaining Land Use Right Certificate (LURC)
A land use right certificate (LURC) is the form of registration of usage of land of all types in
both rural and urban areas. The period of land use is divided into two types, permanent
and fixed term. The permanent type is for residential land, public infrastructure works,
public administrative offices, national defence and security. The fixed-term type is for
leased land for agriculture, plantations, fisheries, manufacturing, and diplomatic offices.
The fixed term varies, but cannot exceed 99 years.
In fact, a LURC is obtained by the following steps.
1. Transaction holders (normally the seller) submit a transaction profile to the Land Right Registration Office (LURRO) of the district where the land in question is located.
2. LURRO checks and dispatches cadastral data to the Tax Office to determine tax amount and registration fee.
3. After receiving information from the Tax Office, LURRO informs the transaction
3-18
THE STUDY FOR BASIC INFORMATION ON THE HOUSING SECTOR IN VIETNAM FINAL REPORT
holders to pay tax15 and fee. 4. After paying the tax and fee, transaction holders submit payment receipt to LURRO. 5. The buyer receives the new LURC.
Land transfer and its documentation are implemented at district Land Right Registration
Offices (LURRO). Provided transfer taxes and fees are paid, transfer approval for urban
residential land transfers is routinely given. Since commercial land use is treated as a
special means of production, transfer approval is based on state planning objectives.
Official discretion is evidently frequently exercised. Unauthorized land transfers,
including subleasing, are punished by administrative sanctions.
(6) Housing-related Taxes and their Use
Land evaluation and pricing are established and announced by the people’s committees of
cities or provinces on January 1 of each year, subject to approval of the people’s councils.
The valuation and pricing framework is the base for tax imposed on land use, transfer of
land use, change of land use purpose, land leases and other fees such as registration and land
compensation. Land values are assessed annually and are supposed to reflect market
values. In practice, however, assessed land prices are always lower than prices transacted
in the real market.
For investors or potential housing beneficiaries, this sort of two-price system results in
confusion and conflicts over land and insufficient supply of land for general housing. The
land price determination process is taken more uncertain.
There are the following taxes and fees which are connected to the land valuation system.
Land use tax (housing): This annual tax is normally very low. The taxation is calculated
from 3 to 32 times higher than the tax imposed on the first class agricultural land in the
city/province. A detailed calculation for tax for amount on one m2 of highest price land
is about VND 40,000 per year..
Capital gains tax (assessed as part of personal income tax): If the value of real estate
transaction (price indicated in the contract) is lower than price in land pricing framework
issued by the city/province people committee, capital gains will be calculated on price
issued by the people committee. In case of higher price, it will be calculated according to
contract price. The tax is normally 25% of the generated profit. If the original price and
other related costs cannot be identified, a tax rate of 2% will be imposed on the total value
of the transaction.
Tax for non-agricultural use: This tax was introduced by the Law of Tax for Non-agricultural
Land Use issued in July 2010 in order to restrain speculative purpose of land.
15 Since 2009, households and individuals making land use right (LUR) transfer pay personal income tax according to the Law of
Personal Income Tax. Normally the seller pays personal income tax and buyer pays registration fee.
3-19
THE STUDY FOR BASIC INFORMATION ON THE HOUSING SECTOR IN VIETNAM FINAL REPORT
In addition to above taxes, the land use right holders for housing have to pay a registration
fee when registering ownership of a home or applying for land use right certification. The
fee is calculated at 0.5% of the total value of the asset (land and house).
Most of the aforesaid housing-related taxes and fees are resources of investment for local
infrastructure services. Although urban residential infrastructure services are the
responsibility of local authorities and associated state-owned enterprises, investments are
financed to a large degree through central government allocations, revenue appointment, or
transfers. The State Budget Law of 2002 provided a certain amount of fiscal
decentralization, distinguishing the following three types of revenue.
1. Taxes assigned 100% at the central level 2. Taxes assigned 100% at the provincial level 3. Taxes shared between central and provincial levels
Those assigned 100% to the local level include land and housing taxes, license taxes, taxes
on transfer of land use rights, fees on land use, land rent, revenues from the leasing and sale
of publicly owned dwellings, and registration fees and other fees and charges. However,
local and shared revenues are insufficient for the investment programs of local authorities.
They are at least somewhat "buoyant" since the administrative land values upon which these
taxes are based are increased periodically to follow market prices. To the extent that land
values rise in a particular area due to infrastructure investments, revenues to local authorities
increase. But the link to financing infrastructure through the increasing revenues is very
weak.
3.6 Housing Finance16
(1) General
As previously state, the basic housing policy before the Doi Moi reform was that, as a rule,
necessary housing should be provided as social goods by the state. Therefore, it is
considered that state-led financial mechanism for people in need of housing was not
elaborated in depth. In 1988 after the socio-economic reform, four Sate-owned
Commercial Banks were separated from the State Bank of Vietnam and, as the market
economy grows, banking system in Vietnam has been diversified to encourage economic
development. As for housing finance, capital gains for housing development funds from
selling state-owned housing to existing tenants prescribed by Decree No.61/CP led to
establishment of housing funds in Hanoi and Ho Chi Minh Cities. The Housing Law
enacted in 2005 states that governmental housing development fund shall be applied to
16 Description of housing finance in this report is largely owed to Chapter Seven of UN-HABITAT, "Vietnam Housing Sector Profile
(Draft Final),” January 2, 2012, except for latest policies. In this connection, the said UN-HABITAT study has considerable implications in preparation of the National Housing Development Strategies until 2020 and with a vision toward 2030 issued in 2011. http://vir.com.vn/news/en/property/strategy-seeks-to-address-housing-issues.html
3-20
THE STUDY FOR BASIC INFORMATION ON THE HOUSING SECTOR IN VIETNAM FINAL REPORT
social housing (Article 52), and Decree No.71/2010/ND-CP provides that this sort of
governmental funds from specified sources have to be established by provincial level
People’s Committee’s decision (Article 75).
Policies for housing finance have been comprehensively shown by Decision
No.105/2007/QD-TTg dated 13/07/2007 approving National Housing Finance Policy
Orientations up to 2020 so as to efficiently operate and manage the housing finance system
in market mechanism. The following solutions are concretely proposed:
- To develop mechanism to raise medium- and long-term capital for the housing sector - To enhance the institutional capacity of mortgage loan providing financial institutions - To support or encourage organizations and individuals to participate in developing the
housing finance system - To support or encourage investment in construction projects for social housing - To improve a legal framework for housing finance
It should be noted that this Decision is clearly distinct from previous housing policies in that
people in need of general housing as well as social housing are taken into account.
(2) Use of Housing Finance
The structure of finance system in Vietnam and the situation of housing finance within it
have certain tiers comprising: the State Bank of Vietnam at the summit, which sets the
policy and regulatory environment for financial institutions and monitors their prudential
and operational performance; state commercial banks not engaged in housing loan to home
owners, but involved in construction and development finance loans to housing
development and construction enterprises; four retail housing banks originating housing
loans; and other financial institutions such as housing development funds and consumer
credit organizations including micro credits to home owners.
A large majority of urban households in Vietnam rely primarily on personal and family
savings to finance housing construction and improvement. In a survey carried out in
200717 , only 20 percent of the respondents said that they wanted to get loans from
commercial banks for housing. Most people relied on personal savings (44 percent) and
another 35 percent preferred informal loans from relatives or friends to add to the own
savings for housing purchase. Respondents said that the procedures for getting loans from
commercial banks are too complicated and also that interest rates are too high.
Much practical housing construction is progressive, which allows home builders to tailor
expenses with available capital. A household can save intermittently and also get personal
loans without interest from relatives and friends. It can also convert other family equity
17 Hanh, Tran Thi, “Housing Finance and Housing Markets,” Thematic Report for the Vietnam Urban Housing Profile Study, Hanoi, 30
June 2011, UNHabitat、p.155 (Referred to in UN-HABITAT, "Vietnam Housing Sector Profile (Draft Final),” January 2, 2012, Chapter Seven.)
3-21
THE STUDY FOR BASIC INFORMATION ON THE HOUSING SECTOR IN VIETNAM FINAL REPORT
(e.g., land, jewelry, livestock) into finance for housing construction. Also, remittances
from family and friends residing overseas have added to this practical housing finance
stream.
In the case of informally-built housing18, which accounts for at least 60% of all urban
housing units production in the country, the aforesaid personally practical means of housing
finance are the only ones available. To make housing finance bankable, people have to
cope with various legal and bureaucratic obstacles, such as lack of building ownership and
land use certificates (BOLUCs) and land use right certificates (LURCs). Two factors to
constrain formal lending for housing are pointed out. One is high cost of borrowing and
another, cultural reluctance to borrow.
Culturally, the Vietnamese like to save if possible and are averse to holding debt. The
burden of debt and the worry that repayment in the future may be difficult, partly as a result
of Vietnam's unstable history and partly due to high inflation have kept many families away
from formal sources of credit for housing.
According to World Bank, “Vietnam Urbanization Review: Technical Assistance Report,”
201119, the survey showed that a large proportion of such transactions are made in cash, as
one-time payments, with money borrowed from friends rather than loans and installment
transactions from banks. The high percentage of transaction is done directly between
vendors and purchasers with no brokers intervening between them. In addition, Hanoi has
higher percentage of one-time payments than Ho Chi Minh. For transaction of high end
property in Hanoi, installment payment is 100%; only 15% is subject to any form of finance,
and only 5% is bank financed. That report says:
Since a high proportion of real estate sales are made with one-time payments, it is very likely that high land and real estate prices reflect a lack of other options for storing wealth. In other words, people who are able to enter the land and real estate markets do not need to borrow money—they can already source it as cash—and this suggests that there is an unusual degree of liquidity in Vietnam and possibly a lack of adequate alternate options for investing wealth.
With interest rates for mortgages at very high rates of 18 to 20% per annum, a borrower is
looking at accumulated premium payments several times the value of the mortgaged
property. Even though high inflation rates discounts future repayments, for many
Vietnamese it seems absurd to be locked into twenty years of high monthly payments.
They make a rational decision to forego current “consumption” of the housing good,
18 ”Informal housing” is a general urban housing type in Vietnam, which is characterized by self-built, self-reliant approach. The land
owner mobilizes his own finances and manages house construction, usually by hiring a small contractor or master-builder. In all cases, the builder is the end consumer, whether a dweller or a landlord. Most of informal housing is neither traded in the housing market nor approved through legal requirements. UN-HABITAT estimates that informal housing accounts for about 60% of urban housing in Vietnam.
19 World Bank, “Vietnam Urbanization Review: Technical Assistance Report,” 2011, pp. 159 and 160.
3-22
THE STUDY FOR BASIC INFORMATION ON THE HOUSING SECTOR IN VIETNAM FINAL REPORT
accumulate savings, and then purchase a housing unit with a combination of cash and
informal sources.
There are many reasons why there is not a more rapid expansion of the formal housing loan
market. Some of these are mostly related to the following credit risk and funding/liquidity
risk:
- Constrained availability and quality of collateral (i.e., LURC and BOLUC)20 - Unclear and cumbersome nature of the property foreclosure procedures - Difficulty in household income verification - Very limited access of lending banks to long term funding sources
Lending by commercial banks is closely tied to the lending interest and the required reserve
ratio, which are controlled by the State Bank of Vietnam. Borrowers can use their
properties, including housing, movable properties or the guarantees from guarantors to get
loans for housing. Housing finance regulations sometimes causes confusion to both
mortgagees and mortgagers. Rules are inconsistent with regards to the process of
certifying collateral. For example, according to the Housing Law, housing collateral
agreements can be certified by People’s Committees of districts or communes, or notaries,
while according to the Land Law certifying land use right collateral is solely the
responsibility of People’s Committees of communes. Also, it is unclear whether the
housing under construction is eligible to being used as collateral or not.
The Housing Law and Decree No.71/2010/ND-CP provides capital sources for commercial
housing development (Article 38 and Article 9 respectively). In practice, however,
because of a high reserves ratio set to commercial bank loans and high lending rates offered
by commercial banks, most housing developers have to look elsewhere to mobilize funds for
housing development. The key funding sources for housing developers at present are,
besides equity, by raising pre-payments from eventual unit owners, as stated in Section 3.3
(3).
(3) Governmental Housing Funds
City of Ho Chi Minh established the Ho Chi Minh city housing development fund in 2004,
receiving a grant from the city budget of VND 1,000 billion to capitalize its operations.
The objective of the fund is to help mobilize funds for housing for low income people living
in the city. Beneficiaries of the fund are civil servants and government officers of the
municipal government. Housing loans are provided from the fund, and borrowers are
required to pay a down payment at 20% of the value of housing unit. The maximum size
of a loan is VND 400 million (2010), maturity is 15 years at an annual interest rate of 9%,
20 In general, it is impossible for a third party (sometimes even the person concerned) to verify contents of LURC, because only persons
granted LURC can read it. This results in lessoning the power of LURC.
3-23
THE STUDY FOR BASIC INFORMATION ON THE HOUSING SECTOR IN VIETNAM FINAL REPORT
which implies a heavy subsidy. It is difficult to screen for qualifying low income
beneficiaries. Lending progress is slow. It is said that the fund has not performed well.
City of Hanoi set up the Hanoi housing development fund in 2001. The objective is (1) to
receive the funds from the city and state and issue long-term and medium-term loans to
housing developers for housing projects, including resettlement housing and residential
infrastructure, (2) receive savings from civil servants as installments towards the purchase of
the city's low income housing units, and (3) make direct investment in housing and
infrastructure development. To date the fund has mainly focused in resettlement housing.
Only two low income housing projects were completed. Although loans were made at
concessional rates, not many civil servants have participated in the loan program, due to the
unclear eligibility criteria to the loans and the small size of the loans.
(4) VND 30 Trillion Credit Package for Social Housing
To encourage low income housing, in the last ten years the government has given housing
developers free land and concessional loans, but stipulated the selling price and who
qualifies. There is a problem in targeting. Many who benefit can hardly be called
low-incomer, and conversely very needy households may be unable to afford the units on
offer. There is also said to be a problem with inferior construction quality.
The government issued Resolution No.02/NQ-CP on January 7, 2013, ordering some
resolutions to remove difficulties for business production, market support, handling of bad
debts and so on. On May 15, 2013, the State Bank of Vietnam issued Circular
No.11/2013/TT-NHNN instructing to provide loans for social housing for five commercial
banks of which the state holds more than 50% of charter capital and the Ministry of
Construction issued Circular No.07/2013/TT-BXD regulating details of operation of the said
housing loans. According to these Circulars, the State Bank of Vietnam uses VND 30
trillion to support the five commercial banks to undertake the loans in 36 months since June
1, 2013. The interest rate of loans is equal to half of the average lending interest rate in the
market, but less than 6% per year. In fact, the State Bank of Vietnam yearly defines and
announces the interest rate applied for the next year in December every year. The interest
rate applied in 2013 is 6% per year. Application of the loaning interest does not exceed 10
years for customers purchasing, leasing, or purchase-leasing social housing and leasing or
purchasing commercial housing (sized and priced like social housing as stated later) and 5
years for enterprises for housing development. Loaning duration applied to the former
housing users are not less than 10 years and that applied to the latter enterprises, not more
than 5 years.
The said housing loans can be borrowed in the following cases:
3-24
THE STUDY FOR BASIC INFORMATION ON THE HOUSING SECTOR IN VIETNAM FINAL REPORT
- In purchasing, leasing or purchase-leasing social housing - In purchasing or leasing commercial housing with an area of less than 70 m2 and at a
sale price of less than VND 15,000,000/m2 - In investing in social housing development
Persons and organizations who can borrow the housing loans are:
- Cadres, civil servants, public employees, armed forces and persons with low income - Enterprises investing in construction of social housing and conversion of commercial
housing into the aforesaid specification
In addition to solution for the redundant supply of social housing, rescue of the frozen
housing market was another purpose of this credit package. According to news and the
study team’s interview after launching the housing loans, however, complicated and
time-consuming procedures, lack of coordination among concerned authorities, etc. are
impediments to satisfactory implementation despite of expectations for support of needy
people and businesses through the big credit package21. Table 3-5 shows the necessary
qualifications with which individuals and organizations can borrow the housing loans. In
fact, since the requirements for qualification have typical difficulties solely for local
authorities to assess whether an applicant has his own house, some improvements will have
to be added to the assessment procedures or systems.
Table 3-5 Necessary Qualifications for the Social Housing Loan
Items Necessary Qualifications for the Social Housing Loan
Housing type to grant the loan
- Social housing - Commercial housing with an area of less than 70m2 and at a sales
price of less than VND15million/m2 Qualifications for individuals (purchase or lease) who can borrow the loan
- Not having own house - Living in house with an area of less than 8m2 per person - Obtaining a permanent residency right - Never having the social housing loan
Qualifications for organizations who can borrow the loan
- Obtaining approvals and licenses for social housing development, including investment approval and construction permit
- Land for housing development is vacant (eviction is finished). - Commercial housing, which is permitted by competent authorities to
convert to social housing - Having an appraisal of Ministry of Construction which is sent to the
state banks of Vietnam designated by the circular
Source: Circular No.07/2013/TT-BXD dated May 15, 2013
THE STUDY FOR BASIC INFORMATION ON THE HOUSING SECTOR IN VIETNAM FINAL REPORT
3.7 Housing Policies of Local Governments
In Decree No.71/2010/ND-CP, it is prescribed that provincial level People's Committees shall
formulate housing development programs or plans for every five and ten or more years on the
basis of the National Housing Development Strategies promulgated by the Prime Minister,
national housing development policies, local development tasks, etc. (Article 74) The said
local housing development programs or plans have to state the major contents in detail as
follows:
- Overview of housing state - Analysis and assessment of housing development and management - Housing development program or plan with housing needs of each target group - Plans to raise funds for housing developmentPresent housing state (types of houses,
difficulties and problems in building and upgrading, housing needs of each target group
As for Hanoi City, Ho Chi Minh City, Vinh Phuc Province and Binh Duong Province covered
by this study, they have the following formulation stage of their own housing development
programs or plans (As of September 2013).
- Hanoi City: Formulated. - Ho Chi Minh City: The 3rd draft completed. - Vinh Phuc Province: The final draft completed to be submitted to MOC soon. - Binh Duong Province: In preparation based on the housing policies formulated in
2008.
Housing development targets for Hanoi City and Ho Chi Minh City are outlined as shown in
Tables 3-6 and 3-7 respectively .
Table 3-6 Criteria for the Housing Development Program in Hanoi (Period 2012 to 2020,
and aiming for 2030)
Items 2015 2020
Housing area per capita 23.1 m2/person 26.3 m2/person In urban areas 26.6 m2/person 28.7 m2/person In rural areas 20 m2/person 22.7 m2/person
Minimum housing area 6.5 m2/person 8.5 m2/person
Total housing area 166,320,000 m2
(Increase of 19,596,600 m2
on 2011)
207,375,000 m2
(Increase of 41,055,000 m2
on 2015)
Accommodations for college students, university students, apprenticeship school and vocational training school students
Demand: 1,300,000 m2, 200,000 students
Supply: 600,000 m2, 100,000 students
Demand: 800,000 m2, 130,000 students
Housing for workers in industrial area
Demand: 3,000,000 m2, 300,000 workers
Supply: 1,500,000 m2,
Demand: 4,000,000 m2, 400,000 workers
3-26
THE STUDY FOR BASIC INFORMATION ON THE HOUSING SECTOR IN VIETNAM FINAL REPORT
230,000 workers
Social housing for low-income people (minimum targets)
Demand: 3,200,000 m2, 45,000 units
Supply: 1,100,000 m2, 15,500 units
Demand: 5,000,000 m2, 72,000 units
Official housing 1,400 m2 Demand: 30 units,
2,100 m2
Rehabilitation housing
Demand: 2,000,000 m2, 25,000 units
Supply: 1,600,000 m2, 20,000 units
Demand: 2,800,000 m2, 35,000 units
Rate of permanent houses 89.7% (88.6% in 2011)
91.2%
Rate of impermanent houses 0.05% Totally reduced Rate of apartment housing in urban housing development projects
87% 89%
Rate of rental housing in urban housing development projects
25% 30%
Investment funds from the government budgets for the investment in leased or leased-purchased social housing, official housing, partly for students’ dormitories and rehabilitation housing, and for support of low-income households
8,453.4 billion VND (4.5% of the total investment to 2015)
7,635 billion VND (1.7% of the total investment to 2020)
Increase of urban and rural land resources
2,133.7 ha 3,664.6 ha
By 2030, the city’s average housing floor area per capita is to reach 31.5 m2/person (minimum 12.6 m2/person), in which the average housing floor area per capita shall be 33.8 m2/person in urban area, 27.1 m2/person in rural area; total housing floor area is 283,500,000 m2 (increases 76,125,000 m2 in comparison with 2020); 93.2% in rate of permanent housing; 93% in rate of apartment housing in urban housing development projects; 35% in rate of rental housing in urban housing development projects; 8,612.7 billion VND investment fund from the government budgets (1% of the total investment fund for 2030); Increase of 5,542.9ha in urban and rural land resources. Source: Prepared by the study team on the basis of "Criteria for the Housing Development Program in Hanoi (Period 2012 to 2020 and aiming for 2030)”
Table 3-7 Criteria for the Housing Development Program in Ho Chi Minh City (Up to
2015, aiming for 2020 and with a vision toward 2030) [3rd Draft]
Items 2015 2020
Housing area per capita 17 m2/person 19.8 m2/person Increase of total floor area 7,800,000 m2/year 8,200,000 m2/year Floor area of social housing to be supplied
2,700,000 m2 at least 3,300,000 m2 at least (660,000 m2/year)
Accommodations for college students, university students, apprenticeship school and vocational training school students
600,000 m2, 100,000 inhabited places (60% of demands)
800,000 m2, 130,000 inhabited places for 230,000 students
3-27
THE STUDY FOR BASIC INFORMATION ON THE HOUSING SECTOR IN VIETNAM FINAL REPORT
(80% of demands) Social housing sold, leased, leased-purchased for public servants, military officers and low-income people
1,300,000 m2, 17,500 housing units
1,500,000 m2, 20,000 housing units
Housing for industrial workers 800,000 m2, units for 93,000 workers (50% of demands)
1,000,000 m2, units for 110,000 workers, 200,000 workers at most (70% of demands)
Rehabilitation housing 25 buildings (350,000 m2, about 6,500 housing units)
Creation of rehabilitation fund with 30,000 housing units in urban renewal projects
Rate of permanent houses 65% or over 75% or over Rate of impermanent houses Less than 5% Totally cleared Rate of houses with appropriate sanitation facilities
75% or over 95% or over
Rate of apartment housing in urban housing development projects
80% or over 90% or over
By 2030, the city’s average housing floor area per capita is to reach 27.8 m2/person (9.500,000 m2/year), in which the number of high qualified and comfortable housing shall occupy 80% of the total housing and the number of apartment housing shall be at least 95% of the total housing development projects. Source: Prepared by the study team on the basis of "Criteria for the Housing Development Program in Ho Chi Minh City (Up to 2015, aiming for 2020 and with a vision toward 2030) 3rd Draft”
3.8 International Donors for Housing Development
Since the Doi Moi reform in 1986, various foreign agencies have increasingly engaged in
helping the country’s development in a variety of sectors. They as donors have supported
housing development and housing finance, including indirect support in urban grading, land
administration and other subjects closely related to housing. According to the investigation of
UN-HABITAT, prominent donor activities in housing in Vietnam are as stated below22.
1. World Bank (WB)
WB has funded the biggest ODA project in urban/housing sector, the Viet Nam Urban
Upgrading Project (VUUP 2004 and continuing) with an initial budget of US$ 300
million23. This project purposes to improve the living and environmental conditions of
the urban poor in four cities of Hai Phong, Nam Dinh, Can Tho and Ho Chi Minh. VUUP
comprises infrastructure upgrading, resettlement housing, land and housing management,
housing improvement loan program, capacity building, etc. for the respective cities.
The success of this project has led to an additional WB funding of approximately US$ 300
22 UN-HABITAT, "Vietnam Housing Sector Profile (Draft Final),” January 2, 2012, Chapters Three and Seven 23 For background and development of VUUP, see
THE STUDY FOR BASIC INFORMATION ON THE HOUSING SECTOR IN VIETNAM FINAL REPORT
million for upgrading activities in eight cities of the Mekong Delta.
2. Asian Development Bank (ADB)
The ADB Housing Finance Project (2002 to 2008) aimed to provide approximately 27,500
housing finance loans which were disbursed through financial institutions participating in
the first round of lending24. The project supported the establishment of a housing finance
facility that would become the housing finance sector's apex institution and also facilitated
the implementation of a policy and institutional reform action plan that would encourage
the development of the housing finance system. It was reported that only 30 to 40% of the
total loan amount had been disbursed so far. The reasons why the project was not popular
were reportedly limited targets (urban households with a stable income), high interest and
lending mechanisms through commercial banks not attractive for banks to participate.
3. Japan International Cooperation Agency (JICA)
JICA has been giving assistance to the Ministry of Construction on housing policies since
1999.
4. United Nations Human Settlements Programme (UN-HABITAT)
UN-HABITAT having a bureau in Hanoi and advises the Ministry of Construction and
other agencies on housing policy and also supports sectoral investigations.
5. Swedish International Development Agency (SIDA)
Since 2004 SIDA has had a small program to assist the establishment and operation of
housing cooperatives and housing savings programs in Hanoi and Ho Chi Minh cities.
6. Belgian Technical Cooperation (BTC)
BTC supported the Tan Hoa Lo Gom Canal Sanitation and Urban Upgrading Project in Ho
Chi Minh city from 1995 to 2005. This project became later included under the umbrella
of the VUUP of WB. The French-based NGO, “Villes en Transition’s (VeT)” was
sub-contracted for studies and technical design.
7. Agence Française du Devéloppmement (AFD)
In 2006, AFD allocated a 30 million eruo concessional 15-year line of credit to the Ministry
of Finance that was on lent to the Ho Chi Minh City Investment Fund for Urban
Development (HIFU). The line of credit was issued to increase the HIFU’s commitment
to social housing. The project also targeted environmental service upgrading in order to
reduce water and solid waste pollution in Ho Chi Minh city.
For the urban infrastructure, a number of multilateral and bilateral donors have been extensively
24 For outline and latest report of the ADB Housing Finance Project, see http://www.adb.org/projects/35497-013/details and http://www.adb.org/projects/documents/housing-finance-project-viet-nam-pcr .
3-29
THE STUDY FOR BASIC INFORMATION ON THE HOUSING SECTOR IN VIETNAM FINAL REPORT
involved in the funding of upgrading initiatives in water and sanitation, drainage, and solid
waste management. These donors include ADB, WB, UN-HABITAT, the Danish International
Development Agency, the Finish International Development Agency, and JICA.
In the field of land administration and registration, the Australian Government Overseas Aid
Program has assisted in legal reforms, modernization of cadastral mapping, and land
recording; SIDA helped in land administration reform; WB funded a major implementation of
land policies and cadastral mapping.
Taken as a whole, the donor-funded projects have helped improve living conditions for
thousands of urban inhabitants, especially for those within the low-income communities. They
have brought in new methods of project management; the use of participatory planning and
result-oriented methods. Results and processes of the these projects have positively
influenced government housing policy making, as found in the National Orientation of Housing
Finance Policy to 2020 (approved in July 2007), the National Urban Upgrading Program in
Period of 2009 to 2020 (approved in June 2009), and the National Housing Development
Strategies until 2020 and with a Vision toward 2030 (approved in November 2011) supported
by UN-HABITAT for their formulation.
3.9 Major Issues of Housing Policies
Part of social housing development funds are formed by revenues from sale and lease of
state-owned houses in localities provided before the Doi Moi reform in accordance with Article
52 of the Housing Law issued in 2005 and Article 75 of Decree No.71/2010/ND-CP issued in
2010. In view of the fact that it is as early as 1994 when Decree No.61/CP issued to sell
state-owned housing to existing tenants, it is supposed that disposal or depreciation of the
existing state-owned housing is not progressed as initially expected. This delay can be
explained by financial shortage of existing dwellers, lack or inconvenience of replaced houses,
satisfaction with as they are, and so on. In the meanwhile, the state-owned housing not yet
disposed of will be deteriorated or depreciated year by year.
In the National Housing Development Strategies until 2020 and with a vision toward 2030
issued in 2011 and the subsequent local ones, targets for raising the rate of rental housing in
total housing are set up. On the other hand, Decision No.105/2007/QD-TTg issued in 2007 to
approve National Housing Finance Policy Orientations up to 2020 states the increase of
people’s housing ownership rate as part of the objectives of the Decision (Article 1). This
means that, accepting the fact that housing in Vietnam is overwhelmingly owner-occupied, the
state intends to activate the housing market through building a system of consistent mechanisms,
policies and legal institutions including housing finance system25.
25 In the Census of 1999, self-owned housing accounted for 86.1% of all housing units nationally and 80.8% in urban areas. Almost
15% of urban housing units were rented from government (mainly social housing built in the 1970s and 1980s) and only 1.4% of
3-30
THE STUDY FOR BASIC INFORMATION ON THE HOUSING SECTOR IN VIETNAM FINAL REPORT
Aside from the main policy of stable supply of housing in demand, it has become necessary to
take measures to revive the shrinking housing market. For example, Circular
02/2013/TT-BXD issued in March 2013 regulates procedures for transfer commercial housing
apartments to social housing apartments or public service facilities (e.g., hospitals, schools,
hotels) when approved or built apartments are not suitable with demands of the market. The
said conversion which recently faced many difficulties has been approved by this Circular.
The Circular has the same root as VND 30 trillion credit package for social housing with regard
to a combination of social housing supply and market stimulation.
Thus, the housing policies of Vietnam are enforced to solve various kinds of issues, such as
deficiency of housing, financial shortage and development of the market. The Housing
Development Program in Ho Chi Minh City (Up to 2015, aiming for 2020 and with a vision
toward 2030) [3rd Draft] analyzes the housing state objectively. This section is concluded by
the following issues in housing policies enumerated on the basis of the description of that
Housing Development Program and the issues shown in Chapter 2 of UN-HABITAT, "Vietnam
Housing Sector Profile (Draft Final),” 2012.
(1) There are a number of housing investment incentives for housing developers and investors,
but not directly for inhabitants. This leads to the fact that real estate developers aim at
earning high profits. Therefore, they prefer investing in high-standard commercial
housing in order to earn fast return on investment, rather than to develop housing for social
beneficiaries.
(2) There are recently many policies of social housing. In fact, however, it only began to gain
prominence in 2007, irrespective of the prescription in the Housing Law issued in 2005.
Many projects are in the pipeline.
(3) Most of the policies give preference to state civil servants. This results in creating
inequality for other low income people working in other sectors.
(4) The government has not applied any incentive on rental housing to steer public favor with
“house owning” to “house renting” as it is popular in other countries.
(5) Although there a number of financial policies on housing development, the housing
financial system has not been completed. There is no investment fund such as housing
saving funds or real estate credit funds for housing development. Besides, the real
estate mortgage is not working efficiently and housing development capital resources are
still limited especially for the medium- and long-term credit funds. Since no LURC is
received before commencement of the construction, the land to be developed cannot be
mortgaged for financing.
urban units were rented from private landlords. While the portion of private rentals in urban areas has certainly increased by 2009, a huge majority of urban housing units are kept self-owned, probably in excess of 75%. The data from the Census of 2009 are not available. UN-HABITAT, "Vietnam Housing Sector Profile (Draft Final),” January 2, 2012, Chapter Four
3-31
THE STUDY FOR BASIC INFORMATION ON THE HOUSING SECTOR IN VIETNAM FINAL REPORT
3-32
(6) Despite the fast growing housing market, this growth is still not yet sustainable. There is a
lack of transparent information; the real estate transactions are not yet open to public.
Besides, the government’s control is still insufficient. The real estate market is processing
unprofessionally with unhealthy competitions. Hence, this results in high risks for both
investors and housing purchasers.
(7) Some laws, decrees or regulations are inconsistent with each other with regard to land
use, investment, construction, city planning and financing, leading to frequent
complications. Administrative procedures are much complicated and time-consuming for
planning, land use and financing as well as housing. Too high standards, too much
documentation and too many fees and taxes to pay are apt to discourage people in need of
housing.
(8) Policies focus more on housing quantity than quality. While encouraging more housing
areas to be built, the policy does not pay enough attention to living quality. For example,
there are no targets for reducing crowding, natural lighting room, number of people sharing
one room, etc.
(9) More attention is paid to new housing development rather than to improving existing urban
areas.
(10) Policy communication is poor without coordination mechanisms. There is lack of policy
monitoring and evaluation tools. There is no periodical census of housing stock and
production, which gives the basis of policy making.
THE STUDY FOR BASIC INFORMATION ON THE HOUSING SECTOR IN VIETNAM FINAL REPORT
4. PRESENT HOUSING DEVELOPMENT IN VIETNAM 4.1 Housing Stock recorded in National Census
(1) Housing Stock
According to the data on households given in the Census of Population and Housing, the
number of households living in housing units can be traced as shown in Table 4-11. It is
found that the number of housing units in urban areas in 2009 increased by 68% over that in
1999. Although most of households have housing in number, it does not mean that they
live in structurally durable houses as stated below.
Table 4-1 The Number of Households with Housing in 1999 and 2009
Source: UN-HABITAT, "Vietnam Housing Sector Profile (Draft Final),” originated from Census of Housing and Population,
1999 and 2009
(2) Size of Housing Units
From the 1999 Census of Population and Housing, 4.0% of urban housing units had living
areas of less than 15 m2. 34.4% of that measured 15 to 36 m2 and 29.5%, 37 to 59 m2.
That is, a total of 68% of urban housing units had living spaces of less than 60 m2 with the
average around 44 m2 per unit. In 2009, the percentage of urban housing units having
living area of less than 15 m2 increased very steeply to 14%; the average size of a unit
increased to 61 m2.
For the country as a whole, floor area per capita increased rapidly over the past decade: from
9.7 m2 in 1999 to 16.7 m2 in 2009 (nationwide). This average trend hides the fact that the
gap between living space for the rich and poor is widening. Over the past 10 years, and
despite the construction of many new large housing units, the proportion of houses with a
total area below 15 m2 has been increasing. A total of 17.4% of urban households live with
1 The Census of Population and Housing which is carried out by the General Statistics Office (GSO) every ten years does not count up
housing units or buildings in spite of its name, but a pure population based on a person’s official residence. Thus, it misses most migrants from rural area without change in registration. There is limited information about housing living conditions derived from the questionnaires filled out for the resident population. As sated in Chapter Four of UN-HABITAT, "Vietnam Housing Sector Profile (Draft Final),” January 2, 2012, it has to be assumed that “households with housing” is equivalent to housing units. This means that unoccupied units or living units not intended for housing (e.g., garages, shops) are not counted. Aside from the national survey, however, principal cities and provinces including those covered by this study periodically collect their own numerical data on housing, as given in 4.2.
4-1
THE STUDY FOR BASIC INFORMATION ON THE HOUSING SECTOR IN VIETNAM FINAL REPORT
an average area per capita of between 6 to 10 m2 per capita, and 4.8% live with less than 5.0
m2 per capita.
The UN-HABITA’s study interprets the fact that this sort of no-space living is accepted by
the Vietnamese, as quoted below2.
In Vietnam, perhaps more than in some other parts in the world, households master the art of 'living on the centimeter'. In small houses, space is used smartly, with multifunctional rooms (day/night shifts in function), curtains creating flexible subdivisions, and the use of mezzanines to extend habitable space. In addition, in case the typology allows for it, and with a climate that allows for it, the outside space directly adjacent to the house is eagerly used to serve as an extension to everyday living-working space.3 The area per capita figures thus need to be understood in the light of a particular climate and housing culture.
(3) Type of Housing Construction
In the Census of Population and Housing, housing construction is classified into four types.
Although the General Statistics Office (GSO) does not define contents of these types, the
study team obtained the following definitions from DOC of Ho Chi Minh City.
A. “Permanent” type means that columns, roofs and walls of a house (three kinds of main structural members) are made of permanent materials.
B. “Semi permanent” type means that two of the three kinds of main structural members are made of permanent materials.
C. “Less semi-permanent4” type means that one of the three kinds of main structural members is made of permanent materials.
D. “Simple” type means that all the three kinds of main structures are made of nonpermanent materials.
Materials are exemplified as shown below.
Table 4-2 Materials for housing construction
Column Roof Wall Permanent - Reinforced concrete
- Brick/rock - Iron/steel/permanent wood
- Reinforced concrete - Tile (concrete,
terra-cotta)
- Reinforced concrete - Brick/rock - Wood, metal
Unpermanent - Low quality wood/ bamboo
- Others
- Sheet (concrete, metal)
- Leaf/straw/oilpaper - Others
- Clay/mortar/straw - Bamboo screen/
plywood - Others
Source: Arranged by the study team on the basis of information from DOC of Ho Chi Minh City
Housing in 2009 is classified by the type of housing construction as shown in Table 4-3.
2 UN-HABITAT, "Vietnam Housing Sector Profile (Draft Final),” January 2, 2012, Chapter Four. 3 Note of the quoted sentences: This is especially so for lower income households, urban and rural alike. 4 In 2009, the GSO replaced the existing term “durable-use wood frame” with “less semi-permanent.”
4-2
THE STUDY FOR BASIC INFORMATION ON THE HOUSING SECTOR IN VIETNAM FINAL REPORT
Table 4-3 Type of Housing Construction in 2009
Housing classified by Construction Quality Area
Total Households with Housing Permanent
Semi- Permanent
Less Semi- permanent
Simple Unidentified
Nation 22,186,275
(100%) 10,375,699
(46.8%) 8,468,219 (38.2%)
1,690,392 (7.6%)
1,645,920 (7.4%)
6,045 (0.03%)
Urban 6,756,726 (100%)
2,764,915) (40.9%)
3,589,268 (53.1%)
222,282 (3.3%)
176,590 (2.6%)
3,671 (0.05%)
Rural 15,429,549
(100%) 7,610,784 (49.3%)
4,878,951 (31.6%)
1,468,110 (9.5%)
1,469,330 (9.5%)
2,374 (0.02%)
Source: UN-HABITAT, "Vietnam Housing Sector Profile (Draft Final),” originated from Census of Housing and Population,
1999 and 2009
(4) Age of Housing
For urban areas in 2009, 8.6% of the total urban housing stock of 6.09 million units was 34
years old or older. A total of 44.9% of the urban housing stock were 10 to 34 years old,
and 24.0% were 5 to 10 years old. Thus, the urban housing stock in Vietnam is very new
in general.
(5) Housing Production
There is no general data in Vietnam on annual housing construction starts or completions.
The present study is made expediently assuming that the increase in households given in
Tables 4-1 and 4-2 is equivalent to the number of new housing production5. Table 4-4
shows the assumed housing production in urban areas during the 1999 to 2009 period.
Table 4-4 Urban Housing Stock and Production by Housing Construction in 1999 and 2009
Housing classified by Construction Quality Year Total Units
Permanent Semi-
Permanent Less semi- Permanent
Simple
1999 4,022,471
(100%) 1,854,359 (46.1%)
1,971,010 (49.0%)
120,674 (3.0%)
76,427 (1.9%)
2009 6,756,726
(100%) 2,764,915 (40.9%)
3,589,268 (53.1%)
222,282 (3.3%)
176,590 (2.6%)
Total Production
2,734,255 (100%)
910,556 (33.3%)
1,618,258 (59.2%)
101,608 (3.7%)
100,163 (3.6%)
Inferred annual production
273,425 91,056 161,826 10,161 10,016
Source: UN-HABITAT, "Vietnam Housing Sector Profile (Draft Final),” originated from Census of Housing and Population,
1999 and 2009
The greatest increase was in the category “Semi-permanent,” representing almost 60% of
5 During the 1999 to 2009 period, unoccupied production, demolished existing units, units unoccupied in 1999 and occupied in 2009,
units added by administrative boundary changes, etc. should be essentially taken into account. In the study, these increase or decrease is disregarded following the UN-HABITAT’s judgment that it is best to assume that they cancel each other out.
4-3
THE STUDY FOR BASIC INFORMATION ON THE HOUSING SECTOR IN VIETNAM FINAL REPORT
the total production. Some 1.6 million units was small single-story "informal" houses
mainly on urban fringes. The majority of this informal construction was for family
residence for migrant workers. About 33% of the total urban housing production over the
1999 to 2009 period was in “Permanent” construction. It can be assumed that most of
these units were new, up to ground floor plus 6 storied shop houses or apartments in shop
houses in both central and suburban parts of cities and towns. The remainder was mainly
large footprint apartment tower blocks and integrated residential projects. Most of these
high-rises would be high quality towers built by major real estate developers, aiming at
middle and upper income Vietnamese and foreigners. Of the 7.3% of housing production
falling into the categories “Less semi-permanent” and “Simple” construction, all would have
been informally built. Most of this production would have been un-sanctioned
construction on urban fringes.
(6) Actors of Housing Development
There are nearly two thousand real estate businesses, most of which are small scale. The
large domestic housing developers are both state and non-state enterprises, and include the
Corporation of Housing and Urban Development (HUD), Vinaconex, Thu Duc House,
Nam Cuong, Bitexco, Cienco FIve, etc. In addition, there are foreign housing developers
who have been investing in large new urban projects, such as Ciputra (Indonesia),
KeangNam (South Korea), Phu My Hung (Taiwan), Viet Hung Development and
Investment JSC which recently develops Eco Park Hung Yen Province near Hanoi, etc.
Vietnam has recently become an attractive place for foreign investment. The government
has been encouraging the private sector to participate in the development of social housing,
with disappointing results so far.
Besides, there are an unknown but large number of individuals who are not registered as
either developers or contractors, but who acquire land and develop private houses for rent or
for sale. And, to keep a holistic perspective on housing production in Vietnam, it should be
noted that, as known from the prevalence of informal or self-help housing, households
themselves account for the biggest weight in housing production.
4-4
THE STUDY FOR BASIC INFORMATION ON THE HOUSING SECTOR IN VIETNAM FINAL REPORT
4.2 Housing Stock in the Study Area
(1) Hanoi City
Housing supply in Hanoi City is increasing every year with the progress of urbanization.
The total amount of housing reached about 1.5 million units in 2009 annually increasing by
about 70,000 units. Over 90% of the housing stock is single family houses (not apartment)
and over 80% of that is permanent type in housing construction.
0
200,000
400,000
600,000
800,000
1,000,000
1,200,000
1,400,000
1,600,000
1,800,000
~1975
1975~
1999
2000~
2005
2006
2007
2008
2009
units
Source: Statistics Office, Hanoi City
Figure 4-1 Housing Stock in Hanoi City
(2) Ho Chi Minh City
Like Hanoi City, housing supply in Hanoi City is annually increasing as the urbanization
progresses. The total amount of housing was about 1.4 million units in 2009, showing an
annual increment of about 50,000 to 60,000 units after 2000. Single family houses occupy
over 90% of the housing stock and permanent type of housing construction is more than
80% of that.
0
200,000
400,000
600,000
800,000
1,000,000
1,200,000
1,400,000
1,600,000
~1975
1975
~199
9
2000
~200
5
200
6
200
7
200
8
200
9
Un
its
Source: Statistics Office, Ho Chi Minh City
Figure 4-2 Housing Stock in Ho Chi Minh City
4-5
THE STUDY FOR BASIC INFORMATION ON THE HOUSING SECTOR IN VIETNAM FINAL REPORT
(3) Vinh Phuc Province
The total housing stock of Vinh Phuc Province was about 250,000 units in 2009, with about
12,000 units annually increasing after 2000. Permanent type of housing construction
exceeds 80% of the total stock.
0
50,000
100,000
150,000
200,000
250,000
300,000
~1975
1975~
1999
2000~
2005
2006
2007
2008
2009
Un
its
Source: Statistics Office, Vinh Phuc Province
Figure 4-3 Housing Stock in Vinh Phuc Province
(4) Binh Duong Province
Housing stock of Binh Duong Province was about 450,000 units in 2009. It is annually
increasing at a rate of about 40,000 units per year since 2000. While permanent type
housing occupied some 40% of the total stock in the past, semi-permanent type housing is
more than 80% of the total units in recent years.
0
50,000
100,000
150,000
200,000
250,000
300,000
350,000
400,000
450,000
500,000
~19
75
1975
~19
99
2000
~20
05
2006
2007
2008
2009
uni
ts
Source: Statistics Office, Binh Duong Province
Figure 4-4 Housing Stock in Binh Duong Province
4-6
THE STUDY FOR BASIC INFORMATION ON THE HOUSING SECTOR IN VIETNAM FINAL REPORT
4.3 Housing Transaction6
(1) Land Supply for Housing in Urban Area
Land with potential for conversion to urban residential use in Vietnam is, in most cases,
small holdings of agricultural land held by peasant farmers. In some locations there are
also large plantation farms, forest, institutional or marginal land held by the state, and
low-lying swamps and other water bodies which can be filled and developed for urban
purposes.
A report by MONRE on land conversions over the 2005 to 2010 period estimated that some
27,994 ha of land had been added to the nation’s urban residential land total, an impressive
increase of 27.2% in five years. It is expected that such conversions will accelerate in the
future. For example, urban land used for construction is forecast to reach 335,000 ha (1.06
percent of the country’s surface area) in 2015 and 450,000 ha (1.40% of the total) by 20257.
In the UN-HABITAT's study, the urban land for housing is provided in any one of the
following three modes8.
1. Land made available by the state, mainly to private developers and state enterprises 2. Land developed by the formal private sector or individuals and traded through market
mechanisms with registered LURCs 3. Privately-held land developed informally, usually through the conversion of agricultural
land held by individuals, and further subdivided
That study supposes that the majority of land is converted to urban use through informal
development (Mode 3) and that Mode 3 and Mode 2 represent at least three fourths of land
created for urban use. Further to the above quoted three modes of urban land creation, land
allocation in Mode 1 is actually processed by a local government on behalf of the state
government, and alteration and management of LURCs in Mode 2 are made by a local
government likewise.
(2) Land Market
In Vietnam today, there is a large and vibrant formal land market and also an even larger
informal land market, about which little is known. Land is brought into urban use at an
ever increasing pace. Due to rising demand, urban land prices in Vietnam are high and are
in general rising rapidly. For example, the 1990s land prices in urban areas increased by
over 500%, in both Hanoi and HCMC. Therefore land, both formal and informal, has
become a way to invest and speculate, shifting a significant share of the country’s economic
resources away from more productive uses.
6 The description of housing transaction is largely owed to UN-HABITAT, "Vietnam Housing Sector Profile (Draft Final),” January 2,
2012, Chapters Six and Ten. 7 UN-HABITAT, "Vietnam Housing Sector Profile (Draft Final),” January 2, 2012, Chapter Six 8 ibid.
4-7
THE STUDY FOR BASIC INFORMATION ON THE HOUSING SECTOR IN VIETNAM FINAL REPORT
In urban areas estimates vary, and some suggest that 60% to 85% of land is transacted
informally9. As these transactions go unreported and unrecorded, it is very difficult to
gauge the size of the informal market with any accuracy. It is important to know that
informal markets have evolved and persisted precisely because they meet many of the needs
of land market participants.
One reason for persistency of the informal market has something to do with Vietnam’s
history. Land use rights have been possessed and reassigned during and after decades of
conflict when laws and rights have been continuously evolving and changing. This has
created a decree of suspicion, uncertainty and an unwillingness to share information in the
minds of land users, not mentioning the frequent lack of archives, documentation and
maintenance on land use rights.
State control over the formal land market is by no means perfect. Although there are
ongoing reforms, the sometimes complicated, opaque and bureaucratic procedures have
introduced a high degree of uncertainty. This is another reason for the high level of
informal transactions. Distortions in the formal market, which are liable to drive
participation in the informal market, include increase in transaction costs implied by
taxation, various fees, lengthy administrative procedures and failure of planning provisions
to meet market demands.
Although the formal market is still evolving, the main actors in the formal market are
described as follows:
1. Households and individuals: These are the end-users of the housing process, but they
are also active players in land markets. They may be searching for land for house
construction or for investment or speculation or both.
2. Financiers: The banking sector plays important role in financing real estate businesses
and development projects. They include para-statals such as Vietcombank, Vietnam
Bank for Industry and Trade (VietinBank), Bank for Investment and Development of
Viet Nam, Bank for Agriculture and Rural Development (AgriBank) and other
commercial joint stock banks such as the Asian Commercial Bank, the Hanoi Housing
Bank (Habubank), the Mekong Delta Housing Bank. The Vietnam market opens up to
more for foreign interests. Some banks offer loans. Most of the commercial banks
provide loans to real estate business, housing developers, households for real estate
business, housing development, buying, or construction. Other financial organizations,
such as Development Investment Funds (in Hanoi and Ho Chi Minh Cities) are also
seen as financing instruments for land, housing and infrastructure development.
3. Housing developers: Housing developers are state or private corporations, foreign
9 ibid.
4-8
THE STUDY FOR BASIC INFORMATION ON THE HOUSING SECTOR IN VIETNAM FINAL REPORT
investors or joint venture companies. With a booming construction of apartment and
housing development projects, such developers obviously are playing a major force to
the land market. State developers have more advantages in land acquisition,
compensation procedures and easier accessibility to loans.
4. Real estate brokers: Foreign firms such as CB Richard Ellis, Jones Lang Lasalle,
Savills etc. are active in Vietnam in real estate brokerage, consulting and property
management. Additionally, hundreds of real estate transaction floors (RETFs) operating
nation-wide and in big cities like Hanoi and Ho Chi Minh Cities also are important
intermediaries in land and property markets. According to MOC (Housing Bureau
2010), currently, about 700 RETFs10 operate in Vietnam, and transactions via RETFs
account for 30% of the formal total in Hanoi, 50% in Ho Chi Minh City and roughly
40% nationwide.
5. Land speculators: In Vietnam, speculators are anyone from an investment organization
to an individual investor. They play a decisive role in heating up the land and real
estate markets. Beyond supply and demand, “the wisdom of the crowd” and rumour
have surprising impacts. The lack of transparency, limited information and market
distortion have supported speculation purposes for recent years. Recently, due to the
high inflation, monetary tightening policy, high loan interest rates, rising construction
costs, and speculation control policy, rampant speculation is said to have moderated.
6. Professional and NGO Associations: The Vietnam Urban Planning and Development
Association (VUPDA), Viet Nam Architect’s Association (VAA), Real Estate
Associations and some NGOs are active in urban planning and development, land
management, architecture, housing, etc. However, the influence and involvement of
these associations and organizations on decision or policy making process is generally
weak.
7. Foreigners and foreign corporations: Under current land laws, foreigners are
permitted to own houses in Vietnam. Foreign ownership of land use rights is not
allowed in Vietnam, but the land is leased from the government. An international
investor can also own land use rights by forming a joint venture company with a local
partner.
8. Donors and their projects: Donors including multilateral and bilateral agencies such as
World Bank, ADB, UN agencies, and organizations in Australia, Sweden, Denmark and
Japan have undertaken studies of land issues in Vietnam and supported the government
to develop an effective and transparent land management system. By technical
assistance, expertise building and loan projects, these efforts have significantly
10 RETFs are not allowed to engage in activities of real estate investment, trading, or rent. RETF only acts as a broker for selling and
buying, renting by authorization of real estate investors and collects fees on such transactions.
4-9
THE STUDY FOR BASIC INFORMATION ON THE HOUSING SECTOR IN VIETNAM FINAL REPORT
contributed to this perspective.
(3) Housing Market
Housing market in Vietnam is still in the initial stage of development. Before 1986 when
the Doi Moi reforms started there was technically no housing market. Housing
transactions then were mainly limited to the sale of state-owned units at administratively-set
prices.
The creation of the housing market began at the end of the 1980s following the Doi Moi
reforms. The ban on self-help building activity was lifted and local governments began to
allocate land to state employees for housing construction via various state institutions.
Housing production was further boosted in the late 1990s by a series of directives in
encouraging investment by large developers. Investments of foreign developers in real
estate were also encouraged.
These reforms triggered a housing boom in many cities of Vietnam. The Real Estate
Business Law, enacted in 2006, further boosted the housing market with the introduction of
a comprehensive legal framework for land and housing transaction, leasing of land and
property, and real estate services. The climate for overseas investment also improved at the
same time. Vietnam’s continuing economic boom, increasing inflow of foreign capital, and
rising expectations all led to a heated real estate market in which speculation in land and
property became rife. Typical in such situations, housing prices and rents in big cities like
Ho Chi Minh City and Hanoi have skyrocketed. And a host of players have entered the
transactions market.
New housing in urban areas was produced at a rate of at least 273,000 per year over the
1999 to 2009 period. Of this total, the corporate real estate sector produced perhaps 10%,
other formal private sector (mostly individuals and small developers) producing maybe 15%,
and government-backed housing contributed another 8%. This left a huge amount of
production or 65% of the production that was informal and outside the system. In fact,
housing that is “self built” or “self-reliant” and which makes up roughly 80% of urban
housing production, does not enter the primary housing market at all and is exchanged
informally. And as shown in (3) Land Market above, there is a parallel housing market
which is dominated by informal exchange.
This dualism also exists on the demand side of the market. A large majority of urban
families cannot begin to afford to purchase or rent the kinds of housing which are produced
by the private real estate sector and even has difficulty paying for government-sponsored
housing. For them, only the informal land/housing market offers housing solutions which
are anywhere near “affordable.” Housing demand by a rising urban professional and
middle class is being met by the “corporate” real estate sector, but this sector, in volume
4-10
THE STUDY FOR BASIC INFORMATION ON THE HOUSING SECTOR IN VIETNAM FINAL REPORT
terms and in terms of meeting overall housing demand, remains secondary.
According to some experts 80% of real estate transactions are informal. The reasons for
the informal real estate market are as follows:
1. Majority of people have insufficient understanding of laws and regulations, thus they do not consider registration of land use right or building ownership.
2. There are few mechanisms for punishing those who remain informal. 3. High registration tax rates lead people to avoid registering. 4. Complicated land registration procedures in addition to poor quality services of
administrative agencies have deterred citizen from registering.
Very little is known about the operation and players in informal housing markets. It can be
assumed that market knowledge is mainly by word-of-mouth among relatives, friends,
co-workers, etc. In any locale there are said to be informal housing agents who take a
small fee for bringing buyers and sellers together.
In Vietnam, renting is not a huge market segment and rental tenure represents, according to
the 2009 Census of Population and Housing, only some 15% of the total urban housing
stock. As with the housing purchase market, rental housing is exchanged either informally
(the majority) or formally. Informal rental exchange is through informal, individualistic
means, and the greatest informal rental market activity involves the exchange of
single-rooms mainly on the urban peripheries for migrant workers. Presumably market
information for this kind of housing relies on word-of-mouth among co-workers and
migrants coming from the same rural communes and provinces. The formal rental market
is mostly high-end and caters largely to foreigners and overseas Vietnamese.
Social housing sector of the housing market involves state agencies who produce and sell
units according to administrative prices and rules on eligibility. Potential beneficiaries
learn about housing units from public announcements and other media. Social and
“low-cost” housing (including resettlement housing) only really enter the housing market
upon resell or rental of units. Although such secondary disposal of social housing units has
been prohibited in the past, it is quite common, and exchange in this secondary sub-market
operates informally.
Actors of the housing market are almost the same those of the land market. Housing
transaction floors (HTFs) which are equivalent to real estate transaction floors as part of real
estate brokers have recently become housing market players. There are now over 375
registered HTFs and they function as official real estate brokers who give information,
advice and services to the clients for fees. Most of the official real estate brokers with
professional licenses work for HTFs. However, the scope of HTFs is still limited and as of
the end of 2009 they had made only around 20,000 completed transactions. To encourage
the use of the HTFs, Decree No.71/2010/ND-CP required housing developers to market
4-11
THE STUDY FOR BASIC INFORMATION ON THE HOUSING SECTOR IN VIETNAM FINAL REPORT
80% of apartments through RETFs. HTFs are in need of improvement, since some do not
have qualified professional real estate brokers and lawyers. HTFs are not supervised by
any agency. Most floors only provide information of housing for sale and do not provide
related transaction services such as payment services, price appraising, registration, titling
transfer, and legal services.
In Vietnam, consumers have weak legal and regulatory protection in housing and housing
land markets. There are no regulations on quality standards for housing units or criteria on
housing management. Also, many people poorly understand and are confused by the laws
and regulations governing land and housing.
Lack of adequate housing appraisal capacity forms another one of the factors causing poor
consumer protection and risk management. Most of the housing buyers and sellers do not
know how to obtain appraisal services, so a purchased property may be falsely appraised at
a higher value and then quickly sold.
(4) Housing Market Trend in Recent Years
As previously stated, the majority of housing transaction in Vietnam is informal and only
about 20% of housing transactions in urban areas are by formal private sector. The said
formal housing transactions are mostly related to high class residences, not affordable to
common households. Figure 4-5 shows typical high class residences (apartments) formally
traded in Hanoi and Ho Chi Minh Cities. Their prices are from 1,000 to 2,000 US$/m2.
Even higher-priced residences are sold in the market. It is considered that most of them
were purchased for speculation.
Royal City (Hanoi City) Estella (Ho Chi Minh City)
Sources: The study team
Figure 4-5 High Class Apartments recently Constructed
The raise of bank rate and other financial measures which the government conducted in
2011 to keep down the steep inflation resulted in making the housing market remarkably
sluggish. In fact, most of the housing appearing in the market was occupied by the
aforesaid high class apartments or villas for speculation. It is supposed that sales of them
4-12
THE STUDY FOR BASIC INFORMATION ON THE HOUSING SECTOR IN VIETNAM FINAL REPORT
with no actual demands dropped significantly according to the business recession.
The formal housing market mostly occupied by high class residents has reportedly
re-activated since the beginning of 2013 after the recession of two years. As a result, the
type of housing has changed to middle class or low-priced housing. A newspaper11 of
Vietnam in July 2013 reported on CBRE Vietnams’ housing transactions in Hanoi as
follows:
- Prices of apartments on sale in Hanoi have come down this year. 95% of them are
occupied by middle class and low priced ones. 80% of housing to be offered for
purchase within the year will be less than 1,000 US$/m2 in price. The said class
housing was only 20% in 2011. From now on, housing with a price range of 750 to
1,000 US$/m2 will grow most densely.
- Transactions of high class villas remain sluggish. Prices have gone down at least 20 to
30% on average from the previous year. For villas incomplete with no appliances,
their prices will further decline. Since villas have continuous fall in price irrespective
of heavy initial investments and low fluidity in the market, investors’ interest in villas
has waned.
Although the indications of recovery of housing market are observed after entering 2013,
housing items handled in the market are mostly occupied by middle class and low-priced
houses. A newspaper in August 2013 reported that, if LURC granted, houses each 35 to
50m2 in total floor area, 20,000 to 25,000 US$ (500 to 700 US$/m2) were good sellers in
Hanoi12. In Ho Chi Minh Metropolitan Area, it often comes up that EHOME houses
offered by a local developer Nam Long are selling well. Nam Long sells apartments of
40m2 per unit at 20,000 US$ (500 US$/m2) and townhouse of 80m2 per unit at 50,000
US$ (600 US$/m2).
11 Article of Thoi Bao Kinh te Vietnam, dated July 10, 2013 12 Article of Nhip Cau Dau Tu, dated August 26, 2013
4-13
THE STUDY FOR BASIC INFORMATION ON THE HOUSING SECTOR IN VIETNAM FINAL REPORT
EHOME4 (on the outskirts of Ho Chi Minh City) Source: The study team
Figure 4-6 Middle Class and Low-priced Houses recently Constructed
While the housing market has revived with regard to middle class and low-priced houses,
high class residences are inactive. According to DOC of the City of Ho Chi Minh, there
are about 14,500 vacant units in the city at the end of 2012. In line with this, the state
government plans to promote sales of unsold units and supply affordable units to the market
by converting commercial housing into social housing and permitting subdivision of
housing once completed, so that issues of commercial housing projects having a lot of
vacant units can be resolved. DOC of the City of Ho Chi Minh requires the selling price to
be set at 12 million VND (about 600 US$)/m2 for conversion of commercial housing into
social housing13.
Although the state government thus tries to increase the housing supply at affordable prices
for the purpose of vitalizing the housing market, units appearing on the formal market of
major cities can hardly have prices of lower than 300 million VND (about 15,000 US$).
That is, it is reportedly still difficult for most of households to purchase dwellings at
affordable prices. Furthermore, MOC plans to support development of housing for rent so
as to enable one unit to be supplied at an approximate rent of 200 million VND (about 1
million US$) per month14 for floor area of 40 to 50 m2.
Summarily, after the housing market of Vietnam in recent years had been held by high class
residences largely for speculation and then adversely affected by the monetary tightening
policy in 2011, it has become revitalized since the beginning of 2013. However, items
selling well have changed from high class to middle class and low-priced ones. In view of
the fact that lot of high class units are left unsold, the state government has employed such
policies as conversion of commercial housing into social housing and permission of
subdivision of completed housing in order to both promote sales of unsold items and
13 Article of Tuoi Tre, dated March 17, 2013 14 Article of Vietnam Plus, dated June 23, 2013
4-14
THE STUDY FOR BASIC INFORMATION ON THE HOUSING SECTOR IN VIETNAM FINAL REPORT
4-15
increase supply of affordable housing in the market. Nevertheless, the fact has not been
improved that no sufficient affordable housing is offered to the demands of general
households. Now, the state government has started to study how to support the
development of housing for rent.
THE STUDY FOR BASIC INFORMATION ON THE HOUSING SECTOR IN VIETNAM FINAL REPORT
5. SHORT-TERM HOUSING DEMANDS ASCERTAINED BY QUESTIONNAIRE SURVEYS AND INTERVIEWS
5.1 Questionnaire Surveys
(1) Purpose and Manner of Questionnaire Surveys
1/ Purpose of Questionnaire Surveys
Questionnaire surveys were carried out for the purpose of grasping trends in housing
development and housing market and short-term housing demands in Hanoi Metropolitan
Area and Ho Chi Minh Metropolitan Area. It is useful in giving valuable market
information to investors or the like intending housing development in Vietnam to clarify
relationship of attributes (income, household structure, etc.) of respondents with prices of
purchased houses, housing area, and so on in connection with results of interviews to be
described later in this chapter.
In addition, it is another purpose of the questionnaire surveys to know general views about a
suburban new town development connected with the city center by such public transport as
urban mass transit or bus.
2/ Manner of Questionnaire Surveys
The questionnaire surveys were conducted through cooperation of local universities
comprising academics of Urban and Architectural Institute, National University of Civil
Engineering and Faculty of Development Economics, University of Economics Ho Chi Minh
City for Hanoi Metropolitan Area and Ho Chi Minh Metropolitan Area respectively. The
questionnaires themselves were carried out by academics and students as local assistants.
The questionnaire forms and manner were determined through discussion of these local
academics. The study team requested concerned People’s Committees to issue the
governmental permission so as to enable the questionnaire surveys and interviews to be
smoothly carried out. As a result, the study team received survey permissions from People’s
Committees of Hanoi City and Vinh Phuc Province in a comparatively short time and from those
of Ho Chi Minh City and Binh Duong Province as late as at the end of September 2013. For
Ho Chi Minh City and Binh Duong Province from which issuance of the permissions was late,
the questionnaire surveys were made in advance of permissions by local assistants through
arbitrarily visiting homes agreeable to the survey in the target area from the middle of August
2013.
In getting views about a new town connected with the city center by public transport, since
principles of public transport and new town have not been generalized in Vietnam yet, the
study team gave local assistants a short lecture on the new town connected with the city
center by public transport so that they can effectively carry out the questionnaire surveys
and interviews with sufficient understanding about inquiries. (See Appendix 1.)
5-1
THE STUDY FOR BASIC INFORMATION ON THE HOUSING SECTOR IN VIETNAM FINAL REPORT
3/ Manner of Questionnaire Surveys by Web Research
Questionnaire surveys by Web research which supplemented the ordinary surveys as
described in Section 2.1 were conducted toward monitors registered in a local Web research
company.
(2) Distribution of Samples by Sphere
The size of the questionnaire survey was 3,000 samples for Hanoi Metropolitan Area (Hanoi
City, Vinh Phuc Province) and 3,000 samples for Ho Chi Minh Metropolitan Area (Ho Chi
Minh City, Binh Duong Province), both including the non-response. 1,000 samples of the
said respective 3,000 ones were taken from the Web research.
Since the population of the study area is unevenly distributed, the questionnaire survey was
conducted by effectively distributing samples according to actual population distribution
varying with localities. The metropolitan area was divided into three spheres depending on
distance from the center, and the central most area having the greatest housing demand and
development pressure was taken highest in sampling ratio.
1/ Questionnaire Surveys
Hanoi Metropolitan Area had the following sample distribution, not including the Web
research.
A. Within 5km from the center 1,000 samples
B. 5km to 10km from the center 600 samples
C. 10km to 20km from the center 200 samples
D. 20km form the center and more (Vinh Phuc Province) 200 samples
Sample distribution of Ho Chi Minh Metropolitan Area, except for that of the Web research,
was as shown below.
A. Within 5km from the center 800 samples
B. 5km to 10km from the center 600 samples
C. 10km to 20km from the center 400 samples
D. 20km form the center and more (Binh Duong Province) 200 samples
2/ Manner of Questionnaire Surveys by Web Research
Questionnaire surveys by Web research were carried out for residents in Districts which are
covered by A. Within 5km from the center and B. 5km to 10 km from the center applied to
the aforesaid surveys. The size of Web research was 1,000 samples for every metropolitan
area.
5-2
THE STUDY FOR BASIC INFORMATION ON THE HOUSING SECTOR IN VIETNAM FINAL REPORT
(3) Specified Districts and Size of the Questionnaire Surveys
Samples of the questionnaire surveys were distributed to districts and by size specified in
Table 5-1.
Table 5-1 Specified Districts and Size of the Questionnaire Surveys
Hanoi Metropolitan Area (3,000 samples, incl. 1,000 samples by Web research) Sphere A: Within 5km from the center (1,000 samples)
(Ha-A1) Ba Dinh (Ha-A2) Hoan Kiem (Ha-A3) Dong Da (Ha-A4) Hai Bai Trung
Sphere B: 5km to 10km from the center (600 samples) (Ha-B1) Tay Ho (Ha-B2) Long Bien (Ha-B3) Cau Giay (Ha-B4) Hoang Mai (Ha-B5) Thanh Xuan (Ha-B6) Ha Dong (Ha-B7) Tu Liem (only wards within 10km from the center)
Sphere C: 10km to 20km from the center (200 samples) (Ha-C1) Dong Anh
Sphere D: 20km from the center and more (200 samples) (Ha-D1) Vinh Yen, Vinh Phuc Province (Ha-D2) Phuc Yen, Vinh Phuc Province
Ho Chi Minh Metropolitan Area (3,000 samples, incl. 1,000 samples by Web research) Sphere A: Within 5km from the center (800 samples)
(Ho-A1) District 1 (Ho-A2) District 3 (Ho-A3) District 4 (Ho-A4) District 5 (Ho-A5) District 10 (Ho-A6) Phu Nhuan District (Ho-A7) Binh Thanh District
Sphere B: 5km to 10km from the center (600 samples) (Ho-B1) District 2 (Ho-B2) District 6 (Ho-B3) District 7 (Ho-B4) District 8 (Ho-B5) District 11 (Ho-B6) Go Vap District (Ho-B7) Tan Binh District (Ho-B8) Tan Phu District
Sphere C: 10km to 20km from the center (400 samples) (Ho-C1) District 9 (Ho-C2) Thu Duc District (Ho-C3) Di An, Binh Duong Province (Ho-C4) Thuan An, Binh Duong Province
Sphere D: 20km from the center and more (200 samples) (Ho-D1) Thu Dau Mot, Binh Duong Province
Plus 1,000 samples by Web research
Plus 1,000 samples by Web research
Source: The study team
5-3
THE STUDY FOR BASIC INFORMATION ON THE HOUSING SECTOR IN VIETNAM FINAL REPORT
Source: The Study Team
Figure 5-1 Distribution of Samples for Hanoi Metropolitan Area
5-4
THE STUDY FOR BASIC INFORMATION ON THE HOUSING SECTOR IN VIETNAM FINAL REPORT
Source: The Study Team
Figure 5-2 Distribution of Samples for Ho Chi Minh Metropolitan Area
5-5
THE STUDY FOR BASIC INFORMATION ON THE HOUSING SECTOR IN VIETNAM FINAL REPORT
(4) Questionnaire Forms
Questionnaire forms were basically prepared paying attention also to views of Japanese
enterprises planning investment in Vietnam. The questionnaire forms were adjusted and
finalized by ascertaining their appropriateness in view of local cultures and circumstances
suggested by local academics. (For the questionnaire forms, see Appendix 2.)
(5) Collection of Questionnaires
The number of collected samples by metropolitan area and sphere is as shown in Tables 5-2
and 5-3. The questionnaire could quantitatively satisfy the planned targets in both Hanoi
and Ho Chi Minh Metropolitan Areas.
Table 5-2 Collection Result of the Questionnaires for Hanoi Metropolitan Area
Planned Target Number of Collected Samples
(Ratio to the target is parenthesized.)
Face-to
face Web
research Total Face-to face Web research Total
A. Within 5km
1,000 1,044
(104%)336
(-) B. 5 ~ 10km
600 1,000 2,600
745(124%)
694 (-)
2,819(108%)A.1,380B.1,439
C. 10 ~ 20km
200 - 200205
(103%)-
205(103%)
D. 20km and more
200 - 200219
(110%)-
219(110%)
Total* 2,000 1,000 3,0002,213
(111%)1,030
(103%) 3,243
(108%)
* 93 samples out of the study area including 54 samples from Hoai Doc, 21 samples from Thanh Tri and 6 samples from Choung My are not included in this table.
Source: The study team
Table 5-3 Collection Result of the Questionnaires for Ho Chi Minh Metropolitan Area
Planned Target Number of Collected Samples
(Ratio to the target is parenthesized.)
Face-to
face Web
research Total Face-to face Web research Total
A. Within 5km
800 797
(100%)486
(-) B. 5 ~ 10km
600 1,000 2,400
606(101%)
544 (-)
2,433(101%)A.1,283B.1,150
C. 10 ~ 20km
400 - 400420
(103%)-
420(103%)
D. 20km and more
200 - 200199
(100%)-
199(100%)
Total* 2,000 1,000 3,0002,022
(101%)1,030
(103%) 3,052
(102%)
* 1 sample from Tan Dinh, Binh Duong Province out of the study area is not included in this table.
Source: The study team
5-6
THE STUDY FOR BASIC INFORMATION ON THE HOUSING SECTOR IN VIETNAM FINAL REPORT
(6) Attributes of Respondents
The total number of samples to be analyzed is summarized as shown below.
Table 5-4 Total Number of Samples to be analyzed Hanoi Metropolitan Area Ho Chi Minh Metropolitan Area
Number of Samples to be analyzed
3,243 3,052
Source: The study team
Attributes of respondents to the questionnaire surveys are as stated below, except for
samples incapable of reading them.
[No. of household members]
Households each having four members prevail in Hanoi Metropolitan Area, accounting for
about 30%. In Ho Chi Minh Metropolitan Area, households with three members occupy
about 30% and those with four members represent almost same percentage. In both of the
metropolitan areas, the total number of households with three and four members is in the
majority. Average number of household members is 3.8 persons in Hanoi Metropolitan
Area and 3.6 persons in Ho Chi Minh Metropolitan Area. That is, it is almost same in the
two of them.
According to the 2009 census1, average number of households is 3.7 persons in Hanoi City
and 3.9 persons in Ho Chi Minh City. This shows nearly same figure as the aforesaid
attributes of the respondents.
0% 10% 20% 30% 40% 50% 60% 70% 80% 90% 100%
Hanoi Metropolitan
Ho Chi MinhMetropolitan
1 person 2 persons 3 persons 4 persons 5 persons 6 persons and over
Source: The study team
Figure 5-3 Attributes of Respondents: Number of Household Members
[Number of generations in household]
In both of the metropolitan areas, households with two generations show highest ratio.
More than 60% of the total households have two generations. Ho Chi Minh Metropolitan
Area is a little higher in ratio of households with one generation than Hanoi Metropolitan
1 The household size was calculated from the Vietnam Population and Housing Census (PHC) 2009.
5-7
THE STUDY FOR BASIC INFORMATION ON THE HOUSING SECTOR IN VIETNAM FINAL REPORT
Area.
0% 10% 20% 30% 40% 50% 60% 70% 80% 90% 100%
Hanoi Metropolitan
Ho Chi MinhMetropolitan
Single generation Two generation Three generation Four generation
Source: The study team
Figure 5-4 Attributes of Respondents: Number of Generations in Household
[Type of Household]
In both of the metropolitan areas, households consisting of married couple with own
children, the eldest 18 years old and over constitute the largest proportion, except for others
(miscellaneous classification). This type of household in Hanoi Metropolitan Area is
higher than that in Ho Chi Minh Metropolitan Area, accounting for about 20%. Ratios of
household types: alone (single), married couple with own children, married couple with own
children (the eldest under 6 years old), married couple with own children (the eldest 6 to 12
years old), and married couple with own children (the eldest 13 to 17 years old) do not
reveal remarkable difference between the two of the metropolitan areas.
0% 10% 20% 30% 40% 50% 60% 70% 80% 90% 100%
Hanoi Metropolitan
Ho Chi MinhMetropolitan
AloneMarried couple without own childrenMarried couple with own children,tha eldest under 6 years oldMarried couple with own children,tha eldest 6 to 12 years oldMarried couple with own children,tha eldest 13 to 17 years oldMarried couple with own children,tha eldest 18 years old and overHouseholder with , no spouse present , with own childrenMarried couple with own children and parent(s)Householder with parent(s)Others
Source: The study team
Figure 5-5 Attributes of Respondents: Type of Household
5-8
THE STUDY FOR BASIC INFORMATION ON THE HOUSING SECTOR IN VIETNAM FINAL REPORT
[Income of Household]
There is a considerable difference in income of household between Hanoi Metropolitan Area
and Ho Chi Minh Metropolitan Area. A majority of households in Hanoi Metropolitan
Area has income of VND 10,001 x 103 to 12,500 x 103 per month (converted into 500,000 to
600,000 yen/year as 0.0045 yen = VND 1). In Ho Chi Minh Metropolitan Area, income of
VND 12,501 x 103 to 15,000 x 103 per month has a majority (likewise 600,000 to 700,000
yen/year) and households having income of VND 20,001 x 103 to 25,000 x 103 per month
(1,000,000 to 1,300,000 yen/year) account for about 30%. Thus, it is found that the
proportion of households with high income in respondents of Ho Chi Minh Metropolitan
Area is higher than that in respondents of Hanoi Metropolitan Area.
Household Living Standards Survey (LSS) 20102 shows that the 3rd quintile3 is of more
than about VND 5,000 x 103 per month and more than about VND 6,000 x 103 per month in
Hanoi City and Ho Chi Minh City respectively. If these figures increase to more than
about VND 6,000 x 103 per month and more than about VND 7,000 x 103 per month taking
the price escalation rate as about 20% for these three years after 2010, this survey result
shows that more than approximately 80% of the respondents belong to the 3rd quintile.
Source: The study team
Figure 5-6 Attributes of Respondents: Income of Household
[Age]
Distribution by age has an apparent difference between Hanoi Metropolitan Area and Ho
Chi Minh Metropolitan Area. In Hanoi Metropolitan Area, a ratio of sixties or over is more
than 20% and respondents of forties or over are in a majority. In Ho Chi Minh
2 For details of LSS, see Table 6-1 of Chapter 6. 3 Quintile is one of five equal groups into which a population can be divided according to the distribution of values of a particular
variable. In this, people in view of distribution of income are divided into five groups, each 20% of the whole from the 1st (lowest) to the 5th (highest). So, the 3rd quintile is the medium income group.
Respondents with the 3rd or higher income quintile of Hanoi MA
Respondents with the 3rd or higher income quintile of HCM MA
5-9
THE STUDY FOR BASIC INFORMATION ON THE HOUSING SECTOR IN VIETNAM FINAL REPORT
Metropolitan Area, a ratio of twenties is about 40% and younger generations of thirties or
lower are 60% or over of the respondents. Average age is 41.8 in Hanoi Metropolitan Area
and 35.5 in Ho Chi Minh Metropolitan Area. Thus, it is found that Hanoi Metropolitan
Area has more respondents of older age than those of Ho Chi Minh Metropolitan Area.
Average age of the head of household is 49 in Hanoi Metropolitan Area and 43 in Ho Chi
Minh Metropolitan Area. In the Vietnam Population and Housing Census (PHC) 20094,
the head of household is 46 years old on average in Hanoi Metropolitan Area and 44 years
old on average in Ho Chi Minh Metropolitan Area. Thus, respondents in Hanoi
Metropolitan Area have households with elderly heads than the city average, while those in
Ho Chi Minh Metropolitan Area have households with heads near the city average.
0% 10% 20% 30% 40% 50% 60% 70% 80% 90% 100%
Hanoi Metropolitan
Ho Chi MinhMetropolitan
‐ 19 20‐29 30‐39 40‐49 50‐59 60 +
Source: The study team
Figure 5-7 Attributes of Respondents: Age
[Sex]
In each of the metropolitan areas, proportion of sex is evenly distributed.
0% 10% 20% 30% 40% 50% 60% 70% 80% 90% 100%
Hanoi Metropolitan
Ho Chi MinhMetropolitan
Male Female
Source: The study team
Figure 5-8 Attributes of Respondents: Sex
[Employment status]
In each of the metropolitan areas, answers of Full-time workers and Part-time workers are in
a majority. A ratio of Full-time workers in Ho Chi Minh Metropolitan Area is considerably
larger than that in Hanoi Metropolitan Area. Answers of Retired in Hanoi Metropolitan 4 The average age of the head of household was calculated from the Vietnam Population and Housing Census (PHC) 2009.
5-10
THE STUDY FOR BASIC INFORMATION ON THE HOUSING SECTOR IN VIETNAM FINAL REPORT
Area are over 20% of the total.
0% 10% 20% 30% 40% 50% 60% 70% 80% 90% 100%
Hanoi Metropolitan
Ho Chi MinhMetropolitan
Full‐time workers Part‐time workers Unemployed Students
Housewives Retired Declined answer
Source: The study team
Figure 5-9 Attributes of Respondents: Employment Status
[Commuting]
In each of the metropolitan areas, use of Motorcycle (Gasoline) shows highest proportion.
Ratio of Car in Hanoi Metropolitan Area is slightly higher than that in Ho Chi Minh
Metropolitan Area. By and large, proportion of commuting means has no significant
difference between the two metropolitan areas.
0% 10% 20% 30% 40% 50% 60% 70% 80% 90% 100%
Hanoi Metropolitan
Ho Chi MinhMetropolitan
Walking Bicycle Motorcycle (Gasoline)Motorcycle (Electric) Car BusTrain Others
Source: The study team
Figure 5-10 Attributes of Respondents: Commuting
[Commuting Time]
0% 10% 20% 30% 40% 50% 60% 70% 80% 90% 100%
Hanoi Metropolitan
Ho Chi MinhMetropolitan
0 Below 30 mins 31 to 45 mins 46 to 60 mins Over 60 mins
Source: The study team
Figure 5-11 Attributes of Respondents: Commuting Time
In each of the metropolitan areas, a ratio of Below 30 minutes is highest. If 0 minute
5-11
THE STUDY FOR BASIC INFORMATION ON THE HOUSING SECTOR IN VIETNAM FINAL REPORT
added, it amounts to nearly 80%. A ratio of 0 minute in Ho Chi Minh Metropolitan Area is
a little high in comparison to Hanoi Metropolitan Area. By and large, proportion of
commuting time has no significant difference between the two metropolitan areas.
5.2 Interviews
(1) Purpose and Manner of Interviews
In line with the questionnaire surveys’ purpose of grasping trends in housing development
and housing market and short-term housing demands in the two metropolitan areas,
interviews were carried out by addressing detailed questions to interviewees selected by
theme or income level so as to deepen understanding of the housing state.
Interviewees were classified into Group A and Group B and further into 7 categories (3 in
Group A and 4 in Group B). The planned number of interviewees was 120 persons in total.
Group A
A1: Housing for low income brackets (industrial workers) 20 persons
A2: Housing for low income brackets (social housing)
A3: Home buyer in a new town 20 persons
Group B (Selected from respondents to the questionnaire survey)
B1: Recent home buyer in urban area 20 persons
B2: Respondent who answered “I want to live in a new town” 20 persons
B3: Respondent who answered “I want to conditionally live in a new town” 20 persons
B4: Respondent who answered “I don’t want to live in a new town” 20 persons
In Group A, interviews also to housing managers and salespersons were planned to collect
various actors’ views in addition to dwellers’ ones. Interviews of Group A and Group B
were finally conducted to the persons shown in Tables 5-5 and 5-6 respectively.
5-12
THE STUDY FOR BASIC INFORMATION ON THE HOUSING SECTOR IN VIETNAM FINAL REPORT
Table 5-5 Interviewees of Group A
Category Hanoi Metropolitan Area HCM Metropolitan Area
12 persons 5 person A1 Housing for low income brackets (industrial workers)
MOLEX Inc. in Thang Long Industrial Park - 1 manager (President and
concurrently Factory Manager)
- 5 industrial workers Municipally provided housing for industrial workers in Thang Long Industrial Park - 2 housing management
company staff members - 1 housing manager (NISSEI)- 3 industrial workers
Industrial workers housing provided jointly by HCMC and Taiwanese enterprise, in Tan Thuan Industrial Park - 2 housing managers - 1 housing manager of Hong
Way Co., Ltd. - 2 industrial workers of Hong
Way Co., Ltd.
8 persons 17 persons A2 Housing for low income brackets (social housing) Social housing (lease-
purchased) municipally provided in Long Bien - 2 housing managers - 2 dwellers Social housing (leased) municipally provided in Long Bien - 3 housing managers - 1 dweller
SEJUCO in District 10 - 3 housing managers - 8 dwellers Social housing provided by BECAMEX in Binh Duong - 2 housing managers - 4 dwellers
20 persons (all dwellers) 21 persons A3 Home buyer in a new town Ding Cong New Town
European Overseas Vietnamese Village
Skycity Tower North Linh Dam Linh Dam Island Trung Yen Trung Hoa Nhan Chinh
Phu My Hung in District 7 - 1 salesperson - 2 facility staff members - 1 publicist - 4 dwellers An Khanh An Phu in Dist. 2 - 3 dwellers Thao Dien in District 2 - 5 dwelelrs AROMA in Binh Duong New City - 6 dwellers
Sou ce: The study team r
Table 5-6 Interviewees of Group B
Category Hanoi Metropolitan Area HCM Metropolitan AreaB1 Recent home buyer in urban
area 20 persons 20 persons
B2 Respondent who answered “I want to live in a new town” 27 persons 20 persons
B3 Respondent who answered “I want to conditionally live in a new town”
24 persons 20 persons
B4 Respondent who answered “I don’t want to live in a new town”
29 persons 21 persons
Source: The study team
5-13
THE STUDY FOR BASIC INFORMATION ON THE HOUSING SECTOR IN VIETNAM FINAL REPORT
(2) Inquiry Formats
Articles to be taken up in the interviews are as shown in Table 5-7. For inquiry formats,
see Appendix 2.
Table 5-7 Articles taken up in the Interviews
CategoryA1
CategoryA2
CategoryA3
CategoryB1
CategoryB2
CategoryB3
CategoryB4
Attribute ○ ○ ○
Family ○ ○ ○
Housingconcern
Greatest concernin choosing the house ○ ○ ○ ○ ○ ○
District ○ ○ ○ ○
Ownership of dwelling ○ ○ ○
Type of dwelling ○ ○ ○
Size ○ ○ ○
No. of dwellers ○ ○ ○
Rent, where leased ○ ○ ○
Reason for removal ○ ○ ○
Purchase reason ○ ○ ○
Size ○ ○ ○ ○
No. of dwellers ○
Rent ○
Furnished accommodation ○
Living years so far ○
Intended living years in future ○ ○ ○ ○
Occasion of removal from present, if any ○ ○ ○ ○
Purchase price ○ ○ ○
Financing manner ○ ○ ○ ○ ○ ○
Self-sustaining ratio ○ ○ ○ ○ ○ ○
How to solve shortage, if any ○ ○ ○ ○ ○ ○
Interest rate ○ ○ ○ ○ ○ ○
Bank loan ○ ○ ○ ○ ○ ○
Governmental support ○ ○ ○ ○
Advantage of New Town ○ ○ ○
Attractive place/space in New Town ○
Favorites in New Town ○
Shortcomings of New Town ○
What to be improved ○
Expectation for coming New Towns ○ ○
Preference for New Town ○ ○
・ Allowable commuting time by car or bike ○ ○ ○ ○
・ Improvement for living in New Town
○
(Allowable difference in purchase price)○ ○ ○
Why do you want to live in New Town? ○ ○
Why don't you want to live in New Town? ○Attraction of New Town by publictransport
○
Availability of public transport ○ ○ ○ ○ ○ ○
・ Reason for use of public transport ○ ○ ○ ○ ○ ○
・ Allowable fare ○ ○ ○ ○ ○ ○
・ Reason for refusal of public transport ○ ○ ○ ○ ○ ○
・ Condition to accept public transport ○ ○ ○ ○ ○ ○
THE STUDY FOR BASIC INFORMATION ON THE HOUSING SECTOR IN VIETNAM FINAL REPORT
(3) Interview Results
1/ A1: Housing for low income brackets (industrial workers)
For housing for industrial workers, the interviews were made to the following three groups.
A1a: Factory company
A1b: Housing manager
A1c: Worker as dweller
Table 5-8 Interviewees for A1: Housing for Low Income Brackets (Industrial Workers)
Group Hanoi Metropolitan Area HCM Metropolitan Area
A1a: Factory company
Thang Long Industrial Park - President of MOLEX Inc.
---
Thang Long Industrial Park - Housing managers of
municipally provided housing for industrial workers
Tan Thuan Industrial Park - Housing managers of
housing provided jointly by HCMC and Taiwanese enterprise
A1b: Housing manager
Thang Long Industrial Park - Manager of housing
provided by an employer, Nissei
Tan Thuan Industrial Park - Manager of housing
provided by an employer, Hong Way Co., Ltd.
Thang Long Industrial Park - 5 workers of MOLEX
living in rental housing built by private sector
Tan Thuan Industrial Park - One worker of Hong Way
Co.,Ltd. living in housing (single) for industrial workers
A1c: Worker as dweller
Thang Long Industrial Park - 3 workers of Nissei living
in housing for industrial workers
Tan Thuan Industrial Park - One worker of Hong Way
Co.,Ltd. living in housing (married couple) for industrial workers
Source: The study team
2/ A2: Housing for low income brackets (social housing)
For social housing, the interviews were made to the following two groups.
A2a: Housing manager
A2b: Dweller
5-15
THE STUDY FOR BASIC INFORMATION ON THE HOUSING SECTOR IN VIETNAM FINAL REPORT
Table 5-9 Interviews for A2: Housing for Low Income Brackets (Social Housing)
Group Hanoi Metropolitan Area HCM Metropolitan Area
Long Bien - Manager of social housing
(lease-purchased) municipally provided
District 10 - Mangers of social housing
municipally provided (Authorities and housing investor)
A2a: Housing manager
Long Bien - Manager of social housing
(leased) municipally provided
Hoa Loi, Binh Duong - Managers of social housing
provided by BECAMEX - Vice President of
BECAMEX Tokyu District 10 - Dwellers in social housing
municipally provided
A2b: Dweller Long Bien - Dwellers in social housing
(lease-purchased) municipally provided
- Dweller in social housing (leased) municipally provided
Hoa Loi, Binh Duong - Dwellers in social housing
provided by BECAMEX
Source: The study team
3/ A3: Home buyer in a new town
To ascertain views of a new town, the interviews were made to home buyers in new towns
and relevant salespersons as shown below. Since most of houses or housing units in new
town development are at a high price, these interviews resulted in knowing what views high
income brackets have about housing in general as well as the new town.
A3a: Staff of housing sales company for new development
- Salesperson
- Facility staff
- Publicist
A3b: Dweller
Table 5-10 Interviewees for A3: Home Buyer in a New Town
Group Hanoi Metropolitan Area HCM Metropolitan Area
A3a: Staff of housing sales company for new development
--- Phu My Hung - Salesperson - Facility staff members - Publicist
A3b: Dweller Dinh Cong European Overseas
Vietnamese Village Skycity Tower Linh Dam
Phu My Hung An Phu An Khanh Thao Dien Binh Duong New City
(AROMA)
5-16
THE STUDY FOR BASIC INFORMATION ON THE HOUSING SECTOR IN VIETNAM FINAL REPORT
North Linh Dam Linh Dam Island Trung Yen Trung Hoa Nhan Chinh Yen Hoa Dai Kim
Source: The study team
4/ B: Interviews to persons selected from respondents to the questionnaire survey
To get more information, interviews were made to persons selected from respondents to the
questionnaire survey according to a variety of views or wants. That is, interviewees were
subdivided into B1: Recent home buyer in urban area, B2: Respondent who answered “I
want to live in a new town, B3: Respondent who answered “I want to conditionally live in a
new town,” and B4: Respondent who answered “I don’t want to live in a new town.”
5-17
THE STUDY FOR BASIC INFORMATION ON THE HOUSING SECTOR IN VIETNAM FINAL REPORT
Hanoi Metropolitan Area
THE RESIDENCE FOR WORKER NEAR THANG LONG INDUSTRIAL PARK
THE SOCIAL HOUSING LONG BIEN DISTRICT
TRUNG YEN SKY CITY TOWER
DINH CONGTRUNG HOA NHAN
NOTRH LINH DAM EUROPEAN
OCERSEAS LINH DAM ISLAND
Ho Chi Minh Metropolitan Area
SOCIAL HOUSING: HOA
BINH DUONG NEW CITY
Source: The study team
Figure 5-12 Location Map of Interview Visits
THE RESIDENCE FOR WORKERS NEAR TAN THUAN INDUSTRIAL
PHU MY HUNG
THE SOCIAL HOUSING
AN KHANH AN PHUIndustrial Park
Housing for industrial workers
Social Housing
New Town
5-18
THE STUDY FOR BASIC INFORMATION ON THE HOUSING SECTOR IN VIETNAM FINAL REPORT
5.3 Short-term Housing Demands found through the Questionnaire Surveys and Interviews
Short-term housing demands resulting from the questionnaire surveys and interviews are
summarized and studied in this section. Before entering the study, it should be noted that
respondents and interviewees involved in the questionnaire surveys and interviews do not cover
all income brackets of Hanoi and Ho Chi Minh Metropolitan Areas, but belong to the average
and higher income bracket (the 3rd or over quintile5), judging from incomes of the respondents
and interviewees and boundary values of income quintiles of Vietnam. The following studies
comprise (1) Recent trend in housing purchase, (2) Housing demands, and (3) Demand for
suburban new town connected with city center by public transport (Section 5.4).
Distinct understanding acquired from the questionnaire surveys and interviews is that there is a
remarkable difference between Hanoi and Ho Chi Minh Metropolitan Areas with regard to
concern about housing. That is, people in Hanoi Metropolitan Area tend to expend more
money in housing provision than those in Ho Chi Minh Metropolitan Area, irrespective of no
difference in housing size between the two metropolitan areas. This finding can be ascertained
also by focusing on views of high income brackets of VND 20 million (about 100,000 yen) or
over per month.
According to a comment from the academic of National University of Civil Engineering which
took part in the survey, while possessing excellent housing is keenly regarded as evidence of the
success in the northern Vietnam including Hanoi Metropolitan Area, more money inclined to be
lavished on dishes and goods rather than housing in Ho Chi Minh Metropolitan Area. He
further pointed out that this difference in locality raises housing selling prices in Hanoi
Metropolitan Area compared with Ho Chi Minh Metropolitan Area.
It is considered that difference in life style between Hanoi expending more money in housing as
property and Ho Chi Minh using more money in enjoyment is affecting housing prices.
(1) Recent Trend in Housing Purchase
1/ Price and Size of Housing recently purchased
- Hanoi Metropolitan Area tends to use more money for housing than Ho Chi Minh
Metropolitan Area.
- In Hanoi Metropolitan Area, the size of housing ranges from 31 to 100 m2 and the price is
polarized into the lower group of VND 600- to 1,400-million (about 3- to 7-million yen)
and the higher group of VND 1,800- to 3,000-million (about 9- to 15-million yen).
- In Ho Chi Minh Metropolitan Area, the size of housing ranges from 31 to 100 m2 like
Hanoi Metropolitan Area, and the price centers on VND 600- to 1,000-million (about 3- to
5-million yen). The number of respondents which paid VND 2,000-million (about
10-million yen) or over is extremely small in comparison to Hanoi Metropolitan Area. 5 For quintiles, see Footnote 4 in page 5-9.
5-19
THE STUDY FOR BASIC INFORMATION ON THE HOUSING SECTOR IN VIETNAM FINAL REPORT
- In Vietnam, most of houses and flats are provided without any fixtures and interior
finishing. Therefore, it is impossible to live in them immediately when purchased as in
Japan. To get such a housing price as generalized in Japan, costs of fixtures and interior
finishing have to be added to the purchase price.
- It is said that the feng-shui thought widespread in Vietnam often changes location of
windows or rooms of a detached house according to the owner’s belief.
Hanoi Metropolitan Area Ho Chi Minh Metropolitan Area
Source: The study team
Figure 5-13 Price and Size of Housing purchased in Past Five Years
2/ Housing Purchase by Income Quintile
Income quintiles of the respondents are set out as follows.
The 3rd quintile: Less than VND 10 million/month
The 4th quintile: VND 10- to 18-million/month
The 5th quintile: VND 18 million/month or over, and car owners
This division was determined by increasing the boundary income of Hanoi and Ho Chi
Minh Cities in LSS 20106 by approximately 20% due to the going up prices during these
three years. Since car owners are regarded as high incomers, they were placed in the 5th
quintile irrespective of low incom.
In each of the two metropolitans, as the income quintile rises, they incline to buy more
high-priced items. Particularly in Hanoi Metropolitan Area, this is remarkably found. In
Ho Chi Minh Metropolitan Area, the 5th quintile buys housing equally ranging from low to
6 For details of LSS, see Table 6-1 of Chapter 6.
5-20
THE STUDY FOR BASIC INFORMATION ON THE HOUSING SECTOR IN VIETNAM FINAL REPORT
high price.
Table 5-11 shows to what extent respondents in the 3rd quintile and the 4th quintile purchase
housing at eight times the annual income which is taken as the highest affordable limit and
to what extent respondents in the 5th quintile buy housing of VND 2,000 million (about 10
million yen) or over which will be targeted where Japanese enterprises take part in housing
development of Vietnam.
Table 5-11 Housing Purchase by Income Quintile
Hanoi Metropolitan Area HCM Metropolitan Area
3rd quintile 51.8% for less than VND 1,000 million
63.3% for less than VND 1,000 million
4th quintile 61.9% for less than VND 1,400 million
71.9% for less than VND 1,400 million
5th quintile 38.9% for VND 2,000 million or over 30.8% for VND 2,000 million or over
Source: The study team
Source: The study team
Figure 5-14 Distribution of Price and Size of Housing by Income Quintile (Hanoi
Metropolitan Area)
5-21
THE STUDY FOR BASIC INFORMATION ON THE HOUSING SECTOR IN VIETNAM FINAL REPORT
Source: The study team
Figure 5-15 Distribution of Price and Size of Housing by Income Quintile (Ho Chi
Minh Metropolitan Area)
3/ Relationship between Annual Household Income and Housing Purchase Price
- It affords the key to an understanding of demands for primary residence how much larger
housing prices on sale are compared with annual household income. In each of the two
metropolitan areas, 80% or over of the housing purchase prices are 10 to 12 times as large
as the annual household income and 90% or over are less than 12 times. In line with this,
it is generally known that an appropriate housing price in Japan lies in seven to eight times
as the annual household income.
- As generally reported, it is very difficult to grasp real household incomes of Vietnam
because of other unspecified incomes than wages. This allows no exceptions also to the
questionnaire surveys in this study. However, if the real income is assumed as 20 to 30%
higher than the income obtained from the questionnaire surveys, it is found that most of
the respondents purchase housing at a price seven to eight times as large as the annual
income. So far as this assumption is taken to be reasonable, it is considered that
acquisition of housing is within the reach of the people of Vietnam.
- According to the Comprehensive Urban Development Programme in Hanoi Capital City7
implemented by JICA in 2005, the housing price on sale was dozen times as large as the
annual household income, resulting in placing housing acquisition far beyond the reach of
the people. To grasp the present state 8 years after the previous JICA’s study, it is
necessary to deliberately ascertain what was socio-economically changed and improved.
In this study, it has been found that there is a critical difference in the concept of 7 See Footnote 1 in page 1-1 of Chapter 1.
5-22
THE STUDY FOR BASIC INFORMATION ON THE HOUSING SECTOR IN VIETNAM FINAL REPORT
household income between Vietnam and Japan. That is, while the household income of
Vietnam is got by dividing a total of incomes of household members by the number of
members, that of Japan is a total of incomes of household members. For example, where
a household of married couple with two children has a total income of VND 20 million
from the couple, the household income of Vietnam is VND 5 million and that of Japan is
VND 20 million. Since the household of Vietnam has about four members on average,
the household income from Vietnam has to be multiplied by four to get it in the Japanese
manner. The fact that proportional relationship between the annual household income
and the housing purchase price is considerably different between the previous JICA’s
study result and the present one may be explained to some extent by the said difference in
the concept of household income between Vietnam and Japan.
(Unit: million VND)
Hanoi Metropolitan Area Ho Chi Minh Metropolitan Area Source: The study team
Figure 5-16 Relationship between Annual Household Income and Housing Purchase Price
(2) Housing Demands
1/ Demands and Motives of Housing Acquisition
- Respondents which answered 'planning to buy a house' account for about 55% in Hanoi
Metropolitan Area and about 75% in Ho Chi Minh Metropolitan Area. In each of the two
metropolitan areas, housing demands are high.
- Particularly, twenties and thirties have intense desires to buy houses. As stated in Chapter
6, Vietnam has larger population at ages of twenties and thirties like Japan in 1950s to
1960s. These younger generations desire housing acquisition from motives of marriage
and birth. On the other hand, the middle-aged respondents take accommodation to the
growth of children and improvement of living condition as reasons for housing acquisition.
As in Japan, change of life stage and enhancement of housing quality constitute reasons
for housing acquisition in Vietnam.
- Housing acquisition for investment is 1.5 times more highly desired in Ho Chi Minh
5-23
THE STUDY FOR BASIC INFORMATION ON THE HOUSING SECTOR IN VIETNAM FINAL REPORT
Metropolitan Area than in Hanoi Metropolitan Area. This is more increasingly found in
higher income brackets.
Ha: Why do you need to buy a house?
0% 20% 40% 60% 80% 100%
20 -
25 -
30 -
35 -
40 -
45 -
50 -
55 -
60 -
全体
ageTo live alone
To get married
To have or add achild
To accommodate tothe growth ofchildrenTo be closed to agood school
To go to workplacemore convenientry
To impluve livingcondition
For imvestment
Ho: Why do you need to buy a house?0% 20% 40% 60% 80% 100%
20 -
25 -
30 -
35 -
40 -
45 -
50 -
55 -
60 -
全体
ageTo live alone
To get married
To have or add achild
To accommodate tothe growth ofchildrenTo be closed to agood school
To go to workplacemore convenientry
To impluve livingcondition
For imvestmentTotalTotal
Source: The study team
Figure 5-17 Motives of Housing Acquisition by Age (Parameterized by the sum of plural answers)
2/ Size and Price of Desirable Housing
- For size and price of desirable housing, there is no significant difference between Hanoi
Metropolitan Area and Ho Chi Minh Metropolitan Area as found in answers of purchased
housing. So far as prices are concerned, Hanoi Metropolitan Area desires higher housing
than Ho Chi Minh Metropolitan Area.
- Hanoi Metropolitan Area centers on housing of 31 to 100 m2 at a price of VND 600- to
1,200-million (about 3- to 6-million yen) and that of 51 to 150 m2 at a price of VND
1,800- to 2,500-million (about 9- to 13-million yen).
- Ho Chi Minh Metropolitan Area centers on housing of 31 to 100 m2 at a price of VND
400- to 1,600-million (about 2- to 8-million yen) without convex demands for high-priced
housing.
5-24
THE STUDY FOR BASIC INFORMATION ON THE HOUSING SECTOR IN VIETNAM FINAL REPORT
Hanoi Metropolitan Area Ho Chi Minh Metropolitan Area Source: The study team
Figure 5-18 Size and Price of Desirable Housing
3/ Housing Desirability by Income Quintile
Table 5-12 shows ratios of housing demands specified with prices by income quintile. The
3rd quintile and the 4th quintile give ratios of respondents desiring housing at a price of less
than VND 1,000 million (about 5 million yen) and less than VND 1,400 million (about 7
million yen) respectively, which are equivalent to eight times the annual income which is
taken as the highest purchasable limit. The 5th quintile gives ratios of respondents desiring
housing of VND 2,000 million (about 10 million yen) or over which will be targeted where
Japanese enterprises take part in housing development of Vietnam.
Table 5-12 Housing Desirability by Income Quintile
Hanoi Metropolitan Area HCM Metropolitan Area
3rd quintile Housing demands: 45.9% Respondents desiring housing of less than VND 1,000 million: 37.8%
Housing demands: 69.2% Respondents desiring housing of less than VND 1,000 million: 55.5%
4th quintile Housing demands: 58.5% Respondents desiring housing of less than VND 1,400 million: 47.1%
Housing demands: 71.4% Respondents desiring housing of less than VND 1,400 million: 70.5%
5th quintile Housing demands: 68.7% Respondents desiring housing of VND 2,000 million or over: 48.6%
Housing demands: 78.9% Respondents desiring housing of VND 2,000 million or over: 25.5%
Source: The study team
Based on annual household incomes of the respondents, about 30%8 of respondents falling
on the 3rd quintile and the 4th quintile in Hanoi Metropolitan Area can have
8 For details of these percentages, see Table 6-19 of Chapter 6.
5-25
THE STUDY FOR BASIC INFORMATION ON THE HOUSING SECTOR IN VIETNAM FINAL REPORT
purchasably-priced housing and about 40%, in Ho Chi Minh Metropolitan Area. For the
5th quintile, about 30% of respondents in Hanoi Metropolitan Area can buy purchasable
housing and about 20%, in Ho Chi Minh Metropolitan Area.
Source: The study team
Figure 5-19 Size and Price of Desirable Housing by Quintile (Hanoi Metropolitan Area)
Source: The study team
Figure 5-20 Size and Price of Desirable Housing by Quintile (Ho Chi Minh Metropolitan Area)
4/ Relationship between Annual Household Income and Desired Price
Relationship between annual household income and desired price is considerably different
from the relationship between annual household income and housing purchase price. As
5-26
THE STUDY FOR BASIC INFORMATION ON THE HOUSING SECTOR IN VIETNAM FINAL REPORT
previously described, 80% or over of the actual housing purchase prices are 10 to 12 times
as large as the annual household income and 90% or over are less than 12 times in each of
the two metropolitan areas. On a housing demand basis, however, answers that desired
prices should be below 6 times as large as the annual household income are predominant.
This tendency is more remarkably found in Ho Chi Minh Metropolitan Area.
(Unit: million VND)
Hanoi Metropolitan Area Ho Chi Minh Metropolitan Area
Source: The study team
Figure 5-21 Relationship between Annual Household Income and Desired Price
5/ Raising Money for Housing Purchase
- The twenties and thirties have highest housing demands, but they do not have enough
financial resources to purchase housing. In Vietnam where housing financial and loan
systems have not been sufficiently established, it was one of important focuses in the
questionnaire surveys and interviews to ascertain how to raise money for housing
purchase.
- From the questionnaire surveys and interviews, it can be concluded that resources for
housing purchase are mainly from parents or relatives or from friends or superiors. The
reason for not applying for a bank lies in high interest (15 to 18% in general, partly 12%
for public servants) and regular repayment. Most of interviewees said relatives or friends
ask for neither interest nor punctuality in repaying.
- In the questionnaire surveys themselves, 70% or over of the respondents in Hanoi
Metropolitan Area and 90% or over of those in Ho Chi Minh Metropolitan Area answered
“To borrow from banks or financial institutions.” Although this is apparently
contradictory to the interview results, most of those answered “From parents or friends” or
“From friends or superiors” as well to the question allowing multiple answers. Thus, it
can be judged that, where resources borrowing from parents, relatives, friends or superiors
5-27
THE STUDY FOR BASIC INFORMATION ON THE HOUSING SECTOR IN VIETNAM FINAL REPORT
are insufficient to purchase housing, they choose use of a bank or financial institutions in
Vietnam.
- In the interviews, the study team questioned home buyers in urban area and new towns
about percentage of own money in the purchase price. About 30% of interviewees in
Hanoi Metropolitan Area and 60% or over of those in Ho Chi Minh Metropolitan Area
covered all payments in own money. In the questionnaire surveys, about 70% of the
respondents planning purchase of housing in Hanoi Metropolitan Area and a little over
90% of those in Ho Chi Minh Metropolitan Area intend to make more than half of
payments in own money.
Hanoi Metropolitan Area
Ho Chi Minh Metropolitan Area
Source: The study team
Figure 5-22 Money Raising Manners for Housing Purchase
6/ Attractive Factors in selecting New Housing
- From the questionnaire surveys, most attractive factors in selecting new housing are
“Public safety and order” and “Convenience for public transportation.” Positive response
to public transportation is interesting in view of the fact that motorcycles are extremely
5-28
THE STUDY FOR BASIC INFORMATION ON THE HOUSING SECTOR IN VIETNAM FINAL REPORT
prevalent for transportation.
- Since a new town connected with public transportation and advantages of public
transportation were emphasized in carrying out the questionnaire surveys, it is supposed
that the answer focused on convenience for public transportation. However, since about
60% of the respondents answered the convenience for public transportation as shown in
Figure 5-23, it cannot be denied that the public transportation is expected to some degree.
- Differences in locality can be found by more answers to "Modernized or sophisticated
atmosphere" and "Proximity to a park with enough green and water" in Hanoi
Metropolitan Area and "Proximity to supermarkets or shops for daily necessaries,"
"Proximity to workplace" and "Public safety and order" in Ho Chi Minh Metropolitan
Area.
Source: The study team
Figure 5-23 Attractive Factors in selecting New Housing
5-29
THE STUDY FOR BASIC INFORMATION ON THE HOUSING SECTOR IN VIETNAM FINAL REPORT
5.4 Demands for Suburban New Town connected with City Center by Public Transport
(1) Results of the Questionnaire Surveys
1/ Demands for New Town
Hanoi Metropolitan Area
Ho Chi Minh Metropolitan Area
Source: The study team
Figure 5-24 Demands for New Town
- A ratio of the respondents answering “Want to live in a new town” amounts about 60% of
the respondents in Hanoi Metropolitan Area and about 75% of Ho Chi Minh Metropolitan
Area to such a higher degree than expected. The higher ratio of Ho Chi Minh
Metropolitan Area may be affected by the presence of Phu My Hung, the most successful
new town which was provided by a Taiwanese developer (See Figure 5-31).
- In each of the two metropolitan areas, the younger the respondents are, the more insistent
their answers are on living a new town (“Yes” and “Yes, but conditionally”). Viewed
from the result that positive answers of “Yes,” not including “Yes, but conditionally”
5-30
THE STUDY FOR BASIC INFORMATION ON THE HOUSING SECTOR IN VIETNAM FINAL REPORT
account for more than 30% irrespective of age, a new town is considered to have definite
demands. Likewise, these positive answers are largely shown in younger generations
having household types of single, married couple without own children, married couple
with own children (the eldest under 6 years old), and householder with parent(s).
- Demands for a new town do not depend on the extent of household income. Respondents
ranging from ordinary income level to high income level equally have interests in a new
town.
2/ Expectations for New Town as Residence
- In each of the two metropolitan areas, respondents wanting to live in a new town answer
“Convenience for public transportation,” “Modernized or sophisticated atmosphere” and
“Potable water supply” as attractive factors in selecting a new house. This tendency is
more remarkably found than respondents who did not want to live in a new town.
- In the interviews to persons living in a new town, most of the interviewees chose
"Convenience for public transportation," "Modernized or sophisticated atmosphere" and
"Proximity a park with enough green and water" as the greatest concern in buying a house.
These factors are considered to become planning or appeal points in developing a new
town.
3/ Reasons for wanting to live in New Town
- For respondents wanting to live in a new town, about 80% of them answered "Clean and
comfortable environment” as reasons for living in a new town in each of the two
metropolitan areas.
- In the interviews to persons living in a new town, they complained of existing urban dirty
or unsanitary atmosphere and air pollution due to motorcycles and showed their great
satisfaction with modernized or sophisticated atmosphere, and clean and comfortable
living environment with enough green. Thus, it seems that the new town is selected in
substitution for the inferior urban living environment.
- In Japan in the past, the economy of suburban new towns had been evaluated with regard
to size and price of housing. In Vietnam, advantages of the new town are emphasized
with regard to clean and comfortable environment rather than economy in size and price.
This means also that existing urban centers lie in inferior living environment.
- In addition, a certain degree of attention is paid to price and size of housing in a new town
like Japan. Particularly housing price is highly expected, as detailed in 4/ below.
- 50% of the respondents wanting to live in a new town answered “Convenience for public
transportation” as reasons for living in a new town. However, since public transport has
not been sufficiently provided, most of them did not choose “Convenience for public
5-31
THE STUDY FOR BASIC INFORMATION ON THE HOUSING SECTOR IN VIETNAM FINAL REPORT
transportation” as the most affirmative answer.
Note: White figures show most affirmative factors and black figures, affirmative factors.
Source: The study team
Figure 5-25 Reasons for wanting to live in New Town
4/ Housing expected for New Town
- Specifications of housing expected for a new town is similar to those of housing in urban
area. In Hanoi Metropolitan Area, they wanted to have a little larger size of housing.
- In Hanoi Metropolitan Area, housing in a new town was wanted to be 51 to 150m2 in size
and VND 800- to 1,200 million and VND 1,800- to 3,000-million in price. Compared
with respondents wanting housing in urban area, the price was same and the size was
large*. For the 5th quintile, the price was same and the size was 76 to 200m2, larger than
respondents wanting housing in urban area.
- In Ho Chi Minh Metropolitan Area, housing to be wanted in a new town was 31 to 100 m2
in size and VND 400- to 1,400-million in price. As found for respondents wanting
housing in urban area, the price was remarkably shifted to lower side in comparison to
Hanoi Metropolitan Area*. Housing expectation of the 5th quintile was almost same as
that of the 3rd and 4th quintiles.
* Characteristics of desirable housing size and price in urban area and new town
Based on answers of the respondents wanting to buy a house, desirable housing size and price were analyzed to clarify differences in location of urban area and new town.
General In each of the two metropolitan areas, answers showing no appreciable differences between housing in urban area and that in new town there occupied approximately half of the whole answers. Descriptions of noticeable characteristics are summarized as follows (See Figures 5-26 and 5-27).
5-32
THE STUDY FOR BASIC INFORMATION ON THE HOUSING SECTOR IN VIETNAM FINAL REPORT
Hanoi Metropolitan Area - Many respondents want more area for housing in new town than for that in urban
area. - For new town, the number of respondents who want low-priced housing with same
size in comparison to urban area is almost equal to that of respondents who want same-priced housing with large size.
- The number of respondents who want larger are for housing in new town is more than that in Ho Chi Minh Metropolitan Area.
- The number of respondents who put size before price is more than that in Ho Chi Minh Metropolitan Area.
- This tendency of giving priority over size is more distinctly found in high income bracket.
Ho Chi Minh Metropolitan Area - For new town, many respondents want low-priced housing with same size in
comparison to housing in urban area. The number of such respondents is more than that in Hanoi Metropolitan Area.
- Respondents in Ho Chi Minh Metropolitan Area give priority over price, contrary to the tendency found in Hanoi Metropolitan Area.
- Giving priority over price is more distinctly found in high income bracket.
【Guide to presentation in Figures 5-26 and 5-27】 Differences of size and price of housing desired in new town from those in urban area are coordinated with plus, minus and zero. Characteristics are expressed by positioning a small circle in a quadrant of a circle. The dimensions of small circle are shown by taking an answer of low-priced, small-sized housing in new town as datum (1.0).
Hanoi Metropolitan Area Ho Chi Minh Metropolitan Area
Source: The study team
Figure 5-26 Characteristics of Desirable Housing Size and Price in Urban Area and New Town
Amount of respondents showing no difference in desirable size and price between new town and urban center.
【price】
【space】
high
low
small large
【price】
【space】
high
low
small large
5-33
THE STUDY FOR BASIC INFORMATION ON THE HOUSING SECTOR IN VIETNAM FINAL REPORT
Hanoi Metropolitan Area Ho Chi Minh Metropolitan Area (for high income bracket) (for high income bracket)
Source: The study team
Figure 5-27 Characteristics of Desirable Housing Size and Price in Urban Area and New Town
(for High Income Bracket)
5/ Use of Public Transport
Hanoi Metropolitan Area
Ho Chi Minh Metropolitan Area
Source: The study team
Figure 5-28 Concern about Public Transport for New Town
【price】
【space】
high
low
small large
Amount of respondents showing no difference in desirable size and price between new town and urban center.
5-34
THE STUDY FOR BASIC INFORMATION ON THE HOUSING SECTOR IN VIETNAM FINAL REPORT
- Over 40% of the respondents wanting to live in a new town chose convenience for public
transport as one of reason for living there in each of the two metropolitan areas. In Hanoi
Metropolitan Area, the ratio was over a half. 30% of the respondents answered that they
would use public transport for commuting. 90% of the respondents affirmatively
answered use of public transport including use depending on fare and occasional use. No
use of public transport was only 10%. Thus, they have high expectation for such public
transport as MRT (Mass Rapid Transit) or bus.
Allowable Fare for MRT
- Allowable maximum MRT fare from home to workplace centered on VND 5,000 (about
25%) and VND 10,000 (about 25%) in Hanoi Metropolitan Area. These ratios amounted
to about 35% by adding answers of same fare as bus fare and about twice as much as bus
fare, which are regarded as equivalent to allowable fare of MRT. In Ho Chi Minh
Metropolitan Area, allowable fare for MRT was VND 10,000 (about 30%) and VND
20,000 (about 30%). These amounts were higher than those of Hanoi Metropolitan Area.
This may show that Ho Chi Minh prefers spending in convenience or comfort instead of no
more investment in housing than necessary.
- In the interviews to high income bracket, allowable fare for MRT was often answered by
comparison with taxi fare in each of the two metropolitan areas. Interviewees in other
income brackets gave answers by comparison with bus, motorcycle taxi, gas cost or
insurance for motorcycle.
Allowable Commuting Time by Public Transport
Hanoi Metropolitan Area
Ho Chi Minh Metropolitan Area
Source: The study team
Figure 5-29 Allowable Commuting Time by Public Transport
5-35
THE STUDY FOR BASIC INFORMATION ON THE HOUSING SECTOR IN VIETNAM FINAL REPORT
- For allowable commuting time by MRT, 80% of the respondents answered less than 30
minutes in each of the two metropolitan areas. Over 60% of them expected commuting
time to be almost same as the present. Part of the respondents saw that, if MRT is taken,
commuters by motorcycle or bus would be able to reach farther places within same time as
the present because of no traffic congestion.
Reasons for expecting MRT
- According to answers, reasons for expecting MRT were punctuality irrespective of traffic
congestion, probable cleanliness, reduction of air pollution due to decrease in motorcycling,
release from difficulties in looking for car park in urban core (from interviewees in high
income bracket), etc. In addition, part of the interviewees pointed out association with
comfort of metros found in Japan, Singapore, Malaysia, etc. Thus, it can be concluded
that expectations for MRT are running high among them.
5-36
THE STUDY FOR BASIC INFORMATION ON THE HOUSING SECTOR IN VIETNAM FINAL REPORT
(2) Interviews to Salespersons, Housing Mangers and Residents about Existing New Town
Phu My Hung, Ho Chi Minh City
Thao Dien, Ho Chi Minh City
AROMA, Binh Duong Province European Overseas Vietnamese Village, Hanoi City
Dinh Cong New Town, Hanoi City
Source: The study team
Figure 5-30 Examples of New Towns
5-37
THE STUDY FOR BASIC INFORMATION ON THE HOUSING SECTOR IN VIETNAM FINAL REPORT
General Master Plan (Saigon South)
Perspective of Phu My Hung New City Center
Housing development in Phu My Hung New City Center
Area: 3,300 ha in total (Saigon South) 409 ha (Phu My Hung New City Center) History: 1993 Investment license granted
1998 Housing sales started 2008 The Convention Center completed 2012 The Crescent Mall completed
Developer: Phu My Hung Corporation, a joint venture between the Central Trading & Development Group of Taiwan and the Government of Ho Chi Minh City
al Trading & Development Group of Taiwan and the Government of Ho Chi Minh City
Source: Phu My Hung Corporation Source: Phu My Hung Corporation
Figure 5-31 Phu My Hung Development Figure 5-31 Phu My Hung Development
5-38
THE STUDY FOR BASIC INFORMATION ON THE HOUSING SECTOR IN VIETNAM FINAL REPORT
Table 5-13 Interviews to Salespersons, Housing Mangers and Residents about Existing
New Town
Inquiries Answers
1 Housing purchase in new town
[Area and Price*] - Condominium: 100 m2 or over, VND 2- to 4-billion
(about 10- to 20- million yen) - Villa (detached house with garden): More than 100
million yen in many cases * Price includes no cost of fixtures and finishing. Many
persons change them even if provided upon purchasing. Therefore, VND 400 million (about 2 million yen) has to be added for living.
2 Attractiveness of new town
- Comfortable living environment with dustless and clean air
- Nearness to water purification plant for ensuring safe and clean water
- Greenery townscape - Sophisticated environment with streets arranged
3 Expectation for public transport
Public transport (MRT) is highly expected. [Attractiveness of public transport] - Safe and clean [Why expected] - Safety and cleanliness due to reduction of motor cycles - Prevention of difficulties in looking for car parks [Issues] - To establish public morals in queuing.
4 Evaluation and sales strategy for new town
[General] Not quite highly evaluated irrespective of many new towns so far. - Distrust in realization - Many rumors about poor quality in concrete, lift,
appliances, etc. - Difference from the planned and expected housing [Sales strategy for Phu My Hung] - No definite image is offered to future residents at selling,
if there is any uncertain part subject to change by completion.
- Accumulation of credit for development by gradually completing housing buildings, not constructing them at a stretch. This approach is deemed useful to prevent bursting ageing of dwellers.
1/ Housing Purchase in New Town
A condominium now provided in a new town which is located in the city center is priced at
VND 2- to 4-billion (about 10- to 20- million yen) for a unit having a floor area of
approximately 100 m2 or over, which ranks in a high class. The price of many villas
(detached houses with garden) amounts to more than 100 million yen. Since housing
5-39
THE STUDY FOR BASIC INFORMATION ON THE HOUSING SECTOR IN VIETNAM FINAL REPORT
prices in Vietnam do not include fixtures and finishing which are often changed even if
provided, at least VND 400 million (about 2 million yen) has to be added for living.
In many cases, it is considered difficult to purchase such a high unit only with their own
regular income. The interviewees, whose most have their own businesses, probably have
informal incomes other than declared. Financial resources of company employees
comprise profits in stock trade, money from parents, capital gains by selling real estates in a
city center, etc. Two thirds of the interviewees in Hanoi Metropolitan Area and three
fourths in Ho Chi Minh Metropolitan Area purchased a 20 million yen priced house only by
the use of own resources.
2/ Attractiveness of New Town
Most of the interviewees who purchased houses in a new town revealed dislike against air
pollution by motorcycles in a city center of Hanoi or Ho Chi Minh, and were pleased with
no dust, clean air and quietness in the new town.
In Thao Dien and An Phu An Khanh near which a water purification plant is located,
residents emphasized advantages in getting clean and safe water. Existing new towns are
highly evaluated with regard to comfortable living environment characterized by air and
water.
3/ Expectation for Public Transport
Public transport is highly expected in view of vibrant development around a station as well
as convenience in use. In addition, they accepted and expected public transport which
reduces motorcycles and produce safety and cleanliness. Most of high incomers
emphasized advantages of public transport because of difficulties in looking for a car park in
the city center. On the other hand, since the public morals in queuing are not kept in
Vietnam, some interviewees were apprehensive for public transport. Thus, moral training
for public transport will have to accompany construction of mass rapid transits.
4/ Evaluation and Sales Strategy of New Town
Many new towns are developed 5 to 10 km apart from the city center. These new towns
are not always highly evaluated because of distrust in realization. In Vietnam, construction
can be sold upon commencement of foundation work. In addition, a completed building is
often considerably different from the planned and expected one.
In the interviews to respondents who showed intentions to live in a new town in the
questionnaire surveys, they often pointed out fear of poor qualities in building structure and
appliances irrespective of great concern about a new town. Therefore, some of high-priced
condominiums are featured by installation of appliances of Japanese or German make
5-40
THE STUDY FOR BASIC INFORMATION ON THE HOUSING SECTOR IN VIETNAM FINAL REPORT
having a high reputation for quality.
On the other hand, as shown in results of the questionnaire surveys, most of the respondents
have high eagerness to live in greenery, silent, clean and sophisticated atmosphere instead of
the densely built, noisy and polluted center of the city. In other words, the new town is
their alternative choice to existing inferior urban environment. Residents who acquired
better environment in the new town derive much satisfaction from new living.
Phu My Hung (Saigon South), a dream new town in Vietnam, is one of the few successful
new towns, which is very famous in Hanoi as well as Ho Chi Minh (See Figure 5-31). One
of reasons for such a fine reputation is having not impaired credit with candidate residents.
That is, the final image shown at selling was realized as planned and, if there is any
uncertain part subject to change by completion, no definite image was offered to future
residents at selling.
In addition, Phu My Hung succeeded in establishing its own brand as well as credit for
development, by annually and steadily completing housing buildings little by little, not
constructing them at a stretch. This sort of approach to housing development is deemed
useful also to prevent bursting ageing of dwellers as generally found in new towns of Japan.
In the questionnaire surveys and interviews, importance of the credit in Vietnam was
recognized afresh. Household appliances, motorcycles and other Japanese products have
been highly evaluated in quality, practice and sincerity so far. Offering credit to the people
of Vietnam is considered to function as a critical key to the high income bracket which will
purchase housing.
(3) Further Inquiries as to Concern about New Town after Questionnaire Surveys
The interviews were carried out to the respondents who consist of B1: Recent (for past five
years) home buyer in urban area, B2: Respondent who answered "I want to live in a new
town," B3: Respondent who answered "I want to conditionally live in a new town,” and B4:
Respondent who answered “I don’t want to live in a new town.” Inquiries to them focused
on manners of raising purchase money, requests for financial system of the government, and
allowable fare for MRT.
Table 5-14 Further Interviews as to Concern about New Town
Inquiries Answers
1 Manners of raising purchase money
[Own money ratio] Hanoi Met. Area: About 60% at own money ratio of 50 to 70% HCM Met. Area: About 60% at own money ratio of 100%- Affordable purchase neither beyond ability nor
dependent on loan is popular in HCM Met. Area. [Solution of shortage of own money]
5-41
THE STUDY FOR BASIC INFORMATION ON THE HOUSING SECTOR IN VIETNAM FINAL REPORT
- Firstly, resources from parents or relatives - Next, resources from bank or the like, with complaints
about high interests [Request for governmental support] - Lower interests and long-term housing loans
2 Public transport (metro and other MRTs)
- Public transport highly expected - Creation of vibrancy around a station - Walkable distance: About 500m from home [Fare] Hanoi Met. Area: - VND 5,000 to 10,000 - Same or about twice as much as bus fare - About 70% of interviewees answered above in total Ho Chi Minh Metropolitan Area: - VND 10,000 to 20,000 (about 60%) Conclusively, this may show that Ho Chi Minh prefers spending in convenience or comfort instead of no more investment in housing than necessary.
1/ Manners of raising Purchase Money
For B1: Recent home buyer in urban area, interviewees who purchased housing at an own
money ratio of 50 to 70% amounted for about 60% in the Hanoi Metropolitan Area and
those who purchased housing in full own money amounted for about 60% in Ho Chi Minh
City. As previously stated, smaller money was expended to housing in Ho Chi Minh
Metropolitan Area than in Hanoi Metropolitan Area. Therefore, housing price was lower
and the ratio of own money was higher in Ho Chi Minh Metropolitan Area. Literally
affordable purchase neither beyond their ability nor dependent on loan is popular as attitude
to life in Ho Chi Minh Metropolitan Area.
This tendency was found also in the own money ratio of future financial plan.
Interviewees who would set an own money ratio at 50% or over amounted to about 70% in
Hanoi Metropolitan Area and they were over 90% in Ho Chi Minh Metropolitan Area. In
each of the two metropolitan areas, shortage of own money is solved by resources from
parents, relatives, friends and bank in decreasing order.
Requests for financial system of the government were granting of lower interests and
long-term housing loans. It is considered that public support like the Government Housing
Loan Corporation in Japan will have to be established particularly for long-term loans.
2/ Public Transport (Metro or Other MRTs)
The high expectation for public transport in the questionnaire surveys was ascertained also
in the interviews. Most of interviewees were expecting many people to come from/to the
area around an MRT station and form it into a vibrant place having restaurants or super
5-42
THE STUDY FOR BASIC INFORMATION ON THE HOUSING SECTOR IN VIETNAM FINAL REPORT
markets.
Many interviewees showed intention to use MRT so far as the fare is reasonable. Reasons
for it were mitigation of traffic congestion in a city center as well as clean trains,
comfortable riding and punctuality.
The study team inquired them of walkable distance with Japanese prejudice that people of
Vietnam would dislike walking. They interestingly replied, “We don’t dislike walking.
We don’t walk so much during the daytime because of sweatiness and uneven street surfaces.
All of us often walk in the evening when it becomes cool. The walkable distance is about
500 m for commuting.” Certainly many people are found walking early morning or in the
evening. Thus, the “dislike” of walking may not prevent wide use of MRT.
Allowable fare for MRT is described in (1) 5/ of Section 5.4.
5.5 Interviews about Housing for Low Income Brackets
(1) Housing for Industrial Workers
Table 5-15 Interviews as to Housing for Industrial Workers
Items Answers/Findings
Tang Long Industrial Park, Hanoi City
Private rental housing [Conditions] - 3 to 4 persons in a room of 10 m2 or so - Roommates: migrants from same rural provinces, co-workers,
married couple with children, etc. - Lavatory and shower, with no kitchen sink - Complaints about dirtiness and unpleasant smell - Rent raise is often asked by a housing owner according to
information on pay raise. [Issues] - Lease contract cannot be concluded without employment
certificate. So, it is difficult to acquire a dwelling before migrants from rural provinces get a steady job.
- Few real estate businesses deal rental housing for industrial workers. It is necessary for public authorities to support brokerage of rental housing for them.
Municipally provided housing
[Conditions] - 7.3 m2/person in accordance with the municipal standard - Bed room (two double-decker beds), lavatory, shower, kitchen
sink, living/dining space common to roommates - Living room and washing machine space common to dwellers on
same floor (Usage different among renting companies) - A variation of 4-person to 16-person rooms - Restaurants, shops or day nurseries arranged on the ground floor [Issues]
5-43
THE STUDY FOR BASIC INFORMATION ON THE HOUSING SECTOR IN VIETNAM FINAL REPORT
- No regulation for per-capita installation of lavatory, shower or the like brings forth shortage of plumbing capacities, as in 16-person room
- Municipally provided rental housing for industrial workers is limited to whole rental by a company and cannot be supplied to any individual employed by another company.
- Only for single persons. If married, they cannot live there. A high-rise apartment building for married couple is to be completed in December 2013.
Than Tuan Industrial Park, Ho Chi Minh City Housing provided by a company established under the control of the municipal government
- Any individual working in tan Thuan Industrial Park can live.
- Building for married couples - Common dining room,
recreation room, and convenience store
Housing for workers constructed by a Taiwanese enterprise
[Conditions] - 5 m2/capita according to
municipal standards (same as nationally regulated)
- Bed room used also as living space, kitchen sink, lavatory and shower (considerably smaller than examples in Hanoi)
- Provided for married couple [Issues] - Minimum living space with no
free space
- Solely for Hong Way - Units for married couples and
single persons are differentiated by storey.
[Issue] - A unit occupied by two
married couples. No privacy is ensured.
1/ Private Rental Housing for Industrial Workers
A number of industrial workers dwell in a small room of 10 m2 or so occupied by three to
four persons in private rental housing. Roommates are migrants coming from the same
rural provinces, co-workers, married couple with children, etc. Mostly, each of the rooms
has a lavatory and shower, but no kitchen sink. Food is prepared at a common space by the
use of individual stoves. Interviewees complained about the present living environment,
saying “although we wish to escape from this small dirty house giving off unpleasant smell,
we have no enough money to find a better home.”
In addition, it was heard that there were cases where rent raise was often asked by a housing
owner according to information on pay raise. Thus, housing owners are often heavy on
industrial workers as lessees.
Where industrial workers are employed by a company having no dormitory, they have to
look for housing under private ownership and conclude an agreement subject to receipt of an
employment certificate issued by their employer. This means that it is difficult to acquire a
dwelling by the time when migrants from rural provinces get a steady job. And, few real
estate businesses deal rental housing for industrial workers. On the other hand, industrial
workers cannot afford to pay commissions for the businesses if any. Consequently, many
5-44
THE STUDY FOR BASIC INFORMATION ON THE HOUSING SECTOR IN VIETNAM FINAL REPORT
industrial workers are compelled to look for an appropriate dwelling for themselves.
To resolve the aforesaid housing state, it is necessary for
public authorities to support brokerage of rental housing
for them. As in Tang Long Industrial Park of Hanoi
City, some modernized apartment buildings for
industrial workers have been constructed. If they are
changed from whole rental by an employer to individual
rental, the issue will be settled to a large degree.
2/ Municipally Provided Housing for Industrial Workers
in Hanoi City
The municipal government of Hanoi provides housing
for industrial workers in Tang Long Industrial Park,
completed in 2007. The housing located in a site of 20
ha comprises 24 5-storeyed apartment buildings and 3 15-storeyed ones and accommodates
about 9,000 persons in total. The unit size is 7.3 m2/person in accordance with the
municipal standard. This size is at a high grade compared with 2 to 3 m2/person of the
private rental housing referred to in 1/ above.
The housing manager said that room environment was improved through guiding regular
cleaning alternately by roommates and that this resulted in improvement of group living
moral.
Dwellers expressed satisfaction with regard to reasonable rent due to employers’ subsidies
and safety. However, enforcement of curfew was disliked particularly by younger dwellers.
They were eager for private rental housing which is not under curfew. In line with this, a
housing manager of Nissei apartment building stated below commented that it could be
explained also by unpopularity due to curfew why occupancy of the building could not
exceed 80% or so.
The study team visited a housing building wholly rented by a Japanese company, Nissei
Electric Vietnam Co., Ltd. Living rules, fixtures, etc. are largely different among
companies renting buildings. Interviewees dwelled in 4-person and 8-person rooms.
Nissei apartment building has 16-person room as well. As previously stated, the room area
was as specified by the municipal design standards. Since the standards have no
regulations for per-capita installation of lavatory, shower or the like, their number is only
one even in 16-person room. Thus, many interviewees complained about plumbing
capacities in rooms.
This sort of rental housing wholly rented by a company cannot be provided to any individual
employed by another company. A high-rise apartment building for married couple which
Source: The study team
Figure 5-32 Typical Private Rental Housing for Industrial Workers
5-45
THE STUDY FOR BASIC INFORMATION ON THE HOUSING SECTOR IN VIETNAM FINAL REPORT
is to be completed in December 2013 can be rented by individuals irrespective of
employment. In Tan Thuan Industrial Park of Ho Chi Minh City, rental housing for
industrial workers provided by SADECO receives any person working in the industrial park.
Its occupancy is over 90%. As for housing for industrial workers, it is deemed necessary
to provide housing for various types of households including individual workers.
Convenience for living in housing area is met to some degree by restaurants, shops or day
nurseries on the ground floor.
5-storeyed apartment building, wholly rented by Nissei Electric Vietnam Co., Ltd.
Dining kitchen (Four-person room)
Bed space (Four-person room)
Lavatory, shower
Washing machine space for common use
15-storeyed apartment building for married couple, to be completed in December 2013
Shop on the ground floor
Source: The study team
Figure 5-33 Municipally Provided Housing for Industrial Workers in Hanoi
3/ Housing for Industrial Workers in Ho Chi Minh City
In Ho Chi Minh City, housing for workers in Tan Thuan Industrial Park developed by a
5-46
THE STUDY FOR BASIC INFORMATION ON THE HOUSING SECTOR IN VIETNAM FINAL REPORT
Taiwanese enterprise is provided under the municipal support. That is, three apartment
buildings constructed by SADECO and three ones by two private developers are located in a
site adjacent to Tan Thuan Industrial Park. Land use right of the site is possessed by
SADECO established under the control of the municipal government.
The former apartment buildings by SADECO can be used by any individual working in Tan
Thuan Industrial Park and the latter ones by private developers are applied as company
houses. While the municipally provided housing for industrial workers found in Hanoi are
company houses wholly rented by employers, this example taken up in Ho Chi Minh City
can be individually rented so far as they work in the industrial park.
Source: The study team
Figure 5-34 Housing for Industrial Workers in Tan Thuan Industrial Park,
Ho Chi Minh City
Rooms are provided with an area of 5 m2/capita according to the municipal standard (same
as regulated by the Vietnamese building code). This size is 2/3 smaller than 7.3 m2 found
in Hanoi. As for a four-person room, while the plan in Hanoi secures living/dining/kitchen
space in addition to lavatory with shower, and larger bed room, that in Ho Chi Minh is the
minimum combining kitchen, lavatory with shower, and bed room. This example in Ho
Chi Minh City has no free space, although it is advantageous to be supported by rent subsidy
from an employer.
Bed and kitchen in one room SADECO Apartment Building
RecreBuilding
ation room in SADECO Apartment Convenience store in SADECO Apartment Building
5-47
THE STUDY FOR BASIC INFORMATION ON THE HOUSING SECTOR IN VIETNAM FINAL REPORT
This apartment building has rooms for married couple and single person. A room for
married couple is occupied by two couples and divided by a partition. It is very difficult to
ensure privacy.
Like the example in Hanoi, SADECO’s housing has a certain degree of living convenience,
such as common dining room, recreation room, and convenience store.
By and large, although they complain about such living regulations as curfew, dwellers think
highly of their housing because of safety and few burglaries like examples in Hanoi.
(2) Social Housing
Table 5-16 Interviews as to Social Housing
Items Answers/Findings
Social housing in Hanoi City and Ho Chi Minh City
[Housing] - 40 to 50 m2 in size of unit and VND 500- to 600-million (about 2.5- to
3-million yen) in price - In general, interior finished, except for kitchen to be provided by an
purchaser. - Lease-purchase system comprising down payments of 20% and rents
equivalent to installments to be paid within 20 years. In Hanoi City, if the remaining amount has become incapable of being paid, no rents in past are repaid.
[Beneficiaries of social housing] - In fact, social housing is part of welfare for civil servants, military staff, etc.- Limited housing budget cannot afford to supply social housing to low
income earners or poor households irrespective of the legal definitions of them.
[Actual dwellers] - High living level with new good furniture. They are not like low
incomers. [Others] - Social housing provided for resettlement has inferior quality in construction.
Social housing in Binh Duong Province
[Housing] - 30 m2 in size and VND 100- to 160-million (about 500,000 to 800,000 yen)
in price - 57 m2 unit used jointly for a shop, priced at VND 500 million (about 2.5
million yen) Lease-purchase system. Transferable, but no speculation. [Actual Dwellers] - Having registration and workplace in Binh Duong Province, not prioritizing
civil servants or military staff - Providing low-priced housing as incentives for encouraging and introducing
investment in the province.
5-48
THE STUDY FOR BASIC INFORMATION ON THE HOUSING SECTOR IN VIETNAM FINAL REPORT
Social Housing provided by Hanoi City
Social Housing provide by Ho Chi Minh City
Social Housing in Binh Duong Province
Source: The study team
Figure 5-35 Social Housing in Hanoi City, Ho Chi Minh City and Binh Duong Province
Findings and issues about social housing on which the state and local governments of
Vietnam focus in the housing policy toward low income earners are as described below.
1/ Features of Social Housing in Hanoi City and Ho Chi Minh City
- Social housing provided in each of the two metropolitan areas is 40 to 50 m2 in size of unit
and VND 500- to 600-million (about 2.5- to 3-million yen). These specifications are
almost the same as those for middle class housing stated in Section 4.3 of Chapter 4. In
Vietnam where low-priced housing has little credibility of quality, social housing newly
supplied provides fair quality.
- In fact, however, most of social housing in the two metropolitan areas are supplied to civil
servants for state or municipal government and military staff and serve as part of welfare
for them, not for other low income earners.
5-49
THE STUDY FOR BASIC INFORMATION ON THE HOUSING SECTOR IN VIETNAM FINAL REPORT
- Institutionally social housing in Ho Chi Minh City is provided to (1) civil servants, (2)
military staff, (3) low income earners (tax payable), and (4) poor bracket (no tax payable,
less than VND 1.2 million (about 60,000 yen) in annual income). For (3) and (4),
difficulties in selection or appraisal make little social housing supplied to them.
- Even in Hanoi City or Ho Chi Minh City which is comparatively rich in finance, the
budget for housing is so limited that low income earners or poor households cannot live in
social housing.
- In general, social housing can be purchased as interior finished, except for kitchen to be
provided by a purchaser.
- In social housing visited by the study team, there was found agreeable living with new
good furniture. This reveals that it was for civil servants, not for low income earners.
- On the other hand, social housing has another role in providing resettlement housing
needed for new development. Such social housing for resettlement is decidedly inferior
in quality. In social housing constructed 5 years before, the study team found exterior
walls to have such cracks as allows rainwater penetration and appearance similar to ruins.
Most of interviewees reconciled themselves to the housing quality because of low price of
social housing.
Source: The study team
Figure 5-36 Social Housing in Dinh Cong New Town completed 5 years before
2/ Features of Social Housing in Binh Duong Province
- Social housing in Binh Duong Province accepts any household having their registration
and workplace in the province, not prioritizing civil servants or military staff, under the
state-wide regulations of now living in a house having an average floor area of less than 5
m2/person and so on. The unit size is as small as 30 m2 and the price is VND 100- to
160-million (about 500,000 to 800,000 yen). A 57 m2 unit used jointly for a shop is
priced at VND 500 million (about 2.5 million yen). Different from Hanoi City and Ho
Chi Minh City, Binh Duong Province needs incentives for encouraging and introducing
5-50
THE STUDY FOR BASIC INFORMATION ON THE HOUSING SECTOR IN VIETNAM FINAL REPORT
5-51
investment and provides such low-priced housing for industrial workers accompanying
many factories to be constructed for investment. This results in providing proper social
housing which cannot be supplied by Hanoi and Ho Chi Minh Cities.
3/ Lease-purchase of Social Housing
- Social housing is featured by acquiring it by lease-purchase9 in addition to low price.
Apart from differences in detail among local governments, the lease-purchase comprises
down payment of 20% and rents equivalent to installments for 5 to 7 years (Binh Duong
Province) and 20 years (Hanoi City, Ho Chi Minh City), needing no interests. In Hanoi
City, if the remaining amount has become incapable of being paid, no rents in past are
repaid. In Binh Duong Province, lease-purchased social housing can be transferred to
another household so far as a price is not raised speculatively. The lease-purchase is
highly advantageous to low income earners to purchase housing. Anyone of the
interviewees revealed favorable reception to the lease-purchase. However, it is said that
this purchase system is financial burden to municipal and provincial governments because
of long-term recovery of repayment.
9 For lease-purchase system, see Section 3.3 of Chapter 3. This system has been applied also to middle or high class housing of private
sector since 2011 when housing market has become depressed.
THE STUDY FOR BASIC INFORMATION ON THE HOUSING SECTOR IN VIETNAM FINAL REPORT
6. LONG-TERM PERSPECTIVE OF HOUSING DEMANDS (ESTIMATION OF PURCHASABILITY BASED ON POPULATION AND HOUSEHOLDS IN FUTURE)
6.1 Procedure for Estimation of Population and Household Number
(1) Objectives of Estimation
Estimation in this study has two purposes: furnishing fundamental data useful to get
long-term perspective of housing demands and offering basic data on demands for housing
for low income earners. Firstly future population in Hanoi and Ho Chi Minh Metropolitan
Areas was projected and next household number was estimated as units to purchase housing.
Then, household number by purchasability of housing was estimated by the use of estimated
household number and household income as fundamental data for grasping the amount of
housing demands.
(2) Available Statistical Data for Estimation
To estimate the future population and the coming number of household, the relevant
statistical data established in the past are needed. Therefore, first of all, the available
statistical data were identified based on the statistical data books and databases, which were
open to the public, established and published by the General Statistics Office (GSO) in
Vietnam and the statistics offices in Hanoi City, Vinh Phuoc Province, Ho Chi Minh City
and Binh Duong Province.
According to these published data and the interview with GSO and local statistics offices in
the study area, the estimation method of future population and household number was
examined, and necessary additional data for the estimation were collected through GSO and
local statistics offices.
As a result of the study on the estimation method and collected statistical data, the study
team decided to use the following statistical data for the estimation of future population and
household number.
a. The Vietnam Population and Housing Census (PHC)
b. Household Living Standards Survey (LSS)
c. Statistical Year Book (SYB)
d. Population Projections for Vietnam 2009 – 2049 (PPV)
The outlines of these statistical data are as shown below.
a. The Vietnam Population and Housing Census (PHC)
PHC is a national census taken every ten years in Vietnam. The latest census was carried
out in 2009. In Ho Chi Minh City the complementary survey for population and housing
6-1
THE STUDY FOR BASIC INFORMATION ON THE HOUSING SECTOR IN VIETNAM FINAL REPORT
was conducted in 2004, the intermediate year between 1999 and 2009. Statistical data in
PHC and complementary 2004 data of Ho Chi Minh City were used for the estimation of
future population and household number. Sources of PHC are GSO, and 2004 data of
Ho Chi Minh City were from Municipal Statistics Office.
b. Household Living Standards Survey (LSS)
LSS is a sample survey for living standards taken every two years in Vietnam. The
number of samples of the survey in 2010 was as small as about 2,000 for Hanoi and Ho
Chi Minh Cites each having 1.8 million households, about 700 for Vinh Phuc Province
and about 900 for Binh Duong Province. In addition to disadvantages of such small
samples, statistical data are not available for administrative subsidiary units of provinces
and cities, but for suburban areas and urban areas. This is the only survey in Vietnam
which reveals the income quintile. The LSS data for 2006, 2008 and 2010 were used for
estimation of household number by quintile. The data of ages of household heads and
household number by quintile etc. were obtained from GSO.
c. Statistical Year Book (SYB)
SYB is a data book surveyed and compiled in each of such administrative areas as
provinces and centrally run cities. SYB includes the demographic, industrial and labor
data. SYB data were used for preparation of logistics curves for the estimation of
population. These data were purchasable in book stores of every statistics office.
d. Population Projections for Vietnam 2009 – 2049 (PPV)
PPV is a study on the population projection for Vietnam conducted by GSO in
cooperation with United Nations Population Fund (UNFPA). The study was made
mainly by the use of the PHC data in 2009. The result of the study on the projected
population of cities and provinces by age and sex up to 2034 is open to the public on the
website. PPV data were used for developing the population projection for the cities and
provinces of the study area. The PPV data up to 2049 were obtained from GSO.
(3) Subdivision of the Estimation Area
1/ Estimation of Population and Household Number
The smaller the area for the estimation of population and household number is, the greater
the error of estimation is. Therefore, appropriate study areas for the estimation were set
out by taking into account both the reduction of error of estimation and the effective conduct
of the survey. The administrative boundaries of the statistical data obtained in the study
are not always equal to the present boundaries because of changes afterwards. In
consideration of these changes and the areas where the questionnaire surveys were
6-2
THE STUDY FOR BASIC INFORMATION ON THE HOUSING SECTOR IN VIETNAM FINAL REPORT
conducted, the estimation areas in the study area were set out as follows:
Hanoi City: Four areas (Area 1 - Area 4)
Area 1: Within 5km from the city center of the city
(P_Ha-A1) Ba Dinh (P_Ha-A2) Hoan Kiem (P_Ha-A3) Dong Da (P_Ha-A4) Hai Bai Trung
Area 2: Between 5km and 10km from the center of the city
(P_Ha-B1) Tay Ho (P_Ha-B2) Long Bien (P_Ha-B3) Cau Giay (P_Ha-B4) Hoang Mai (P_Ha-B5) Thanh Xuan (P_Ha-B6) Tu Liem (P_Ha-B7) Gia Lam
Area 3: Between 10km and 20km from the center of the city
(P_Ha-C1) Dong Anh
Area 4: Beyond 20km from the center of the city
(P_Ha-D1) The area of Hanoi City, excluding Area 1, Area 2 and Area 3
Vinh Phuc Province: Two areas (Area 1 and Area 2)
Area 1: Area where the population is concentrated1
(P_Vi-A1) Vinh Yen, Vinh Phuc Province (P_Vi-A2) Phuc Yen, Vinh Phuc Province
Area 2: Other areas of the province excluding Area 1
(Pu_Vi-B1) Others, Vinh Phuc Province
Ho Chi Minh City: Four areas (Area 1 to Area 4)
Area 1: Within 5km from the center of the city
(P_Ho-A1) District 1 (P_Ho-A2) District 3 (P_Ho-A3) District 4 (P_Ho-A4) District 5 (P_Ho-A5) District 10 (P_Ho-A6) Phu Nhuan District (P_Ho-A7) Binh Thanh District
Area 2: Between 5km and 10km from the center of the city
(P_Ho-B1) District 2 (P_Ho-B2) District 6
1 ‘Area where the population is concentrated’ is different from DID (Densely Inhabited District) which is defined in the census of Japan.
This area literally means administrative units where population is concentrated.
6-3
THE STUDY FOR BASIC INFORMATION ON THE HOUSING SECTOR IN VIETNAM FINAL REPORT
(P_Ho-B3) District 7 (P_Ho-B4) District 8 (P_Ho-B5) District 11 (P_Ho-B6) Go Vap District (P_Ho-B7) Tan Binh District (P_Ho-B8) Tan Phu District
Area 3: Between 10km and 20km from the center of the city
(P_Ho-C1) District 9 (P_Ho-C2) District 12 (P_Ho-C3) Thu Duc District (P_Ho-C4) Binh Tan District
Area 4: Beyond 20km from the center of the city
(P_Ha-D1) The area of Ho Chi Minh City, excluding Area 1, Area 2 and Area 3
Binh Duong Province: Two areas (Area 1 and Area 2)
Area 1: Area where the population is concentrated
(P_Bi-A1) Di An, Binh Duong Province (P_Bi-A2) Thuan An, Binh Duong Province (P_Bi-A3) Thu Dau Mot, Binh Duong Province
Area 2: Other areas of the province excluding Area 1
(P_Bi-B1) Others, Binh Duong Province
2/ Estimation of Household Number by Purchasability
The number of households by purchasability becomes the key to long-term perspective of
housing demands. Data on household incomes which are indispensable for this analysis
are covered only by LSS. However, since LSS is a compilation by sampling as stated in
(2) b. of Section 6.1, the number of households by purchasability cannot be estimated by the
use of LSS as data for incomes and households on the basis of the subdivisions applied to
the estimation of population and household number as stated in 1/ above.
Thus, the estimation of household number by purchasability was made using the following
area subdivisions.
Hanoi City and Ho Chi Minh City: Area A (urban area) and Area B (suburban area)
Vinh Phuc Province and Binh Duong Province: One area for each province
Area subdivisions for two kinds of estimation are as shown in Figures 6-1 and 6-2.
6-4
THE STUDY FOR BASIC INFORMATION ON THE HOUSING SECTOR IN VIETNAM FINAL REPORT
Area subdivisions for estimation of population and household number in Hanoi Metropolitan Area: Hanoi City: 4 areas Vinh Phuc Province: 2 areas
Area subdivisions for estimation of household number by purchasability in Hanoi Met. Area: Hanoi City: 2 areas Vinh Phuc Province: 1 area
Source: The study team
Figure 6-1 Area Subdivisions for Estimation in Hanoi Metropolitan Area
6-5
THE STUDY FOR BASIC INFORMATION ON THE HOUSING SECTOR IN VIETNAM FINAL REPORT
Area subdivisions for estimation of household number by purchasability in Ho Chi Minh Metropolitan Area: Ho Chi Minh City: 2 areas Binh Duong Province: 1 area
Area subdivisions for estimation of population and household number in Ho Chi Minh Metropolitan Area: Ho Chi Minh City: 4 areas Binh Duong Province: 2 areas
Source: The study team
6-6
THE STUDY FOR BASIC INFORMATION ON THE HOUSING SECTOR IN VIETNAM FINAL REPORT
Figure 6-2 Area Subdivisions for Estimation in Ho Chi Minh Metropolitan Area
6.2 Outline of Procedures for Estimation
In this section, presuppositions and procedures for the estimation of population and household
number and the estimation of household number by purchasability are outlined including
considerations for processing statistical data. The whole estimation flow is shown at the end
of the section. In this study, the estimation was made for every 5 years during a period from
2009 to 2034.
(1) Presuppositions and Procedures for Estimation of Population and Household Number
A. The estimation is made in such a manner that estimation results will coincide with the
projection results of PPV
While PPV shows projection results for every city and province, this study makes estimation
for areas divided for the study area, i.e., four divisions per city and two divisions per
province. Therefore, the estimation was made in such a manner that the sum of population
projected for a division coincides with the projection of equivalent city or province given in
PPV.
Population was basically estimated according to the change (cohort change ratios2) in
population derived from the past data. This processing has the following two
disadvantages.
1/ There is a possibility that population balance among areas may be disturbed because of
estimation based on population changes in the past 10 years. In other words, areas with
linear and explosive increase in population are liable to occur.
2/ Simple summation of populations estimated for areas does not coincide with the
populations by age group and sex of corresponding areas given in PPV.
To cope with these disadvantages, rapid
population increase of certain areas was
controlled by the use of the theory of logistic
curve3 which is often used to explain the growth
of biological population etc.
0.0
0.5
1.0
1.5
‐20 ‐15 ‐10 ‐5 0 5 10 15 20
Logistic curve
2 ‘Cohort’ means a group of people born in same year (or same period). ‘Cohort change ratio' is a change ratio calculated from actual
population movements in the past for respective cohorts by age group of every 5 years. For example, if the population of people between the ages of 20 and 24 in a certain area is 10,000, this group (cohort) ranges from 25 to 29 years in age in 2009. If the population of people between the ages of 25 and 29 is 11,000, cohort change ratio of this group is 1.10 (11,000 divided by 10,000). Future population can be estimated by the use of the cohort change ratio computed by the past population movements.
3 A logistic curve is obtained as a solution of the differential equation which expresses growth of biological population etc. This equation is underpinned by the principle that the biological reproduction does not keep monotonous or exponential growth in actual environment and that, as saturation begins, the growth slows and stops at maturity. The logistic curve is frequently applied to demography or diffusion of merchandise.
6-7
THE STUDY FOR BASIC INFORMATION ON THE HOUSING SECTOR IN VIETNAM FINAL REPORT
Source: The study team
Figure 6-3 Logistic Curve
Example: Estimation of Population of Four Areas of Ho Chi Minh City
If population of four areas of Ho Chi Minh City is estimated by simple application of the
projection of PPV and cohort change ratio, the unchangeable overall population given by
PPV results in increasing population of suburban areas due to the high increasing ratio and
decreasing population of central areas due to the low increasing ratio. Therefore, estimated
population was corrected by the use of a logistic curve so as to adjust it to real movements,
as shown below.
Correction of estimation of each area by the
f th l i ti
Source: The study team
Figure 6-4 Example of Population Estimation (for Each Area of Ho Chi Minh City)
B. In estimating the number of households from estimated population, the present size and
composition of households in Vietnam will not change drastically in the future.
1/ A ratio of household head number in population of same age by age group and area will
remain the same over a period of time.
2/ Distribution of household size by age group of household head and area will remain the
same over a period of time.
6-8
THE STUDY FOR BASIC INFORMATION ON THE HOUSING SECTOR IN VIETNAM FINAL REPORT
For example of 1/, population of 30 to 34 years in age in the city center of Hanoi will have
the same ratio of household heads in the future as now found. For 2/, the number of
household members of household heads of 30 to 34 years in age living in the city center of
Hanoi will have the same ratio as present.
In the study, the distribution of household size by age group of household head were derived
from statistical data of the PHC 2009. Thus, the number of households estimated in the
study is due to the household composition (relationship between age of household head and
household size) of cities and divided areas in 2009.
(2) Presuppositions and Procedures for Estimation of Household Number by
Purchasability
A. Housing demands of Vietnam is nearing ones for primary residence in 2013.
Household income is an important factor to ascertain housing demands. It is considered
that demands for primary residence (i.e., housing demands excluding ones for investment)
are firstly led by the 5th income quintile4.
According to the questionnaire surveys in the study, 80% or over of the prices of housing
purchased in the past 5 years are 10 to 12 times as large as the annual household income and
90% or over are less than 12 times in each of the two metropolitan areas (See 5.3(1) 3/of
Chapter 5).
In Vietnam, it is difficult to grasp real household income of people. This becomes more
difficult in higher income earners. Judged from the questionnaire survey results and
attributes of respondents, it is supposed that the present 5th income quintile in Hanoi and Ho
Chi Minh City purchases housing at a price not exceeding seven to eight times as large as
the annual income which is generally taken as a purchasable level for primary residence.
In other words, it can be judged that housing demands of Vietnam are nearing ones for
primary residence, not for investment.
Thus, in the study the 5th income quintile in the year of applied statistical data5 was
regarded as a group having relatively high potential for housing purchase. The income
quintile was considered to have interrelationship with housing purchasability on the
assumption that the latest 5th income quintile has highest possibilities of newly purchasing
housing and that the 4th and 3rd income quintiles have second and third highest ones. That
is, the estimation was based on the assumption that the change of the number of households
with housing purchasability could be grasped by estimating the amount of households of the
following five groups belonging to each income quintile in the start year of 2009. 4 Quintile is one of five equal groups into which a population can be divided according to the distribution of values of a particular
variable. In this, people in view of distribution of income are divided into five groups, each 20% of the whole from the 1st (lowest) to the 5th (highest).
5 Statistical data of the LSS 2006 , 2008 and 2010 and the PHC 2009 were applied. For details of computation, see 6.2(2).
6-9
THE STUDY FOR BASIC INFORMATION ON THE HOUSING SECTOR IN VIETNAM FINAL REPORT
Group 1: Having lowest potential (the 1st income quintile in 2009)
Group 2: Having second lowest potential (the 2nd income quintile in 2009)
Group 3: Having medium potential (the 3rd income quintile in 2009)
Group 4: Having second highest potential (the 4th income quintile in 2009)
Group 5: Having highest potential (the 5th income quintile in 2009)
B. Attributive Proportions of households in each quintile will not change to a considerable
degree in the future.
Like the estimation of household number as previously stated, the estimation of household
number by purchasability was made on the presupposition that proportions of households by
attribute (area, age of household head and no. of household members) in each group will not
change to a considerable degree in the future.
Household number by purchasability was estimated in the following manner on the basis of
the income quintile data and household number for the two cities and two provinces from
the LSS 2006, 2008 and 2010 and the estimation of household number.
1/ The data of household number by income quintile, age of household head and household
member number from the LSS 2006, 2008 and 2010 were used for analysis of potential for
housing purchase6.
2/ Proportions of household number by purchasability in household number by income
quintile, age of household head, household member number and area were analyzed from
results of 1/ above.
3/ Household number by purchasability was estimated from results of 2/ and the household
number estimated.
Example of computation for five-person households with heads of 40 to 44 years in age living in
urban area of Hanoi City: (1) proportions of each group of potential for housing purchase were
computed from the LSS data, and (2) household number by purchasability of each group
was estimated by multiplying household number with same attributes (estimated for every
five years from 2009 to 2034) by the said proportions.
For reference, quantile range of annual household incomes in the two cities and two
provinces given in the LSS 2010 are as shown below.
6 The data of household number by income quintile, age of household head and household member number given the LSS 2006, 2008
and 2010 are based on only about 2,000 samples (in 2010). Shortage of the data was interpolated as necessary.
6-10
THE STUDY FOR BASIC INFORMATION ON THE HOUSING SECTOR IN VIETNAM FINAL REPORT
Table 6-1 Quantile Range of Annual Household Incomes (LSS 2010)
(Unit: VND 000/year)
Hanoi City Vinh Phuc Prov. Ho Chi Minh City Binh Duong Prov.
1st Quintile Less than 33,392 Less than 23,694 Less than 49,805 Less than 41,773
5th Quintile More than 143,239 More than 84,613 More than 163,562 More than 118,606
Source: The study team
6-11
THE STUDY FOR BASIC INFORMATION ON THE HOUSING SECTOR IN VIETNAM FINAL REPORT
(3) Flow of the Estimation
The estimation was carried out in the following flow.
A: Estimation of population by area with a logistic curve
B: Estimation of population by area, age and sex with the cohort change ratio
Does sum of population at city/province levels in B coincide with future population by age and sex by city/province from PPV?
Is sum of population by age and sex in B equal to population by area in A?
Estimation of population by area, age group and sex
[Assumption] 1/ A ratio of household head number in population of same age by age group and area will remain the same
over a period of time. 2/ Distribution of household size by age group of household head and area will remain the same over a
period of time.
Estimation of household number by area
Interpolation of data by quintile
[Assumption] Attributes of households in each quintile will depend on age of household head, household size and area and will hardly change over a period of time.
Estimation of household number by purchasability
Statistical Data
SYB 2006, 2008 and 2010
PHC 1999, 2004* and 2009 * Only for HCMC
PPV
PHC 2009
LSS 2006, 2008 and 2010
Convergence
YES
NO
Source: The study team
Figure 6-5 Flow of the Estimation
6-12
THE STUDY FOR BASIC INFORMATION ON THE HOUSING SECTOR IN VIETNAM FINAL REPORT
6.3 Estimation Results
For each of the two cities and two provinces in the study area, the present state, population
projection, estimation results of household number7 and estimation results of household number by
purchasability are stated in this section.
(1) Hanoi City
1/ Present State (from PHC 2009)
Characteristics of population and households by study area of Hanoi City area are as
summarized below.
Table 6-2 Population and Households of Hanoi City (PHC 2009)
Area
Upper: Population (1,000)
Lower: Household no. (1,000)
Population Trend* (Ratio of 2010 to 2005)
Age Distribution (Average Age)
Age Distribution of Household Head (Average Age)
No. of Persons per Household (Average No.)
Total 6,452 1,749
Increasing (1.12)
Late teens to twenties(31 years in age)
Forties (46 years in age)
Four persons (3.7 persons)
Area 1 (~ 5km)
1,039 281
Slightly increasing (1.04)
More forties to fifties than other areas (34 years in age)
More forties or over (50 years in age)
Four persons (3.7 persons)
Area 2 (~ 10km)
1,963 567
Increasing (1.28)
Particularly more late teens to twenties (30 yeas in age)
More twenties (42 years in age)
Mainly four persons, more two persons below than other areas (3.5 persons)
Area 3 (Dong Anh)
333 93
Increasing (1.14)
Late teens to twenties(30 years in age)
More twenties (43 years in age)
Mainly four persons, more two persons below than other areas (3.6 persons)
Area 4 (Others)
3,116 808
Increasing (1.06)
Late teens to twenties(31 years in age)
More forties or over (47 years in age)
Mainly four persons, more five persons or over than other areas (3.9 persons)
* Population trend only is computed from SYB. The degree of increase is expressed as follows: 1.00 to 1.01: Leveling off 1.02 to 1.04: Slightly increasing 1.05 to 1.29: Increasing 1.30 or over: Greatly increasing
Source: The study team
In the survey year of the PHC 2009, Area 4 (Others) has largest population and household
number, and next is followed by Area 2 (~ 10km) and Area 1 (~ 5km).
As shown in Table 6-2, population of Hanoi City as a whole is increasing of late years.
7 The number of households gives estimation results in the study, irrespective of the statistical data from the PHC 2009.
6-13
THE STUDY FOR BASIC INFORMATION ON THE HOUSING SECTOR IN VIETNAM FINAL REPORT
This varies with location; such outskirts as Area 2 (~ 10km) and Area 3 (Dong Anh) reveal
remarked increase in population.
The population structure shows that late teens to twenties have the largest proportion of
population in any area, 5 to 14 years in age being smaller in population (Figure 6-6). This
tendency is almost the same in the two metropolitan areas. It is supposed that the reduction
of population in 5 to 14 years is due to the national population policy implemented in 1990s.
Population pyramid (age-sex structures) of any area is similar to that of Hanoi City as shown
in Figure 6-6, with a few local exceptions that Area 1 (~ 5km) has more elderly population
than other areas.
4.1
3.3
3.2
5.0
5.8
5.0
4.0
3.4
3.0
3.5
2.9
2.0
1.5
1.1
1.0
0.9
0.6
0.6
(4.6)
(3.5)
(3.4)
(4.8)
(5.4)
(4.9)
(4.1)
(3.5)
(3.0)
(3.4)
(2.8)
(1.7)
(1.3)
(1.0)
(0.8)
(0.6)
(0.3)
(0.2)
(10.0) (7.5) (5.0) (2.5) 0.0 2.5 5.0 7.5 10.0
0‐4
5‐9
10‐14
15‐19
20‐24
25‐29
30‐34
35‐39
40‐44
45‐49
50‐54
55‐59
60‐64
65‐69
70‐74
75‐79
80‐84
85 +
Total
(Male) Female
Source:PHC 2009
Figure 6-6 Population Pyramid of Hanoi City (2009)
For age of household head, Area 1 (~ 5km) which is higher in overall age distribution is
higher (50 years on average).
Household heads of Area 2 (~ 10km) and Age 3 (Dong Anh) are younger (42 years and 43
years on average respectively). Areas 2 and 3 have largely 4-person households like
other areas, but slightly more 2-person households (3.5 persons and 3.6 persons on average
respectively).
2/ Population Projection
Population projection of Hanoi City is as shown in Table 6-3 and Figure 6-7.
In Hanoi City as a whole, population in 2034 will amount to 8,383,000, 1.30 times as large
as that in 2009. Population will considerably grow in any area. Particularly, Area 2 (~
10km) and Area 3 (Dong Anh) will show a high increasing ratio of about 40%. For
population number, Area 4 (Others) which has the largest population in 2009 will get
6-14
THE STUDY FOR BASIC INFORMATION ON THE HOUSING SECTOR IN VIETNAM FINAL REPORT
4,027,000 population at an increasing ratio of 1.29 in 2034.
Table 6-3 Population Projection of Hanoi City
(Population in 2014 and later is a ratio to that in 2009.)
THE STUDY FOR BASIC INFORMATION ON THE HOUSING SECTOR IN VIETNAM FINAL REPORT
0
000
000
000
000
000
000
000
000
‐ 19
20‐24
25‐29
30‐34
35‐39
40‐44
45‐49
50‐54
55‐59
60‐64
65‐69
70‐74
75‐79
80‐84
85+
5000
10
15
20
25
30
35
40
45
2009
2014
2024
2034
Area 1(~5km)
0
20000
40000
60000
80000
100000
120000‐ 19
20‐24
25‐29
30‐34
35‐39
40‐44
45‐49
50‐54
55‐59
60‐64
65‐69
70‐74
75‐79
80‐84
85+
2009
2014
2024
2034
Area 2(~10km)
0
5000
10000
15000
20000
25000
‐ 19
20‐24
25‐29
30‐34
35‐39
40‐44
45‐49
50‐54
55‐59
60‐64
65‐69
70‐74
75‐79
80‐84
85+
2009
2014
2024
2034
Area 3(DongAnh)
0
20000
40000
60000
80000
100000
120000
140000
160000
‐ 19
20‐24
25‐29
30‐34
35‐39
40‐44
45‐49
50‐54
55‐59
60‐64
65‐69
70‐74
75‐79
80‐84
85+
2009
2014
2024
2034
Area 4(Others)
0
50000
100000
150000
200000
250000
300000
350000
‐ 19
20‐24
25‐29
30‐34
35‐39
40‐44
45‐49
50‐54
55‐59
60‐64
65‐69
70‐74
75‐79
80‐84
85+
2009
2014
2024
2034
Total
Figure 6-10 shows estimation of household number by area and age of household head of
Hanoi City. In Hanoi City as a whole, most households will have heads aged between 35
and 54 in 2009 and between 40 and 64 years in 2034. Thus, household heads will become
surely aged. For age of household head by area, Area 2 (~ 10km) and Area 3 (Dong Anh)
which now have younger population will shift the age of household head from twenties to
thirties to forties to fifties and Area 1 (~ 5km) which has larger elderly population will have
to accept aged household heads.
Source: The study team
Figure 6-10 Household Number by Age of Household Head of Hanoi City
4/ Estimation of Household Number by Purchasability
Estimation results of household number by purchasability of Hanoi City are as shown in
Figures 6-11 and 6-12.
In the urban center of Hanoi City (Area 1 and Area 2), the number of households will
increase in the order of Group 5 to Group 1. From 2009, that of Group 5 having the
highest purchasability will most greatly increase by 53,000 in 2024 and by 63,000 in 2034.
Household numbers of Groups 4 and 5 which have higher purchasability of housing will
6-18
THE STUDY FOR BASIC INFORMATION ON THE HOUSING SECTOR IN VIETNAM FINAL REPORT
increase by 1.22 in 2024 and 1.26 in 2034 at a ratio of these numbers to those in 2009 (Table
6-5).
Household No. by Purchasability (1,000) Increase of Household No. by Purchasability (1,000)
Source: The study team
Figure 6-11 Household Number by Purchasability of Urban Center (Areas 1 and 2) of Hanoi City
In the outskirts of Hanoi City (Area 3 and Area 4), household numbers of groups which have
lower purchasability of housing will markedly increase contrary to the estimation of the
urban center. Particularly, Group 1 will show a considerable increase of 120,000 to
130,000 households in 2034.
For Group 5 having higher purchasability, although it is quantitatively small, the number of
households will increase by 1.25 times in 2024 and 1.41 times in 2034 at a ratio to that in
2009 (Table 6-5).
Consequently, the urbanized area of Hanoi City will generate housing demands for high
incomers in the future and the outskirts thereof will heighten housing demands for low
income earners.
Household No. by Purchasability (1,000) Increase of Household No. by Purchasability (1,000) Source: The study team
Figure 6-12 Household Number by Purchasability of Outskirts (Areas 3 and 4) of Hanoi City
89
12
98 103 106 110 114
5 139 146 150 153 156
2202 212 216 218 219
9232 247 255 260 263
9
266282 292 298 3023
937 990 1,020 1,040 1,054
0
200
400
600
800
1,000
1,200
09 2014 2019 2024 2029 2034
Year
18
20
23
84
20
Group 5
Group 4
Group 3
Group 2
Group 1
0
5
10
15
20
25
30
35
40
45
50
55
60
65
70
2009 2014 2019 2024 2029 2034
Year
Group 1
Group 2
Group 3
Group 4
Group 5
Area1+ Area 2(~10km) Area1+ Area 2(~10km)
337 356 376 401 430 463
248 262 276 289300
311170
180190
199207
21595
102109
117124
130
5154
5964
6872
900 954
1,010 1,070
1,130 1,191
2009 2014 2019 2024 2029 2034
Year
0
200
400
600
800
1,000
1,200
1,400
Group 5
Group 4
Group 3
Group 2
Group 1
0
20
40
60
80
100
120
140
2009 2014 2019 2024 2029 2034
Year
Group 1
Group 2
Group 3
Group 4
Group 5
Area3+ Area 4(10km~) Area3+ Area 4(10km~)
6-19
THE STUDY FOR BASIC INFORMATION ON THE HOUSING SECTOR IN VIETNAM FINAL REPORT
Table 6-5 Household Number by Area and Purchasability of Hanoi City
(Household number in 2014 and later is a ratio to that in 2009.)
Area Group of Purchasability
Household No.In 2009 (1,000)
2014 2019 2024 2029 2034
Total 843 1.11 1.17 1.21 1.23 1.25
Group 1 89 1.11 1.16 1.20 1.24 1.28
Group 2 125 1.11 1.17 1.20 1.23 1.25
Group 3 182 1.11 1.16 1.19 1.20 1.20
Group 4 209 1.11 1.18 1.22 1.25 1.26
Urban Center
Areas 1 and 2:
~10km
Group 5 239 1.11 1.18 1.22 1.25 1.26
Total 900 1.06 1.12 1.19 1.26 1.32
Group 1 337 1.06 1.12 1.19 1.28 1.38
Group 2 248 1.06 1.11 1.17 1.21 1.26
Group 3 170 1.06 1.11 1.17 1.22 1.26
Group 4 95 1.07 1.16 1.24 1.31 1.38
Outskirts
Areas 3 and 4:
10km~
Group 5 51 1.08 1.16 1.25 1.34 1.41
Source: The study team
(2) Vinh Phuc Province
1/ Present State (from PHC 2009)
Characteristics of population and households by study area of Vinh Phuc Province are as
summarized below.
Table 6-6 Population and Households of Vinh Phuc Provice (PHC 2009)
Area
Upper: Population (1,000)
Lower: Household no. (1,000)
Population Trend* (Ratio of 2010 to 2005)
Age Distribution (Average Age)
Age Distribution of Household Head (Average Age)
No. of Persons per Household
(Average No.)
Total 1,000 266
Slightly increasing (1.02)
Late teens to twenties(31years in age)
Forties (46 years in age)
Four persons (3.8 persons)
Area 1 (Densely populated)
186 57
Increasing (1.12)
More late teens to twenties other than Area 2 (Others) (30 years in age)
Twenties (41 years in age)
Mainly four persons, next three or below person; alone (20%) (3.3 persons)
Area 2 (Others)
814 209
Leveling off** (1.00)
Late teens to twenties (31years in age)
Forties (47 years in age)
Mainly four persons(3.8 persons)
* Population trend only is computed from SYB. The degree of increase is expressed as follows: 1.00 to 1.01: Leveling off 1.02 to 1.04: Slightly increasing 1.05 to 1.29: Increasing 1.30 or over: Greatly increasing
** Slightly increasing after decreasing in 2006
Source: The study team
In the survey year of the PHC 2009, population and household number of Area 1 (Densely
6-20
THE STUDY FOR BASIC INFORMATION ON THE HOUSING SECTOR IN VIETNAM FINAL REPORT
populated) are only 20 to 30% of those of Area 2 (Others).
Vinh Phuc Province as a whole is slightly increasing in population. While population of
Area 1 is increasing, that of Area 2 is leveling off. The age distribution centers on late
teens to twenties in each of Area 1 and Area 2. Population age of Area 1 is slightly less
than that of Area 2. For difference in age between Area 1 and Area 2, there is more
considerable difference in age of household head. The average age of household heads is
41 years in Area 1 and 47 years in Area 2.
The number of household members in Area 2 is larger than that in Area 1.
Conclusively, Area 1 is characterized by younger household heads and more small
households and Area 2, by household heads of late forties and 4-person households like Area
4 of Hanoi City.
2/ Population Projection
Population projection of Vinh Phuc Province is as shown in Table 6-7 and Figure 6-13.
Table 6-7 Population Projection of Vinh Phuc Province
(Population in 2014 and later is a ratio to that in 2009.)
Area
Population projection in
2009 (1,000).
2014 2019 2024 2029 2034
Total 1,000 1.05 1.10 1.14 1.17 1.20
Area 1 (Densely populated) 186 1.06 1.10 1.14 1.17 1.19
Area 2 (~10km) 814 1.04 1.09 1.14 1.17 1.20
Source: The study team
In Vinh Phuc Province as a whole, population will increase by 1.14 times (1,137,000
population) in 2024 and by 1.20 times (1,196,000 population) in 2034, compared with 2009.
The increasing ratio is almost the same in Area 1 and Area 2.
Area 2 will have considerable increase of population, 1.14 times (924,000 population) in
2014 and 1.20 times (974,000 population) in 2034 compared to 2009.
Figure 6-14 shows population pyramids of Vinh Phuc Province. The outskirts of Vinh
Phuc Province also reveal the progress of aging in Area 2 like the estimation results of
Hanoi City.
6-21
THE STUDY FOR BASIC INFORMATION ON THE HOUSING SECTOR IN VIETNAM FINAL REPORT
THE STUDY FOR BASIC INFORMATION ON THE HOUSING SECTOR IN VIETNAM FINAL REPORT
Table 6-9 Household Number by Area and Purchasability of Vinh Phuc Province
(Household number in 2014 and later is a ratio to that in 2009.)
Group of Purchasability
Household No. In 2009 (1,000)
2014 2019 2024 2029 2034
Total 264 1.04 1.08 1.12 1.15 1.19
Group 1 66 1.02 1.05 1.09 1.15 1.21
Group 2 58 1.03 1.05 1.07 1.09 1.11
Group 3 51 1.04 1.08 1.11 1.14 1.17
Group 4 47 1.05 1.10 1.15 1.18 1.21
Group 5 42 1.06 1.12 1.18 1.23 1.26
Source: The study team
(3) Ho Chi Minh City
1/ Present State (from PHC 2009)
Characteristics of population and households by study area of Ho Chi Minh City are as
summarized below.
Table 6-10 Population and Households of Ho Chi Minh City (PHC 2009)
Area
Upper: Population (1,000)
Lower: Household no. (1,000)
Population Trend*
(Ratio of 2010 to 2005)
Age Distribution (Average Age)
Age Distribution of Household Head (Average Age)
No. of Persons per Household
(Average No.)
Total 7,163 1,825
Increasing (1.18)
Late teens to thirties (30 years in age)
Thirties to forties (44 years in age)
Three to four persons (3.9 persons)
Area 1 (~5km)
1,585 377
Leveling off (1.01)
More forties to fifties than other areas (33 years in age)
More forties to sixties (49 years in age)
Three to four persons,More six or over persons than Areas 3 and 4 (4.2 persons)
Area 2 (~10km)
2,619 644
Increasing (1.14)
Late teens to thirties (30 years in age)
Thirties to forties (44y ears in age)
Three to four persons,More six or over persons than Areas 3 and 4 (4.0 persons)
Area 3 (~20km)
1,676 466
Increasing (1.35)
More late teens to twenties than other areas (28 years in age)
Twenties to thirties (39 years in age)
Two to four persons, more two persons than other areas (3.6 persons)
Area 4 (Others)
1,282 338
Increasing (1.29)
Late teens to thirties (30 years in age)
Thirties to forties (44 years in age)
Three to four persons (3.8 persons)
* Population trend only is computed from SYB. The degree of increase is expressed as follows: 1.00 to 1.01: Leveling off 1.02 to 1.04: Slightly increasing 1.05 to 1.29: Increasing 1.30 or over: Greatly increasing
Source: The study team
6-26
THE STUDY FOR BASIC INFORMATION ON THE HOUSING SECTOR IN VIETNAM FINAL REPORT
In the survey year of the PHC 2009, Area 2 (~ 10km) has largest population and household
number, and next is followed by Area 1 (~ 5km) and Area 3 (~ 20km). Areas 4 (Others) is
smallest in both population and household number. As shown in Table 6-10, population of
Ho Chi Minh City as a whole is increasing of late years. This varies with location.
Population of Areas 2 to 4 remarkably increased and that of Area 1 (~ 5km) was leveling off.
Structurally, population by age centers on late teens to twenties in any Area like Hanoi City.
However, there are some differences among areas. In particular, Area 1 (~ 5km) has larger
proportion of population in forties to fifties as found in Hanoi City.
For age of household head, Area 1 (~ 5km) has household heads of considerably higher ages
(49 years on average) than other areas. Area 3 (~ 20km) is lowest in age of household
head (39 years on average) and has more household members than other areas.
2/ Population Projection
Population projection of Ho Chi Minh City is as shown in Figure 6-18 and Table 6-11. In
Ho Chi Minh City as a whole, population will amount to 9,252,000 in 2024 and 9,975,000 in
2034, respectively 1.29 times and 1.39 times as large as that in 2009. Increase in
population is remarkable in any area. In particular, Area 3 (~ 20km) will have the highest
increasing ratio of about 1.6 in 2034. Area 3 reveals also largest increase in population,
747,000 in 2024 and 941,000 in 2034. Area 2 (~ 10km) which is largest in population in
2009 will have almost the same (strictly lower) increase as Area 3 (~ 20km) in 2034
THE STUDY FOR BASIC INFORMATION ON THE HOUSING SECTOR IN VIETNAM FINAL REPORT
Figure 6-21 shows estimation of household number by area and age of household head of
Ho Chi Minh City. In Ho Chi Minh City as a whole, most households will have heads
aged between 35 and 54 in 2009 and between 40 and 64 years in 2034. Thus, aging of
household heads will come definitely.
For age of household head by area, Area 2 (~ 10km) and Area 3(~ 20km) which now have
younger population will shift the age of household head from twenties to thirties to forties to
fifties, and Area 1 (~ 5km) which has larger elderly population will have to accept aged
household heads.
0
50000
100000
150000
200000
250000
300000
350000
‐ 19
20‐24
25‐29
30‐34
35‐39
40‐44
45‐49
50‐54
55‐59
60‐64
65‐69
70‐74
75‐79
80‐84
85+
2009
2014
2024
2034
Total
Source: The study team
Figure 6-21 Household Number by Age of Household Head of Ho Chi Minh City
4/ Estimation of Household Number by Purchasability
Estimation results of household number by purchasability of Ho Chi Minh City are as
shown in Figures 6-22 and 6-23 and Table 6-13. For urban center (Areas 1, 2 and 3) , the
number of households of Group 5 having the highest purchasability will most greatly
increase by 97,000 households (1.3 times) in 2024 and 130,000 households (1.4 times) in
Area1(~5km)
0
20000
40000
60000
80000
100000
120000
‐ 19
20‐24
25‐29
30‐34
35‐39
40‐44
45‐49
50‐54
55‐59
60‐64
65‐69
70‐74
75‐79
80‐84
85+
2009
2014
2024
2034
Area2(~10km)
0
20000
40000
60000
80000
100000
120000
‐ 19
20‐24
25‐29
30‐34
35‐39
40‐44
45‐49
50‐54
55‐59
60‐64
65‐69
70‐74
75‐79
80‐84
85+
2009
2014
2024
2034
Area3(~20km)
0
10000
20000
30000
40000
50000
60000
70000
80000
‐ 19
20‐24
25‐29
30‐34
35‐39
40‐44
45‐49
50‐54
55‐59
60‐64
65‐69
70‐74
75‐79
80‐84
85+
2009
2014
2024
2034
Area4(Others)
6-31
THE STUDY FOR BASIC INFORMATION ON THE HOUSING SECTOR IN VIETNAM FINAL REPORT
2034, compared with 2009. Group 4 second highest in purchasability will increase by
80,000 households (1.26 times) in 2024 and 100,000 households (1.32 times) in 2034.
129 143 146 147 148 149
8192 98 101 103 104
6371 75 77 79 7941
4853 58 62 65
24
2830 31 32 32
337
382 402
415 423 429
2009 2014 2019 2024 2029 2034
Year
0
50
100
150
200
250
300
350
400
450
500
Group 5
Group 4
Group 3
Group 2
Group 1
0
5
10
15
20
25
30
2009 2014 2019 2024 2029 2034
Year
Group 1
Group 2
Group 3
Group 4
Group 5
Area4(Others) Area4(Others)
Household No. by Purchasability (1,000) Increase of Household No. by Purchasability (1,000)
Source: The study team
Figure 6-22 Household Number by Purchasability of Urban Center (Areas 1, 2 and 3) of Ho Chi Minh City
In the outskirts of Ho Chi Minh City (Area 4), Group 1 having the lowest purchasability has
the largest proportion of household number in 2009 and will maintain it in the future.
Concretely, Group 1 will increase by 18,000 households (1.14 times) in 2024 and 20,000
households (1.16 times) in 2034, from 2009.
On the other hand, the increase of Group 5 having the highest purchasability will not exceed
7,000 households in 2024 and 8,000 households in 2034. However, the increasing ratio of
Group 5 will be so high, 1.3 times and 1.34 times in 2024 and 2034 respectively from 2009.
Ho Chi Minh City reveals even larger increase of household number of Group 5 than Hanoi
City. This suggests that housing demands and market in the future will grow more
remarkably in Ho Chi Minh City than in Hanoi City.
Household No. by Purchasability (1,000) Increase of Household No. by Purchasability (1,000)
Source: The study team
Figure 6-23 Household Number by Purchasability of Outskirts (Area 4) of Ho Chi Minh City
269 295 308 316 324 333
283 313 330 340 345 347
303334 353 365 371 375
309344 370 389 401 408
328367
399 425 444 4581,492
1,654 1,762
1,836 1,885 1,922
2009 2014 2019 2024 2029 2034
Year
0
500
1,000
1,500
2,000
2,500
Group 5
Group 4
Group 3
Group 2
Group 1
0
20
40
60
80
100
120
140
2009 2014 2019 2024 2029 2034
Year
Group 1
Group 2
Group 3
Group 4
Group 5
Area1+Area2+ Area 3(~20km) Area1+Area2+ Area 3(~20km)
6-32
THE STUDY FOR BASIC INFORMATION ON THE HOUSING SECTOR IN VIETNAM FINAL REPORT
Table 6-13 Household Number by Area and Purchasability of Ho Chi Minh City
(Household number in 2014 and later is a ratio to that in 2009.)
Area Group of Purchasability
Household No. In 2009 (1,000)
2014 2019 2024 2029 2034
Total 1,492 1.11 1.18 1.23 1.26 1.29
Group 1 269 1.10 1.15 1.18 1.21 1.24
Group 2 283 1.10 1.17 1.20 1.22 1.23
Group 3 303 1.10 1.17 1.20 1.22 1.24
Group 4 309 1.12 1.20 1.26 1.30 1.32
Urban Center
Areas 1, 2
and 3: ~20km
Group 5 328 1.12 1.22 1.30 1.35 1.40
Total 337 1.13 1.19 1.23 1.25 1.27
Group 1 129 1.11 1.14 1.14 1.14 1.16
Group 2 81 1.14 1.22 1.26 1.28 1.29
Group 3 63 1.14 1.20 1.23 1.25 1.26
Group 4 41 1.17 1.29 1.40 1.50 1.58
Outskirts
Area 4: Others
Group 5 24 1.16 1.24 1.30 1.33 1.34
Source: The study team
(4) Binh Duong Province
1/ Present State (from PHC 2009)
Characteristics of population and households by study area of Binh Duong Province are as
summarized below.
Table 6-14 Population and Households of Binh Duong Provice (PHC 2009)
Area
Upper: Population (1,000)
Lower: Household no. (1,000)
Population Trend*(Ratio of 2010 to
2005)
Age Distribution (Average Age)
Age Distribution of Household Head (Average Age)
No. of Persons per Household (Average No.)
Total 1,482 470
Increasing (1.41)
Twenties (28 years in age)
Twentiis (37 years in age)
Two to four persons (3.1 persons)
Area 1 (Densely Populated)
897 298
Increasing (1.45)
Twenties, particularly female (27 years in age)
Twenties (35 years in age)
Two persons (3.0 persons)
Area 2 (Others)
585 172
Increasing (1.34)
Twenties (29 years in age)
Twenties to forties (41 years in age)
2 to four persons (3.4 persons)
* Population trend only is computed from SYB. The degree of increase is expressed as follows: 1.00 to 1.01: Leveling off 1.02 to 1.04: Slightly increasing 1.05 to 1.29: Increasing 1.30 or over: Greatly increasing
Source: The study team
In the survey year of the PHC 2009, population and household number of Area 1 (Densely
populated) are materially larger than those of Area 2 (Others).
Population of Binh Duong Province as a whole is increasing in recent years. As shown in
6-33
THE STUDY FOR BASIC INFORMATION ON THE HOUSING SECTOR IN VIETNAM FINAL REPORT
Table 6-14, population of Area 1 increased by about 1.5 times during the period from 2005
to 2010, and Area 2 revealed smaller, but more than 1.3 times increase.
The age distribution centers on twenties in each of Area 1 and Area 2. Population age of
Area 1 is slightly less than that of Area 2. For difference in age between Area 1 and Area 2,
there is distinct difference in age of household head. The average age of household heads
is 35 years in Area 1and 41 years in Area 2.
The number of household members in Area 2 is larger than that in Area 1. Conclusively,
Area 1 is characterized by younger household heads and more small households and Area 2,
by household heads of early forties and 2 to 4 person households.
2/ Population Projection
Population projection of Binh Duong Province is as shown in Figure 6-24 and Table 6-15.
In Binh Duong Province as a whole, population will increase by 1.63 times (2,418,000
population) and 1.87 times (2,777,000 population) in 2034, compared with 2009.
In 2009, population of Area 1 is 1.5 times as large as that of Area 2. Population increase is
estimated at a high ratio in any area. Area 2 will have a remarkably higher increasing ratio
than Area 1. Population of Area 2 will increase to almost the same as that of Area 1 in
2034.
897 1,118 1,238 1,321 1,382 1,435
585
751
929 1,097
1,232 1,342
1,482
1,869
2,166
2,418
2,614 2,777
0
500
1,000
1,500
2,000
2,500
3,000
2009 2014 2019 2024 2029 2034
Population
Year
Population Projeciton
(BinhDuongProvince:By Logistic Curve & PPV)
Area1
(Densely Inhabited Cities) Area2(Others) Total (Densely populated)
(1,000)
Source: The study team
Figure 6-24 Population Projection of Binh Duong Province
6-34
THE STUDY FOR BASIC INFORMATION ON THE HOUSING SECTOR IN VIETNAM FINAL REPORT
Table 6-15 Population Projection of Binh Duong Province
(Population in 2014 and later is a ratio to that in 2009.)
Area
Population projection in
2009 (1,000).
2014 2019 2024 2029 2034
Total 1,482 1.26 1.46 1.63 1.76 1.87
Area 1 (Densely populated) 897 1.25 1.38 1.47 1.54 1.60
Area 2 (~10km) 585 1.28 1.59 1.88 2.11 2.30
Source: The study team
Figure 6-25 shows population pyramids of Binh Duong Province. While the pyramid
shape of the whole province will be transformed into asterisk, that of Area 2 will be
stationary with same population in every cohort.
6-35
THE STUDY FOR BASIC INFORMATION ON THE HOUSING SECTOR IN VIETNAM FINAL REPORT
Area 1 (Densely populated)
Source: The study team
Figure 6-25 Population Pyramid by Area of Binh Duong Province
3/ Estimation of Household Number
Estimation results of household number of Binh Duong Province are as shown in Table 6-15
and Figure 6-26. Vin Phuc Province as a whole will have 699,000 households in 2024 and
776,000 households, respectively increasing by 1.49 times and 1.66 times compared with
2009.
Area 2 has rather higher increasing ratio of household number than Area 1. The number of
6-36
THE STUDY FOR BASIC INFORMATION ON THE HOUSING SECTOR IN VIETNAM FINAL REPORT
households of Area 2 will increase by 132,000 (1.77 times as large as in 2009) in 2024 and
194,000 households (2.13 times) in 2034. Area 2 will increase to 365,000 households in
2034.
Table 6-16 Household Number of Binh Duong Province
(Household number in 2014 and later is a ratio to that in 2009.)
Area Household
Number in 2009(1,000)
2014 2019 2024 2029 2034
Total 468 1.24 1.39 1.49 1.58 1.66
Area 1 (Densely populated) 297 1.23 1.31 1.34 1.35 1.39
Figure 6-26 Household Number of Binh Duong Province
Figure 6-27 shows estimation of household number by area and age of household head of
Binh Duong Province in 2009, 2014, 2024 and 2034. Most households will have head
aged between 20 and 39 in 2009 and between 40 and 59 in 2034.
In both Area 1 and Area 2, while ages of household heads are on the younger side in 2009,
they will shift from twenties to forties by 2034.
6-37
THE STUDY FOR BASIC INFORMATION ON THE HOUSING SECTOR IN VIETNAM FINAL REPORT
0
20000
40000
60000
80000
100000
120000
140000
160000
‐ 19
20‐24
25‐29
30‐34
35‐39
40‐44
45‐49
50‐54
55‐59
60‐64
65‐69
70‐74
75‐79
80‐84
85+
2009
2014
2024
2034
Total
Source: The study team
Figure 6-27 Household Number by Age of Household Head of Binh Duong Province
4/ Estimation of Household Number by Purchasability
Estimation results of household number by purchasability of Binh Duong Province as a
whole is shown in Figure 6-28 and Table 6-17. Household number of Group 5 having
highest purchasability reveals a significant increase. This tendency is similar to the
increase of the urban center (Areas 1, 2 and 3) of Ho Chi Minh City. Quantitatively, Group
5 will increase by 63,000 households (1.85 times) in 2024 and 90,000 households (2.22
times) in 2034, compared with 2009. For Group 1 having lowest purchasability, such
increase will be 31,000 households (1.25 times) in 2024 and 50,000 households (1.39 times)
in 2034 at most.
Household No. by Purchasability (1,000) Increase of Household No. by Purchasability (1,000) Source: The study team
Figure 6-28 Household Number by Purchasability of Binh Duong Province
0
10
20
30
40
50
60
70
80
90
100
2009 2014 2019 2024 2029 2034
Year
Group 1
Group 2
Group 3
Group 4
Group 5
122 146 151 153 158 170
100124 137 144 148 15291
112125 133 138 143
81
104120 133 141
148
74
96117
137153
164
582
650 699
738 776
0
100
200
300
400
500
600
700
800
900
009 2014 2019 2024 2029 2034
Year
468
2
Group 5
Group 4
Group 3
Group 2
Group 1
0
10000
20000
30000
40000
50000
60000
70000
80000
90000
100000
‐ 19
20‐24
25‐29
30‐34
35‐39
40‐44
45‐49
50‐54
55‐59
60‐64
65‐69
70‐74
75‐79
80‐84
85+
2009
2014
2024
2034
Area1 istricts) (Densely Inhabited D
0
10000
20000
30000
40000
50000
60000
‐ 19
20‐24
25‐29
30‐34
35‐39
40‐44
45‐49
50‐54
55‐59
60‐64
65‐69
70‐74
75‐79
80‐84
85+
2009
2014
2024
2034
Area2(Others) (Densely populated)
6-38
THE STUDY FOR BASIC INFORMATION ON THE HOUSING SECTOR IN VIETNAM FINAL REPORT
Table 6-17 Household Number by Area and Purchasability of Binh Duong Province
(Household number in 2014 and later is a ratio to that in 2009.)
Group of Purchasability
Household No. In 2009 (1,000)
2014 2019 2024 2029 2034
Total 468 1.24 1.39 1.49 1.58 1.66
Group 1 122 1.19 1.23 1.25 1.29 1.39
Group 2 100 1.24 1.37 1.44 1.48 1.52
Group 3 91 1.24 1.38 1.46 1.52 1.58
Group 4 81 1.28 1.49 1.64 1.75 1.82
Group 5 74 1.30 1.58 1.85 2.06 2.22
Source: The study team
6.4 Conclusion of Long-term Perspective on Housing Demands
As stated at the beginning of this chapter, the estimation in this study aims at furnishing fundamental
data to get long-term perspective of housing demands in helping housing development and basic
data on demands for housing for low income earners.
This section conclusively states long-term perspective on these housing demands on the basis of the
estimation results and the findings in the questionnaire surveys and interviews. The statement
focuses on Hanoi City and Ho Chi Minh City8.
The estimation of household number by purchasability was made on the following presuppositions.
- According to the quantile range of annual household incomes from the LSS 2010 (Table 6-1) and
the questionnaire survey results, households belonging to the 5th quintile in Hanoi City and Ho Chi
Minh City of Vietnam in 2013 can purchase own housing at their income level without purpose of
investment.
- Ages of household heads and number of household members estimated from the statistical data of
the LSS 2006 to 2010 will not reveal any significant changes as attributes of households belonging
to every quintile in the future.
(1) Housing Demands of Higher Income Earners
The amount of households with annual incomes of more than VND 2,000 million (10
million yen) which are assumed as the target households of Japanese enterprises of housing
development is estimated in the following manner taking Hanoi City as an example.
In the questionnaire surveys, 68.7% of the respondents probably belonging to the 5th
quintile intended to purchase housing. 48.6% of the respondents so answered wanted to
8 Judged from the quantile range of annual household incomes shown in Table 6-1, while the 5th quintile of Hanoi City and Ho Chi Minh
City has incomes surely nearing demands for primary residence (i.e., housing demands excluding ones for investment), the same quintile of Vinh Phuc Province and Binh Duong Province has not drawn so high incomes as to satisfy demands for primary residence yet. This is the reason why the conclusion pays particular attention to Hanoi City and Ho Chi Minh City.
6-39
THE STUDY FOR BASIC INFORMATION ON THE HOUSING SECTOR IN VIETNAM FINAL REPORT
purchase housing at a price of VND 2,000 (10 million yen) or over. Thus, it is concluded
that 33.4% (68.7% x 48.6%) of the 5th quintile, which generally regarded as the group
having high purchasability, become the target households of development in which Japanese
enterprises will take part.
More quantitatively, the household number of Group 5 having highest potential for housing
purchase is 256,000 within 10km from the city center and 54,000 beyond 10km, amounting
to 310,000 in total. The amount of households capable of purchasing housing priced at
VND 2,000 (10 million yen) or over can be rated at 102,300 (310,000 x 0.33).
The amount of Group 5 having highest purchasability in the 5th quintile of Hanoi City and
Ho Chi Minh City will increase as shown in Table 6-18.
In this connection, the figures given in Table 6-18 are ones estimated on the assumption that
the percentage of the respondents wanting to purchase housing of VND 2,000 million or
over in the questionnaire surveys will not change in the future. In fact, these figures are
considered to further increase as the economy of Vietnam grows.
Table 6-18 Estimated Change of Housing Demands (the 5th Quintile)
Hanoi City Ho Chi Minh City
Desirability ratio of households of the
5th quintile (A) 68.7% 78.9%
Desirability ratio of housing priced at
VND 2,000 million or over (B) 48.6% 25.5%
(A) x (B) 33.4% 20.1%
Household number of Group 5 in
2014 (Urban center and outskirts) 310,000 395,000
Household number of Group 5 in
2024 (Urban center and outskirts) 356,000 456,000
Household number of Group 5 in
2034 (Urban center and outskirts) 374,000 490,000
Hanoi City Ho Chi Minh City
Target volume in 2014 About 100,000 households
(about 5%) About 80,000 households
(about 4%)
Target volume in 2024 About 120,000 households
(about 6%) About 91,000 households
(about 4%) About 125,000 households About 98,000 households
Target volume in 2034 (about 6%) (about 4%)
Note: Percentage in ( ) is a ratio to the whole household number.
Source: The study team
In Table 6-18, housing demands of the 5th quintile in Hanoi City in 2014 is estimated at
about 100,000 households. As for this demand size, Phu My Hung development in Ho Chi
6-40
THE STUDY FOR BASIC INFORMATION ON THE HOUSING SECTOR IN VIETNAM FINAL REPORT
Minh City has provided approximately 12,000 houses or units since 1998 when it appeared.
This means that annual supply amounts to 800 houses or units on average. In Japan, Japan
Housing Corporation (presently reorganized as Urban Renaissance Agency) provided about
50,000 houses or units per year to relieve the housing shortage in 1960s.
Supply (unit)
Source: “Roles of Urban Renaissance Agency” cited from website of Ministry of Land, Infrastructure,
Transport and Tourism, Japan
Figure 6-29 Temporal Change of Supplies from Urban Renaissance Agency of Japan
(2) Housing Demands of the 3rd and 4th Quintiles
Of the households belonging to the 3rd and 4th quintiles of Hanoi City and Ho Chi Minh
City, the amount of Group 3 and Group 4 wanting to purchase at a price corresponding to
less than 8 times as large as annual income which is rated at the upper limit of purchase
price can be estimated as shown below. If housing which can be purchased at the income
level of the 3rd and 4th quintiles is allowed to be defined as affordable housing, this
estimation results reveal demands for affordable housing to a certain degree.
Table 6-19 Estimated Change of Housing Demands (the 3rd and 4th Quintiles)
Hanoi City Ho Chi Minh City
Desirability ratio of households of the
3rd quintile (C) 45.9% 69.2%
Desirability ratio of housing priced at
less than 8 times the annual income (D)37.8% 55.5%
Accumulation up to 2010 Rental housing: Approx. 760,000 unitsSold housing: Approx. 280,000 units
Rental housing
Sold housing
6-41
THE STUDY FOR BASIC INFORMATION ON THE HOUSING SECTOR IN VIETNAM FINAL REPORT
Household number of Group 3 in 2014
(Urban center and outskirts) 382,000 405,000
Household number of Group 3 in 2024
(Urban center and outskirts) 415,000 442,000
Household number of Group 3 in 2034
(Urban center and outskirts) 434,000 454,000
Desirability ratio of households of the
4th quintile (E) 58.5% 71.4%
Desirability ratio of housing priced at
less than 8 times the annual income (F) 47.1% 70.5%
(E) x (F) 27.6% 50.3%
Household number of Group 4 in 2014
(Urban center and outskirts) 334,000 392,000
Household number of Group 4 in 2024
(Urban center and outskirts) 372,000 447,000
Household number of Group 4 in 2034
(Urban center and outskirts) 393,000 473,000
Hanoi City Ho Chi Minh City
Demands for ‘affordable housing’ in
2014 About 159,000 About 353,000
(about 8%) (about 17%)
Demands for ‘affordable housing’ in
2024 About 175,000 About 395,000
(about 8%) (about 18%)
Demands for ‘affordable housing’ in
2034 About 184,000 About 412,000
(about 8%) (about 18%)
Note: Percentage in ( ) is a ratio to the whole household number.
Source: The study team
(3) Housing Demands of Brackets to be publically supported
The amount of Group 1 and Group 2 which desire to purchase in the 1st quintile and the 2nd
quintile which are rated lower in housing purchasability exceeds 600,000 households 10km
apart from the city center of Hanoi and within 10km of the city center of Ho Chi Minh.
These figures amount to about 850,000 households in 2014 and nearly 1 million households
in 2034 in both the cities as a whole. This amount accounts for more than 40% of the
whole households in each of the two cities. In view of these estimation results, it is
necessary to accelerate public support including provision of social housing.
6-42
THE STUDY FOR BASIC INFORMATION ON THE HOUSING SECTOR IN VIETNAM FINAL REPORT
6-43
Table 6-20 Estimated Change of Housing Demands (the 1st and 2nd Quintiles)
(Unit: Household number)
Hanoi City Ho Chi Minh City
~10km 10km or more ~10km 10km or more
232,000 618,000 608,000 235,000 2014
850,000 (about 45%) 843,000 (about 41%)
256,000 690,000 656,000 248,000 2024
946,000 (about 45%) 904,000 (about 40%)
270,000 774,000 680,000 253,000 2034
1,044,000 (about 47%) 933,000 (about 40%)
( ): Percentage of total household number
Source: The study team
For reference, annual income levels of Hanoi City and Ho Chi Minh City in 2010 is as
shown again below. VND 1,000 is rated at 5 yen as in 2013.
Table 6-21 Quantile Range of Annual Household Incomes (LSS 2010)9
(Unit: VND 000/year)
Hanoi City Ho Chi Minh City
Less than 33,392 Less than 49,805 1st Quintile
(Less than about 17,000 yen) (Less than about 24,500 yen)
33,392 to 58,062 49,805 to 71,933 2nd Quintile
(about 17,000 to 29,000 yen) (about 24,500 to 36,000 yen)
3rd Quintile 58,062 to 88,852 71,933 to 103,540
4th Quintile 88,852 to 143,239 103,540 to 163,562
5th Quintile More than 143,239 More than 163,562
Source: The study team
(4) Others
In urban areas, while there lives a large number of groups having high purchasability, larger
elderly population reside within 5km of the city center in each of Hanoi City and Ho Chi
Minh City. As aging enhances in population structure, the necessity to provide housing
helpful for the elderly will increasingly arise.
On the other hand, there lives larger younger population within 5 to 10km from the city
center of Hanoi City and 5km or over apart from the city center of Ho Chi Minh City. It is
anticipated that this population will increase in the future. Therefore, housing demands
resulting from marriage will increase particularly with regard to affordable housing.
9 Same as Table 6-1 of Section 6.1.
THE STUDY FOR BASIC INFORMATION ON THE HOUSING SECTOR IN VIETNAM FINAL REPORT
7. ISSUES OF RELOCATION OF THE PORT AREA OF HO CHI MINH CITY AND SITE REDECELOPMENT
7.1 Housing Supply in the Urban Central Area
It is expected that the urban central area of major cities of Vietnam will continue to keep high
housing demands. In fact, however, the shortage of land supply for redevelopment in existing
built-up areas results in insufficient housing supply and will inevitably remain below the
increasing housing demands.
In this connection, the port functions in the center of Ho Chi Minh City most of which are
planned to be relocated to downstream areas due to new construction of bridges has great
potential for supply of valuable redevelopment land for housing and other urban functions. In
effect, however, relocation program is not smoothly progressed as scheduled because of delay in
construction of port facilities in new sites, access roads thereto, total redevelopment project
scheme, etc.
This chapter identifies issues and obstacles of relocation of the port facilities and redevelopment
of vacated site, and studies approaches to the relocation/redevelopment program as a model
case of housing supply in the urban central area.
7.2 Present Relocation of Port Facilities
Ports located along the Saigon River in the central area of Ho Chi Minh City account for 80%
of water/marine transport in the south of Vietnam. To further enhance port functions from now
on, it is necessary to relocate the present ports to downward places where larger handling areas
can be acquired and larger ships can be landed with greater water depths.
In the present official program, 9 ports in the center of Ho Chi Minh City are planned to be
relocated to three places of Cat Lai, Hiep Phuoc and Cai Mep Thi Vai. Except Saigon New
Port relocated to Cat Lai Port in 2010, most of the said ports in need of relocation have not been
moved.
The City of Ho Chi Minh which intends also to keep the existing port functions within its own
administrative boundaries plans to relocate Saigon Port, Tan Thuan Dong and Veggie Port to
Hiep Phuoc Port which is located in the municipal area. The relocation schedule has not been
determined yet. Hiep Phuoc Port of which the water depth is short will be dredged by an ODA
support of Belgium.
As for Cai Mep Thi Vai Port, it is pointed out that motivations for the relocation remain low
because of the lack of such infrastructure as roads and bridges connecting to the city center and
the delay in construction of Nhon Trach Industrial Park as a hinterland.
7-1
THE STUDY FOR BASIC INFORMATION ON THE HOUSING SECTOR IN VIETNAM FINAL REPORT
Source: JICA, “A Study on the current situation of ports and strategies for optimized port operation in southern Vietnam (Draft Final
Report),” June 28, 2013
Figure7-1 Relocation Program of Ports in the Center of Ho Chi Minh City
Source: JICA, “A Study on the current situation of ports and strategies for optimized port operation in southern Vietnam (Draft Final
Report),” June 28, 2013
Figure7-2 Present Location of Ports in the Center of Ho Chi Minh City
7-2
THE STUDY FOR BASIC INFORMATION ON THE HOUSING SECTOR IN VIETNAM FINAL REPORT
7.3 Issues to be settled for Promotion of Relocation
Issues to be settled for promotion of relocation of the port functions comprise the shortage of
finances which are needed for existing land users to carry out the relocation and the delay in
construction of new port facilities and transport infrastructure connected thereto.
(1) Shortage of Finances for Relocation
In addition to the fatal fact that there are no sufficient available finances for relocation, the
Ministry of Defense (MOD) which possesses land use rights of Saigon New Port and Ba
Son Shipbuilder is bringing about tardy relocation because of its deliberate intention that
the present plots occupied by container port and shipyard would be sold at higher prices to
raise resources for the relocation. Concretely, while MOD asks for higher floor area ratio
than that regulated by the administratively formulated zoning plan, the relevant municipal
authorities oppose it in terms of wholly balanced development in the city and remarkable
impacts on road traffic. Hence, the negotiation between both parties is making slow
progress.
For Saigon Port, it probably seems that the land user (the City of Ho Chi Minh) has
expected to make up the financial deficit with profits from land transaction and their
investment by converting land use purpose of the present plots after relocation. In fact,
however, where the land is converted to use different from the present, land use right has to
be legally returned to the state. Although the City of Ho Chi Minh was thus unwilling to
implement the relocation, the agreement that, where part of the present port functions is left
by newly constructing a passenger terminal in the plots, the existing land use right can be
maintained after relocation was concluded between the Ministry of Transport (MOT) and
the City of Ho Chi Minh in January 2013.
Such favorable circumstances have urgently accelerated the development of Saigon Port in
such a manner that a major developer in Vietnam, Vinh Group1 participates jointly in the
relocation and redevelopment project. A new corporation invested jointly by Saigon Port
Company2 and Vingroup plans to implement construction of port facilities and necessary
infrastructure in and around Hiep Phuoc Port and redevelopment of the vacated plots.
This development principle was permitted by the Prime Minister at the end of November
2013. In determining basic planning conditions of the redevelopment, the municipal
authorities are opposed to increase in floor area ratio requested by the new corporation, as
found in the case of Saigon New Port and Ba Son Shipbuilder stated above. The study
team obtained these new information at an interview with Saigon Port Company on
December 5, 2013. 1 Vingroup is one of the outstanding developers in Vietnam, featured by urban mixed-use development and resort development. Viewed
from Royal City in Hanoi and Vincom Center in Ho Chi Minh City completed in 2013, Vingroup is now active in urban development. 2 Saigon Port Company which works for management and operation of the Saigon Port belongs to the group of Vinalines established as a
state-owned enterprise under the Ministry of Transport.
7-3
THE STUDY FOR BASIC INFORMATION ON THE HOUSING SECTOR IN VIETNAM FINAL REPORT
(2) Lack of Port-oriented Infrastructure in New Ports
As previously stated, the fact that neither access roads and other infrastructure connecting
to the city center nor industrial parks as part of hinterlands have been constructed or
completed discourages relocation of Hiep Phuoc Port and Cai Mep Thi Vai Port.
For Hiep Phuoc Port, it is planned that, after the new corporation composed of Saigon Port
Company and Vingroup is permitted to develop the port area around the middle of 2015
when the access roads are completed taking 18 months starting in January 2014, relocation
of Saigon Port and development of vacated plots will be commenced.
7.4 Development Plans of Sites vacated after the Relocation
Sites vacated after the relocation are planned to be developed as shown below.
Table 7-1 Site Development Plans after the Relocation
Port Relocation Site Development drawn in the City Master Plan
Situation
Saigon New Port Relocated to Cat Lai. Mixed development (residential, commercial) connected to UMRT station
Ba Son Ship Builder
Undecided Mixed development (office, residential, commercial) around UMRT station
Under negotiation between HCMC and MOD for increase in FAR
Saigon Port (Nha Rong-Khanh Hoi)
To be relocated Hiep Phuoc soon.
Office, commercial, residential, passenger terminal, etc.
A new corporation was established jointly with Vinh Group to implement the relocation and development.
Saigon Port (Tan Thuan)
No progress.
Tan Thuan Dong To be relocated to Hiep Phuoc (Indefinite time)
Ben Nghe To be relocated to a port in District 9 (Indefinite time)
VICT Undecided Veggie Port To be relocated to
Hiep Phuoc (Indefinite time)
Lotus Port Undecided
Industrial and other use
Source: The study team
7-4
THE STUDY FOR BASIC INFORMATION ON THE HOUSING SECTOR IN VIETNAM FINAL REPORT
7.5 Redevelopment Principles of Urban Central Vacancy generated by Relocation of Port
Redevelopment principles of urban central vacancy generated by relocation of port functions
are proposed on the basis of the aforesaid present state as shown below.
Development Scheme of a New Port
As known from Saigon New Port which was functionally relocated and Saigon Port of which
the relocation process was ensured, it is deemed effective in facilitating the relocation and
redevelopment related to the port area to carry out construction of relevant infrastructure by
forming a partnership with the private sector at the early state. For example, Vingroup
succeeded in acquiring permission of joint investment in the plots vacated by relocation by
bearing construction of port facilities and transport infrastructure for the new port. This is a
kind of BT (Build Transfer) which features implementation of public works in Vietnam having
no sufficient budget for infrastructure construction. This sort of combination of the carrot
(permission of appetizing redevelopment) and the stick (construction of necessary
infrastructure) is one of productive approaches.
Establishment of Definite Urban Development Process
The aforesaid approach, however, is made in an unclear or uncertain negotiation in view of the
fact that private contribution to public services is transacted between the private and public
sectors without documenting in writing. This conventional practice is hardly accepted by
foreign investors who in general conduct any business on a contract basis. Therefore, the
collateral approach so far should be authorized by a contractual process so as to enable
foreigners to have higher reliability of the transaction.
Creation of Safe and Comfortable Waterfront
Redevelopment of sites vacated by relocation of a port is required to be planned with due
consideration for the location fronting water body, the Saigon River. That is, provision of
open space adjoining the river or public transport (BRT, LRT, water transportation, etc.) should
be ensured by a collateral contract to make the investor contribute to public services for creating
waterfront friendly to citizens. In addition, embankment strengthening, grade raising by land
filling or other solutions should be carried out so as to cope with increasing flood damages
along the Saigon River due to the sea level rise from global warming.
In creating the safe and comfortable waterfront, it is deemed effective to lead developing
investors to draw up appropriate plans in such a manner that the local government formulates a
development guideline and a rule rewarding the corporate contribution to public works. As
previously stated, Saigon Port plans to provide the convenience and vibrancy to waterfront by
allowing Vingroup to participate in development as a trade-off for construction of the passenger
7-5
THE STUDY FOR BASIC INFORMATION ON THE HOUSING SECTOR IN VIETNAM FINAL REPORT
7-6
terminal. On the other hand, this sort of guideline and trade-off rule can play a critical role in
resisting and controlling investors’ claim for relaxing regulations concerning floor area ratio or
developing indices, as found in Saigon New Port or Ba Son Shipbuilder.
THE STUDY FOR BASIC INFORMATION ON THE HOUSING SECTOR IN VIETNAM FINAL REPORT
8. ITEMIZED MATTERS TO WHICH EXPERIENCES IN JAPAN CAN BE APPLIED
8.1 Summary of Housing Issues in Major Cities of Vietnam
As studied for long term demands for housing in major cities of Vietnam in Chapter 6, if it is
assumed that a purchasable housing unit is priced at about 8 times as much as the annual
household income, demands for a unit of VND 2,000 million (10 million yen) class are
estimated at 100 to 120 thousand households of Hanoi City and 80 to 100 thousand households
of Ho Chi Minh City in 2014 through 2034. It is expected that enterprises of Japan will be
able to set the target at this class or higher of housing development.
The said class of housing which is placed at a higher price range in Vietnam will form a leading
project of every city to produce a symbolic townscape, provide green and open space open to
citizens as corporate contribution to public works, or exemplify latest environmental
technologies for Eco-city. On the other hand, where enterprises of Japan take part in housing
development in Vietnam, they will have to present a typical development approach in
accordance with the new regulation that social housing shall be incorporated in any commercial
housing development without exception, as stated in Chapter 3. Saigon South New Town (Phu
My Hung) in Ho Chi Minh City has served as a leading housing development project in
Vietnam. This project revealed a new paradigm of housing development in Vietnam which is
featured by high rise apartment building with high quality, housing area integrated with
comfortable open waterfront, etc.
For a unit of VND 600 to 14,000 million (3 to 7 million yen) class which is considered
affordable to most of households, demands are estimated at 160 to 180 thousand households of
Hanoi City and 350 to 400 thousand households of Ho Chi Minh City. As referred to in
Chapter 4, although supply of the said affordable class of housing has begun of late, it is in
small quantities. In addition, most of the class is not traded in the formal housing market,
resulting in inferior quality.
While it is necessary to enhance the total housing quality of this class, there have been found
few developers or contractors which can supply this sort of class. Most of the housing
developers referred to in Chapter 4 aim to supply high class housing, including the Corporation
of Housing and Urban Development (HUD) and other state-owned developers. Improvement of
the housing sector comprising contractors, housing supplier, developers, etc. and public support
to the housing sector are required to supply affordable housing in the quantity estimated in
Chapter 6. In addition, it is preferred to set up standards for housing construction and
environment so as to ensure the housing quality.
In Chapter 6, the amount of households incapable of purchasing even this class of affordable
housing was forecast to reach as much as 0.85 to 1 million households. They will not be able
to live in this sort of affordable housing without public full support. As previously pointed out,
8-1
THE STUDY FOR BASIC INFORMATION ON THE HOUSING SECTOR IN VIETNAM FINAL REPORT
the present housing policy for low incomers does not effectively work in urban areas of
Vietnam.
Most of social housing is offered only to public employees and military officers. Low income
people essentially needing dwellings hardly live in social housing statutorily provided. In
Hanoi City and Ho Chi Minh City, provision and construction of housing for industrial workers
are municipally supported. This support, however, is limited to such experimental one as
cannot cover a majority of workers in both the cities. As a result, this causes a serious issue
that most of industrial workers live in inferior and too small dwellings provided by the private
sector. Although the VND 30 trillion credit package for social housing has been prepared by
the government in 2013, only a few people are blessed with this institution so far.
According to the issues of urban housing in Vietnam which were thus ascertained in and before
Chapter 6 varying with the income level and the housing price range, matters to be resolved by
the use of expertise, experience and technology of Japan and supported by ODA of Japan are
described below.
8.2 Matters to be resolved by the Use of Expertise, Experience and Technology of Japan
It is considered that policies adopted during the rapid economic growth of Japan will give
useful information on supply of affordable housing or that for severer households.
In urban city centers of Vietnam which are much in housing demand, large-sized land whose
usage is to be converted, such as port areas in Ho Chi Minh City, is expected to be applied to
housing purpose. However, this sort of redevelopment in the city center is very slow. As
stated in Chapter 7, reasons for this delay derive from financial shortage of urban infrastructure
construction in the public sector, lack of incentives to participation of the private sector,
imperfect transparency of the permission process of planning and development, etc.
Experience and know-how in urban redevelopment of Japan have applicable information on
these issues too.
In addition, superior technologies in urban development are useful for various kinds of urban
issues, such as environmental pollution, traffic congestion and energy shortage, which are found
in the city center accompanying the urban explosion of Vietnam.
Thus, approaches to be taken in Vietnam are proposed below on the basis of expertise,
experience and technology of Japan.
(1) Suggestion about Government Housing Policy
During the rapid economic growth of Japan after the World War II, various housing policies
were carried out by the government to cope with a great deal of housing demands and
succeeded in a large amount of housing supply characterized by suburban new towns in
metropolitan regions. The housing policies largely comprise (1) formation of public
8-2
THE STUDY FOR BASIC INFORMATION ON THE HOUSING SECTOR IN VIETNAM FINAL REPORT
housing financial system, (2) provision of rental housing and new towns by public
organizations, and (3) establishment of housing standards and mass production systems.
For (1) formation of public housing financial system, the fact that this sort of financial
system, although already promulgated, does not effectively serve has become known. To
make the system more applicable, the state should take the initiative by providing such a
guideline that a local government at the provincial level which is responsible for operation
of the financial system can implement more uniform and appropriate operation and
cooperate with other local governments.
In Japan, the Government Housing Loan Corporation which was organized in 1950
accommodated 500 thousand households on annual average, playing a major role in support
for public housing supply. Of late, this financial institution enhances functions of
encouraging new policies by providing preferential interests for energy saving housing or
housing for the aged. Most of resources of the corporation originate from postal savings,
social security pension, public loans and other fiscal investment and loan program.
Experience and know-how accumulated in this sort of financial institution will be
considerably useful for supplying a large amount of housing in Vietnam. In 2007, the
Government Housing Loan Corporation was reorganized into Japan Housing Finance
Agency (Independent Administrative Corporation) so as to finance private financial
institutions which have housing activities with difficulties in arranging loans.
For (2) provision of rental housing and new towns by public organizations, Japan enabled
suburban large-sized urban development to successfully function in metropolitan regions by
setting up new towns in respective statutory urban master plans and networking public
transport with the city center. Construction of a new town closely connected with pubic
transport, which is one of urban development approaches originated by Japan, can be
applied to Vietnam. Supply of rental housing by a public financing organization will
become useful know-how to Vietnam which hardly has such rental housing financial system
irrespective of the high housing demands in major cities.
In Japan, Japan Housing Corporation which was established to satisfy eager demand for
housing in 1955 contributed effectively to alleviation of the housing shortage through
supplying about 1.5 million units by 2000. Afterwards according to varying social
demands, the corporation shifted its business focus from a great deal of housing supply to
provision of healthy, cultural and functional urban infrastructure by changing the
corporation name to Housing and Urban Development Corporation and Urban Renaissance
Agency (Independent Administrative Corporation) in 1999 and 2004 respectively. The
said in-depth experience and know-how of the public organization for providing housing
and urban infrastructure in Japan with time will serve for satisfactory construction of
housing and urban infrastructure in Vietnam.
8-3
THE STUDY FOR BASIC INFORMATION ON THE HOUSING SECTOR IN VIETNAM FINAL REPORT
For (3) establishment of housing standards and mass production systems, applicable
housing standards can be formulated by modifying the Japanese housing standards to local
characteristics of Vietnam, and housing industry with high production can be built up as one
of promising industries in cooperation with housing manufacturers and construction
companies of Japan. Thus, specialized housing technologies of Japan will be useful for
development of housing supply and industries in Vietnam.
As pointed out in Section 5.4 of Chapter 5, the issue of poor maintenance of the state built
housing units has presented itself. The aforesaid Urban Renaissance Agency has
considerable experience and know-how with regard to maintenance and management of a
large amount of housing stock. That is, Urban Renaissance Agency has managerial
know-how about technological standards for quality of reinforced concrete, quality of
building materials including durable cladding materials, maintenance organization or
institution, and so on, all of which will be useful for housing industries and construction in
Vietnam.
(2) Proposal for processing Redevelopment of the City Center
In such major cities of Japan as Tokyo, Yokohama or Osaka, development of their center is
dealt with on the basis of guideline enacted by an individual local government, and the
private sector carries out development by being rewarded with increase of floor area ratio,
subsidies and other incentives instead of observance of the guideline. It is deemed
effective in encouraging redevelopment of the city centers of metropolitan regions of
Vietnam to establish such systematic institutions transparent to people as applied in Japan.
Viewed from its accumulated experience, Japan can play a major role in support for making
policies and forming institutions for urban development of Vietnam.
This experience was acquired particularly by local governments of Japan through
controlling and promoting private sector’s urban development. Therefore, it is expected
that local governments of Japan give direct support to central or local governments of
Vietnam in order to appropriately proceed with urban core development, including
redevelopment of major cities of Vietnam.
(3) Support for Technological Introduction in addressing the Issues
As stated at the opening of this Chapter, for supply of high-class housing units and
housing development, it is necessary to introduce various kinds of latest urban
development technologies as a leading urbanizing project. For example, at this point
when an urban mass transit system is about to be constructed in Hanoi and Ho Chi Minh
Cities, housing development connected to public transport will result in reduction of traffic
congestion and CO2 emission. In addition to the connection to public transport,
8-4
THE STUDY FOR BASIC INFORMATION ON THE HOUSING SECTOR IN VIETNAM FINAL REPORT
installation of high efficiency appliances in houses or housing units or energy
accommodation among different urban usages will be able to be realized by utilizing
experience and know-how of Japan.
Ministry of Land, Infrastructure, Transport and Tourism of Japan (MLIT) is establishing a
cooperative relationship with Ministry of Construction (MOC) of Vietnam regarding promotion
of environment-oriented urban development. Japanese Conference for Overseas Development
of Eco-Cities (J-CODE)1 which was organized on a private-sector basis to carry overseas
environment-oriented urban development into effect formed Vietnam Working Group (J-CODE
VWG) in June 2012 to aim the development promotion at Vietnam. Utilizing this sort of
existing public-private partnership framework for urban development is one of approaches to
Transit Oriented Development (TOD) or application of latest environmental or energy saving
technologies in Vietnam.
8.3 Matters to which Japan is expected to offer ODA Support in Housing Development
(1) Requests from Vietnam
According to the study team’s interview to Housing Bureau and Urban Development
Agency of Ministry of Construction (MOC), their requests to Japan are as itemized below:
1/ Support for constructing fundamental database about housing
In Vietnam, fundamental data about housing is accumulated by individual local
governments without sufficient database to be shared by them. Presupposing that data
as a rule are collected and edited by each of local governments, Japan is requested to
help prepare guidelines or the like for constructing the database for their activities in
housing.
2/ Technology transfer for analyzing housing information including demand forecasting
In Vietnam, there are not enough know-how for analyzing or forecasting housing
demand etc. in such a manner as conducted in this study. Japan is requested to transfer
to Vietnam technology for analyzing housing information. For example, it is expected
to support preparation of a manual or the like for information analysis.
3/ Sharing experience of comprehensive mixed development including housing
As experienced in Japan, particularly where large-sized development or a large amount
of housing supply is targeted, housing development will necessitate wide-ranging
policies, planning and implementation integrated with entire urban planning and
1 The Japanese Conference for Overseas Development of Eco-Cities (J-CODE) was established in October 2011 to respond in a unified
manner to the rapidly growing needs of eco-friendly urban development in emerging economics especially in Asia. Composed of Japanese leading firms from wide range of fields, J-CODE aims to contribute to the promotion of overseas eco-city development projects from the very initial stage of concept planning to construction and to town management by bringing relevant Japanese private sector firms together into "Japan Teams." Cited from J-CODE web site: http://www.j-code.jp/.
8-5
THE STUDY FOR BASIC INFORMATION ON THE HOUSING SECTOR IN VIETNAM FINAL REPORT
transportation planning. Vietnam requests Japan to enable Vietnam to share this sort of
experience of housing development as one of the comprehensive urban development
policies in Japan.
(2) Matters to which Japan is expected to offer ODA Support
Based on the aforesaid requests from Vietnam and results of this study, matters to which Japan
is expected to offer ODA support to Vietnam are summarized below:
a) Support for short term
1/ Technical support for construction of housing database and analysis of housing information
Construction of fundamental housing database and analysis/forecasting of housing demands
and other housing information for which technological support was requested by MOC
coincide with technologies and expertise which Japanese public organizations or experts
including Urban Renaissance Agency have accumulated for many years. To respond not
only to rapidly growing urban population, but also to social maturation, it is possible to
provide technologies for analysis of data and information for the purpose of formulation of
various housing policies. This sort of technical cooperation is expected to be realized as
short-term ODA support of Japan.
2/ Technical support for preparation of technical standards for housing and spread housing
development (new town)
In Vietnam, technological standards for constructing and maintaining affordable housing are
not efficiently set up in view of the fact that exterior walls of state-built housing are apt to
deteriorate shortly. Although a lot of affordable housing will have to be constructed as part
of spread housing development (new towns) from now on, technical standards for
construction and maintenance of new towns have not been fully established. Standards for
new towns are required to comprise layout standards, standards for providing various
housing facilities, town management rule, etc.
Thus, it is deemed effective to support preparation of wide-ranged technical standards for
housing and spread housing development by the use of short-term ODA of Japan. Hence,
such technical support will be able to be fulfilled by technologies and expertise acquired by
Urban Renaissance Agency and other public organizations and experts engaged in
formulation of housing policies in Japan
b) Support for medium and long term
1/ Support for establishing housing financial system
As stated in Chapter 3, although how to build up the housing financial system in Vietnam
was a few times studied by ODA including the ADB housing finance project, the system
8-6
THE STUDY FOR BASIC INFORMATION ON THE HOUSING SECTOR IN VIETNAM FINAL REPORT
8-7
could not be broadly used by the people at large. The VND 30 Trillion Credit Package for
Social Housing commenced in 2013 has not been effectively utilized yet.
Housing financial system is largely affected by to what degree resources can be acquired.
In Japan, the Government Housing Loan Corporation uses the fiscal investment and loan
program composed of postal savings, social security pension, public loans, etc. In
Singapore which provided a great deal of public housing, Central Provident Fund (CPF)
has played a major role in housing financial system.
As the Government Housing Loan Corporation helped to supply a great deal of housing
after World War II in Japan, Vietnam which will have markedly increasing housing
demand from now on should establish such housing financial system as can be
practically and widely used. In addition, it should be studied whether the resources and
management/operation organizations applied in Japan or Singapore can be provided by a
city-based system in Vietnam. Thus, establishment of housing financial system
including identification of resources is proposed as the medium- and long-term ODA
support by Japan.
2/ Support for study on how to increase supply of rental housing
In major cities of Vietnam, it is foreseen that a number of households at such a lower
income level as cannot purchase even affordable housing will be formed increasingly.
Therefore, policies with which public agencies or organizations can supply a great deal
of rental housing or support it should be studied. In line with this, housing for
industrial workers should be such as can be optionally rented by a considerable extent of
workers as exemplified in Ho Chi Minh City, as well as rental housing provided by an
employer as found in the example of Hanoi City.
In Japan, local governments of prefectures, cities, towns or villages as well as Urban
Renaissance Agency (Japan Housing Corporation in former days) have constructed,
bought out or rented housing under state subsidies to provide public rental housing for
low-income households, and local housing supply corporations largely established by
prefectural governments have supplied low-rented housing with a certain degree of
quality. This large supply of reasonable rental housing by plural providers resulted in
solving the housing shortage after World War II and meeting the housing demand
varying from time to time. In Vietnam, it is required that approaches to construction of
rental housing and support for it should be advised as medium- or long-term ODA
support from Japan on the basis of the aforesaid experience accumulated in Japan.