THE STUDY ON CONSUMER BEHAVIOR IN
PURCHASING DOG FOOD AND PERCEPTION
TOWARDS BIOLOGICALLY APPROPRIATE RAW
FOOD (BARF) FOR DOGS IN BANGKOK
METROPOLITAN
BY
MR. SUCHINDA POOCHAROEN
AN INDEPENDENT STUDY SUBMITTED IN PARTIAL
FULFILLMENT OF
THE REQUIREMENTS FOR THE DEGREE OF
MASTER OF SCIENCE PROGRAM IN MARKETING
(INTERNATIONAL PROGRAM)
FACULTY OF COMMERCE AND ACCOUNTANCY
THAMMASAT UNIVERSITY
ACADEMIC YEAR 2017
COPYRIGHT OF THAMMASAT UNIVERSITY
Ref. code: 25605902040723ONZ
THE STUDY ON CONSUMER BEHAVIOR IN
PURCHASING DOG FOOD AND PERCEPTION
TOWARDS BIOLOGICALLY APPROPRIATE RAW
FOOD (BARF) FOR DOGS IN BANGKOK
METROPOLITAN
BY
MR. SUCHINDA POOCHAROEN
AN INDEPENDENT STUDY SUBMITTED IN PARTIAL
FULFILLMENT OF THE REQUIREMENTS FOR THE DEGREE
OF MASTER OF SCIENCE PROGRAM IN MARKETING
(INTERNATIONAL PROGRAM)
FACULTY OF COMMERCE AND ACCOUNTANCY
THAMMASAT UNIVERSITY
ACADEMIC YEAR 2017
COPYRIGHT OF THAMMASAT UNIVERSITY
Ref. code: 25605902040723ONZ
(1)
Independent Study Title THE STUDY ON CONSUMER BEHAVIOR
IN PURCHASING DOG FOOD AND
PERCEPTION TOWARDS BIOLOGICALLY
APPROPRIATE RAW FOOD (BARF) FOR
DOGS IN BANGKOK METROPOLITAN
Author Mr. Suchinda Poocharoen
Degree Master of Science Program in Marketing
(International Program)
Major Field/Faculty/University Faculty of Commerce and Accountancy
Thammasat University
Independent Study Advisor Professor Kenneth E. Miller, Ph.D.
Academic Year 2017
ABSTRACT
Dog food industry in Thailand has been growing continuously due to major
driving forces like urbanization, pet humanization and aging society. With these
evolving trends, the consumer behavior has been continuously changing over time.
Therefore, it is important for both marketers and business entrepreneurs to understand
the implications which could create new opportunities for the business. Biologically
Appropriate Raw Food for dog, also known as Bone and Raw Food (BARF), is one of
the emerging trends among the dog owners due to its health benefits.
This study aimed to understand consumer behavior in purchasing dog food.
The objectives of the research were to understand the key attributes that affect
purchasing decision for dog food, consumer profile for dog food in Bangkok
Metropolitan region, understand consumer perception towards BARF for dogs and
identify influencing attitudes and their impacts on willingness for BARF trial. The
research methodology includes both exploratory and descriptive researches in which
secondary research, in-depth interview and survey questionnaire were conducted. The
survey targeted dog owners who lived in Bangkok Metropolitan and purchased dog
food within the past three months. The collected data was analyzed using the
statistical package for the social sciences (SPSS). The model was described in terms
Ref. code: 25605902040723ONZ
(2)
of frequency, means, standard deviation, one-way ANOVA, regression and
correlation.
The four key factors which affect the consumer purchasing decision of dog
food were healthy, functional value, reassurance and emotional value. Based on these
factors, the respondents were grouped into three segments which are smart shopper,
value seeker and health driven. The research found that the consumers who are unsure
about the benefits of BARF are less willing to try BARF. On the contrary, the
consumers who agree that food which is traditionally optimal for a wolf is optimal for
dogs and that cooking destroys enzymes needed for digestion are more willing to try
BARF.
From this the study, manufacturers and marketers of dog food and pet care
service providers will gain some insights about the behavior of consumers in
purchasing dog food and their perception towards BARF in order to tailor effective
marketing strategies to attract the consumers.
Keywords: Dog food, BARF, Biological appropriate raw food, Bone and raw food,
Pet care industry, Consumer behavior
Ref. code: 25605902040723ONZ
(3)
ACKNOWLEDGEMENTS
This work would not have been possible without the advice and support of
many people. First, and foremost, I would like to express my sincere appreciation for
my advisor, Prof. Dr. Kenneth E. Miller, for his support, guidance and encouragement
throughout this project. I also would like to express my deepest thanks to all dog
owners who participated in the interviews and survey questionnaire for their
contribution. In addition, special thanks are due to BONE and RAW, an online-based
BARF shop and 1688 Pet Shop, a specialty pet care store, for the never-ending
supports. Last but not least, I would like to thank Asst. Prof. Pannapachr
Itthiopassagul, Director of MIM Program and all members of the MIM office for their
dedicated contribution, coordination, and assist throughout my study in MIM.
Mr. Suchinda Poocharoen
Ref. code: 25605902040723ONZ
(4)
TABLE OF CONTENTS
Page
ABSTRACT (1)
ACKNOWLEDGEMENTS (3)
LIST OF TABLES (7)
LIST OF FIGURES (8)
CHAPTER 1 INTRODUCTION 1
1.1 Problem statement and research purpose 1
1.2 Definitions 2
1.3 Research objectives 2
CHAPTER 2 REVIEW OF LITERATURE 4
CHAPTER 3 RESEARCH METHODOLOGY 6
3.1 Research methodology 6
3.1.1 Exploratory research 6
3.1.1.1 Secondary research 7
3.1.1.2 In-depth interview 7
3.1.2 Descriptive research 7
3.1.2.1 Survey questionnaire 7
3.2 Sampling plan 8
3.2.1 In-depth interview sampling plan 8
3.2.2 Survey questionnaire sampling plan 8
3.3 Data collection 9
3.3.1 In-depth interview data collection 9
Ref. code: 25605902040723ONZ
(5)
3.3.2 Survey questionnaire data collection 9
3.4 Data analysis plan 10
3.4.1 Qualitative data analysis 10
3.4.1 Quantitative data analysis 10
CHAPTER 4 RESULT AND DISCUSSION 11
4.1 Key findings from exploratory research 11
4.1.1 Shopping channel 11
4.1.2 Buying frequency and monthly spending 11
4.1.3 Factors affecting purchasing decision for dog food 12
4.2 Key findings from descriptive research 12
4.2.1 Summary of respondents' demographic profiles 12
4.2.2 Factor analysis on attributes that affect purchasing decision 14
4.2.3 Segmentation of consumers for dog food 16
4.2.4 Segment profiles 18
4.2.4.1 Demographic profile 18
4.2.4.2 Attitudes toward their dogs 21
4.2.4.3 Consumer lifestyle 21
4.2.4.4 No. of dogs owned and dog food purchasing pattern 22
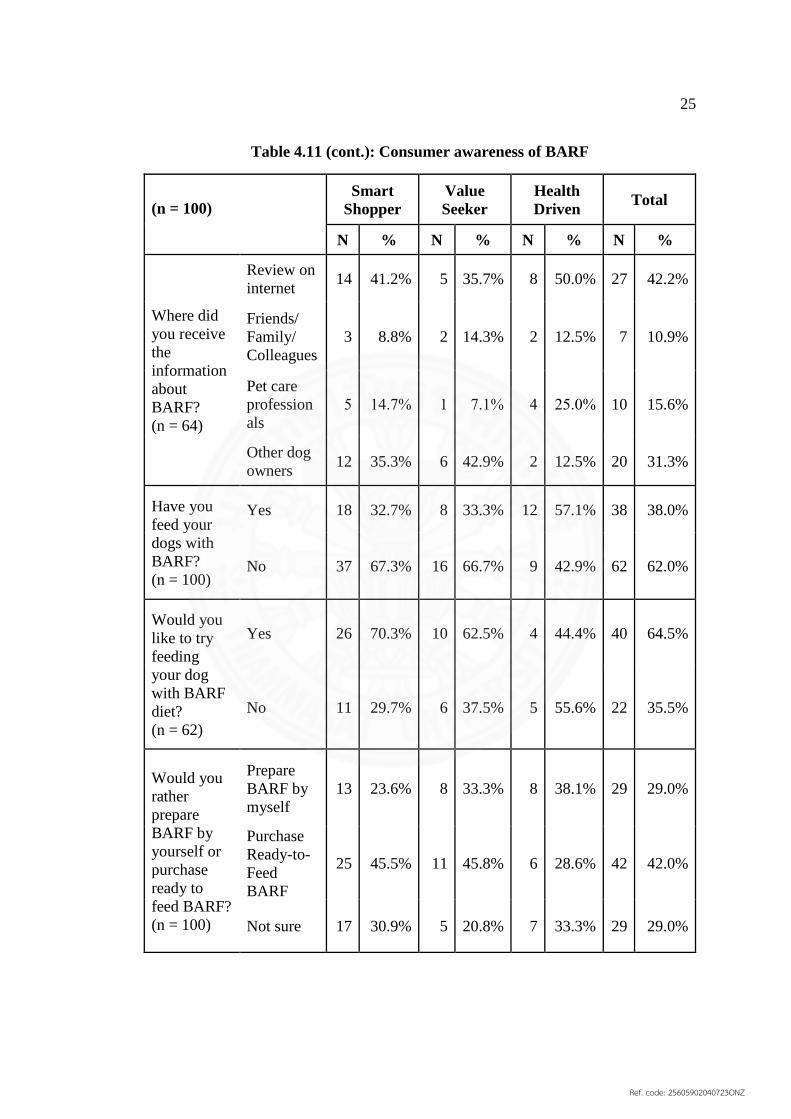
4.2.5 Perception towards BARF 24
4.2.5.1 Consumer awareness of BARF 24
4.2.5.2 Influential attitudes and their impacts on willingness
for BARF trial 26
CHAPTER 5 CONCLUSIONS AND RECOMMENDATIONS 28
5.1 Conclusions 28
5.1.1 Factors affection purchasing decision for dog food 28
5.1.2 Segmentation of dog food consumers 28
5.1.3 Perception towards BARF 29
5.2 Recommendations 29
Ref. code: 25605902040723ONZ
(6)
5.2.1 Product 30
5.2.2 Price 30
5.2.3 Place 30
5.2.4 Promotion 30
5.3 Limitation of the study 31
REFERENCES 32
APPENDICES 34
APPENDIX A: Timeline Plan 35
APPENDIX B: Survey Questionnaire 36
APPENDIX C: SPSS Results 45
BIOGRAPHY 47
Ref. code: 25605902040723ONZ
(7)
LIST OF TABLES
Tables Page
3.1 In-depth interview sampling plan 8
3.2 Survey questionnaire sampling plan 9
3.3 Interpretation of the score from 4-point Likert scale 10
4.1 Respondent profiles for in-depth interview 11
4.2 Respondents' demographic profile 13
4.3 Respondents’ no. of dogs owned 14
4.4 KMO and Bartlett's test on factors affecting purchasing decision
for dog food 15
4.5 Result of factor analysis on key attributes affecting purchasing decision
for dog food 16
4.6 Result of K-Mean cluster analysis 17
4.7 Mean comparison for three segments and four factors using ANOVA 18
4.8 Demographic profile of the consumer segments 18
4.9 Lifestyle of the consumer segments 21
4.10 No. of dogs owned and dog food purchasing pattern 22
4.11 Consumer awareness of BARF 24
4.12 Influential attitudes and their impacts on willingness for BARF trial 27
Ref. code: 25605902040723ONZ
1
CHAPTER 1
INTRODUCTION
1.1 Problem statement and research purpose
According to Euromonitor International (2017), the global dog food industry
was estimated to be worth USD 47,954 million in 2017. Although North America and
Western Europe regions contribute to over 66% of the global market, huge growth is
expected to come from emerging markets in Asia Pacific region which now has the
market size of USD 4,888 million. Dog food market in Thailand was worth USD 609
million or THB 19.3 billion and 181,000 tons in 2016 and was expected to grow at
CAGR of 8% in retail volume and 10% in value at constant 2017 prices, to reach THB
35.2 billion and 283,000 tons in 2022. In 2017, 22.9% of households in Thailand owned
at least one dog while Thailand dog population was growing at a steady rate to over 8.2
million in 2017.
The major driving forces of the rise in pet care industry in Thailand are
urbanization, pet humanization and aging society. Thailand’s urban population was
accounted for 52.7% of total population in 2017 at the annual rate of urbanization of
2.2% between 2015 to 2020 est. (Central Intelligence Agency, 2017). In 2010, the
Bangkok urban area accounted for nearly 80% of the total urban area in Thailand (The
World Bank, 2015). Due to the migration from rural to urban areas, more people are
living in condominiums and high-rise apartments and with smaller space, households
tend to look for pets as companions (Euromonitor International, 2017). In addition, pet
ownership is evolving into companionship in which the pet owners treat pets as a part
of their family, the so-called phenomenon of “pet humanization” (Euromonitor
International, 2014). As a result, pet owners are willing to spend more on their pets.
SCB Economic Intelligence Center (EIC) (2017) said that there is a noticeable trend
towards increasing number of pet ownership by the elderly and childless couples in
societies like Thailand with aging population and declining birth rates.
Consequently, this is a huge opportunity for the dog food manufacturers to
introduce value-added products with improved health benefits, especially in premium
and mid-priced dog food. Biologically Appropriate Raw Food (BARF) is also an
Ref. code: 25605902040723ONZ
2
alternative feeding method for dog that becomes increasing popular among dog owner.
BARF is basically, raw meat, raw bones and raw organs which remain a niche in the
market while its size is still not fully quantifiable. However, claims of BARF benefits
especially in dog health improvement have attracted interests from consumers. While
consumers form stronger bond with their companion animals, they are more willing to
pay a higher price for premium products in pet humanized markets (Schlesinger and
Joffe, 2011).
This study is a contemporary topic in applied marketing which focused on the
dog food consumers in Bangkok metropolitan. From the study, manufacturers and
marketers of dog food and pet care service providers can gain some insight about the
consumer behavior of dog owners in purchasing dog food, factors affecting consumer
purchasing decision, consumer perception towards BARF for dogs as well as
influencing attitude towards BARF trial. The timeline of the study is as shown in
Appendix A.
1.2 Definitions
1. BARF: Biologically Appropriate Raw Food, also known as Bone and Raw
Food, is a type of dogs’ diet consisting of raw food including raw meat, raw
bones and raw organs etc. that, BARF enthusiasts claimed, dogs were naturally
designed to eat
2. Dry dog food: a dry form of dog food that provide complete and balanced
nutrition, also known as kibble
3. Wet dog food: a wet form of dog food that provide complete and balanced
nutrition, also known as canned dog food
1.3 Research objectives
This study will focus on understanding consumer behavior and perception
towards biologically appropriate raw food (BARF) for dogs in Bangkok metropolitan
under the following research objectives;
1. To understand key attributes that affect purchasing decision for dog food.
2. To understand consumer profile for dog food in Bangkok Metropolitan region.
Ref. code: 25605902040723ONZ
3
2.1. Demographics including age, gender, education level, occupation, monthly
income, marital status, etc.
2.2. Psychographics including attitudes toward their dogs, lifestyle, etc.
2.3. Behaviors including dog food purchasing pattern, etc.
3. To understand consumer perception towards BARF for dogs
3.1. To understand consumer awareness of BARF for dogs.
3.2. To identify influencing attitudes and their impacts on willingness for BARF
trial.
Ref. code: 25605902040723ONZ
4
CHAPTER 2
REVIEW OF LITERATURE
The study from Tesfom and Birch (2010) concluded that there are significant
relationships between the way dog owners buy for their dogs and the way they buy for
themselves. It is highlighted that the dog owners are more serious about buying healthy
dog food than about buying healthy food for themselves while also being more sensitive
to their own food prices than for their dog food prices. It was also pointed out that dog
owners are more loyal to dog food brands than human food brands.
In addition, the consumer study from Boya et al. (2008) divide dog owners into
3 segments, based on self-reported nature of their relationships with their dogs and how
they see themselves in relation to their dogs, which are “dog people”, “dog parents”
and “pet owners”. It was also suggested that these three segments exhibit distinctly
different dog food-related choice patterns which was driven by the relationships with
their dogs. The research also confirms the previous research that dog owners are more
concerned with healthfulness and nutritional value of their dogs’ food than in their own
food.
In light of the above study, Nielson (2016) research indicates that pet owners
are saying no to GMOs (genetically modified ingredients). GMOs has been a
controversial topic in human food in European countries and United States. 50% of
French pet owners and 33% of U.S. pet owners ranked “non-GMO” in the top three of
ten as important health food claims. Over half of consumers who preferred non-GMO
claims felt that GMOs are unnatural, that their long-term impact on health is unknown,
and that they themselves do not want to eat GMOs so their pets should not have to. 48%
of the pet owners said that they are willing to pay for “non-GMO” products than for
any other claim listed. Beside the point, consumers also prefer products with the claim
of “organic ingredients” over “scientifically formulated” as they feel that the word
“scientific” make them think that the food is unnatural i.e. it may have added
preservatives or hormones. In addition, Nielson (2016) also pointed out that consumers
feel that their pets’ diets can have a significant impact on the overall well-being of the
Ref. code: 25605902040723ONZ
5
pets. In fact, 85% believe they can extend the lives of their pets based on the foods they
feed them.
Consumers' education is the key issue for the marketing of functional pet foods
due to difficulty in understanding pet food labels. In addition, research on pet food is
still scarce. Accurate claims on food labels help consumers select products that satisfy
their desire to promote animal care and improve their pets' health. (Cerbo, et al., 2017)
The study of Thai consumers (Thanansirangkul, 2013) reported that the
recommendations from veterinary clinics and professional dog breeders play an
important role in influencing the consumer choices of dog food with high degree of
consumer compliance. Hence, it is crucial for the marketers to involve these influencers
in building the dog food brand.
Ref. code: 25605902040723ONZ
6
CHAPTER 3
RESEARCH METHODOLOGY
3.1 Research methodology
This research study focused on both exploratory research and descriptive
researches in order to gather adequate and insightful information for the data analysis
to achieve its objectives. The exploratory research consists of secondary research and
in-depth interviews while descriptive research will be based on survey questionnaire.
The research methodology was designed to understand the Bangkok Metropolitan
consumer behavior on purchasing dog food in general and their perception towards
BARF.
3.1.1 Exploratory research
Secondary research and in-depth interview were devised in the exploratory
research for this study. Relevant information and insights in various aspects of
Thailand dog food market, consumer behavior on purchasing dog food and perception
towards BARF were collected in this process. The results from the exploratory
research were further used to identify the main issues that should be addressed and
reduce bias in the quantitative research.
Research
Methodology
Secondary
Research
In-depth
Interview Survey
Questionnaire
Exploratory
Research
Descriptive
Research
Figure 1: Research Methodology
Ref. code: 25605902040723ONZ
7
3.1.1.1 Secondary research
The secondary research focused on exploring the overview of dog food industry,
industry trends, consumer perception, attitudes and purchasing behavior in purchasing
dog food, and general information on dog food and BARF. Secondary research sources
included:
1. Published academic journals and literature related to dog owners’
perception, attitude and behavior.
2. Statistical data from government documents and Euromonitor
International on dog owners in Thailand, such as dog ownership,
spending on dog food, and relevant information.
3. Opinions and discussion on online platform including Facebook group,
webboard, etc.
3.1.1.2 In-depth interview
After developing the key questions from secondary research, in-depth
interviews were conducted to understand the relationships between demographics,
psychographics and behavior of the consumers, factors affecting the purchasing
decision and perception towards BARF. The in-depth interview allowed the interviewer
to probe in order to understand the rationale behind consumers’ decision. The results
from in-depth interview were expected to produce hypotheses on consumer profiles,
perceptions and attitudes for further test in the descriptive research.
3.1.2 Descriptive research
The descriptive research was carried out in the form of self-administered
survey questionnaire in order to quantify the responses into statistically inferable data.
3.1.2.1 Survey questionnaire
The survey questionnaire was designed using Survey Monkey website based on
the findings and insights from the exploratory research. The data was collected through
online channel to collect a total of 100 survey responses in order to gain statistical
evidence to generalize the findings on the relationships between consumer
demographic, psychographic and behavioral profile, factors affecting purchasing
Ref. code: 25605902040723ONZ
8
decision for dog food and consumer perception towards BARF. See guideline of the
survey questionnaire in Appendix B.
3.2 Sampling plan
Sample selection for both in-depth interview and survey questionnaire was
based on convenience sampling (non-probability technique). The participants for both
in-depth interview and survey questionnaire were from both genders, all socioeconomic
status, living in Bangkok Metropolitan, owns at least one dog and purchased dog food
at least once three months prior. The sampling plan for the research are summarized as
follows.
3.2.1 In-depth interview sampling plan
A total of four participants were selected as the participants in the in-depth
interview. The sampling plan for in-depth interview is as shown in table 3.1 below.
Table 3.1: In-depth interview sampling plan
Gender Three males and three females
Socioeconomic
Status (SES) All
Area Living in Bangkok Metropolitan
Behavior Owns at least one dog
Purchased dog food at least once within the last three months
Sample Size 6 participants
Sampling Method Convenience Sampling
3.2.2 Survey questionnaire sampling plan
The survey was planned to collect data from a total of 100 respondents through
online channel. The sampling plan for survey questionnaire is shown table 3.2 below.
Ref. code: 25605902040723ONZ
9
Table 3.2: Survey questionnaire sampling plan
Gender Male and Female
Socioeconomic
Status (SES) All
Area Living in Bangkok Metropolitan
Behavior Owns at least one dog
Purchased dog food at least once within the last three months
Sample Size 100 respondents
Sampling Method Convenience Sampling
3.3 Data collection
3.3.1 In-depth interview data collection
A pilot in-depth interview was tested with two respondents before conducting
the actual interview. Personal connection was used to recruit qualified participants. The
in-depth interview was conducted in November 2017. Each individual interview took
approximately 15 minutes. Face-to-face or telephone interviews was carried out based
on the convenience of the respondents.
3.3.2 Survey questionnaire data collection
The questionnaire was designed for the respondents to complete within 15
minutes. To avoid the error of questionnaire design, a pre-test questionnaire was
distributed to 10 respondents and the feedback from pre-test will be used to adjust the
questionnaire before launching the final questionnaires to the public. The survey
questionnaire was distributed between January to February of 2018 through LINE and
Facebook messenger application for personal connection, Facebook groups and pages
such as, rakmahjung, BARFThailand, konrakgolden, etc. and Twitter.
Ref. code: 25605902040723ONZ
10
3.4 Data analysis plan
3.4.1 Qualitative data analysis
The qualitative analysis focused on the insights gathered from in-depth
interview. After each in-depth interview, initial conclusion was drawn to see the
relationship and patterns for further analysis. The in-depth interviews aimed to identify
attributes that affect decision making process in purchasing dog food, general profile
including demographics, psychographics and behaviors, as well as awareness and
perception towards BARF.
3.4.1 Quantitative data analysis
The quantitative data collected from the survey questionnaire was screened,
cleaned and analyzed using Microsoft Excel and Statistical Package for the Social
Sciences (SPSS) to show frequency distribution, relationships between variables
through cross tabulations, factor analysis, cluster analysis and other statistical analysis
as deemed appropriate.
Since some data was collected in the form of 4-point Likert scale to measure
level of agreement, importance and frequency, therefore, the criteria for interpretation
of the score derived from Likert scale into verbal description was established as shown
in table 3.3 by using the formula; (Ariola, Principles and Methods of Research, 2006)
Class interval = range / number of classes = (4-1) / 4 = 0.75
Table 3.3: Interpretation of the score from 4-point Likert scale
Scale Range of Mean Score Level of Agreement / Importance /
Frequency
1 1.00 – 1.75 Strongly Disagree / Not important / Never
2 1.76 – 2.50 Disagree / Slightly important / Seldom
3 2.51 – 3.25 Agree / Important / Sometimes
4 3.25 – 4.00 Strongly Agree / Very Important / Often
Ref. code: 25605902040723ONZ
11
CHAPTER 4
RESULTS AND DISCUSSION
4.1 Key findings from exploratory research
The exploratory research was conducted with six respondents who are recruited
by personal connection to get preliminary ideas on consumer attitudes and behavior in
purchasing dog food as well as their perception on BARF. The insightful information
collected from the interview is summarized in table 4.1.
Table 4.1: Respondent profiles for in-depth interview
No. Name Age Gender Occupation No. of Dogs
1 Ay 25 Male Business Owner 1
2 Ton 26 Male Architect 3
3 Fern 27 Female Sales Engineer 2
4 Pentor 27 Male Researcher 3
5 Jim 57 Female Housewife 5
6 May 35 Female Sales Engineer 1
4.1.1 Shopping channel
Typically, the interviewees buy dog food from pet specialty store. Although, a
few may choose to buy from superstores and supermarkets in some occasions. The
interviewees often buy dog food from pet specialty store because;
- “My neighbor recommended me to buy from the store and it is very close to my
house.”, Ay.
- “I know the pet shop owner and he can provide good recommendations and
advices.”, May.
- “The price is lower in specialty store”, Jim.
4.1.2 Buying frequency and monthly spending
The interviewees usually purchase dog food once a month or more than once a
month. Majority of them buy dog food in the range of 1,000 – 1,500 THB per month
per dog while a few have higher spending up to 2,000 THB per month per dog.
Ref. code: 25605902040723ONZ
12
- “Since I have many dogs at home, I buy dog food at least once a month and must
manage my budget”, Jim.
- “I want the best stuff for my dog, so I often buy treats and other supplements for
my dog”, Fern.
- “At home, we often give leftover food for our dog. Sometimes, we buy wet food
to mix with it”, Pentor.
4.1.3 Factors affecting purchasing decision for dog food
The interviewees have different concerns in purchasing dog food. Some of the
key attributes include value for money, nutritional value, recommendations, etc.
- “I choose dog food brand with the best value for money”, Jim.
- “Many brands of dog food have additives which are not safe for dogs. I choose
the product that has less sodium, flavoring agent and has high nutritional
values”, Fern.
- “I buy the same product that my dog likes to eat at a reasonable price”, Ton.
- “I look for dog food with whole protein and grain-free”, May
4.2 Key findings from descriptive research
After data collection process from January to February of 2018, the data from
a total of 100 respondents was analyzed using Statistic Package for Social Sciences
(SPSS).
4.2.1 Summary of respondents’ demographic profile
The demographic profiles of 100 target respondents who lived in Bangkok
Metropolitan, owned at least one dog and purchased dog food within the past three
months were highlighted with respect to gender, age, level of education, occupation,
monthly personal income, marital status and type of residence as follows; 83% female,
50% aging between 21 to 30 years old, 47% bachelor’s degree, 49% corporate
employee, 30% monthly personal income range between 20,000 - 35,000 THB, 71%
Single and 71% live in single-detached house (See table 4.2). The results showed that
samples may not represent the entire population due to convenience sampling.
Ref. code: 25605902040723ONZ
13
Table 4.2: Respondents' demographic profile
Respondents’ Demographic Profiles (n = 100) Frequency %
Gender
Male 17 17%
Female 83 83%
Age
Below 21 6 6%
21-30 50 50%
31-40 30 30%
41-50 10 10%
51-60 4 4%
Above 60 0 0%
Level of education
High School or Equivalent 11 11%
Bachelor's Degree 47 47%
Master's Degree 38 38%
Doctorate Degree 4 4%
Occupation
Business Owner 17 17%
Corporate Employee 49 49%
Government Officer / State Enterprise Officer 10 10%
Freelance 10 10%
Housewife 3 3%
Student 10 10%
Retired 0 0%
Unemployed 1 1%
Monthly personal income (THB)
Lower than 20,000 20 20%
20,000 - 35,000 30 30%
35,001 - 50,000 18 18%
50,001 - 65,000 13 13%
More than 65,000 19 19%
Ref. code: 25605902040723ONZ
14
Table 4.2 (cont.): Respondents' demographic profile
Respondents’ Demographic Profiles (n = 100) Frequency %
Marital status
Single 71 71%
Married, no children 16 16%
Married with children 9 9%
Married, children have left home 2 2%
Divorced / Separated 2 2%
Widow 0 0%
Type of residence
Apartment / Flat 8 8%
Townhouse 16 16%
Single-detached house 71 71%
Condominium 5 5%
In terms of no. of dogs owned, over 48% of the respondents owned one dog.
26% owed two dogs, 7% owned three dogs, 8% owned four dogs and 11% owned
more than four dogs (See table 4.3)
Table 4.3: Respondents’ no. of dogs owned
Respondents’ Demographic Profiles (n = 100) Frequency %
No. of Dogs Own
1 48 48.0%
2 26 26.0%
3 7 7.0%
4 8 8.0%
More than 4 11 11.0%
4.2.2 Factor analysis on attributes that affect purchasing decision
Factor analysis, subjected to 17 independent variables, i.e. survey questionnaire
no. 11. a. to 11. q., was conducted for the key attributes affecting purchasing decision
for dog food in order to find the independent latent variables and reduce the set of
Ref. code: 25605902040723ONZ
15
variables in the dataset. However, the Determinant of the correlation matrix was less
than 0.00001, i.e. 4.58E-6, showing that there is a problem of multicollinearity.
Therefore, the inter-correlation between variables was observed and highly correlated
variables (R > 0.9) were found. Correlations between “No preservatives” (11. j.) and
“No flavoring agent” (11. k.) and “No coloring agent” (11. l.) were significant at p <
0.05 with the values of 0.92 and 0.92, respectively. Hence, the variables “No flavoring
agent” (11. k.) and “No coloring agent” (11. l.) were eliminated before running the
factor analysis with the Determinant value of 0.001 which was greater than the required
value of 0.0001. The Pearson’s correlation matrix is shown in appendix C.
The Kaiser-Meyer-Olkin measure of sampling adequacy (KMO) and Bartlett's
test of sphericity were also conducted to ensure that the variables were appropriate for
running the factor analysis. Table 4.4 shows the KMO of 0.77, indicating that the
pattern of correlations is relatively compact and factor analysis would yield distinct and
reliable factors, and Bartlett's test with P-value less than significant level of 0.001,
indicating that it is not an identity matrix and there are some relationships between the
variables that we can include in the analysis.
Table 4.4: KMO and Bartlett's test on factors affecting purchasing decision
for dog food
KMO and Bartlett's Test
Kaiser-Meyer-Olkin Measure of Sampling Adequacy. .765
Bartlett's Test of Sphericity
Approx. Chi-Square 710.338
df 105
Sig. .000
Factor analysis was conducted with Varimax rotation method with Kaiser
Normalization. The results show that 15 variables can be grouped into four factors
based on Eigenvalue of 1.25 and accounted for 68.0% of total variance as shown in
appendix C. The four factors were interpreted and labelled as 1) healthy 2) functional
value 3) reassurance and 4) emotional value as shown in table 4.5 with respect to their
loading attributes.
Ref. code: 25605902040723ONZ
16
Table 4.5: Result of factor analysis on key attributes affecting purchasing
decision for dog food
Factor 1
Healthy
Factor 2
Functional
value
Factor 3
Reassurance
Factor 4
Emotional
value
No preservatives .886
Low sodium .832
Gluten Free .826
Natural / Organic
Ingredients .786
Smell .812
Flavor .804
Value for money .670
Easy to prepare .568
Recommendations
from friends / family /
colleagues
.847
Recommendations
from pet care
professional
.714
Reviews from other
dog owners .460 .707
Brand .791
Hygiene .400 .685
Nutrition .518 .681
Packaging .450 .485
4.2.3 Segmentation of consumers for dog food
The respondents were segmented based on four factors by hierarchical cluster
(Ward’s method) and K-Means cluster analysis. In hierarchical cluster analysis, the
coefficients under agglomeration schedule and Dendrogram show that the data could
be grouped into either 3 or 4 clusters. By using K-Means cluster analysis, it was
concluded that clustering the data into 3 segments could give us a meaningful
interpretation with larger cluster size. The interpretation of each cluster in terms of the
Ref. code: 25605902040723ONZ
17
four factors including healthy, functional value, reassurance and emotional value are as
shown in table 4.6.
Table 4.6: Result of K-Mean cluster analysis
(n = 100) Segment 1
Smart Shopper
Segment 2
Value Seeker
Segment 3
Health Driven
n 55 24 21
Healthy -0.13 0.07 0.25
Functional Value 0.45 0.17 -1.37
Reassurance 0.31 -0.28 -0.50
Emotional Value 0.47 -1.41 0.39
Segment 1: Smart Shopper
This segment represents the group of people who are concerned with both
functional and emotional values of the products. They look for trusting dog food brand
with great value for money, dog-appetizing flavor and smell when purchasing dog food.
In addition, they also need affirmation from the third party like friends, family, other
dog owners and pet specialists.
Segment 2: Value Seeker
This segment represents the group of people who are concerned mainly with
functional value of the products. They know that some of the commercial dog food are
not healthy and therefore, they moderately seek for products which are healthy while
also balancing with the value for money and dog-appetizing flavor and smell.
Segment 3: Health Driven
This segment represents the group of people who are health conscious. They are
concerned with what is in the dog food that they purchase, and they actively seek for
products which are made from natural or organic raw materials with the least additives
that could be harmful. They also look for trusting brands of products.
To compare means between groups of these three segments, ANOVA was
conducted and found that three out of four dimensions including functional value,
reassurance and emotional value were significantly different between groups (p < 0.05).
Ref. code: 25605902040723ONZ
18
On the other hand, healthy was not significantly different between the groups as shown
in table 4.7.
Table 4.7: Mean comparison for three segments and four factors using ANOVA
Sum of
Squares df
Mean
Square F Sig.
Healthy
Between Groups 2.373 2 1.186 1.191 .308
Within Groups 96.627 97 .996
Total 99.000 99
Functional Value
Between Groups 51.306 2 25.653 52.173 .000
Within Groups 47.694 97 .492
Total 99.000 99
Reassurance Between Groups 12.455 2 6.228 6.980 .001
Within Groups 86.545 97 .892
Total 99.000 99
Emotional Value Between Groups 62.438 2 31.219 82.825 .000
Within Groups 36.562 97 .377
Total 99.000 99
4.2.4 Segment profile
4.2.4.1 Demographic profile
To understand the segments of dog food consumers, the demographic profiles
of each segment are shown in table 4.8. There is no significant difference between the
three segments in term of demographics.
Table 4.81: Demographic profile of the consumer segments
(n = 100)
Smart
Shopper
(n = 55)
Value
Seeker
(n = 24)
Health
Driven
(n = 21) N % N % N %
Gender
Male 8 14.5% 6 25.0% 3 14.3%
Female 47 85.5% 18 75.0% 18 85.7%
Ref. code: 25605902040723ONZ
19
Table 4.8 (cont.)2: Demographic profile of the consumer segments
(n = 100)
Smart
Shopper
(n = 55)
Value
Seeker
(n = 24)
Health
Driven
(n = 21) N % N % N %
Age
Below 21 3 5.5% 3 12.5% 0 0.0%
21-30 32 58.2% 8 33.3% 10 47.6%
31-40 13 23.6% 8 33.3% 9 42.9%
41-50 4 7.3% 4 16.7% 2 9.5%
51-60 3 5.5% 1 4.2% 0 0.0%
Above 60 0 0.0% 0 0.0% 0 0.0%
Level of education
High School or Equivalent 6 10.9% 4 16.7% 1 4.8%
Bachelor's Degree 29 52.7% 9 37.5% 9 42.9%
Master's Degree 19 34.5% 11 45.8% 8 38.1%
Doctorate Degree 1 1.8% 0 0.0% 3 14.3%
Occupation
Business Owner 10 18.2% 4 16.7% 3 14.3%
Corporate Employee 26 47.3% 11 45.8% 12 57.1%
Government Officer / State Enterprise
Officer 6 10.9% 2 8.3% 2 9.5%
Freelance 6 10.9% 0 0.0% 4 19.0%
Housewife 1 1.8% 2 8.3% 0 0.0%
Student 6 10.9% 4 16.7% 0 0.0%
Retired 0 0.0% 0 0.0% 0 0.0%
Unemployed 0 0.0% 1 4.2% 0 0.0%
monthly personal income (THB)
Lower than 20,000 8 14.5% 8 33.3% 4 19.0%
20,000 - 35,000 18 32.7% 6 25.0% 6 28.6%
35,001 - 50,000 15 27.3% 3 12.5% 0 0.0%
50,001 - 65,000 6 10.9% 3 12.5% 4 19.0%
More than 65,000 8 14.5% 4 16.7% 7 33.3%
Marital status
Single 41 74.5% 18 75.0% 12 57.1%
Married, no children 8 14.5% 2 8.3% 6 28.6%
Married with children 5 9.1% 2 8.3% 2 9.5%
Married, children have left home 0 0.0% 1 4.2% 1 4.8%
Divorced / Separated 1 1.8% 1 4.2% 0 0.0%
Widow 0 0.0% 0 0.0% 0 0.0%
Type of residence
Apartment / Flat 2 3.6% 4 16.7% 2 9.5%
Townhouse 9 16.4% 3 12.5% 4 19.0%
Single-detached house 42 76.4% 17 70.8% 12 57.1%
Condominium 2 3.6% 0 0.0% 3 14.3%
Ref. code: 25605902040723ONZ
20
1. Smart shopper: This is the largest segment which accounted for 55% of the total
respondents. 85.5% of the segment was female with 58.2% ages between 21-30
years followed by 23.6% of age between 31-40 years. In terms of level of
education, over 52.7% had bachelor’s degree while 34.5% had master’s degree.
47.4% of the segment was corporate employee and 18.2% was business owner
with 32.7% and 27.3% had monthly personal income between 20,000 - 35,000
and 35,001 - 50,000 THB, respectively. For marital status, 74.5% was single
and 14.5% was married with no children. 76.4% of the segment lived in single-
detached house and 16.4% lived in townhouse.
2. Value seeker: The segment is the Second largest segment which accounted for
24% of the total respondents. 75% of the segment was female with 33.3% ages
between 21-30 and 33.3% ages between 31-40 years. In terms of level of
education, over 37.5% had bachelor’s degree while 45.8% had master’s degree.
In terms of occupation, 45.8% was corporate employee, 16.7% was business
owner and 16.7% was student. 33.3% of the segment had monthly personal
income lower than 20,000 THB and 25.0% had monthly personal income
between 20,000 - 35,000 THB. 75.0% of the segment was single, 8.3% was
married with no children and 8.3% was married with children. For the type of
residence, 70.8% lived in single-detached house, 16.7% in apartment / flat and
12.5% in townhouse.
3. Health driven: Accounted for 21% of the total respondents, the segment is the
smallest segment. 85.7% of the segment was female with 47.6% ages between
21-30 and 42.9% ages between 31-40 years. Over 42.9% had bachelor’s degree
while 38.1% had master’s degree. 57.1% was corporate employee, 19.0% was
freelance and 14.3% was business owner. 33.3% of the segment had monthly
personal income more than 65,000 THB and 28.6% had monthly personal
income between 20,000 - 35,000 THB. In terms of marital status, 57.1% of the
segment was single and 28.6% was married with no children. 57.1% of the
segment lived in single-detached house, and 19.0% in townhouse.
Ref. code: 25605902040723ONZ
21
4.2.4.2 Attitudes toward their dogs
By comparing means, the means of the three segments were not significantly
different in terms of attitudes of the segments towards their dogs, except for “My dog
is an extension of myself” (F = 3.24, p < 0.043) which was significantly different
between the segments. The health driven and value seeker segments strongly agreed
that “My dog is an extension of myself” with the means of 3.52 and 3.46, respectively.
Whereas, the smart shopper agreed with the statement with the mean of 3.07.
4.2.4.3 Consumer Lifestyle
The means of the three segments were significantly different in terms of lifestyle
for “I am interested in technology” (F = 5.98, p < 0.004), “I like to party with friends”
(F = 3.52, p < .033) and “I like to have detailed information before making any
decision” (F = 3.63, p < .030) as shown in table 4.9.
Table 4.9: Lifestyle of the consumer segments
(n = 100)
Mean
F
statistic
P
value
Smart
Shopper
(n = 55)
Value
Seeker
(n = 24)
Health
Driven
(n = 21)
I am interested in technology 3.35 2.75 3.19 5.976 .004
I like to party with friends 2.93 2.88 2.33 3.520 .033
I like to have detailed
information before making
any decision
3.56 3.25 3.67 3.628 .030
1. Smart shopper segment strongly agreed that “I am interested in technology”
with the mean of 3.35 while the other two segments agree with the
statement.
2. Smart shopper and value seeker segments agreed that “I like to party with
friends” with the means of 2.93 and 2.88 whereas health driven segment
disagreed with the statement with the mean of 2.33.
Ref. code: 25605902040723ONZ
22
3. Health driven and smart shopper strongly agreed that “I like to have detailed
information before making any decision” with the means of 3.67 and 3.56,
respectively, and value seeker agreed with the statement with the mean of
3.25.
4.2.4.4 No. of dogs owned and dog food purchasing pattern
Majority of all respondents across the segments owned one dog with smart
shopper at 45.5%, value seeker at 58.3% and health driven at 42.9%. The dog ownership
pattern is quite similar among the segments. 27.3% of smart shopper owned two dogs
and over 12.7% owned more than four dogs. 16.7% of value seeker owned two dogs
and 12.5% owned more than four dogs. While 33.3% of health driven segment owned
two dogs and only 4.8% owned more than four dogs.
Over 43.6% of smart shopper segment purchased dog food once a month and
38.2% purchased dog food more than once a month. For value seeker, 37.5% purchased
dog food more than once a month and 37.5% purchased dog food once a month. On the
contrary, over 52.4% of health driven segment purchased dog food more than once a
month and only 28.6% purchased dog food once a month.
In terms of monthly spending on dog food per dog, over 23.8% of health driven
segment spend more than 3,500 THB which is the highest across the segments, followed
by 18.2% of the smart shopper. Majority of smart shopper (49.1%) spend between 501-
1,500 THB while majority of value seeker (45.8%) also spend between 501-1,500 THB.
Table 4.10: No. of dogs owned and dog food purchasing pattern
(n = 100)
Smart
Shopper
(n = 55)
Value
Seeker
(n = 24)
Health
Driven
(n = 21)
N % N % N %
No. of dogs
owned
One 25 45.5% 14 58.3% 9 42.9%
Two 15 27.3% 4 16.7% 7 33.3%
Three 3 5.5% 2 8.3% 2 9.5%
Four 5 9.1% 1 4.2% 2 9.5%
More than four 7 12.7% 3 12.5% 1 4.8%
Ref. code: 25605902040723ONZ
23
Table 4.10 (cont.): No. of dogs owned and dog food purchasing pattern
(n = 100)
Smart
Shopper
Value
Seeker
Health
Driven
(n = 55) (n = 24) (n = 21)
N % N % N %
Frequency of
purchasing
dog food
> Once/month 21 38.2% 9 37.5% 11 52.4%
Once/month 24 43.6% 9 37.5% 6 28.6%
Once/two months 8 14.5% 5 20.8% 3 14.3%
< Once/two months 2 3.6% 1 4.2% 1 4.8%
Monthly
spending on
dog food per
dog
< 500 THB 1 1.8% 5 20.8% 1 4.8%
501-1,500 THB 27 49.1% 11 45.8% 7 33.3%
1,501-2,500 THB 12 21.8% 4 16.7% 7 33.3%
2,501-3,500 THB 5 9.1% 2 8.3% 1 4.8%
> 3,500 THB 10 18.2% 2 8.3% 5 23.8%
In terms of the frequencies in visiting purchase channel and types of dog food
purchased, there was no significant difference between the means for the three
segments, except for the frequency of providing leftover/scrap (F = 5.112, p < 0.008).
While smart shopper and value seeker seldomly provided leftover/scrap for their dogs
with the mean of 1.91 and 2.38, respectively, health driven segment never provided
leftover/scrap for their dogs with the mean of 1.43.
In general, all respondents often visited pet specialty store to purchase dog food
followed by supermarkets and hypermarkets. Value seeker never purchased dog food
from internet retailers and veterinary clinics whereas smart shopper and health driven
seldomly visited these types of stores. The result also shows that all segments did not
purchase dog food from convenience stores.
Ref. code: 25605902040723ONZ
24
4.2.5 Perception towards BARF
4.2.5.1 Consumer awareness of BARF
From the total of 100 respondents, 64% heard about BARF. Health driven
segment has the highest awareness of 76.2% while smart shopper and value seeker has
the awareness of 61.8% and 58.3%, respectively. Majority of the respondents heard
about BARF from review on internet (42.2%) and other dog owners (31.3%). Smart
shopper and health driven segments mainly received the information abort BARF from
review on internet while value seeker mainly received from other dog owners.
Surprisingly, 38% of the respondents had fed their dogs with BARF. The
segments that had fed BARF were leading by health driven segment at 57.1%, value
seeker at 33.3% and smart shopper at 32.7%. When the people who had not fed their
dogs with BARF were asked if they would like to try, 64.5% said yes. The leading
segments who would like to try feeding BARF were smart shopper at 70.3%, value
seeker at 62.5% and health driven at 44.4%.
Most of health driven segment (38.1%) wanted to prepare BARF by themselves
while only 28.6% would like to purchase ready-to-feed BARF. On the other hand,
majority of smart shopper and value seeker would like to purchase ready-to-feed BARF
at 45.5% and 45.8%, respectively.
Table 4.11: Consumer awareness of BARF
(n = 100)
Smart
Shopper
Value
Seeker
Health
Driven Total
N % N % N % N %
Have you
heard of
BARF?
(n = 100)
Yes 34 61.8% 14 58.3% 16 76.2% 64 64.0%
No 21 38.2% 10 41.7% 5 23.8% 36 36.0%
Ref. code: 25605902040723ONZ
25
Table 4.11 (cont.): Consumer awareness of BARF
(n = 100)
Smart
Shopper
Value
Seeker
Health
Driven Total
N % N % N % N %
Where did
you receive
the
information
about
BARF?
(n = 64)
Review on
internet 14 41.2% 5 35.7% 8 50.0% 27 42.2%
Friends/
Family/
Colleagues
3 8.8% 2 14.3% 2 12.5% 7 10.9%
Pet care
profession
als
5 14.7% 1 7.1% 4 25.0% 10 15.6%
Other dog
owners 12 35.3% 6 42.9% 2 12.5% 20 31.3%
Have you
feed your
dogs with
BARF?
(n = 100)
Yes 18 32.7% 8 33.3% 12 57.1% 38 38.0%
No 37 67.3% 16 66.7% 9 42.9% 62 62.0%
Would you
like to try
feeding
your dog
with BARF
diet?
(n = 62)
Yes 26 70.3% 10 62.5% 4 44.4% 40 64.5%
No 11 29.7% 6 37.5% 5 55.6% 22 35.5%
Would you
rather
prepare
BARF by
yourself or
purchase
ready to
feed BARF?
(n = 100)
Prepare
BARF by
myself
13 23.6% 8 33.3% 8 38.1% 29 29.0%
Purchase
Ready-to-
Feed
BARF
25 45.5% 11 45.8% 6 28.6% 42 42.0%
Not sure 17 30.9% 5 20.8% 7 33.3% 29 29.0%
Ref. code: 25605902040723ONZ
26
4.2.5.2 Influential attitudes and their impacts on willingness for
BARF trial
Linear regression based on stepwise method was conducted to see the
relationships between the dependent variable “Would you like to try feeding your dog
with BARF diet?” with 13 independent variables, i.e. survey questionnaire no. 16. a. to
16. m. The adjusted R-square was 0.22 indicating that 22% of the variation in “Would
you like to try feeding your dog with BARF diet?” can be explained by the three
independent variables which include the consumer attitudes on following statements “I
am unsure about the benefits of BARF”, “Food which is traditionally optimal for a wolf
is optimal for dogs” and “Cooking destroys enzymes needed for digestion”. Whereas
88% of the variation could be impacted by other variables outside the study. P-values
indicated that “I am unsure about the benefits of BARF” (p = 0.038), “Food which is
traditionally optimal for a wolf is optimal for dogs” (p = 0.029) and “Cooking destroys
enzymes needed for digestion” (p = 0.040) significantly impacted the trial of BARF
diet at 0.05 significant level. Moreover, there was no problem of multicollinearity as
the Pearson correlation coefficient value was less than 0.5, indicating a weak
relationship among predictors.
The beta coefficients in table 4.12 explained that the consumers who agree with
“I am unsure about the benefits of BARF” are less willing to try BARF diet for their
dogs. On the other hand, consumers who agree with “Food which is traditionally
optimal for a wolf is optimal for dogs” and “Cooking destroys enzymes needed for
digestion” are more willing to try feeding BARF to their dogs. The equation to predict
the consumer willingness to try feeding BARF diet for their dogs is as follows:
Willingness to try BARF diet = 1.70 - 0.15 (I am unsure about the benefits of
BARF) + 0.14 (Food which is traditionally optimal for a wolf is optimal for dogs) +
0.16 (Cooking destroys enzymes needed for digestion)
Ref. code: 25605902040723ONZ
27
Table 4.12: Influential attitudes and their impacts on willingness for BARF trial
Model
Unstandardized
Coefficients
Standardized
Coefficients t Sig.
B Std. Error Beta
1 (Constant) 1.700 .341 4.987 .000
I am unsure about the
benefits of BARF .152 .071 .253 2.122 .038
Food which is
traditionally optimal
for a wolf is optimal
for dogs
-.138 .062 -.255 -2.234 .029
Cooking destroys
enzymes needed for
digestion
-.162 .077 -.249 -2.099 .040
a. Dependent Variable: Would you like to try feeding your dog with BARF diet?
(n = 62)
R = 0.51, R2 = 0.26, Adjusted R2 = 0.22, F = 6.861, p = 0.000
There was a significant difference between the means of the three segments
towards the attitude that “BARF is more expensive than commercial pet food” (F =
4.934, p < 0.009) with the means of 2.96, 2.33 and 2.38 for smart shopper, value
seeker and health driven, respectively.
In general, the respondents in each segment agree that “Commercial pet food
contains high levels of sodium”, “Commercial pet food contains chemicals that may
harm dogs”, “Commercial dog food can make dogs sick” and “I think that normal
human food is not suitable for dogs”.
Ref. code: 25605902040723ONZ
28
CHAPTER 5
CONCLUSIONS AND RECOMMENDATIONS
With the key megatrends like urbanization, pet humanization and aging society
driving growth of pet care industry in Thailand and across the world, it is important to
keep an eye on the business opportunity that tag along with it due to the change in
consumer attitudes, behaviors, demographics as well as the business landscape. Many
studies suggested that pet owners are willing to spend more on their pets than they did
in the past and dog owners are more concerned with healthfulness and nutritional value
of their dogs’ food than in their own food, along side with the healthy-food trend, BARF
could be an alternative diet for dogs. Therefore, this is the opportunity for a business to
adapt their product and marketing strategy to this emerging trend.
This study “The study on consumer behavior in purchasing dog food and
perception towards biologically appropriate raw food (BARF) for dogs in Bangkok
Metropolitan” aims to explore attitudes and behaviors of dog owners in Bangkok
Metropolitan, factors affecting the consumer purchasing decision for dog food and,
also, to investigate consumer perception and influential attitudes and their impacts on
willingness for BARF trial. To answer research objectives, literature reviews, gathering
secondary data, in-depth interviews and questionnaire survey were conducted with the
following key findings.
5.1 Conclusions
5.1.1 Factors affecting purchasing decision for dog food
The key factors were investigated using 17 independent variables that were
collected from the survey. After reducing the no. of factors, due to multicollinearity, 15
independent variables were grouped into four factors which are healthy, functional
value, reassurance and emotional value.
5.1.2 Segmentation of dog food consumers
Based on the four factors, dog food consumers can be segmented into three
segments which are smart shopper, value seeker and health driven. The demographics
Ref. code: 25605902040723ONZ
29
of the three groups were not significantly different. When the attitudes towards their
dogs were measured, the health driven and value seeker segments strongly believe that
their dogs were the extensions of themselves.
In terms of lifestyle, smart shopper is very interested in technology while the
other two segments are slightly less interested. Smart shopper and value seeker
segments like to party with friends whereas health driven does not like to party. Health
driven and smart shopper need detailed information before making any decision.
In terms of dog food purchasing behaviour, the health driven never provide
leftover/scrap for their dogs while smart shopper and value seeker seldomly provided
leftover/scrap for their dogs. Generally, consumers usually visit, in descending order,
pet specialty store, supermarkets and hypermarkets to purchase dog food.
5.1.3 Perception towards BARF
More than half of the respondents had heard about BARF before, especially,
health driven segment with the highest awareness. Majority of the respondents heard
about BARF from review on internet and other dog owners. Almost half of the
respondents had fed their dogs with BARF which is leading by health driven segment.
Surprisingly, many of the consumers who have been provided with some background
information about BARF are interested in feeding BARF to their dogs.
The result also shows that consumers who are unsure about the benefits of
BARF are less willing to try BARF. On the contrary, the consumers who agree that
“food which is traditionally optimal for a wolf is optimal for dogs” and “cooking
destroys enzymes needed for digestion” are more willing to try feeding BARF to their
dogs. In addition, value seeker and health driven segment do not think that BARF is
more expensive than commercial pet food. Consumers in smart shopper and value
seeker were not sure if their dogs would eat BARF.
5.2 Recommendations
The recommendations, in terms of marketing implications, will be explained
through the marketing mix.
Ref. code: 25605902040723ONZ
30
5.2.1 Product
Since the consumers are now more educated, they are concerned with the
products that they purchase to feed both themselves and their dogs. They believe that
commercial pet food contains high levels of sodium and other chemicals that can
make their dogs sick and they also think that providing human leftover food is not
appropriate for their loving dogs. Hence, the consumers will seek for an alternative
feed which is suitable for their dogs as shown in their interest in trial after provided
information about BARF. This is a great business opportunity for BARF producers.
5.2.2 Price
Majority of the consumers believe that BARF is less expensive than
commercial pet food, except for smart shopper segment, which is not true since
feeding dogs with commercial pet food is less expensive. The belief might be a result
of the perception that unprocessed food has lower associated costs. Additional
research on price sensitivity and customer perceived value will be required to
understand the consumer evaluation process.
5.2.3 Place
It is observed that majority of BARF shops in Thailand sell their products
online. Although it e-commerce channel is growing but from the result, the
respondents often visited pet specialty store, supermarkets and hypermarkets. Online
retailers are not what they preferred yet. Hence, it is recommended that BARF
retailers create their presence in the mentioned channels.
5.2.4 Promotion
The awareness of BARF among the consumers are quite high, but the
consumers have not try feeding BARF. The promotion of BARF should mainly focus
on changing the consumers attitudes by education through content creation on
benefits of BARF and messages including “food which is traditionally optimal for a
wolf is optimal for dogs” and “cooking destroys enzymes needed for digestion” which
can increase the consumer willingness to try feeding BARF.
Ref. code: 25605902040723ONZ
31
3.5 Limitation of the Study
This study could be used as a basic reference for general information and
direction for a further study of consumer attitude and behavior towards BARF in
Bangkok Metropolitan. However, there are some limitations to the study. To illustrate,
with the use of a convenience sampling method for both exploratory and descriptive
research, small sample size and as well as limited time period, the research findings and
results may or may not entirely represent the entire population of interest.
Ref. code: 25605902040723ONZ
32
REFERENCES
Boya, U. O., Dotson, M. J., & Hyatt, E. M. (2015). A comparison of dog food choice
criteria across dog owner. International Journal of Consumer Studies, 74–82.
Central Intelligence Agency. (2017). The World Factbook: Urbanization. Retrieved
December 10, 2017, from https://www.cia.gov/:
https://www.cia.gov/library/publications/the-world-factbook/fields/2212.html
Cerbo, A. D., Morales-Medina, J. C., Palmieri, B., Pezzuto, F., Cocco, R., Flores, G.,
& Iannitti, T. (2017, June). Functional foods in pet nutrition: Focus on dogs and
cats. Research in Veterinary Science, 112, 161-166.
Euromonitor International. (2014, October). Pet Humanisation: The trend and its
strategic impact on global pet care markets. Retrieved November 27, 2017,
from Euromonitor International: http://www.euromonitor.com/pet-
humanisation-the-trend-and-its-strategic-impact-on-global-pet-care-
markets/report
Euromonitor International. (2017, May). Dog Food in Thailand. Retrieved October 5,
2017, from Euromonitor International: http://www.euromonitor.com/dog-food-
in-thailand/report
Euromonitor International. (2017, May). Pet Care in Thailand. Retrieved October 5,
2017, from Euromonitor International: http://www.euromonitor.com/pet-care-
in-thailand/report
International, Euromonitor. (2017, March 16). Asian Trends in Pet Food and Pet Health
- VIV Asia. Retrieved December 8, 2017, from http://www.vivasia.nl/:
Ref. code: 25605902040723ONZ
33
http://www.vivasia.nl/~/media/vivasia-R/Files/Visitor-
2017/presentations%20VIV%20Asia/Euromonitor%20International.pdf
Nielson. (2016, March). The Humanization of Pet Food. How far are pets parents
willing to go? Retrieved December 10, 2017, from http://www.nielsen.com:
http://www.nielsen.com/content/dam/nielsenglobal/kr/docs/global-
report/2016/humanization-of-pet-food-report-mar-2016.pdf
SCB Economic Intelligence Center (EIC). (2017, September 4). Furry companions
driving pet food industry growth. Retrieved October 5, 2017, from Bangkok
Post: https://www.bangkokpost.com/archive/furry-companions-driving-pet-
food-industry-growth/1318039
Schlesinger, D. P., & Joffe, D. J. (2011, January). Raw food diets in companion
animals: A critical review. Retrieved October 22, 2017, from NCBI:
https://www.ncbi.nlm.nih.gov/pmc/articles/PMC3003575/
Tesfom, G., & Birch, N. (2010, September). Do They Buy for Their Dogs the Way
They Buy for Themselves? Psychology & Marketing, 27, pp. 898–912.
Thanansirangkul, J. (2013). Consumer's buying behavior of premium dog food.
Bangkok: Thammasat University.
The World Bank. (2015, January 26). http://www.worldbank.org. Retrieved December
10, 2017, from Urbanization in Thailand is dominated by the Bangkok urban
area: http://www.worldbank.org/en/news/feature/2015/01/26/urbanization-in-
thailand-is-dominated-by-the-bangkok-urban-area
Ref. code: 25605902040723ONZ
35
APPENDIX A
TIMELINE PLAN
The timeline for this research was 6 months starting from October 6th, 2017 to April 6th, 2017. The comprehensive report was
submitted on April 6th, 2018.
W1 W2 W3 W4 W1 W2 W3 W4 W1 W2 W3 W4 W1 W2 W3 W4 W1 W2 W3 W4 W1 W2 W3 W4 W1 W2 W3 W4
Submit Proposal Topic Statement 6
Secondary Research
Design In-Depth Interview Questions
Pilot Test of In-Depth Interview
Submit Progress Report I 27
Conduct In-Depth Interviews
Data Analysis
Liturature Review
Submit Progress Report II 27
Preparing Report
Submit Final Proposal Report 13
Design Online Questionnaires
Pilot Test Online Questionnaires
Revise the Online Questionnaires
Launch Online Questionnaires
Revise Proposal Report 8
Submit Progress Report I 24
Data Analysis
Submit Progress Report II 15
Prepare Comprehensive Report
Submit Comprehensive Report 6
FEB 2018 MAR 2018 APR 2018Activities
NOV 2017OCT 2017 DEC 2017 JAN 2018
Ref. code: 25605902040723ONZ
36
APPENDIX B
SURVEY QUESTIONNAIRE
Section A: Screening Questions
1. Do you live within Bangkok Metropolitan region? (Single Answer)
☐ Yes ☐ No [End of Questionnaire]
2. Do you own a dog(s)? (Single Answer)
☐ Yes ☐ No [End of Questionnaire]
3. Did you purchase dog food within the past three months? (Single Answer)
☐ Yes ☐ No [End of Questionnaire]
Section B: Consumer Attitude and Behavior
4. How much do you agree with following statements? (1=strongly disagree,
2=disagree, 3=agree and 4=strongly agree) (Single Answer)
Statements Strongly
Disagree Disagree Agree
Strongly
Agree
a. My dog is my best friend 1 2 3 4
b. Spending time with my dog
prevents me from spending time
with other humans
1 2 3 4
c. My dog(s) have helped me
develop better relationships with
other people
1 2 3 4
d. I would not be willing to establish
a relationship with someone who
was not willing to accept my dog
1 2 3 4
Ref. code: 25605902040723ONZ
37
e. My dog is an extension of myself 1 2 3 4
f. I see dogs as more like people than
wild animals
1 2 3 4
g. I feel like I can communicate with
my dogs
1 2 3 4
h. My dog is a part of my family 1 2 3 4
i. My dog is like a child to me 1 2 3 4
j. I learn a lot from my dogs 1 2 3 4
k. I have the same responsibilities as
a parent when it comes to taking
care of my dog
1 2 3 4
l. My dog gets to eat better food than
me
1 2 3 4
5. How much do you agree with following statements? (1=strongly disagree,
2=disagree, 3=agree and 4=strongly agree) (Single Answer)
Statements Strongly
Disagree Disagree Agree
Strongly
Agree
a. I exercise regularly 1 2 3 4
b. I have a healthy diet 1 2 3 4
c. I usually spend my free time at
home
1 2 3 4
d. I take my dog to the veterinarian
regularly
1 2 3 4
e. I like to travel 1 2 3 4
f. I am interested in technology 1 2 3 4
g. I like to party with friends 1 2 3 4
h. I like to try something new 1 2 3 4
Ref. code: 25605902040723ONZ
38
i. I like to have detailed
information before making any
decision
1 2 3 4
j. I like cooking 1 2 3 4
k. I usually take my dog for a walk 1 2 3 4
6. How many dogs do you have? (Single Answer)
☐ One ☐ Two
☐ Three ☐ Four
☐ More than four
7. How often do you purchase the following dog food? (1=never, 2=seldom, 3
sometimes and 4=often) (Single Answer)
Type of Dog Food Never Seldom Sometimes Often
a. Dog treats and mixers 1 2 3 4
b. Dry dog food 1 2 3 4
c. Wet dog food 1 2 3 4
d. Leftovers/scrap 1 2 3 4
8. How often do you purchase dog food from the following? (1=never,
2=seldom, 3 sometimes and 4=often) (Single Answer)
Channels Never Seldom Sometimes Often
a. Specialty stores (eg. pet store,
pet equipment store)
1 2 3 4
b. Convenience store (eg. 7-
Eleven, Family mart)
1 2 3 4
c. Supermarkets (eg. Tops, Villa
Market, Foodland)
1 2 3 4
Ref. code: 25605902040723ONZ
39
d. Hypermarkets (eg. Big C, Tesco
Lotus, Makro)
1 2 3 4
e. Internet retailers 1 2 3 4
f. Veterinary clinics 1 2 3 4
g. Other (Please specify)… 1 2 3 4
9. How often do you purchase dog food? (Single Answer)
☐ More than once/month ☐ Once/month
☐ Once every two months ☐ Less than once every two months
10. What’s your monthly spending on dog food per dog? (Single Answer)
☐ Less than 500 THB ☐ 501-1,500 THB
☐ 1,501-2,500 THB ☐ 2,501-3,500 THB
☐ More than 3,500 THB
11. How important are the following factors in your purchase decision for dog
food? (1=not important, 2=slightly important, 3=important and 4=very
important) (Single Answer)
Factors Not
Important
Slightly
Important Important
Very
Important
a. Hygiene 1 2 3 4
b. Value for money 1 2 3 4
c. Packaging 1 2 3 4
d. Brand 1 2 3 4
e. Flavor 1 2 3 4
f. Smell 1 2 3 4
g. Nutrition 1 2 3 4
h. Easy to prepare 1 2 3 4
i. Natural / Organic Ingredients 1 2 3 4
Ref. code: 25605902040723ONZ
40
j. No preservatives 1 2 3 4
k. No flavoring agent 1 2 3 4
l. No coloring agent 1 2 3 4
m. Low sodium 1 2 3 4
n. Gluten Free 1 2 3 4
o. Reviews from other dog
owners 1 2 3 4
p. Recommendations from pet
care professional 1 2 3 4
q. Recommendations from
friends / family / colleagues 1 2 3 4
12. Have you heard of BARF (Biologically Appropriate Raw Food or Bones and
Raw Food) for dogs? (Single Answer)
☐ Yes [Proceed to 14] ☐ No [Proceed to information about
BARF]
13. Where did you receive the information about BARF? (Single Answer)
☐ Review on internet ☐ Friends/ Family/ Colleagues
☐ Pet care professionals ☐ Other dog owners
☐ Other (Please specify)…
Section C: Information about BARF
Please read the information below to understand the product offering, price and
benefits of commercial BARF in order to proceed with the next section.
Thank you BONE and RAW (https://www.facebook.com/boneandraw/) for the
supporting information for the survey.
Ref. code: 25605902040723ONZ
42
Section D: Consumer Perception on BARF
14. Have you feed your dogs with BARF (Biologically Appropriate Raw Food or
Bones and Raw Food)? (Single Answer)
☐ Yes [Proceed to 17] ☐ No [Proceed to 16]
15. Would you like to try feeding your dog with BARF diet? (Single Answer)
☐ Yes ☐ No
16. How much do you agree with following statements? (1=strongly disagree,
2=disagree, 3=agree and 4=strongly agree) (Single Answer)
Statements Strongly
Disagree Disagree Agree
Strongly
Agree
a. Food which is traditionally
optimal for a wolf is optimal for
dogs
1 2 3 4
b. Dogs can get infected with the
bacteria in raw meat diets
1 2 3 4
c. I am unsure about the benefits of
BARF
1 2 3 4
d. Cooking destroys enzymes
needed for digestion
1 2 3 4
e. Cooking can lead to nutrient loss
in food
1 2 3 4
f. Commercial pet food contains
high levels of sodium
1 2 3 4
g. Commercial pet food contains
chemicals that may harm dogs
1 2 3 4
h. Commercial dog food can make
dogs sick
1 2 3 4
Ref. code: 25605902040723ONZ
43
i. It is difficult to prepare a balanced
BARF diet for dogs on your own
1 2 3 4
j. BARF might be contaminated
with parasites
1 2 3 4
k. BARF is more expensive than
commercial pet food
1 2 3 4
l. I am not sure if my dog would eat
BARF
1 2 3 4
m. I think that normal human food is
not suitable for dogs
1 2 3 4
Section E: Consumer Demographics
17. What's your gender? (Single Answer)
☐ Male ☐ Female
18. What's your age? (Single Answer)
☐ Below 21 ☐ 21 – 30 ☐ 31 - 40
☐ 41 – 50 ☐ 51 – 60 ☐ Above 60
19. What’s your level of education? (Single Answer)
☐ Below High School ☐ High School or Equivalent
☐ Bachelor’s Degree ☐ Master's Degree
☐ Doctorate Degree
20. What’s your occupation? (Single Answer)
☐ Business Owner ☐ Corporate Employee
☐ Freelance ☐ Government / State Enterprise Officer
☐ Housewife ☐ Student
Ref. code: 25605902040723ONZ
44
☐ Retired ☐ Unemployed
21. What's your monthly personal income? (Single Answer)
☐ Below 20,000 THB ☐ 20,001 - 35,000 THB
☐ 35,001 - 50,000 THB ☐ 50,001 - 65,000 THB
☐ Above 65,000 THB
22. What’s your marital status? (Single Answer)
☐ Single ☐ Married, no children
☐ Married with children ☐ Married, children have left home
☐ Divorced / Separated ☐ Widow
23. What type of residence do you live in? (Single Answer)
☐ Apartment / Flat ☐ Townhouse
☐ Single-detached house ☐ Condominium
END OF THE SURVEY
Ref. code: 25605902040723ONZ
45
APPENDIX C
SPSS RESULTS
Table C.1: Pearson’s correlation matrix on factors affecting consumer purchasing decision (n = 100)
Correlations
12. a. 12. b. 12. c. 12. d. 12. e. 12. f. 12. g. 12. h. 12. i. 12. j. 12. m. 12. n. 12. o. 12. p. 12. q.
12. a. 1.00
12. b. 1.00
12. c. .28** .35** 1.00
12. d. .38** .29** 1.00
12. e. .36** .33** .27** 1.00
12. f. .24* .29** .23* .80** 1.00
12. g. .62** .22* .45** 1.00
12. h. .40** .20* .29** 1.00
12. i. .44** .32** .48** 1.00
12. j. .41** .21* .55** .72** 1.00
12. m. .44** .22* .58** .64** .75** 1.00
12. n. .34** .23* .24* .36** .60** .69** .66** 1.00
12. o. .21* .28** .31** .43** .45** .34** .35** 1.00
12. p. .27** .21* .39** .39** .34** .35** .39** .26** .66** 1.00
12. q. .247* .27** .21* .50** .45** 1.00
**. Correlation is significant at the 0.01 level (2-tailed).
*. Correlation is significant at the 0.05 level (2-tailed).
Ref. code: 25605902040723ONZ
46
Table C.2: Total Variance Explained
Total Variance Explained
Com
ponen
t Initial Eigenvalues Extraction Sums of
Squared Loadings
Rotation Sums of
Squared Loadings
Total % of
Var.
Cum.
% Total
% of
Var. Cum.% Total
% of
Var. Cum.%
1 4.806 32.041 32.041 4.806 32.041 32.041 3.643 24.289 24.289
2 2.258 15.052 47.092 2.258 15.052 47.092 2.397 15.981 40.270
3 1.890 12.601 59.693 1.890 12.601 59.693 2.095 13.967 54.236
4 1.249 8.326 68.020 1.249 8.326 68.020 2.068 13.783 68.020
5 .939 6.263 74.283
6 .774 5.162 79.444
7 .675 4.498 83.943
8 .474 3.158 87.100
9 .415 2.768 89.869
10 .365 2.433 92.301
11 .324 2.160 94.461
12 .280 1.870 96.331
13 .217 1.450 97.780
14 .184 1.228 99.009
15 .149 .991 100.000
Ref. code: 25605902040723ONZ
47
BIOGRAPHY
Name Mr. Suchinda Poocharoen
Date of Birth July 27, 1990
Educational Attainment
2013: Bachelor in Engineering
Major in Chemical Engineering,
Sirindhorn International Institute of Technology
Thammasat University
Work Experiences 2013 – 2017: Export Sales Engineer
The Siam Refractory Industry Co., Ltd.
A subsidiary of The Siam Cement Public
Company Limited
Ref. code: 25605902040723ONZ