14 - 021 JR 1R THE STUDY ON EFFICIENT AND INTEGRATED TRANSPORT/LOGISTICS DEVELOPMENT IN EASTERN MPA FINAL REPORT MARCH 2014 JAPAN INTERNATIONAL COOPERATION AGENCY ORIENTAL CONSULTANTS CO., LTD. NIPPON KOEI CO., LTD. MITSUBISHI CORPORATION SUMITOMO CORPORATION TOYOTA TSUSHO CORPORATION KAMIGUMI CO., LTD. COORDINATING MINISTRY OF ECONOMIC AFFAIRS THE REPUBLIC OF INDONESIA
COORDINATING MINISTRY OF ECONOMIC AFFAIRS THE REPUBLIC OF INDONESIA
US$1.00 = Rp.12,175.58 US$1.00 = JPY104.71
(Exchange rate of January 2014)
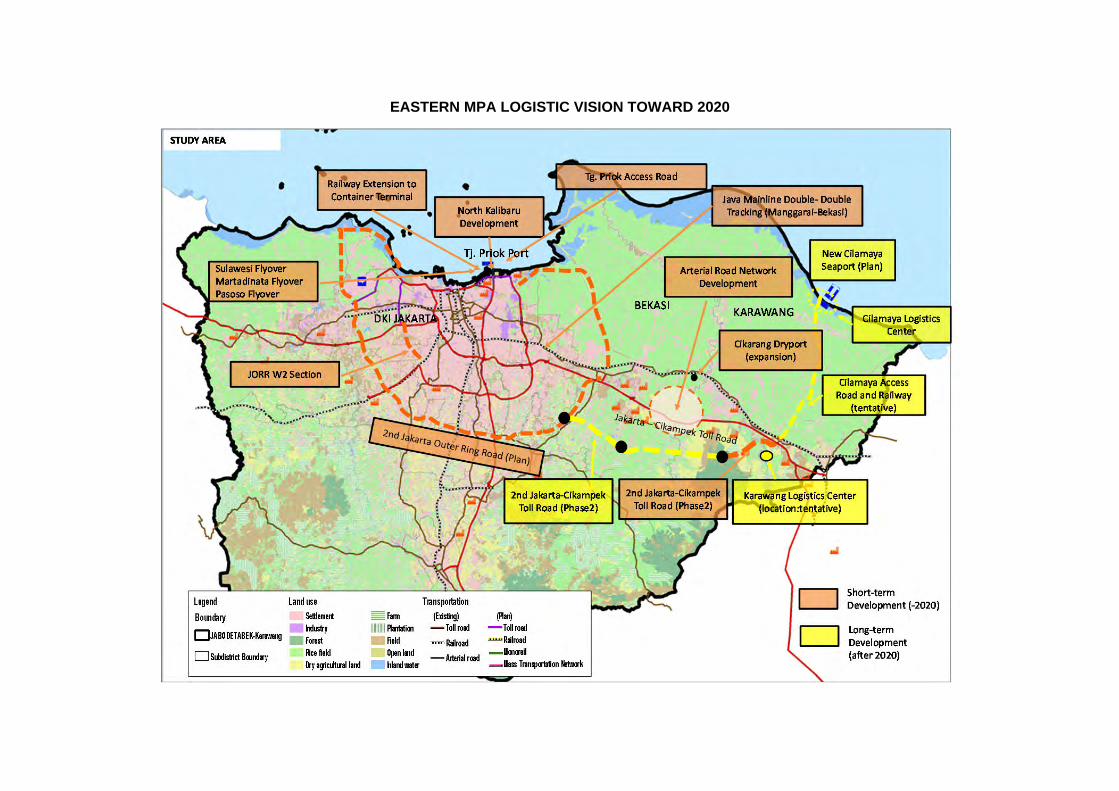
EASTERN MPA LOGISTIC VISION TOWARD 2020
The Study on Efficient and Integrated Transport/Logistics Development in Eastern MPA
S-1
SUMMARY 1. INTRODUCTION
Background of the Study 1.1
1.1.1 Significance of the Eastern MPA
This study area is recognized as being one of the six economic corridors in the Expansion of Indonesian Economic Development (MP3EI), and is also recognized as being a significant area to develop the growth sub-corridor in MPA (Figure S.1.1.1)
Figure S.1.1.1 Economic Corridors in Indonesia and GRDP of Each Economic Corridor, and the Concept of Greater Jakarta MPA
1.1.2 The Problem of High Logistics Costs
Industrial estates along the Jakarta-Cikampek Toll Road are confronted with the problem of high logistics costs caused by serious traffic congestion and various terminal problems in Tanjung Priok Port. The problem of high logistics costs is occurring due to the long transportation time between Tanjung Priok Port and Jakarta MPA.
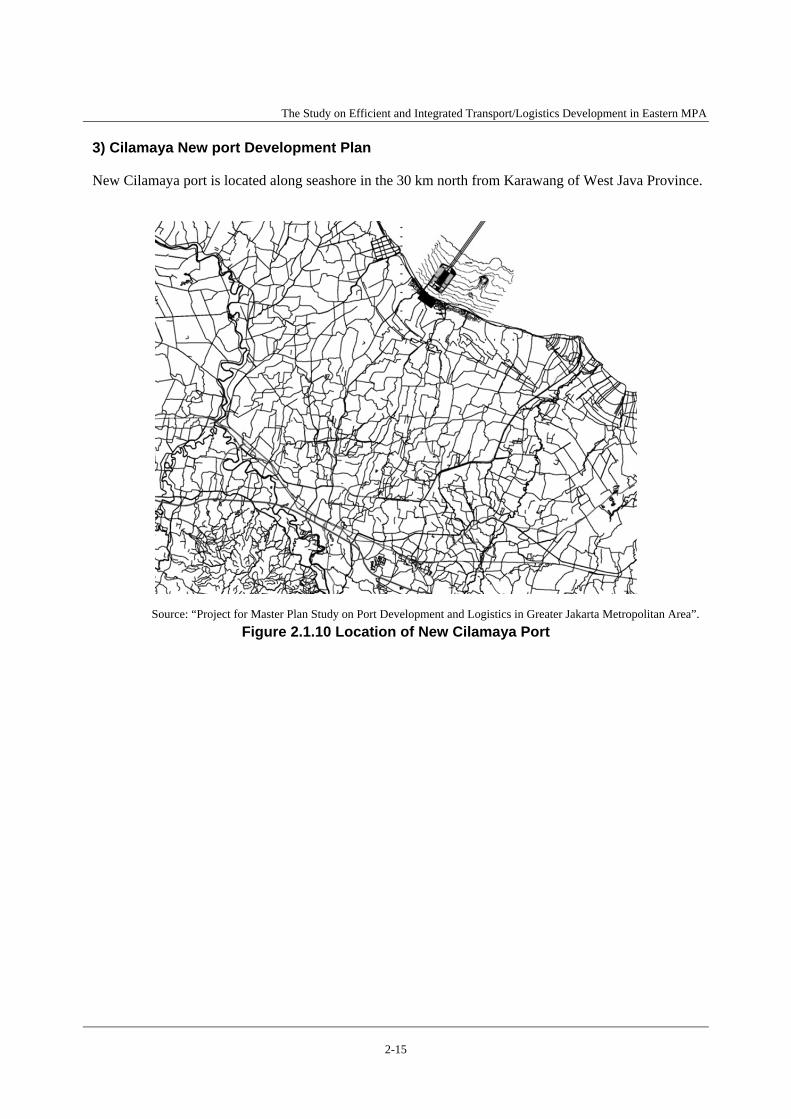
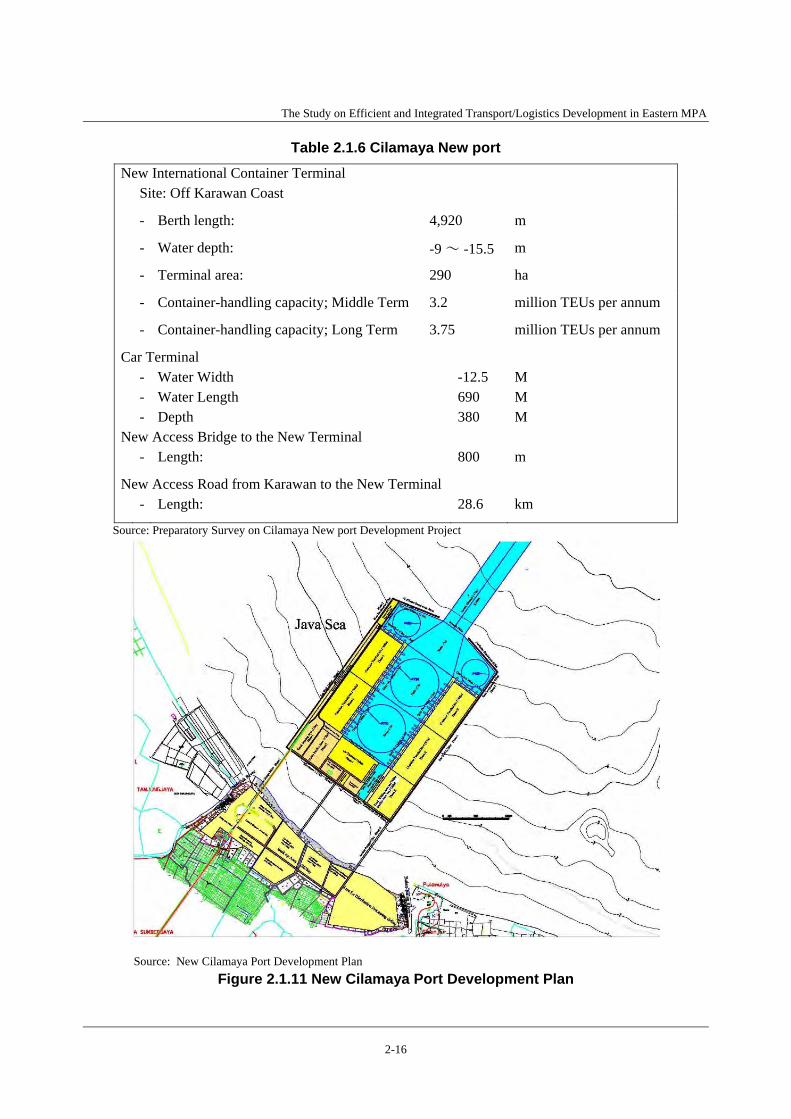
1.1.3 Development of Cilamaya New International Port
The logistics improvement project in Jakarta MPA is conducted based on the conditions precedent of the Cilamaya new international port development, a core project authorized by the flagship project of MPA, MP3EI, and the master plan of the Ministry of Transport.
Survey and Study Areas 1.2
The Study will cover large areas of JABODETABEK and Karawang Regency, with particular focus on the Eastern MPA (West Java Province, Karawang Regency, and Bekasi Regency) — defined as the Survey Area. Included in the Study Area are the harbour district where construction of Cilamaya New
①East Sumatra
②North Java
③Kalimantan
④West Sulawesi⑤East Java
/Nusa Tenggara⑥Papua
②North Java
①East Sumatra ③Kalimantan ④West Sulawesi
⑤East Java/Nusa Tenggara⑥Papua
Jakarta Metropolitan
Million US$
Source: Indonesian Economics Development Corridors High Level Recommendation on Institutional Framework for Metropolitan Priority Area Project in Jakarta (December 2010)
Source: MPA Interim Report
The Study on Efficient and Integrated Transport/Logistics Development in Eastern MPA
S-2
Port is planned, and the surrounding region of industrial estates in Bekasi and Karawang that is planning to introduce the hard infrastructure.
Objectives of the Study 1.3
The Study has been conducted to be able to provide:
(1) Recommendations contributing to logistic improvement in Eastern MPA until 2020;
(2) Recommendations contributing to logistic improvement in Eastern MPA after the opening of Cilamaya seaport in 2020.
The Study on Efficient and Integrated Transport/Logistics Development in Eastern MPA
S-3
2. CURRENT STATUS, FUTURE PROSPECTS, ISSUES AND SOLUTIONS OF TRANSPORTATION AND LOGISTICS IN STUDY AREA
Items Current Status Future Prospects and Issues Solutions (Direction)
2.1 Facilities of Tanjung Priok Port
2.1.1 Tanjung Priok Port
Tanjung Priok Port plays an invaluable role in providing essential logistics facilities in the Jakarta Metropolitan Area. (Figure 2.1.1 Main Terminals in Tanjung Priok Port) The container throughput in Tanjung Priok Port is steadily increasing, as shown in Table 2.1.1 and Figure 2.1.2. Container throughput in 2012 was over 6.2 million TEU. Among them, 4.1 million TEU were international containers and 2.1 were domestic ones. The volume of international containers has already exceeded the total handling capacity (3.95 million TEU) of the three major international container terminals, namely JICT-1, KOJA, and MAL. Capacities are shown in Table 2.1.2. These terminals have been making strong efforts to increase their container-handling capacities. Excess volume is handled in other small-scale container terminals and non-container terminals. Investment for capacity improvement is required urgently.
The volume of international containers in 2012 was actually 4.1 million TEU, but the throughput of international containers is estimated at 7.2 million TEU in 2020, and estimated at 13.4 million TEU in 2030. In addition, total container throughput, including domestic containers, is forecasted at 11 million TEU in 2020, and 20 million TEU in 2030. Thus, mere capacity increase by North Kalibaru Project is not enough. To deal with the growth in demand, it is necessary to construct a North Kalibaru container terminal as a short-term measure, and to construct a Cilamaya new port as a long-term measure. Issues on North Kalibaru Development Project are summarized as follows; - Early Commencement of Terminal Operation Described in
Short-Term - Continuous Implementation of Mid-Term Plan - Evaluation of Long-Term Plan - Evaluation of Maximum Depth of channels, basins and
quay-walls - Issues on Access Road
A short-term countermeasure of infrastructure for shortage of terminal space at Tanjung Priok Port is required in addition to the early service of a new container terminal developed at North Kalibaru until the opening of Cilamaya New Port. 1) Continuous Input of New GCs 2) Continuous Input of New RTGs 3) Capacity Improvement of Other Small Container Terminals and
Non-Container Terminals
2.2 Container Depots There are many container depots, such as TPS container depot, LCL container depot, and empty container depots surrounding Tanjung Priok Port (Figure 2.1.4). However, traffic congestion worsens with the increase of deadhead to the container depots surrounding the port. That means empty containers are increasing due to the adverse balance of trade in Tanjung Priok Port in recent years.
Container yard congestion created by increase of recent demand and the change of OB regulations, (the occupancy ratio of the in-terminal container yard reduced from 85% to 65%) forebodes an increase of passage to the outside of the container terminal before and after customs clearance from now on. The adverse balance of trade is considered will likely not be changed in a short time. Thus, the problems of the empty container depots and the increase of deadhead to the container depots surrounding the port will likely increase traffic jams. However, it is difficult to make a new container depot due to a shortage of space surrounding Tanjung Priok Port.
TPS container depot and the empty container depots surrounding Tanjung Priok Port should be transferred to the Eastern MPA where cargo demand is highest and thereby alleviate the traffic congestion that worsens with the increase of deadhead to the container depots surrounding the port. TPP and LCL container depot are to be constructed in a vacant lot created by the transfer of TPS Container Depot and an empty container depot and they will deal with OB containers.
2.3 Cargo Handling System in Tanjung Priok Port
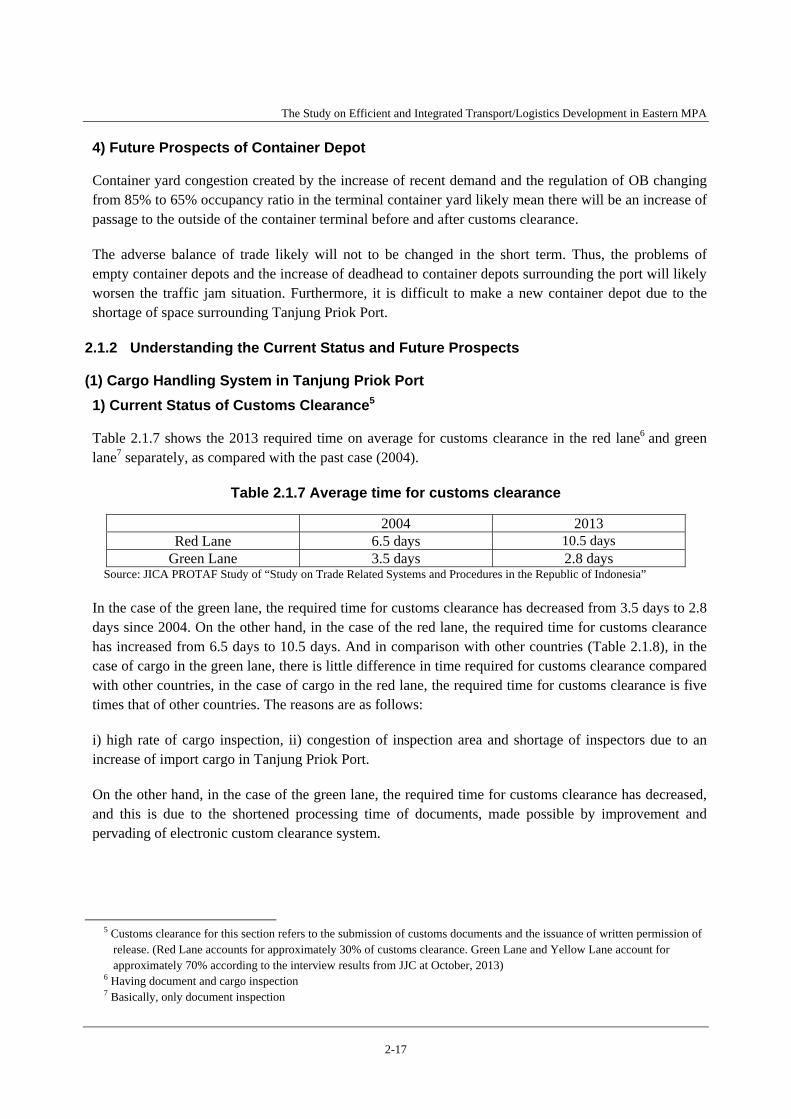
2.3.1 Customs Clearance
The required time on average for customs clearance is 10.5 days in the red lane and 2.8 days in the green lane at present. The required time for customs clearance in the green lane has improved compared with 2004, but the red lane requires more days. The reasons are as follows: i) high rate of cargo inspection ii) congestion of inspection area and shortage of inspectors because of increased import cargo in Tanjung Priok Port.
At present, red lane importers will be transferring from red lane to yellow lane and green lane by building a track record of customs clearance. And as a result, the required time for customs clearance is expected to decrease. However, it is difficult to know how many clearances importers need in order to transfer to the next level, because there is no definite standard. And if more start-up companies are added for customs clearance, customs clearance in the red lane will increase and thus total required time for customs clearance up to the increased volume of customs clearance is considered to be increased.
It is possible to decrease, by around one day, the required time for customs clearance by conducting payment of customs duty all together with import declaration. When the cargo is classified into red lane, importer themselves have to find a customs inspector, so one or two days are required. To avoid the need for importers to find an inspector themselves, an inspector should be nominated automatically at the time of classification into red lane, by developing an electronic procedure. An increase of customs officer staff is planned as a short-term solution together with the development of an electronic procedure. If this procedure is developed, the process of procuring an import permit in the red lane may be reduced by one or two days compared with the present situation.
The Study on Efficient and Integrated Transport/Logistics Development in Eastern MPA
S-4
Items Current Status Future Prospects and Issues Solutions (Direction)
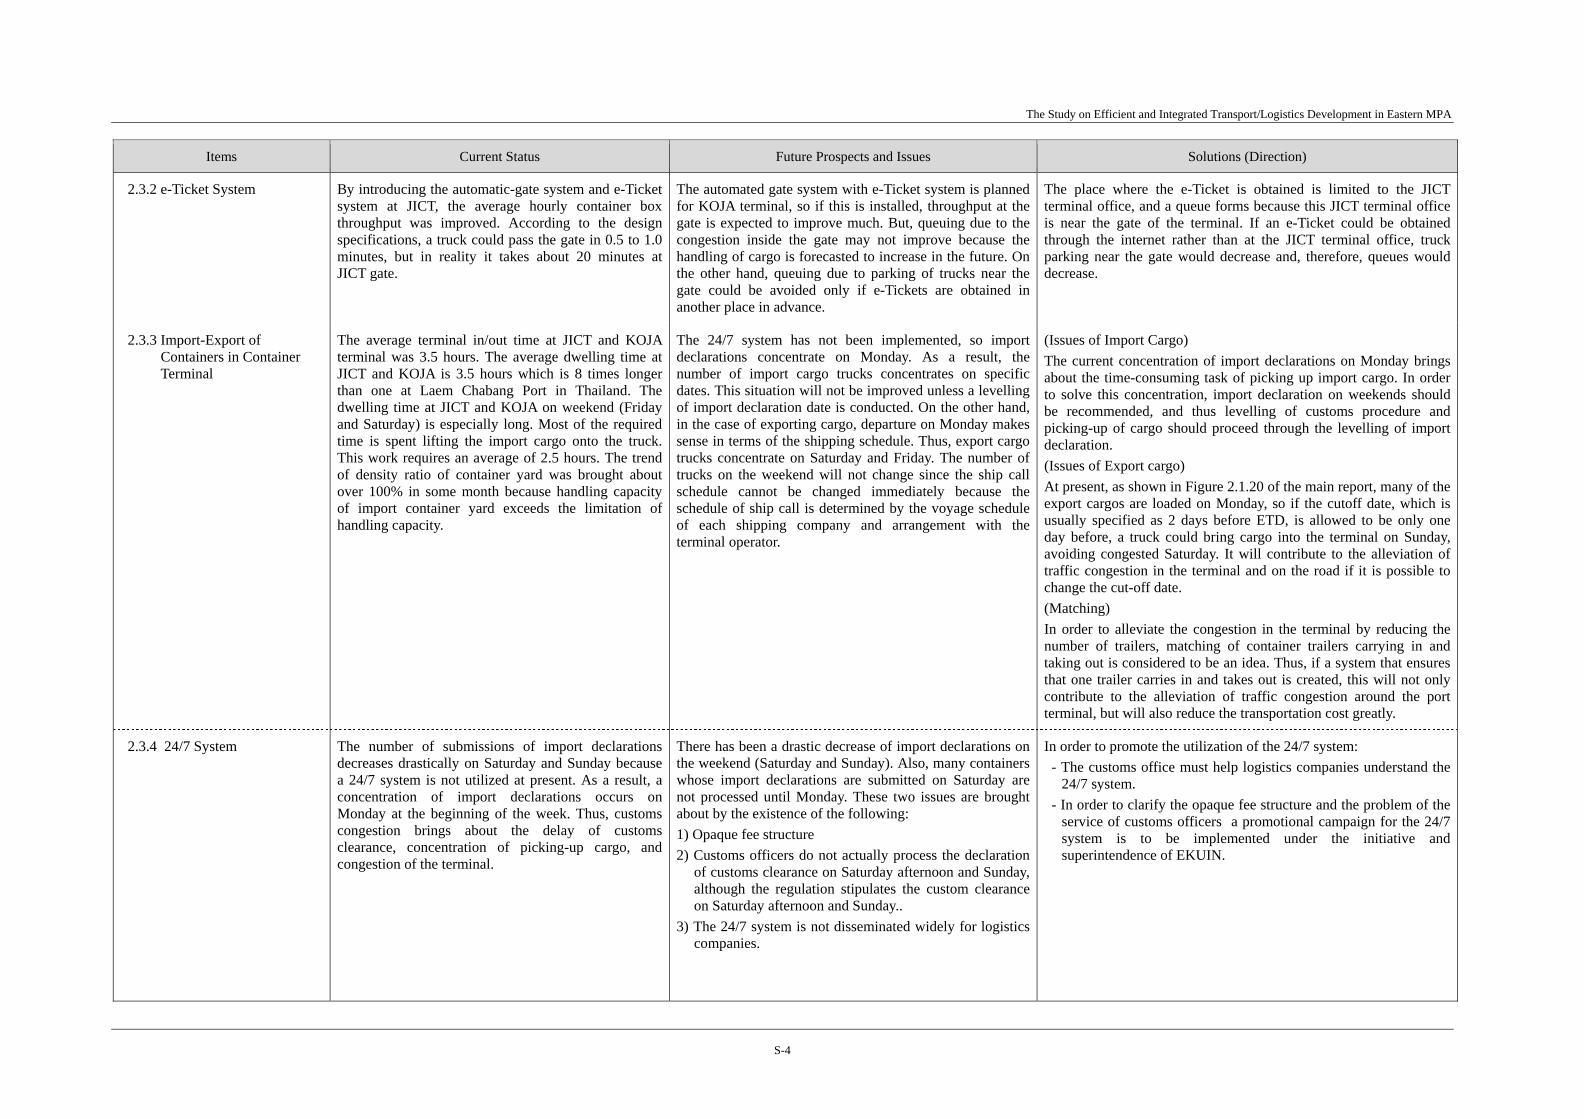
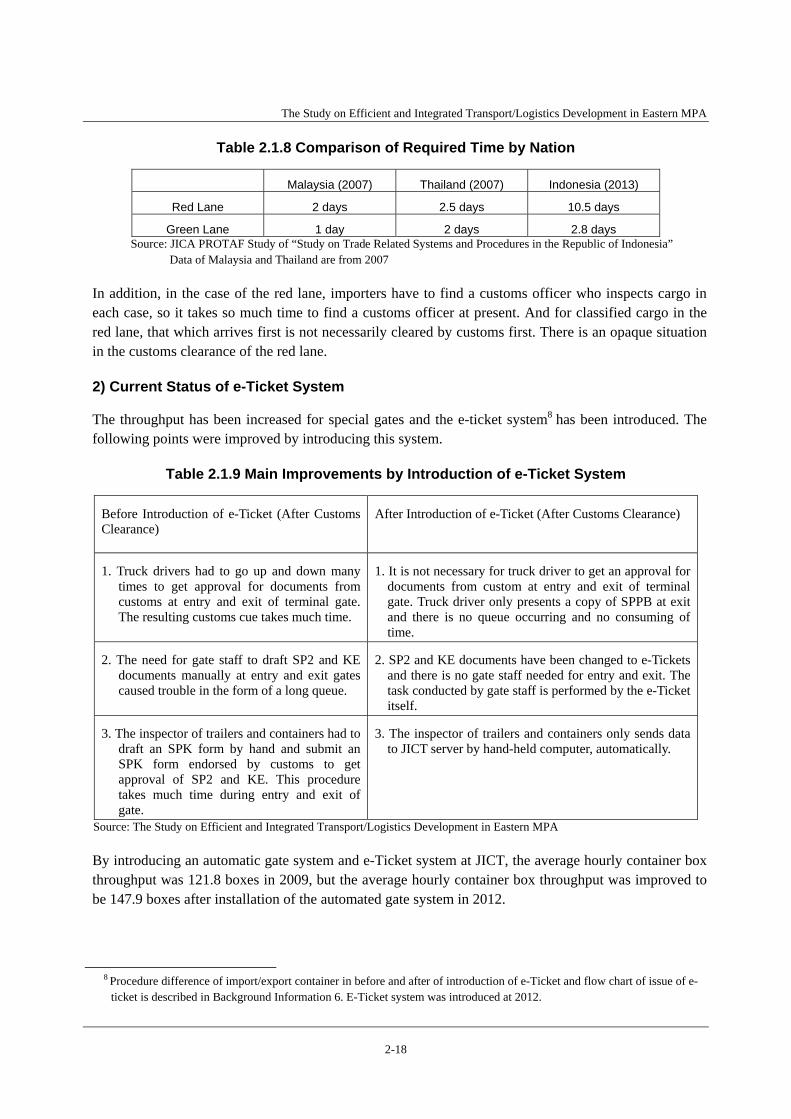
2.3.2 e-Ticket System
By introducing the automatic-gate system and e-Ticket system at JICT, the average hourly container box throughput was improved. According to the design specifications, a truck could pass the gate in 0.5 to 1.0 minutes, but in reality it takes about 20 minutes at JICT gate.
The automated gate system with e-Ticket system is planned for KOJA terminal, so if this is installed, throughput at the gate is expected to improve much. But, queuing due to the congestion inside the gate may not improve because the handling of cargo is forecasted to increase in the future. On the other hand, queuing due to parking of trucks near the gate could be avoided only if e-Tickets are obtained in another place in advance.
The place where the e-Ticket is obtained is limited to the JICT terminal office, and a queue forms because this JICT terminal office is near the gate of the terminal. If an e-Ticket could be obtained through the internet rather than at the JICT terminal office, truck parking near the gate would decrease and, therefore, queues would decrease.
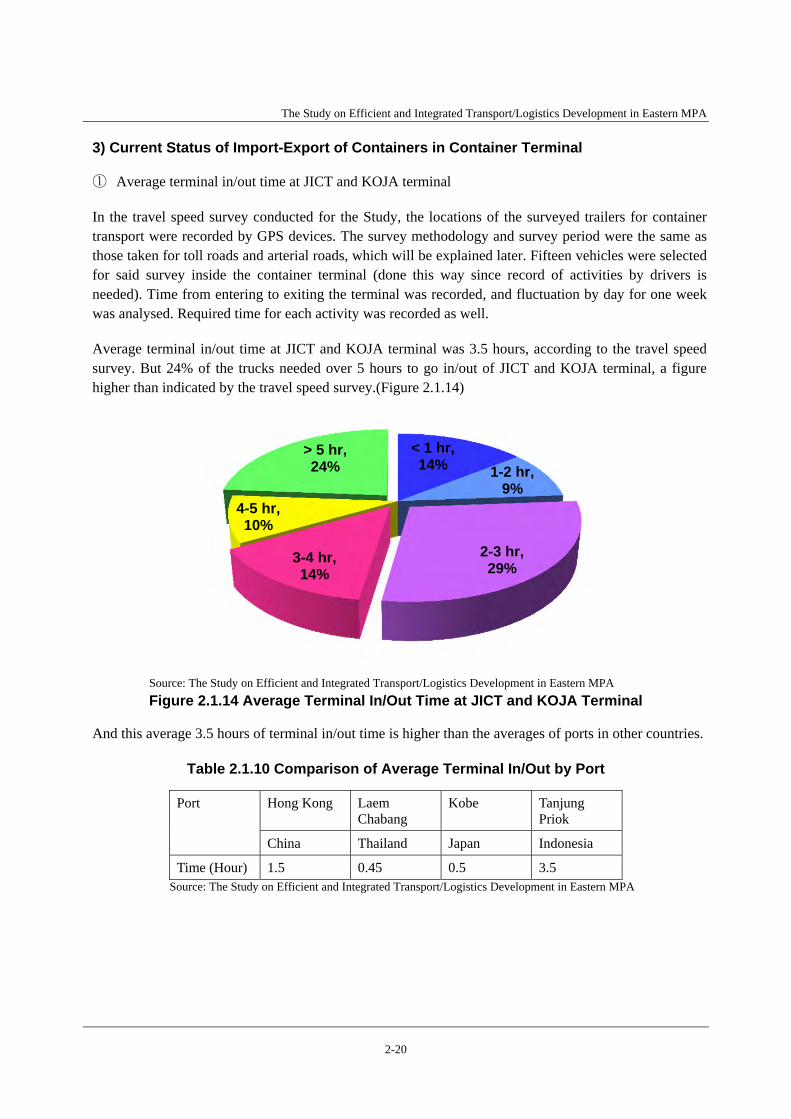
2.3.3 Import-Export of Containers in Container Terminal
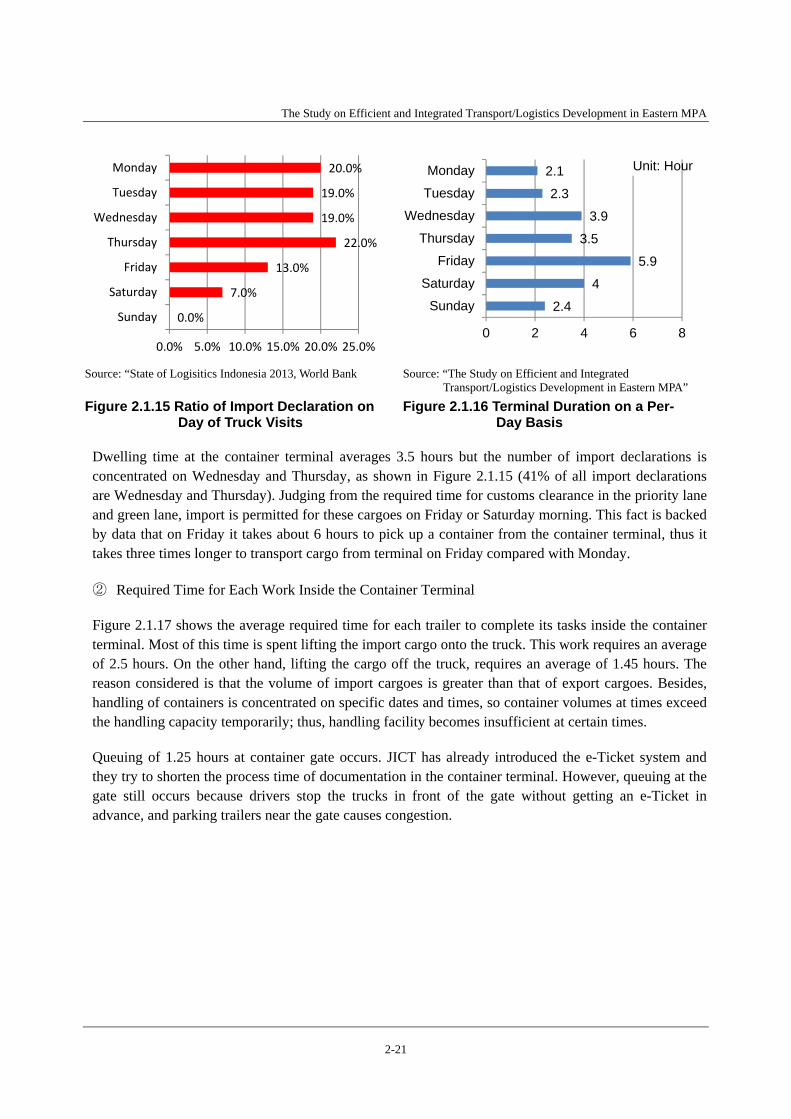
The average terminal in/out time at JICT and KOJA terminal was 3.5 hours. The average dwelling time at JICT and KOJA is 3.5 hours which is 8 times longer than one at Laem Chabang Port in Thailand. The dwelling time at JICT and KOJA on weekend (Friday and Saturday) is especially long. Most of the required time is spent lifting the import cargo onto the truck. This work requires an average of 2.5 hours. The trend of density ratio of container yard was brought about over 100% in some month because handling capacity of import container yard exceeds the limitation of handling capacity.
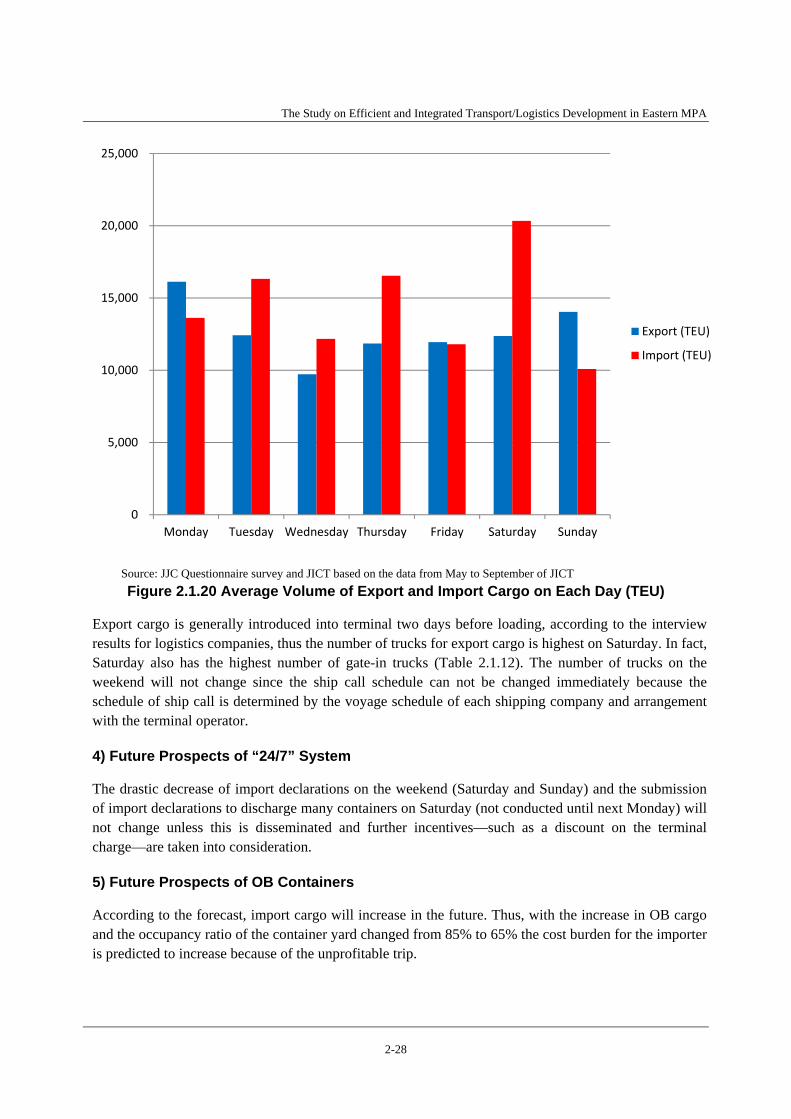
The 24/7 system has not been implemented, so import declarations concentrate on Monday. As a result, the number of import cargo trucks concentrates on specific dates. This situation will not be improved unless a levelling of import declaration date is conducted. On the other hand, in the case of exporting cargo, departure on Monday makes sense in terms of the shipping schedule. Thus, export cargo trucks concentrate on Saturday and Friday. The number of trucks on the weekend will not change since the ship call schedule cannot be changed immediately because the schedule of ship call is determined by the voyage schedule of each shipping company and arrangement with the terminal operator.
(Issues of Import Cargo) The current concentration of import declarations on Monday brings about the time-consuming task of picking up import cargo. In order to solve this concentration, import declaration on weekends should be recommended, and thus levelling of customs procedure and picking-up of cargo should proceed through the levelling of import declaration. (Issues of Export cargo) At present, as shown in Figure 2.1.20 of the main report, many of the export cargos are loaded on Monday, so if the cutoff date, which is usually specified as 2 days before ETD, is allowed to be only one day before, a truck could bring cargo into the terminal on Sunday, avoiding congested Saturday. It will contribute to the alleviation of traffic congestion in the terminal and on the road if it is possible to change the cut-off date. (Matching) In order to alleviate the congestion in the terminal by reducing the number of trailers, matching of container trailers carrying in and taking out is considered to be an idea. Thus, if a system that ensures that one trailer carries in and takes out is created, this will not only contribute to the alleviation of traffic congestion around the port terminal, but will also reduce the transportation cost greatly.
2.3.4 24/7 System
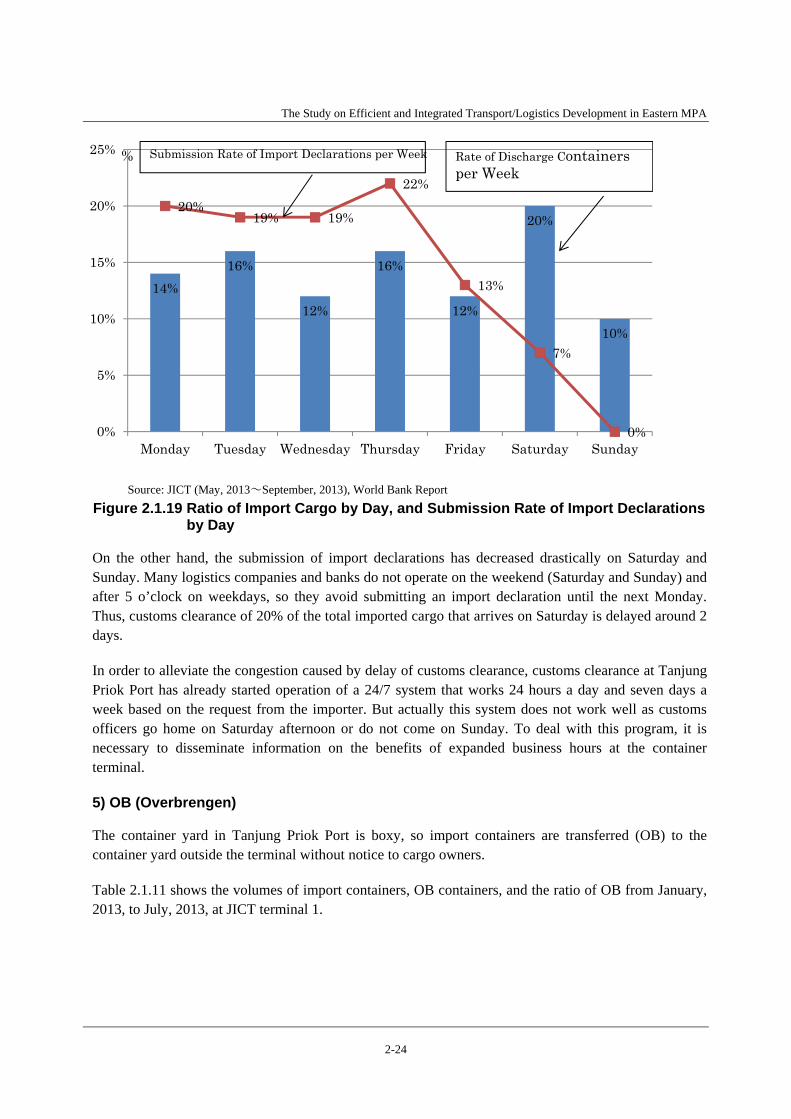
The number of submissions of import declarations decreases drastically on Saturday and Sunday because a 24/7 system is not utilized at present. As a result, a concentration of import declarations occurs on Monday at the beginning of the week. Thus, customs congestion brings about the delay of customs clearance, concentration of picking-up cargo, and congestion of the terminal.
There has been a drastic decrease of import declarations on the weekend (Saturday and Sunday). Also, many containers whose import declarations are submitted on Saturday are not processed until Monday. These two issues are brought about by the existence of the following: 1) Opaque fee structure 2) Customs officers do not actually process the declaration
of customs clearance on Saturday afternoon and Sunday, although the regulation stipulates the custom clearance on Saturday afternoon and Sunday..
3) The 24/7 system is not disseminated widely for logistics companies.
In order to promote the utilization of the 24/7 system: - The customs office must help logistics companies understand the
24/7 system. - In order to clarify the opaque fee structure and the problem of the
service of customs officers a promotional campaign for the 24/7 system is to be implemented under the initiative and superintendence of EKUIN.
The Study on Efficient and Integrated Transport/Logistics Development in Eastern MPA
S-5
Items Current Status Future Prospects and Issues Solutions (Direction)
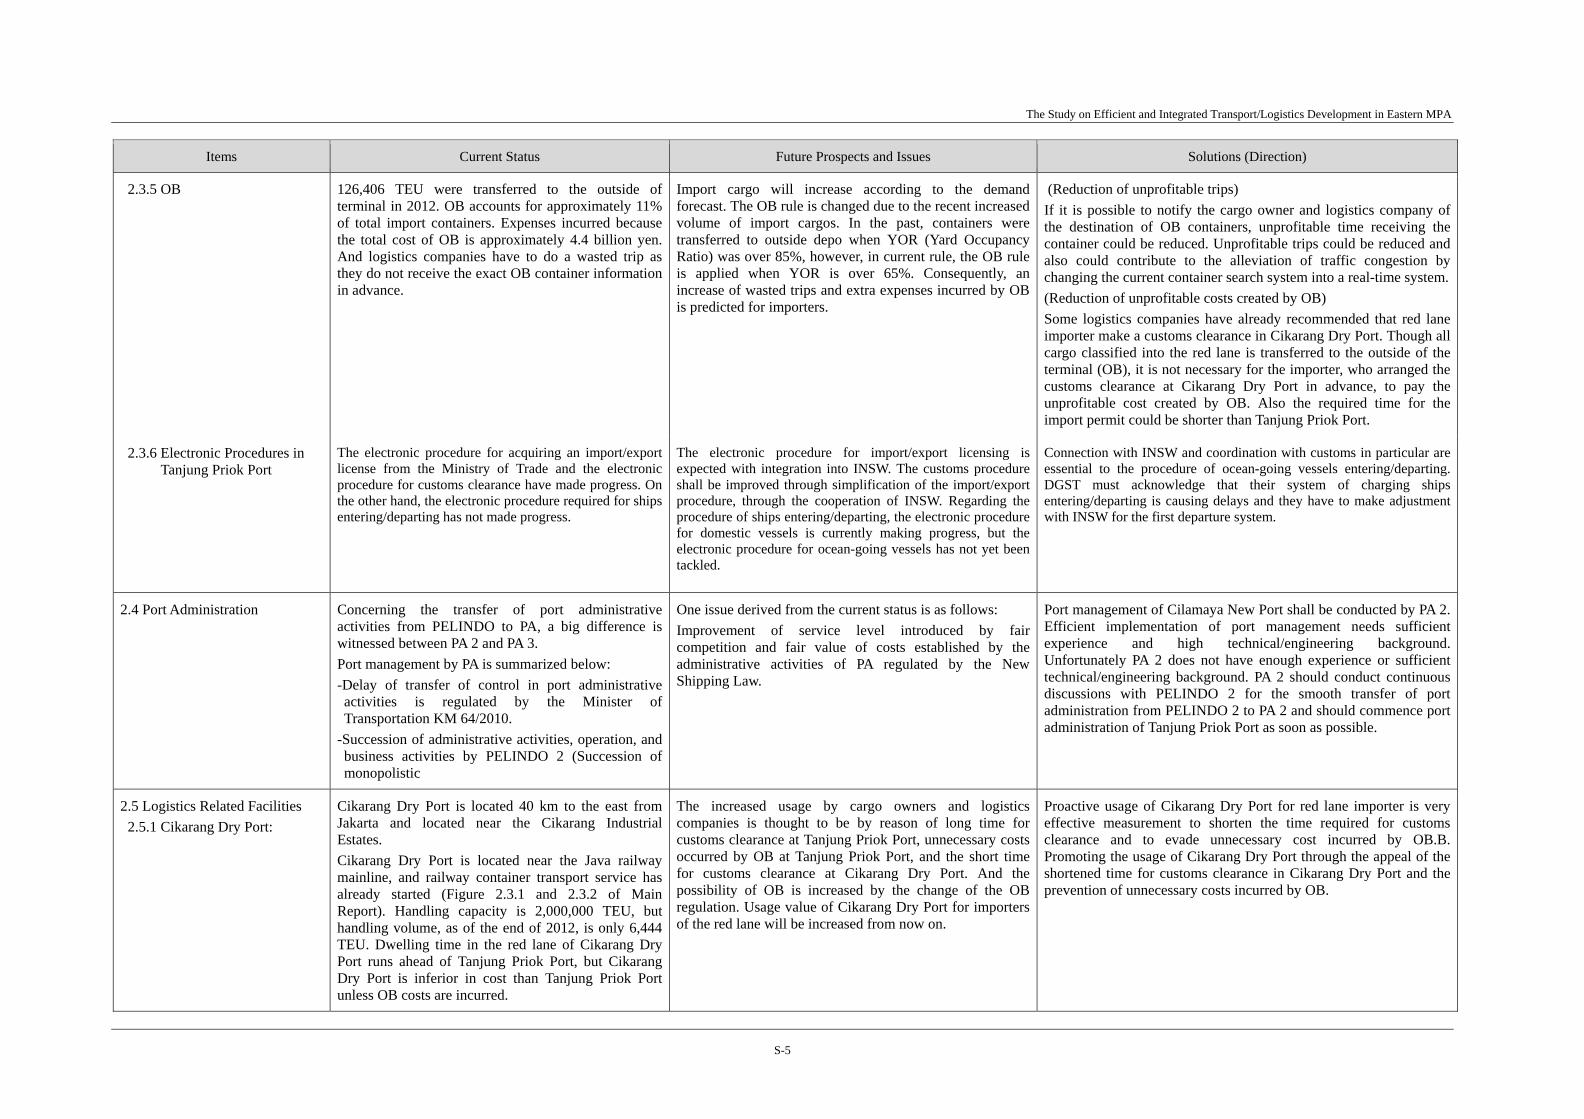
2.3.5 OB
126,406 TEU were transferred to the outside of terminal in 2012. OB accounts for approximately 11% of total import containers. Expenses incurred because the total cost of OB is approximately 4.4 billion yen. And logistics companies have to do a wasted trip as they do not receive the exact OB container information in advance.
Import cargo will increase according to the demand forecast. The OB rule is changed due to the recent increased volume of import cargos. In the past, containers were transferred to outside depo when YOR (Yard Occupancy Ratio) was over 85%, however, in current rule, the OB rule is applied when YOR is over 65%. Consequently, an increase of wasted trips and extra expenses incurred by OB is predicted for importers.
(Reduction of unprofitable trips) If it is possible to notify the cargo owner and logistics company of the destination of OB containers, unprofitable time receiving the container could be reduced. Unprofitable trips could be reduced and also could contribute to the alleviation of traffic congestion by changing the current container search system into a real-time system.(Reduction of unprofitable costs created by OB) Some logistics companies have already recommended that red lane importer make a customs clearance in Cikarang Dry Port. Though all cargo classified into the red lane is transferred to the outside of the terminal (OB), it is not necessary for the importer, who arranged the customs clearance at Cikarang Dry Port in advance, to pay the unprofitable cost created by OB. Also the required time for the import permit could be shorter than Tanjung Priok Port.
2.3.6 Electronic Procedures in Tanjung Priok Port
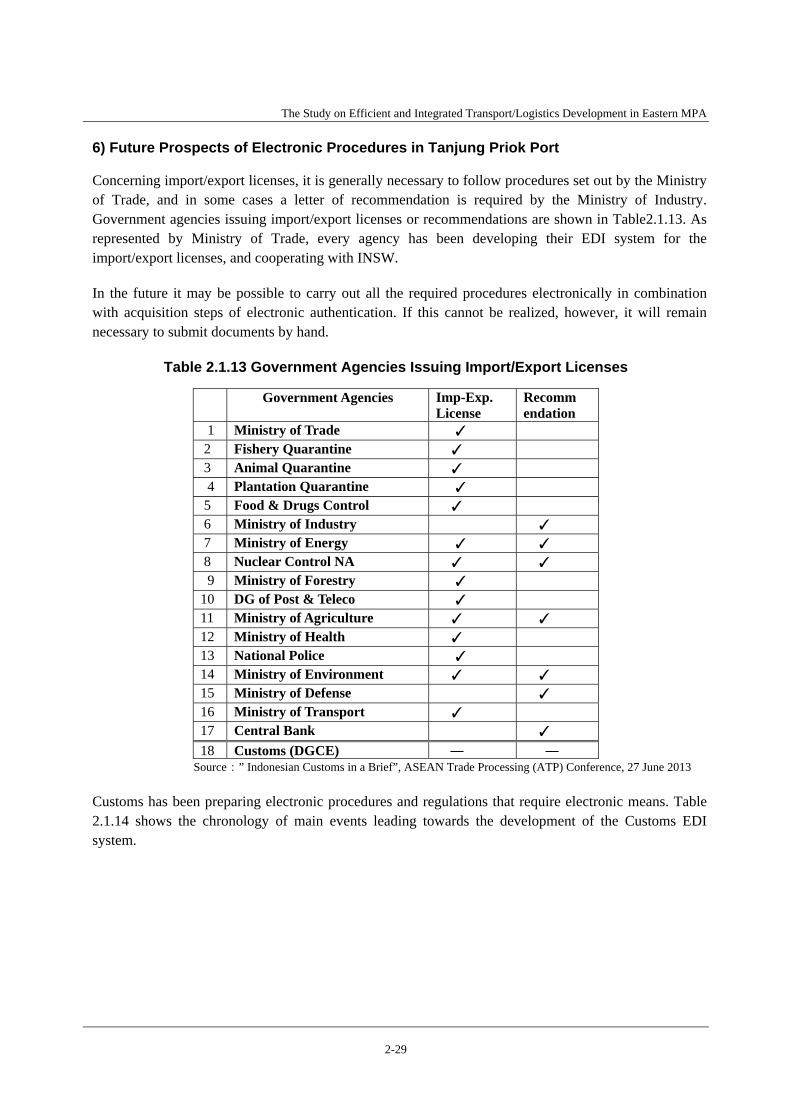
The electronic procedure for acquiring an import/export license from the Ministry of Trade and the electronic procedure for customs clearance have made progress. On the other hand, the electronic procedure required for ships entering/departing has not made progress.
The electronic procedure for import/export licensing is expected with integration into INSW. The customs procedure shall be improved through simplification of the import/export procedure, through the cooperation of INSW. Regarding the procedure of ships entering/departing, the electronic procedure for domestic vessels is currently making progress, but the electronic procedure for ocean-going vessels has not yet been tackled.
Connection with INSW and coordination with customs in particular are essential to the procedure of ocean-going vessels entering/departing. DGST must acknowledge that their system of charging ships entering/departing is causing delays and they have to make adjustment with INSW for the first departure system.
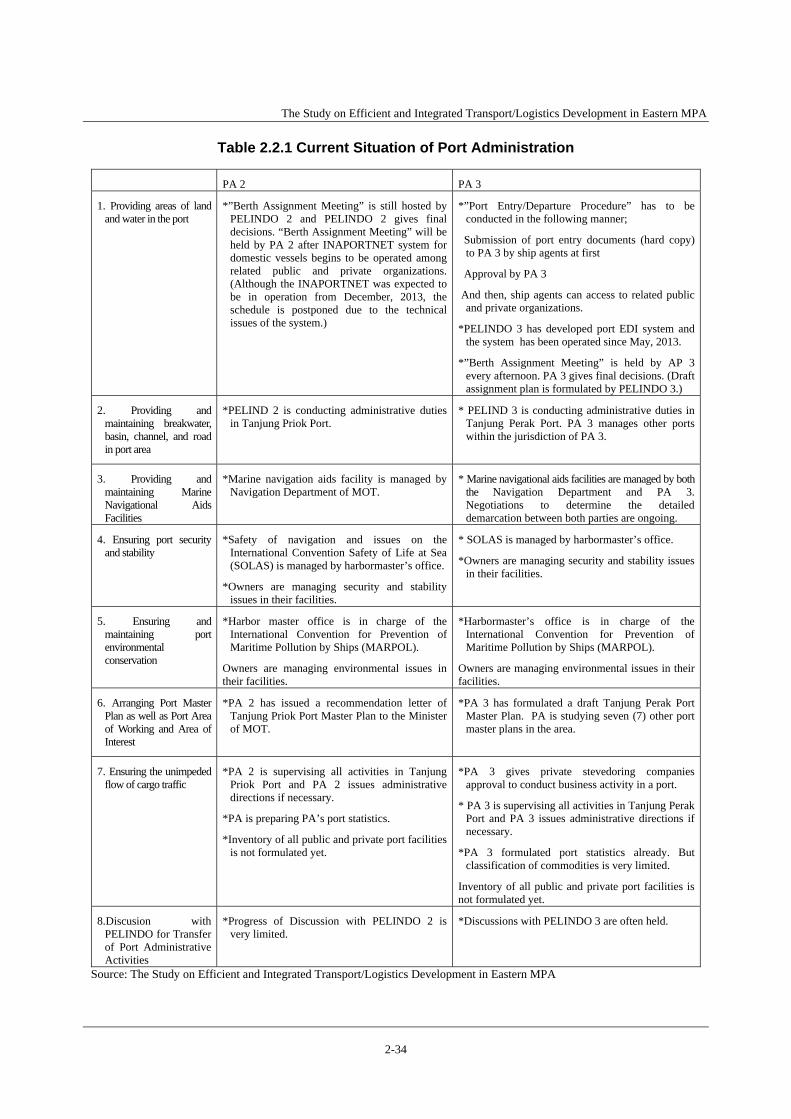
2.4 Port Administration Concerning the transfer of port administrative activities from PELINDO to PA, a big difference is witnessed between PA 2 and PA 3. Port management by PA is summarized below: -Delay of transfer of control in port administrative activities is regulated by the Minister of Transportation KM 64/2010.
-Succession of administrative activities, operation, and business activities by PELINDO 2 (Succession of monopolistic
One issue derived from the current status is as follows: Improvement of service level introduced by fair competition and fair value of costs established by the administrative activities of PA regulated by the New Shipping Law.
Port management of Cilamaya New Port shall be conducted by PA 2. Efficient implementation of port management needs sufficient experience and high technical/engineering background. Unfortunately PA 2 does not have enough experience or sufficient technical/engineering background. PA 2 should conduct continuous discussions with PELINDO 2 for the smooth transfer of port administration from PELINDO 2 to PA 2 and should commence port administration of Tanjung Priok Port as soon as possible.
2.5 Logistics Related Facilities 2.5.1 Cikarang Dry Port:
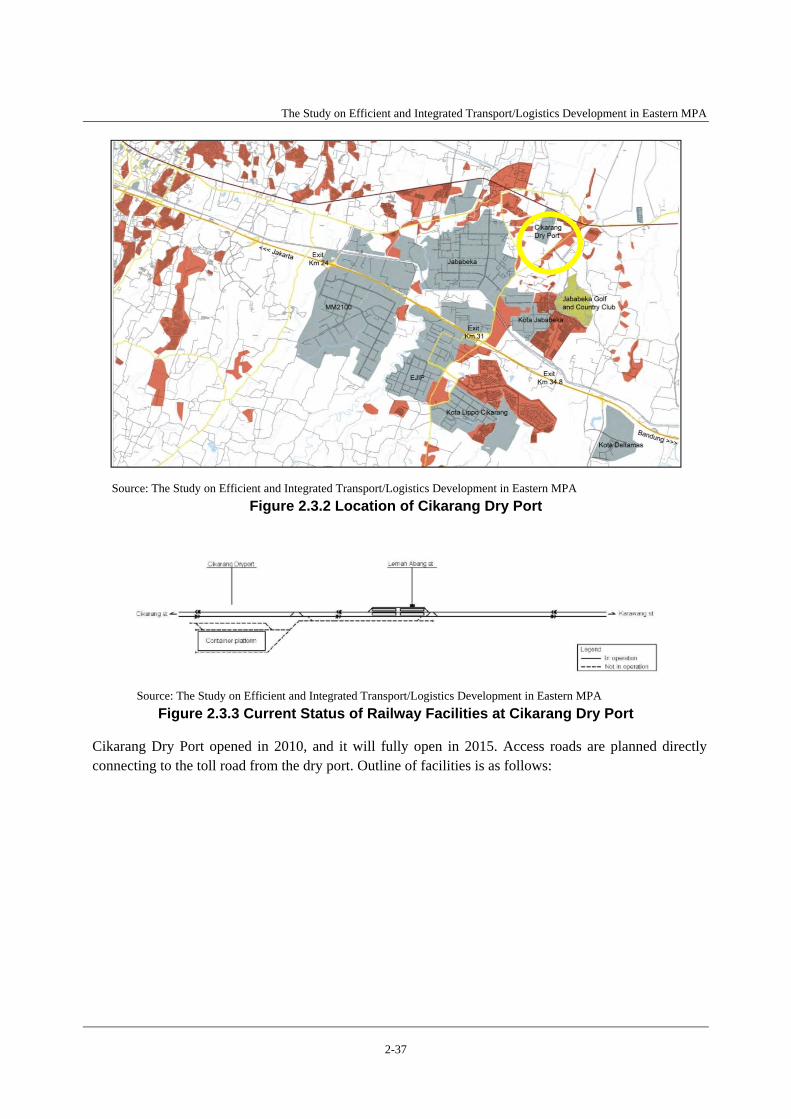
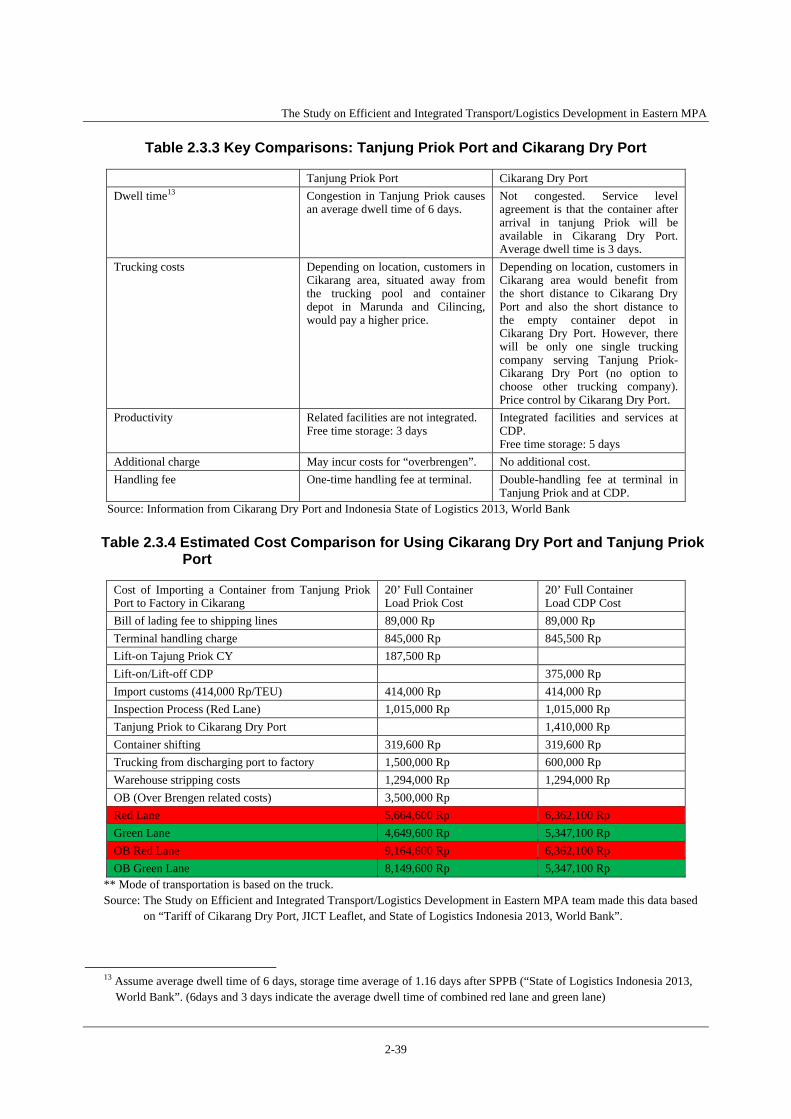
Cikarang Dry Port is located 40 km to the east from Jakarta and located near the Cikarang Industrial Estates. Cikarang Dry Port is located near the Java railway mainline, and railway container transport service has already started (Figure 2.3.1 and 2.3.2 of Main Report). Handling capacity is 2,000,000 TEU, but handling volume, as of the end of 2012, is only 6,444 TEU. Dwelling time in the red lane of Cikarang Dry Port runs ahead of Tanjung Priok Port, but Cikarang Dry Port is inferior in cost than Tanjung Priok Port unless OB costs are incurred.
The increased usage by cargo owners and logistics companies is thought to be by reason of long time for customs clearance at Tanjung Priok Port, unnecessary costs occurred by OB at Tanjung Priok Port, and the short time for customs clearance at Cikarang Dry Port. And the possibility of OB is increased by the change of the OB regulation. Usage value of Cikarang Dry Port for importers of the red lane will be increased from now on.
Proactive usage of Cikarang Dry Port for red lane importer is very effective measurement to shorten the time required for customs clearance and to evade unnecessary cost incurred by OB.B. Promoting the usage of Cikarang Dry Port through the appeal of the shortened time for customs clearance in Cikarang Dry Port and the prevention of unnecessary costs incurred by OB.
The Study on Efficient and Integrated Transport/Logistics Development in Eastern MPA
S-6
Items Current Status Future Prospects and Issues Solutions (Direction)
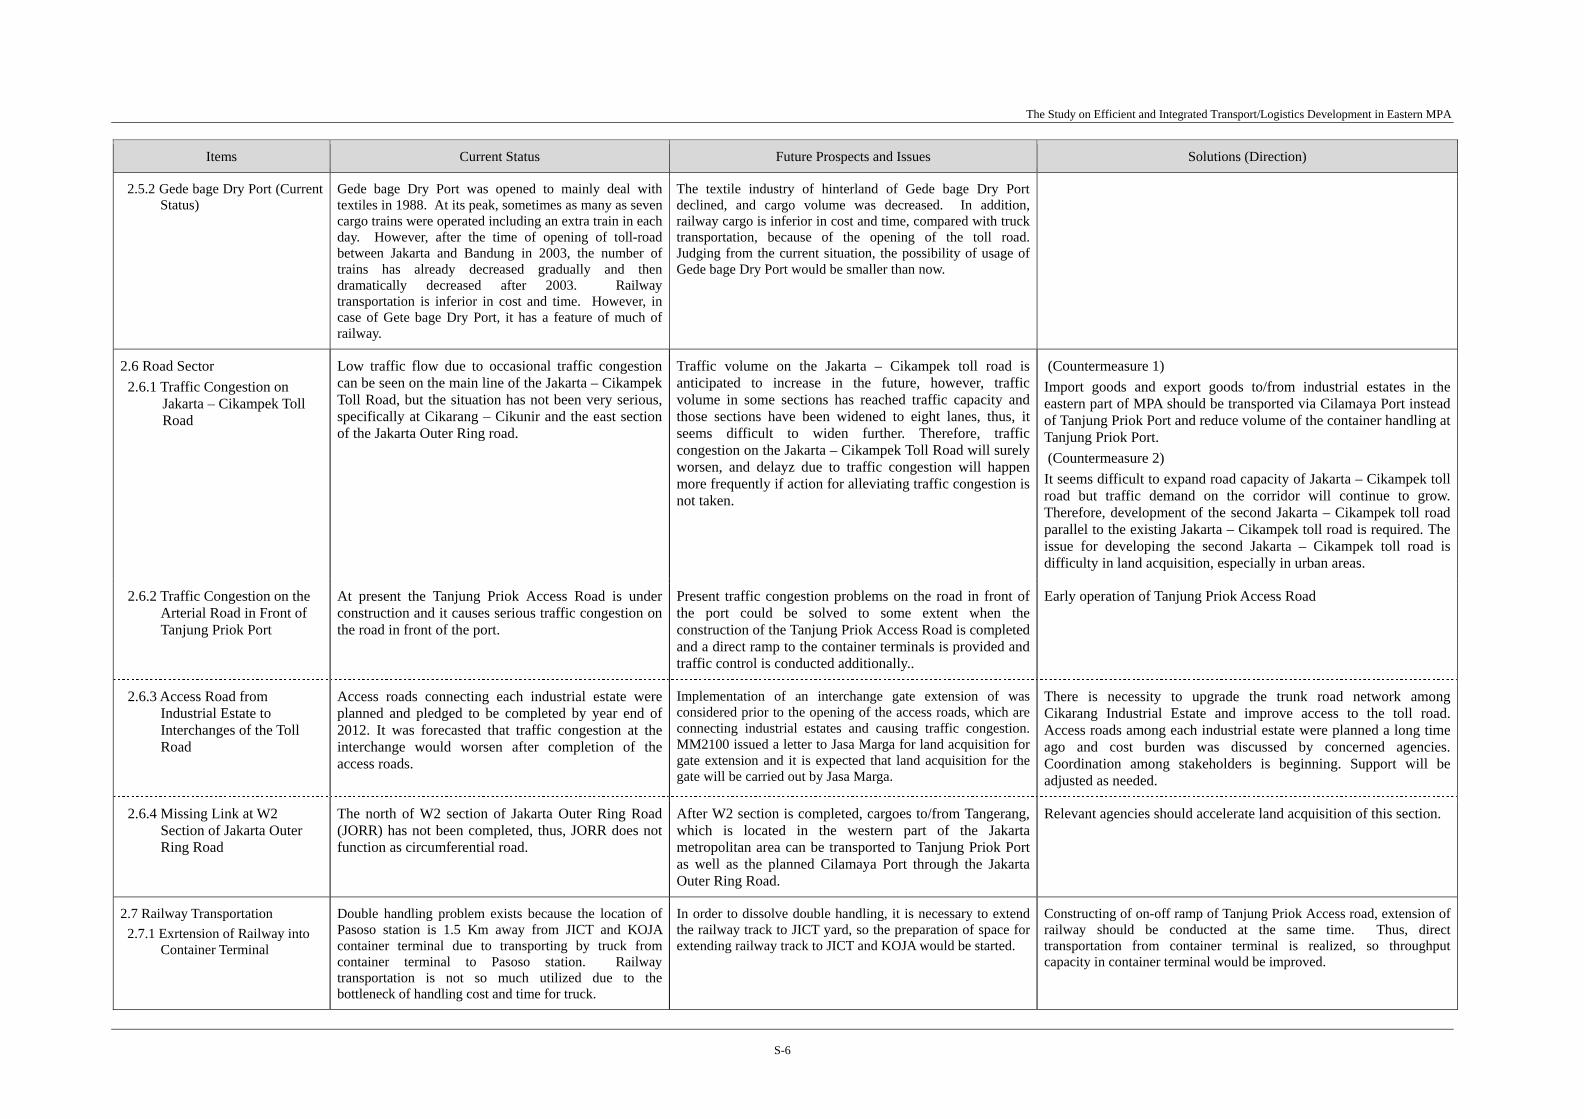
2.5.2 Gede bage Dry Port (Current Status)
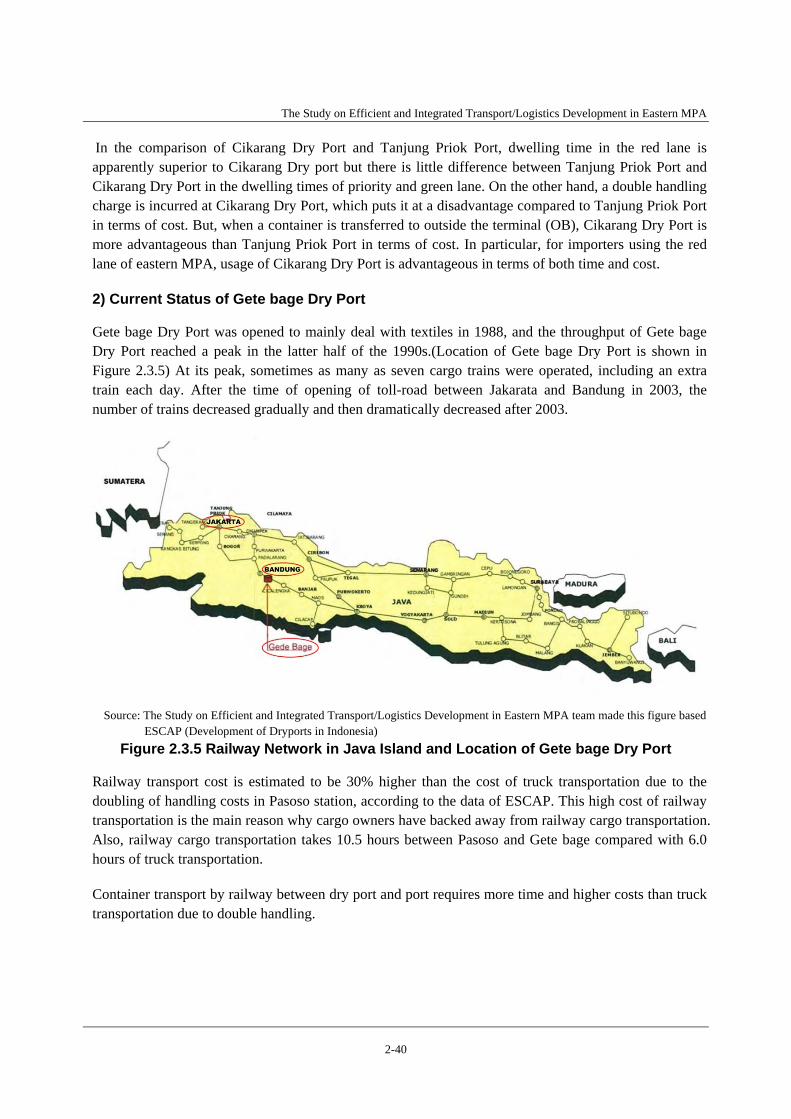
Gede bage Dry Port was opened to mainly deal with textiles in 1988. At its peak, sometimes as many as seven cargo trains were operated including an extra train in each day. However, after the time of opening of toll-road between Jakarta and Bandung in 2003, the number of trains has already decreased gradually and then dramatically decreased after 2003. Railway transportation is inferior in cost and time. However, in case of Gete bage Dry Port, it has a feature of much of railway.
The textile industry of hinterland of Gede bage Dry Port declined, and cargo volume was decreased. In addition, railway cargo is inferior in cost and time, compared with truck transportation, because of the opening of the toll road. Judging from the current situation, the possibility of usage of Gede bage Dry Port would be smaller than now.
2.6 Road Sector 2.6.1 Traffic Congestion on
Jakarta – Cikampek Toll Road
Low traffic flow due to occasional traffic congestion can be seen on the main line of the Jakarta – Cikampek Toll Road, but the situation has not been very serious, specifically at Cikarang – Cikunir and the east section of the Jakarta Outer Ring road.
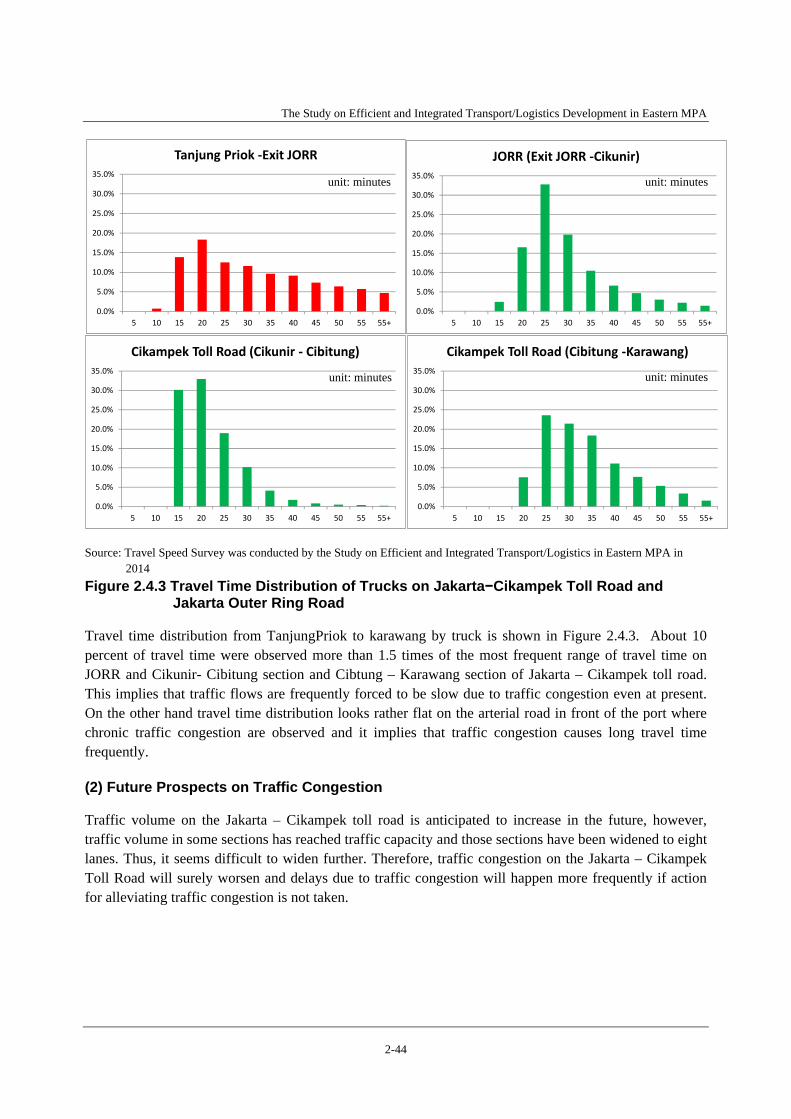
Traffic volume on the Jakarta – Cikampek toll road is anticipated to increase in the future, however, traffic volume in some sections has reached traffic capacity and those sections have been widened to eight lanes, thus, it seems difficult to widen further. Therefore, traffic congestion on the Jakarta – Cikampek Toll Road will surely worsen, and delayz due to traffic congestion will happen more frequently if action for alleviating traffic congestion is not taken.
(Countermeasure 1) Import goods and export goods to/from industrial estates in the eastern part of MPA should be transported via Cilamaya Port instead of Tanjung Priok Port and reduce volume of the container handling at Tanjung Priok Port. (Countermeasure 2) It seems difficult to expand road capacity of Jakarta – Cikampek toll road but traffic demand on the corridor will continue to grow. Therefore, development of the second Jakarta – Cikampek toll road parallel to the existing Jakarta – Cikampek toll road is required. The issue for developing the second Jakarta – Cikampek toll road is difficulty in land acquisition, especially in urban areas.
2.6.2 Traffic Congestion on the Arterial Road in Front of Tanjung Priok Port
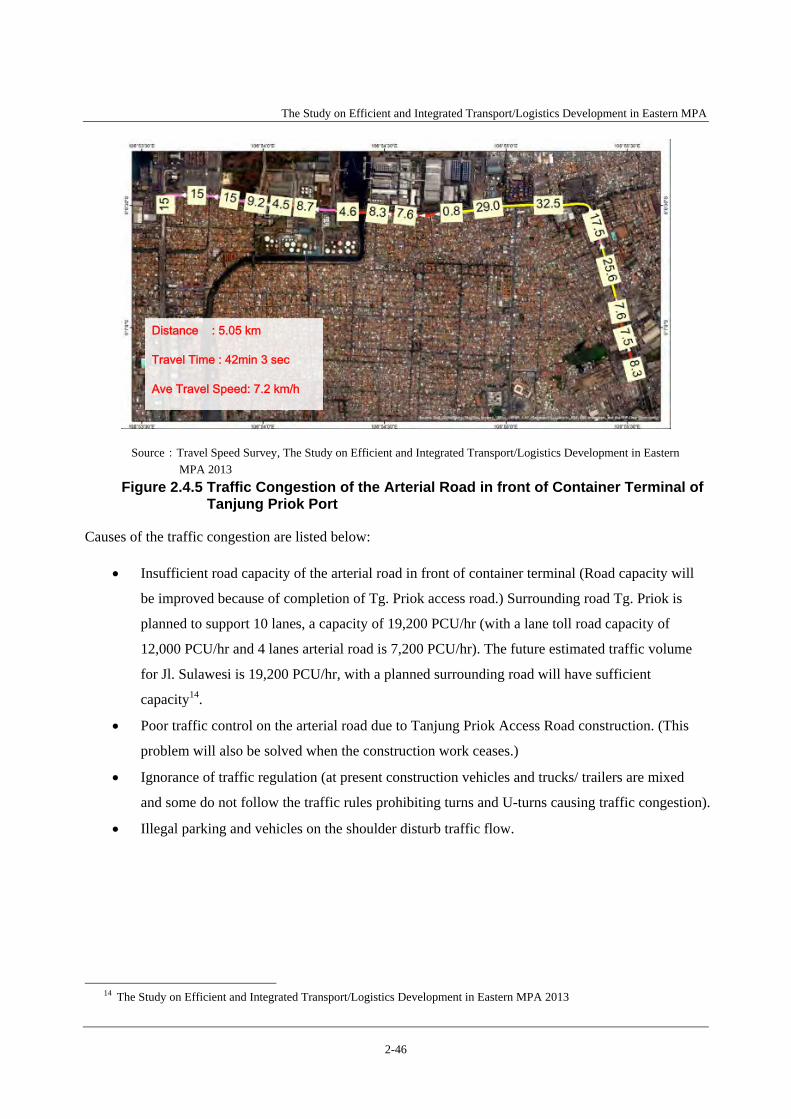
At present the Tanjung Priok Access Road is under construction and it causes serious traffic congestion on the road in front of the port.
Present traffic congestion problems on the road in front of the port could be solved to some extent when the construction of the Tanjung Priok Access Road is completed and a direct ramp to the container terminals is provided and traffic control is conducted additionally..
Early operation of Tanjung Priok Access Road
2.6.3 Access Road from Industrial Estate to Interchanges of the Toll Road
Access roads connecting each industrial estate were planned and pledged to be completed by year end of 2012. It was forecasted that traffic congestion at the interchange would worsen after completion of the access roads.
Implementation of an interchange gate extension of was considered prior to the opening of the access roads, which are connecting industrial estates and causing traffic congestion. MM2100 issued a letter to Jasa Marga for land acquisition for gate extension and it is expected that land acquisition for the gate will be carried out by Jasa Marga.
There is necessity to upgrade the trunk road network among Cikarang Industrial Estate and improve access to the toll road. Access roads among each industrial estate were planned a long time ago and cost burden was discussed by concerned agencies. Coordination among stakeholders is beginning. Support will be adjusted as needed.
2.6.4 Missing Link at W2 Section of Jakarta Outer Ring Road
The north of W2 section of Jakarta Outer Ring Road (JORR) has not been completed, thus, JORR does not function as circumferential road.
After W2 section is completed, cargoes to/from Tangerang, which is located in the western part of the Jakarta metropolitan area can be transported to Tanjung Priok Port as well as the planned Cilamaya Port through the Jakarta Outer Ring Road.
Relevant agencies should accelerate land acquisition of this section.
2.7 Railway Transportation 2.7.1 Exrtension of Railway into
Container Terminal
Double handling problem exists because the location of Pasoso station is 1.5 Km away from JICT and KOJA container terminal due to transporting by truck from container terminal to Pasoso station. Railway transportation is not so much utilized due to the bottleneck of handling cost and time for truck.
In order to dissolve double handling, it is necessary to extend the railway track to JICT yard, so the preparation of space for extending railway track to JICT and KOJA would be started.
Constructing of on-off ramp of Tanjung Priok Access road, extension of railway should be conducted at the same time. Thus, direct transportation from container terminal is realized, so throughput capacity in container terminal would be improved.
The Study on Efficient and Integrated Transport/Logistics Development in Eastern MPA
S-7
Items Current Status Future Prospects and Issues Solutions (Direction)
2.7.2 Double-double tracking of Java main line
Cargo train in Bekasi line is limited to 10 trains per day because Bekasi line is utilized for middle-long distance train and commuter train.
Issues for efficiency of railway transportation are as follows: Construction of double-double tracking of railway between Manggarai and Bekasi makes it possible to add the train for container.
If the construction of double-double tracking between Manggarai and Bekasi would be completed, around 10 cargo trains are operated in addition.
2.7.3 Long distance container transportation in Java main line
Demand for cargo train is low because service level of cargo train is low due to the delay of cargo train in middle-long distance.
Comparative advantage of railway cargo is said to be that transportation distance is usually over 400 km. In case of over 400 Km, Semarang, Solo, and Yogyakarta in middle Java are to be destination. But most section of Java north line is single tracking at present, so train delay is occurred frequently. Thus, double tracking of north line should be conducted at first.
Double-tracking project of North Line is under construction according to the plan of Ministry of Transportaion.
The Study on Efficient and Integrated Transport/Logistics Development in Eastern MPA
S-8
3. LOGISTIC SITUATION OF JAKARTA METROPOLITAN AREA AT THE OPENING OF CILAMAYA PORT
Demand of Port in Jakarta Metropolitan Area and Significance of the Eastern MPA 3.1
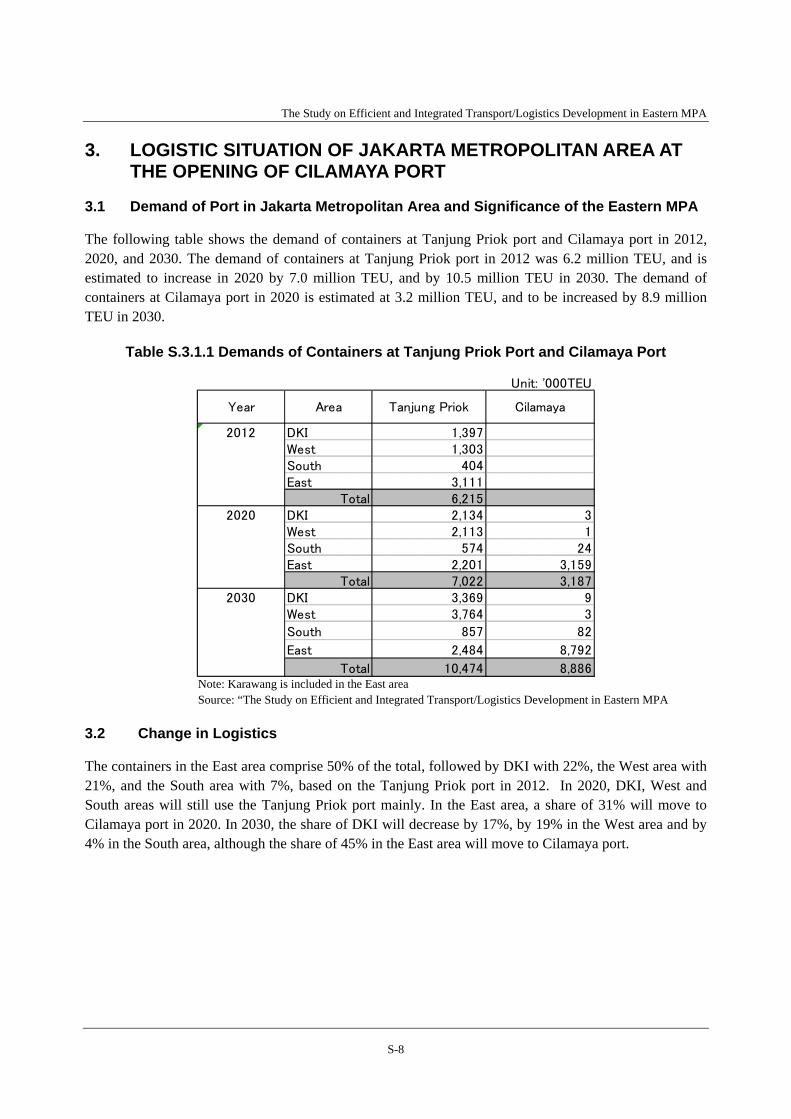
The following table shows the demand of containers at Tanjung Priok port and Cilamaya port in 2012, 2020, and 2030. The demand of containers at Tanjung Priok port in 2012 was 6.2 million TEU, and is estimated to increase in 2020 by 7.0 million TEU, and by 10.5 million TEU in 2030. The demand of containers at Cilamaya port in 2020 is estimated at 3.2 million TEU, and to be increased by 8.9 million TEU in 2030.
Table S.3.1.1 Demands of Containers at Tanjung Priok Port and Cilamaya Port
Note: Karawang is included in the East area Source: “The Study on Efficient and Integrated Transport/Logistics Development in Eastern MPA
Change in Logistics 3.2
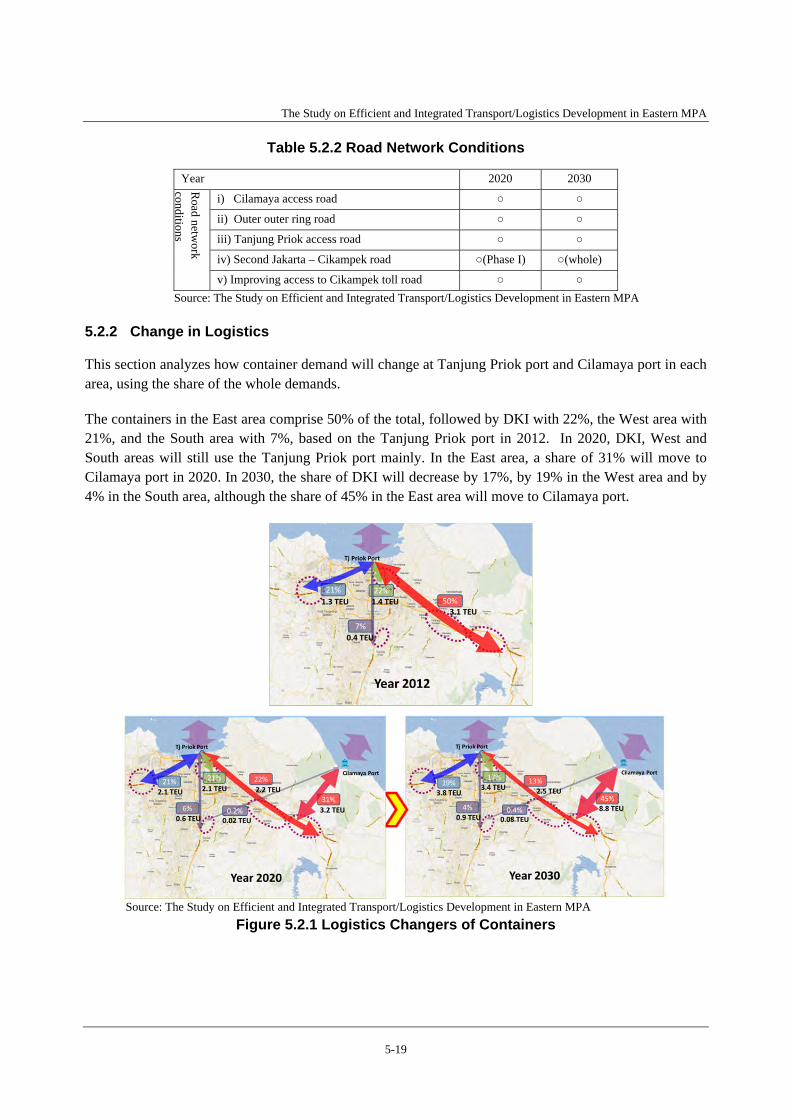
The containers in the East area comprise 50% of the total, followed by DKI with 22%, the West area with 21%, and the South area with 7%, based on the Tanjung Priok port in 2012. In 2020, DKI, West and South areas will still use the Tanjung Priok port mainly. In the East area, a share of 31% will move to Cilamaya port in 2020. In 2030, the share of DKI will decrease by 17%, by 19% in the West area and by 4% in the South area, although the share of 45% in the East area will move to Cilamaya port.
Unit: '000TEU
2012 DKI 1,397West 1,303South 404East 3,111
Total 6,2152020 DKI 2,134 3
West 2,113 1South 574 24East 2,201 3,159
Total 7,022 3,1872030 DKI 3,369 9
West 3,764 3
South 857 82
East 2,484 8,792
Total 10,474 8,886
Year Area Tanjung Priok Cilamaya
The Study on Efficient and Integrated Transport/Logistics Development in Eastern MPA
S-9
Source: The Study on Efficient and Integrated Transport/Logistics Development in Eastern MPA
Figure S.3.2.1 Logistics Changers of Containers
Change in Logistics Cost and Time 3.3
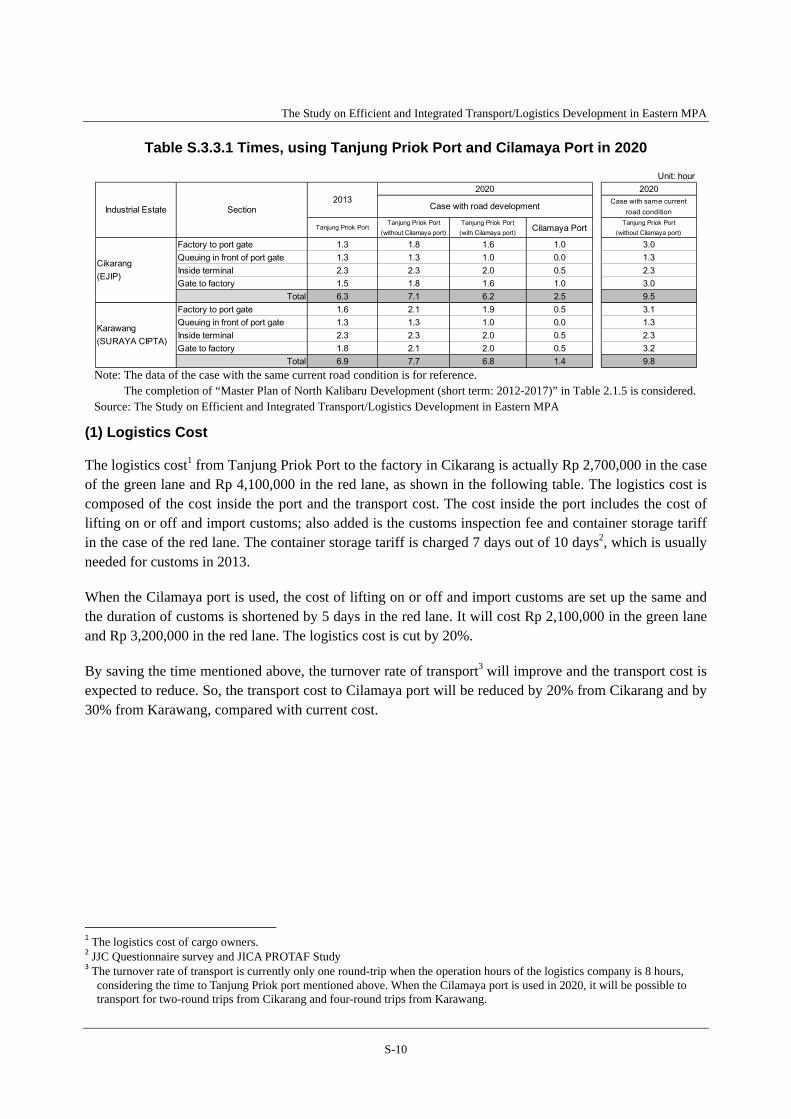
Based on the travel speed survey, the travel time of a round trip between factories in the Eastern area and Tanjung Priok Port is analysed. In the case of EJIP in Cikarang, it took 6.3 hours, and in the case of Surayacipta in Karawang, it took 6.9 hours.
If Cilamaya Port is not opened, it will take 7.1 hours from Cikarang and 7.7 hours from Karawang. If Cilamaya Port is opened, it will take 2.5 hours from EJIP to Cilmaya port and 1.4 hours from Surayacipta to Cilamaya Port.
The Study on Efficient and Integrated Transport/Logistics Development in Eastern MPA
S-10
Table S.3.3.1 Times, using Tanjung Priok Port and Cilamaya Port in 2020
Note: The data of the case with the same current road condition is for reference.
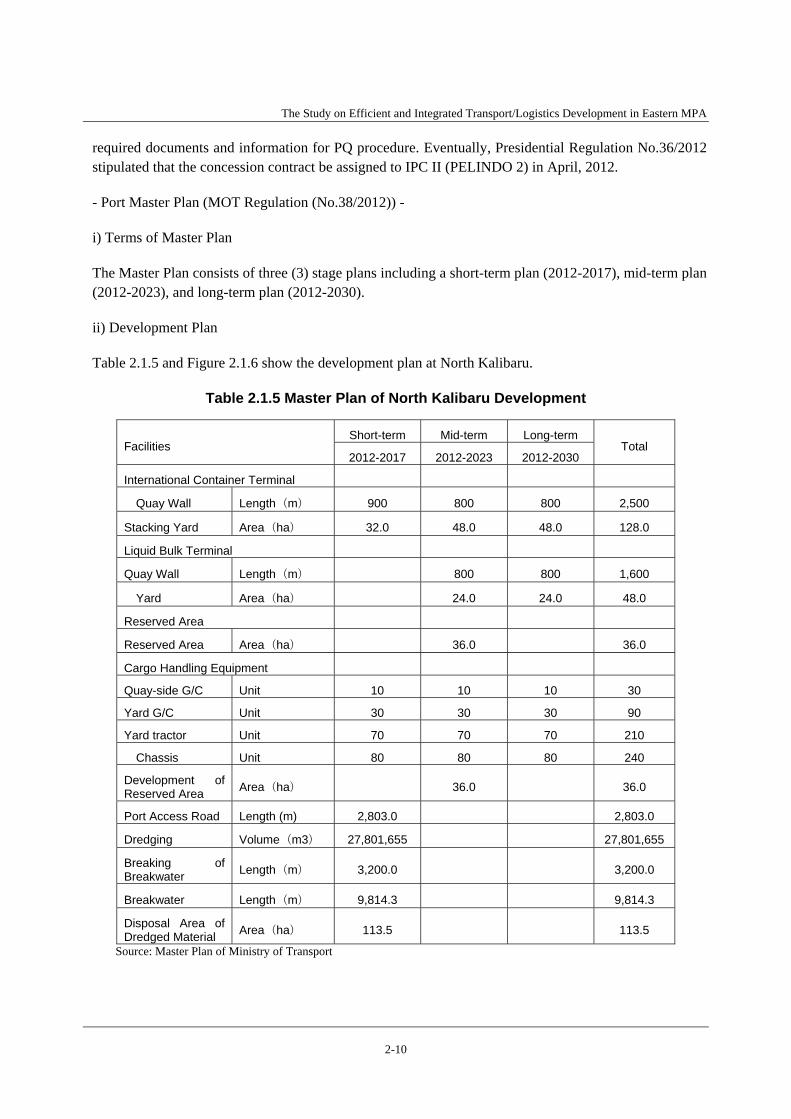
The completion of “Master Plan of North Kalibaru Development (short term: 2012-2017)” in Table 2.1.5 is considered. Source: The Study on Efficient and Integrated Transport/Logistics Development in Eastern MPA
(1) Logistics Cost
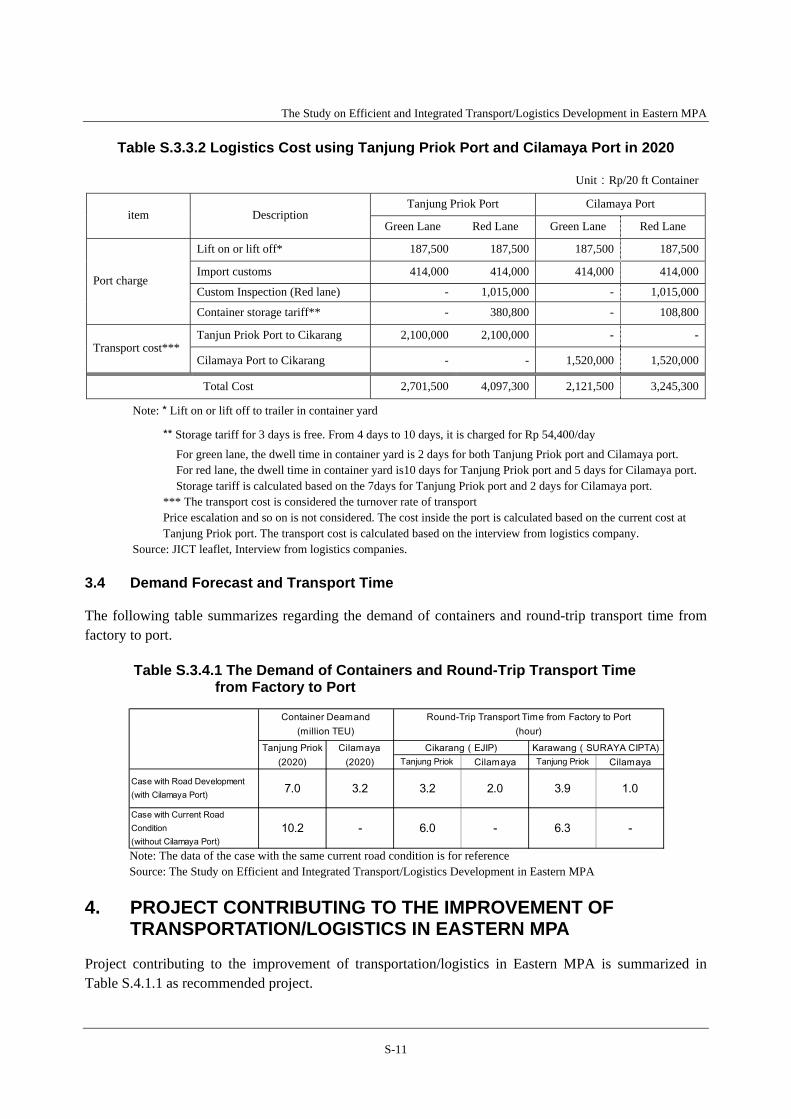
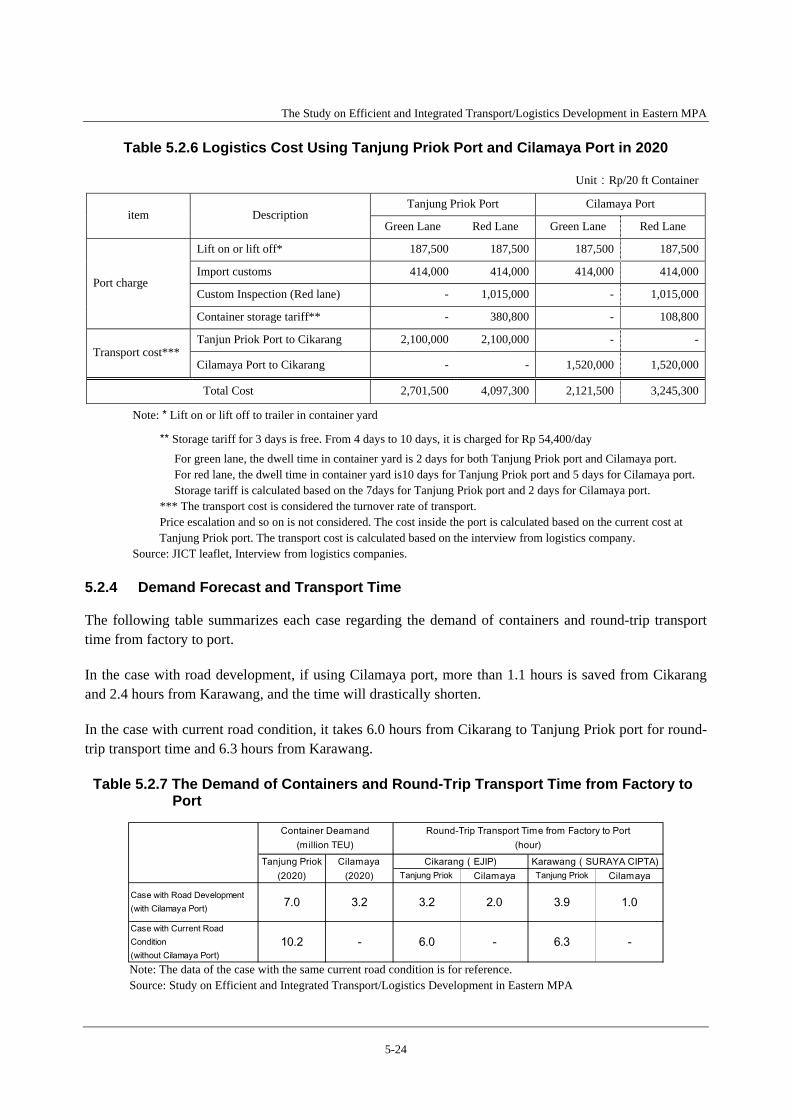
The logistics cost1 from Tanjung Priok Port to the factory in Cikarang is actually Rp 2,700,000 in the case of the green lane and Rp 4,100,000 in the red lane, as shown in the following table. The logistics cost is composed of the cost inside the port and the transport cost. The cost inside the port includes the cost of lifting on or off and import customs; also added is the customs inspection fee and container storage tariff in the case of the red lane. The container storage tariff is charged 7 days out of 10 days2, which is usually needed for customs in 2013.
When the Cilamaya port is used, the cost of lifting on or off and import customs are set up the same and the duration of customs is shortened by 5 days in the red lane. It will cost Rp 2,100,000 in the green lane and Rp 3,200,000 in the red lane. The logistics cost is cut by 20%.
By saving the time mentioned above, the turnover rate of transport3 will improve and the transport cost is expected to reduce. So, the transport cost to Cilamaya port will be reduced by 20% from Cikarang and by 30% from Karawang, compared with current cost.
1 The logistics cost of cargo owners. 2 JJC Questionnaire survey and JICA PROTAF Study 3 The turnover rate of transport is currently only one round-trip when the operation hours of the logistics company is 8 hours,
considering the time to Tanjung Priok port mentioned above. When the Cilamaya port is used in 2020, it will be possible to transport for two-round trips from Cikarang and four-round trips from Karawang.
Unit: hour2020
Case with same currentroad condition
Tanjung Priok PortTanjung Priok Port
(without Cilamaya port)Tanjung Priok Port(with Cilamaya port) Cilamaya Port Tanjung Priok Port
(without Cilamaya port)
Factory to port gate 1.3 1.8 1.6 1.0 3.0Queuing in front of port gate 1.3 1.3 1.0 0.0 1.3Inside terminal 2.3 2.3 2.0 0.5 2.3Gate to factory 1.5 1.8 1.6 1.0 3.0
Total 6.3 7.1 6.2 2.5 9.5Factory to port gate 1.6 2.1 1.9 0.5 3.1Queuing in front of port gate 1.3 1.3 1.0 0.0 1.3Inside terminal 2.3 2.3 2.0 0.5 2.3Gate to factory 1.8 2.1 2.0 0.5 3.2
Total 6.9 7.7 6.8 1.4 9.8
Industrial Estate Section Case with road development2013
2020
Cikarang(EJIP)
Karawang(SURAYA CIPTA)
The Study on Efficient and Integrated Transport/Logistics Development in Eastern MPA
S-11
Table S.3.3.2 Logistics Cost using Tanjung Priok Port and Cilamaya Port in 2020
Unit:Rp/20 ft Container
item Description Tanjung Priok Port Cilamaya Port
Green Lane Red Lane Green Lane Red Lane
Port charge
Lift on or lift off* 187,500 187,500 187,500 187,500
Transport cost*** Tanjun Priok Port to Cikarang 2,100,000 2,100,000 - -
Cilamaya Port to Cikarang - - 1,520,000 1,520,000
Total Cost 2,701,500 4,097,300 2,121,500 3,245,300
Note: * Lift on or lift off to trailer in container yard
** Storage tariff for 3 days is free. From 4 days to 10 days, it is charged for Rp 54,400/day
For green lane, the dwell time in container yard is 2 days for both Tanjung Priok port and Cilamaya port. For red lane, the dwell time in container yard is10 days for Tanjung Priok port and 5 days for Cilamaya port.Storage tariff is calculated based on the 7days for Tanjung Priok port and 2 days for Cilamaya port.
*** The transport cost is considered the turnover rate of transport Price escalation and so on is not considered. The cost inside the port is calculated based on the current cost at Tanjung Priok port. The transport cost is calculated based on the interview from logistics company.
Source: JICT leaflet, Interview from logistics companies.
Demand Forecast and Transport Time 3.4
The following table summarizes regarding the demand of containers and round-trip transport time from factory to port.
Table S.3.4.1 The Demand of Containers and Round-Trip Transport Time from Factory to Port
Note: The data of the case with the same current road condition is for reference Source: The Study on Efficient and Integrated Transport/Logistics Development in Eastern MPA
4. PROJECT CONTRIBUTING TO THE IMPROVEMENT OF TRANSPORTATION/LOGISTICS IN EASTERN MPA
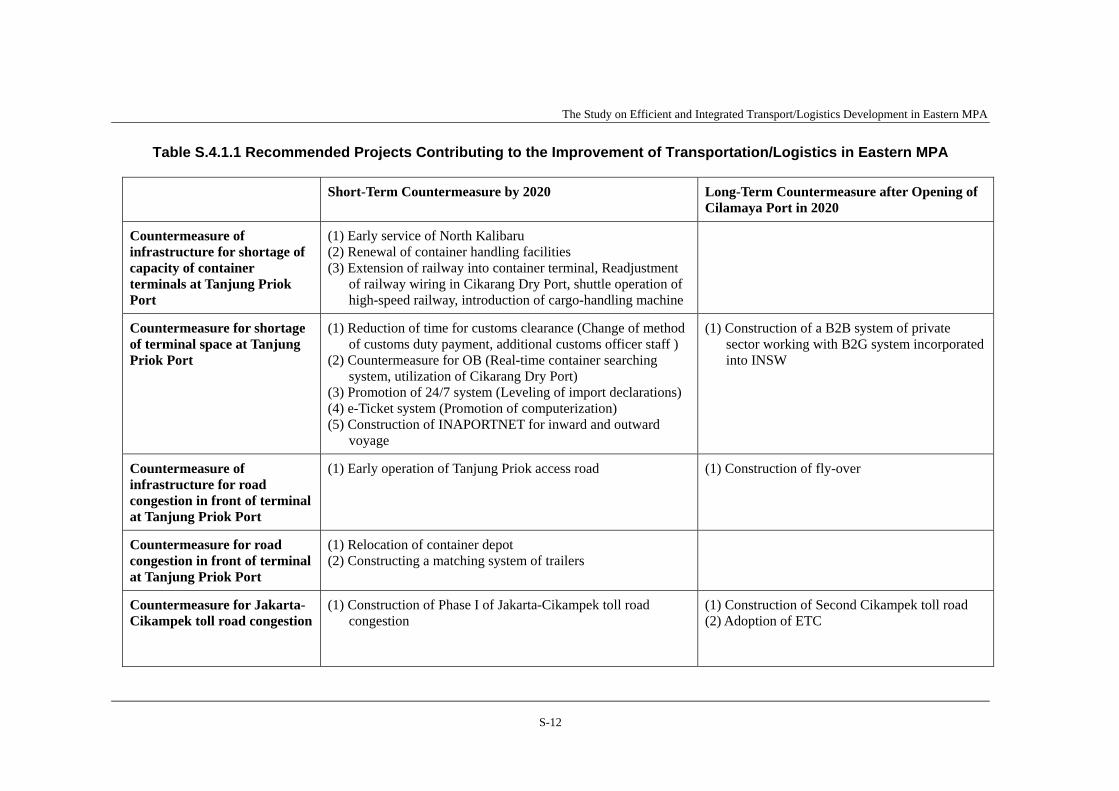
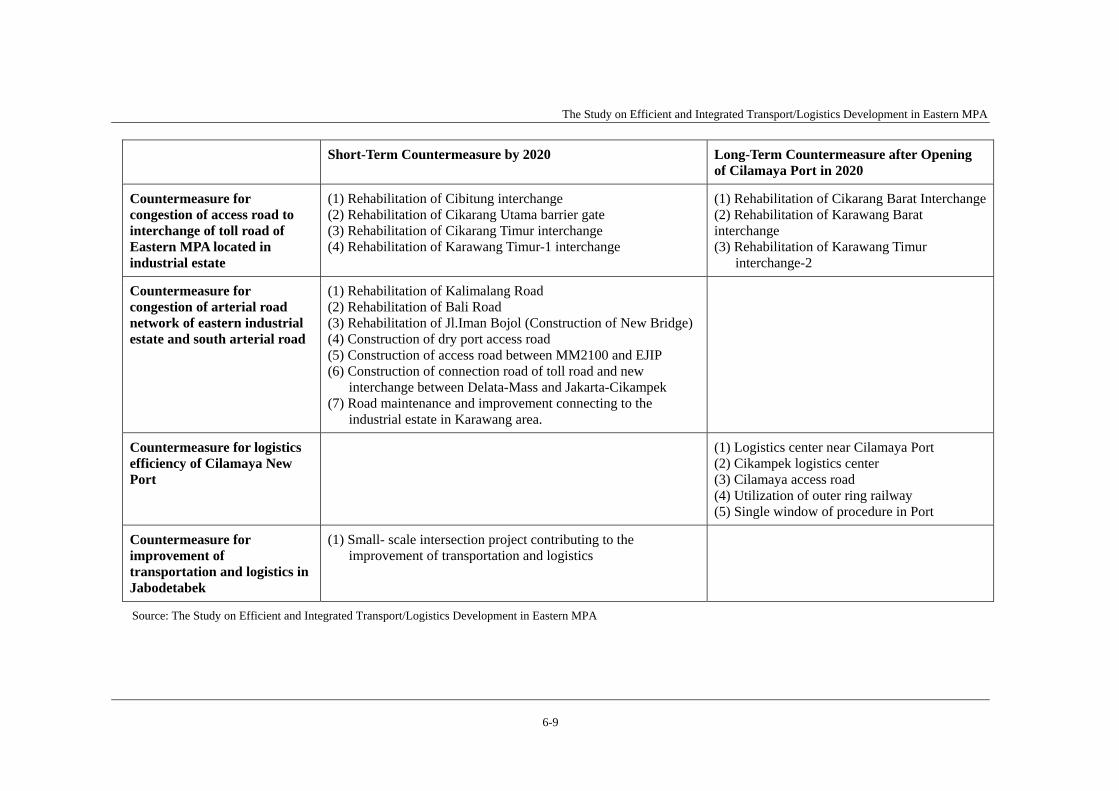
Project contributing to the improvement of transportation/logistics in Eastern MPA is summarized in Table S.4.1.1 as recommended project.
Tanjung Priok Cilamaya Tanjung Priok Cilamaya
Case with Road Development(with Cilamaya Port) 7.0 3.2 3.2 2.0 3.9 1.0
Case with Current RoadCondition(without Cilamaya Port)
10.2 - 6.0 - 6.3 -
Container Deamand(million TEU)
Round-Trip Transport Time from Factory to Port(hour)
Tanjung Priok(2020)
Cilamaya(2020)
Cikarang(EJIP) Karawang(SURAYA CIPTA)
The Study on Efficient and Integrated Transport/Logistics Development in Eastern MPA
S-12
Table S.4.1.1 Recommended Projects Contributing to the Improvement of Transportation/Logistics in Eastern MPA
Short-Term Countermeasure by 2020 Long-Term Countermeasure after Opening of Cilamaya Port in 2020
Countermeasure of infrastructure for shortage of capacity of container terminals at Tanjung Priok Port
(1) Early service of North Kalibaru (2) Renewal of container handling facilities (3) Extension of railway into container terminal, Readjustment
of railway wiring in Cikarang Dry Port, shuttle operation of high-speed railway, introduction of cargo-handling machine
Countermeasure for shortage of terminal space at Tanjung Priok Port
(1) Reduction of time for customs clearance (Change of method of customs duty payment, additional customs officer staff )
(2) Countermeasure for OB (Real-time container searching system, utilization of Cikarang Dry Port)
(3) Promotion of 24/7 system (Leveling of import declarations) (4) e-Ticket system (Promotion of computerization) (5) Construction of INAPORTNET for inward and outward
voyage
(1) Construction of a B2B system of private sector working with B2G system incorporated into INSW
Countermeasure of infrastructure for road congestion in front of terminal at Tanjung Priok Port
(1) Early operation of Tanjung Priok access road (1) Construction of fly-over
Countermeasure for road congestion in front of terminal at Tanjung Priok Port
(1) Relocation of container depot (2) Constructing a matching system of trailers
Countermeasure for Jakarta-Cikampek toll road congestion
(1) Construction of Phase I of Jakarta-Cikampek toll road congestion
(1) Construction of Second Cikampek toll road (2) Adoption of ETC
The Study on Efficient and Integrated Transport/Logistics Development in Eastern MPA
S-13
Short-Term Countermeasure by 2020 Long-Term Countermeasure after Opening of Cilamaya Port in 2020
Countermeasure for congestion of access road to interchange of toll road of Eastern MPA located in industrial estate
(1) Rehabilitation of Cibitung interchange (2) Rehabilitation of Cikarang Utama barrier gate (3) Rehabilitation of Cikarang Timur interchange (4) Rehabilitation of Karawang Timur-1 interchange
(1) Rehabilitation of Cikarang Barat Interchange (2) Rehabilitation of Karawang Barat interchange (3) Rehabilitation of Karawang Timur
interchange-2
Countermeasure for congestion of arterial road network of eastern industrial estate and south arterial road
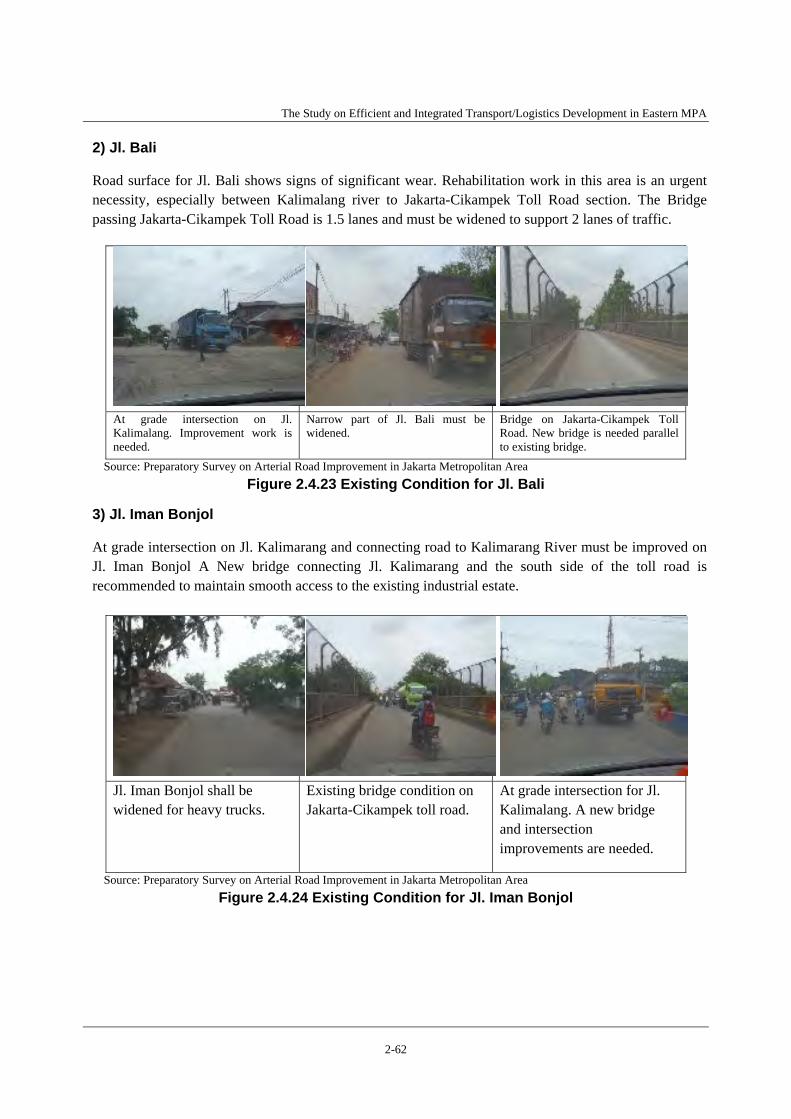
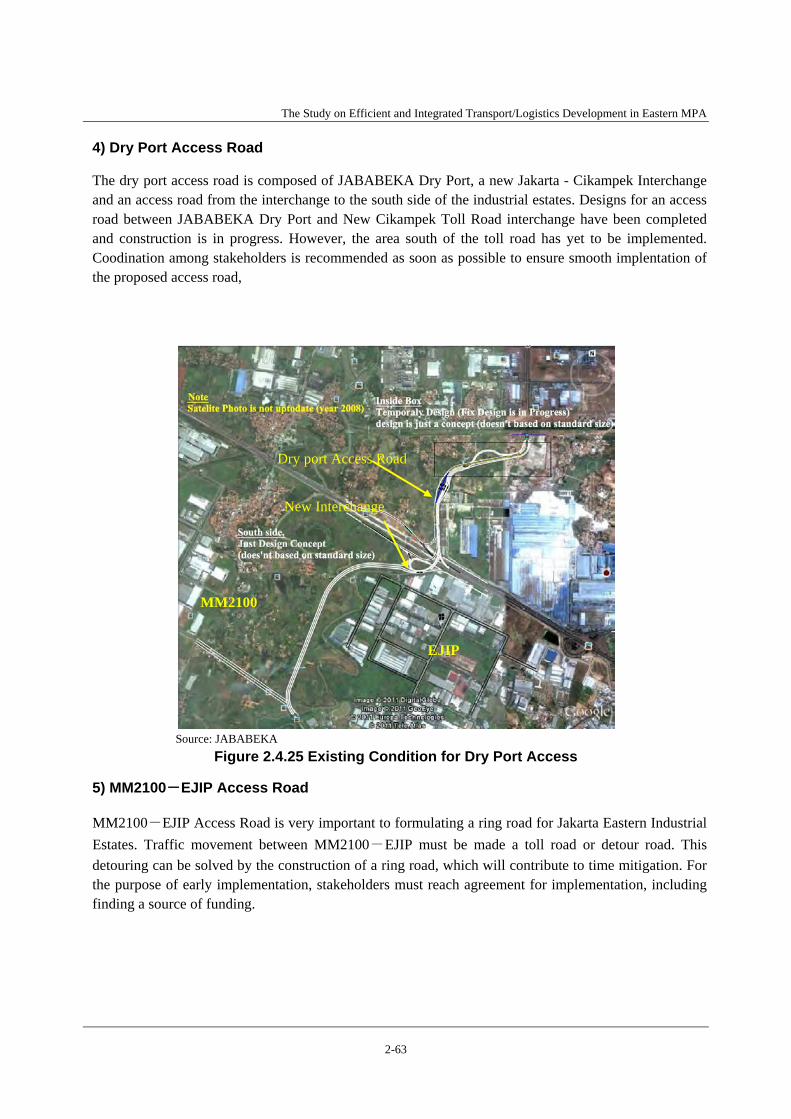
(1) Rehabilitation of Kalimalang Road (2) Rehabilitation of Bali Road (3) Rehabilitation of Jl.Iman Bojol (Construction of New
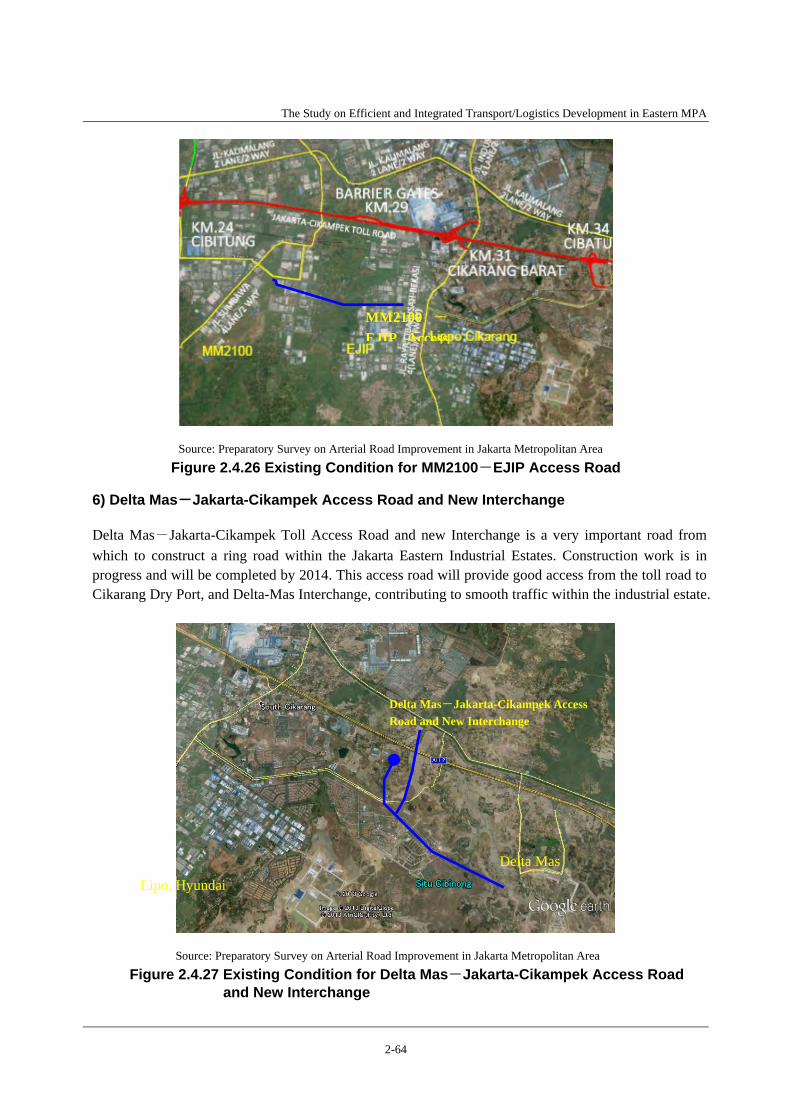
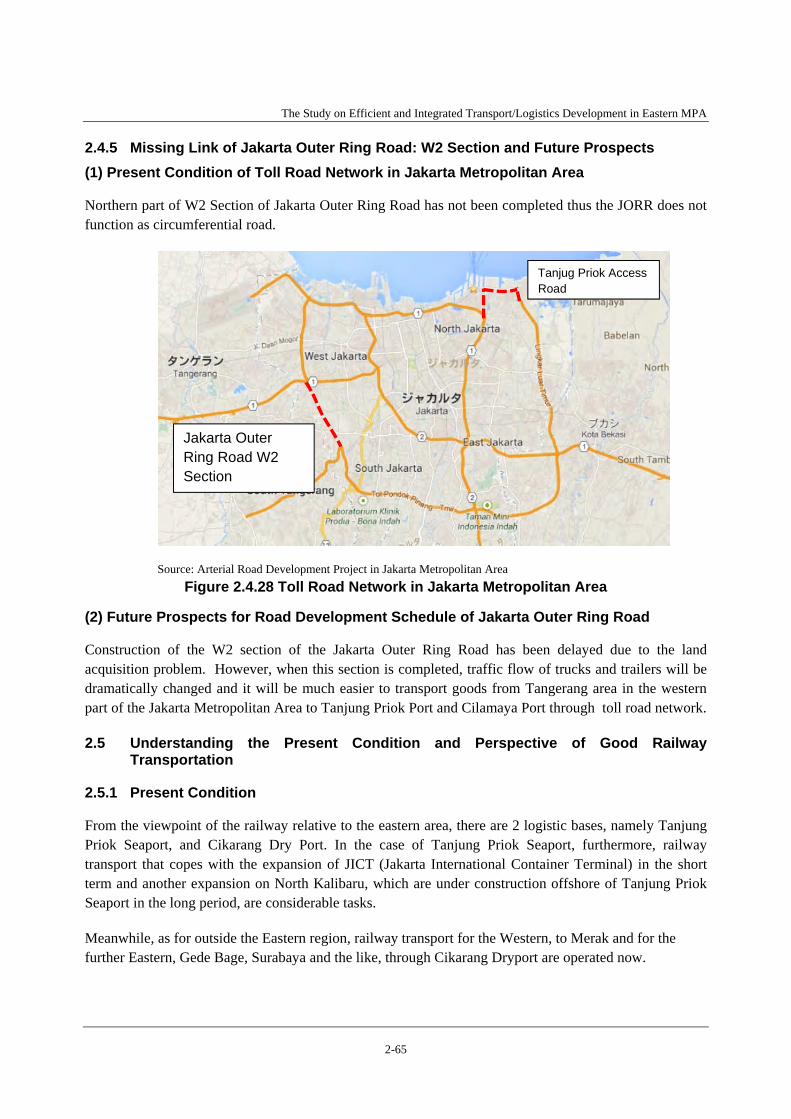
Bridge) (4) Construction of dry port access road (5) Construction of access road between MM2100 and EJIP (6) Construction of connection road of toll road and new
interchange between Delata-Mass and Jakarta-Cikampek (7) Road maintenance and improvement connecting to the
industrial estate in Karawang area.
Countermeasure for logistics efficiency of Cilamaya New Port
(1) Logistics center near Cilamaya Port (2) Cikampek logistics center (3) Cilamaya access road (4) Utilization of outer ring railway (5) Single window of procedure in Port
Countermeasure for improvement of transportation and logistics in Jabodetabek
(1) Small- scale intersection project contributing to the improvement of transportation and logistics
Source: The Study on Efficient and Integrated Transport/Logistics Development in Eastern MPA
The Study on Efficient and Integrated Transport/Logistics Development in Eastern MPA
i
TABLE OF CONTENTS
EASTERN MPA LOGISTIC VISION TOWARD 2020
SUMMARY
TABLE OF CONTENTS LIST OF TABLES AND FIGURES
LIST OF ABBREVIATIONS
CHAPTER1 Introduction
1.1 Background of the Study ....................................................................................... 1- 1
1.1.1 Significance of the Eastern MPA .......................................................................... 1- 1
1.1.2 The Problem of High Logistics Costs ................................................................... 1- 1
1.1.3 Development of Cilamaya New International Port ............................................... 1- 2
1.2 Survey and Study Areas ........................................................................................ 1- 2
1.3 Objectives of the Study ......................................................................................... 1- 2
CHAPTER2 Current Status and Future Prospects of Transport/Logistics Sector in
the Eastern MPA 2.1 Understanding the Current Status and Future Prospects of Port Sector ................ 2- 1
2.1.1 Understanding the Current Status, Future Prospects and Existing Improvement Projects of Port Sector ...................................................... 2- 1
2.1.2 Understanding the Current Status and Future Prospects ...................................... 2-17
2.2 Port Administration .............................................................................................. 2-32
2.2.1 Current Situation of Port Administration ............................................................. 2-32
2.3 Understanding the Current Status andFuture Prospects of Logistics Related Facilities .................................................................................. 2-36
2.3.1 Current Status and Future Prospects of Logistics Related Facilites ..................... 2-36
2.4 Understanding Present Condition, Perspective, and Existing Development Plan of Road Sector ......................................................... 2-41
2.4.1 Traffic Congestion on Jakarta – Cikampek Toll Road ......................................... 2-41
2.4.2 Traffic Congestion on Arterial Road in Front of Container Terminal at Tanjung Priok Port ........................................................................................... 2-45
2.4.3 Access Road to Interchanges of Toll Road in the Eastern Industrial Estates ....... 2-54
2.4.4 Ring Road and North-South Road Development in Jakarta Eastern Industrial Estates ........................................................................ 2-59
2.4.5 Missing Link of Jakarta Outer Ring Road: W2 Section and Future Prospects .... 2-65
The Study on Efficient and Integrated Transport/Logistics Development in Eastern MPA
ii
2.5 Understanding the Present Condition and Perspective of Good Railway Transportation .............................................................................. 2-65
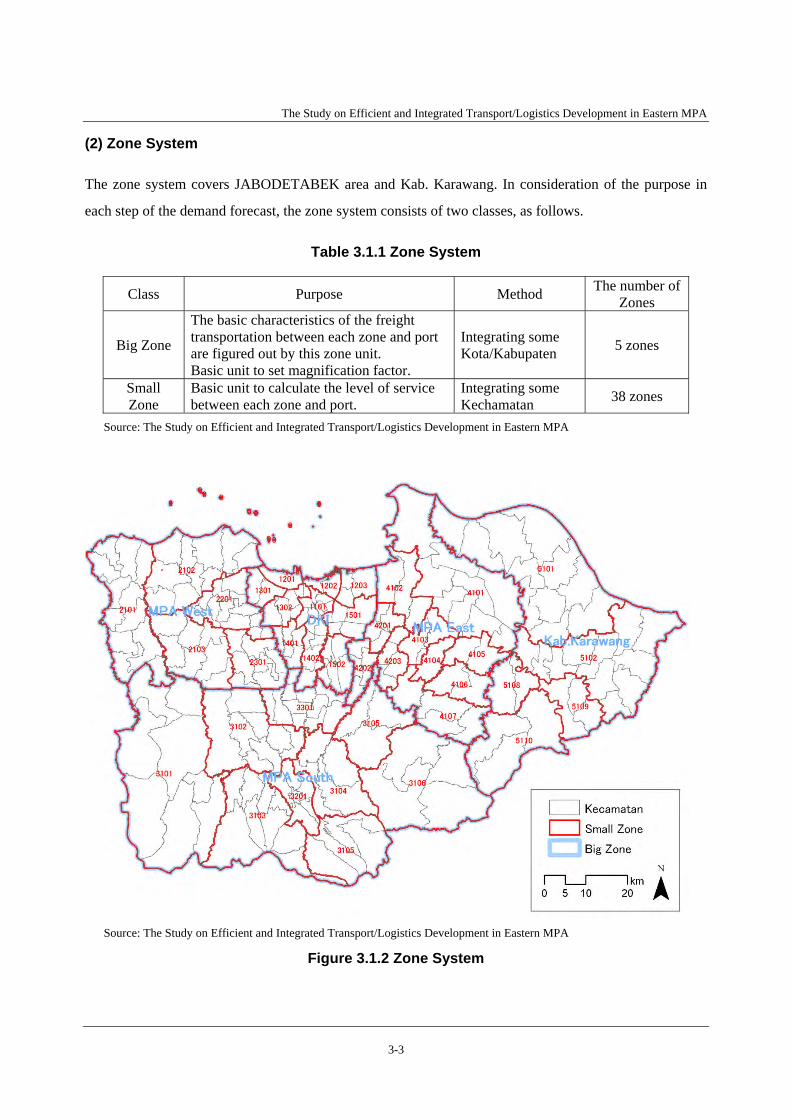
CHAPTER3 Forecast of Transportation and Logistics in the Eastern MPA 3.1 Current Status and Issues of Transportation and Logistics in the Study Area ...... 3- 1
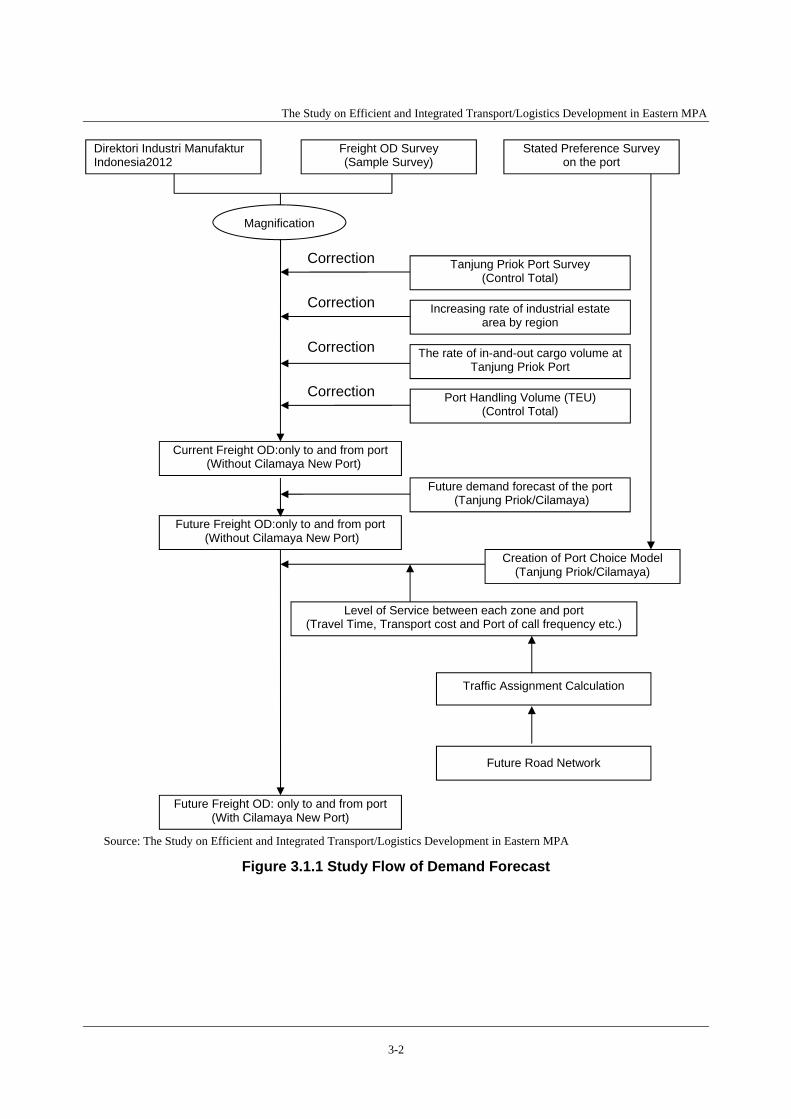
3.1.1 General Issues on Demand Forecast ..................................................................... 3- 1
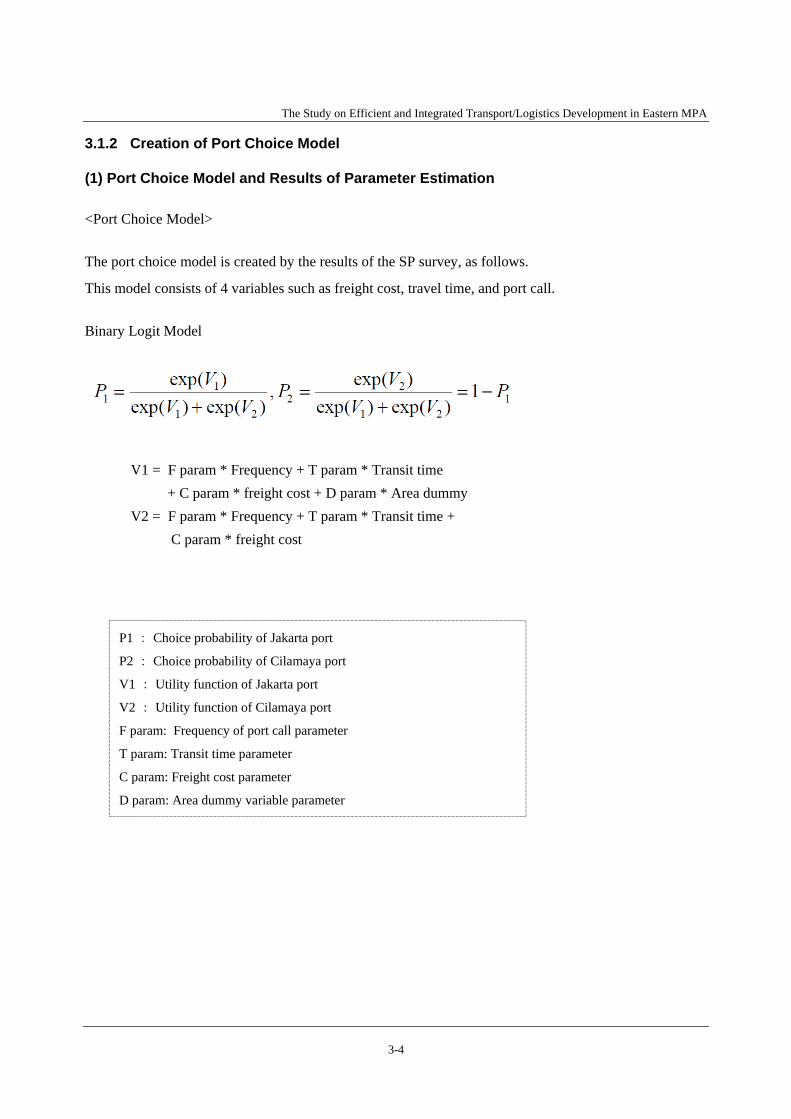
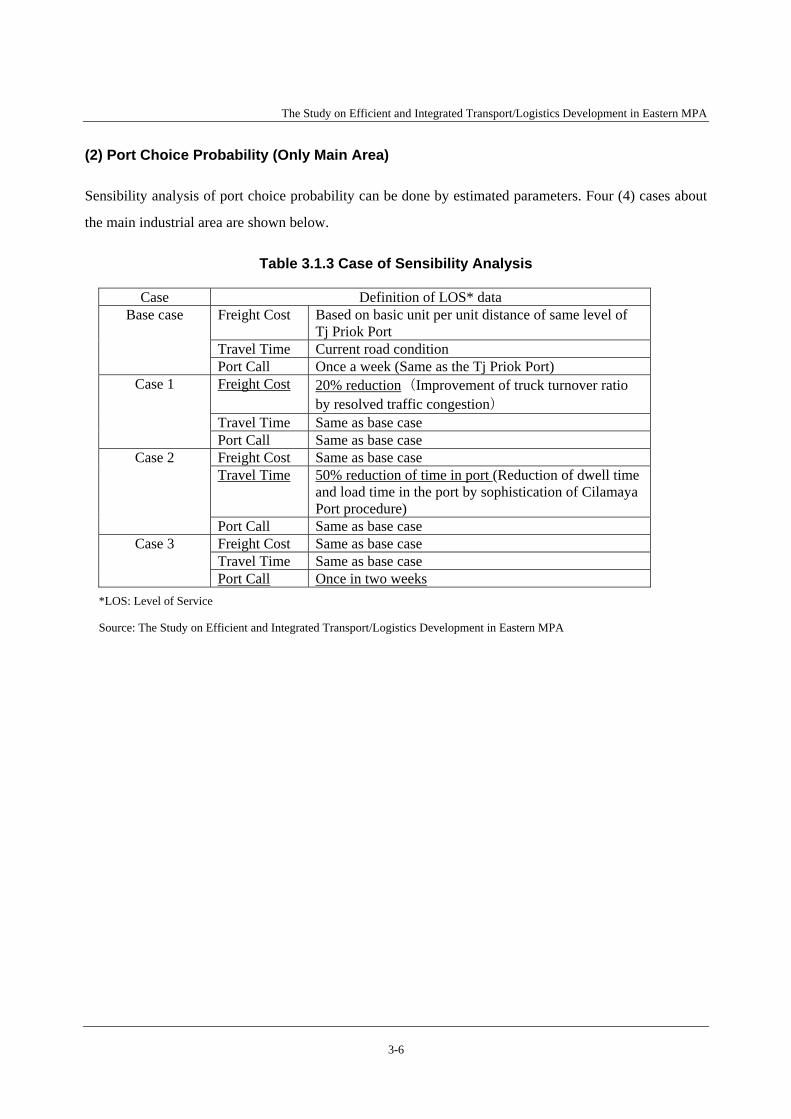
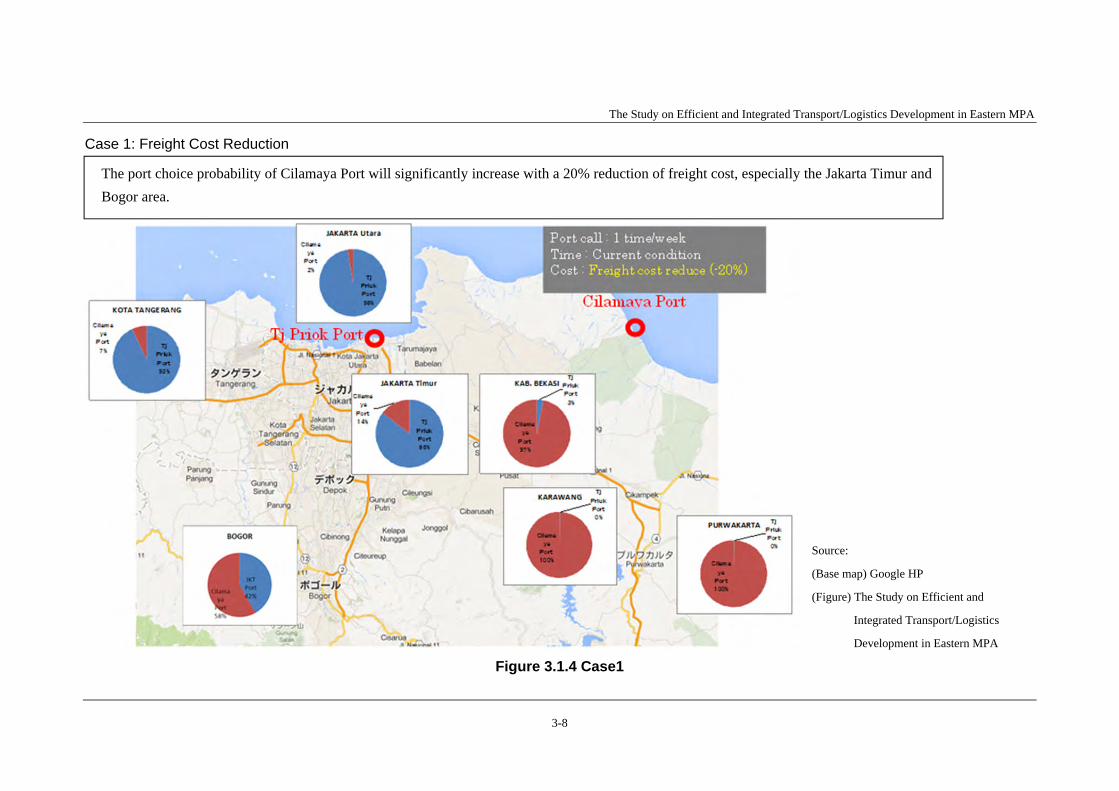
3.1.2 Creation of Port Choice Model ............................................................................. 3- 4
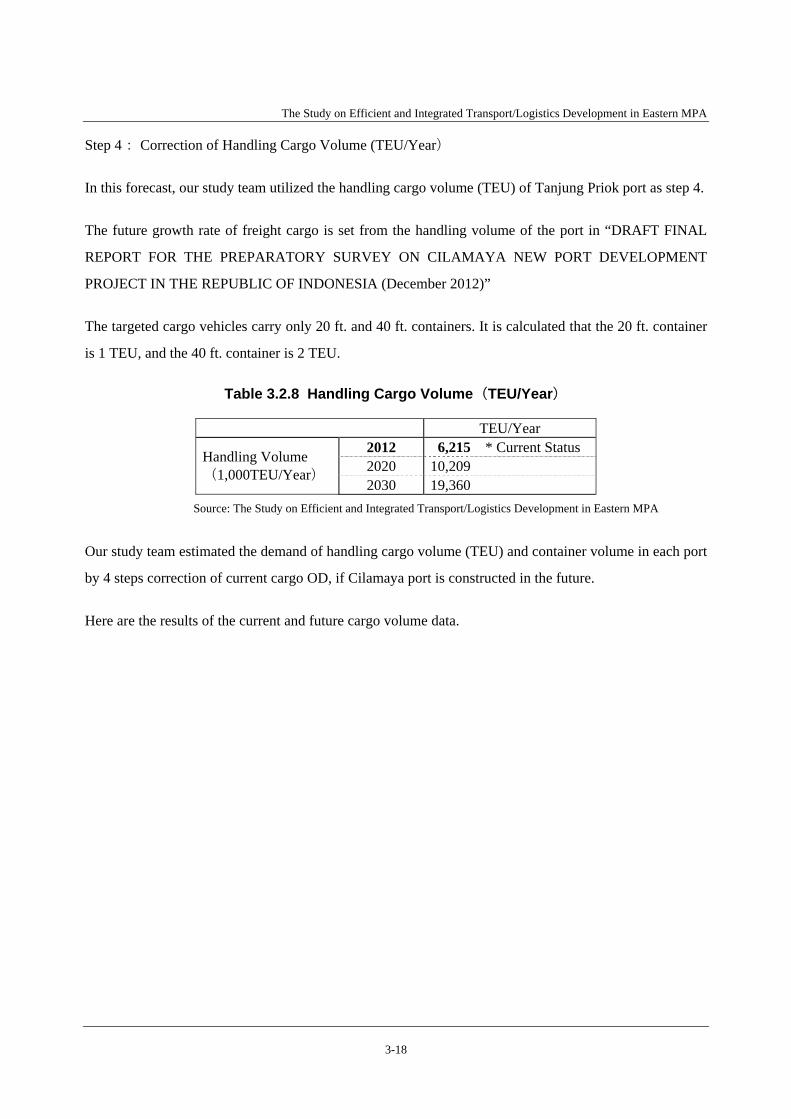
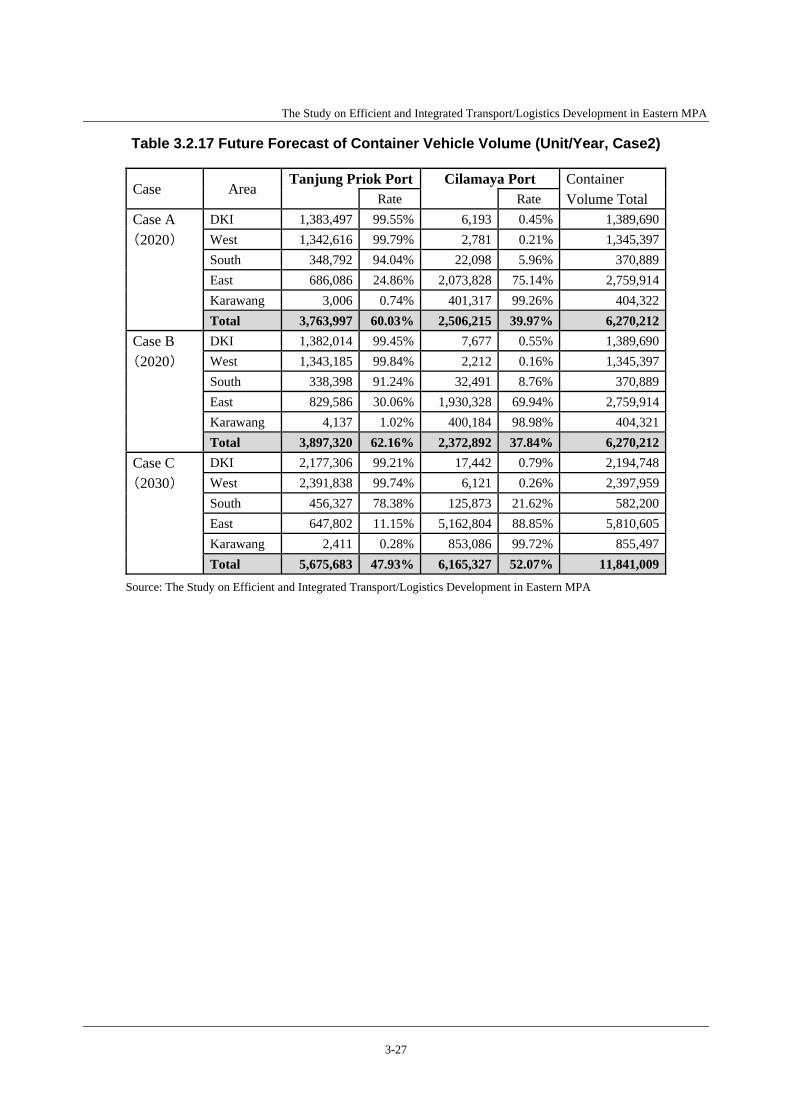
3.2 Demand Forecast of Cargo Transportation in Eastern Area ................................ 3-11
CHAPTER4 Lessons Learned from Similar Ports in Other Countries and their Hinterlands’ Development Projects
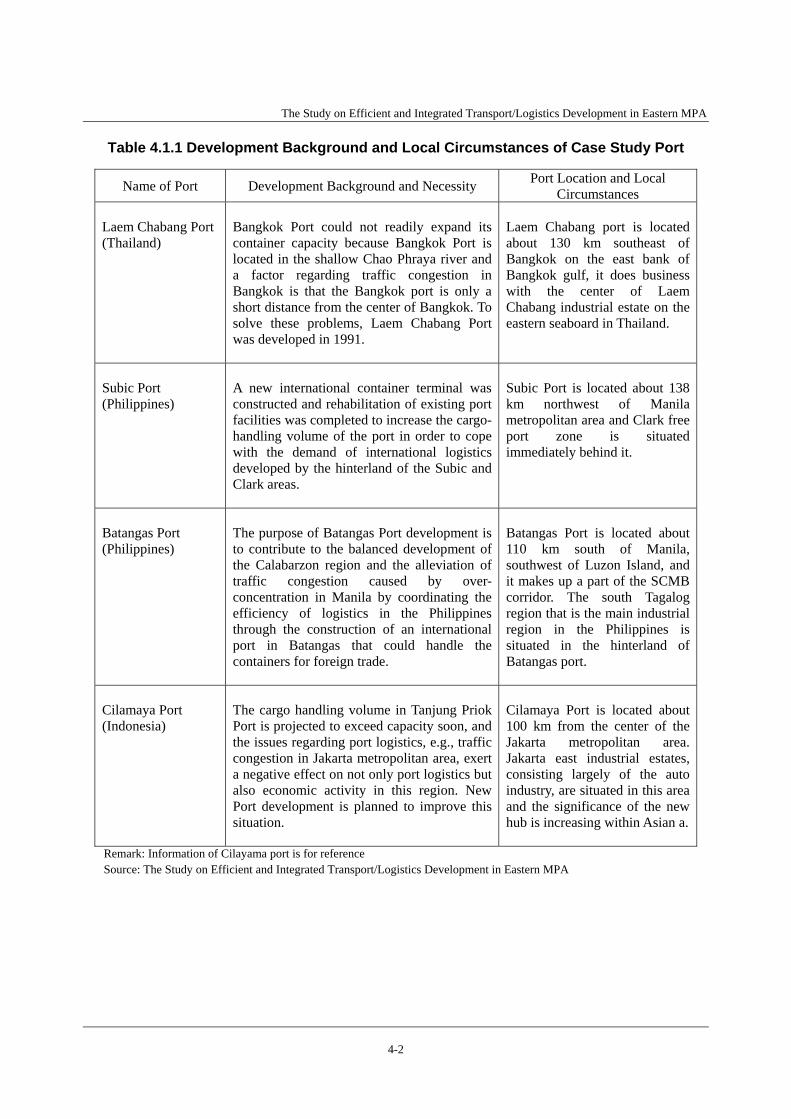
4.1 Development Background of Case Study Ports and Their Hinterlands ................ 4- 1
4.2 Current Status and Factor Analysis of Case Study Port ........................................ 4- 4
4.2.1 Current Status of Case Study Port ......................................................................... 4- 4
4.2.2 Factor Analysis of Case Study Port ....................................................................... 4- 4
4.3 Good Lessons for Development of Cilamaya Port ................................................ 4- 4
CHAPTER5 Issues and Solution of Transportation and Logistics 5.1 Short-Term Countermeasure by 2020 (before opening of Cilamaya Port) ........... 5- 1
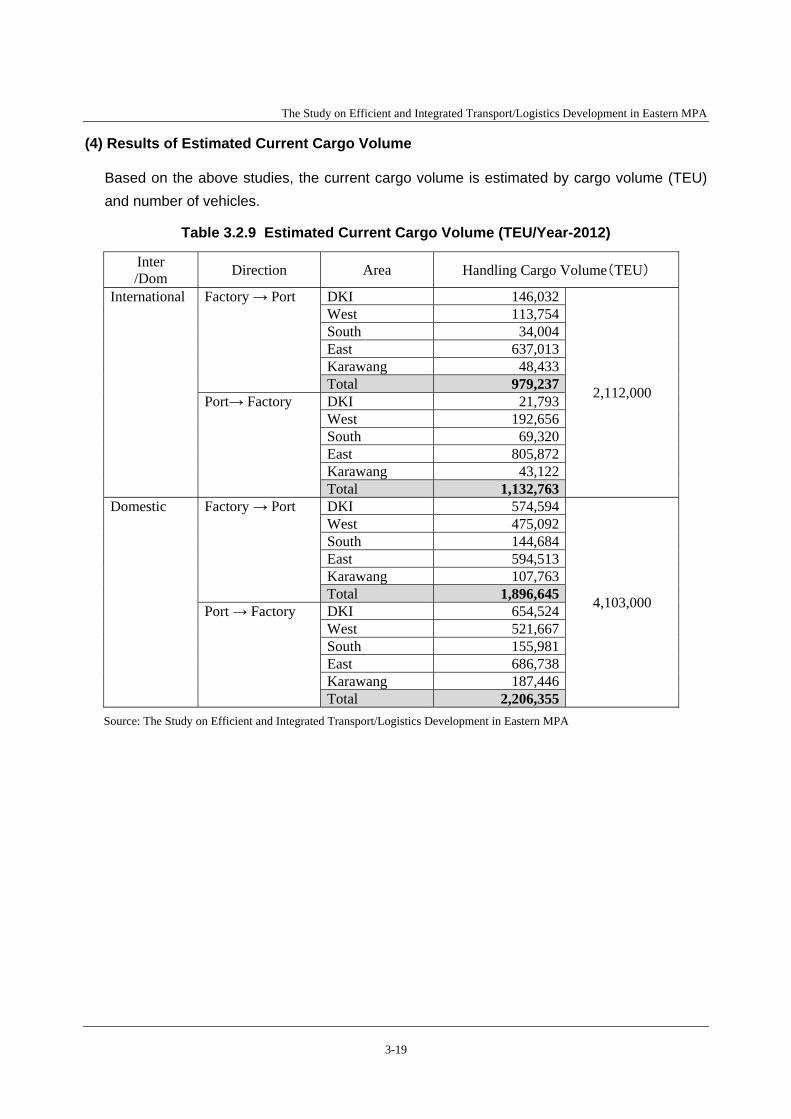
5.1.1 Short-Term Countermeasure of Infrastructure for Shortage of Terminal Space at Tanjung Priok Port .................................................................. 5- 1
5.1.2 Short-Term Countermeasures for Shortage of Terminal Space in Tanjung Priok Port ................................................................................................ 5- 7
5.1.3 Countermeasure of infrastructure for Road Congestion in Front of the Terminal at Tanjung Priok Port ..................................................................... 5-10
5.1.4 Countermeasure for Road Congestion in Front of the Terminal at Tanjung Priok Port ............................................................................................... 5-10
5.1.5 Countermeasure for Road Congestion of Jakarta-Cikampek Toll road ............... 5-11
5.1.6 Countermeasure Against Congestion of Access road to Interchange of Toll Road of Eastern MPA Located in Industrial Estate ..................................... 5-12
5.1.7 Countermeasure Against Congestion of the Arterial Road Network of Eastern Industrial Estate and South Arterial Road .............................................. 5-13
5.1.8 Small scale intersection project contributing to the improvement of transportation and logistics .................................................................................. 5-17
5.1.9 Countermeasures Against Issues of Port Administration of Tanjung Priok ......... 5-17
The Study on Efficient and Integrated Transport/Logistics Development in Eastern MPA
iii
5.2 Logistic Situation of Jakarta Metropolitan Area at the Opening of Cilamaya Port ....................................................................................................... 5-18
5.2.1 Demand of Port in Jakarta Metropolitan Area and the Significance of the Eastern MPA .................................................................................................. 5-18
5.2.2 Change in Logistics .............................................................................................. 5-19
5.2.3 Change in Logistics Cost and Time ..................................................................... 5-20
5.2.4 Demand Forecast and Transport Time ................................................................. 5-24
5.3 Long-term Issues and Solutions contributing to the Logistics Improvement of Eastern MPA after Opening of Cilamaya Sea Port in 2020. ................................ 5-25
5.3.1 Long-Term Countermeasure Against Shortage of Terminals in Tanjung Priok Port ................................................................................................ 5-25
5.3.2 Countermeasure for Road Congestion in Front of the Terminal at Tanjung Priok Port ............................................................................................... 5-25
5.3.3 Countermeasure for Road Congestion of Jakarta-Cikampek Toll Road .............. 5-25
5.3.4 Countermeasures Against Congestion of Access Road to Interchange of Toll Road of Eastern MPA Located in Industrial Estate ..................................... 5-26
5.3.5 Countermeasures for Logistics Efficiency of Cilamaya New Port ...................... 5-27
CHAPTER6 Recommendation Contributing to Logistics Improvement in Eastern MPA 6.1 Recommendation Contributing to the Logistics Improvement in Eastern MPA until 2020 .............................................................................................................. 6- 1
6.1.1 Short-Term Countermeasure of Infrastructure for Shortage of Terminal Space at Tanjung Priok Port .................................................................. 6- 1
6.1.2 Short-Term Countermeasures for Shortage of Terminal Space in Tanjung Priok Port ................................................................................................ 6- 2
6.1.3 Countermeasure of Infrastructure for Road Congestion in Front of Terminal at Tanjung Priok Port ............................................................................ 6- 3
6.1.4 Countermeasures for Road Congestion in Front of Terminal at Tanjung Priok Port ................................................................................................ 6- 3
6.1.5 Countermeasure for Jakarta-Cikampek Toll Road Congestion ............................. 6- 3
6.1.6 Countermeasures Against Congestion of Access Road to Interchange of Toll Road of Eastern MPA Located in Industrial Estate ...................................... 6- 4
6.1.7 Countermeasures Against Congestion of the Arterial Road Network of Eastern Industrial Estate and South Arterial Road ................................................ 6- 4
6.1.8 Small scale intersection project contributing to the improvement of transportation and logistics ................................................................................... 6- 5
6.2 Recommendation Contributing to the Logistic Improvement of Eastern MPA after Opening of Cilamaya Sea Port in 2020. ................................. 6- 5
6.2.1 Long-Term Countermeasure Against Shortage of Terminals in Tanjung Priok Port ................................................................................................ 6- 5
The Study on Efficient and Integrated Transport/Logistics Development in Eastern MPA
iv
6.2.2 Countermeasure for Road Congestion in Front of the Terminal at Tanjung Priok Port ................................................................................................ 6- 6
6.2.3 Countermeasure for Road Congestion of Jakarta-Cikampek Toll Road ............... 6- 6
6.2.4 Countermeasures Against Congestion of Access Road to Interchange of Toll Road of Eastern MPA Located in Industrial Estate ...................................... 6- 6
6.2.5 Countermeasures for Logistics Efficiency of Cilamaya New Port ....................... 6- 7
6.3 Project Contributing to the Improvement of Transportation/Logistics in Eastern MPA ......................................................................................................... 6- 7
The Study on Efficient and Integrated Transport/Logistics Development in Eastern MPA
v
LIST OF TABLES
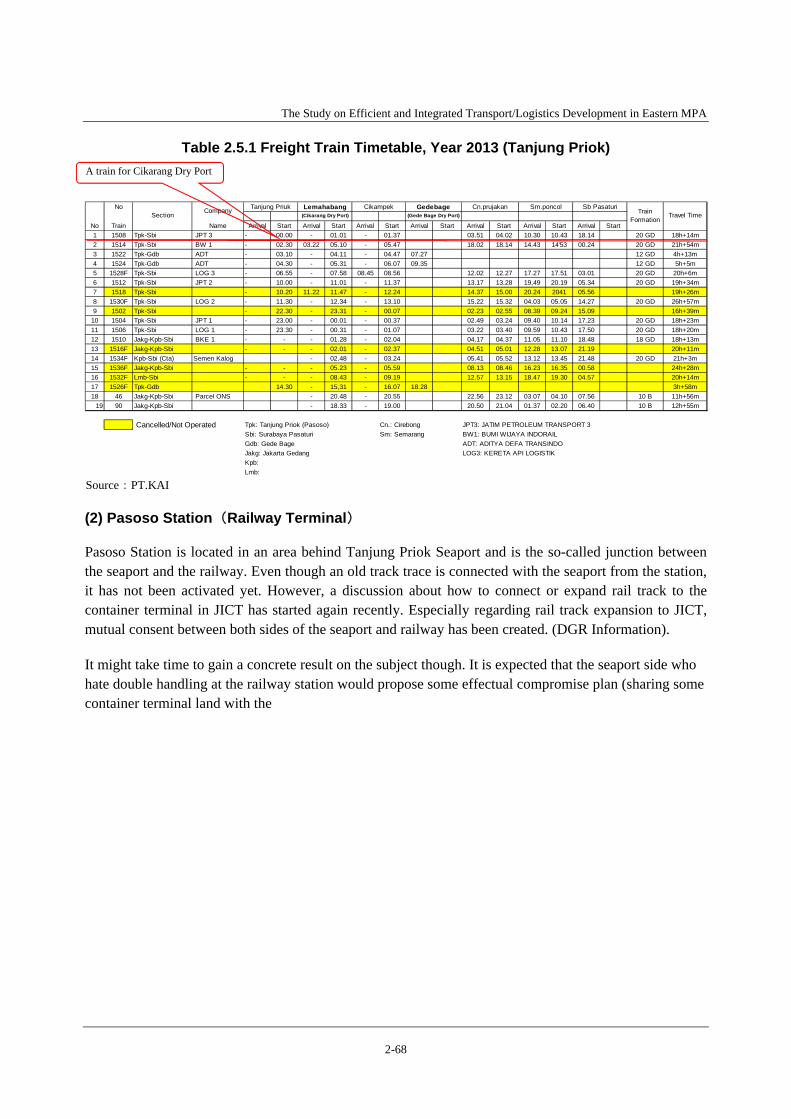
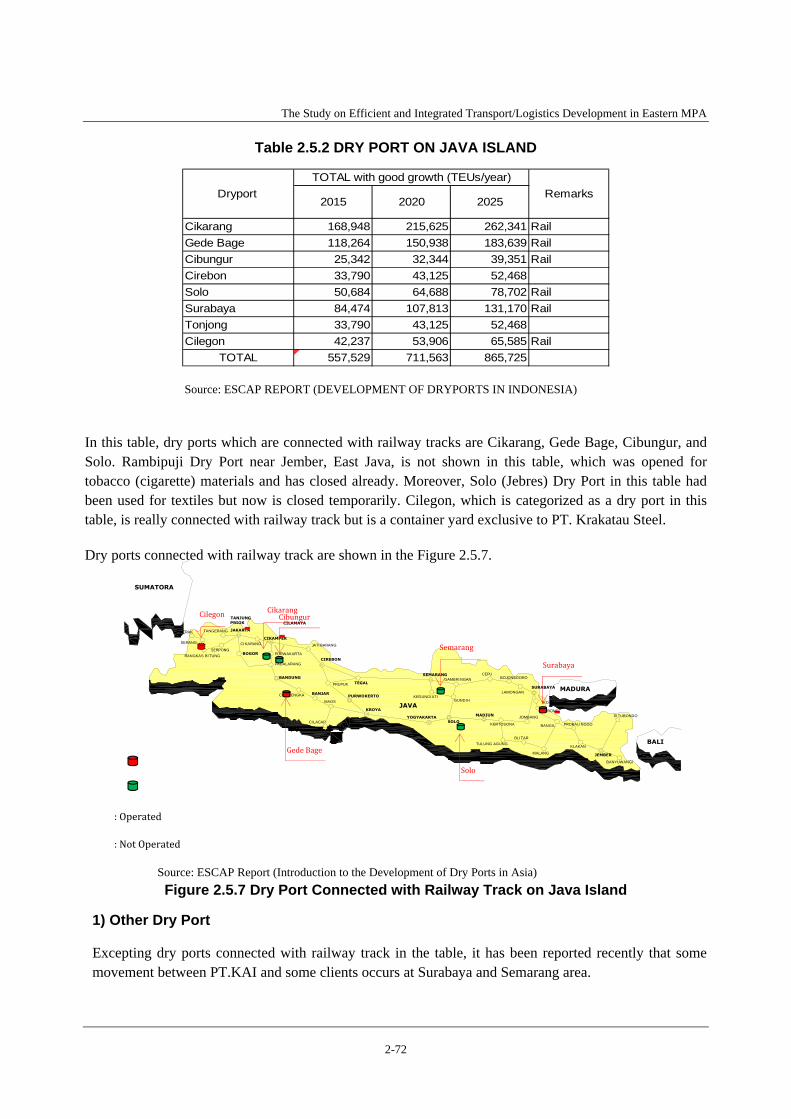
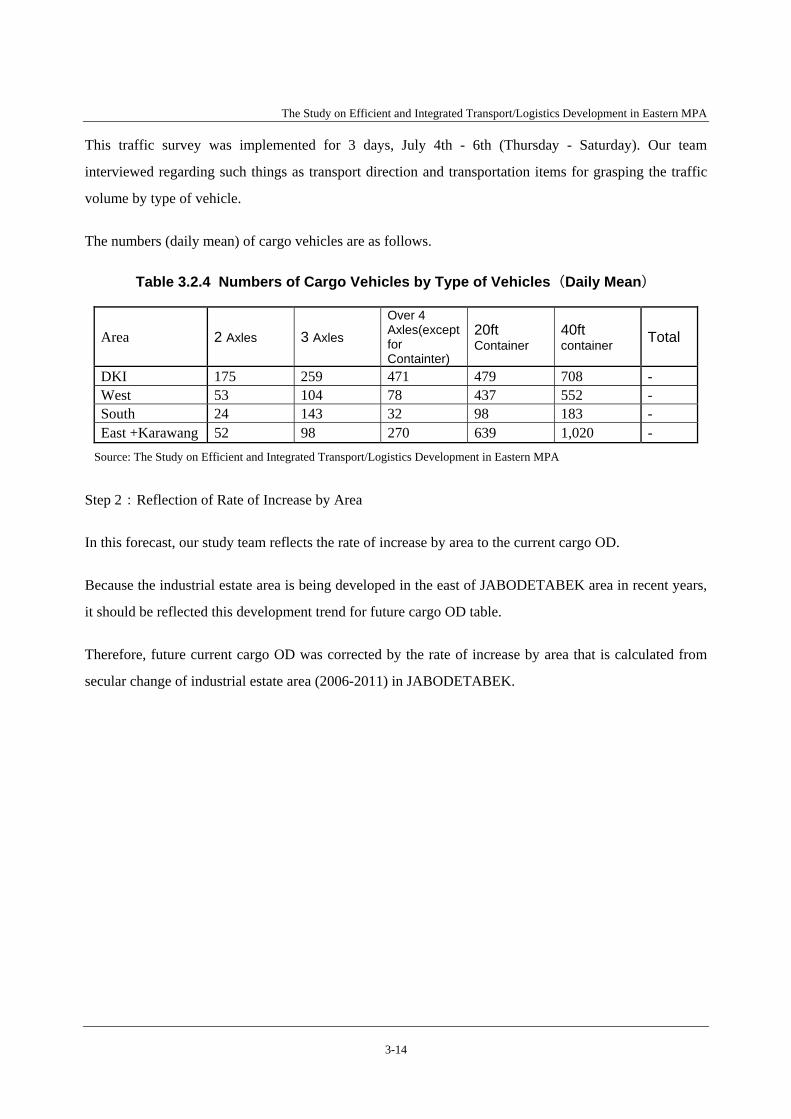
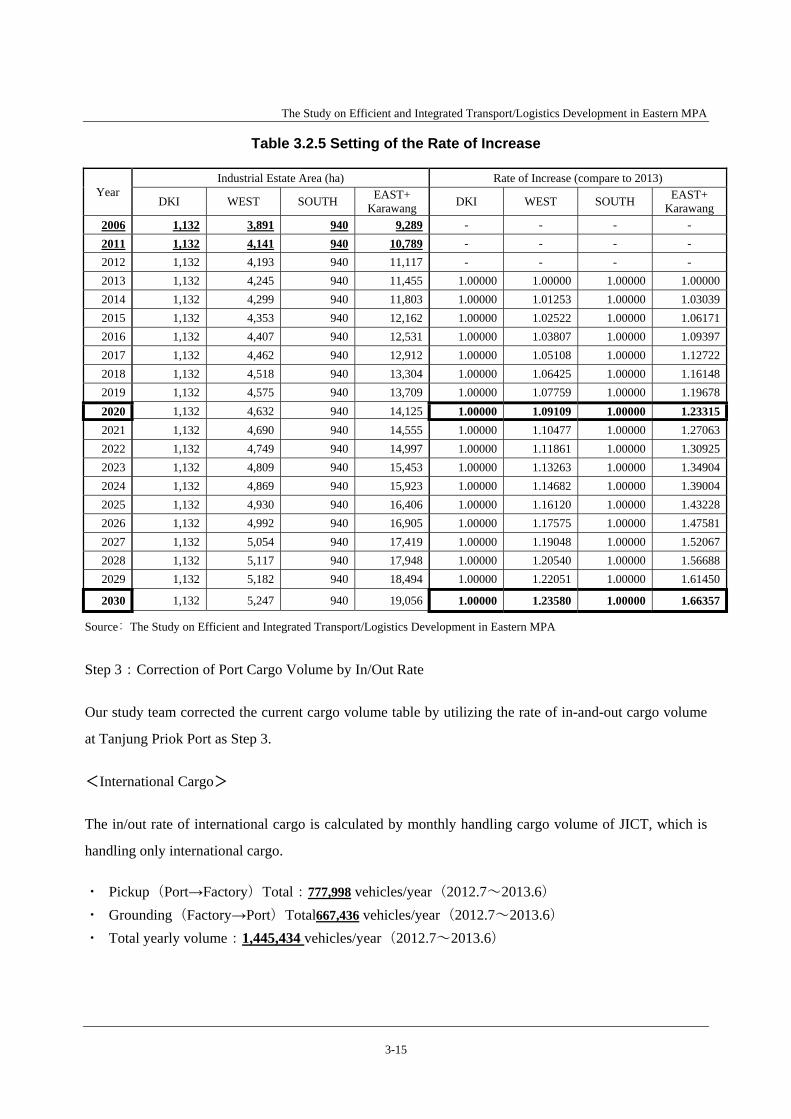
Table 2.1.1 Volume of Containers in Tanjung Priok Port ................................................................... 2- 2 Table 2.1.2 Capacity of Container Terminals ...................................................................................... 2- 3 Table 2.1.3 Specifications of Major Container Terminals ................................................................... 2- 5 Table 2.1.4 Measures for Capacity Increasing Taken in JICT-1 ......................................................... 2- 6 Table 2.1.5 Master Plan of North Kalibaru Development .................................................................. 2-10 Table 2.1.6 Cilamaya New port .......................................................................................................... 2-16 Table 2.1.7 Average time for customs clearance ................................................................................ 2-17 Table 2.1.8 Comparison of Required Time by Nation ........................................................................ 2-18 Table 2.1.9 Main Improvements by Introduction of e-Ticket System ................................................ 2-18 Table 2.1.10 Comparison of Average Terminal In/Out by Port ......................................................... 2-20 Table 2.1.11 Volume of OB Containers and OB ratio (JICT 1, January, 2012 - July, 2013) ............. 2-25 Table 2.1.12 The Number of Gate-In Trucks for Terminal ................................................................ 2-27 Table 2.1.13 Government Agencies Issuing Import/Export Licenses ................................................ 2-29 Table 2.1.14 Main Events Towards the Development of Customs EDI System ................................ 2-30 Table 2.2.1 Current Situation of Port Administration ......................................................................... 2-34 Table 2.3.1 Outline of the Facility ...................................................................................................... 2-38 Table 2.3.2 The Current Situation of Cikarang Dry Port. ................................................................... 2-38 Table 2.3.3 Key Comparisons: Tanjung Priok Port and Cikarang Dry Port ....................................... 2-39 Table 2.3.4 Estimated Cost Comparison for Using Cikarang Dry Port and Tanjung Priok Port ........ 2-39 Table 2.4.1 Estimated Traffic Volume on the Road in front of terminal at Tanjung Priok Port ........ 2-49 Table 2.4.2 Project Condition of R.E. Martadinata ............................................................................ 2-51 Table 2.4.3 Project Condition of Sulawesi - Tg.PA ............................................................................ 2-52 Table 2.5.1 Freight Train Timetable, Year 2013 (Tanjung Priok) ...................................................... 2-68 Table 2.5.2 DRY PORT ON JAVA ISLAND .................................................................................... 2-72 Table 2.5.3 Major Double Tracking Project(Java Island) ............................................................. 2-74 Table 2.5.4 Track Capacity in Double-double Tracking in Bekasi Line (Estimation) ....................... 2-74 Table 3.1.1 Zone System ..................................................................................................................... 3- 3 Table 3.1.2 Results of Parameter Estimation ....................................................................................... 3- 5 Table 3.1.3 Case of Sensibility Analysis ............................................................................................. 3- 6 Table 3.2.1 Analysis Case Set ............................................................................................................. 3-11 Table 3.2.2 Area Classification ........................................................................................................... 3-12 Table 3.2.3 Industry Classifications .................................................................................................... 3-13 Table 3.2.4 Numbers of Cargo Vehicles by Type of Vehicles(Daily Mean) ................................ 3-14 Table 3.2.5 Setting of the Rate of Increase ......................................................................................... 3-15 Table 3.2.6 JICT Monthly Cargo Volume .......................................................................................... 3-16 Table 3.2.7 Domestic Container Cargo Volume of Tanjung Priok Port ............................................. 3-16 Table 3.2.8 Handling Cargo Volume(TEU/Year) ......................................................................... 3-18 Table 3.2.9 Estimated Current Cargo Volume (TEU/Year-2012) ...................................................... 3-19 Table 3.2.10 Estimated Current Cargo Volume (Number of Vehicles/Year-2012) ............................ 3-20 Table 3.2.11 Future Forecast of Cargo Volume (TEU/Year, Base Case) ........................................... 3-21 Table 3.2.12 Future Forecast of Cargo Volume (TEU/Year, Case1) .................................................. 3-22 Table 3.2.13 Future Forecast of Cargo Volume (TEU/Year, Case2) .................................................. 3-23
The Study on Efficient and Integrated Transport/Logistics Development in Eastern MPA
vi
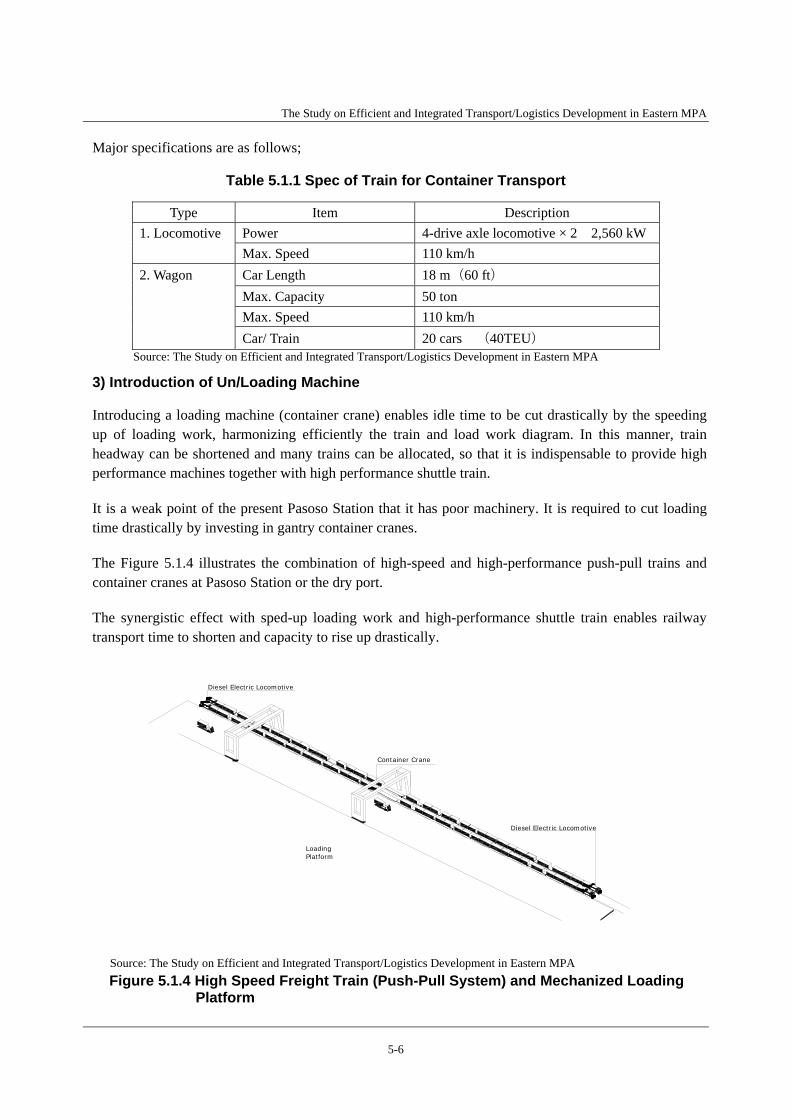
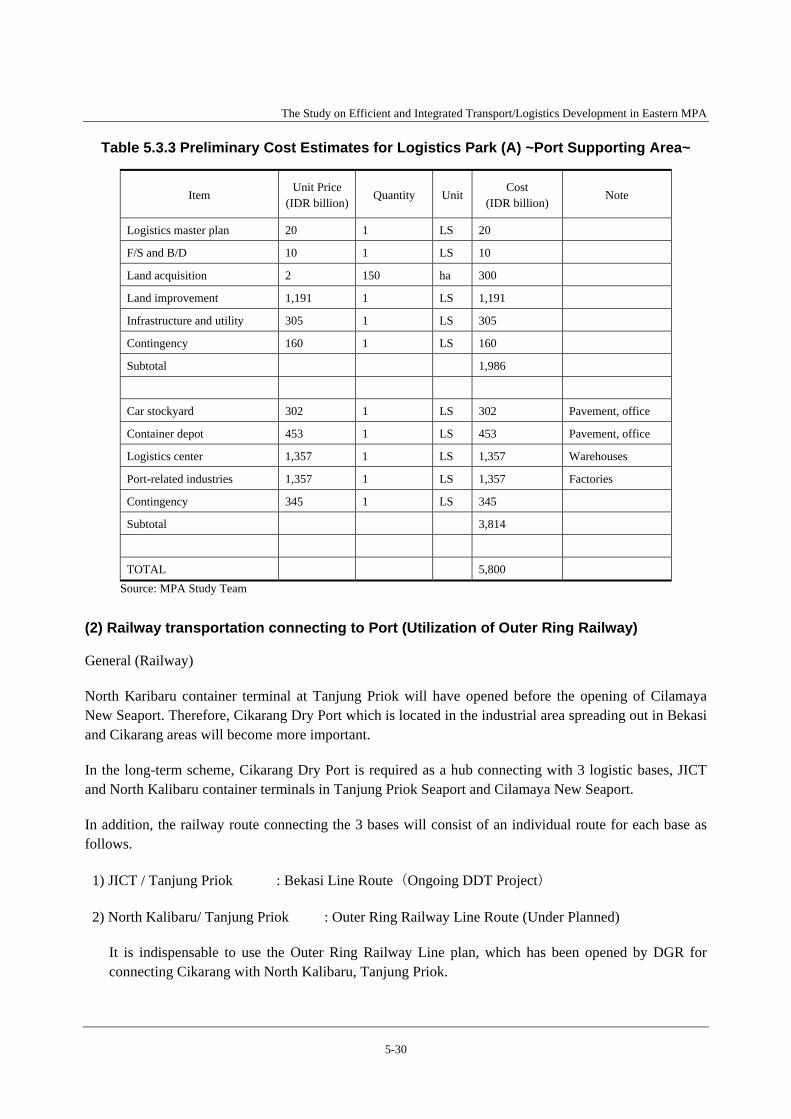
Table 3.2.14 Future Forecast of Cargo Volume (TEU/Year, Casse3) ................................................ 3-24 Table 3.2.15 Future Forecast of Container Vehicle Volume (Unit/Year, Base Case) ........................ 3-25 Table 3.2.16 Future Forecast of Container Vehicle Volume (Unit/Year, Case1) ............................... 3-26 Table 3.2.17 Future Forecast of Container Vehicle Volume (Unit/Year, Case2) ............................... 3-27 Table 3.2.18 Future Forecast of Container Vehicle Volume (Unit/Year, Case3) ............................... 3-28 Table 4.1.1 Development Background and Local Circumstances of Case Study Port ........................ 4- 2 Table 4.1.2 Comparison of Port Development Plan ............................................................................ 4- 3 Table 5.1.1 Spec of Train for Container Transport .............................................................................. 5- 6 Table 5.1.2 Number of Gate-In Trucks by Day and Time ................................................................... 5- 9 Table 5.2.1 Demands of Containers at Tanjung Priok Port and Cilamaya Port .................................. 5-18 Table 5.2.2 Road Network Conditions................................................................................................ 5-19 Table 5.2.3 Predicted Travel Speed, Waiting Time at Terminal Gate and Duration in the Container Terminal 2020 ...................................................................................... 5-21 Table 5.2.4 Time, Using Tanjung Priok Port and Cilamaya Port in 2020 .......................................... 5-22 Table 5.2.5 Time of Breakdown, Using Tanjung Priok Port and Cilamaya Port in 2020 .................. 5-22 Table 5.2.6 Logistics Cost Using Tanjung Priok Port and Cilamaya Port in 2020 ............................. 5-24 Table 5.2.7 The Demand of Containers and Round-Trip Transport Time from Factory to Port ........ 5-24 Table 5.3.1 Area Allocation of Logistics Park (1) .............................................................................. 5-29 Table 5.3.2 Area Allocation of Logistics Park (2) .............................................................................. 5-29 Table 5.3.3 Preliminary Cost Estimates for Logistics Park (A) ~Port Supporting Area~ .................. 5-30 Table 6.3.1 Recommended Projects Contributing to the Improvement of Transportation/Logistics
in Eastern MPA ................................................................................................................ 6- 8
The Study on Efficient and Integrated Transport/Logistics Development in Eastern MPA
vii
LIST OF FIGURES
Figure 1.1.1 Economic Corridors in Indonesia and GRDP of each Economic Corridor,
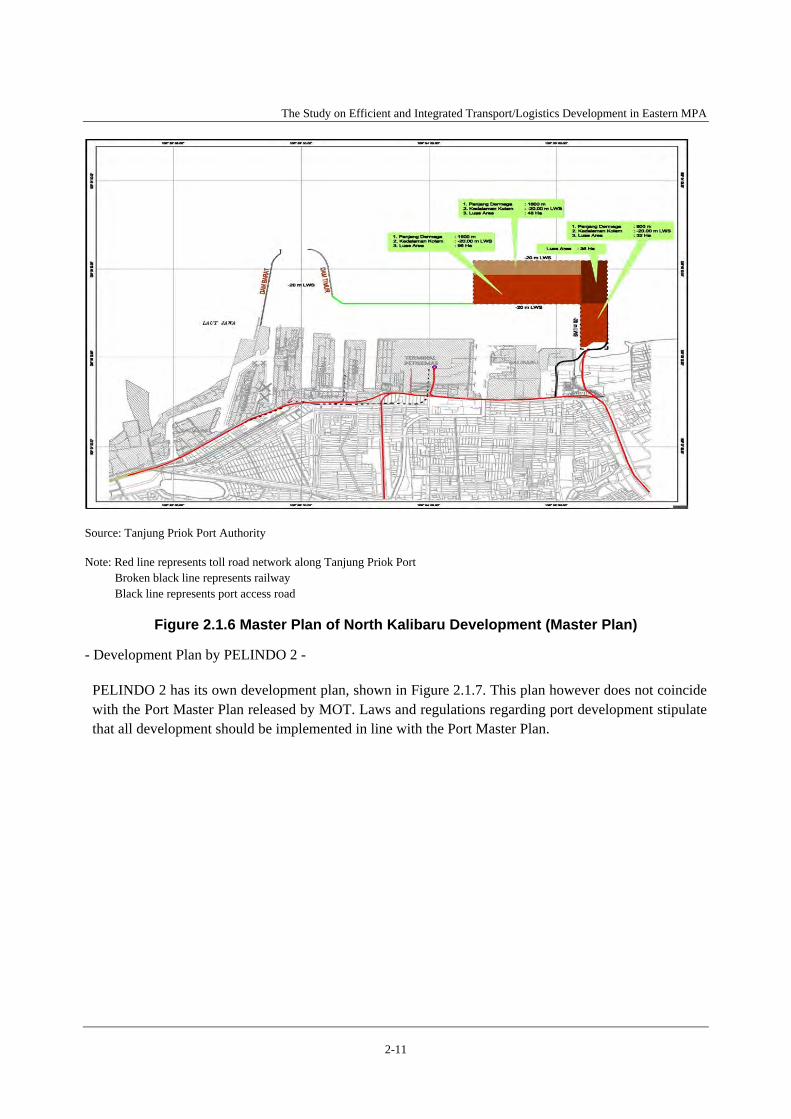
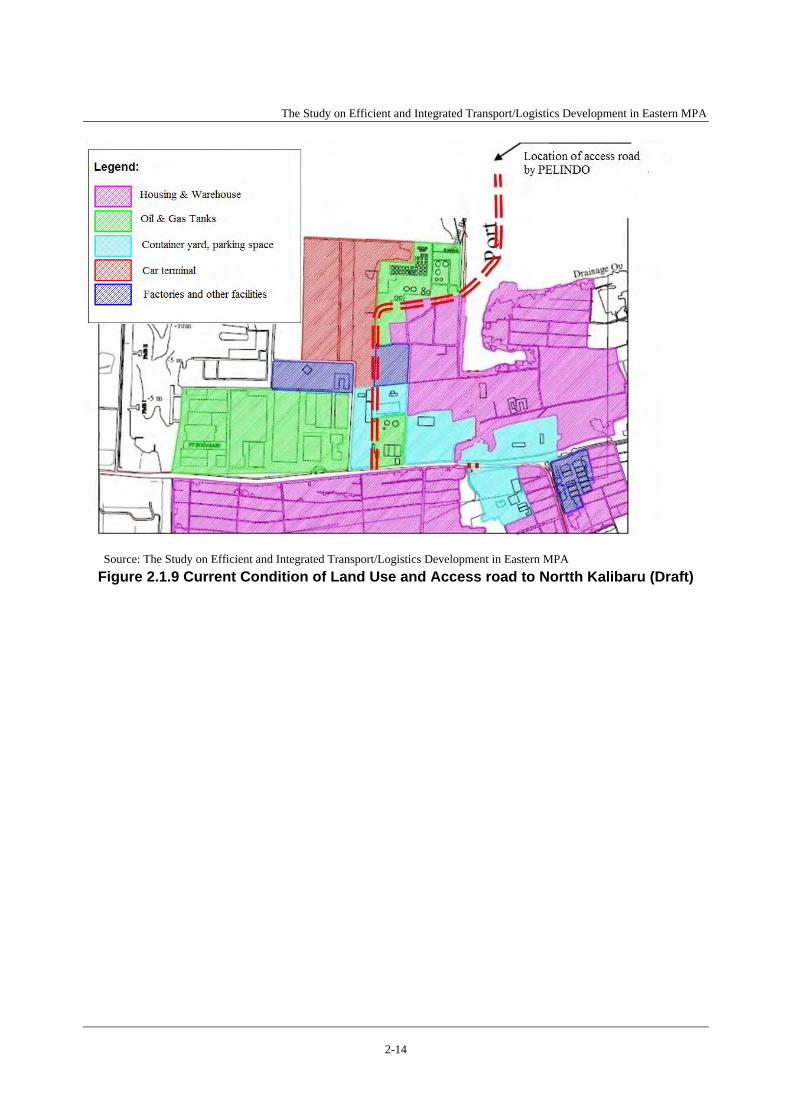
and the Concept of Greater Jakarta MPA ....................................................................... 1- 1 Figure 2.1.1 Major Container Terminals in Tanjung Priok Port ......................................................... 2- 2 Figure 2.1.2 Volume of Containers in Tanjung Priok Port ................................................................. 2- 3 Figure 2.1.3 The Existing Port Facility Layout of Tanjung Priok Port ............................................... 2- 4 Figure 2.1.4 Locations of Container Depots Around Tajung Priok Port ............................................ 2- 7 Figure 2.1.5 Forecast of Container Throughput of Port in Jakarta Metropolitan Area ....................... 2- 8 Figure 2.1.6 Master Plan of North Kalibaru Development (Master Plan) ......................................... 2-11 Figure 2.1.7 Development Plan by PELINDO 2 ............................................................................... 2-12 Figure 2.1.8 Construction Work ........................................................................................................ 2-12 Figure 2.1.9 Current Condition of Land Use and Access road to Nortth Kalibaru (Draft) ................ 2-14 Figure 2.1.10 Location of New Cilamaya Port .................................................................................. 2-15 Figure 2.1.11 New Cilamaya Port Development Plan ....................................................................... 2-16 Figure 2.1.12 Hourly Container Box Throughput (JICT) in 2009 ..................................................... 2-19 Figure 2.1.13 Hourly Container Box Throughput (JICT) in 2012 ..................................................... 2-19 Figure 2.1.14 Average Terminal In/Out Time at JICT and KOJA Terminal ..................................... 2-20 Figure 2.1.15 Ratio of Import Declaration on Day of Truck Visits ................................................... 2-21 Figure 2.1.16 Terminal Duration on a Per-Day Basis ........................................................................ 2-21 Figure 2.1.17 Average Required Time on Each Activity in Container Terminal
at Tanjung Priok Port .................................................................................................. 2-22 Figure 2.1.18 Density Ratio of Container Yard (Import & Export) ................................................... 2-23 Figure 2.1.19 Ratio of Import Cargo by Day, and Submission Rate of Import Declarations
by Day ......................................................................................................................... 2-24 Figure 2.1.20 Average Volume of Export and Import Cargo on Each Day (TEU) ........................... 2-28 Figure 2.1.21 Scheme of New INAPORTNET .................................................................................. 2-31 Figure 2.3.1 Relative Location of Cikarang Dry Port and Tanjung Priok Port/Cilamaya
New Port ........................................................................................................................ 2-36 Figure 2.3.2 Location of Cikarang Dry Port ...................................................................................... 2-37 Figure 2.3.3 Current Status of Railway Facilities at Cikarang Dry Port ............................................ 2-37 Figure 2.3.4 Outline of Cikarang Dry Port Facilities ......................................................................... 2-38 Figure 2.3.5 Railway Network in Java Island and Location of Gete bage Dry Port .......................... 2-40 Figure 2.3.6 Transportation Trend by Railway of Gete Bage Dry Port ............................................. 2-41 Figure 2.4.1 Routes for Travel Speed Survey and Road Section ID .................................................. 2-42 Figure 2.4.2 Average Travel Time of Trucks on Jakarta−Cikampek toll road and
Jakarta Outer Ring Road by Day of Week and by Hour Band ...................................... 2-43 Figure 2.4.3 Travel Time Distribution of Trucks on Jakarta−Cikampek Toll Road and
Jakarta Outer Ring Road ............................................................................................... 2-44 Figure 2.4.4 Traffic Volume and Capacity on the Jakarta−Cikampek Toll Road ............................. 2-45 Figure 2.4.5 Traffic Congestion of the Arterial Road in front of Container Terminal of
Tanjung Priok Port ........................................................................................................ 2-46 Figure 2.4.6 Traffic Congestion on the road in front of Tanjung Priok Port ..................................... 2-47 Figure 2.4.7 Tanjung Priok Access Road Development Plan and Progress ...................................... 2-47
The Study on Efficient and Integrated Transport/Logistics Development in Eastern MPA
viii
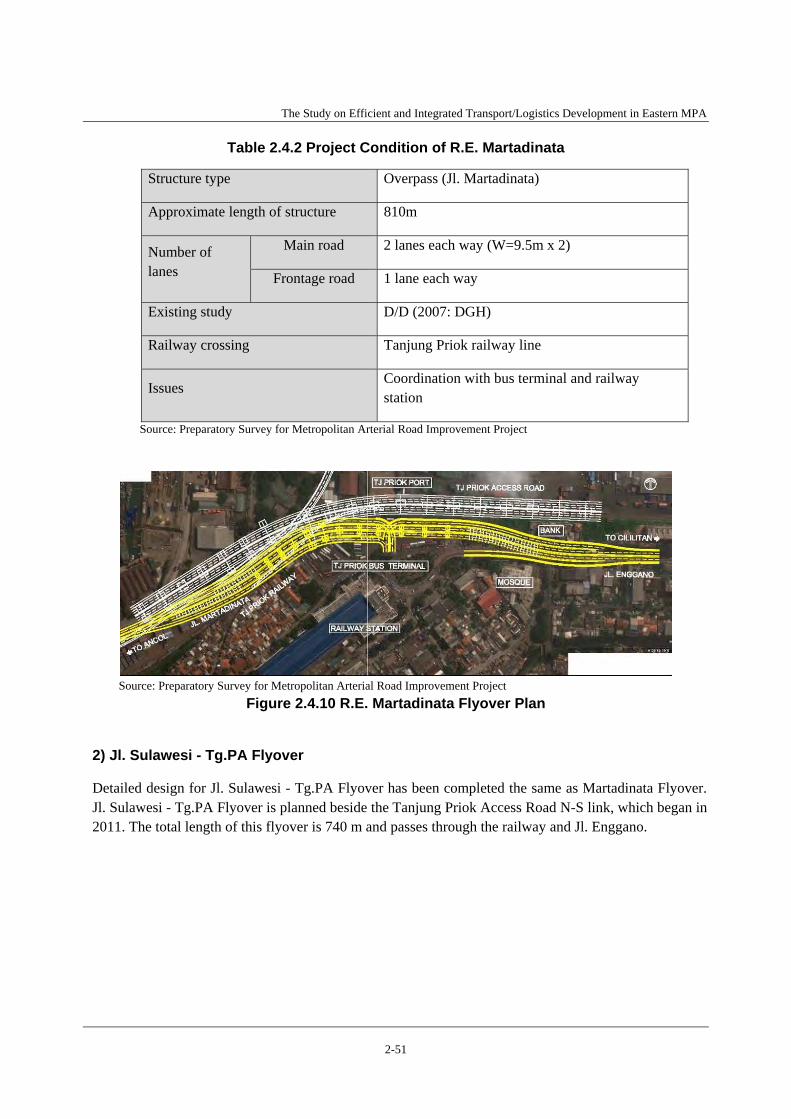
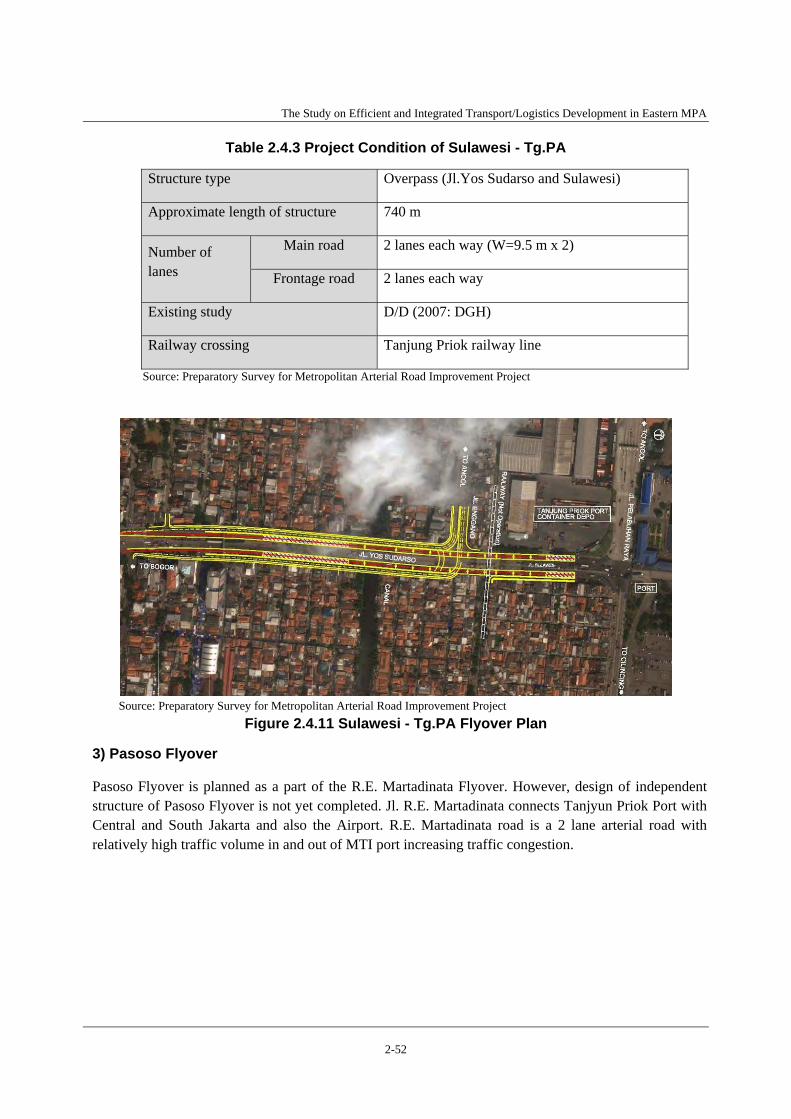
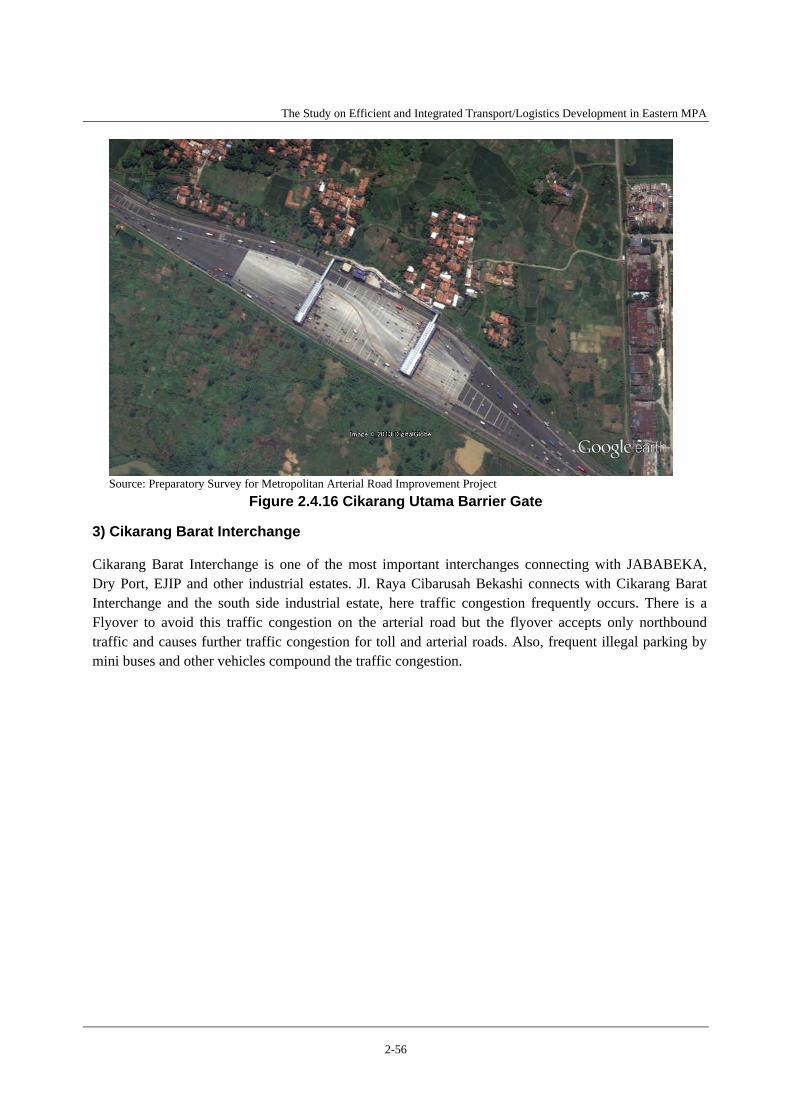
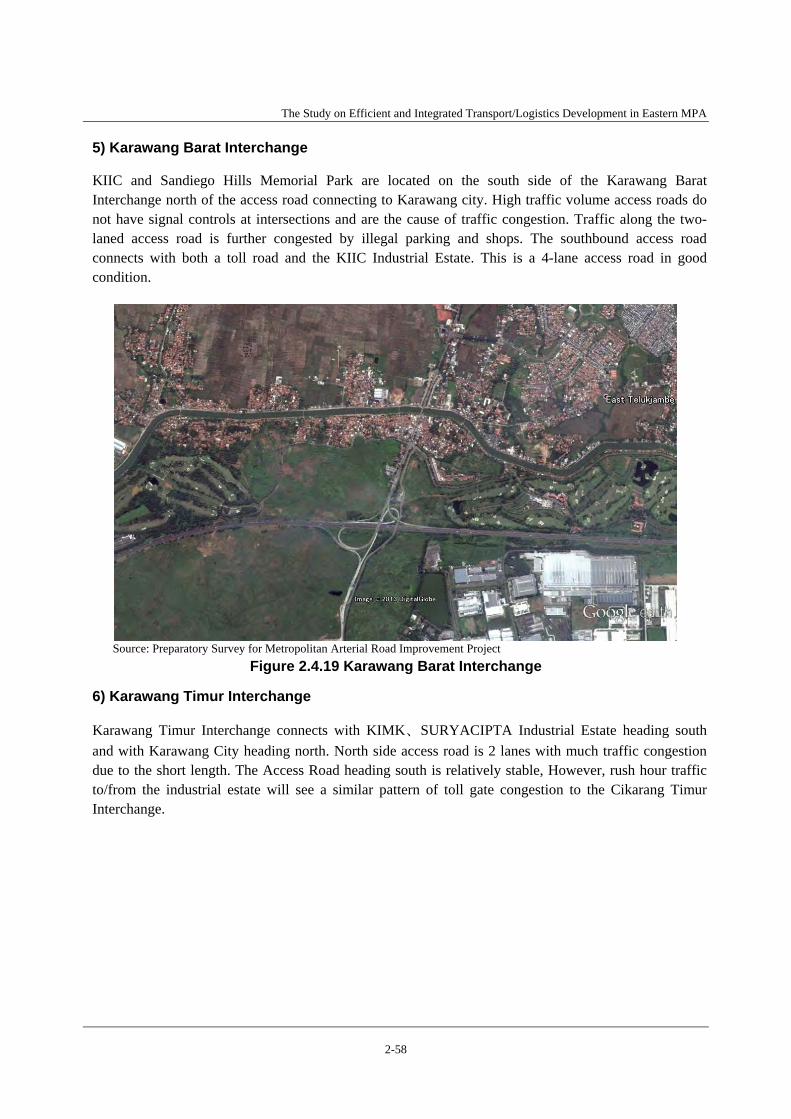
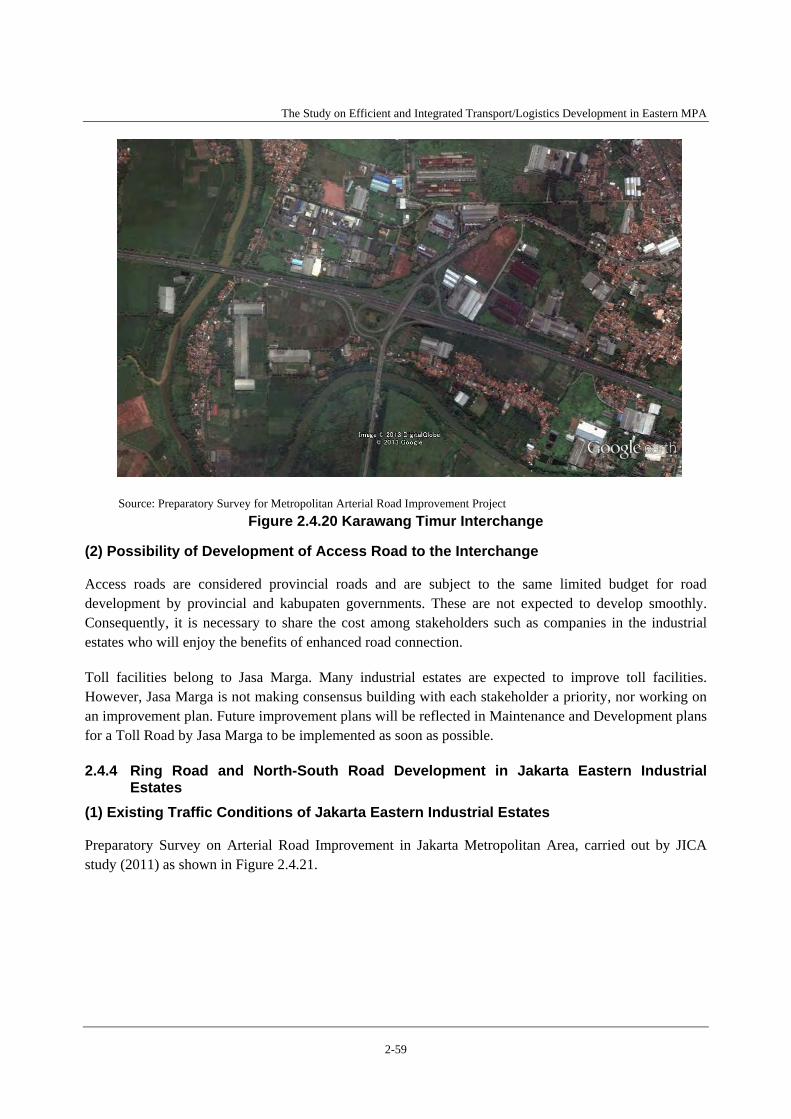
Figure 2.4.8 Perspective of Ramp at Gate near Tanjung Priok Port .................................................. 2-48 Figure 2.4.9 R.E Martadinata and Sulawesi–Tanjung Priok Flyovers ............................................... 2-50 Figure 2.4.10 R.E. Martadinata Flyover Plan .................................................................................... 2-51 Figure 2.4.11 Sulawesi - Tg.PA Flyover Plan ................................................................................... 2-52 Figure 2.4.12 Current Situation of near Pasoso Flyover Plan ............................................................ 2-53 Figure 2.4.13 Pasoso Flyover Plan .................................................................................................... 2-53 Figure 2.4.14 Travel Speed Survey Results in the Eastern Industrial Estates ................................... 2-54 Figure 2.4.15 Cibitung Toll Gate Access Road ................................................................................. 2-55 Figure 2.4.16 Cikarang Utama Barrier Gate ...................................................................................... 2-56 Figure 2.4.17 Cikarang Barat Interchange ......................................................................................... 2-57 Figure 2.4.18 Cikarang Timur Interchange ........................................................................................ 2-57 Figure 2.4.19 Karawang Barat Interchange ....................................................................................... 2-58 Figure 2.4.20 Karawang Timur Interchange ...................................................................................... 2-59 Figure 2.4.21 Ring Road and North-South Road Development in
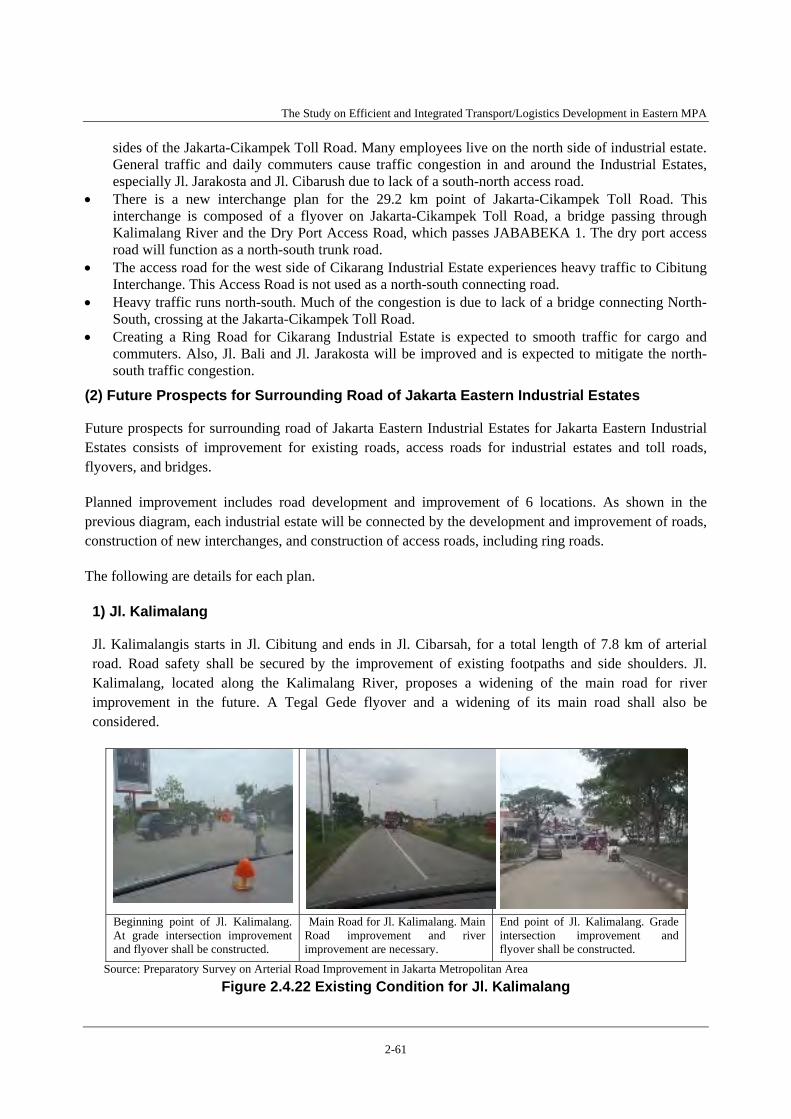
Jakarta Eastern Industrial Estates ................................................................................ 2-60 Figure 2.4.22 Existing Condition for Jl. Kalimalang ......................................................................... 2-61 Figure 2.4.23 Existing Condition for Jl. Bali ..................................................................................... 2-62 Figure 2.4.24 Existing Condition for Jl. Iman Bonjol ....................................................................... 2-62 Figure 2.4.25 Existing Condition for Dry Port Access ...................................................................... 2-63 Figure 2.4.26 Existing Condition for MM2100-EJIP Access Road ................................................ 2-64 Figure 2.4.27 Existing Condition for Delta Mas-Jakarta-Cikampek Access Road
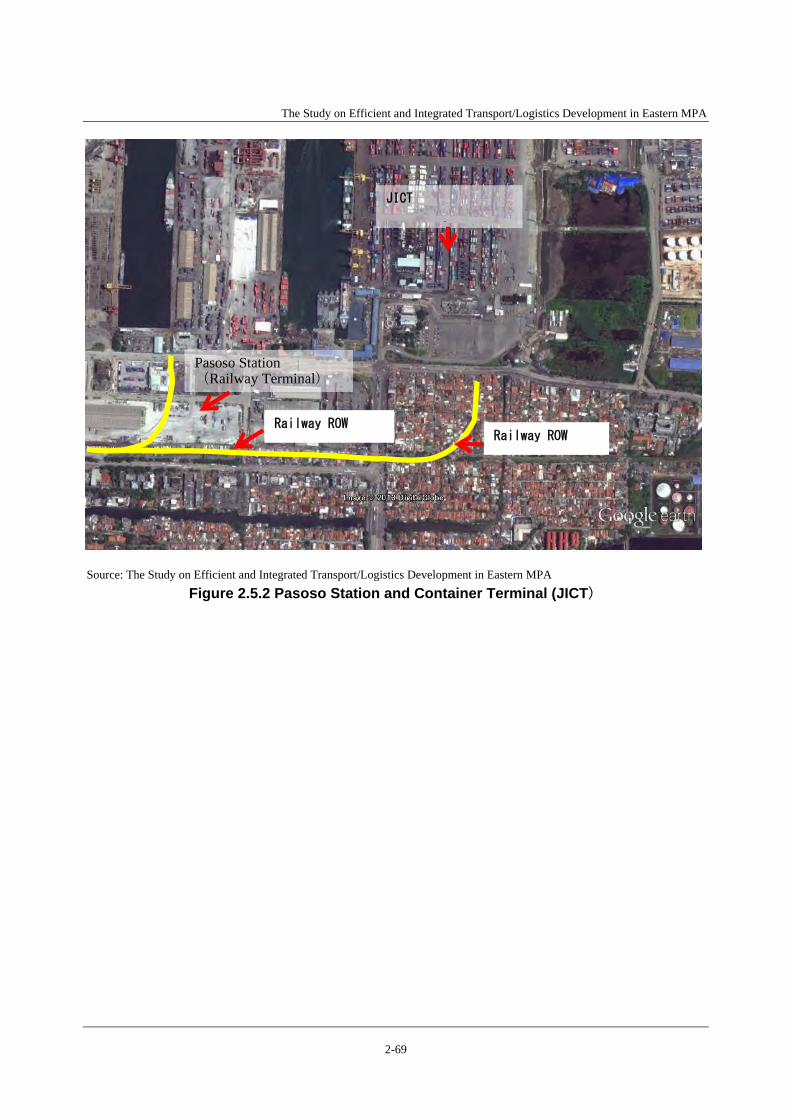
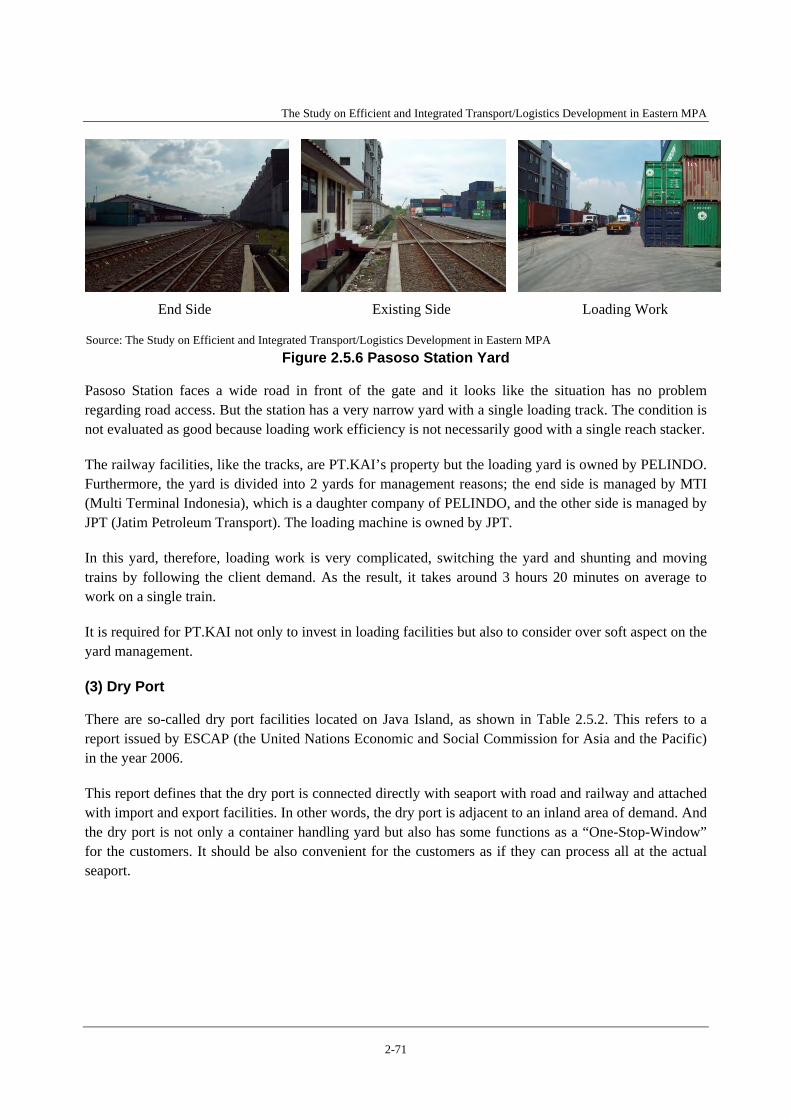
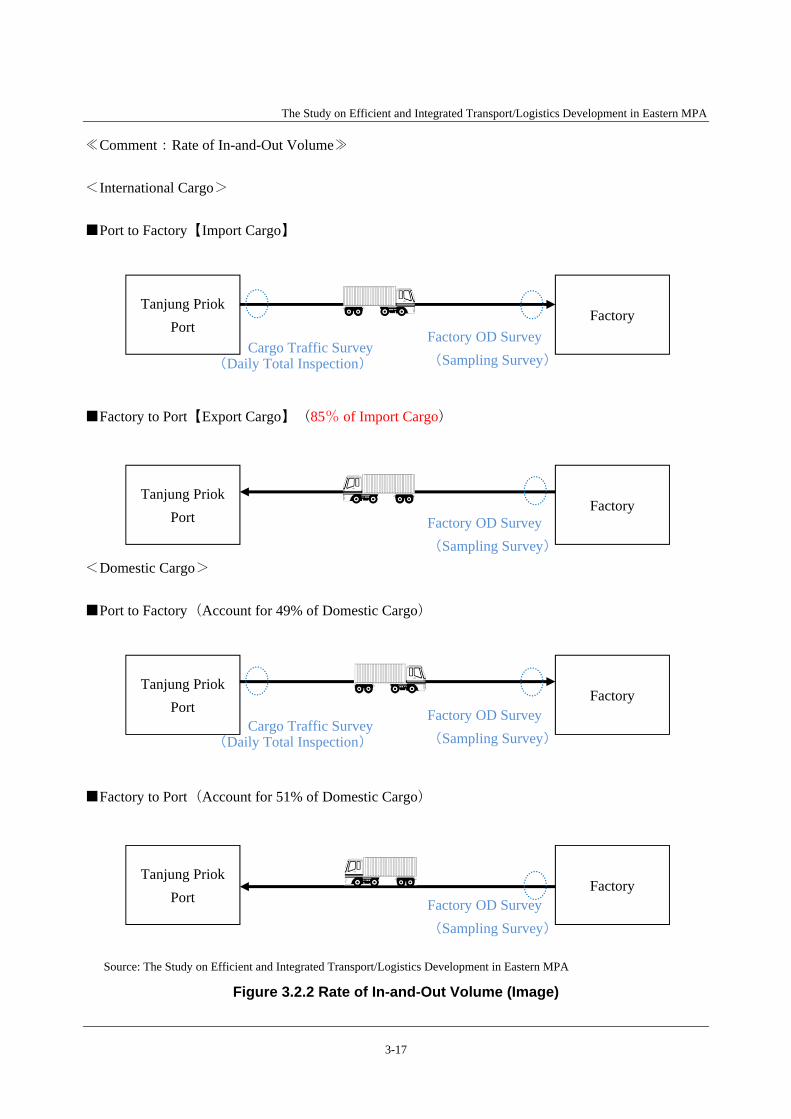
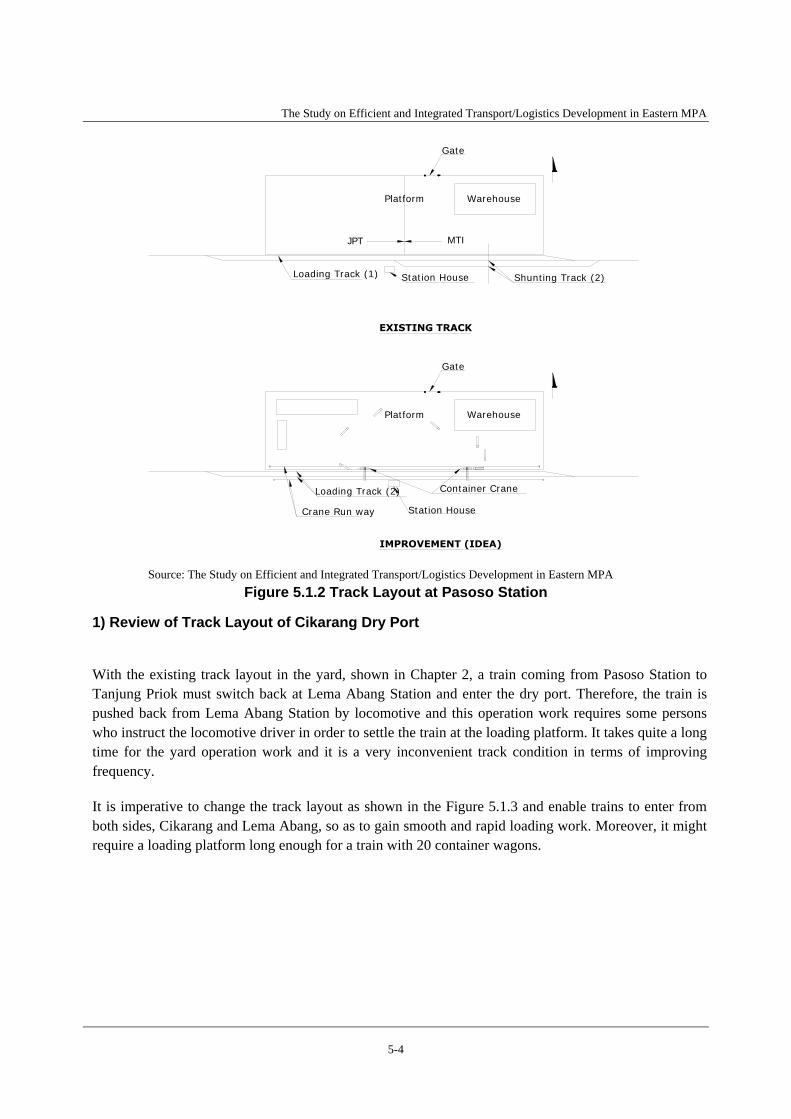
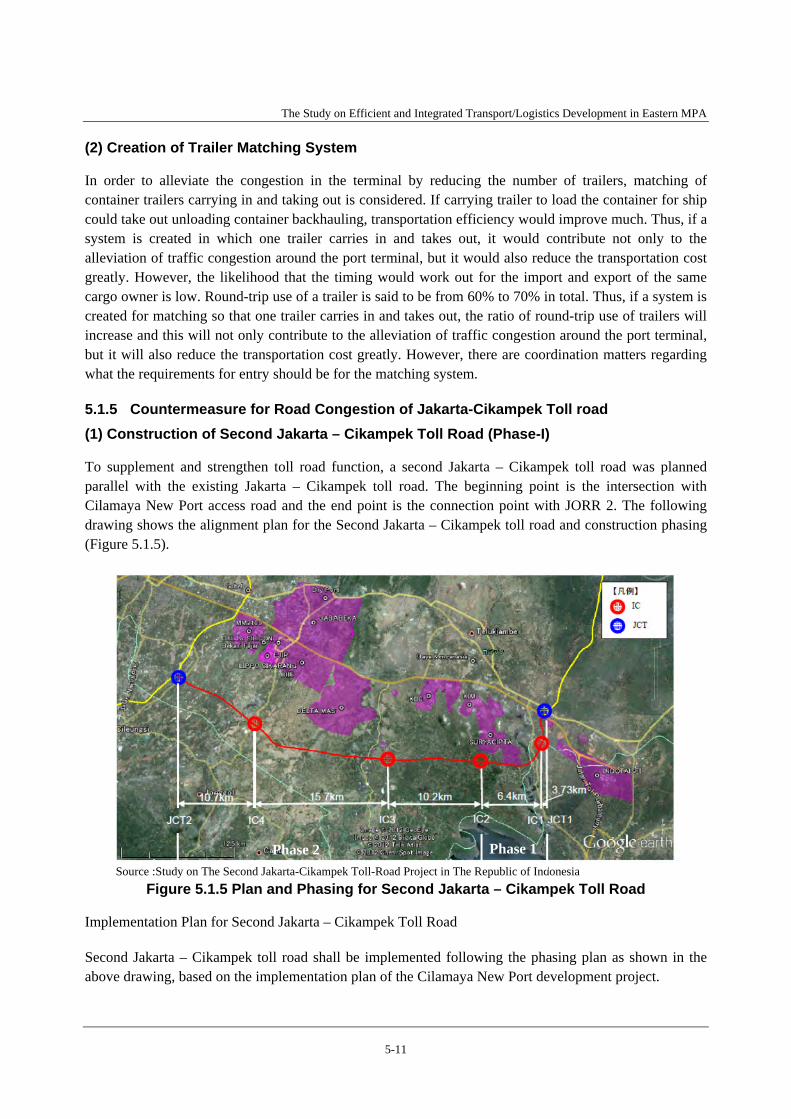
and New Interchange ................................................................................................... 2-64 Figure 2.4.28 Toll Road Network in Jakarta Metropolitan Area ....................................................... 2-65 Figure 2.5.1 JABODETABEK Railway Network and Cikarang Dry Port ........................................ 2-66 Figure 2.5.2 Pasoso Station and Container Terminal (JICT) .......................................................... 2-69 Figure 2.5.3 Railway Right of way in front of JICT Terminal in Tanjung Priok Area ..................... 2-70 Figure 2.5.4 Current Situation of PointA ........................................................................................... 2-70 Figure 2.5.5 Current Situation of PointB ........................................................................................... 2-70 Figure 2.5.6 Pasoso StationYard ........................................................................................................ 2-71 Figure 2.5.7 Dry Port Connected with Railway Track on Java Island ............................................... 2-72 Figure 2.5.8 Tanjung Priok Seaport and Dryports ............................................................................. 2-73 Figure 3.1.1 Study Flow of Demand Forecast .................................................................................... 3- 2 Figure 3.1.2 Zone System ................................................................................................................... 3- 3 Figure 3.1.3 Base Case ........................................................................................................................ 3- 7 Figure 3.1.4 Case1 .............................................................................................................................. 3- 8 Figure 3.1.5 Case2 .............................................................................................................................. 3- 9 Figure 3.1.6 Case3 ............................................................................................................................. 3-10 Figure 3.2.1 Road Network ................................................................................................................ 3-12 Figure 3.2.2 Rate of In-and-Out Volume (Image) ............................................................................. 3-17 Figure 4.1.1 Location of Case Study Ports and Existing Ports ........................................................... 4- 1 Figure 5.1.1 Railway Extension to Container Terminal at Tanjung Priok Port .................................. 5- 3 Figure 5.1.2 Track Layout at Pasoso Station ...................................................................................... 5- 4 Figure 5.1.3 Track Layout Improved at Cikarang Dry Port (Plan) ..................................................... 5- 5 Figure 5.1.4 High Speed Freight Train (Push-Pull System) and Mechanized Loading Platform ....... 5- 6
The Study on Efficient and Integrated Transport/Logistics Development in Eastern MPA
ix
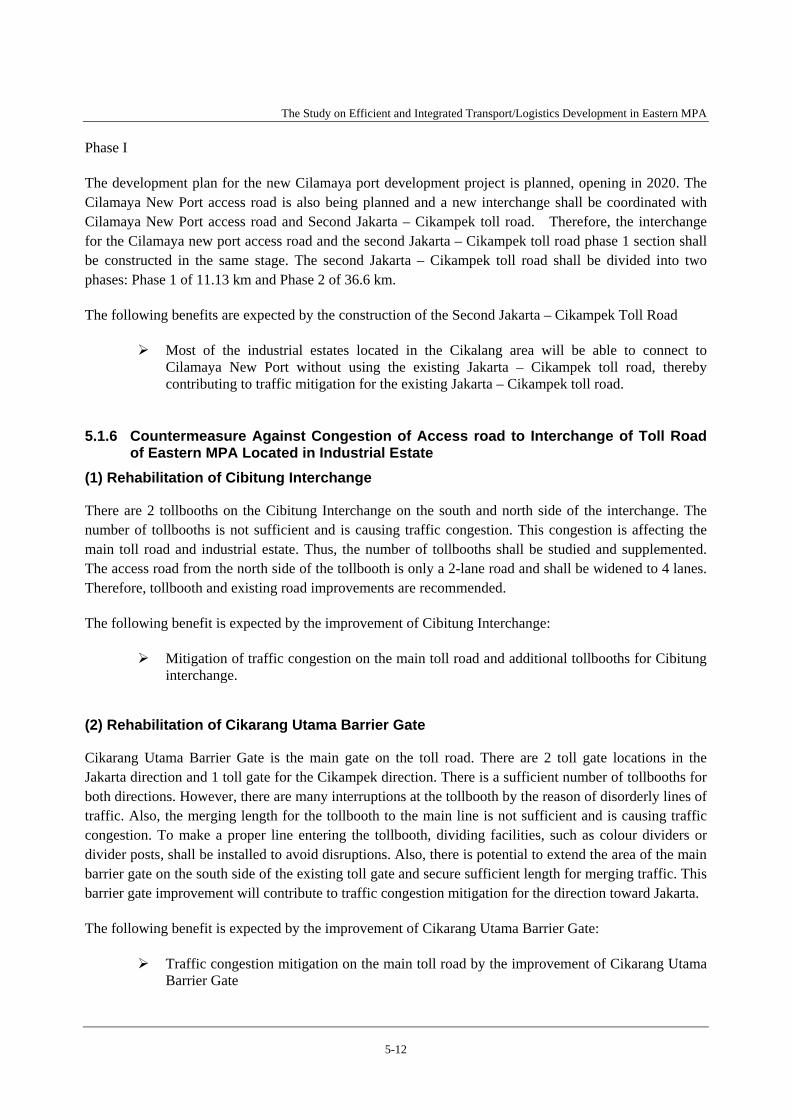
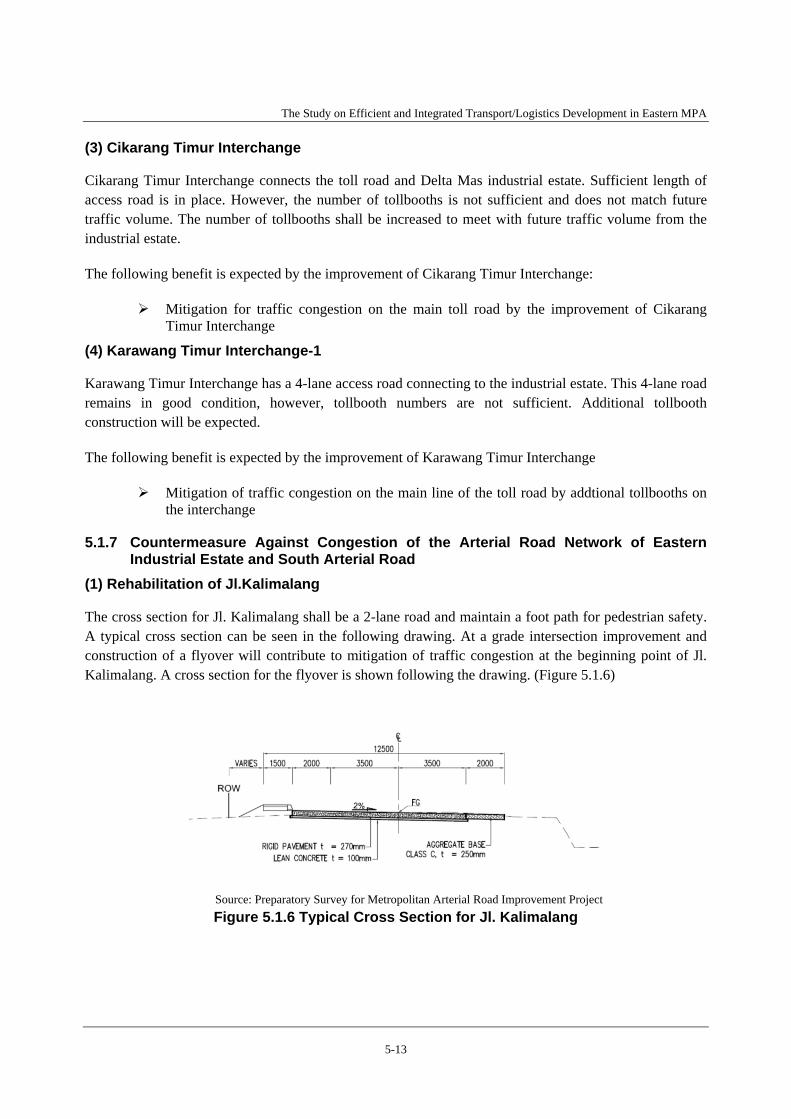
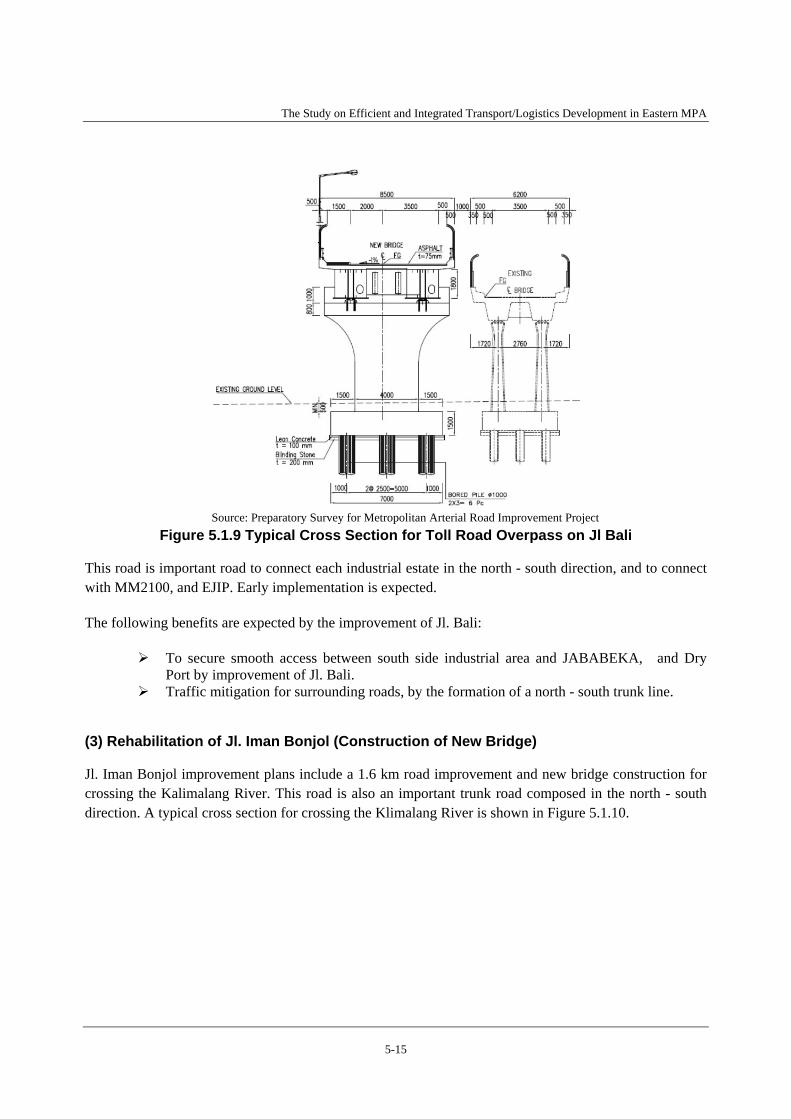
Figure 5.1.5 Plan and Phasing for Second Jakarta – Cikampek Toll Road........................................ 5-11 Figure 5.1.6 Typical Cross Section for Jl. Kalimalang ...................................................................... 5-13 Figure 5.1.7 Typical Cross Section for Tegal Gede Flyover ............................................................. 5-14 Figure 5.1.8 Typical Cross Section for Jl. Bali .................................................................................. 5-14 Figure 5.1.9 Typical Cross Section for Toll Road Overpass on Jl Bali ............................................. 5-15 Figure 5.1.10 Typical Cross Section for New Bridge on Jl. Iman Bonjol ......................................... 5-16 Figure 5.2.1 Logistics Changers of Containers .................................................................................. 5-19 Figure 5.3.1 Images of Facilities in Logistics Center ........................................................................ 5-28 Figure 5.3.2 JABODETABEK Railway Network Master Plan(2020) .............................................. 5-32
The Study on Efficient and Integrated Transport/Logistics Development in Eastern MPA
x
LIST OF ABBREVIATIONS
Abbreviation English
CDP Cikarang Dry Port
CMS Container movement slip
C/T Container Terminal
CY Container Yard
EIR Equipment Interchange Receipt
ETD Estimated Time of Departure
F/S Feasibility Study
GC Gantry Crane
GRDP Gross Regional Domestic Product
GPS Global positioning system
ha hectare
IEDC Indonesia Economic Development Corridor
JICT Jakarta International Container Terminal
JORR Jakarta Outer Ring Road
JORR 2 Jakarta Outer Outer Ring Road
KE Kartu Ekspor
LCL Less than Container Load
MARPOL International Convention on the Prevention of Pollution from Ships
MP3EI Master Plan for the Acceleration and Expansion of Indonesia’s Economic Development
MPA Metropolitan Priority Area
OB Overbrengen
PA Port Authority
Rp rupiah
RTG Rubber Tired Gantry Crane
SOLAS International Convention on the Safety of Life at Sea
SP2 Surat Penyerahan peti Kemas
SPPB Surat Persetujuan Pengeluaran barang
SPK Surat Pemeriksaan Peti
TEU Twenty-foot Equivalent Unit
Tg. Priok Port Tanjung Priok Port
TPS Tempat Penimbunan Sementare
The Study on Efficient and Integrated Transport/Logistics Development in Eastern MPA
xi
TID Truck Identification Card
VMT Vehicle Mounted Terminal
The Study on Efficient and Integrated Transport/Logistics Development in Eastern MPA
1-1
1. INTRODUCTION
1.1 Background of the Study
1.1.1 Significance of the Eastern MPA
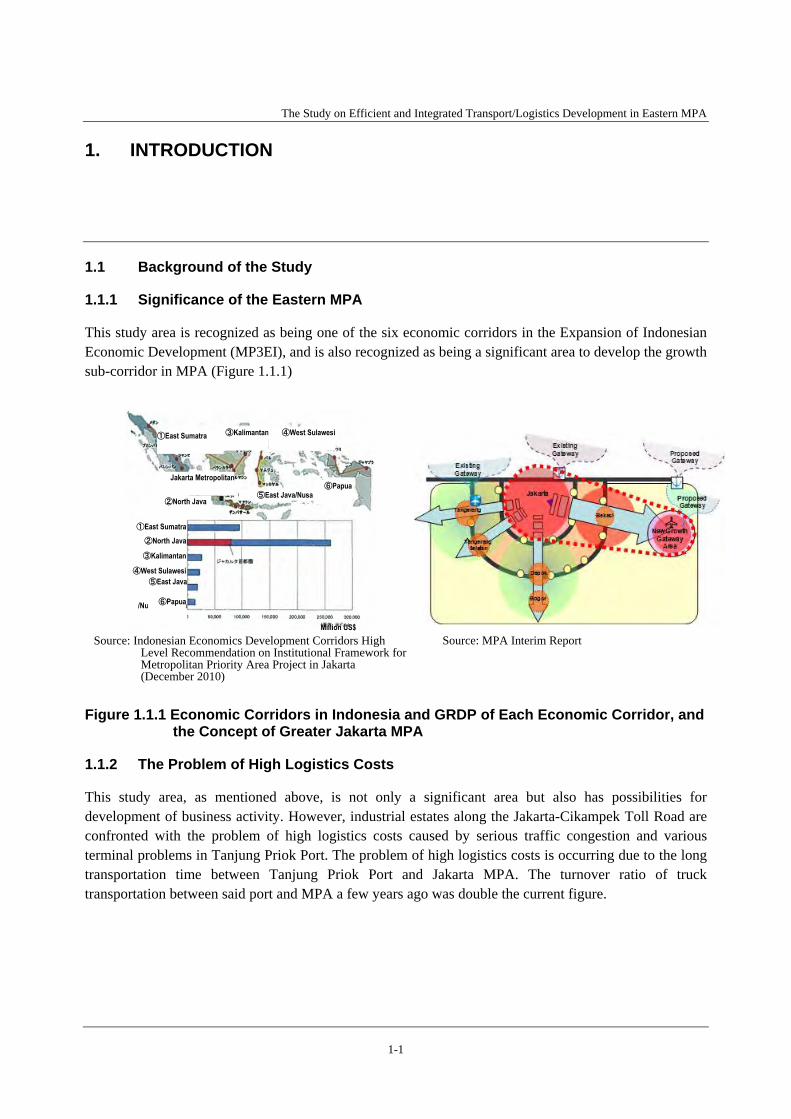
This study area is recognized as being one of the six economic corridors in the Expansion of Indonesian Economic Development (MP3EI), and is also recognized as being a significant area to develop the growth sub-corridor in MPA (Figure 1.1.1)
Figure 1.1.1 Economic Corridors in Indonesia and GRDP of Each Economic Corridor, and the Concept of Greater Jakarta MPA
1.1.2 The Problem of High Logistics Costs
This study area, as mentioned above, is not only a significant area but also has possibilities for development of business activity. However, industrial estates along the Jakarta-Cikampek Toll Road are confronted with the problem of high logistics costs caused by serious traffic congestion and various terminal problems in Tanjung Priok Port. The problem of high logistics costs is occurring due to the long transportation time between Tanjung Priok Port and Jakarta MPA. The turnover ratio of truck transportation between said port and MPA a few years ago was double the current figure.
Source: MPA Interim Report Source: Indonesian Economics Development Corridors High Level Recommendation on Institutional Framework for Metropolitan Priority Area Project in Jakarta (December 2010)
①East Sumatra
②North Java
③Kalimantan
④West Sulawesi⑤East Java
/Nusa Tenggara⑥Papua
②North Java
①East Sumatra ③Kalimantan ④West Sulawesi
⑤East Java/Nusa Tenggara⑥Papua
Jakarta Metropolitan
Million US$
The Study on Efficient and Integrated Transport/Logistics Development in Eastern MPA
1-2
1.1.3 Development of Cilamaya New International Port
The logistics improvement project in Jakarta MPA is conducted based on the conditions precedent of the Cilamaya new international port development, a core project authorized by the flagship project of MPA, MP3EI, and the master plan of the Ministry of Transport.
1.2 Survey and Study Areas
The Study will cover large areas of JABODETABEK and Karawang Regency, with particular focus on the Eastern MPA (West Java Province, Karawang Regency, and Bekasi Regency) — defined as the Survey Area. Included in the Study Area are the harbour district where construction of Cilamaya New Port is planned, and the surrounding region of industrial estates in Bekasi and Karawang that is planning to introduce the hard infrastructure.
1.3 Objectives of the Study
The Study has been conducted to be able to provide:
(1) Recommendations contributing to logistic improvement in Eastern MPA until 2020;
(2) Recommendations contributing to logistic improvement in Eastern MPA after the opening of Cilamaya seaport in 2020.
The Study on Efficient and Integrated Transport/Logistics Development in Eastern MPA
2-1
2. CURRENT STATUS AND FUTURE PROSPECTS OF TRANSPORT/LOGISTICS SECTOR IN THE EASTERN MPA
2.1 Understanding the Current Status and Future Prospects of Port Sector
2.1.1 Understanding the Current Status, Future Prospects and Existing Improvement Projects of Port Sector
Current Status of Tanjung Priok Port (1)
1) Increase of Cargo Demand and Handling Capacity in Tanjung Priok Port
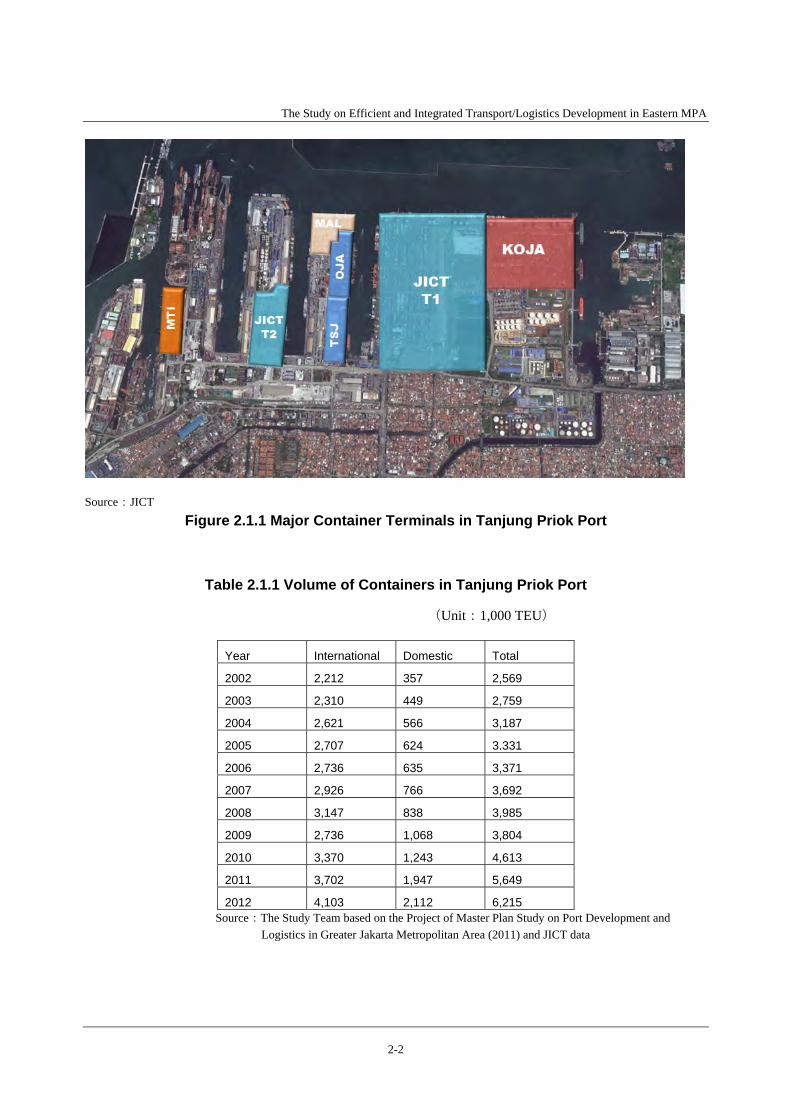
Tanjung Priok Port plays an invaluable role in providing essential logistics facilities in the Jakarta Metropolitan Area. (Figure 2.1.1 Main Terminals in Tanjung Priok Port) The container throughput in Tanjung Priok Port is steadily increasing, as shown in Table 2.1.1 and Figure 2.1.2. Container throughput in 2012 was over 6.2 million TEU. Among them, 4.1 million TEU were international containers and 2.1 were domestic ones.
The volume of international containers has already exceeded the total handling capacity (3.95 million TEU) of the three major international container terminals, namely JICT-1, KOJA, and MAL. Capacities are shown in Table 2.1.2. These terminals have been making strong efforts to increase their container-handling capacities. Excess volume is handled in other small-scale container terminals and non-container terminals. Investment for capacity improvement is required urgently.
Terminal operators have been managing to handle rapidly increasing domestic containers utilizing not only major container terminals but also JICT-2 and MTI which are terminals for international and domestic containers and many non-container terminals. Since the volume of domestic containers is expected to increase more and more, new investment to improve capacities of JICA-2, MTI, and non-container terminals is required.
The Study on Efficient and Integrated Transport/Logistics Development in Eastern MPA
2-2
Source:JICT Figure 2.1.1 Major Container Terminals in Tanjung Priok Port
Table 2.1.1 Volume of Containers in Tanjung Priok Port
(Unit:1,000 TEU)
Year International Domestic Total
2002 2,212 357 2,569
2003 2,310 449 2,759
2004 2,621 566 3,187
2005 2,707 624 3.331
2006 2,736 635 3,371
2007 2,926 766 3,692
2008 3,147 838 3,985
2009 2,736 1,068 3,804
2010 3,370 1,243 4,613
2011 3,702 1,947 5,649
2012 4,103 2,112 6,215 Source:The Study Team based on the Project of Master Plan Study on Port Development and
Logistics in Greater Jakarta Metropolitan Area (2011) and JICT data
The Study on Efficient and Integrated Transport/Logistics Development in Eastern MPA
2-3
Source:The Project of Master Plan Study on Port Development and Logistics in Greater Jakarta Metropolitan Area (2011) and the Study Team
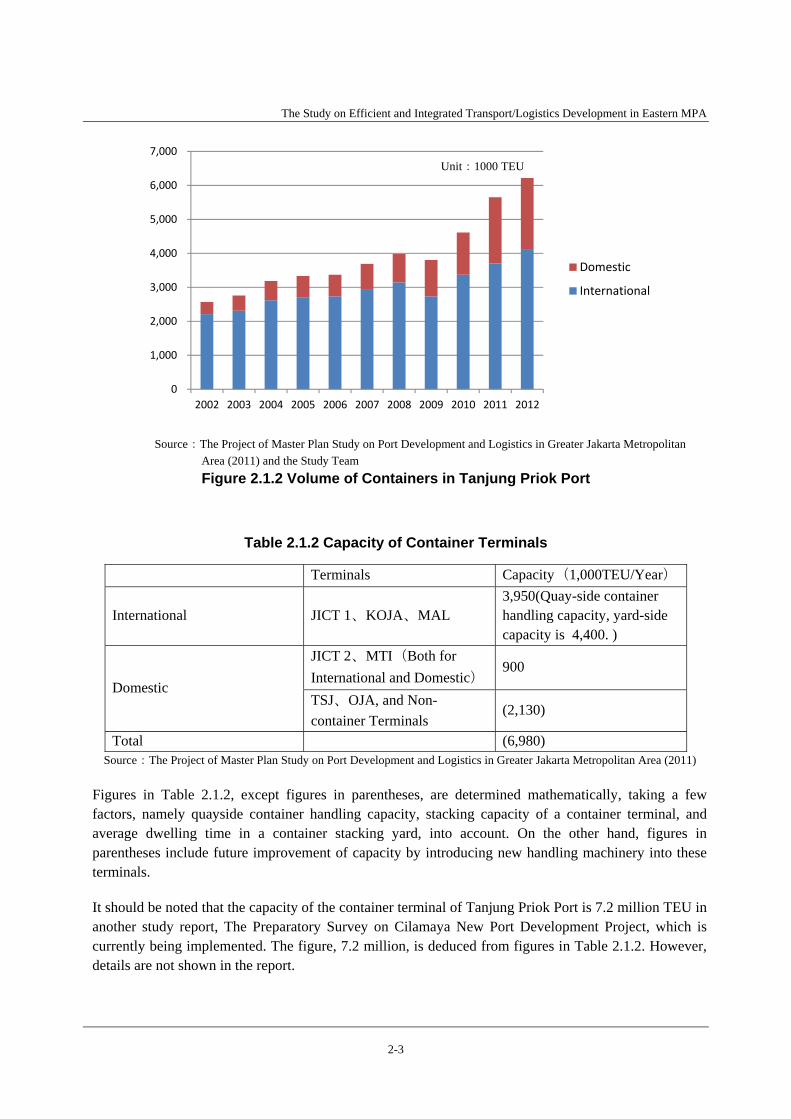
Figure 2.1.2 Volume of Containers in Tanjung Priok Port
Table 2.1.2 Capacity of Container Terminals
Terminals Capacity(1,000TEU/Year)
International JICT 1、KOJA、MAL 3,950(Quay-side container handling capacity, yard-side capacity is 4,400. )
Domestic
JICT 2、MTI(Both for International and Domestic)
900
TSJ、OJA, and Non-container Terminals
(2,130)
Total (6,980) Source:The Project of Master Plan Study on Port Development and Logistics in Greater Jakarta Metropolitan Area (2011)
Figures in Table 2.1.2, except figures in parentheses, are determined mathematically, taking a few factors, namely quayside container handling capacity, stacking capacity of a container terminal, and average dwelling time in a container stacking yard, into account. On the other hand, figures in parentheses include future improvement of capacity by introducing new handling machinery into these terminals.
It should be noted that the capacity of the container terminal of Tanjung Priok Port is 7.2 million TEU in another study report, The Preparatory Survey on Cilamaya New Port Development Project, which is currently being implemented. The figure, 7.2 million, is deduced from figures in Table 2.1.2. However, details are not shown in the report.
The Study on Efficient and Integrated Transport/Logistics Development in Eastern MPA
2-4
Existing Port Facilities in Tanjung Priok Port
The Wharf Area of Tanjung Priok Port to handle commercial goods is divided into seven areas as follows:
� Japat River Wharf � Island Wharf � First Wharf � Second Wharf � Third Wharf � International Container Terminal Area (JICT and KOJA) � Bulk Cargo Area (Petroleum, Grains)
Source: The Project of Master Plan Study on Port Development and Logistics in Greater Jakarta Metropolitan Area (2011)
Figure 2.1.3 The Existing Port Facility Layout of Tanjung Priok Port
Specifications of major container terminals are shown in Table 2.1.3.
The Study on Efficient and Integrated Transport/Logistics Development in Eastern MPA
2-5
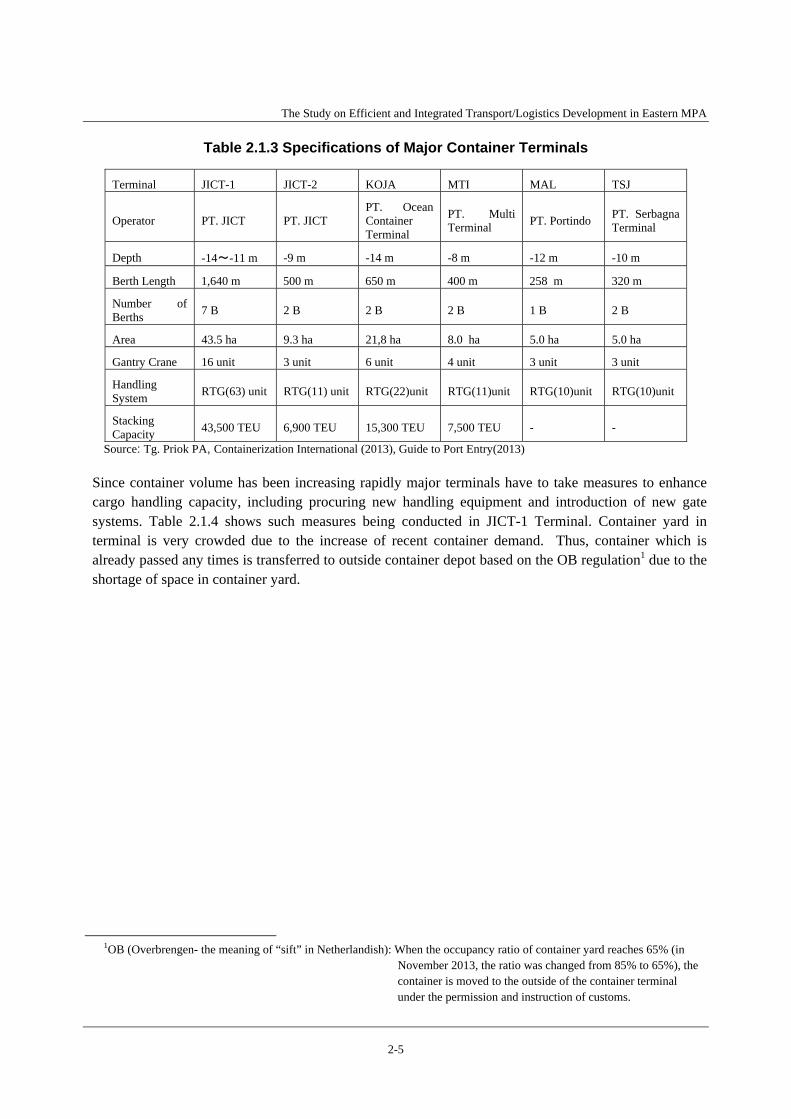
Table 2.1.3 Specifications of Major Container Terminals
Terminal JICT-1 JICT-2 KOJA MTI MAL TSJ
Operator PT. JICT PT. JICT PT. Ocean Container Terminal
PT. Multi Terminal PT. Portindo PT. Serbagna
Terminal
Depth -14~-11 m -9 m -14 m -8 m -12 m -10 m
Berth Length 1,640 m 500 m 650 m 400 m 258 m 320 m
Number of Berths 7 B 2 B 2 B 2 B 1 B 2 B
Area 43.5 ha 9.3 ha 21,8 ha 8.0 ha 5.0 ha 5.0 ha
Gantry Crane 16 unit 3 unit 6 unit 4 unit 3 unit 3 unit
Handling System RTG(63) unit RTG(11) unit RTG(22)unit RTG(11)unit RTG(10)unit RTG(10)unit
Stacking Capacity 43,500 TEU 6,900 TEU 15,300 TEU 7,500 TEU - -
Source: Tg. Priok PA, Containerization International (2013), Guide to Port Entry(2013)
Since container volume has been increasing rapidly major terminals have to take measures to enhance cargo handling capacity, including procuring new handling equipment and introduction of new gate systems. Table 2.1.4 shows such measures being conducted in JICT-1 Terminal. Container yard in terminal is very crowded due to the increase of recent container demand. Thus, container which is already passed any times is transferred to outside container depot based on the OB regulation1 due to the shortage of space in container yard.
1OB (Overbrengen- the meaning of “sift” in Netherlandish): When the occupancy ratio of container yard reaches 65% (in
November 2013, the ratio was changed from 85% to 65%), the container is moved to the outside of the container terminal under the permission and instruction of customs.
The Study on Efficient and Integrated Transport/Logistics Development in Eastern MPA
2-6
Table 2.1.4 Measures for Capacity Increasing Taken in JICT-1
Item Measures Current Situation
1 Maintaining and Deepening of Water Channel, Basin, and Quay-wall
JICT-1 is requesting PELINDO 2 to maintain water depth of water channels and basins, and to deepen the West Quay-walls from -12m to -14m.
PELINDO 2 has been implementing maintenance dredging every year. Deepening of quay-walls has not been conducted due to engineering issues. Deepening might make quay-walls collapse.
2 Introduction of New Quay-side Gantry Cranes (GCs2)
JICT-1 has introduced two (2) new GCs along the North Quay-walls among nine (9) GCs. These new GCs are Post-Panamax Series and have Twin Movement System that can handle two (2) containers simultaneously. Although JICT-1 has a plan to procure more new GCs, all new GCs will not necessarily replace existing GCs due to the fact that pile foundation for CGs has not enough bearing capacity for the heavier weight of all new GCs. JICT will install a new GC along the West Quay-wall in the Terminal.
Introduction of new GCs is appropriate to increase cargo-handling capacity of the Terminal. Drastic improvement of handling capacity has not been achieved due to the physical limitation of pile foundation for new GCs.
3 Intoduction of New Yard GCs (RTGs3)
JICT-1 has introduced six (6) new RTGs in the container yard among sixty-three (63) RTGs. These new RTGs are hybrid type, of which driving forces are a diesel engine and an electric motor and have higher capability (5+1 stacking function) than existing RTGs with 4+1 stacking function. JICT has a plan to procure an additional fifteen (15) new RTGs in 2014.
Introduction of new RTGs is appropriate to increase cargo-handling capacity of the Terminal. Drastic improvement of handling capacity has not been achieved, because the number of new RTGs is insufficient.
4 Introduction of e-Ticket System
JICT-1 has introduced a new gate system, called “e-Ticket System”, to reduce the time of gate procedures. This system consists of the following actions;
“Issuing ID cards to registered container trailers in advance”,
“Issuing e-tickets to trailers with ID cards to minimize gate procedure hours”,
“Insertion of e-ticket into e-ticket reader by a trailer driver at a gate” and
“provision of required instructions to the driver by this system at the gate.”
KOJA terminal has introduced similar system called “e-billing System”.
Introduction of the “e-Ticket System” is appropriate for reducing the time-at-gate procedures. Drastic improvement of time saving has not been achieved, however, because trailer drivers can not receive the e-ticket through the internet but have to visit the e-ticket office by themselves or staff-members of transport companies.
Source: The Study on Efficient and Integrated Transport/Logistics Development in Eastern MPA
At present, JICT/KOJA terminals handle more than 80% of the international container volume through the Port of Tanjung Priok, with the balance taken by MAL (International/Domestic terminal) and OJA (International/Domestic terminal). Due to congestion at the north quay of JICT and KOJA (which only accommodate the vessels with LOA more than 200 m), mid/small sized container vessels are handled alongside the quay of MAL/OJA.
2 GC:Abbreviation of gantry Crane. Quay-side Gantry Crane 3 RTG: Abbreviation of Rubber Tired Gantry Crane. Transfer crane with rubber tier.
The Study on Efficient and Integrated Transport/Logistics Development in Eastern MPA
2-7
Container yards for these terminals are very congested, due to the increase of cargo demand in recent years. In view of the shortage of the storage capacity of both terminals, OB system1 has been functioning well in managing the storage level at the terminal safely.
2) Current Status of Container Depot
There are many container depots, such as the TPS and LCL container depots, as well as empty containers, surrounding Tanjung Priok Port (Figure 2.1.4).
TPS: Temporary depot before and after customs check. Customs clearance is not conducted basically. TPP: Customs clearance is to be conducted. LCL: Consolidated cargo. Customs clearance is to be conducted.
Source: The Study on Efficient and Integrated Transport/Logistics Development in Eastern MPA
Figure 2.1.4 Locations of Container Depots Around Tajung Priok Port
However, traffic congestion worsens by the increase of deadhead to container depots surrounding the port. That means empty containers are increasing due to the adverse balance of trade in Tanjung Priok Port in recent years.
The Study on Efficient and Integrated Transport/Logistics Development in Eastern MPA
2-8
Future Prospects (2)
1) Forecast of Container Throughput in Tanjung Priok Port
The volume of international containers in 2012 was actually 4.1 million TEU, but the throughput of international containers is estimated at 7.2 million TEU in 2020, and estimated at 13.4 million TEU in 20304. In addition, total container throughput, including domestic containers, is forecasted at 11 million TEU in 2020, and 20 million TEU in 2030. Thus, mere capacity increase by North Kalibaru Project is not enough. To deal with the growth in demand, it is necessary to construct a North Kalibaru container terminal as a short-term measure, and to construct a Cilamaya new port as a long-term measure. These projects are discussed later.
Source: : Preparatory Survey on Cilamaya New port Development Project Figure 2.1.5 Forecast of Container Throughput of Port in Jakarta Metropolitan Area
a) Analysis on Current Container-Handling Capacity
Table 2.1.2 shows container-handling capacity estimated in a report of The Project of Master Plan Study on Port Development and Logistics in Greater Jakarta Metropolitan Area (2011). And then, various measures to increase the capacity, including the introduction of new GCs and RTGs are implemented. Analysis on current container-handling capacity is conducted in this section.
- Maintaining and Deepening of Water Channel, Basin and Quay-wall -
The capacities shown in Table 2.1.2 are estimated assuming that the depth of major water facilities in Tanjung Priok Port will be maintained in an appropriate manner. Capacity could increase when the depth of these facilities would be larger than the current figures.
4 Preparatory Survey on Cilamaya New port Development Project (JICA)
The Study on Efficient and Integrated Transport/Logistics Development in Eastern MPA
2-9
- Intruduction of New Quayside Gantry Cranes (GCs) -
Among nine (9) GCs along the North Quay-walls of JICT-1, two (2) GCs have been replaced by new GCS. These new GCs are Post-Panamax series and have the Twin Movement System, which can handle two (2) containers simultaneously. Since the Twin Movement System requires more complicated driving skills and more sophisticated chassis preparation, it takes a longer time than Single Movement System. This means that productivity of the Twin Movement System is not twice that of the Single Movement System. Productivity of the Twin Movement System is estimated to be approximately 1.2 – 1.3 times of the ordinary system. Productivity of an ordinary GC for Panamax vessels is about 130,000 TEU/year, in general. Hence, capacity improvement by the introduction of two (2) new GCs would be approximately 52,000 – 78,000 TEU/year.
- Introduction of New Yard GCs (RTGs) -
Among sixty-three (63) RTGs in JICT-1 Terminal, six (6) RTGs have been replaced by new GCS. These new RTGs are hybrid type, of which the driving forces are a diesel engine and an electric motor and have higher capability—5+1 stacking function—than existing RTGs with 4+1 stacking function. Improvement of yard stacking capacity by the introduction of new RTGs is estimated at approximately 2 %. ((57*4+6*5)/63*4)=1.024)
- Introduction of e-Ticket System -
Since productivity at gates is not a bottleneck of cargo handling capacity at Tanjung Priok Port, e-Ticket system does not contribute any capacity improvement so far. However, time-saving at gates is crucially important for consignees and shippers, because time-saving can reduce transport cost of consignees and shippers directly and significantly. A more efficient and effective e-Ticket system including internet compatible system is required.
- Overall Evaluation of Current Capacity -
Cargo-handling capacity is determined mainly by three (3) factors, namely productivity at quay-wall side, productivity at stacking yard, and productivity at gate. Since the productivity at quay-wall side has been the bottleneck of cargo handling capacity in Tanjung Priok Port, improvement by new GCs can represent capacity increase at Tanjung Priok Port.
Terminal operators have been managing to handle rapidly increasing domestic containers utilizing not only major container terminals but also JICT-2 and MTI, which are terminals for international and domestic containers and many non-container terminals.
2) North Kalibaru Development Plan
In Tanjung Priok Port, a variety of PPP schemes including “Lease”, “Partial Concession”, “Joint Operation” and “Concession” have been implemented. Among them, concession for Karibaru Terminal Development is the most important and interesting as a precedent of PPP project under the New Shipping Law, No.17/2008. DGST entered into official pre-qualification (PQ) procedure of open-tendering for the Karibaru Terminal Development in July, 2011. Many consortiums submitted the
The Study on Efficient and Integrated Transport/Logistics Development in Eastern MPA
2-10
required documents and information for PQ procedure. Eventually, Presidential Regulation No.36/2012 stipulated that the concession contract be assigned to IPC II (PELINDO 2) in April, 2012.
- Port Master Plan (MOT Regulation (No.38/2012)) -
i) Terms of Master Plan
The Master Plan consists of three (3) stage plans including a short-term plan (2012-2017), mid-term plan (2012-2023), and long-term plan (2012-2030).
ii) Development Plan
Table 2.1.5 and Figure 2.1.6 show the development plan at North Kalibaru.
Table 2.1.5 Master Plan of North Kalibaru Development
Facilities Short-term Mid-term Long-term
Total 2012-2017 2012-2023 2012-2030
International Container Terminal
Quay Wall Length(m) 900 800 800 2,500
Stacking Yard Area(ha) 32.0 48.0 48.0 128.0
Liquid Bulk Terminal
Quay Wall Length(m) 800 800 1,600
Yard Area(ha) 24.0 24.0 48.0
Reserved Area
Reserved Area Area(ha) 36.0 36.0
Cargo Handling Equipment
Quay-side G/C Unit 10 10 10 30
Yard G/C Unit 30 30 30 90
Yard tractor Unit 70 70 70 210
Chassis Unit 80 80 80 240
Development of Reserved Area Area(ha) 36.0 36.0
Port Access Road Length (m) 2,803.0 2,803.0
Dredging Volume(m3) 27,801,655 27,801,655
Breaking of Breakwater Length(m) 3,200.0 3,200.0
Breakwater Length(m) 9,814.3 9,814.3
Disposal Area of Dredged Material Area(ha) 113.5 113.5
Source: Master Plan of Ministry of Transport
The Study on Efficient and Integrated Transport/Logistics Development in Eastern MPA
2-11
Source: Tanjung Priok Port Authority
Note: Red line represents toll road network along Tanjung Priok Port Broken black line represents railway Black line represents port access road
Figure 2.1.6 Master Plan of North Kalibaru Development (Master Plan)
- Development Plan by PELINDO 2 -
PELINDO 2 has its own development plan, shown in Figure 2.1.7. This plan however does not coincide with the Port Master Plan released by MOT. Laws and regulations regarding port development stipulate that all development should be implemented in line with the Port Master Plan.
The Study on Efficient and Integrated Transport/Logistics Development in Eastern MPA
2-12
Source: PELINDO 2 Figure 2.1.7 Development Plan by PELINDO 2
Figure 2.1.8 shows the current situation of North Kalibal Terminal. PELINDO 2 has commenced construction already.
Many reinforced concrete piles have been installed already.
Foundation of access road bridge is under construction.
Source: The Study on Efficient and Integrated Transport/Logistics Development in Eastern MPA Figure 2.1.8 Construction Work
- Issues of North Kalibaru Development -
i) Early Commencement of Terminal Operation Described in Short-Term
The short-term development plan has been implemented by PELINDO 2. Since it is apparent that cargo demand will exceed the capacity of Tanjung Priok Port in a few years, early commencement of terminal operation is required.
ii) Continuous Implementation of Mid-Term Plan
Although PELINDO 2 has commenced preparatory work for the Mid-term Plan, progress and prospects are not clear so far. Since container demand has been increasing rapidly, the Mid-term Plan should be implemented as soon as possible.
The Study on Efficient and Integrated Transport/Logistics Development in Eastern MPA
2-13
iii) Evaluation of Long-Term Plan
Long-term plan and Cilamaya New Port development may be implemented at the same time. Implementation of the Long-term Plan should be evaluated again taking various factors, including progress of the Cilamaya project, cargo demand, and traffic congestion in Metropolitan area after the completion of short-term plan, into consideration.
iv) Evaluation of Maximum Depth of Major Port Facilities
Depth of major port facilities is -16m in the short-term plan and the current depth of the channel and basin is -14m. Since it will take a long time to dredge from -14m to -16m, terminal operation of the short-term plan has to be commenced with the depth of -14m. Final depth of major port facility is -20m in the master plan. It will take a much longer time to dredge the channel and basin from -16m to -20m. Based on the concession contract between MOT and PELINDO 2, PELINDO 2 shall conduct these dredging works. It is not clear so far that PELINDO 2 has enough funding sources to dredge channel and basin from -14m to -20m. In this context, maximum depth of major facilities in the master plan should be evaluated again taking various factors into consideration, including progress of the Cilamaya project, cargo demand and traffic congestion in Metropolitan area after the completion of short-term plan .
v) Issues on Access Road
Six traffic lanes are needed to fully handle the container volume of the current plan. However, there is no space for a new access road in this area because of installed equipment of big oil and gas companies and many houses and warehouses, as shown in Figure 2.1.9. Therefore, it is difficult to construct a new access road without resettlement and land acquisition.
The Study on Efficient and Integrated Transport/Logistics Development in Eastern MPA
2-14
Source: The Study on Efficient and Integrated Transport/Logistics Development in Eastern MPA Figure 2.1.9 Current Condition of Land Use and Access road to Nortth Kalibaru (Draft)
The Study on Efficient and Integrated Transport/Logistics Development in Eastern MPA
2-15
3) Cilamaya New port Development Plan
New Cilamaya port is located along seashore in the 30 km north from Karawang of West Java Province.
Source: “Project for Master Plan Study on Port Development and Logistics in Greater Jakarta Metropolitan Area”. Figure 2.1.10 Location of New Cilamaya Port
The Study on Efficient and Integrated Transport/Logistics Development in Eastern MPA
2-16
Table 2.1.6 Cilamaya New port
New International Container Terminal
Site: Off Karawan Coast
- Berth length: 4,920 m
- Water depth: -9 ~ -15.5 m
- Terminal area: 290 ha
- Container-handling capacity; Middle Term 3.2 million TEUs per annum
- Container-handling capacity; Long Term 3.75 million TEUs per annum
Car Terminal - Water Width -12.5 M - Water Length 690 M - Depth 380 M New Access Bridge to the New Terminal
- Length: 800 m
New Access Road from Karawan to the New Terminal
- Length: 28.6 km
Source: Preparatory Survey on Cilamaya New port Development Project
Source: New Cilamaya Port Development Plan Figure 2.1.11 New Cilamaya Port Development Plan
The Study on Efficient and Integrated Transport/Logistics Development in Eastern MPA
2-17
4) Future Prospects of Container Depot
Container yard congestion created by the increase of recent demand and the regulation of OB changing from 85% to 65% occupancy ratio in the terminal container yard likely mean there will be an increase of passage to the outside of the container terminal before and after customs clearance.
The adverse balance of trade likely will not to be changed in the short term. Thus, the problems of empty container depots and the increase of deadhead to container depots surrounding the port will likely worsen the traffic jam situation. Furthermore, it is difficult to make a new container depot due to the shortage of space surrounding Tanjung Priok Port.
2.1.2 Understanding the Current Status and Future Prospects
(1) Cargo Handling System in Tanjung Priok Port
1) Current Status of Customs Clearance5
Table 2.1.7 shows the 2013 required time on average for customs clearance in the red lane6 and green lane7 separately, as compared with the past case (2004).
Table 2.1.7 Average time for customs clearance
2004 2013 Red Lane 6.5 days 10.5 days
Green Lane 3.5 days 2.8 days Source: JICA PROTAF Study of “Study on Trade Related Systems and Procedures in the Republic of Indonesia”
In the case of the green lane, the required time for customs clearance has decreased from 3.5 days to 2.8 days since 2004. On the other hand, in the case of the red lane, the required time for customs clearance has increased from 6.5 days to 10.5 days. And in comparison with other countries (Table 2.1.8), in the case of cargo in the green lane, there is little difference in time required for customs clearance compared with other countries, in the case of cargo in the red lane, the required time for customs clearance is five times that of other countries. The reasons are as follows:
i) high rate of cargo inspection, ii) congestion of inspection area and shortage of inspectors due to an increase of import cargo in Tanjung Priok Port.
On the other hand, in the case of the green lane, the required time for customs clearance has decreased, and this is due to the shortened processing time of documents, made possible by improvement and pervading of electronic custom clearance system.
5 Customs clearance for this section refers to the submission of customs documents and the issuance of written permission of
release. (Red Lane accounts for approximately 30% of customs clearance. Green Lane and Yellow Lane account for approximately 70% according to the interview results from JJC at October, 2013)
6 Having document and cargo inspection 7 Basically, only document inspection
The Study on Efficient and Integrated Transport/Logistics Development in Eastern MPA
2-18
Table 2.1.8 Comparison of Required Time by Nation
Malaysia (2007) Thailand (2007) Indonesia (2013)
Red Lane 2 days 2.5 days 10.5 days
Green Lane 1 day 2 days 2.8 days Source: JICA PROTAF Study of “Study on Trade Related Systems and Procedures in the Republic of Indonesia” Data of Malaysia and Thailand are from 2007
In addition, in the case of the red lane, importers have to find a customs officer who inspects cargo in each case, so it takes so much time to find a customs officer at present. And for classified cargo in the red lane, that which arrives first is not necessarily cleared by customs first. There is an opaque situation in the customs clearance of the red lane.
2) Current Status of e-Ticket System
The throughput has been increased for special gates and the e-ticket system8 has been introduced. The following points were improved by introducing this system.
Table 2.1.9 Main Improvements by Introduction of e-Ticket System
Before Introduction of e-Ticket (After Customs Clearance)
After Introduction of e-Ticket (After Customs Clearance)
1. Truck drivers had to go up and down many times to get approval for documents from customs at entry and exit of terminal gate. The resulting customs cue takes much time.
1. It is not necessary for truck driver to get an approval for documents from custom at entry and exit of terminal gate. Truck driver only presents a copy of SPPB at exit and there is no queue occurring and no consuming of time.
2. The need for gate staff to draft SP2 and KE documents manually at entry and exit gates caused trouble in the form of a long queue.
2. SP2 and KE documents have been changed to e-Tickets and there is no gate staff needed for entry and exit. The task conducted by gate staff is performed by the e-Ticket itself.
3. The inspector of trailers and containers had to draft an SPK form by hand and submit an SPK form endorsed by customs to get approval of SP2 and KE. This procedure takes much time during entry and exit of gate.
3. The inspector of trailers and containers only sends data to JICT server by hand-held computer, automatically.
Source: The Study on Efficient and Integrated Transport/Logistics Development in Eastern MPA
By introducing an automatic gate system and e-Ticket system at JICT, the average hourly container box throughput was 121.8 boxes in 2009, but the average hourly container box throughput was improved to be 147.9 boxes after installation of the automated gate system in 2012.
8 Procedure difference of import/export container in before and after of introduction of e-Ticket and flow chart of issue of e-ticket is described in Background Information 6. E-Ticket system was introduced at 2012.
The Study on Efficient and Integrated Transport/Logistics Development in Eastern MPA
2-19
Source: Port Statistics of JICT Figure 2.1.12 Hourly Container Box Throughput (JICT) in 2009
Source: Port Statistics of JICT Figure 2.1.13 Hourly Container Box Throughput (JICT) in 2012
On the other hand, the average hourly container box throughput of KOJA terminal, without installation of the automated gate, has not changed from 52.7 boxes in 2012. According to our survey results, trucks are waiting for an average of 75 minutes, average 20 minutes in JICT and average 120 minutes in KOJA. This big difference is considered to be due to the installation of the automated gate system including the e-Ticket system9. However, despite the design specification that says a truck can pass the gate in 0.5 to 1.0 minutes, queues about 20 minutes long occur at the JICT gate. The reasons this queue occurs at the gate are as follows: the number of trucks entering the terminal is limited to prevent congestion in the terminal; and because truck drivers are required to get an e-Ticket from the JICT terminal office, where there is limited space, which causes a queue to form.
9 Most of Japanese logistics companies get the e-ticket in advance by the staff of the companies, and hand it to drivers not in
front of terminal, but another place. However, for local track companies, most of drivers do the e-ticket procedure as well as carry of the export containers at the same time.
127 128 125
77
14
108
75 6881
112 12094
48
145129 134
157138
22
226214 220
178 183
0
50
100
150
200
250
00-0
101
-02
02-0
303
-04
04-0
505
-06
06-0
707
-08
08-0
909
-10
10-1
111
-12
12-1
313
-14
14-1
515
-16
16-1
717
-18
18-1
919
-20
20-2
121
-22
22-2
323
-24
Truc
ks
Operation Time
153 157 160138
114
127114 108
125142 148
128
106
139 148136
161147
135
177200
214
186 189
0
50
100
150
200
250
00-0
101
-02
02-0
303
-04
04-0
505
-06
06-0
707
-08
08-0
909
-10
10-1
111
-12
12-1
313
-14
14-1
515
-16
16-1
717
-18
18-1
919
-20
20-2
121
-22
22-2
323
-24
Truc
ks
Operation Time
The Study on Efficient and Integrated Transport/Logistics Development in Eastern MPA
2-20
3) Current Status of Import-Export of Containers in Container Terminal
① Average terminal in/out time at JICT and KOJA terminal
In the travel speed survey conducted for the Study, the locations of the surveyed trailers for container transport were recorded by GPS devices. The survey methodology and survey period were the same as those taken for toll roads and arterial roads, which will be explained later. Fifteen vehicles were selected for said survey inside the container terminal (done this way since record of activities by drivers is needed). Time from entering to exiting the terminal was recorded, and fluctuation by day for one week was analysed. Required time for each activity was recorded as well.
Average terminal in/out time at JICT and KOJA terminal was 3.5 hours, according to the travel speed survey. But 24% of the trucks needed over 5 hours to go in/out of JICT and KOJA terminal, a figure higher than indicated by the travel speed survey.(Figure 2.1.14)
Source: The Study on Efficient and Integrated Transport/Logistics Development in Eastern MPA Figure 2.1.14 Average Terminal In/Out Time at JICT and KOJA Terminal
And this average 3.5 hours of terminal in/out time is higher than the averages of ports in other countries.
Table 2.1.10 Comparison of Average Terminal In/Out by Port
Port
Hong Kong Laem Chabang
Kobe Tanjung Priok
China Thailand Japan Indonesia
Time (Hour) 1.5 0.45 0.5 3.5 Source: The Study on Efficient and Integrated Transport/Logistics Development in Eastern MPA
< 1 hr,14% 1-2 hr,
9%
2-3 hr,29%
3-4 hr,14%
4-5 hr,10%
> 5 hr,24%
The Study on Efficient and Integrated Transport/Logistics Development in Eastern MPA
2-21
2.4
4
5.9
3.5
3.9
2.3
2.1
0 2 4 6 8
Sunday
Saturday
Friday
Thursday
Wednesday
Tuesday
Monday Unit: Hour
Source: “State of Logisitics Indonesia 2013, World Bank Source: “The Study on Efficient and Integrated Transport/Logistics Development in Eastern MPA”
Figure 2.1.15 Ratio of Import Declaration on Day of Truck Visits
Figure 2.1.16 Terminal Duration on a Per- Day Basis
Dwelling time at the container terminal averages 3.5 hours but the number of import declarations is concentrated on Wednesday and Thursday, as shown in Figure 2.1.15 (41% of all import declarations are Wednesday and Thursday). Judging from the required time for customs clearance in the priority lane and green lane, import is permitted for these cargoes on Friday or Saturday morning. This fact is backed by data that on Friday it takes about 6 hours to pick up a container from the container terminal, thus it takes three times longer to transport cargo from terminal on Friday compared with Monday.
② Required Time for Each Work Inside the Container Terminal
Figure 2.1.17 shows the average required time for each trailer to complete its tasks inside the container terminal. Most of this time is spent lifting the import cargo onto the truck. This work requires an average of 2.5 hours. On the other hand, lifting the cargo off the truck, requires an average of 1.45 hours. The reason considered is that the volume of import cargoes is greater than that of export cargoes. Besides, handling of containers is concentrated on specific dates and times, so container volumes at times exceed the handling capacity temporarily; thus, handling facility becomes insufficient at certain times.
Queuing of 1.25 hours at container gate occurs. JICT has already introduced the e-Ticket system and they try to shorten the process time of documentation in the container terminal. However, queuing at the gate still occurs because drivers stop the trucks in front of the gate without getting an e-Ticket in advance, and parking trailers near the gate causes congestion.
0.0%
7.0%
13.0%
22.0%
19.0%
19.0%
20.0%
0.0% 5.0% 10.0% 15.0% 20.0% 25.0%
Sunday
Saturday
Friday
Thursday
Wednesday
Tuesday
Monday
The Study on Efficient and Integrated Transport/Logistics Development in Eastern MPA
2-22
Source: The Study on Efficient and Integrated Transport/Logistics Development in Eastern MPA” Figure 2.1.17 Average Required Time on Each Activity in Container Terminal at Tanjung Priok Port
③ High Density Ratio at Container Yard
The reason why much time is required for entering and exiting the terminal in 2013, as mentioned above, is because much time for lifting on and lifting off cargoes from trailers is required. This is because many containers are unloaded from a ship, and many containers have to be loaded into a ship at the same time at peak time. Therefore, container volume exceeds the capacity of the facility temporarily; as a result, handling facilities become insufficient at certain times. Throughput capacity of containers is considered to be pushed to the limit due to the narrowness of JICT and KOJA terminals. This is found as a result of the high density ratio of the container yard. Figure 2.1.18 shows the density ratio trends of the container yard per month in 2012 and 2013. In the case of imports in 2013, some months have more than 100% in density ratio of container yard, reaching 110% in June. The container yard is apparently operated in much denser situations compared with 2012.
0.85
2.5
1.45
1.25
0 0.5 1 1.5 2 2.5 3
Waiting/Slow moving due tocongestion
Lift on (Import)
Lift off (Export)
Queue in front of gateUnit: Hour
The Study on Efficient and Integrated Transport/Logistics Development in Eastern MPA
2-23
Source: JICT # The yard occupancy rate was low in August, 2012, due to the long vacation of “IDUL FITRI.” # The yard occupancy rate for exports was low in January 2013, as has been typical in past years. Accordingly,
throughput in January is relatively lower than in December, when throughput is influenced by Christmas and New Year.
# The yard occupancy rate of import was low in March, 2013, (98%, Feb., 2013, 90%, Mar., 2013) due to the increase of throughput of containers in March compared with the throughput of containers in February. Thus, the yard occupancy rate in March was lower than February.
# The yard occupancy rate of import was low in July, 2013, due to many OB applications considering the impact of following the long vacation of “IDUL FITRI.”Source: JICT
Figure 2.1.18 Density Ratio of Container Yard (Import & Export)
4) Current Status of 24/7 System10
Of the total discharge of import cargo, 20% happens on Saturday, as shown in Figure 2.1.19.
10 24/7 system was introduced at 2013.
0
20
40
60
80
100
120
Jan Feb Mar Apr May Jun2012
Jul Aug Sep Oct Nov Dec Jan Feb Mar Apr2013
May Jun Jul
(%)
Density Ratio of Container Yard (%)
Export Yard
Import Yard
The Study on Efficient and Integrated Transport/Logistics Development in Eastern MPA
2-24
Source: JICT (May, 2013~September, 2013), World Bank Report Figure 2.1.19 Ratio of Import Cargo by Day, and Submission Rate of Import Declarations by Day
On the other hand, the submission of import declarations has decreased drastically on Saturday and Sunday. Many logistics companies and banks do not operate on the weekend (Saturday and Sunday) and after 5 o’clock on weekdays, so they avoid submitting an import declaration until the next Monday. Thus, customs clearance of 20% of the total imported cargo that arrives on Saturday is delayed around 2 days.
In order to alleviate the congestion caused by delay of customs clearance, customs clearance at Tanjung Priok Port has already started operation of a 24/7 system that works 24 hours a day and seven days a week based on the request from the importer. But actually this system does not work well as customs officers go home on Saturday afternoon or do not come on Sunday. To deal with this program, it is necessary to disseminate information on the benefits of expanded business hours at the container terminal.
5) OB (Overbrengen)
The container yard in Tanjung Priok Port is boxy, so import containers are transferred (OB) to the container yard outside the terminal without notice to cargo owners.
Table 2.1.11 shows the volumes of import containers, OB containers, and the ratio of OB from January, 2013, to July, 2013, at JICT terminal 1.
OB (TEU) 11,198 9,654 8,549 12,794 13,371 15,512 16,943 214,427
OB % 11.57% 10.24% 7.90% 11.00% 11.48% 12.80% 15.60% 10.61% (Average) Source: The Study on Efficient and Integrated Transport/Logistics Development in Eastern MPA
According to the general trend, the OB ratio is low in the time of small volume of import container. The OB ratio for import containers is approximately 11%.
Logistics companies do not receive information about OB containers.11 First, they go to the terminal of Tanjung Priok port to pick up the container. And then in the case of OB, they have to go to the outside container yard to pick up the container. Thus, they are forced to make an unprofitable trip because of OB.
6) Current Status of Electronic Procedures in Tanjung Priok Port
The necessary procedures for importers/exporters involve the import/export licenses of the Ministry of Trade and declarations to Customs. In some cases, letters of recommendation are required by the Ministry of Industry or others.
Although importers/exporters can submit the application for Ministry of Trade licenses by EDI (Electric Data Interchange), even then they must finally hand in paper documents. After the licenses are issued, the contents are registered in the INSW (Indonesian National Single Window) system, delivered to Customs through INSW and checked by Customs on the declarations. On rare occasions the content is not registered and the declaration is rejected by Customs. Thus this system has a little room for improvement.
Importers/exporters can declare to Customs by Customs’ EDI system (Module PIB for import and Module PEB for export) after obtaining the licenses. In the case of import for example, if shipping lines/shipping agencies have not submitted the inward manifests to Customs, the declarations are
11 JICT and KOJA have access to the system that could search the destination of a container (including OB container), but
there is a time lag between receiving information of the container destination and picking up the cargo, thus this system does not work well actually.
The Study on Efficient and Integrated Transport/Logistics Development in Eastern MPA
2-26
rejected by Customs. Also they must hand in the declaration papers and related documents to Customs within 3 days after permission has been issued.
According to an interview with an importer, the introduction of the EDI system has enhanced convenience. Prior to introducing the EDI system, the importer firstly had to search for the person in charge of import licenses in the Ministry of Trade, but now applications for licenses can be started using the EDI system. Also it is possible to follow the status of a Customs examination with the Customs system. This has simplified procedures for importers.
An EDI system processing the procedures required for ships entering/departing from ports is called INAPORTNET. DGST (Directorate General of Sea Transportation) has been developing it. In Tanjung Priok Port, the MOU (Memorandum of Understanding) was concluded between seven (7) port-related governmental agencies and PELINDO 2 in June, 2012, regarding the usage of INAPORTNET. It was expected that use of INAPORTNET would thereby expand but it has not been managed effectively so far.
The Study on Efficient and Integrated Transport/Logistics Development in Eastern MPA
2-27
Future Prospects of Cargo Handling System (2)
1) Future Prospects of Customs Clearance
The ratio of cargo inspection will be decreased by transferring from red lane to yellow12 lane, green lane gradually, by getting the credit of emerging start-up company. Thus the required time for customs clearance is expected to decrease. However, a clear standard does not exit to transfer from red lane to yellow lane and green lane, so it is impossible to accelerate the transfer from red lane to yellow lane and green lane by a private corporate efforts. If more start-up companies are added, the required time for customs clearance in the red lane will increase accordingly with the increasing volume as a whole.
2) Future Prospects of e-Ticket System
The automated gate system with the e-Ticket system is planned to be implemented by December, 2013. So, if it is installed, throughput at the gate is expected to improve much. But, queuing due to the congestion inside the gate may not improve because the handling of cargo is forecasted to increase in the future. On the other hand, queuing due to parking of trucks near the gate could be avoided only if e-Tickets are obtained in another place in advance.
3) Future Prospects of Import-Export of Containers in Container Terminal
At present, as shown in Figure 2.1.15, the 24/7 system is not almost utilized. While Saturday has the most import cargo, the number of trucks importing cargo is least on Sunday and Monday (In particular, 23:00-7:00 on Sunday and 7:00-15:00 on Monday) to avoid the procedure of import declaration until next Monday. As long as the increase of import declaration of Saturday afternoon and Sunday continues to occur this trend is considered to be unchanged. On the other hand, in the case of export cargo, the number of trucks of export cargo is most on Monday, as shown in 2.1.20.
Table 2.1.12 The Number of Gate-In Trucks for Terminal
7:00-15:00 15:00-23:00 23:00-7:00 Total
Monday 735 1,125 1,660 3,520
Tuesday 1,399 1,250 1,610 4,259
Wednesday 1,624 1,447 1,717 4,788
Thursday 1,753 1,382 1,659 4,794
Friday 1,509 1,347 1,774 4,630
Saturday 1,979 1,728 1,395 5,102
Sunday 1,427 1,140 668 3,235 Source: JJC Questionnaire survey and JICT based on the data from May to September of JICT
12 Yellow lane: Qualification for the yellow lane is assigned to logistics companies holding good customs clearance records
or low-risk cargo.
The Study on Efficient and Integrated Transport/Logistics Development in Eastern MPA
2-28
Source: JJC Questionnaire survey and JICT based on the data from May to September of JICT Figure 2.1.20 Average Volume of Export and Import Cargo on Each Day (TEU)
Export cargo is generally introduced into terminal two days before loading, according to the interview results for logistics companies, thus the number of trucks for export cargo is highest on Saturday. In fact, Saturday also has the highest number of gate-in trucks (Table 2.1.12). The number of trucks on the weekend will not change since the ship call schedule can not be changed immediately because the schedule of ship call is determined by the voyage schedule of each shipping company and arrangement with the terminal operator.
4) Future Prospects of “24/7” System
The drastic decrease of import declarations on the weekend (Saturday and Sunday) and the submission of import declarations to discharge many containers on Saturday (not conducted until next Monday) will not change unless this is disseminated and further incentives—such as a discount on the terminal charge—are taken into consideration.
5) Future Prospects of OB Containers
According to the forecast, import cargo will increase in the future. Thus, with the increase in OB cargo and the occupancy ratio of the container yard changed from 85% to 65% the cost burden for the importer is predicted to increase because of the unprofitable trip.
The Study on Efficient and Integrated Transport/Logistics Development in Eastern MPA
2-29
6) Future Prospects of Electronic Procedures in Tanjung Priok Port
Concerning import/export licenses, it is generally necessary to follow procedures set out by the Ministry of Trade, and in some cases a letter of recommendation is required by the Ministry of Industry. Government agencies issuing import/export licenses or recommendations are shown in Table2.1.13. As represented by Ministry of Trade, every agency has been developing their EDI system for the import/export licenses, and cooperating with INSW.
In the future it may be possible to carry out all the required procedures electronically in combination with acquisition steps of electronic authentication. If this cannot be realized, however, it will remain necessary to submit documents by hand.
Table 2.1.13 Government Agencies Issuing Import/Export Licenses
4 Plantation Quarantine ✓ 5 Food & Drugs Control ✓ 6 Ministry of Industry ✓ 7 Ministry of Energy ✓ ✓ 8 Nuclear Control NA ✓ ✓
9 Ministry of Forestry ✓ 10 DG of Post & Teleco ✓ 11 Ministry of Agriculture ✓ ✓ 12 Ministry of Health ✓ 13 National Police ✓ 14 Ministry of Environment ✓ ✓ 15 Ministry of Defense ✓ 16 Ministry of Transport ✓ 17 Central Bank ✓ 18 Customs (DGCE) ― ―
Source:” Indonesian Customs in a Brief”, ASEAN Trade Processing (ATP) Conference, 27 June 2013
Customs has been preparing electronic procedures and regulations that require electronic means. Table 2.1.14 shows the chronology of main events leading towards the development of the Customs EDI system.
The Study on Efficient and Integrated Transport/Logistics Development in Eastern MPA
2-30
Table 2.1.14 Main Events Towards the Development of Customs EDI System
Development Items Year
Development of Electronic Import Declaration 1997
Development of Electronic RKSP (Arrival Plan of Careers) Procedure 2002
Development of Online Payment of Customs and Excise 2003
Development of Electronic Export Declaration 2004
Development of Electronic Cargo Manifest Procedure 2005
Development of Electronic Procedures by Internet 2007
Source:Prepared from “Survey on the Possibility of IC Tag Usage in ASEAN Countries”, Next Generation Electronic Commerce Promotion Council of Japan, 2006 March, and “Requests and Problems on Trade and Investment in Indonesia”, Japan Business Council for Trade and Investment Facilitation, 2013
Customs is currently developing and implementing the following items: improvement of the efficiency of inspection works by the electronic exchanges with bonded zone temporary storage facilities; development of electronic procedures deposit/withdrawal of goods into/from bonded areas (Auto Gate System). Also in terms of equipment, Customs intends to back-up the datacenter in case of disaster. Customs intends to strengthen the cooperation with INSW and to further simplify import/export procedures in the future in order to facilitate logistics and ensure security. (The description of this paragraph is based on “Indonesian Customs in a Brief”, ASEAN Trade Processing (ATP) Conference, 2013 June 27.)
Last year PELINDO2 established a system management company, PT ILCS Company to handle the logistics information, which is a joint company with 51% capital of PELINDO2 and 49 % capital of PT Telkom Indonesia Company. The aim of the company is to provide the information platform for every stakeholder in port/airport logistics. Also it is responsible for ensuring that INAPORTNET is efficiently operated in Tanjung Priok Port based on the MOU referred in (1) 6). They are firstly developing the system processing the port procedures for domestic ships. And they have a plan to expand the system further in order to establish a logistics information platform in all ports in Indonesia. They call it PCS (Port Community System) or New INAPORTNET (see Figure 2.1.21).
If port-related governmental agencies in Tanjung Priok Port provide ships’ information to the information platform through INSW, and port-related companies are able to use the information for logistics, the environment handling the logistics information in Tanjung Priok Port will become much better, together with the completion of the computerization of port procedures.
The Study on Efficient and Integrated Transport/Logistics Development in Eastern MPA
2-31
Source: PT ILCS Company Figure 2.1.21 Scheme of New INAPORTNET
On the other hand, PT EDI Indonesia Company is operating Cargo Link System as a B2B system together with KOJA container terminal. It exchanges electronically information of collection/delivery order of goods after customs clearance and information of the charge payment between consignees/forwarders/trackers and shipping lines/terminals/bonded facilities/banks by using the information in INSW. In November, 2011, PT EDI Company started it together with KOJA terminal, one (1) consignee, five (5) trackers, and one (1) bank. The users have so far increased to two (2) bonded facilities, twenty (20) consignees, twenty-eight (28) forwarders/trackers, and three (3) banks. Customs calls it Integrated Cargo Release System (I-Care) and expects that it will contribute to reducing pick-up times. If the users spread to other terminals, we believe the possibility of reducing the cargo dwelling time in the terminals will become higher. (The descriptions in this paragraph are based on ”Development of National Logistics System Framework”, Coordinating Ministry for Economic Affairs, 7-8 May 2013, and Home page of PT EDI IndonesiaCompany.)
The Study on Efficient and Integrated Transport/Logistics Development in Eastern MPA
2-32
2.2 Port Administration
2.2.1 Current Situation of Port Administration
New Shipping Law (No. 17: 2008) (1)
①Port Management and Business Activities in Ports
New Shipping Law stipulates clearly responsibilities and activities of the Port Authority (PA) and Port Business Entities. Government Regulation (No.61: 2009) identifies the details of these responsibilities and activities.
Responsibilities of PA are described as follows;
-Providing areas of land and water in the port; -Providing and maintaining breakwater, basin, channel, and road in port area; -Providing and maintaining Marine Navigational Aids Facilities; -Ensuring port security and stability; -Ensuring and maintaining port environmental conservation; -Arranging Port Master Plan as well as Port Area of Working and Area of Interest; -Proposing tariffs to be stipulated by the Minister, for water and/or land utilization, and port facilities which are provided by the Government as well as port services operated by port authority according to the provisions of laws; and -Ensuring the unimpeded flow of cargo traffic. -Port authority executes the operation and provision of services of the port, which are needed by the customers, but which are not provided by port business entities
Business Activities in Ports are described as follows:
-Operation and/or provision of services of wharfs for mooring; -Operation and/or provision of fuelling and clean water services; -Operation and/or provision of services of boarding and disembarking of passengers and/or vehicles; -Operation and/or provision of services of wharfs for loading and unloading goods and cargoes; -Operation and/or provision of services of warehouses and yards, loading and unloading equipment, as well as ports tools; -Operation and/or provision of services of container terminal, dry bulk, liquid bulk, and RO/RO; -Operation and/or provision of services of loading and unloading goods; -Operation and/or provision of services of goods distribution and consolidation center; and/or -Operation and/or provision of services related to ship delay.
②Separation of Port Management and Business Activities in Ports
PELIND 2 has been conducting port management and business activities for many years. The Government Regulation declares the separation of port management and business activities in ports.
The Study on Efficient and Integrated Transport/Logistics Development in Eastern MPA
2-33
-At the validity period of this new regulation, the Government, the Regional Government and State-Owned Business Entities that operate the ports still operate business activities based on this New Shipping Law.
-Within a maximum period of 3 (three) years since Law Number 17 Year 2008 regarding Shipping has been effective, port business operation implemented by the Government, the Regional Government and State-Owned Business Entities must be adjusted to the provisions as regulated in this Government Regulation.
-Evaluation of State-Owned Business Entities and audit of whole assets of State-Owned Business Entities shall be carried out within 3 (three) years.
Current Situation of Port Management under the New Shipping Law (2)
MOT has established four (4) Port Authorities in Belawan (PA 1), Jakarta (PA 2), Surabaya (PA 3), and Makassae (PA 4) based on Government Regulation (No. 63: 2010). Current situation port administration of PA 2 and PA 3 is shown in Table 2.2.1.
The Study on Efficient and Integrated Transport/Logistics Development in Eastern MPA
2-34
Table 2.2.1 Current Situation of Port Administration
PA 2 PA 3
1. Providing areas of land and water in the port
*”Berth Assignment Meeting” is still hosted by PELINDO 2 and PELINDO 2 gives final decisions. “Berth Assignment Meeting” will be held by PA 2 after INAPORTNET system for domestic vessels begins to be operated among related public and private organizations. (Although the INAPORTNET was expected to be in operation from December, 2013, the schedule is postponed due to the technical issues of the system.)
*”Port Entry/Departure Procedure” has to be conducted in the following manner;
Submission of port entry documents (hard copy) to PA 3 by ship agents at first
Approval by PA 3
And then, ship agents can access to related public and private organizations.
*PELINDO 3 has developed port EDI system and the system has been operated since May, 2013.
*”Berth Assignment Meeting” is held by AP 3 every afternoon. PA 3 gives final decisions. (Draft assignment plan is formulated by PELINDO 3.)
2. Providing and maintaining breakwater, basin, channel, and road in port area
*PELIND 2 is conducting administrative duties in Tanjung Priok Port.
* PELIND 3 is conducting administrative duties in Tanjung Perak Port. PA 3 manages other ports within the jurisdiction of PA 3.
3. Providing and maintaining Marine Navigational Aids Facilities
*Marine navigation aids facility is managed by Navigation Department of MOT.
* Marine navigational aids facilities are managed by both the Navigation Department and PA 3. Negotiations to determine the detailed demarcation between both parties are ongoing.
4. Ensuring port security and stability
*Safety of navigation and issues on the International Convention Safety of Life at Sea (SOLAS) is managed by harbormaster’s office.
*Owners are managing security and stability issues in their facilities.
* SOLAS is managed by harbormaster’s office.
*Owners are managing security and stability issues in their facilities.
5. Ensuring and maintaining port environmental conservation
*Harbor master office is in charge of the International Convention for Prevention of Maritime Pollution by Ships (MARPOL).
Owners are managing environmental issues in their facilities.
*Harbormaster’s office is in charge of the International Convention for Prevention of Maritime Pollution by Ships (MARPOL).
Owners are managing environmental issues in their facilities.
6. Arranging Port Master Plan as well as Port Area of Working and Area of Interest
*PA 2 has issued a recommendation letter of Tanjung Priok Port Master Plan to the Minister of MOT.
*PA 3 has formulated a draft Tanjung Perak Port Master Plan. PA is studying seven (7) other port master plans in the area.
7. Ensuring the unimpeded flow of cargo traffic
*PA 2 is supervising all activities in Tanjung Priok Port and PA 2 issues administrative directions if necessary.
*PA is preparing PA’s port statistics.
*Inventory of all public and private port facilities is not formulated yet.
*PA 3 gives private stevedoring companies approval to conduct business activity in a port.
* PA 3 is supervising all activities in Tanjung Perak Port and PA 3 issues administrative directions if necessary.
*PA 3 formulated port statistics already. But classification of commodities is very limited.
Inventory of all public and private port facilities is not formulated yet.
8.Discusion with PELINDO for Transfer of Port Administrative Activities
*Progress of Discussion with PELINDO 2 is very limited.
*Discussions with PELINDO 3 are often held.
Source: The Study on Efficient and Integrated Transport/Logistics Development in Eastern MPA
The Study on Efficient and Integrated Transport/Logistics Development in Eastern MPA
2-35
Concerning the transfer of port administrative activities from PELINDO to PA, a big difference is witnessed between PA 2 and PA3. Port management by PA is summarized below:
-More than 3 (three) years have passed already. Port Authorities were established by the Regulation of the Minister of Transportation KM 64/2010. However, PELINDO 2 is still conducting port management and port business activities.
-Accordingly, a monopolistic situation in cargo handling services in the port continues. Fair competition, which is the most important objective of the New Shipping Law, has not been implemented yet. JICT and KOJA are major container terminals of Tanjung Priok Port and 2 (two) operation companies are managing and operating these terminals, respectively. However, actual shareholders of these companies are PELINDO 2 and a Mega-operator. JICT and KOJA are not competitors.
- Since PELINDO 2 is still conducting port management, PA has not been implementing port management yet and staff-members of PA have no opportunity to obtain required know-how and techniques through on-the-job training (OJT).
Future Prospects (3)
1) Realization Of Higher Service Level and Appropriate Transportation Costs
When a container terminal has insufficient area of container stacking yard for existing container volume, many containers are obliged to be transferred out of the container terminal to off-dock container yards to increase cargo handling capacity of the terminal. This manner in cargo handling is commonly witnessed in many container terminals around the world and generally known as “Overbrengen” (OB). Container terminals of Tanjung Priok Port belong to this kind of terminal. However, OBs are carried out without any notification to consignees at container terminals in Tanjung Priok Port. Consequently, when a consignee reaches a container terminal to pick up cargo, his container is not at the terminal but at another stacking place, off-dock container yard. This consignee has to go to the off-dock yard to pick it up. He loses time and money. OB without notification to consignee is prevalent at container terminals in Tanjung Priok Port due to the monopolistic situation in cargo handling services. Furthermore, consignees have to pay additional charges of OB. If fair competition in cargo handling services had been introduced as planned, the additional charge for OB would be at an appropriate level.
It should be noted that basic stevedoring charges are unified through Ministerial approval and this unified pricing is not an issue yet addressed.
2) Capacity Building of Port Authority and Staff members
Capacity building of PA and its staff members is very important because the staff will have to carry out their responsibilities at Cilamaya New Port in the near future. Prosperity of the Cilamaya New Port depends on the managing capacity of PA 2.
The Study on Efficient and Integrated Transport/Logistics Development in Eastern MPA
2-36
2.3 Understanding the Current Status andFuture Prospects of Logistics Related Facilities
2.3.1 Current Status and Future Prospects of Logistics Related Facilites
Present Condition of Logistics Related Facilites (1)
1) Present Condition of Cikarang Dry Port
Handling containers at Tanjung Priok Port takes a long time, and containers over the capacity of the terminal often are moved out to the container yards in the surrounding area. To deal with this situation, Cikarang Dryport was developed to alleviate the congestion at Tanjung Priok Port by transporting containers to the eastern part of the Jakarta metropolitan area, and processing custom clearance at the dry port.
Cikarang dry port is located 40km east of Jakarta, in the Cikarang industrial estates.
Source: The Study on Efficient and Integrated Transport/Logistics Development in Eastern MPA Figure 2.3.1 Relative Location of Cikarang Dry Port and Tanjung Priok Port/Cilamaya New Port
Cikarang dry port closely located to the Java railway of main line, and railway container transport service has already started two times by train a day though the plan operates 5 times by train a day between Pasoso station and Cikarang Dry Port (November, 2013). Main reason is considered to be small demand of cargo train due to the high transportation cost, and the shortage of train. And judging from the rail system of Cikarang Dry Port, it is necessary for the train coming from Tanjung Priok Port to switch back at Ruma Aban station after passing the dry port, so it takes much time to install the train in the cargo rail.
The Study on Efficient and Integrated Transport/Logistics Development in Eastern MPA
2-37
Source: The Study on Efficient and Integrated Transport/Logistics Development in Eastern MPA
Figure 2.3.2 Location of Cikarang Dry Port
Source: The Study on Efficient and Integrated Transport/Logistics Development in Eastern MPA Figure 2.3.3 Current Status of Railway Facilities at Cikarang Dry Port
Cikarang Dry Port opened in 2010, and it will fully open in 2015. Access roads are planned directly connecting to the toll road from the dry port. Outline of facilities is as follows:
The Study on Efficient and Integrated Transport/Logistics Development in Eastern MPA
2-38
Table 2.3.1 Outline of the Facility
Land area 200haCargo volume capacity 2,000,000 TEUsFacility - Container yard
- Container freight station - Customs, quarantine facility - Empty container depot - Truck pool - And cargo railway station, etc.
Transaction volume - 6,444 TEU(2012)
Source: Cikarang Dry Port
Source: Cikarang Dry port
Figure 2.3.4 Outline of Cikarang Dry Port Facilities
Handling capacity is 2,000,000 TEU, but handling volume as of the end of 2012 is only 6,444 TEU.
Table 2.3.2 The Current Situation of Cikarang Dry Port.
Criterion Current Condition Throughput 6,444 TEU (2012) Shipping line 11 shipping lines(Maersk Line group, APL,
Railway Operation time 24/7 Container lead time at CDP Max. 24 hours after container arrives in Tanjung
Priok Number of users 70 companies(June, 2013)
Source: Information from Cikarang dry port and Kontan newspaper
The Study on Efficient and Integrated Transport/Logistics Development in Eastern MPA
2-39
Table 2.3.3 Key Comparisons: Tanjung Priok Port and Cikarang Dry Port
Tanjung Priok Port Cikarang Dry Port Dwell time13 Congestion in Tanjung Priok causes
an average dwell time of 6 days. Not congested. Service level agreement is that the container after arrival in tanjung Priok will be available in Cikarang Dry Port. Average dwell time is 3 days.
Trucking costs Depending on location, customers in Cikarang area, situated away from the trucking pool and container depot in Marunda and Cilincing, would pay a higher price.
Depending on location, customers in Cikarang area would benefit from the short distance to Cikarang Dry Port and also the short distance to the empty container depot in Cikarang Dry Port. However, there will be only one single trucking company serving Tanjung Priok-Cikarang Dry Port (no option to choose other trucking company). Price control by Cikarang Dry Port.
Productivity Related facilities are not integrated.Free time storage: 3 days
Integrated facilities and services at CDP. Free time storage: 5 days
Additional charge May incur costs for “overbrengen”. No additional cost. Handling fee One-time handling fee at terminal. Double-handling fee at terminal in
Tanjung Priok and at CDP. Source: Information from Cikarang Dry Port and Indonesia State of Logistics 2013, World Bank
Table 2.3.4 Estimated Cost Comparison for Using Cikarang Dry Port and Tanjung Priok Port
Cost of Importing a Container from Tanjung Priok Port to Factory in Cikarang
20’ Full ContainerLoad Priok Cost
20’ Full Container Load CDP Cost
Bill of lading fee to shipping lines 89,000 Rp 89,000 Rp Terminal handling charge 845,000 Rp 845,500 Rp Lift-on Tajung Priok CY 187,500 RpLift-on/Lift-off CDP 375,000 Rp Import customs (414,000 Rp/TEU) 414,000 Rp 414,000 Rp Inspection Process (Red Lane) 1,015,000 Rp 1,015,000 Rp Tanjung Priok to Cikarang Dry Port 1,410,000 Rp Container shifting 319,600 Rp 319,600 Rp Trucking from discharging port to factory 1,500,000 Rp 600,000 Rp Warehouse stripping costs 1,294,000 Rp 1,294,000 Rp OB (Over Brengen related costs) 3,500,000 RpRed Lane 5,664,600 Rp 6,362,100 Rp Green Lane 4,649,600 Rp 5,347,100 Rp OB Red Lane 9,164,600 Rp 6,362,100 Rp OB Green Lane 8,149,600 Rp 5,347,100 Rp
** Mode of transportation is based on the truck. Source: The Study on Efficient and Integrated Transport/Logistics Development in Eastern MPA team made this data based
on “Tariff of Cikarang Dry Port, JICT Leaflet, and State of Logistics Indonesia 2013, World Bank”.
13 Assume average dwell time of 6 days, storage time average of 1.16 days after SPPB (“State of Logistics Indonesia 2013,
World Bank”. (6days and 3 days indicate the average dwell time of combined red lane and green lane)
The Study on Efficient and Integrated Transport/Logistics Development in Eastern MPA
2-40
In the comparison of Cikarang Dry Port and Tanjung Priok Port, dwelling time in the red lane is apparently superior to Cikarang Dry port but there is little difference between Tanjung Priok Port and Cikarang Dry Port in the dwelling times of priority and green lane. On the other hand, a double handling charge is incurred at Cikarang Dry Port, which puts it at a disadvantage compared to Tanjung Priok Port in terms of cost. But, when a container is transferred to outside the terminal (OB), Cikarang Dry Port is more advantageous than Tanjung Priok Port in terms of cost. In particular, for importers using the red lane of eastern MPA, usage of Cikarang Dry Port is advantageous in terms of both time and cost.
2) Current Status of Gete bage Dry Port
Gete bage Dry Port was opened to mainly deal with textiles in 1988, and the throughput of Gete bage Dry Port reached a peak in the latter half of the 1990s.(Location of Gete bage Dry Port is shown in Figure 2.3.5) At its peak, sometimes as many as seven cargo trains were operated, including an extra train each day. After the time of opening of toll-road between Jakarata and Bandung in 2003, the number of trains decreased gradually and then dramatically decreased after 2003.
Source: The Study on Efficient and Integrated Transport/Logistics Development in Eastern MPA team made this figure based
ESCAP (Development of Dryports in Indonesia) Figure 2.3.5 Railway Network in Java Island and Location of Gete bage Dry Port
Railway transport cost is estimated to be 30% higher than the cost of truck transportation due to the doubling of handling costs in Pasoso station, according to the data of ESCAP. This high cost of railway transportation is the main reason why cargo owners have backed away from railway cargo transportation. Also, railway cargo transportation takes 10.5 hours between Pasoso and Gete bage compared with 6.0 hours of truck transportation.
Container transport by railway between dry port and port requires more time and higher costs than truck transportation due to double handling.
The Study on Efficient and Integrated Transport/Logistics Development in Eastern MPA
2-41
Source: ESCAP (Development of Dryports in Indonesia)
Figure 2.3.6 Transportation Trend by Railway of Gete Bage Dry Port
Future Prospects of Logistics Related Facilities (2)
1) Future Prospects of Logistics Related Facilities
Handling a container at Tanjung Priok Port takes a long time and sometimes the cost charged by OB is unprofitable. So, the number of cargo owners, importers, and logistics companies using Cikarang Dry Port has increased in consideration of less congestion and shorter customs clearance time compared with Tanjung Priok Port. In addition, the standard of OB (transferring containers to the outside of the terminal) was changed from 85% to 65% together with the increase of cargo demand, so the possibility of OB could be increased. Thus, the usage value of Cikarang Dry Port will be increased in the near future.
2) Future Prospects of Gete Bage Dry Port
The textile industry of hinterland of Gede bage Dry Port declined, and cargo volume was decreased. In addition, railway cargo is inferior in cost and time, compared with truck transportation, because of the opening of the toll road. Judging from the current situation, the possibility of usage of Gede bage Dry Port would be smaller than now.
2.4 Understanding Present Condition, Perspective, and Existing Development Plan of Road Sector
2.4.1 Traffic Congestion on Jakarta – Cikampek Toll Road
Present Condition (1)
Travel speed survey was conducted to understand the congested situation of the study area. Survey route is as shown in Figure 2.4.1.
Export Import Empty Total
The Study on Efficient and Integrated Transport/Logistics Development in Eastern MPA
2-42
Source: The Study on Efficient and Integrated Transport/Logistics in Eastern MPA, Travel Speed Survey 2013 Figure 2.4.1 Routes for Travel Speed Survey and Road Section ID
The Travel Speed Survey was conducted as follows:
Survey Routes Toll roads and arterial roads between Tanjung Priok Port and Tangerang, Depok and Bekasi areas
Survey Period 1st survey – one week from 20th of May, 2013 to 26h of May, 2013 Supplemental survey – 30 days from 9th of December, 2013
Vehicles to be Surveyed 1st survey – 600 tracks Supplemental survey – 24,000 samples in maximum, depending on the target section.
Based on the survey results as shown in Figure 2.4.2, low traffic flow was due to occasional traffic congestion on the main line of Jakarta–Cikampek Toll Road, but the situation has not been very serious depending on the time zone, specifically at Cikarang–Cikunir and the east section of the Jakarta Outer Ring road. Analysis is shown on Figure 2.4.2.
At present trucking companies, forwarders and consigners are most concerned about the long travel time between Tanjung Priok Port and industrial estates in eastern part of the Jakarta metropolitan area. Fluctuation of the travel time by road section, by hour band and by day of week has been analysed for the section between the east section of Jakarta Outer Ring Road and Jakarta–Cikampek toll road.
Travel time from Karawang IC to the exit at the northern end of the eastern section of the Jakarta Outer Ring Road is illustrated by day of week and by 3-hour band of each day in Figure 2.4.2. Average travel time from Cikarang to the junction of the Jakarta – Cikampek Toll Road and JORR amounts to 0.92 hours
Cikunir
Cikarang
Karawang
Cilincing
Tanjung Priok Port
Cibitung
The Study on Efficient and Integrated Transport/Logistics Development in Eastern MPA
2-43
(55 minutes) and the average travel time on the eastern section of JORR was 0.36 hours (32 minutes). Total average travel time accounted for 1.28 hours (77 minutes). When the roads are not congested it takes about one hour and 15 minutes, while it takes almost two hours during the congested period.
Source: The Study on Efficient and Integrated Transport/Logistics in Eastern MPA, Travel Speed Survey 2013 Figure 2.4.2 Average Travel Time of Trucks on Jakarta−Cikampek toll road and Jakarta
Outer Ring Road by Day of Week and by Hour Band
0.0
0.5
1.0
1.5
2.0
2.5JORR E Cikampek
hour
The Study on Efficient and Integrated Transport/Logistics Development in Eastern MPA
2-44
Source: Travel Speed Survey was conducted by the Study on Efficient and Integrated Transport/Logistics in Eastern MPA in 2014
Figure 2.4.3 Travel Time Distribution of Trucks on Jakarta−Cikampek Toll Road and Jakarta Outer Ring Road
Travel time distribution from TanjungPriok to karawang by truck is shown in Figure 2.4.3. About 10 percent of travel time were observed more than 1.5 times of the most frequent range of travel time on JORR and Cikunir- Cibitung section and Cibtung – Karawang section of Jakarta – Cikampek toll road. This implies that traffic flows are frequently forced to be slow due to traffic congestion even at present. On the other hand travel time distribution looks rather flat on the arterial road in front of the port where chronic traffic congestion are observed and it implies that traffic congestion causes long travel time frequently.
Future Prospects on Traffic Congestion (2)
Traffic volume on the Jakarta – Cikampek toll road is anticipated to increase in the future, however, traffic volume in some sections has reached traffic capacity and those sections have been widened to eight lanes. Thus, it seems difficult to widen further. Therefore, traffic congestion on the Jakarta – Cikampek Toll Road will surely worsen and delays due to traffic congestion will happen more frequently if action for alleviating traffic congestion is not taken.
0.0%
5.0%
10.0%
15.0%
20.0%
25.0%
30.0%
35.0%
5 10 15 20 25 30 35 40 45 50 55 55+
JORR (Exit JORR -Cikunir)
0.0%
5.0%
10.0%
15.0%
20.0%
25.0%
30.0%
35.0%
5 10 15 20 25 30 35 40 45 50 55 55+
Tanjung Priok -Exit JORR
0.0%
5.0%
10.0%
15.0%
20.0%
25.0%
30.0%
35.0%
5 10 15 20 25 30 35 40 45 50 55 55+
Cikampek Toll Road (Cikunir - Cibitung)
0.0%
5.0%
10.0%
15.0%
20.0%
25.0%
30.0%
35.0%
5 10 15 20 25 30 35 40 45 50 55 55+
Cikampek Toll Road (Cibitung -Karawang)
unit: minutes unit: minutes
unit: minutes unit: minutes
The Study on Efficient and Integrated Transport/Logistics Development in Eastern MPA
2-45
Source: The Study on Efficient and Integrated Transport/Logistics Development in Eastern MPA Figure 2.4.4 Traffic Volume and Capacity on the Jakarta−Cikampek Toll Road
2.4.2 Traffic Congestion on Arterial Road in Front of Container Terminal at Tanjung Priok Port
Present Condition (1)
At present, the Tanjung Priok Access Road is being developed. As a result traffic congestion on the arterial road has been serious due to the construction work. The most severely congested sections have been at Jl. Pelabuhan Raya、Jl. Jampea, Jl. Sulawesi and Jl. Enggano in front of the container terminal.
8 Lanes 6 Lanes
Traffic Capacity
Traf
fic V
olum
e (p
uc/d
auy)
The Study on Efficient and Integrated Transport/Logistics Development in Eastern MPA
2-46
Source:Travel Speed Survey, The Study on Efficient and Integrated Transport/Logistics Development in Eastern MPA 2013
Figure 2.4.5 Traffic Congestion of the Arterial Road in front of Container Terminal of Tanjung Priok Port
Causes of the traffic congestion are listed below:
Insufficient road capacity of the arterial road in front of container terminal (Road capacity will
be improved because of completion of Tg. Priok access road.) Surrounding road Tg. Priok is
planned to support 10 lanes, a capacity of 19,200 PCU/hr (with a lane toll road capacity of
12,000 PCU/hr and 4 lanes arterial road is 7,200 PCU/hr). The future estimated traffic volume
for Jl. Sulawesi is 19,200 PCU/hr, with a planned surrounding road will have sufficient
capacity14.
Poor traffic control on the arterial road due to Tanjung Priok Access Road construction. (This
problem will also be solved when the construction work ceases.)
Ignorance of traffic regulation (at present construction vehicles and trucks/ trailers are mixed
and some do not follow the traffic rules prohibiting turns and U-turns causing traffic congestion).
Illegal parking and vehicles on the shoulder disturb traffic flow.
14 The Study on Efficient and Integrated Transport/Logistics Development in Eastern MPA 2013
Distance : 5.05 km
Travel Time : 42min 3 sec
Ave Travel Speed: 7.2 km/h
The Study on Efficient and Integrated Transport/Logistics Development in Eastern MPA
2-47
Traffic Congestion at Tanjung Priok Port (Reduced Number of Lanes due to Construction Work)
Traffic Congestion in front of Tanjung Priok Port(Entrance Road to Terminal Gate)
Source:The Study on Efficient and Integrated Transport/Logistics Development in Eastern MPA 2013JICA Study Team Figure 2.4.6 Traffic Congestion on the road in front of Tanjung Priok Port
Future Prospects of the Traffic Congestion in front of TanjungPriok Port (2)
Traffic congestion on the road in front of Tanjung Priok Port will be alleviated after the completion of the Tanjung Priok Access Road and its provision of a direct on/off ramp to the container terminal as shown in Figure 2.4.8. Development plan of the Tanjung Priok Access Road is shown in Figure 2.4.7.
Source: Tanjung Priok Access Road Development Study Figure 2.4.7 Tanjung Priok Access Road Development Plan and Progress
E-1E-2E-2AN-S LinkN-S Direct Rump
Progress of Tj. Propk Port Access Road Construction Project2013 2014 2015
Construction Work2009 2010 2011 2012
Jl. Enggano
Jl. Enggano
Jl.S
ula
wes
i
Jl.S
ula
wes
i
Jl.Pelabuhan Raya
Jl.Pelabuhan Raya
Jl.Jampea
Jl.Jampea
The Study on Efficient and Integrated Transport/Logistics Development in Eastern MPA
2-48
Source:The Study on Tanjung Priok Port Access Road Development Plan Figure 2.4.8 Perspective of Ramp at Gate near Tanjung Priok Port
Tanjung Priok Access Road will be completed by 2015. After completion of the access road, Jl. Jampea road will be 6 lanes with an arterial road consisting of 4 lanes. It will also include a Frontage Road running along the arterial road. Jl. Sulawesi will be a 4 land Toll Road with a 4 lane arterial road. According to Bina Marga design standards, the traffic capacity of a 6 lane Toll Road is 12,000 PCU/day. The 4 lane arterial road traffic capacity is 8,000 PCU/hr. As a result, traffic capacity for Jl. Jampea, East-West flow will be 19,200 PCU /hr and Jl. Sulawesi, North-South direction will be 15,200 PCU hr. According to the Study on Arterial Road Improvement Project in Jakarta Metropolitan Area, high traffic volume projection for 2030 will measure 12,772 PCU/hr15, well within the capacity of the 2013 Tanjung Priok Access Road.
15 The Study on Efficient and Integrated Transport/Logistics Development in Eastern MPA 2013
The Study on Efficient and Integrated Transport/Logistics Development in Eastern MPA
2-49
Table 2.4.1 Estimated Traffic Volume on the Road in front of terminal at Tanjung Priok Port
Estimated Traffic Volume (PCU)
Location 2010 2013 2015 2020 2030 Annual Growth
East-West flow
R.E. Martadinata
Enggano
38,912 39,853 40,494 42,139 45,754 0.8%
Traffic volume on peak hour 3,892 3,985 4,049 4,214 4,575
North-Sputh flow
Sulawesi- Tg. PA 75,770 81,835 86,146 97,942 127,716 2.60%
Traffic volume on peak hour 7,577 8,184 8,615 9,794 12,772
Source : The Study on Efficient and Integrated Transport/Logistics Development in Eastern MPA 2013
Existing Road Development Plan (3)
JICA’s Preparatory Study on Arterial Road Improvement Project in Jakarta Metropolitan Area proposed R.E.Martadinata and Sulawesi flyovers located in the Western part of Tanjung Priok Port. The construction of flyovers will serve to further alleviate traffic congestion. In particular, R. E. Martadinata flyover in the West will contribute to significant improvement since this includes Tanjung Priok Bus Terminal development and its surrounding railway station.
The Study on Efficient and Integrated Transport/Logistics Development in Eastern MPA
2-50
Source: Feasibility Study on Tanjung Priok Access Road Construction Figure 2.4.9 R.E Martadinata and Sulawesi–Tanjung Priok Flyovers
1) R.E. Martadinata Flyover
Detailed design for R.E. Martadinata flyover has been completed on the Tanjung Priok Access Road Plan, however, implementation is delayed due to ongoing land acquisition and cost overrun issues. R.E. Martadinata flyover will relieve traffic congestion created by the existing railway and bus terminal. Especially with the Railway proposing to connect JICT、KOJA. Such a railway crossing would be a cause of traffic congestion for the road and an obstacle for traffic. A railway flyover will be implemented in the initial stage of the Railway Expansion Project, however, there are many illegal houses and shops. As a result, the implementation of land acquisition remains both difficult and time consuming.
The Study on Efficient and Integrated Transport/Logistics Development in Eastern MPA
2-51
Table 2.4.2 Project Condition of R.E. Martadinata
Structure type Overpass (Jl. Martadinata)
Approximate length of structure 810m
Number of lanes
Main road 2 lanes each way (W=9.5m x 2)
Frontage road 1 lane each way
Existing study D/D (2007: DGH)
Railway crossing Tanjung Priok railway line
Issues Coordination with bus terminal and railway station
Source: Preparatory Survey for Metropolitan Arterial Road Improvement Project
Source: Preparatory Survey for Metropolitan Arterial Road Improvement Project
Figure 2.4.10 R.E. Martadinata Flyover Plan
2) Jl. Sulawesi - Tg.PA Flyover
Detailed design for Jl. Sulawesi - Tg.PA Flyover has been completed the same as Martadinata Flyover. Jl. Sulawesi - Tg.PA Flyover is planned beside the Tanjung Priok Access Road N-S link, which began in 2011. The total length of this flyover is 740 m and passes through the railway and Jl. Enggano.
The Study on Efficient and Integrated Transport/Logistics Development in Eastern MPA
2-52
Table 2.4.3 Project Condition of Sulawesi - Tg.PA
Structure type Overpass (Jl.Yos Sudarso and Sulawesi)
Approximate length of structure 740 m
Number of lanes
Main road 2 lanes each way (W=9.5 m x 2)
Frontage road 2 lanes each way
Existing study D/D (2007: DGH)
Railway crossing Tanjung Priok railway line
Source: Preparatory Survey for Metropolitan Arterial Road Improvement Project
Source: Preparatory Survey for Metropolitan Arterial Road Improvement Project
Figure 2.4.11 Sulawesi - Tg.PA Flyover Plan
3) Pasoso Flyover
Pasoso Flyover is planned as a part of the R.E. Martadinata Flyover. However, design of independent structure of Pasoso Flyover is not yet completed. Jl. R.E. Martadinata connects Tanjyun Priok Port with Central and South Jakarta and also the Airport. R.E. Martadinata road is a 2 lane arterial road with relatively high traffic volume in and out of MTI port increasing traffic congestion.
The Study on Efficient and Integrated Transport/Logistics Development in Eastern MPA
2-53
Entrance traffic for MTI gate using 2 lanes Incoming and outgoing traffic through MTI gate is a cause of traffic congestion.
Source: Preparatory Survey for Metropolitan Arterial Road Improvement Project Figure 2.4.12 Current Situation of near Pasoso Flyover Plan
It is expected that the construction of Pasoso flyover will smooth access to MTI Port and Railway facilities. However, it is necessary to consider R.E. Martadinata flyover conditions and Tanjung Priok Access Road W section.
Source: Preparatory Survey for Metropolitan Arterial Road Improvement Project Figure 2.4.13 Pasoso Flyover Plan
The Study on Efficient and Integrated Transport/Logistics Development in Eastern MPA
2-54
2.4.3 Access Road to Interchanges of Toll Road in the Eastern Industrial Estates
Present Situation of Traffic Congestion on Access Road to Interchanges (1)
Serious congestion exists on the access road from the industrial estates to the interchanges of the toll road.
Source: Preparatory Survey for Metropolitan Arterial Road Improvement Project Figure 2.4.14 Travel Speed Survey Results in the Eastern Industrial Estates
1) Cibitung Interchange
The MM2100 Industrial Estate is located on the south side of the Cibitung Interchange on a 4-lane access road. However, traffic congestion occurs at the industrial estate and toll road. This traffic congestion extends to MM2100 and causes traffic congestion within the Industrial Estate. The north side access road that connects JABABEKA and Dry Port, has only a 2-lane access road, as does Kalimarang Road. These roads contribute significantly to the traffic congestion of the surrounding area.
The Study on Efficient and Integrated Transport/Logistics Development in Eastern MPA
Cikarang Utama Barrier Gate is the main gate on the toll road. Two toll gates are located in the Jakarta direction and one toll gate in the Cikampek direction. There is a sufficient number of toll booths for both directions; however, disorderly traffic remains a major cause of interruption. Additionally, traffic merging into toll booth lines are not sufficiently controlled, resulting in further traffic congestion.
The Study on Efficient and Integrated Transport/Logistics Development in Eastern MPA
2-56
Source: Preparatory Survey for Metropolitan Arterial Road Improvement Project
Figure 2.4.16 Cikarang Utama Barrier Gate
3) Cikarang Barat Interchange
Cikarang Barat Interchange is one of the most important interchanges connecting with JABABEKA, Dry Port, EJIP and other industrial estates. Jl. Raya Cibarusah Bekashi connects with Cikarang Barat Interchange and the south side industrial estate, here traffic congestion frequently occurs. There is a Flyover to avoid this traffic congestion on the arterial road but the flyover accepts only northbound traffic and causes further traffic congestion for toll and arterial roads. Also, frequent illegal parking by mini buses and other vehicles compound the traffic congestion.
The Study on Efficient and Integrated Transport/Logistics Development in Eastern MPA
2-57
Source: Preparatory Survey for Metropolitan Arterial Road Improvement Project
Figure 2.4.17 Cikarang Barat Interchange
4) Cikarang Timur Interchange
Cikarang Timur Interchange connects with toll road and the Delta Mas Industrial Estate. While the access road is of sufficient length, the number of toll booths is not in line with current or future traffic volumes. The number of toll booth shall be increased to meet with future traffic volume from the industrial estate.
Source: Preparatory Survey for Metropolitan Arterial Road Improvement Project
Figure 2.4.18 Cikarang Timur Interchange
The Study on Efficient and Integrated Transport/Logistics Development in Eastern MPA
2-58
5) Karawang Barat Interchange
KIIC and Sandiego Hills Memorial Park are located on the south side of the Karawang Barat Interchange north of the access road connecting to Karawang city. High traffic volume access roads do not have signal controls at intersections and are the cause of traffic congestion. Traffic along the two-laned access road is further congested by illegal parking and shops. The southbound access road connects with both a toll road and the KIIC Industrial Estate. This is a 4-lane access road in good condition.
Source: Preparatory Survey for Metropolitan Arterial Road Improvement Project
Figure 2.4.19 Karawang Barat Interchange
6) Karawang Timur Interchange
Karawang Timur Interchange connects with KIMK、SURYACIPTA Industrial Estate heading south and with Karawang City heading north. North side access road is 2 lanes with much traffic congestion due to the short length. The Access Road heading south is relatively stable, However, rush hour traffic to/from the industrial estate will see a similar pattern of toll gate congestion to the Cikarang Timur Interchange.
The Study on Efficient and Integrated Transport/Logistics Development in Eastern MPA
2-59
Source: Preparatory Survey for Metropolitan Arterial Road Improvement Project Figure 2.4.20 Karawang Timur Interchange
Possibility of Development of Access Road to the Interchange (2)
Access roads are considered provincial roads and are subject to the same limited budget for road development by provincial and kabupaten governments. These are not expected to develop smoothly. Consequently, it is necessary to share the cost among stakeholders such as companies in the industrial estates who will enjoy the benefits of enhanced road connection.
Toll facilities belong to Jasa Marga. Many industrial estates are expected to improve toll facilities. However, Jasa Marga is not making consensus building with each stakeholder a priority, nor working on an improvement plan. Future improvement plans will be reflected in Maintenance and Development plans for a Toll Road by Jasa Marga to be implemented as soon as possible.
2.4.4 Ring Road and North-South Road Development in Jakarta Eastern Industrial Estates
Existing Traffic Conditions of Jakarta Eastern Industrial Estates (1)
Preparatory Survey on Arterial Road Improvement in Jakarta Metropolitan Area, carried out by JICA study (2011) as shown in Figure 2.4.21.
The Study on Efficient and Integrated Transport/Logistics Development in Eastern MPA
2-60
Source: Preparatory Survey on Arterial Road Improvement in Jakarta Metropolitan Area Figure 2.4.21 Ring Road and North-South Road Development in Jakarta Eastern
Industrial Estates
The development plan for Cikarang area, located on Karawang Industrial Estate, concerns Jl. Karimalang (Length 7.8km) and 3 arterial roads passing a toll road for north-south direction. Jl. Karimalang is a 2-lane road and running parallel with Karimalang River. A heavy volume traffic of trucks and trailers and has caused damage to the road surface.
There are two bridges passing Karimalang River. The bridge for Dry Port Access Road is completed on Kalimalang River section only. Jl. Bali, which is located on the west side of Cikarang, is a 2-lane road with a 1.5 lane bridge passing the Jakarta-Cikampek Toll Road. Jl. Imam Bonjol shows sign of significant road wear .
There is a flyover passing for Jakarta-Cikampek toll road. The dry port access road is under construction and only some parts are completed. North of the Jl. Karimalang, there are many houses and shops, making land acquisition difficult. Beginning and end points of Jl. Karimalang are consistently very congested.
Details for Existing Traffic Condition of Jakarta Eastern Industrial Estates are shown below.
Cikalang industrial estate has 450 Japanese factories and the biggest industrial estate in Jabodetabek composed of MM2100 and Delta Mas. These Industrial Estates are located on the north and south
Jl. Kalimarang Improvement
Jl. Bali Improvement
MM2100-EJIP Access Improvement
Dry port access road
Delta Mas-Jakarta-Cikampek Access Improvement
Jl. ImanBonjol Improvement
The Study on Efficient and Integrated Transport/Logistics Development in Eastern MPA
2-61
sides of the Jakarta-Cikampek Toll Road. Many employees live on the north side of industrial estate. General traffic and daily commuters cause traffic congestion in and around the Industrial Estates, especially Jl. Jarakosta and Jl. Cibarush due to lack of a south-north access road.
There is a new interchange plan for the 29.2 km point of Jakarta-Cikampek Toll Road. This interchange is composed of a flyover on Jakarta-Cikampek Toll Road, a bridge passing through Kalimalang River and the Dry Port Access Road, which passes JABABEKA 1. The dry port access road will function as a north-south trunk road.
The access road for the west side of Cikarang Industrial Estate experiences heavy traffic to Cibitung Interchange. This Access Road is not used as a north-south connecting road.
Heavy traffic runs north-south. Much of the congestion is due to lack of a bridge connecting North-South, crossing at the Jakarta-Cikampek Toll Road.
Creating a Ring Road for Cikarang Industrial Estate is expected to smooth traffic for cargo and commuters. Also, Jl. Bali and Jl. Jarakosta will be improved and is expected to mitigate the north-south traffic congestion.
Future Prospects for Surrounding Road of Jakarta Eastern Industrial Estates (2)
Future prospects for surrounding road of Jakarta Eastern Industrial Estates for Jakarta Eastern Industrial Estates consists of improvement for existing roads, access roads for industrial estates and toll roads, flyovers, and bridges.
Planned improvement includes road development and improvement of 6 locations. As shown in the previous diagram, each industrial estate will be connected by the development and improvement of roads, construction of new interchanges, and construction of access roads, including ring roads.
The following are details for each plan.
1) Jl. Kalimalang
Jl. Kalimalangis starts in Jl. Cibitung and ends in Jl. Cibarsah, for a total length of 7.8 km of arterial road. Road safety shall be secured by the improvement of existing footpaths and side shoulders. Jl. Kalimalang, located along the Kalimalang River, proposes a widening of the main road for river improvement in the future. A Tegal Gede flyover and a widening of its main road shall also be considered.
Beginning point of Jl. Kalimalang. At grade intersection improvement and flyover shall be constructed.
Main Road for Jl. Kalimalang. Main Road improvement and river improvement are necessary.
End point of Jl. Kalimalang. Grade intersection improvement and flyover shall be constructed.
Source: Preparatory Survey on Arterial Road Improvement in Jakarta Metropolitan Area Figure 2.4.22 Existing Condition for Jl. Kalimalang
The Study on Efficient and Integrated Transport/Logistics Development in Eastern MPA
2-62
2) Jl. Bali
Road surface for Jl. Bali shows signs of significant wear. Rehabilitation work in this area is an urgent necessity, especially between Kalimalang river to Jakarta-Cikampek Toll Road section. The Bridge passing Jakarta-Cikampek Toll Road is 1.5 lanes and must be widened to support 2 lanes of traffic.
At grade intersection on Jl. Kalimalang. Improvement work is needed.
Narrow part of Jl. Bali must be widened.
Bridge on Jakarta-Cikampek Toll Road. New bridge is needed parallel to existing bridge.
Source: Preparatory Survey on Arterial Road Improvement in Jakarta Metropolitan Area Figure 2.4.23 Existing Condition for Jl. Bali
3) Jl. Iman Bonjol
At grade intersection on Jl. Kalimarang and connecting road to Kalimarang River must be improved on Jl. Iman Bonjol A New bridge connecting Jl. Kalimarang and the south side of the toll road is recommended to maintain smooth access to the existing industrial estate.
Source: Preparatory Survey on Arterial Road Improvement in Jakarta Metropolitan Area Figure 2.4.24 Existing Condition for Jl. Iman Bonjol
Jl. Iman Bonjol shall be widened for heavy trucks.
Existing bridge condition on Jakarta-Cikampek toll road.
At grade intersection for Jl. Kalimalang. A new bridge and intersection improvements are needed.
The Study on Efficient and Integrated Transport/Logistics Development in Eastern MPA
2-63
4) Dry Port Access Road
The dry port access road is composed of JABABEKA Dry Port, a new Jakarta - Cikampek Interchange and an access road from the interchange to the south side of the industrial estates. Designs for an access road between JABABEKA Dry Port and New Cikampek Toll Road interchange have been completed and construction is in progress. However, the area south of the toll road has yet to be implemented. Coodination among stakeholders is recommended as soon as possible to ensure smooth implentation of the proposed access road,
Source: JABABEKA
Figure 2.4.25 Existing Condition for Dry Port Access
5) MM2100-EJIP Access Road
MM2100-EJIP Access Road is very important to formulating a ring road for Jakarta Eastern Industrial Estates. Traffic movement between MM2100-EJIP must be made a toll road or detour road. This detouring can be solved by the construction of a ring road, which will contribute to time mitigation. For the purpose of early implementation, stakeholders must reach agreement for implementation, including finding a source of funding.
MM2100
EJIP
Dry port Access Road
New Interchange
The Study on Efficient and Integrated Transport/Logistics Development in Eastern MPA
2-64
Source: Preparatory Survey on Arterial Road Improvement in Jakarta Metropolitan Area
Figure 2.4.26 Existing Condition for MM2100-EJIP Access Road
6) Delta Mas-Jakarta-Cikampek Access Road and New Interchange
Delta Mas-Jakarta-Cikampek Toll Access Road and new Interchange is a very important road from which to construct a ring road within the Jakarta Eastern Industrial Estates. Construction work is in progress and will be completed by 2014. This access road will provide good access from the toll road to Cikarang Dry Port, and Delta-Mas Interchange, contributing to smooth traffic within the industrial estate.
Source: Preparatory Survey on Arterial Road Improvement in Jakarta Metropolitan Area Figure 2.4.27 Existing Condition for Delta Mas-Jakarta-Cikampek Access Road and New Interchange
MM2100 -
EJIP Access
Lipo, Hyundai Delta Mas
Delta Mas-Jakarta-Cikampek Access
Road and New Interchange
The Study on Efficient and Integrated Transport/Logistics Development in Eastern MPA
2-65
2.4.5 Missing Link of Jakarta Outer Ring Road: W2 Section and Future Prospects
Present Condition of Toll Road Network in Jakarta Metropolitan Area (1)
Northern part of W2 Section of Jakarta Outer Ring Road has not been completed thus the JORR does not function as circumferential road.
Source: Arterial Road Development Project in Jakarta Metropolitan Area Figure 2.4.28 Toll Road Network in Jakarta Metropolitan Area
Future Prospects for Road Development Schedule of Jakarta Outer Ring Road (2)
Construction of the W2 section of the Jakarta Outer Ring Road has been delayed due to the land acquisition problem. However, when this section is completed, traffic flow of trucks and trailers will be dramatically changed and it will be much easier to transport goods from Tangerang area in the western part of the Jakarta Metropolitan Area to Tanjung Priok Port and Cilamaya Port through toll road network.
2.5 Understanding the Present Condition and Perspective of Good Railway Transportation
2.5.1 Present Condition
From the viewpoint of the railway relative to the eastern area, there are 2 logistic bases, namely Tanjung Priok Seaport, and Cikarang Dry Port. In the case of Tanjung Priok Seaport, furthermore, railway transport that copes with the expansion of JICT (Jakarta International Container Terminal) in the short term and another expansion on North Kalibaru, which are under construction offshore of Tanjung Priok Seaport in the long period, are considerable tasks.
Meanwhile, as for outside the Eastern region, railway transport for the Western, to Merak and for the further Eastern, Gede Bage, Surabaya and the like, through Cikarang Dryport are operated now.
Jakarta Outer Ring Road W2 Section
Tanjug Priok Access Road
The Study on Efficient and Integrated Transport/Logistics Development in Eastern MPA
2-66
Present railway transport for containers originates at Pasoso Station adjacent the Tanjung Priok Seaport and connects some stations on Java Island only by 10 freight trains daily, as mentioned later. However, there are problems of transport capacity, frequency, and double-handling in the present railway transport system, and resolutions on these problems are required.
On the other hand, regarding road transport in this area, the major highways connecting Tanjung Priok Seaport and Cikarang, Bekasi areas are all congested chronically. And they have serious problems in the road routes for large-scale sea container transport, too. The Tanjung Priok access road that is under construction is expected to improve these problems drastically.
Railway’s role required from the seaport is to bring out containers from the container terminals as promptly as possible to complement road traffic with heavy congestion. However, it is very difficult to find out advantage in the freight railway transport in the case of the Eastern area because the distance from Cikarang Dryport as the starting point to Tanjung Priok Seaport is around 60 km, and to Cilamaya New Seaport, around 40 km.
In the mean time, it is estimated that the amount of O/D containers inside the Eastern area might be extremely bigger than the one outside the area. Then, the freight railway has no other choice but to challenge high frequency operation for short distance, and large scale transport (heavy haul train) for long distance, that is to say, out of this region should be considered in order to cope with the requirement from the seaport. And it is also required to provide railway facilities and rolling stocks (locomotive and freight wagon). Fig. 2.5.1 illustrates the existing JABODETABEK Railway network.
Angke
Duri
Tangerang
Gambir
Tanahabang
Jatinegara Bekasi
Nambo
Bogor
Depok
Citayam
Kemayoran
Jakartakota
Tanjungpriok
Kampungbandan
ManggaraiCikarang
Ancol
Dry Port
Serpon
ParungpanjangRangkas
bitung
Pasarsenen
Pondokjati
Source: The Study on Efficient and Integrated Transport/Logistics in Eastern MPA Figure 2.5.1 JABODETABEK Railway Network and Cikarang Dry Port
The Study on Efficient and Integrated Transport/Logistics Development in Eastern MPA
2-67
Existing Transport Capacity of Freight Railway (1)
There are 10 trains every day, which start from Tanjung Priok. The detailed data is shown in Table 2.5.1. These trains all start from Pasoso Station. Most of the trains (8 trains) terminate at Surabaya Pasaturi Station and 2 trains at Gede Bage Dry Port.
Meanwhile, one train to Cikarang Dry port is arranged as a stop-off train for Surabaya.
This stop of the train is indicated at Lema Abang Station in Table 2.5.1. It is why the dry port is located in the branch line starting at Lema Abang Station. The train is operated in switchback from the station, and the dry port station is managed under the Lema Abang station master.
According to the table, it takes around 1 hour from Pasoso Station to Cikarang Dry Port (Lema Abang station) and it seems to be a relatively short time. But after that, it requires almost 2 hours for the switch back operation, train shunting works, and un-loading process.
As an additional reference, each train operation is contracted for 2 years between the client and PT.KAI, that is to say, train basis sales, not container basis. One train has a 20 freight-wagon formation and the transport capacity is equivalent to 40 TEU/train.
The Study on Efficient and Integrated Transport/Logistics Development in Eastern MPA
2-68
Table 2.5.1 Freight Train Timetable, Year 2013 (Tanjung Priok)
Cancelled/Not Operated Tpk: Tanjung Priok (Pasoso) Cn.: Cirebong JPT3: JATIM PETROLEUM TRANSPORT 3Sbi: Surabaya Pasaturi Sm: Semarang BW1: BUMI WIJAYA INDORAILGdb: Gede Bage ADT: ADITYA DEFA TRANSINDOJakg: Jakarta Gedang LOG3: KERETA API LOGISTIKKpb: Lmb:
Pasoso Station is located in an area behind Tanjung Priok Seaport and is the so-called junction between the seaport and the railway. Even though an old track trace is connected with the seaport from the station, it has not been activated yet. However, a discussion about how to connect or expand rail track to the container terminal in JICT has started again recently. Especially regarding rail track expansion to JICT, mutual consent between both sides of the seaport and railway has been created. (DGR Information).
It might take time to gain a concrete result on the subject though. It is expected that the seaport side who hate double handling at the railway station would propose some effectual compromise plan (sharing some container terminal land with the
A train for Cikarang Dry Port
The Study on Efficient and Integrated Transport/Logistics Development in Eastern MPA
2-69
Source: The Study on Efficient and Integrated Transport/Logistics Development in Eastern MPA Figure 2.5.2 Pasoso Station and Container Terminal (JICT)
Pasoso Station(Railway Terminal)
JICT
タ
Railway ROW Railway ROW
The Study on Efficient and Integrated Transport/Logistics Development in Eastern MPA
2-70
Source: The Study on Efficient and Integrated Transport/Logistics Development in Eastern MPA
Figure 2.5.3 Railway Right of way in front of JICT Terminal in Tanjung Priok Area
Source: The Study on Efficient and Integrated Transport/Logistics Development in Eastern MPA
Figure 2.5.4 Current Situation of PointA (Rail track is remained, but not used)
Source: The Study on Efficient and Integrated Transport/Logistics Development in Eastern MPA
Figure 2.5.5 Current Situation of PointB (Rail track is underground)
Railway ROW A B
The Study on Efficient and Integrated Transport/Logistics Development in Eastern MPA
2-71
End Side Existing Side Loading Work
Source: The Study on Efficient and Integrated Transport/Logistics Development in Eastern MPA Figure 2.5.6 Pasoso Station Yard
Pasoso Station faces a wide road in front of the gate and it looks like the situation has no problem regarding road access. But the station has a very narrow yard with a single loading track. The condition is not evaluated as good because loading work efficiency is not necessarily good with a single reach stacker.
The railway facilities, like the tracks, are PT.KAI’s property but the loading yard is owned by PELINDO. Furthermore, the yard is divided into 2 yards for management reasons; the end side is managed by MTI (Multi Terminal Indonesia), which is a daughter company of PELINDO, and the other side is managed by JPT (Jatim Petroleum Transport). The loading machine is owned by JPT.
In this yard, therefore, loading work is very complicated, switching the yard and shunting and moving trains by following the client demand. As the result, it takes around 3 hours 20 minutes on average to work on a single train.
It is required for PT.KAI not only to invest in loading facilities but also to consider over soft aspect on the yard management.
Dry Port (3)
There are so-called dry port facilities located on Java Island, as shown in Table 2.5.2. This refers to a report issued by ESCAP (the United Nations Economic and Social Commission for Asia and the Pacific) in the year 2006.
This report defines that the dry port is connected directly with seaport with road and railway and attached with import and export facilities. In other words, the dry port is adjacent to an inland area of demand. And the dry port is not only a container handling yard but also has some functions as a “One-Stop-Window” for the customers. It should be also convenient for the customers as if they can process all at the actual seaport.
The Study on Efficient and Integrated Transport/Logistics Development in Eastern MPA
Source: ESCAP REPORT (DEVELOPMENT OF DRYPORTS IN INDONESIA)
In this table, dry ports which are connected with railway tracks are Cikarang, Gede Bage, Cibungur, and Solo. Rambipuji Dry Port near Jember, East Java, is not shown in this table, which was opened for tobacco (cigarette) materials and has closed already. Moreover, Solo (Jebres) Dry Port in this table had been used for textiles but now is closed temporarily. Cilegon, which is categorized as a dry port in this table, is really connected with railway track but is a container yard exclusive to PT. Krakatau Steel.
Dry ports connected with railway track are shown in the Figure 2.5.7.
: Operated : Not Operated
Source: ESCAP Report (Introduction to the Development of Dry Ports in Asia) Figure 2.5.7 Dry Port Connected with Railway Track on Java Island
1) Other Dry Port
Excepting dry ports connected with railway track in the table, it has been reported recently that some movement between PT.KAI and some clients occurs at Surabaya and Semarang area.
MADURA
BALI
SUMATORA
JAKARTA
CIKAMPEK
BANDUNG
CIREBON
PURWOKERTO
KROYA
YOGYAKARTASOLO
MADIUN
SEMARANG
SURABAYA
JEMBER
MERAK
SERPONG
TANGERANG
BOGOR
CIKARANG
CILACAP
PRUPUK
MAOS
TEGAL
JATIBARANG
KEDUNGIATIGUNDIH
GAMBRINGANCEPU
BOJONEGORO
KERTOSONA
TULUNG AGUNGBLITAR
MALANG
BANGIL
JOMBANG
PROBALINGGO
KLAKAN
SITUBONDO
BANYUWANGI
SERANG
RANGKAS BITUNG
BANJAR
JAVA
PADALARANG
CICALENGKA
SIDOARJO
LAMONGAN
PORONG
PURWAKARTA
TANJUNG PRIOK CILAMAYA
Cikarang Cibungur Semarang Surabaya
SoloGede Bage
Cilegon
The Study on Efficient and Integrated Transport/Logistics Development in Eastern MPA
2-73
Anyway, the transport and logistics bases in the Eastern area, Cikarang and Gede Bage, are acting as main roles for Tanjung Priok territory, as shown in the ESCAP report (Fig.2.5.8).
Source: ESCAP Report (Introduction to the Development of Dry Ports in Asia)
Figure 2.5.8 Tanjung Priok Seaport and Dryports
2.5.2 Perspective (Railway)
Regarding railway infrastructure on Java Island is under improving in various districts, that is to say, Double tracking is Java North and South line and double-double tracking in Bekasi Line.
It is expected that the railway infrastructure would be improved remarkably in the track (transport) capacity in the JABODETABEK Eastern Area and the whole Java Island as well.
Railway infrastructure is improved and reinforced under the state government responsibility in Indonesia. Meanwhile, all locomotive operations, freight wagon operations, and maintenance personnel should be provided by and be the responsibility of the railway operator, PT.KAI. Unfortunately, it should be recognized that so much late preparation of rolling stock or locomotive and freight wagons forces actual railway capacity to be behind transport demand in the actual condition.
Railway Track Capacity (1)
Ongoing railway infrastructure improvement or reinforcement undertakings, namely track capacity reinforcement, are shown in Table 2.5.3.
The Study on Efficient and Integrated Transport/Logistics Development in Eastern MPA
2-74
Table 2.5.3 Major Double Tracking Project(Java Island)
Track Reinforcement Project Section Completion Year
Scope Remarks
Electrification/Double-Double Tracking of Java Main Line
Manggarai ~ Bekasi 2016 - Double-double tracking: between Mangarai and Bekasi Station to separate commuter and long distance trains.
- Electrification: between Manggarai and Cikarang
Yen Loan Undertaking
Double Tracking of Java South Line
Kroya ~ Kutoarjo 2018 - This project is carried out following Yogyakarta and Kutoarjo
Yen Loan Undertaking Section between Cirebon and Kroya will be executed for double tracking by local budget.
Double Tracking of Java North Line
Cirebon ~ Surabaya 2014 - Entire Completion in 2013 is dragged on into 2014.
Local Budget
JABODETABEK Elevated Loop Line
The East and West lines are connected, elevated as a loop line.
2018 - Existing tracks are elevated as a commuter line. It may be possible to use the ground track for freight train. (note)
Local Budget
(note) Elevated commuter service railway means dissolution of the level crossing. Therefore, transferring the ground tracks to freight
trains shall be discussed particularly for dissolution of level crossing (ex. Under pass).Serpong line is also under double tracking project by local budget.
Source: The Study on Efficient and Integrated Transport/Logistics in Eastern MPA
Track capacity in JABODETABEK area where commuter or passenger trains and freight trains are operated in parallel is as follows. (Table 2.5.4)
Table 2.5.4 Track Capacity in Double-double Tracking in Bekasi Line (Estimation)
Description Train Number(Trains/day)
Difference Before(2000~)
After(2016~)
Long Distance Passenger Train 154 190 +36 Local Passenger Train 36 34 - 2 Commuter Train 68 140 +72 Freight Train 38 47 +9 Total 296 411 +115
Source: DGR
It might be possible to increase freight trains by around 10 trains in comparison with the present number from the data.
In addition, even though track capacity in the whole of Java Island should be reviewed on another occasion, it is estimated optimistically that the track capacity would be enough to be divided for increasing freight trains.
The Study on Efficient and Integrated Transport/Logistics Development in Eastern MPA
3-1
3. FORECAST OF TRANSPORTATION AND LOGISTICS IN THE EASTERN MPA
3.1 Study Area
General Issues on Demand Forecast 3.1.1
Study Flow of Demand Forecast (1)
The study flow of the demand forecast is as follows. The demand forecast is calculated by utilizing the
freight OD survey (the targets of the survey are factories) and the stated preference survey on the port,
which were conducted in this study.
The Study on Efficient and Integrated Transport/Logistics Development in Eastern MPA
3-2
Source: The Study on Efficient and Integrated Transport/Logistics Development in Eastern MPA
Figure 3.1.1 Study Flow of Demand Forecast
Future demand forecast of the port (Tanjung Priok/Cilamaya)
Level of Service between each zone and port (Travel Time, Transport cost and Port of call frequency etc.)
Traffic Assignment Calculation
Freight OD Survey (Sample Survey)
Stated Preference Survey on the port
Direktori Industri Manufaktur Indonesia2012
Current Freight OD:only to and from port (Without Cilamaya New Port)
Creation of Port Choice Model (Tanjung Priok/Cilamaya)
Future Freight OD:only to and from port (Without Cilamaya New Port)
Future Freight OD: only to and from port (With Cilamaya New Port)
Future Road Network
Tanjung Priok Port Survey (Control Total)
Correction
Increasing rate of industrial estate area by region
Correction
Magnification
The rate of in-and-out cargo volume at Tanjung Priok Port
Correction
Port Handling Volume (TEU) (Control Total)
Correction
The Study on Efficient and Integrated Transport/Logistics Development in Eastern MPA
3-3
Zone System (2)
The zone system covers JABODETABEK area and Kab. Karawang. In consideration of the purpose in
each step of the demand forecast, the zone system consists of two classes, as follows.
Table 3.1.1 Zone System
Class Purpose Method The number of Zones
Big Zone
The basic characteristics of the freight transportation between each zone and port are figured out by this zone unit. Basic unit to set magnification factor.
Integrating some Kota/Kabupaten 5 zones
Small Zone
Basic unit to calculate the level of service between each zone and port.
Integrating some Kechamatan 38 zones
Source: The Study on Efficient and Integrated Transport/Logistics Development in Eastern MPA
Source: The Study on Efficient and Integrated Transport/Logistics Development in Eastern MPA
Figure 3.1.2 Zone System
The Study on Efficient and Integrated Transport/Logistics Development in Eastern MPA
3-4
Creation of Port Choice Model 3.1.2
Port Choice Model and Results of Parameter Estimation (1)
<Port Choice Model>
The port choice model is created by the results of the SP survey, as follows.
This model consists of 4 variables such as freight cost, travel time, and port call.
Binary Logit Model
P1 : Choice probability of Jakarta port
P2 : Choice probability of Cilamaya port
V1 : Utility function of Jakarta port
V2 : Utility function of Cilamaya port
F param: Frequency of port call parameter
T param: Transit time parameter
C param: Freight cost parameter
D param: Area dummy variable parameter
V1 = F param * Frequency + T param * Transit time + C param * freight cost + D param * Area dummy V2 = F param * Frequency + T param * Transit time + C param * freight cost
The Study on Efficient and Integrated Transport/Logistics Development in Eastern MPA
3-5
<Results of Parameter Estimation>
・ Results show that “Transit time” and “Freight cost” have significant impact on these port choices. ・ In addition, this model seems to give statistically significant results. (The accuracy of each parameter
[Modulus of t value > 1.96] , Accuracy of the entire model’s [likelihood ratio > 0.2]) ・ Thus, it is possible to determine that the present model is able to reflect the intentions of cargo
owners. Table 3.1.2 Results of Parameter Estimation
Observation sample numbers: 708 Model accuracy: likelihood ratio 0.791
Source: The Study on Efficient and Integrated Transport/Logistics Development in Eastern MPA
【Reference】Comparison of each parameter value All parameter values cannot be compared because the unit of each value is different. The difference between parameter values is as follows. Port call 1.29 times/week ≒ Transit time 1hour ≒ Freight cost Rp.440,000
Parameter Estimate T – statistic
Frequency of port call (times/week) 0.898424 2.635
The Study on Efficient and Integrated Transport/Logistics Development in Eastern MPA
3-6
Port Choice Probability (Only Main Area) (2)
Sensibility analysis of port choice probability can be done by estimated parameters. Four (4) cases about
the main industrial area are shown below.
Table 3.1.3 Case of Sensibility Analysis
Case Definition of LOS* data Base case Freight Cost Based on basic unit per unit distance of same level of
Tj Priok Port Travel Time Current road condition Port Call Once a week (Same as the Tj Priok Port)
Case 1 Freight Cost 20% reduction(Improvement of truck turnover ratio by resolved traffic congestion)
Travel Time Same as base case Port Call Same as base case
Case 2 Freight Cost Same as base case Travel Time 50% reduction of time in port (Reduction of dwell time
and load time in the port by sophistication of Cilamaya Port procedure)
Port Call Same as base case Case 3 Freight Cost Same as base case
Travel Time Same as base case Port Call Once in two weeks
*LOS: Level of Service
Source: The Study on Efficient and Integrated Transport/Logistics Development in Eastern MPA
The Study on Efficient and Integrated Transport/Logistics Development in Eastern MPA
3-7
Base Case
Figure 3.1.3 Base Case
If the Cilamaya Port was opened under the same level of service as the Tanjung Priok Port, it shows that it would be chosen by most cargo owners in Jakarta’s Eastern area.
Source:
(Base map) Google HP
(Figure) The Study on Efficient and
Integrated Transport/Logistics
Development in Eastern MPA
The Study on Efficient and Integrated Transport/Logistics Development in Eastern MPA
3-8
Case 1: Freight Cost Reduction
Figure 3.1.4 Case1
The port choice probability of Cilamaya Port will significantly increase with a 20% reduction of freight cost, especially the Jakarta Timur and Bogor area.
Source:
(Base map) Google HP
(Figure) The Study on Efficient and
Integrated Transport/Logistics
Development in Eastern MPA
The Study on Efficient and Integrated Transport/Logistics Development in Eastern MPA
3-9
Case 2: Reduction of Times in Cilamaya Port
Figure 3.1.5 Case2
The Port choice probability of Cilamaya Port will increase, especially in Bogor and Kab Bekasi area, by 50% reduction of the time in the Cilamaya Port (such as dwell time, load time, and so on) because of sophistication of port procedures.
Source:
(Base map) Google HP
(Figure) The Study on Efficient and
Integrated Transport/Logistics
Development in Eastern MPA
The Study on Efficient and Integrated Transport/Logistics Development in Eastern MPA
3-10
Case 3: Low Port Call
Figure 3.1.6 Case3
The port choice probability of Cilamaya Port will decrease, especially in Kab Bekasi area, by lower than port call of Tj Priok port (from “once a week” to “once every 2 weeks”).
Source:
(Base map) Google HP
(Figure) The Study on Efficient and
Integrated Transport/Logistics
Development in Eastern MPA
The Study on Efficient and Integrated Transport/Logistics Development in Eastern MPA
3-11
3.2 Demand Forecast of Cargo Transportation in Eastern Area
Analysis Case Set (1)
The analysis case sets are the three following cases. The years of demand forecast are 2020 and 2030.
Table 3.2.1 Analysis Case Set
Case A Case B Case C Year 2020 2020 2030 R
oad network conditions
i) Cilamaya access road ○ ○ ○ ii) Outer outer ring road ○ ○ ○ iii) Tanjung Priok access
road ○ ○ ○
iv) Second Jakarta – Cikampek road ○(phase-1) ○(whole) ○(whole)
v) Improving access to Cikampek toll road ○ ○ ○
Access conditions to Cilamaya port Same as the base case in the sensitivity analysis(Table 3.1.3 Reference)
Same as the base case in the sensitivity analysis(Table 3.1.3 Reference)
Same as the base case in the sensitivity analysis(Table 3.1.3 Reference)
Source: The Study on Efficient and Integrated Transport/Logistics Development in Eastern MPA
The Study on Efficient and Integrated Transport/Logistics Development in Eastern MPA
3-12
Source: The Study on Efficient and Integrated Transport/Logistics Development in Eastern MPA
Figure 3.2.1 Road Network
Creation of the Current Cargo Car OD Table (2)
There is a need to increase all office-based OD because the freight OD survey is a sample survey.
This study set the magnification factor from Direktori Industri Manufaktur Indonesia 2012. The
magnification factors were classified by area and industry type.
Table 3.2.2 rea Classification
Region Area Contained 1 DKI Jakarta Pusat, Jakarta Utara, Jakarta Barat, Jakarta Selatan, Jakarta Timur 2 West Kab. Tangerang, Kota Tangerang, Kota Tangerang Selatan 3 South Kab. Bogor, Kota Bogor, Kota Depok 4 East Kab. Bekasi, Kota Bekasi 5 Karawang Kab. Karawang
Source: The Study on Efficient and Integrated Transport/Logistics Development in Eastern MPA
i) Cilamaya access road ※Interim alignment
iii) Tanjung Priok access road
v) Improving access to Cikampek toll road
iv) Second Jakarta – Cikampek road
ii) Outer outer ring road
The Study on Efficient and Integrated Transport/Logistics Development in Eastern MPA
3-13
Table 3.2.3 Industry Classifications
Type of Industry Industries included 1 Miscellaneous
and Light Industry
Food Industry Beverages Textiles Wearing Apparel Leather and Related Products and Footwear Wood and of Products of Wood and Cork, Except Furniture- Articles of Straw and Plaiting Materials, Bamboo, Rattan, and the like Paper and Paper Products Printing and Reproduction of Recorded Media Manufacture Of Furniture
2 Chemical Coke and Refined Petroleum Products Chemicals and Chemical Products Pharmaceuticals, Medicinal Chemical and Botanical Products Rubber and Plastic Products Other Non Metallic Mineral Products
3 Metal Basic Metals FABRICATED METAL PRODUCTS, EXCEPT MACHINERY AND EQUIPMENT
4 Machinery COMPUTERS, ELECTRONIC AND OPTICAL PRODUCTS ELECTRICAL EQUIPMENT MACHINERY AND EQUIPMENT N.E.C Motor Vehicles, Trailers And Semi-Trailers Other Transport Equipment
5 Other Other Manufacturing Repair and Installation of Machinery and Equipment
Source: The Study on Efficient and Integrated Transport/Logistics Development in Eastern MPA
Setting of Control Total (3)
In this forecast, our study team conducted step-by-step calculations for correcting cargo OD by 4 steps.
・ Step 1: Correction of vehicle volume by type of vehicles ・ Step 2: Reflection of rate of increase by area ・ Step 3:Correction of port cargo volume by in/out rate ・ Step 4:Correction of handling cargo volume (TEU/Year)
Step 1:Correction of Vehicle Volume by Type of Vehicles
In this forecast, our study team corrected the current cargo OD table by utilizing Cargo Traffic Survey
data (implemented in July, 2013) at Tanjung Priok Port as Step 1.
The Study on Efficient and Integrated Transport/Logistics Development in Eastern MPA
3-14
This traffic survey was implemented for 3 days, July 4th - 6th (Thursday - Saturday). Our team
interviewed regarding such things as transport direction and transportation items for grasping the traffic
volume by type of vehicle.
The numbers (daily mean) of cargo vehicles are as follows.
Table 3.2.4 Numbers of Cargo Vehicles by Type of Vehicles(Daily Mean)
Area 2 Axles 3 Axles Over 4 Axles(except for Containter)
20ft Container
40ft container Total
DKI 175 259 471 479 708 - West 53 104 78 437 552 - South 24 143 32 98 183 - East +Karawang 52 98 270 639 1,020 -
Source: The Study on Efficient and Integrated Transport/Logistics Development in Eastern MPA
Step 2:Reflection of Rate of Increase by Area
In this forecast, our study team reflects the rate of increase by area to the current cargo OD.
Because the industrial estate area is being developed in the east of JABODETABEK area in recent years,
it should be reflected this development trend for future cargo OD table.
Therefore, future current cargo OD was corrected by the rate of increase by area that is calculated from
secular change of industrial estate area (2006-2011) in JABODETABEK.
The Study on Efficient and Integrated Transport/Logistics Development in Eastern MPA
3-15
Table 3.2.5 Setting of the Rate of Increase
Year Industrial Estate Area (ha) Rate of Increase (compare to 2013)
DKI WEST SOUTH EAST+ Karawang DKI WEST SOUTH EAST+
The Study on Efficient and Integrated Transport/Logistics Development in Eastern MPA
3-16
Based on the above results, export cargo volume is calculated by import cargo volume; it is set as a
control total for 85% of import cargo volume (667,436 / 777,998 = 0.858).
Table 3.2.6 JICT Monthly Cargo Volume
2012 Jul Aug Sep Oct Nov Dec Unloading 69,149 45,044 69,140 68,116 68,022 64,227 Loading 58,129 47,030 56,790 57,586 56,045 60,016 Monthly Volume 127,278 92,074 125,930 125,702 124,067 124,243 2013 Jan Feb Mar Apr May Jun
Source: The Study on Efficient and Integrated Transport/Logistics Development in Eastern MPA
The Study on Efficient and Integrated Transport/Logistics Development in Eastern MPA
3-17
≪Comment:Rate of In-and-Out Volume≫
<International Cargo>
■Port to Factory【Import Cargo】
■Factory to Port【Export Cargo】(85% of Import Cargo)
<Domestic Cargo>
■Port to Factory(Account for 49% of Domestic Cargo)
■Factory to Port(Account for 51% of Domestic Cargo)
Source: The Study on Efficient and Integrated Transport/Logistics Development in Eastern MPA
Figure 3.2.2 Rate of In-and-Out Volume (Image)
Tanjung Priok Port
Factory
Tanjung Priok Port
Factory
Tanjung Priok Port
Factory
Tanjung Priok Port
Factory
Factory OD Survey (Sampling Survey)
Cargo Traffic Survey(Daily Total Inspection)
Factory OD Survey (Sampling Survey)
Factory OD Survey (Sampling Survey)
Factory OD Survey (Sampling Survey)
Cargo Traffic Survey(Daily Total Inspection)
The Study on Efficient and Integrated Transport/Logistics Development in Eastern MPA
3-18
Step 4: Correction of Handling Cargo Volume (TEU/Year)
In this forecast, our study team utilized the handling cargo volume (TEU) of Tanjung Priok port as step 4.
The future growth rate of freight cargo is set from the handling volume of the port in “DRAFT FINAL
REPORT FOR THE PREPARATORY SURVEY ON CILAMAYA NEW PORT DEVELOPMENT
PROJECT IN THE REPUBLIC OF INDONESIA (December 2012)”
The targeted cargo vehicles carry only 20 ft. and 40 ft. containers. It is calculated that the 20 ft. container
is 1 TEU, and the 40 ft. container is 2 TEU.
Table 3.2.8 Handling Cargo Volume(TEU/Year)
TEU/Year
Handling Volume (1,000TEU/Year)
2012 6,215 * Current Status 2020 10,209 2030 19,360
Source: The Study on Efficient and Integrated Transport/Logistics Development in Eastern MPA
Our study team estimated the demand of handling cargo volume (TEU) and container volume in each port
by 4 steps correction of current cargo OD, if Cilamaya port is constructed in the future.
Here are the results of the current and future cargo volume data.
The Study on Efficient and Integrated Transport/Logistics Development in Eastern MPA
3-19
Results of Estimated Current Cargo Volume (4)
Based on the above studies, the current cargo volume is estimated by cargo volume (TEU) and number of vehicles.
Table 3.2.9 Estimated Current Cargo Volume (TEU/Year-2012)
Inter /Dom Direction Area Handling Cargo Volume(TEU)
International Factory → Port DKI 146,032
2,112,000
West 113,754 South 34,004 East 637,013 Karawang 48,433 Total 979,237 Port→ Factory DKI 21,793 West 192,656 South 69,320 East 805,872 Karawang 43,122 Total 1,132,763Domestic Factory → Port DKI 574,594
4,103,000
West 475,092 South 144,684 East 594,513 Karawang 107,763 Total 1,896,645 Port → Factory DKI 654,524 West 521,667 South 155,981 East 686,738 Karawang 187,446 Total 2,206,355
Source: The Study on Efficient and Integrated Transport/Logistics Development in Eastern MPA
The Study on Efficient and Integrated Transport/Logistics Development in Eastern MPA
3-20
Table 3.2.10 Estimated Current Cargo Volume (Number of Vehicles/Year-2012) Inter /Dom Direction Area 2 axles 3 axles 4 axles (except
for Containter) 20 ft. Container 40 ft. Container Total
International Factory → DKI 39,486 63,777 64,591 132,565 6,734 307,153 Port West 464 26,935 17,655 48,992 32,381 126,427 South 2,668 29,812 4,269 12,528 10,738 60,015 East 0 3,584 40,112 47,650 294,682 386,028 Karawang 8,572 13,398 23,861 2,796 22,818 71,446 Total 51,191 137,507 150,488 244,530 367,353 951,069
Port→ DKI 0 28,791 0 21,793 0 50,584 Factory West 0 0 0 23,415 84,621 108,036 South 0 0 0 26,197 21,561 47,759 East 7,598 0 6,113 23,184 391,344 428,239 Karawang 0 6,438 0 43,122 0 49,560 Total 7,598 35,229 6,113 137,712 497,526 684,178
Domestic Factory → DKI 11,586 10,123 69,238 123,488 225,553 439,987 Port West 14,803 2,866 4,946 130,742 172,175 325,532 South 4,127 11,052 4,886 29,445 57,619 107,129 East 6,160 3,880 333 184,958 204,777 400,109 Karawang 0 7,180 12,412 9,138 49,312 78,043 Total 36,675 35,102 91,815 477,771 709,437 1,350,800
Port→ DKI 59,714 62,117 165,008 164,513 245,005 696,357 Factory West 18,766 36,249 27,343 149,020 186,323 417,701 South 8,513 57,458 11,223 32,326 61,827 171,347 East 10,370 27,654 21,924 208,735 239,001 507,686 Karawang 0 0 65,216 6,793 90,326 162,335 Total 97,363 183,478 290,713 561,387 822,484 1,955,425
Source: The Study on Efficient and Integrated Transport/Logistics Development in Eastern MPA
The Study on Efficient and Integrated Transport/Logistics Development in Eastern MPA
3-21
Future Forecast of Cargo Volume (5)
The future forecast of two ports (Tanjung Priok or Cilamaya new Port) by port choice model is as follows.
The cargo volume of Tanjung priok port is bigger than one of Cilamaya new port on all area because the
level of service for Tanjung priok port is better than one for Cilamaya new port.
But the Eastern area, which includes MPA East and Karawang, is located near Cilamaya, then cargo
volume of Cilamaya New Port is greater than that of Tanjung Priok Port in the Eastern area.
In the future, the Eastern area which is near Cilamaya new port will grow as factory area. As a result, the
demand for Cilamaya new port will increase.
Table 3.2.11 Future Forecast of Cargo Volume (TEU/Year, Base Case)
Area Tanjung Priok Port Cilamaya Port
Total Rate Rate
Case A DKI 2,134,090 99.87% 2,810 0.13% 2,136,901 (2020) West 2,113,265 99.94% 1,305 0.06% 2,114,571 South 574,150 96.06% 23,567 3.94% 597,717 East 2,184,902 46.98% 2,465,462 53.02% 4,650,363 Karawang 16,029 2.26% 693,420 97.74% 709,449 Total 7,022,436 68.79% 3,186,564 31.21% 10,209,000
Case B DKI 2,133,418 99.84% 3,483 0.16% 2,136,901 (2020) West 2,113,568 99.95% 1,003 0.05% 2,114,571 South 564,947 94.52% 32,770 5.48% 597,717 East 2,517,196 54.13% 2,133,167 45.87% 4,650,364 Karawang 21,785 3.07% 687,662 96.93% 709,449 Total 7,350,914 72.00% 2,858,086 28.00% 10,209,000
Case C DKI 3,369,211 99.72% 9,478 0.28% 3,378,689 (2030) West 3,764,066 99.93% 2,748 0.07% 3,766,814 South 856,736 91.22% 82,413 8.78% 939,148 East 2,470,569 25.29% 7,298,654 74.71% 9,769,222 Karawang 13,188 0.88% 1,492,938 99.12% 1,506,127 Total 10,473,770 54.10% 8,886,230 45.90% 19,360,000
Source: The Study on Efficient and Integrated Transport/Logistics Development in Eastern MPA
The Study on Efficient and Integrated Transport/Logistics Development in Eastern MPA
3-22
Table 3.2.12 Future Forecast of Cargo Volume (TEU/Year, Case1)
Area Tanjung Priok Port Cilamaya Port
Total Rate Rate
Case A DKI 2,130,457 99.70% 6,444 0.30% 2,136,901 (2020) West 2,111,692 99.86% 2,879 0.14% 2,114,571 South 569,752 95.32% 27,965 4.68% 597,717 East 1,858,175 39.96% 2,792,189 60.04% 4,650,364 Karawang 19,095 2.69% 690,353 97.31% 709,449 Total 6,689,170 65.52% 3,519,830 34.48% 10,209,000
Case B DKI 2,128,881 99.62% 8,020 0.38% 2,136,901 (2020) West 2,112,301 99.89% 2,269 0.11% 2,114,571 South 557,935 93.34% 39,780 6.66% 597,717 East 2,207,602 47.47% 2,442,761 52.53% 4,650,363 Karawang 26,237 3.70% 683,212 96.30% 709,449 Total 7,032,957 68.89% 3,176,043 31.11% 10,209,000
Case C DKI 3,361,123 99.48% 17,567 0.52% 3,378,689 (2030) West 3,760,514 99.83% 6,299 0.17% 3,766,814 South 814,780 86.76% 124,369 13.24% 939,148 East 1,970,216 20.17% 7,799,007 79.83% 9,769,223 Karawang 15,836 1.05% 1,490,291 98.95% 1,506,126 Total 9,922,468 51.25% 9,437,532 48.75% 19,360,000
Source: The Study on Efficient and Integrated Transport/Logistics Development in Eastern MPA
The Study on Efficient and Integrated Transport/Logistics Development in Eastern MPA
3-23
Table 3.2.13 Future Forecast of Cargo Volume (TEU/Year, Case2)
Area Tanjung Priok Port Cilamaya Port
Total Rate Rate
Case A DKI 2,127,919 99.58% 8,981 0.42% 2,136,901 (2020) West 2,110,380 99.80% 4,190 0.20% 2,114,571 South 563,993 94.36% 33,722 5.64% 597,717 East 1,171,211 25.19% 3,479,152 74.81% 4,650,363 Karawang 5,186 0.73% 704,263 99.27% 709,449 Total 5,978,690 58.56% 4,230,310 41.44% 10,209,000
Case B DKI 2,125,777 99.48% 11,123 0.52% 2,136,901 (2020) West 2,111,340 99.85% 3,230 0.15% 2,114,571 South 547,877 91.66% 49,840 8.34% 597,717 East 1,415,152 30.43% 3,235,212 69.57% 4,650,364 Karawang 7,107 1.00% 702,342 99.00% 709,448 Total 6,207,254 60.80% 4,001,746 39.20% 10,209,000
Case C DKI 3,353,653 99.26% 25,037 0.74% 3,378,689 (2030) West 3,757,999 99.77% 8,815 0.23% 3,766,814 South 750,516 79.91% 188,631 20.09% 939,148 East 1,095,895 11.22% 8,673,328 88.78% 9,769,223 Karawang 4,160 0.28% 1,501,967 99.72% 1,506,127 Total 8,962,222 46.29% 10,397,778 53.71% 19,360,000
Source: The Study on Efficient and Integrated Transport/Logistics Development in Eastern MPA
The Study on Efficient and Integrated Transport/Logistics Development in Eastern MPA
3-24
Table 3.2.14 Future Forecast of Cargo Volume (TEU/Year, Casse3)
Area Tanjung Priok Port Cilamaya Port
Total Rate Rate
Case A DKI 2,135,107 99.92% 1,794 0.08% 2,136,901 (2020) West 2,113,730 99.96% 840 0.04% 2,114,571 South 576,327 96.42% 21,389 3.58% 597,717 East 2,617,001 56.28% 2,033,361 43.72% 4,650,363 Karawang 24,383 3.44% 685,066 96.56% 709,449 Total 7,466,550 73.14% 2,742,450 26.86% 10,209,000
Case B DKI 2,134,676 99.90% 2,224 0.10% 2,136,901 (2020) West 2,113,927 99.97% 643 0.03% 2,114,571 South 570,007 95.36% 27,710 4.64% 597,717 East 2,953,916 63.52% 1,696,448 36.48% 4,650,363 Karawang 32,943 4.64% 676,506 95.36% 709,449 Total 7,805,468 76.46% 2,403,532 23.54% 10,209,000
Case C DKI 3,372,354 99.81% 6,335 0.19% 3,378,689 (2030) West 3,765,056 99.95% 1,757 0.05% 3,766,814 South 881,623 93.87% 57,524 6.13% 939,148 East 3,221,358 32.97% 6,547,865 67.03% 9,769,223 Karawang 20,432 1.36% 1,485,694 98.64% 1,506,126 Total 11,260,824 58.17% 8,099,176 41.83% 19,360,000
Source: The Study on Efficient and Integrated Transport/Logistics Development in Eastern MPA
The Study on Efficient and Integrated Transport/Logistics Development in Eastern MPA
3-25
Future Forecast of Container Vehicle Volume (6)
The future forecast of container volume is as follows. The tendencies of port choice are the same as those
of future container volume.
Table 3.2.15 Future Forecast of Container Vehicle Volume (Unit/Year, Base Case)
Case Area Tanjung Priok Port Cilamaya Port Container Rate Rate Volume Total
Case A DKI 1,387,752 99.86% 1,938 0.14% 1,389,690(2020) West 1,344,530 99.94% 866 0.06% 1,345,397 South 355,604 95.88% 15,285 4.12% 370,889 East 1,275,056 46.20% 1,484,857 53.80% 2,759,914 Karawang 9,303 2.30% 395,019 97.70% 404,322 Total 4,372,245 69.73% 1,897,968 30.27% 6,270,212
Case B DKI 1,387,285 99.83% 2,405 0.17% 1,389,690(2020) West 1,344,709 99.95% 687 0.05% 1,345,397 South 349,572 94.25% 21,317 5.75% 370,889 East 1,474,264 53.42% 1,285,649 46.58% 2,759,914 Karawang 12,698 3.14% 391,625 96.86% 404,322 Total 4,568,529 72.86% 1,701,684 27.14% 6,270,212
Case C DKI 2,188,104 99.70% 6,643 0.30% 2,194,748(2030) West 2,396,050 99.92% 1,908 0.08% 2,397,959 South 526,768 90.48% 55,430 9.52% 582,200 East 1,449,758 24.95% 4,360,848 75.05% 5,810,605 Karawang 7,644 0.89% 847,853 99.11% 855,497 Total 6,568,325 55.47% 5,272,684 44.53% 11,841,009
Source: The Study on Efficient and Integrated Transport/Logistics Development in Eastern MPA
The Study on Efficient and Integrated Transport/Logistics Development in Eastern MPA
3-26
Table 3.2.16 Future Forecast of Container Vehicle Volume (Unit/Year, Case1)
Case Area Tanjung Priok Port Cilamaya Port Container Rate Rate Volume Total
Case A DKI 1,385,329 99.69% 4,362 0.31% 1,389,690(2020) West 1,343,513 99.86% 1,884 0.14% 1,345,397 South 352,713 95.10% 18,177 4.90% 370,889 East 1,087,432 39.40% 1,672,481 60.60% 2,759,914 Karawang 11,082 2.74% 393,240 97.26% 404,322 Total 4,180,068 66.67% 2,090,144 33.33% 6,270,212
Case B DKI 1,384,255 99.61% 5,436 0.39% 1,389,690(2020) West 1,343,864 99.89% 1,534 0.11% 1,345,397 South 345,067 93.04% 25,823 6.96% 370,889 East 1,296,270 46.97% 1,463,644 53.03% 2,759,914 Karawang 15,271 3.78% 389,051 96.22% 404,322 Total 4,384,725 69.93% 1,885,487 30.07% 6,270,212
Case C DKI 2,182,628 99.45% 12,120 0.55% 2,194,748(2030) West 2,393,642 99.82% 4,318 0.18% 2,397,959 South 499,376 85.77% 82,823 14.23% 582,200 East 1,160,588 19.97% 4,650,018 80.03% 5,810,605 Karawang 9,173 1.07% 846,325 98.93% 855,497 Total 6,245,406 52.74% 5,595,603 47.26% 11,841,009
Source: The Study on Efficient and Integrated Transport/Logistics Development in Eastern MPA
The Study on Efficient and Integrated Transport/Logistics Development in Eastern MPA
3-27
Table 3.2.17 Future Forecast of Container Vehicle Volume (Unit/Year, Case2)
Case Area Tanjung Priok Port Cilamaya Port Container Rate Rate Volume Total
Case A DKI 1,383,497 99.55% 6,193 0.45% 1,389,690(2020) West 1,342,616 99.79% 2,781 0.21% 1,345,397 South 348,792 94.04% 22,098 5.96% 370,889 East 686,086 24.86% 2,073,828 75.14% 2,759,914 Karawang 3,006 0.74% 401,317 99.26% 404,322 Total 3,763,997 60.03% 2,506,215 39.97% 6,270,212
Case B DKI 1,382,014 99.45% 7,677 0.55% 1,389,690(2020) West 1,343,185 99.84% 2,212 0.16% 1,345,397 South 338,398 91.24% 32,491 8.76% 370,889 East 829,586 30.06% 1,930,328 69.94% 2,759,914 Karawang 4,137 1.02% 400,184 98.98% 404,321 Total 3,897,320 62.16% 2,372,892 37.84% 6,270,212
Case C DKI 2,177,306 99.21% 17,442 0.79% 2,194,748(2030) West 2,391,838 99.74% 6,121 0.26% 2,397,959 South 456,327 78.38% 125,873 21.62% 582,200 East 647,802 11.15% 5,162,804 88.85% 5,810,605 Karawang 2,411 0.28% 853,086 99.72% 855,497 Total 5,675,683 47.93% 6,165,327 52.07% 11,841,009
Source: The Study on Efficient and Integrated Transport/Logistics Development in Eastern MPA
The Study on Efficient and Integrated Transport/Logistics Development in Eastern MPA
3-28
Table 3.2.18 Future Forecast of Container Vehicle Volume (Unit/Year, Case3)
Case Area Tanjung Priok Port Cilamaya Port Container Rate Rate Volume Total
Case A DKI 1,388,453 99.91% 1,238 0.09% 1,389,690(2020) West 1,344,840 99.96% 557 0.04% 1,345,397 South 357,062 96.27% 13,829 3.73% 370,889 East 1,527,813 55.36% 1,232,101 44.64% 2,759,914 Karawang 14,165 3.50% 390,157 96.50% 404,322 Total 4,632,331 73.88% 1,637,881 26.12% 6,270,212
Case B DKI 1,388,155 99.89% 1,535 0.11% 1,389,690(2020) West 1,344,956 99.97% 441 0.03% 1,345,397 South 352,859 95.14% 18,030 4.86% 370,889 East 1,732,208 62.76% 1,027,704 37.24% 2,759,914 Karawang 19,215 4.75% 385,107 95.25% 404,322 Total 4,837,394 77.15% 1,432,819 22.85% 6,270,212
Case C DKI 2,190,298 99.80% 4,450 0.20% 2,194,748(2030) West 2,396,740 99.95% 1,218 0.05% 2,397,959 South 543,441 93.34% 38,758 6.66% 582,200 East 1,888,311 32.50% 3,922,295 67.50% 5,810,605 Karawang 11,846 1.38% 843,651 98.62% 855,496 Total 7,030,635 59.38% 4,810,373 40.62% 11,841,008
Source: The Study on Efficient and Integrated Transport/Logistics Development in Eastern MPA
The Study on Efficient and Integrated Transport/Logistics Development in Eastern MPA
3-29
Consideration of Demand Estimation Result (7)
・ In the future, if Cilamaya Port is constructed, this port will be used mainly by factories located in JABODETABEK east area because of good accessibility compared with Tj Priok Port.
・ Specifically, the logistics amount of Cilamaya Port is predicted to account for 30-40% (2020:approximately 2.9-3.2 million TEU out of 10 million TEU、2030:approximately 8.9 million TEU out of 19 million TEU ) of all logistics in Jabodetabek Area.
The reason for high usage rate of Tanjung Priok Port
The results of the demand forecast: from the viewpoint of fare, time, and port of call frequency, the cargo
handling capacity of Tanjung Priok is expected to be greater than that of Cilamaya Port, but the reasons
for this are thought to be as follows.
・ - In the future, the accessibility of Tj Priok Port is getting better by road constructions such as “Tj Priok Access Road” and so on. On the other hand, the freight cost of Cilamaya Port is getting higher than Tj Priok Port because the distance to Cilamaya Port tends to increase from each zone.
・ - For the reasons set forth above, the choice probability of Tj Priok port tends to increase.
On the other hand, the rate of utilization of Cilamaya new port in the East area which is near Cilamaya
new port is predicted higher than the rate of utilization of Tanjung Priok port in the East area. In the
future, the Eastern area will grow as factory area. As a result, the demand for Cilamaya new port will
increase.
Attention point of Demand Estimation
Decision-makers choosing a port are divided into two cases. One of the decision-maker groups is owners
of goods and the other is logistics companies. This SP (Stated Preference) survey was implemented for
owners of goods (factories in JABODETABEK Area).
As a result, this demand estimation model has increased the sensitivity for freight cost compared with the
time. (Owners of goods are concerned with cost).
Therefore, this model tends to favor Tanjung Priok Port compared with the Cilamaya port, because the
distance to Tj Priok Port is short.
The Study on Efficient and Integrated Transport/Logistics Development in Eastern MPA
4-1
4. LESSONS LEARNED FROM SIMILAR PORTS IN OTHER COUNTRIES AND THEIR HINTERLANDS’ DEVELOPMENT PROJECTS
4.1 Development Background of Case Study Ports and Their Hinterlands
The study was conducted to learn from the experiences of three ports, Laem Chabang Port in Thailand, and Subic Port and Batangas Port in the Philippines, which are similar to Cilamaya Port as regards the background of development and local circumstances. Figure 4.1.1 shows the locations of the ports. Development background and necessity of each port and Cilamaya Port are described in Table 4.1.1. And Table 4.1.2 compares the development plan of each port.
Figure 4.1.1 Location of Case Study Ports and Existing Ports
Laem Chabang Port, Subic Port, and Batangas Port were developed to alleviate traffic congestion and provide balanced development. Each port exists in a metropolitan area and also within approximately 100 kilometers of another existing port. The development background and location of each port in relationship to the previously existing ports are similar to the relationship between Cilamaya New Port and Tanjung Priok Port. However, Laem Chabang Port as developed or more developed than the metropolitan port (Bangkok Port) but in the case of Subic Port and Batangas Port, the characteristic of development is a substitution of function of metropolitan port.
Philippines Thailand
The Study on Efficient and Integrated Transport/Logistics Development in Eastern MPA
4-2
Table 4.1.1 Development Background and Local Circumstances of Case Study Port
Name of Port Development Background and Necessity Port Location and Local Circumstances
Laem Chabang Port (Thailand)
Bangkok Port could not readily expand its container capacity because Bangkok Port is located in the shallow Chao Phraya river and a factor regarding traffic congestion in Bangkok is that the Bangkok port is only a short distance from the center of Bangkok. To solve these problems, Laem Chabang Port was developed in 1991.
Laem Chabang port is located about 130 km southeast of Bangkok on the east bank of Bangkok gulf, it does business with the center of Laem Chabang industrial estate on the eastern seaboard in Thailand.
Subic Port (Philippines)
A new international container terminal was constructed and rehabilitation of existing port facilities was completed to increase the cargo-handling volume of the port in order to cope with the demand of international logistics developed by the hinterland of the Subic and Clark areas.
Subic Port is located about 138 km northwest of Manila metropolitan area and Clark free port zone is situated immediately behind it.
Batangas Port (Philippines)
The purpose of Batangas Port development is to contribute to the balanced development of the Calabarzon region and the alleviation of traffic congestion caused by over-concentration in Manila by coordinating the efficiency of logistics in the Philippines through the construction of an international port in Batangas that could handle the containers for foreign trade.
Batangas Port is located about 110 km south of Manila, southwest of Luzon Island, and it makes up a part of the SCMB corridor. The south Tagalog region that is the main industrial region in the Philippines is situated in the hinterland of Batangas port.
Cilamaya Port (Indonesia)
The cargo handling volume in Tanjung Priok Port is projected to exceed capacity soon, and the issues regarding port logistics, e.g., traffic congestion in Jakarta metropolitan area, exert a negative effect on not only port logistics but also economic activity in this region. New Port development is planned to improve this situation.
Cilamaya Port is located about 100 km from the center of the Jakarta metropolitan area. Jakarta east industrial estates, consisting largely of the auto industry, are situated in this area and the significance of the new hub is increasing within Asian a.
Remark: Information of Cilayama port is for reference Source: The Study on Efficient and Integrated Transport/Logistics Development in Eastern MPA
The Study on Efficient and Integrated Transport/Logistics Development in Eastern MPA
4-3
Table 4.1.2 Comparison of Port Development Plan
Laem Chabang Port Subic Port Batangas Port Cilamaya Port Country name
Thailand Philippine Philippine Indonesia
Year of Planning
“Laem Chabang Seaboard Development Plan in Thailand”(1985)
“Subic Port Development Plan”(1997, 1998, 1999)
“Greater Metropolitan Seaport Development Plan in Phillipines”(1994)
“Jakarta Metropolitan Port Logistics Improvement Plan” (2011)
Planned Facilities
Master plan Container berth (-13, 7 berth; 2100 m) Bulk berth (-13.0 m, 2 berth: 520 m -10.0 m, 5 berth: 925 m) Tapioka berth (-13.0 m, 1 berth: 340 m) Sugar/Syrup berth (-11.5 m, 1 berth: 275 m)
Container berth (-13 m: 840 m)
Master Plan Year 2010 External trade container terminal (-10 m 1 berth: 180 m) Bulk external trade terminal (-10 m, 1 berth, 170 m) Internal trade berth container berth (-10 m 1 berth, 150 m) Internal trade Ro/Ro terminal (-5.5 m 1 berth, 120 m)
Container berth (-17 m:3,360 m) Ro/Ro (-12.5 m: 690 m)
Planned Cargo Volume (Container, Others)
Cargo demand in 2001 Container: 7.6 million tons International trade cargo: 2.0 million tons Domestic cargo: 0.86 million ton Tapioka: 4.5 million tons Sugar: 1.4 million tons Syrup: 0.5 million tons
Short-term (2005 year)Container: 320 thousands TEU Long-term (2020 year)Container: 910 thousands TEU
Master Plan in 2010 International trade container terminal: 1.2 million tons International trade bulk terminal: 400 thousands tons Domestic trade container terminal: 3,300 thousands tons Domestic trade Ro/Ro terminal: 2,400 thousands tons
After 5 years of starting of service Container: 3.75 million TEU Completed vehicle: 770 thousands vehicles After 10 years of starting of service Container: 7.50 million TEU Completed vehicle: 770 thousands vehicles 1.02 million vehicles
Others Integrated development of industrial estate of hinterland Issues for physical limit of Bangkok Port
*Development of vacant lot brought about retreat of *American Force Correction of over-concentration for Manila port
*Cargo of industrial estates in the south of Manila
Cargo of industrial estates in the east of Jakarta
Handling Volume of Container (World Container Port Traffic League 2010)
5,068,076 TEU 21 place
- - -
Source: The Study on Efficient and Integrated Transport/Logistics Development in Eastern MPA
The Study on Efficient and Integrated Transport/Logistics Development in Eastern MPA
4-4
4.2 Current Status and Factor Analysis of Case Study Port
4.2.1 Current Status of Case Study Port
Laem Chabang Port handled 1,120,000 TEU/year in 1997, so this volume is more than the volume of Bangkok Port (1,100,000 TEU/year). The handling volume of containers in Laem Chabang port in 2011 is ranked 23rd in the world. This volume is 4.37 times that of Bangkok Port, e.g. 5,730,000 TEU. And Super Post-Panamax ships could enter the Laem Chabang Port and it is rated as the fastest growing container port in the world (Lloyd’s List). On the other hand, in the case of Batangas Port and Subic Port, the handling volume of container cargo of Batangas Port and Subic Port was less than the capacity of both ports. Also, please refer to the corresponding “Background Information” of this chapter.
4.2.2 Factor Analysis of Case Study Port
In the case of Laem Chabang Port, the cargo demand is so big and in accordance with the development of these industries, maritime cargo has increased steadily. Under these circumstances, it is easy to get a port call decision of a shipping company. And also truck companies are willing to invest in terminal construction. In addition, the number of terminals is large, and various kinds of operators entered making competition among operators fierce, thus reasonable transportation cost is established. On the other hand, in the case of Subic Port and Batangas Port, the situation is the opposite. As the competitive operator of Manila Port entered for operator, competitive incentive with Manila port is lacking. And also, truck companies take time to decide on the investment for terminal construction. Also, please refer to the corresponding “Background Information” of this chapter.
4.3 Good Lessons for Development of Cilamaya Port
The following lessons have been learned from the case study in order to develop the Indonesian economy by balanced development of the existing Tanjung Priok Port and Cilamaya Port.
(1) Strategic Development of Hinterland of Port
It is necessary for the government to entice the manufacturing industry that increases the maritime cargo for the hinterland of the port strategically through the various incentives. Arrangement of industrial estates of hinterland is also a necessary condition for the success of port development. In this point, Cilamaya Port is similar to the case of Laem Chabang, and is different from the case of Subic Port and Batangas Port and the hinterland in the Philippines. However, the hinterland of Cilamaya Port is a different situation compared with Laem Chanbang Port. The hinterland of Cilamaya Port is required to consider the environment in development, construction of access roads, considering fully that the surrounding environment and large-scale hinterland is reserved.
(2) Creation of Competition
It is important to create an environment of competition in the field of service and price in the same port managed by several operators. Competition is created in service and price managed by a number of operators in Laem Chabang Port, while competition is not created in service and price managed by a single operator in Batangas Port and Subic Port. In the case of Cilamaya Port, four terminals are planned
The Study on Efficient and Integrated Transport/Logistics Development in Eastern MPA
4-5
to construct by dividing two of eight berths in very deep waters, and it is considered to be possible to create a competition to select a separate operator including capital ties.
(3) Enhancement of Port Authority (PA) and Staff Capability for Appropriate Operation of New Shipping Law
As Thailand’s and Philippines’ examples show, it is necessary to enhance the authority and capacity of the PA that is managing a port, and the PA could conduct the harbor administration in accordance with government policy. The PA in Thailand has a wide authority and it could conduct harbor administration in accordance with the policy of the government. While in the Philippines the PA has little authority and it is difficult for it to conduct the harbor administration in accordance with the policy of the government. In the case of Indonesia, GOI promulgated a new shipping law in April, 2008, which calls for port management to be conducted either by the Port Authority or Port Management Unit based on the concept of port landlord, in which management is separate from operations. With this law, a framework for effective and efficient port development, management, and operation through Public and Private Partnership can be established. Cilamaya New Port is planned to do administrative operation of port by PA, based on the new shipping law.
Capacity of PA is necessary to create a competition as mentioned above in 2). High technical background and experience is required to conduct administrative operation of the port, and it is necessary to improve the knowledge and experience of port administration and operation of PA.
The Study on Efficient and Integrated Transport/Logistics Development in Eastern MPA
5-1
5. ISSUES AND SOLUTIONS OF TRANSPORTATION AND LOGISTICS
5.1 Short-Term Countermeasure by 2020 (before opening of Cilamaya Port)
Short-Term Countermeasure of Infrastructure for Shortage of Terminal Space at 5.1.1Tanjung Priok Port
(1) Early Service of North Kalibaru
Early service of a new container terminal developed at North Kalibaru is a short-term countermeasure against the shortage of container terminals. However, an access road problem exists for the early service of North Kalibaru due to land acquisition and resettlement.
(2) Renewal of Container Handling Facilities
In order to alleviate the congestion of container yard in terms of capacity improvement of container handling facilities, continuous input of new GC and RTG should be taken.
1) Continuous Introduction of GC. 2) Continuous Introduction of RTG. 3) Introduction of New GC and RTG in Small and Medium Terminal.
(3) Extension of Railway into Container Terminal
The reason why logistics companies do not employ the railway for the transportation of container without hesitation is that handling cost due to double handling and consuming time due to double handling are to be bottleneck according to the survey for logistics companies. Thus, considering the promotion of railway cargo in order to take out the container from container terminal in Tanjung Priok Port to outside of the terminal, canceling of double handling in Pasoso station is essential. In order to dissolve this double handling, it is necessary to extend the railway track to JICT and KOJA yard. However, the extension of railway into container terminal is not to be proceeded by the problem of land acquisition. Tanjung Priok Access road is under construction, so new terminal gate is planned to connect directly to on-off ramp of toll road. It is possible to secure the space to install the railway beside the new gate of terminal. Extension of railway into container terminal using by railway space from Pasoso to JICT makes it possible to dissolve the double handling. Promotion of container transportation by railway makes it possible to increase the throughput capacity in container yard of terminal.
A plan for extension of railway line into the Container Terminal has been prepared several times in the past but it has not materialized. The reasons for the delay of implementation might include the following:
1) Land acquisition has not been well prepared yet
2) Concerns about the anticipated traffic congestion by intersecting with the roads outside of the port
The Study on Efficient and Integrated Transport/Logistics Development in Eastern MPA
5-2
3) Pelindo II has not been interested
Among these factors, 1) the land for railway line extension could be acquired when a ramp of Tanjung Priok Access Road is constructed. 2) Martadhinata flyover and Jl Surawesi flyover are planned to be constructed and the expected traffic congestion could be alleviated, as described in Sub-Section 2.4.2 3) At present, the container-handling capacity has not been expanded against the increasing container demand at the container terminals. To supplement the limited capacity of container handling at the container yards, if containers can be transported quickly by railway from the terminals then the total containers handled would increase and lead to increased revenues for the terminal operators. This would provide incentive to extend the railway line for the operators and bring about good conditions for the project implementation.
The following should be studied quickly for implementing the project in the short term.
- Confirmation of the ROW of the existing railway in Tanjung Priok
- Confirmation of the Necessity of Resettlement of the Residents
- Study of the Alignment of the Railway in the Container Terminal
- Coordination with the Ramp of the Tanjung Priok Access Road
- Determination of the Project Implementing Agency and Coordination on Cost Sharing among the Stakeholders
- Study on Utilization of Pasoso Railway Container Terminal in the Future
- Study on the Method for crossing Jl. Pelabuhan, based on the Traffic Demand Analysis, including railway crossings.
- Study on questions of economic viability
The Study on Efficient and Integrated Transport/Logistics Development in Eastern MPA
5-3
Sourced: The Study on Efficient and Integrated Transport/Logistics Development in Eastern MPA
Figure 5.1.1 Railway Extension to Container Terminal at Tanjung Priok Port
Second best: improvement of Pasoso Station
As mentioned above, a discussion is about to begin on railway track extending to JICT yard but it might take time to realize it. As shown in Figure 5.1.2, Pasoso Station has only a single loading track. In addition, 2 shunting tracks are arranged for changing and moving trains during loading work. Two loading tracks shall be installed with container cranes. As the result, loading work can be carried out simultaneously in the 2 tracks and containers brought by chassis from JICT can be un/loaded smoothly and rapidly. Moreover, the train can start immediately after loading work in the track, and so shunting work is not needed in the yard1.On the other hand, in order to introduce this system into the yard, it is definitely required to unify the management, which is controlled by 2 companies, JPT and MTI. In the future, these container cranes can be moved to the JICT container yard after rail track extension.
1 In case a train must be stabled momentarily due to the train diagram, the train can be stabled at Sungai Lagoa Station, which is
a sub-station of Pasoso Station.
The Study on Efficient and Integrated Transport/Logistics Development in Eastern MPA
5-4
Source: The Study on Efficient and Integrated Transport/Logistics Development in Eastern MPA
Figure 5.1.2 Track Layout at Pasoso Station
1) Review of Track Layout of Cikarang Dry Port
With the existing track layout in the yard, shown in Chapter 2, a train coming from Pasoso Station to Tanjung Priok must switch back at Lema Abang Station and enter the dry port. Therefore, the train is pushed back from Lema Abang Station by locomotive and this operation work requires some persons who instruct the locomotive driver in order to settle the train at the loading platform. It takes quite a long time for the yard operation work and it is a very inconvenient track condition in terms of improving frequency.
It is imperative to change the track layout as shown in the Figure 5.1.3 and enable trains to enter from both sides, Cikarang and Lema Abang, so as to gain smooth and rapid loading work. Moreover, it might require a loading platform long enough for a train with 20 container wagons.
Gate
WarehousePlatform
Station House
JPT MTI
Station House
Warehouse
Gate
Platform
Container Crane
Crane Run way
Loading Track (2)
Loading Track (1) Shunting Track (2)
EXISTING TRACK
IMPROVEMENT (IDEA)
The Study on Efficient and Integrated Transport/Logistics Development in Eastern MPA
5-5
Source: The Study on Efficient and Integrated Transport/Logistics Development in Eastern MPA
Figure 5.1.3 Track Layout Improved at Cikarang Dry Port (Plan)
2) Introduction of High Speed Freight Train (Shuttle, Push-Pull system)
It should be studied about the introduction of a shuttle freight train in order to speed up transport efficiently between Pasoso and Cikarang Dry Port. As shown in the existing train diagram, it takes one hour for direct operation between both stations. However, the inefficient work method causes actual transport time to be significantly longer. It is a remarkable defect of the existing system.
In order to attract large-scale sea containers into 60 km of transport between Tanjung Priok and Cikarang Dry Port, there is no other choice for the freight railway to realize punctuality, rapidness, and high frequency.
In the case of a conventional locomotive hauling freight train, it takes time indispensably to change the locomotive at the terminal station, shunt the train in the yard, or the like.
A push-pull freight train system, proposed here, consists of a fixed formation with freight wagons and 2 high-performance locomotives coupled permanently at the head and end of the train.
This train can run with high performance equivalent to a passenger train and can operate in parallel with electric cars in commuter service section in some cases.
Loading Station
Station Lemah Abang(km 52.623)
Jl. Kb. Cibeber(Level Crossing)Container Yard
The Study on Efficient and Integrated Transport/Logistics Development in Eastern MPA
5-6
Major specifications are as follows;
Table 5.1.1 Spec of Train for Container Transport
Type Item Description 1. Locomotive Power 4-drive axle locomotive × 2 2,560 kW Max. Speed 110 km/h 2. Wagon Car Length 18 m(60 ft) Max. Capacity 50 ton Max. Speed 110 km/h Car/ Train 20 cars (40TEU)
Source: The Study on Efficient and Integrated Transport/Logistics Development in Eastern MPA
3) Introduction of Un/Loading Machine
Introducing a loading machine (container crane) enables idle time to be cut drastically by the speeding up of loading work, harmonizing efficiently the train and load work diagram. In this manner, train headway can be shortened and many trains can be allocated, so that it is indispensable to provide high performance machines together with high performance shuttle train.
It is a weak point of the present Pasoso Station that it has poor machinery. It is required to cut loading time drastically by investing in gantry container cranes.
The Figure 5.1.4 illustrates the combination of high-speed and high-performance push-pull trains and container cranes at Pasoso Station or the dry port.
The synergistic effect with sped-up loading work and high-performance shuttle train enables railway transport time to shorten and capacity to rise up drastically.
Source: The Study on Efficient and Integrated Transport/Logistics Development in Eastern MPA Figure 5.1.4 High Speed Freight Train (Push-Pull System) and Mechanized Loading
Platform
Container Crane
Diesel Electric Locomotive
Diesel Electric Locomotive
Loading Platform
The Study on Efficient and Integrated Transport/Logistics Development in Eastern MPA
5-7
4) Effect introduced by new system and Feasibility
Current handling capacity is 400 TEU/day by 10 trains. Total number of container transported from overseas to Tanjung Priok Port is projected for 14,237 TEU/day in 2030. Thus the ratio for all container transported by train is only 2.8%.
But, extra 7 trains operation is possible at present based on current time schedule. Thus if 17 trains per day are operated, 680 TEU/day are transported by train. In addition, extra 9 container transportation trains are to be operated according to the plan of double-double tracking, so the transportation of 1,040 TEU/day is possible.
Demand in transportation container from Tanjung Priok Port to eastern MPA area in 2030 is projected to 1,726 TEU/day. If the volume of container is confined to Tanjung Priok port and east industrial area, approximately 60% container volume from Tanjung Priok Port to east industrial estate is covered by railway transportation by 26 trains operation.
Actually much of various coordination is required to be put into practice, but it is good opportunity to introduce the railway into the container terminal as the following reasons:
Ramp of Tanjung Priok Access road will be constructed in the terminal in 2015.
Additional railway length is short.
Right of way remains in the site.
Planned flyover in the intersection of road and railway would be implemented if the outlook for securing fund is calculated.
Considering the mentioned above current situation, railway introduction to container terminal is recommended for short-term countermeasure.
5) Preparation of Incidential Facilities
It is also required to invest in some other facilities like a rolling stock maintenance facility, or the like, in addition to the improvements mentioned above.
Short-Term Countermeasures for Shortage of Terminal Space in Tanjung Priok 5.1.2Port
(1) Reducing Time for Customs Clearance (Change of Method of Customs Duty Payment, Additional Staff of Customs Officer)
In the case of the green lane, the required time for customs clearance is not very different from other countries in terms of development of electric procedures (Table. 2.1.7), but it is possible to shorten the required time for customs clearance by around one day by including payment of customs duty with the import declaration.2 On the other hand, in the case of the red lane, the required time for customs clearance
2 At present, customs duty should be paid after the import permit, so payment of customs duty needs one day at least.
The Study on Efficient and Integrated Transport/Logistics Development in Eastern MPA
5-8
was worse than the past situations of Tanjung Priok and other countries. When cargo is classified into the red lane, the importers themselves have to find a customs inspector, so one or two days are required.
To prevent the need for the importer to find an inspector, customs office staff should be increased as a short-term solution. If this procedure is developed, the import permit process for the red lane can be reduced by one or two days, compared with the present situation. However, the time required to train customs officers will increase the difficulty of achieving this as a short-term countermeasure.
(2) Countermeasure for OB
Regarding a problem related to the OB problem: there are unprofitable trips and costs.
1) Reduction of Unprofitable Trips (Real-Time Container Searching System)
If it is possible to notify, on time, the cargo owner and logistics company of the destination of OB containers, the unprofitable time receiving the container could be reduced. Unprofitable trips could be reduced, which could also contribute to the alleviation of traffic congestion by changing the current container search system into a real-time system.3
2) Reduction of Unprofitable Costs Created by OB (Utilization of Cikarang Dry Port)
In 2012, 126, 406 TEU containers were transferred to the outside of the terminal. Thus, a cost burden of approximately 442.4 billion Rp was incurred by the importer. In general, the possibility of OB is much increased if the container is deposited around one week in terminal. So some logistics companies have already recommended that importers using the red lane4 make a customs clearance in Cikarang Dry Port. Though all cargo classified into the red lane is transferred to the outside of the terminal (OB), it is not necessary for the importer, who arranged the customs clearance at Cikarang Dry Port in advance, to pay the unprofitable cost created by OB. Also, the required time for the import permit could be shorter than at Tanjung Priok Port. However, there is a problem that the cost for customs clearance in Cikarang Dry Port requires more than the cost of customs clearance in Tanjung Priok Port.
(3) Promotion of 24/7 System (Leveling of Import Declarations)
Twenty percent of all import cargo at present is discharged on Saturday. But many logistics companies avoid submitting an import declaration until the next Monday, thus the number of trucks picking up import cargo from the terminal at Tanjung Priok is low on Sunday and Monday and the number of trucks picking up import cargo on Wednesday, Thursday, and Saturday is high. An off-centered situation regarding the number of trucks picking up import cargo is created at the terminal of Tanjung Priok Port. (Table 5.1.2)
3 Container location data is currently revised every 3 hours. 4 In the case of the red lane, the required time for import permit is 11 days (May, 2013).
The Study on Efficient and Integrated Transport/Logistics Development in Eastern MPA
5-9
Table 5.1.2 Number of Gate-In Trucks by Day and Time
If the concentration of trailers on the terminal is decentralized, road congestion in front of the terminal and congestion of the container terminal—the reason it takes 3 hours to transport a cargo inside the terminal—will be alleviated a little.
If logistics companies tried to make a customs clearance on Saturday afternoon or Sunday, it was not conducted for the following reasons:
1) Opaque fee structure
2) Customs officers do not actually process the declaration of customs clearance on Saturday
afternoon and Sunday, although the regulation stipulates the custom clearance on Saturday
afternoon and Sunday.
3) The 24/7 system is not disseminated widely for logistics companies.
(4) e-Ticket System (Promotion of Computerization)
The place where e-Tickets are obtained is limited to the JICT terminal office, and a queue forms at this JICT terminal office near the gate of the terminal. If e-Tickets could be obtained via the internet, truck parking near the gate would decrease causing the formation of queues to also decrease.
(5) Construction of INAPORTNET for Inward and Outward Voyage
The main works of the Port Authority of Tanjung Priok Port are to ensure that port activities are properly carried out based on the performance reports from each terminal operator and to provide guidance on improving their businesses, if necessary. Because the works of the port authority were built into the INPORTNET system, which DGST had developed, as the direct approvals of entering/departing in/from ports, the system did not reflect the actual port procedures.
We think it may be possible to reflect the actual port procedures in New INAPORTNET currently being developed by PT ILCS Company as the project center, because Port Authority and shipping companies are participating in the development.
When New INAPORTNET, which is now being developed as the system for processing port procedures for domestic ships, comes into use, we think the most difficult problem in expanding the system to include international ships procedures will be the connection with INSW, especially the coordination with Customs. At this stage, agreement can be obtained through the negotiation between the central
The Study on Efficient and Integrated Transport/Logistics Development in Eastern MPA
5-10
government authorities. In order to achieve the objective, DGST should consult adequately with DGCE (Directorate General of Customs and Excise). In the negotiation, DGST should be conscious that its participation in the INSW project is very late, recognize the necessity to modify New INAPORTNET according to the existing INSW system and tackle the challenges actively.
INSW has a scheme with a focus on customs clearance, in which INAPORTNET will process port-related logistics information. On the other hand, the systems will process import/export licenses such as INATRADE. (This description is based on ”Development of National Logistics System Framework”, Coordinating Ministry for Economic Affairs, 7-8 May 2013.) If INAPORTNET is able to process international/domestic ships’ information functions properly, stakeholders related to port logistics will be able to cooperate with each other through INSW. If INSW can be effectively used, distribution costs can be reduced, trade will be facilitated and the international competitiveness of Indonesia will be enhanced.
Countermeasure of infrastructure for Road Congestion in Front of the Terminal at 5.1.3Tanjung Priok Port
(1) Tanjung Priok Access Road
Tanjung Priok Access Road construction work is in progress and is expected to be complete by 2015. Direct access to toll road, improvement of port gate and surrounding road, and smooth access from/to port area to road will all be drastically improved by separating traffic into cargo and other vehicles.
The following benefits are expected by the completion of Tanjung Priok Access Road:
Mitigation of traffic congestion for traffic congestion on arterial road in front of container terminal at Tanjung Priok Port by the direct connection to toll road and road improvement
Access time mitigation by JICT gate improvement Traffic separation of cargo vehicles and common vehicles by the construction of new toll
road and arterial road improvement. This will contribute to traffic mitigation on surrounding arterial road.
Countermeasure for Road Congestion in Front of the Terminal at Tanjung Priok 5.1.4Port
(1) Relocation of Container Depots
To deal with the traffic congestion that worsens with the increase of deadhead to the container depots surrounding the port and the increased demand for container depots, the TPS container depot and empty container depots surrounding Tanjung Priok Port should be relocated to the Eastern MPA where cargo demand is highest thereby alleviating the traffic congestion. The TPP and LCL container depot are to be constructed in a vacant lot created by the relocation of the TPS Container Depot and the empty container depot and it deals with OB containers. The cost burden of cargo owners due to OB is to be alleviated slightly by collecting a depot surrounding a port.
The Study on Efficient and Integrated Transport/Logistics Development in Eastern MPA
5-11
(2) Creation of Trailer Matching System
In order to alleviate the congestion in the terminal by reducing the number of trailers, matching of container trailers carrying in and taking out is considered. If carrying trailer to load the container for ship could take out unloading container backhauling, transportation efficiency would improve much. Thus, if a system is created in which one trailer carries in and takes out, it would contribute not only to the alleviation of traffic congestion around the port terminal, but it would also reduce the transportation cost greatly. However, the likelihood that the timing would work out for the import and export of the same cargo owner is low. Round-trip use of a trailer is said to be from 60% to 70% in total. Thus, if a system is created for matching so that one trailer carries in and takes out, the ratio of round-trip use of trailers will increase and this will not only contribute to the alleviation of traffic congestion around the port terminal, but it will also reduce the transportation cost greatly. However, there are coordination matters regarding what the requirements for entry should be for the matching system.
Countermeasure for Road Congestion of Jakarta-Cikampek Toll road 5.1.5
(1) Construction of Second Jakarta – Cikampek Toll Road (Phase-I)
To supplement and strengthen toll road function, a second Jakarta – Cikampek toll road was planned parallel with the existing Jakarta – Cikampek toll road. The beginning point is the intersection with Cilamaya New Port access road and the end point is the connection point with JORR 2. The following drawing shows the alignment plan for the Second Jakarta – Cikampek toll road and construction phasing (Figure 5.1.5).
Source :Study on The Second Jakarta-Cikampek Toll-Road Project in The Republic of Indonesia
Figure 5.1.5 Plan and Phasing for Second Jakarta – Cikampek Toll Road
Implementation Plan for Second Jakarta – Cikampek Toll Road
Second Jakarta – Cikampek toll road shall be implemented following the phasing plan as shown in the above drawing, based on the implementation plan of the Cilamaya New Port development project.
Phase 2 Phase 1
The Study on Efficient and Integrated Transport/Logistics Development in Eastern MPA
5-12
Phase I
The development plan for the new Cilamaya port development project is planned, opening in 2020. The Cilamaya New Port access road is also being planned and a new interchange shall be coordinated with Cilamaya New Port access road and Second Jakarta – Cikampek toll road. Therefore, the interchange for the Cilamaya new port access road and the second Jakarta – Cikampek toll road phase 1 section shall be constructed in the same stage. The second Jakarta – Cikampek toll road shall be divided into two phases: Phase 1 of 11.13 km and Phase 2 of 36.6 km.
The following benefits are expected by the construction of the Second Jakarta – Cikampek Toll Road
Most of the industrial estates located in the Cikalang area will be able to connect to Cilamaya New Port without using the existing Jakarta – Cikampek toll road, thereby contributing to traffic mitigation for the existing Jakarta – Cikampek toll road.
Countermeasure Against Congestion of Access road to Interchange of Toll Road 5.1.6of Eastern MPA Located in Industrial Estate
(1) Rehabilitation of Cibitung Interchange
There are 2 tollbooths on the Cibitung Interchange on the south and north side of the interchange. The number of tollbooths is not sufficient and is causing traffic congestion. This congestion is affecting the main toll road and industrial estate. Thus, the number of tollbooths shall be studied and supplemented. The access road from the north side of the tollbooth is only a 2-lane road and shall be widened to 4 lanes. Therefore, tollbooth and existing road improvements are recommended.
The following benefit is expected by the improvement of Cibitung Interchange:
Mitigation of traffic congestion on the main toll road and additional tollbooths for Cibitung interchange.
(2) Rehabilitation of Cikarang Utama Barrier Gate
Cikarang Utama Barrier Gate is the main gate on the toll road. There are 2 toll gate locations in the Jakarta direction and 1 toll gate for the Cikampek direction. There is a sufficient number of tollbooths for both directions. However, there are many interruptions at the tollbooth by the reason of disorderly lines of traffic. Also, the merging length for the tollbooth to the main line is not sufficient and is causing traffic congestion. To make a proper line entering the tollbooth, dividing facilities, such as colour dividers or divider posts, shall be installed to avoid disruptions. Also, there is potential to extend the area of the main barrier gate on the south side of the existing toll gate and secure sufficient length for merging traffic. This barrier gate improvement will contribute to traffic congestion mitigation for the direction toward Jakarta.
The following benefit is expected by the improvement of Cikarang Utama Barrier Gate:
Traffic congestion mitigation on the main toll road by the improvement of Cikarang Utama Barrier Gate
The Study on Efficient and Integrated Transport/Logistics Development in Eastern MPA
5-13
(3) Cikarang Timur Interchange
Cikarang Timur Interchange connects the toll road and Delta Mas industrial estate. Sufficient length of access road is in place. However, the number of tollbooths is not sufficient and does not match future traffic volume. The number of tollbooths shall be increased to meet with future traffic volume from the industrial estate.
The following benefit is expected by the improvement of Cikarang Timur Interchange:
Mitigation for traffic congestion on the main toll road by the improvement of Cikarang Timur Interchange
(4) Karawang Timur Interchange-1
Karawang Timur Interchange has a 4-lane access road connecting to the industrial estate. This 4-lane road remains in good condition, however, tollbooth numbers are not sufficient. Additional tollbooth construction will be expected.
The following benefit is expected by the improvement of Karawang Timur Interchange
Mitigation of traffic congestion on the main line of the toll road by addtional tollbooths on the interchange
Countermeasure Against Congestion of the Arterial Road Network of Eastern 5.1.7Industrial Estate and South Arterial Road
(1) Rehabilitation of Jl.Kalimalang
The cross section for Jl. Kalimalang shall be a 2-lane road and maintain a foot path for pedestrian safety. A typical cross section can be seen in the following drawing. At a grade intersection improvement and construction of a flyover will contribute to mitigation of traffic congestion at the beginning point of Jl. Kalimalang. A cross section for the flyover is shown following the drawing. (Figure 5.1.6)
Source: Preparatory Survey for Metropolitan Arterial Road Improvement Project Figure 5.1.6 Typical Cross Section for Jl. Kalimalang
The Study on Efficient and Integrated Transport/Logistics Development in Eastern MPA
5-14
Source: Preparatory Survey for Metropolitan Arterial Road Improvement Project Figure 5.1.7 Typical Cross Section for Tegal Gede Flyover
This road will connect with southern industrial estate, with JABABEKA, and Dry Port and is expecting early implementation.
The following benefits are expected by the improvement of Jl. Kalimalang:
Smooth access with industrial estate and Jakarta – Cikampek toll road and securing pedestrian safety by the improvement of Jl. Kalimalang.
Contribution for traffic congestion for toll road by construction of an east - west trunk road.
(2) Rehabilitation of Jl. Bali
The access bridge on Jl. Bali is 1.5 lanes wide. Therefore, a new bridge will be constructed beside the existing bridge for smooth connection of each industrial estate. The following drawings are showing a typical road and bridge cross section. (Figure 5.1.8, Figure 5.1.9)
Source: Preparatory Survey for Metropolitan Arterial Road Improvement Project
Figure 5.1.8 Typical Cross Section for Jl. Bali
The Study on Efficient and Integrated Transport/Logistics Development in Eastern MPA
5-15
Source: Preparatory Survey for Metropolitan Arterial Road Improvement Project
Figure 5.1.9 Typical Cross Section for Toll Road Overpass on Jl Bali
This road is important road to connect each industrial estate in the north - south direction, and to connect with MM2100, and EJIP. Early implementation is expected.
The following benefits are expected by the improvement of Jl. Bali:
To secure smooth access between south side industrial area and JABABEKA, and Dry Port by improvement of Jl. Bali.
Traffic mitigation for surrounding roads, by the formation of a north - south trunk line.
(3) Rehabilitation of Jl. Iman Bonjol (Construction of New Bridge)
Jl. Iman Bonjol improvement plans include a 1.6 km road improvement and new bridge construction for crossing the Kalimalang River. This road is also an important trunk road composed in the north - south direction. A typical cross section for crossing the Klimalang River is shown in Figure 5.1.10.
The Study on Efficient and Integrated Transport/Logistics Development in Eastern MPA
5-16
Source: Preparatory Survey for Metropolitan Arterial Road Improvement Project Figure 5.1.10 Typical Cross Section for New Bridge on Jl. Iman Bonjol
Alignment shall basically follow the existing alignment, however, the road pavement shall be reconstructed. Improvement for at grade intersection with Jl. Kalimarang shall be improved and this improvement will be able to maintain smooth traffic for Jl. Kalimarang and Jl. Iman Bonjol.
The following benefits are expected by the improvement of Jl. Iman Bonjol:
To maintain smooth access between the industrial estate located on the south side of Jakarta – Cikampek toll road and JABABEKA, and Dry Port by improvement of Jl. Iman Bonjol
Mitigation of traffic congestion of surrounding roads because of formulation of a north - south trunk road.
(4) Dry Port Access Road
The dry port access road is composed with JABABEKA Dry Port road and a new interchange for the Jakarta - Cikampek toll road and access road from Interchange to the south side industrial estate. Design for the access road between JABABEKA Dry Port and New Cikampek toll road interchange has been completed and construction work is in progress. However, the south side of the toll road has not been implemented. For smooth implementation of this access road, coordination among stakeholders shall be made and implemented as soon as possible.
The following benefits are expected by the construction of the dry port access road:
To maintain smooth access from the dry port to each industrial estate Mitigation of traffic congestion of surrounding roads because of formulation of a north -
south trunk road
The Study on Efficient and Integrated Transport/Logistics Development in Eastern MPA
5-17
(5) MM2100-EJIP Access Road
The roads in MM2100、and EJIP industrial estate have been maintained in good condition. Coordinating with each industrial estate the construction of an access road should lead to more smooth access from/to each industrial estate and contribute to more mitigation of traffic congestion. The most concerning issue is the land acquisition issue. To solve this issue and implement this project, coordination with concerned stakeholders shall be made and implemented as soon as possible.
The following benefits are expected by the construction of MM2100-EJIP access road:
Traffic mitigation for surrounding roads because of direct connection with MM2100-EJIP Mitigation of traffic congestion of surrounding roads because of formulation of an east -
west trunk road
(6) The Delta Mas-Jakarta-Cikampek toll road access road and the new interchange
Delta Mas-Jakarta-Cikampek toll road access road and the new interchange plan is being implemented by the budget of the industrial estate.
The following benefits are expected by the construction of Delta Mas-Jakarta-Cikampek toll access road and new interchange:
Traffic mitigation for surrounding roads because of construction of new access road and interchange
Mitigation of traffic congestion of surrounding roads because of formulation of an east - west trunk road
(7) Road maintenance and improvement connecting to the industrial estate in Karawang area
Development of Ring road and North-South Road Development in Karawang Area. It is advisable to consider the implementation of countermeasure based on the study results conducted by other study in currently conducting.
Small scale intersection project contributing to the improvement of transportation 5.1.8and logistics
This traffic management project, including intersection improvement, is to improve logistics and transportation in Jabodetabek.
Countermeasures Against Issues of Port Administration of Tanjung Priok 5.1.9
Port management of Cilamaya New Port shall be conducted by PA 2. Efficient implementation of port management needs sufficient experience and high technical/engineering background. Unfortunately PA 2 does not have enough experience or sufficient technical/engineering background. PA 2 should conduct continuous discussions with PELINDO 2 for the smooth transfer of port administration from PELIND 2 to PA 2 and should commence port administration of Tanjung Priok Port as soon as possible.
The Study on Efficient and Integrated Transport/Logistics Development in Eastern MPA
5-18
5.2 Logistic Situation of Jakarta Metropolitan Area at the Opening of Cilamaya Port
Demand of Port in Jakarta Metropolitan Area and the Significance of the Eastern 5.2.1MPA
Chapter 3 analyzed the port choice probability of Tanjung Priok port and Cilamaya port in each area. Based on the result, this section will consider how the demand of containers of Tanjung Priok port and Cilamaya port would be changed after the opening of Cilamaya port in 2020.
Based on the road network conditions5, the following table shows the demand of containers at Tanjung Priok port and Cilamaya port in 2012, 2020, and 2030 (Base Case of Port Choice Probability6). The demand of containers at Tanjung Priok port in 2012 was 6.2 million TEU, and is estimated to increase in 2020 by 7.0 million TEU and by 10.5 million TEU in 2030. The demand of containers at Cilamaya port in 2020 is estimated at 3.2 million TEU, and to be increased by 8.9 million TEU in 2030.
Table 5.2.1 Demands of Containers at Tanjung Priok Port and Cilamaya Port
Note: Karawang is included in the East area
Base Case of Port Choice Probability Source: The Study on Efficient and Integrated Transport/Logistics Development in Eastern MPA
5 Refer to Chapter 3 of Case A (2020) and Case C (2039) in “Table 3.2.1 Analysis Case Set.” 6 Refer to Chapter 3 of Base Case in “Table 3.1.3 Case of Sensitivity Analysis.”
Unit: '000TEU
2012 DKI 1,397West 1,303South 404East 3,111
Total 6,2152020 DKI 2,134 3
West 2,113 1South 574 24East 2,201 3,159
Total 7,022 3,1872030 DKI 3,369 9
West 3,764 3
South 857 82
East 2,484 8,792
Total 10,474 8,886
Year Area Tanjung Priok Cilamaya
The Study on Efficient and Integrated Transport/Logistics Development in Eastern MPA
5-19
Table 5.2.2 Road Network Conditions
Year 2020 2030
Road netw
ork conditions
i) Cilamaya access road ○ ○
ii) Outer outer ring road ○ ○
iii) Tanjung Priok access road ○ ○
iv) Second Jakarta – Cikampek road ○(Phase I) ○(whole)
v) Improving access to Cikampek toll road ○ ○ Source: The Study on Efficient and Integrated Transport/Logistics Development in Eastern MPA
Change in Logistics 5.2.2
This section analyzes how container demand will change at Tanjung Priok port and Cilamaya port in each area, using the share of the whole demands.
The containers in the East area comprise 50% of the total, followed by DKI with 22%, the West area with 21%, and the South area with 7%, based on the Tanjung Priok port in 2012. In 2020, DKI, West and South areas will still use the Tanjung Priok port mainly. In the East area, a share of 31% will move to Cilamaya port in 2020. In 2030, the share of DKI will decrease by 17%, by 19% in the West area and by 4% in the South area, although the share of 45% in the East area will move to Cilamaya port.
Source: The Study on Efficient and Integrated Transport/Logistics Development in Eastern MPA
Figure 5.2.1 Logistics Changers of Containers
The Study on Efficient and Integrated Transport/Logistics Development in Eastern MPA
5-20
Change in Logistics Cost and Time 5.2.3
After the opening of Cilamaya port, the logistics will be divided into two ports - Tanjung Priok port and Cilamaya port - therefore, for the East area, transport time will be saved by using the Cilamaya port, and the duration of trucks in Cilamaya port and days of customs are expected to decrease. Turn ratio of truck transportation will improve and this will lead to a reduction of logistics costs.
(1) Time
Based on the travel speed survey, the travel time of a round trip between a factory in the Eastern area and Tanjung Priok port is analysed. In the case of EJIP in Cikarang, it took 6.3 hours, which was 2.8 hours for the round trip, 1.3 hours for queuing in front of the gate, and 2.3 hours inside the terminal. In the case of Surayacipta in Karawang, it took 6.9 hours, which was 3.4 hours for the round trip, and the same as Cikarang for the time of queuing in front of the gate and inside the terminal.
The following predictions are for the time to Tanjung Priok port and Cilamaya port in 2020 with road development under the road network conditions mentioned in Table 5.2.2.Average travel speeds indicated in Table 5.2.3 are daily average speeds thus the speeds in the peak period could be less than 10 km per hour due to traffic congestion. Traffic demand would be increased in 2020 compared to the present; consequently, traffic congestion would be worsend and time of traffic congestion would be further increased.
In the case with road development, the speed of the section between Cikarang Barat and Cikunir and Jakarta outer ring road is a bit faster, compared to the case with Cilamaya port. On the other hand, the speed of the section between Karawang and Cikarang Barat is slow due to the traffic increase associated with the use of Cilamaya port.
For reference, the case in which the Tanjung Priok access road is not completed and other road development is not yet implemented by 2020 (case with current road condition) is analysed, with expected traffic volume in 2020 shown in the following table7.
7 In the case with current road condition, the speed of the whole network is decreased based on the traffic increase, and the speed
of the section between Cikarang Barat and Cikunir of the Jakarta-Cikampek toll road and arterial road in front of the terminal at Tanjung Priok is also decreased. On the other hand, the speed of Jakarta outer ring road is a bit faster, by 3-4 km/h. This is because the section between Cilincing of Jakarta outer ring road and the junction of Jakarta-Cikampek toll road is missing link of toll road of Tanjung Priok access road, so the traffic from DKI to Jakarta outer ring road via Tanjung Priok access road uses another toll road route (detour) and traffic volume is decreased. In addition, the speed in the section of Karawang and Cikarang Barat is improved, because the traffic that passes through the Jakarta-Cikampek toll road, using the phase 1 section of the second Jakarta-Cikampek toll road is dispersed around Cikarang Barat and the inter change nearby and some part of the traffic volume is decreased.
The Study on Efficient and Integrated Transport/Logistics Development in Eastern MPA
5-21
Table 5.2.3 Predicted Travel Speed, Waiting Time at Terminal Gate and Duration in the Container Terminal 2020
Note: The data of the case with the same current road condition is for reference. The completion of “Master Plan of North Kalibaru Development (short term: 2012-2017)” in Table 2.1.5 is considered.
Source: The Study on Efficient and Integrated Transport/Logistics Development in Eastern MPA
If Cilamaya port is not opened, it will take 7.1 hours from Cikarang and 7.7 hours from Karawang. Time for queuing in front of the gate and the terminal duration would be the same as the current situation. This is because the capacity of Tanjung Priok port is increased, though all containers are concentrated in only Tanjung Priok port. In terms of round-trip time from the factory to the port gate, after the opening of Tanjung Priok access road, the time will be reduced, although the traffic on Jakarta-Cikampek toll road, especially the section between Cikarang Barat and Cikunir, will worsen. So the time will be about 0.8 hours longer than the current situation from both Cikarang and Karawang.
After the opening, when Cilamaya port and Tanjung Priok port are used, it will take 6.2 hours from Cikarang and 6.8 hours from Kawarang. On the other hand, when Cilamaya port is used, it will take 2.5 hours from Cikarang and 1.4 hours from Karawang, and time is dramatically saved. The time for queuing in front of the gate and inside the terminal as well as round trip will drastically shorten.
Cikarang is located in the middle between Tanjung Priok port and Cilamaya port, so if using Tanjung Priok port, the section of Cikarang Barat and Cikunir of the Jakarta-Cikampek toll road has a great impact on traffic congestion. However, if using Cilamaya port, the other section of Karawang and Cikarang Barat is used, so 1.2 hours is saved from Cikarang and 2.9 hours is shortened from Karawang.
Toll Road
Average Speed Average Speed
Case With Road Development Case With Current
Road Condition Without
Cilamaya Port With
Cilamaya Port Without
Cilamaya Port
Jakarta-Cikampek
Toll Road
Karawang - Cikarang Barat 53 km/h 49 km/h 68 km/h
Cikarang Barat - Cikunir 17 km/h 20 km/h 12 km/h
Jakarta Outer Ring Road 33 km/h 34 km/h 37 km/h
Tanjung Priok Access Road 60 km/h 60 km/h ―
Arterial Road in front of Terminal at Tanjung Priok Port
(without Tanjung Priok Access Road) ― ―
5 km/h
Cilamaya Access Road ― 68 km/h ―
Port Time for queuing
in front of gate
Terminal
Duration
Tanjung Priok Port (without Cilamaya Port) 1.3 hours 2.3 hours
Tanjung Priok Port (with Cilamaya Port) 1.0 hour 2.0 hours
Cilamaya Port 0 hours 0.5 hours
The Study on Efficient and Integrated Transport/Logistics Development in Eastern MPA
5-22
Table 5.2.4 Time, Using Tanjung Priok Port and Cilamaya Port in 2020
Note: The data of the case with the same current road condition is for reference.
The completion of “Master Plan of North Kalibaru Development (short term: 2012-2017)” in Table 2.1.5 is considered. Source: The Study on Efficient and Integrated Transport/Logistics Development in Eastern MPA
Table 5.2.5 Time of Breakdown, Using Tanjung Priok Port and Cilamaya Port in 2020
Note: JORR (Jakarta Outer Ring Road)
The data of the case with the same current road condition is for reference. The completion of “Master Plan of North Kalibaru Development (short term: 2012-2017)” in Table 2.1.5 is considered.
Source: The Study on Efficient and Integrated Transport/Logistics Development in Eastern MPA
Travel time on the Jakarta - Cikampek toll road is estimated to be longer as traffic demand increase in the future. It should be noted that traffic congestion on the Jakarta - Cikampek Toll Road is not mainly caused by trucks but by private passenger cars. It implies that development of Cilamaya port would not give significant impact on the traffic congestion of the roads in the Jakarta Metropolitan area. On the other hand a more straight-forward measure is to increase road capacity to accommodate increasing traffic demand on the corridor. In this sense it is needed to development of the second Jakarta -
Unit: hour2020
Case with same currentroad condition
Tanjung Priok PortTanjung Priok Port
(without Cilamaya port)Tanjung Priok Port
(with Cilamaya port) Cilamaya Port Tanjung Priok Port(without Cilamaya port)
Factory to port gate 1.3 1.8 1.6 1.0 3.0Queuing in front of port gate 1.3 1.3 1.0 0.0 1.3Inside terminal 2.3 2.3 2.0 0.5 2.3Gate to factory 1.5 1.8 1.6 1.0 3.0
Total 6.3 7.1 6.2 2.5 9.5Factory to port gate 1.6 2.1 1.9 0.5 3.1Queuing in front of port gate 1.3 1.3 1.0 0.0 1.3Inside terminal 2.3 2.3 2.0 0.5 2.3Gate to factory 1.8 2.1 2.0 0.5 3.2
Total 6.9 7.7 6.8 1.4 9.8
Industrial Estate Section Case with road development2013
2020
Cikarang(EJIP)
Karawang(SURAYA CIPTA)
Unit: minute (hour)
(Karawang -Cikarang Barat)
(Cikarang Barat -Cikunir)
2013 Cikarang Factory → Tanjung Priok Port 10 - 28 21 20 79 (1.3)(EJIP) Tanjung Priok Port → Factory 7 - 31 26 25 88 (1.5)Karawang Factory → Tanjung Priok Port 2 26 28 21 20 96 (1.6)(SURAYA CIPTA) Tanjung Priok Port → Factory 2 25 31 26 25 109 (1.8)
2020 Cikarang Factory → Tanjung Priok Port 10 - 71 26 4 110 (1.8)(EJIP) Tanjung Priok Port → Factory 7 - 71 28 4 109 (1.8)Karawang Factory → Tanjung Priok Port 2 23 71 26 4 125 (2.1)(SURAYA CIPTA) Tanjung Priok Port → Factory 2 23 71 28 4 127 (2.1)Cikarang Factory → Tanjung Priok Port 10 - 60 25 4 99 (1.6)(EJIP) Tanjung Priok Port → Factory 7 - 60 27 4 97 (1.6)Karawang Factory → Tanjung Priok Port 2 24 60 25 4 115 (1.9)(SURAYA CIPTA) Tanjung Priok Port → Factory 2 24 60 27 4 117 (2.0)
2020 Cikarang Factory → Tanjung Priok Port 10 - 102 23 44 179 (3.0)(EJIP) Tanjung Priok Port → Factory 7 - 102 25 46 179 (3.0)Karawang Factory → Tanjung Priok Port 2 18 102 23 44 189 (3.1)(SURAYA CIPTA) Tanjung Priok Port → Factory 2 18 102 25 46 192 (3.2)
Section to and from the portfactory - gate of
toll road
Jakarta Cikampektoll road
(Cikarang Barat-Karawang)
Cilamaya accessroad Total
2020 Cilamaya Port Cikarang Factory → Cilamaya Port 10 24 26 61 (1.0)(EJIP) Cilamaya Port → Factory 7 24 26 58 (1.0)Karawang Factory → Cilamaya Port 2 - 26 28 (0.5)(SURAYA CIPTA) Cilamaya Port → Factory 2 - 26 28 (0.5)
JORR(Cikunir -
East JORR)
East JORR -port gate
Total
Tanjung Priok Port(withoutCilamaya port)
Tanjung Priok Port(withCilamaya port)
Year Section to and from the portfacotry - gate of
Jakarta Cikampektoll road
Jakarta Cikampek toll road
Case with same currentroad conditionTanjung Priok Port(without Cilamaya port)
Year
The Study on Efficient and Integrated Transport/Logistics Development in Eastern MPA
5-23
Cikampek Toll Road to increase road capacity. Otherwise the traffic demand has already reached its traffic capacity on the toll road and soon or later it would be oversaturated and traffic flows become unstable. It implies that traffic congestion with long queue would frequently occur and it would bring about very slow speed on the road.
(2) Logistics Cost
The logistics cost8 from Tanjung Priok port to the factory in Cikarang is actually Rp 2,700,000 in the case of the green lane and Rp 4,100,000 in the red lane, as shown in the following table. The logistics cost is composed of the cost inside the port and the transport cost. Included in the cost inside the port is the cost of lift on or off and import customs, and the customs inspection fee and container storage tariff is added in the case of the red lane. The container storage tariff is charged 7 days out of 10 days9, which is usually needed for customs in 2013.
When the Cilamaya port is used, the cost of lift on or off and import customs are set up as the same condition and the duration of customs is shortened by 5 days in the red lane, it costs Rp 2,100,000 in the green lane and Rp 3,200,000 in the red lane. The logistics cost is reduced by 20%.
By saving the time mentioned above, the turnover rate of transport10 will improve and the transport cost is expected to reduce. So, the transport cost to Cilamaya port will be reduced by 20% from Cikarang and by 30% from Karawang, compared with current cost.
8 The logistic cost of cargo owners 9 JJC Questionnaire survey and JICA PROTAF Study 10 The turnover rate of transport is currently only one round-trip when the operation hours of the logistics company is 8 hours,
considering the time to Tanjung Priok port mentioned above. When the Cilamaya port is used in 2020, it will be possible to transport for two round-trips from Cikarang and four round-trips from Karawang
The Study on Efficient and Integrated Transport/Logistics Development in Eastern MPA
5-24
Table 5.2.6 Logistics Cost Using Tanjung Priok Port and Cilamaya Port in 2020
Unit:Rp/20 ft Container
item Description Tanjung Priok Port Cilamaya Port
Green Lane Red Lane Green Lane Red Lane
Port charge
Lift on or lift off* 187,500 187,500 187,500 187,500
Transport cost*** Tanjun Priok Port to Cikarang 2,100,000 2,100,000 - -
Cilamaya Port to Cikarang - - 1,520,000 1,520,000
Total Cost 2,701,500 4,097,300 2,121,500 3,245,300
Note: * Lift on or lift off to trailer in container yard
** Storage tariff for 3 days is free. From 4 days to 10 days, it is charged for Rp 54,400/day
For green lane, the dwell time in container yard is 2 days for both Tanjung Priok port and Cilamaya port. For red lane, the dwell time in container yard is10 days for Tanjung Priok port and 5 days for Cilamaya port.Storage tariff is calculated based on the 7days for Tanjung Priok port and 2 days for Cilamaya port.
*** The transport cost is considered the turnover rate of transport. Price escalation and so on is not considered. The cost inside the port is calculated based on the current cost at Tanjung Priok port. The transport cost is calculated based on the interview from logistics company.
Source: JICT leaflet, Interview from logistics companies.
Demand Forecast and Transport Time 5.2.4
The following table summarizes each case regarding the demand of containers and round-trip transport time from factory to port.
In the case with road development, if using Cilamaya port, more than 1.1 hours is saved from Cikarang and 2.4 hours from Karawang, and the time will drastically shorten.
In the case with current road condition, it takes 6.0 hours from Cikarang to Tanjung Priok port for round-trip transport time and 6.3 hours from Karawang.
Table 5.2.7 The Demand of Containers and Round-Trip Transport Time from Factory to Port
Note: The data of the case with the same current road condition is for reference. Source: Study on Efficient and Integrated Transport/Logistics Development in Eastern MPA
Tanjung Priok Cilamaya Tanjung Priok Cilamaya
Case with Road Development(with Cilamaya Port) 7.0 3.2 3.2 2.0 3.9 1.0
Case with Current RoadCondition(without Cilamaya Port)
10.2 - 6.0 - 6.3 -
Container Deamand(million TEU)
Round-Trip Transport Time from Factory to Port(hour)
Tanjung Priok(2020)
Cilamaya(2020)
Cikarang(EJIP) Karawang(SURAYA CIPTA)
The Study on Efficient and Integrated Transport/Logistics Development in Eastern MPA
5-25
5.3 Long-term Issues and Solutions contributing to the Logistics Improvement of Eastern MPA after Opening of Cilamaya Sea Port in 2020.
Long-Term Countermeasure Against Shortage of Terminals in Tanjung Priok Port 5.3.1
Constructing a B2B System of Private Sector
If an environment of effective port logistics information is constructed, the government should support this private sector B2B system working with the B2G system incorporated into the INSW B2G information, such as import declaration and import permit information, is shared with the platform of selected B2B information, which makes it possible for stakeholders to exchange information related to port logistics and thus contributes to the efficiency of port logistics But there is a risk that it will require much time to coordinate various organizations for constructing an INSW.
Countermeasure for Road Congestion in Front of the Terminal at Tanjung Priok 5.3.2Port
Fly-Over
Three flyovers are requested (R.E. Martadinata Flyover, Sulawesi – Tanjun priok flyover, and Pasoso flyover). Construction of these 3 flyovers will contribute to traffic mitigation for arterial roads in front of the container terminal at Tanjung Priok Port. Tanjung Priok access road construction is ongoing and will complete in 2015. After the opening of the Tanjung Priok access road, traffic congestion on arterial roads in front of the container terminal at Tanjung Priok Port will be solved. However, considering the future of the area, these flyover projects shall be implemented as a long-term development plan.
The following benefits are expected by construction of flyovers in front of the container terminal at Tanjung Priok Port:
Tanjung Priok railway station, bus station, commuter vehicles and other vehicles will be separated and maintain smooth traffic by the construction of R.E. Martadinata flyover
The main flow to the port and sub-traffic will be able to be divided by the construction of Sulawesi - Tg.PA flyover, thereby maintaining smooth traffic
In/out traffic from/to port and railway station could be divided and maintain smooth traffic by the construction of Pasoso flyover
Countermeasure for Road Congestion of Jakarta-Cikampek Toll Road 5.3.3
(1) Construction of Second Jakarta-Cikampek Toll Road
The Second Jakarta – Cikampek Toll Road will be constructed in 2 phases. Phase 1 shall consist of short-term projects and Phase 2 shall consist of long-term projects based on the New Cilamaya port development plan.
Phase 2
The Phase 2 section is from Interchange 2 to the end point of Junction 2(total length of 36.60 km)of the Second Jakarta – Cikampek Toll Road. This Phase 2 section is a long section and will take a long time
The Study on Efficient and Integrated Transport/Logistics Development in Eastern MPA
5-26
for land acquisition, and with no forecast for the opening of JORR 2, Phase 2 section shall be a long-term plan. If the ring road and north - south trunk road could be implemented, traffic for the existing Jakarta – Cikampek toll road will reduce. Thus, the Second Jakarta – Cikampek Toll Road shall be implemented in Phase 2.
The following benefits are expected by the construction of Second Jakarta – Cikampek Toll Road:
Direct access from industrial estate to Cilamaya New Port without using the existing Jakarta – Cikampek toll road, thereby contributing to traffic mitigation for the existing Jakarta – Cikampek toll road.
To maintain bypass function for the existing Jakarta – Cikampek toll road for accident and/or disaster.
(2) ETC
ETC system is an automated tariff collection system using an on-board unit. ETC will be able to contribute to traffic congestion. However, system development, tariff system coordination, development of on board system and so onwill takes a long time. Therefore, ETC system will be long-term planning.
The following benefits are expected by ETC:
Mitigation of traffic congestion at toll gate by ETC Reduction of personal expense by employment of ETC
Countermeasures Against Congestion of Access Road to Interchange of Toll Road 5.3.4of Eastern MPA Located in Industrial Estate
(1) Cikarang Barat Interchange
Cikarang Barat Interchange is one of the important interchanges connecting with JABABEKA, Dry Port, EJIP and other industrial estates. Jl. Raya Cibarusah Bekashi connects with Cikarang Barat Interchange and the south side industrial estate and traffic congestion is occurring frequently. There is a flyover to avoid this traffic congestion on arterial roads. However, the flyover accepts only north direction traffic and causes traffic congestion for the toll and arterial roads. Also, there is much illegal parking by mini buses, trucks, and other cars. This is also a cause of traffic congestion. To solve this situation, there is necessity of coordination with concerned agencies and stakeholders and this takes a long time. Therefore, this Cikarang Barat Interchange project shall be a long-term project.
The following benefits are expected by construction of Cikarang flyover project:
Traffic mitigation for arterial road and Cikarang Barat interchange access road will be expected, and the surrounding road congestion shall also be mitigated by the construction and improvement of arterial road and bus station
The Study on Efficient and Integrated Transport/Logistics Development in Eastern MPA
5-27
(2) Karawang Barat Interchange
KIIC and San Diego Hills Memorial Park are locating on the south side of Karawang Barat Interchange and the north side access road is connecting with Karawang city. Even though it is a high traffic volume access road, there are no signal controls at the grade intersection and it causes traffic congestion. Also, the access road is 2 lanes and there are many shops and illegal parking. This is one of the causes of traffic congestion for this access road. The south side access road connects with the toll road and KIIC industrial estate. This road is a 4-lane access road and is kept in good condition, for an access road. To solve this situation, there is necessity of coordination with concerned agencies and stakeholders, which takes a long time. Therefore, this Karawang Barat Interchange project shall be a long-term project.
The following benefit is expected by construction of Karawang Barat Interchange project:
Mitigation of traffic congestion for the interchange access road and arterial roads by the improvement of the interchange access road
(3) Karawang Timur Interchange-2
Karawang Timur Interchange is connecting with KIMK、SURYACIPTA industrial estate in the south direction and with Karawang city in the north direction. The north side access road is 2 lanes and there is much traffic congestion due to the short length of the access road. The access road for the south direction is keeping relatively good. However, traffic from/to the industrial estate will concentrate at the same time, and the toll gate is congested at the same as Cikarang Timur Interchange. To solve this situation, there is necessity of coordination with concerned agencies and stakeholders, which takes a long time. Therefore, this Karawang Timur Interchange project shall be a long-term project.
The following benefit is expected by construction of Karawang Timur Interchange-2 project:
Mitigation of traffic for connecting arterial roads with toll road by the improvement of Karawang Timur Interchange
Countermeasures for Logistics Efficiency of Cilamaya New Port 5.3.5
(1) Logistics Center Near Cilamaya Port and Cikampek
This project aims to create a new logistics network centered at the new Cilamaya Port. The new port will have an efficient cargo/logistics distribution system and will contribute to the economic activities in the region. Traffic congestion in and around the port area would be alleviated.
The new port was planned in Cilamaya with a capacity of 7.5 million TEUs in 2030. However, the logistics facilities supporting its activities such as container depots, warehouses, logistics center, stockyard, etc., have not yet been considered.
In order to promote the use of the new port and to avoid crucial traffic congestion around the Cilamaya Port, it is necessary to establish a strategic logistics network connecting Cilamaya Port and nearby industrial areas. The economic and industrial development in Indonesia requires more advanced logistics
The Study on Efficient and Integrated Transport/Logistics Development in Eastern MPA
5-28
services. The development of: 1) port-supporting facilities near Cilamaya Port, and 2) a dry port and logistics center along the highway and railway are required in order to provide such advanced services.
The port supporting logistics facilities will be comprised of two major logistics parks.
This project is supposed to have a functional base for physical distribution to support logistics for the Cikampek and Karawang regions. Arrangement of facilities such as highly sophisticated shipping storages, storage equipped with refrigerator, and container freight stations are planned.
1) Logistics Park (A); Port-Supporting Area near Cilamaya Port
I. Car stockyard (for loading and unloading, pre-delivery inspection (PDI))
II. Container stockyard (for empty containers, container repair yard, temporary storage for loaded containers
III. Logistics center (high performance warehouses, refrigerated warehouses, trailer parking area, CFS, etc.)
IV. Port-related industry (distributive processing, Assembly processing plant, etc.)
V. Offices and others
Container Depot/Dry Port Car Stockyard
Logistics Center High Performance Warehouses (Indoor)Source: MPA Study Team from Cargo Circulation Center at Tokyo Bay in Japan
Figure 5.3.1 Images of Facilities in Logistics Center
The Study on Efficient and Integrated Transport/Logistics Development in Eastern MPA
5-29
Table 5.3.1 Area Allocation of Logistics Park (1)
Item Area Note (1) Car stockyard 20 ha For loading and unloading, PDI (2) Container depot 30 ha Empty containers, container repair yard, etc.
(3) Logistics center 30 ha High performance warehouses, refrigerated warehouses, trailer parking area, CFS, etc.
(4) Port-related industries 30 ha Assembly processing plant, etc. (5) Offices and others 20 ha (6) Road 20 ha
TOTAL 150 ha
Source: MPA Study Team
2) Logistics Park (B); Dryport and Logistics Center (along the highway and the railway), in Cikampek along the highway and railway
I. Dryport (provides an integrated port and logistics services as a port terminal, to be able to complete all document formalities of port clearance and customs clearance); and
II. Logistics center (high performance warehouses, distributive processing center, refrigerated warehouses, trailer parking area, CFS, etc.).
Table 5.3.2 Area Allocation of Logistics Park (2)
Item Area Note
(1) Dry port 100 ha Extended gate of Cilamaya Port, provides one-stop services for logistics
(2) Logistics center 50 ha TOTAL 150 ha
Source: MPA Study Team
To make the dry port competitive against Cilamaya Port and Tanjung Priok Port and to make logistics companies locate into the logistics parks, some arrangements should be taken in close cooperation with the Government of Indonesia.
Integrated operations of the Cilamaya Container Terminal and the dry port are advisable for cargo handling efficiency. If Cilamaya Port and the dry port are operated by one operator, cargo handling would be more efficient.
The Study on Efficient and Integrated Transport/Logistics Development in Eastern MPA
5-30
Table 5.3.3 Preliminary Cost Estimates for Logistics Park (A) ~Port Supporting Area~
Item Unit Price
(IDR billion)Quantity Unit
Cost (IDR billion)
Note
Logistics master plan 20 1 LS 20
F/S and B/D 10 1 LS 10
Land acquisition 2 150 ha 300
Land improvement 1,191 1 LS 1,191
Infrastructure and utility 305 1 LS 305
Contingency 160 1 LS 160
Subtotal 1,986
Car stockyard 302 1 LS 302 Pavement, office
Container depot 453 1 LS 453 Pavement, office
Logistics center 1,357 1 LS 1,357 Warehouses
Port-related industries 1,357 1 LS 1,357 Factories
Contingency 345 1 LS 345
Subtotal 3,814
TOTAL 5,800 Source: MPA Study Team
(2) Railway transportation connecting to Port (Utilization of Outer Ring Railway)
General (Railway)
North Karibaru container terminal at Tanjung Priok will have opened before the opening of Cilamaya New Seaport. Therefore, Cikarang Dry Port which is located in the industrial area spreading out in Bekasi and Cikarang areas will become more important.
In the long-term scheme, Cikarang Dry Port is required as a hub connecting with 3 logistic bases, JICT and North Kalibaru container terminals in Tanjung Priok Seaport and Cilamaya New Seaport.
In addition, the railway route connecting the 3 bases will consist of an individual route for each base as follows.
1) JICT / Tanjung Priok : Bekasi Line Route(Ongoing DDT Project)
2) North Kalibaru/ Tanjung Priok : Outer Ring Railway Line Route (Under Planned)
It is indispensable to use the Outer Ring Railway Line plan, which has been opened by DGR for connecting Cikarang with North Kalibaru, Tanjung Priok.
The Study on Efficient and Integrated Transport/Logistics Development in Eastern MPA
5-31
3) Cilamaya New Seaport : New Access Line to Cilamaya (Via Lema Abang Station) (Under Planned)
Figure 5.3.2 shows JABODETABEK Railway Network Master Plan by DGR (2020). Excepting Bekasi line route (Java Main Line), the other 2 routes are new lines that will be constructed. All of these lines are too short for freight railway to be operated economically in case of these lines being exclusive freight railway.
Outer Ring Railway: This line will be opened from Tanjung Priok Seaport (Via Marinda) connecting with Cikarang Station by the year 2020. After that, this line will be extended to Parung Panjang (Serpong line) through Nambo and Citayam (Bogor line). Even though details of the route and structure are not clear, it must be developed as a passenger and freight railway.
Access to the Cilamaya New Seaport: Route selection of this access is currently under study in Feasibility Study. Combined structure of road and railway is considered to be possible idea. Connecting point of railway is not yet decided, but it is scheduled to be connected with Java mainline.
The Study on Efficient and Integrated Transport/Logistics Development in Eastern MPA
The Study on Efficient and Integrated Transport/Logistics Development in Eastern MPA
5-33
(3) Single Window of Procedure in Port
At the opening of Cilamaya Port, we think there is no question that the port-related EDI system and single window system will be operated in Tanjung Priok Port or elsewhere already. Therefore, the port-related EDI system in Cilamaya Port will probably be an expansion of the system used in Tanjung Priok Port or elsewhere.
It is assumed that users of Cilamaya Port will mainly be port-related companies neighboring Tanjung Priok Port. Then we expect that the B2B system processing port logistics business information in Cilamaya Port will be the expansion of the B2B system, which would be used by port logistics companies in Tanjung Priok Port at this time.
In this case, the aim for port logistics is to create a more efficient environment for port-related logistics information. In order to tackle the issue, we think it is effective that the nongovernmental B2B system, which will be able to cooperate with governmental B2G systems integrated into INSW, should be selected and supported by the government. This will make it possible for B2G information focusing on Customs declaration and license application to be shared with the selected B2B information platform and for stakeholders related to port logistics to exchange a wide range of information. This would contribute to efficiency of logistics, cost reduction and improvement of international competitiveness in Indonesia.
The Study on Efficient and Integrated Transport/Logistics Development in Eastern MPA
6-1
6. RECOMMENDATION CONTRIBUTING TO LOGISTICS IMPROVEMENT IN EASTERN MPA
Eastern MPA is recognized as being a significant area to develop the growth of Indonesia. However, Eastern MPA is confronted with the problem of high logistics costs caused by serious traffic congestion and various problems at the terminal in Tanjung Priok Port. In order to solve this logistics cost problem, the following solutions are recommended as countermeasures against the logistics cost problem and logistics efficiency in Eastern MPA, after the opening of Cilamaya Port, which is also recommended.
6.1 Recommendation Contributing to the Logistics Improvement in Eastern MPA until 2020
The high logistics cost problem, caused by the long transportation time between Eastern MPA and Tanjung Priok Port (until the opeing of Cilamaya New Port in 2020) requires the following countermeasures.
6.1.1 Short-Term Countermeasure of Infrastructure for Shortage of Terminal Space at Tanjung Priok Port
(1) Early Service of North Kalibaru
Early service of a new container terminal developed at North Kalibaru is a short-term countermeasure against the shortage of container terminals. Implementation would be done with private funds.
(2) Renewal of Container Handling Facilities
In order to alleviate the congestion in the container yard, continuous input of new GC and RTG should be taken.
1) Continuous introduction of twin movement system should be taken from the viewpoint of quay- wall side.
2) Introduction of a more efficient GC type compared with the former dual mode GC type, except for twin movement type should be accepted.
3) JICT-1 has introduced six (6) new RTGs in the container yard among sixty three (63) RTGs. These new RTGs are a hybrid type and have high capability and a 5+1 stacking function. JICT has a plan to procure an additional fifteen (15) new RTGs in 2014.Implementaion would be done by private port operator.
(3) Extension of Railway into Container Terminal
In order to bring the containers to the outside of the terminal by using an existing railway infrastructure, transportation of containers by rail is promoted and the container handling capacity in the terminal is
The Study on Efficient and Integrated Transport/Logistics Development in Eastern MPA
6-2
strengthened by extending a railway into the terminal, which also solves the problem of double handling. Concrete countermeasures should be taken to strengthen handling capacity.
1) Readjustment of railway wiring in Cikarang Dry Port
2) Shuttle operation of high-speed cargo railway
Approximately 12% of annual handling capacity (2,000,000 TEU/year) of Cikarang Dry Port could be transported by railway by mentioned countermeasure.
3) Introduction of cargo handling machine
Introduction of cargo handling machine enable cargo railway to operate the regular train exactly and reduce the idle time of operation drastically.
6.1.2 Short-Term Countermeasures for Shortage of Terminal Space in Tanjung Priok Port
The following countermeasures should be taken for the cargo handling system for the shortage of terminal space
(1) Reducing Time for Customs Clearance (Change of Method of Customs Duty Payment, Additional Staff of Customs Officer)
The customs clearance period in the green lane is not so bad compared with other countries, but it is possible to reduce that time by one day by conducting payment of tax duty and import declaration at the same time. On the other hand, the situation of the red lane is serious compared with other countries due to the shortage of customs officers. Time required for customs clearance would be reduced by one or two days by increasing the number of customs officer.
(2) Countermeasure for OB (Real-Time Container Searching System of Container, Utilization of Cikarang Dry Port)
Approximately 11% of all import containers are transferred to the outside of the terminal (OB). The cost incurred by OB is around 4.4 billion yen. In order to reduce the unnecessary trips occasioned by OB, a system could be created that informs the logistics company of the location of the container.
On the other hand, regarding a reduction of OB related costs, red lane importers are recommended to clear customs at Cikarang Dry Port to reduce the unnecessary cost and time incurred by OB. Regarding a container searching system, implementation would be done by port operator through improvement of the current system.
(3) Promotion of 24/7 System (Leveling of Import Declarations)
The avoidance of import declarations on Saturday afternoon and Sunday at present leads to a concentration of import declarations on Monday. As a result, various problems occur. It is necessary to disseminate the “24/7” system so that customs clearance can be implemented on the weekend for cargo owners and logistics companies. Furthermore, the introduction of a discount system for the terminal usage
The Study on Efficient and Integrated Transport/Logistics Development in Eastern MPA
6-3
fee should be considered as incentive for usage during these days and times. Introduction of a discount system for the terminal usage fee would promote the leveling of import declarations and thus contribute to the alleviation of congestion on the inside of the terminal and in front of the terminal.
(4) e-Ticket System (Promotion of Computerization)
By introducing the automatic gate system and the e-Ticket system at JICT, the average hourly container box throughput was improved. But there is a problem obtaining an e-Ticket: queuing at the gate. By obtaining an e-ticket through the internet, queuing at the gate is to be reduced.
(5) Construction of INAPORTNET for Inward and Outward Voyage
INAPORTNET for inward voyage is under development, but the appropriate function of INAPORTNET enables related stakeholders of port logistics to work together with information and to reduce the logistics cost by arranging the environment that INSW works functionally.
6.1.3 Countermeasure of Infrastructure for Road Congestion in Front of Terminal at Tanjung Priok Port
(1) Early Operation of Tanjung Priok Access Road
Regarding the road congestion in front of the terminal, if the Tanjung Priok access road was constructed on schedule, and on/off ramp was connected to container terminal directly, congestion would be alleviated to some extent. Direct access to Tanjung Priok Port made it possible to alleviate the general road congestion in front of the terminal.
6.1.4 Countermeasures for Road Congestion in Front of Terminal at Tanjung Priok Port
(1) Relocation of Container Depot
Relocating the TPS container depot and empty container depot surrounding the port to the Eastern MPA made it possible to alleviate the traffic congestion by the increase of deadhead of empty container. And constructing a TPP and LCL Container Depot for the space of relocation made it possible to alleviate the cost burden of cargo owners by OB.
(2) Constructing a Matching System for Trailers
Constructing a matching system in which export and import is conducted by one trailer would contribute to the alleviation of traffic congestion surrounding the terminal by increasing the ratio of round-use trailers.The matching site would be constructed by the private sector.
6.1.5 Countermeasure for Jakarta-Cikampek Toll Road Congestion
(1) Construction of Phase I of Jakarta-Cikampek Toll Road
For phase I, 11.3 km (out of 47.73 km total) from the junction of the access road of Cilamaya new port to Second Cikampek toll road has been constructed. Because of the construction of a Second Cikampek toll road, the industrial estate south of Jakarta-Cikampek toll road could connect to Cilamaya New Port without passing the Jakarta-Cikampek toll road. Thus, Second Cikampek toll road greatly contributes to
The Study on Efficient and Integrated Transport/Logistics Development in Eastern MPA
6-4
the alleviation of congestion along the Jakarta-Cikampek toll road. Implementaion would be done by PPP scheme.
6.1.6 Countermeasures Against Congestion of Access Road to Interchange of Toll Road of Eastern MPA Located in Industrial Estate
(1) Rehabilitation of Cibitung Interchange
A tollbooth has been established at the south and north ends of the Cibitung interchange, but it is not an appropriate tollbooth because it causes congestion and this congestion continues to the main road of the toll road and south industrial estate. An increase of tollbooths at Cibitung interchange and expansion of the access road make it possible to contribute to the alleviation of congestion on the main toll road and surrounding roads.
(2) Rehabilitation of Cikarang Utama Barrier Gate
Cikarang Utama Barrier Gate is the barrier gate on the main road. There are two barrier gates in the direction of Jakarta, and there is one barrier gate for Cikampek. The number of established barriers is sufficient. It is necessary to protect against vehicles cutting in line by the establishment of separator posts and classified color of pavement to delineate the location of each tollbooth from an early stage when vehicles enter the barrier on the main road. By rehabilitation of these, congestion of the main road of the toll road shall be alleviated.
(3) Rehabilitation of Cikarang Timur interchange
The total number of tollbooths is insufficient and future arrangements with the industrial estate have not been made. Toll road congestion will be alleviated by rehabilitation of gates.
(4) Rehabilitation of Karawang Timur-1 Interchange
A 4-lane access road has been constructed and the situation of the road is relatively reasonable. But, it is necessary to verify the number of tollbooths that will cope with the number of vehicles of the future industrial estate. By increasing the number of tollbooths, the congestion of the main road of the toll road and the surrounding roads would be alleviated.
6.1.7 Countermeasures Against Congestion of the Arterial Road Network of Eastern Industrial Estate and South Arterial Road
(1) Rehabilitation of Kalimalang Road
Congestion of the intersection of Cibarusa Road and the base point of Kalimalang Road is alleviated by construction of a fly-over. And this fly-over construction made it possible to smoothly access the Jakarta-Cikampek toll road.
(2) Rehabilitation of Bali Road
Smooth access between the industrial estate of south of Jakarta-Cikampek toll road and the dry port in JABABEKA was made possible by the rehabilitation of Bali Road.
The Study on Efficient and Integrated Transport/Logistics Development in Eastern MPA
6-5
(3) Rehabilitation of Iman Bonjol Road (Construction of New Bridge)
Iman Bonjol road improvement plans include a 1.6 km road improvement and new bridge construction for crossing the Kalimalang River. This road is also an important trunk road in the north-south direction.
(4) Construction of Dry Port Access Road
It is necessary to connect the dry port and the industrial estate south of the toll road to use the dry port effectively.
(5) Construction of Access Road Between MM2100 and EJIP
The road condition of the industrial estate is very good. Effective logistics is expected to reduce the burden on surrounding roads by working with the lateral roads among the industrial estate.
(6) Construction of Connection Road of Toll Road and New Interchange Between Delta-Mass and Jakarta-Cikampek
The burden on the interchange and surrounding road could be reduced by the construction of a connection road and new interchange between Delta-Mass and Jakarta-Cikampek.
(7) Road maintenance and improvement connecting to the industrial estate in Karawang area.
The road maintenance and improvement in Karawang area is expected to lead to efficient industrial estate logistics.
6.1.8 Small scale intersection project contributing to the improvement of transportation and logistics
It is expected that efficient transportation improvement can be achieved through a short-term project, with limited funds.
6.2 Recommendation Contributing to the Logistic Improvement of Eastern MPA after Opening of Cilamaya Sea Port in 2020.
6.2.1 Long-Term Countermeasure Against Shortage of Terminals in Tanjung Priok Port
(1) Constructing a B2B System of Private Sector Working with B2G System Incorporated into INSW
If an environment of effective port logistics information is constructed, the government should support this private sector B2B system working with the B2G system incorporated into the INSW. B2G information, such as import declaration and import permit information, is shared with the platform of selected B2B information, which makes it possible for stakeholders to exchange information related to port logistics and thus contributes to the efficiency of port logistics.
The Study on Efficient and Integrated Transport/Logistics Development in Eastern MPA
6-6
6.2.2 Countermeasure for Road Congestion in Front of the Terminal at Tanjung Priok Port
(1) Fly-Over
Surrounding Tanjung Priok station buses, general cars, and cargo transportation are separated by the construction of a fly-over at R.E. Martadinata and thus smooth access is granted to each transportation mode and traffic congestion is alleviated. Main traffic and sub-traffic are separated by a fly-over at Sulawesi-Tg.PA and thus it contributes to the alleviation of congestion on the general road. Vehicles entering into the port gate and passing vehicles are separated by construction of Pasoso fly-over and thus it contributes to the alleviation of congestion of the road in front of the port.
6.2.3 Countermeasure for Road Congestion of Jakarta-Cikampek Toll Road
(1) Construction of Second Jakarta-Cikampek Toll Road
Industrial estate located in the south of Jakarta-Cikampek toll road could connect to the new Cilamaya Port by construction of Second Cikampek, which would contribute to the alleviation of congestion of the Jakarta-Cikampek toll road. And, Second Cikampek toll road could be constructed parallel to the Jakarta-Cikampek toll road, which would contribute a by-pass function in times of disaster and accident. Implementaion would be done by PPP scheme.
(2) Adoption of ETC
Adoption of ETC greatly contributes to the alleviation of congestion at tollbooth.
6.2.4 Countermeasures Against Congestion of Access Road to Interchange of Toll Road of Eastern MPA Located in Industrial Estate
(1) Rehabilitation of Cikarang Barat Interchange
By improving the interchange of Cikarang Barat and connecting roads, congestion of local arterial roads linked to interchange access road would be alleviated, and local arterial roads would be rehabilitated. Also, by constructing bus stops, the traffic safety of users of public transportation would be secured and congestion of surrounding roads would be alleviated.
(2) Rehabilitation of Karawang Barat Interchange
By rehabilitating Karawang Barat interchange and improving roads that link to the interchange, congestion of local arterial roads linking to the interchange access would be alleviated.
(3) Rehabilitation of Karawang Timur Interchange-2
The alleviation of congestion of local arterial roads linking to the main road of the toll road would be achieved by rehabilitation of the access road of Karawang Timur interchange.
The Study on Efficient and Integrated Transport/Logistics Development in Eastern MPA
6-7
6.2.5 Countermeasures for Logistics Efficiency of Cilamaya New Port
It is necessary to construct a new logistics network in the center of Cilamaya new port. The following recommendations should be made to contribute to the economic activity in this area by arranging the distribution system of cargo effectively.
(1) Logistics Center Near Cilamaya Port
Cilamaya Port is expected to handle 8,800,000 TEU in 2030. A logistics center is recommended for promoting the usage of the new port, avoiding traffic congestion surrounding the new port, and as part of a strategic network arrangement between Cilamaya Port and the surrounding industrial estate.
(2) Cikampek Logistics Center
Sophiscated warehousing function, refrigerated warehousing function, and a container cargo base are recommended in order to construct the supporting function of the logistics of Cikampek and Karawang.
(3) Cilamaya Access Road
By connecting the Jakarta-Cikampek toll road and Cilamaya access road, efficient distribution of cargo would be achieved.
(4) Railway Transportation Connecting to Port (Utilization of Outer Ring Railway)
The railway will be connected to Cikarang Station by way of Tanjung Priok Port and Malunda. After that, the railway will be connected to Parun Panjan by way of Nambo and Titayam, based on the plan of DGR. Railway cargo would be strengthened by use of the outer railway.
(5) Single Window of Procedure in Port
At the opening of Cilamaya Port, the port-related EDI system and single window system will be operated in Tanjung Priok Port or elsewhere already. In this case, the aim for port logistics is to create a more efficient environment for port-related logistics information. In order to tackle the issue, we think it is effective that the nongovernmental B2B system, which will be able to cooperate with governmental B2G systems integrated into INSW, should be selected and supported by the government. This will make it possible for B2G information focusing on Customs declaration and license application to be shared with the selected B2B information platform and for stakeholders related to port logistics to exchange a wide range of information. This would contribute to efficiency of logistics, cost reduction and improvement of international competiveness in Indonesia. This system would be constructed by government fund.
6.3 Project Contributing to the Improvement of Transportation/Logistics in Eastern MPA
Projects mentioned above in 6.1 and 6.2 are written up in Table 6.3.1.
The Study on Efficient and Integrated Transport/Logistics Development in Eastern MPA
6-8
Table 6.3.1 Recommended Projects Contributing to the Improvement of Transportation/Logistics in Eastern MPA
Short-Term Countermeasure by 2020 Long-Term Countermeasure after Opening of Cilamaya Port in 2020
Countermeasure of infrastructure for shortage of capacity of container terminals at Tanjung Priok Port
(1) Early service of North Kalibaru (2) Renewal of container handling facilities (3) Extension of railway into container terminal, Readjustment of
railway wiring in Cikarang Dry Port, shuttle operation of high-speed railway, introduction of cargo-handling machine
Countermeasure for shortage of terminal space at Tanjung Priok Port
(1) Reduction of time for customs clearance (Change of method of customs duty payment, additional customs officer staff )
(2) Countermeasure for OB (Real-time container searching system, utilization of Cikarang Dry Port)
(3) Promotion of 24/7 system (Leveling of import declarations) (4) e-Ticket system (Promotion of computerization) (5) Construction of INAPORTNET for inward and outward
voyage
(1) Construction of a B2B system of private sector working with B2G system incorporated into INSW
Countermeasure of infrastructure for road congestion in front of terminal at Tanjung Priok Port
(1) Early operation of Tanjung Priok access road (1) Construction of fly-over
Countermeasure for road congestion in front of terminal at Tanjung Priok Port
(1) Relocation of container depot (2) Constructing a matching system of trailers
Countermeasure for Jakarta-Cikampek toll road congestion
(1) Construction of Phase I of Jakarta-Cikampek toll road congestion
(1) Construction of Second Cikampek toll road (2) Adoption of ETC
The Study on Efficient and Integrated Transport/Logistics Development in Eastern MPA
6-9
Short-Term Countermeasure by 2020 Long-Term Countermeasure after Opening of Cilamaya Port in 2020
Countermeasure for congestion of access road to interchange of toll road of Eastern MPA located in industrial estate
(1) Rehabilitation of Cibitung interchange (2) Rehabilitation of Cikarang Utama barrier gate (3) Rehabilitation of Cikarang Timur interchange (4) Rehabilitation of Karawang Timur-1 interchange
(1) Rehabilitation of Cikarang Barat Interchange (2) Rehabilitation of Karawang Barat interchange (3) Rehabilitation of Karawang Timur
interchange-2
Countermeasure for congestion of arterial road network of eastern industrial estate and south arterial road
(1) Rehabilitation of Kalimalang Road (2) Rehabilitation of Bali Road (3) Rehabilitation of Jl.Iman Bojol (Construction of New Bridge) (4) Construction of dry port access road (5) Construction of access road between MM2100 and EJIP (6) Construction of connection road of toll road and new
interchange between Delata-Mass and Jakarta-Cikampek (7) Road maintenance and improvement connecting to the
industrial estate in Karawang area.
Countermeasure for logistics efficiency of Cilamaya New Port
(1) Logistics center near Cilamaya Port (2) Cikampek logistics center (3) Cilamaya access road (4) Utilization of outer ring railway (5) Single window of procedure in Port
Countermeasure for improvement of transportation and logistics in Jabodetabek
(1) Small- scale intersection project contributing to the improvement of transportation and logistics
Source: The Study on Efficient and Integrated Transport/Logistics Development in Eastern MPA