Japan International Cooperation Agency (JICA) Haiphong People's Committee Socialist Republic of Vietnam The Study on Sanitation Improvement Plan for Haiphong City in The Socialist Republic of Vietnam FINAL REPORT July 2001 Nippon Koei Co., Ltd. EX Corporation S S S 01 95 J R SUPPORTING REPORT
Transcript
Japan International Cooperation Agency (JICA)
Haiphong People's CommitteeSocialist Republic of Vietnam
The Studyon
Sanitation Improvement Plan for Haiphong Cityin
The Socialist Republic of Vietnam
FINAL REPORT
July 2001
Nippon Koei Co., Ltd.
EX Corporation
S S S
0 1 95J R
SUPPORTING REPORT
LIST OF REPORTS
SUMMARY
MAIN REPORT
Volume 1 Sanitation Master Plan
Volume 2 Feasibility Studies for the Priority Projects
SUPPORTING REPORT
DATA BOOK
EXCHANGE RATE FOR COST ESTIMATION
Estimate of Base Cost : As of June 2000 Price Level Currency Exchange Rate : USD1.0 = VND14,072
i
THE STUDY ON SANITATION IMPROVEMENT FOR HAIPHONG CITY
IN THE SOCIALIST REPUBLIC OF VIETNAM
FINAL REPORT
SUPPORTING REPORT
Table of Contents A. RESULTS OF FIELD SURVEY WORKS
A.1 First Study in Vietnam.............................................................................................A-1 A.1.1 Interview Survey of 500 Households...........................................................A-1 A.1.2 Interview Survey of 100 Factories ...............................................................A-3 A.1.3 Survey for the Current Environmental Conditions .....................................A-5 A.1.4 Source-wise Unit Pollution Load Study ......................................................A-9 A.1.5 Sewer Line and Drainage Channel Profile Study......................................A-17 A.1.6 Study of Leachate from Solid Waste Disposal Site...................................A-18 A.1.7 Household Waste Generation Survey.........................................................A-34 A.1.8 Solid Waste Collection Quantity Survey ...................................................A-38 A.1.9 Solid Waste Composition Analysis ............................................................A-40
A.2 Second Study in Vietnam ......................................................................................A-43 A.2.1 Drainage Topographic Survey ....................................................................A-43 A.2.2 Sewerage Topographic Survey ...................................................................A-46 A.2.3 Topographic Survey for Trang Cat Landfill ..............................................A-49 A.2.4 Geological Survey for Sewerage Project ...................................................A-52 A.2.5 Geological Survey for Trang Cat Landfill.................................................A-61 A.2.6 Environmental Impact Assessment for Drainage Project .........................A-66 A.2.7 Environmental Impact Assessment for Sewerage Project ........................A-70 A.2.8 Environmental Impact Assessment for Solid Waste Management...........A-75 A.2.9 Recycling Materials Market Survey ..........................................................A-80 A.2.10 Hazardous Industrial Waste Survey ...........................................................A-87
B. IMPLEMENTATION OF PILOT PROJECT B.1 Objectives and Outline of Pilot Project..................................................................B-1 B.2 Contact Purification Unit ........................................................................................B-1 B.3 Activated Sludge Unit .............................................................................................B-4 B.4 Technology Transfer ................................................................................................B-9
C. Environmental Impact Assessment ................................................................................C-1 C.1 General Matters of Environmental Impact Assessment ........................................C-1
C.1 1 Introduction ...................................................................................................C-1 C.1.2 Environmental Policies and Legislation ......................................................C-2
ii
C.1.3 Vietnamese Laws for Land Use and Resettlement Procedures..................C-8 C.1.4 Baseline Data in Study Area.......................................................................C-18
C.2 Environmental Impact Assessment for Drainage Project....................................C-25 C.2.1 Project Description......................................................................................C-25 C.2.2 Baseline Data Survey Results.....................................................................C-28 C.2.3 Present Drainage Status ..............................................................................C-51 C.2.4 Environmental Impacts of the Project........................................................C-53 C.2.5 Mitigation Measure .....................................................................................C-62 C.2.6 Outline Resettlement Action Plan ..............................................................C-71 C.2.7 Monitoring Programs ..................................................................................C-76
C.3 Environmental Impact Assessment for Sewerage Project...................................C-81 C.3.1 Project Description......................................................................................C-81 C.3.2 Baseline Data Survey Results.....................................................................C-83 C.3.3 Present Sanitation Status........................................................................... C-111 C.3.4 Environmental Impacts of the Project......................................................C-112 C.3.5 Mitigation Measures .................................................................................C-124 C.3.6 Land Acquisition and Resettlement .........................................................C-132 C.3.7 Monitoring Programs ................................................................................C-134
C.4 Environmental Impact Assessment for Solid Waste Management ...................C-140 C.4.1 Project Description....................................................................................C-140 C.4.2 Baseline Data Survey Results...................................................................C-142 C.4.3 Present Solid Waste Status........................................................................C-166 C.4.4 Environmental Impacts of the Project......................................................C-168 C.4.5 Mitigation Measures .................................................................................C-174 C.4.6 Land Acquisition and Compensation.......................................................C-183 C.4.7 Monitoring .................................................................................................C-185
D. Detailed Data Base for Cost Estimation D.1 Construction Cost ....................................................................................................D-1 D.2 Project Cost..............................................................................................................D-1
iii
Abbreviations
Government of Vietnam/Public Institutions
DI : Department of Industry
DARD : Department of Agriculture and Rural Development DOC : Department of Construction
DOF : Department of Finance DOH : Department of Health
DOSTE : Department of Science, Technology and Environment EMD : Environmental Management Division GOV : Government of Vietnam
HP : Haiphong HPPC : Haiphong People’s Committee
MOC : Ministry of Construction MOF : Ministry of Finance
MOI : Ministry of Industry MOSTE : Ministry of Science, Technology and Environment
MPI : Ministry of Planning and Investment NEA : National Environmental Agency
NIED : National Institute for Educational Development NIURP : National Institute for Urban and Rural Planning
PMU : Project Management Unit SADCO : Sewerage And Drainage Company
SC : Steering Committee SCPE : Scientific Center for Population and Environment TEDI : Transportation Engineering Design Institute
TUPWS : Transport and Urban Public Works Service URENCO : Urban Environment Company
VIWASE : Vietnam Institute for Water and Sanitation Engineering WSCO : Water Supply Company
International / Foreign Organizations
ADB : Asian Development Bank
AIT : Asian Institute of Technology ASEAN : Association of Southeast Asian Nations
AusAID : Australian Agency for International Development CIDA : Canadian International Development Agency
DIDC : Department for International Development Cooperation of the Ministry for Foreign Affairs of Finland
EU : European Union FINNIDA : Finnish International Development Agency
iv
IBRD (WB) : International Bank for Reconstruction and Development (World Bank)
IFC : International Finance Agency
JBIC : Japan Bank for International Cooperation JICA : Japan International Cooperation Agency
NGO : Non-Government Organization OECD : Organization for Economic Cooperation and Development
SIDA : Swedish International Development Agency UNDP : United Nations Development Program
UNICEF : United Nations Children’s Fund UNIDO : United Nations Industrial Development Organization
WB : World Bank WHO : World Health Organization
Peculiar Abbreviations for this Study
City MP : Haiphong City Master Plan DVEZ : Dinh Vu Economic zone
NDA : New Development Area NUA : New Urban Area OCC : Old City Center
SA : Study Area SMP : Sanitation Master Plan
The Study : The Study on Sanitation Improvement Plan for Haiphong City The JICA Study Team
: The JICA Team for the Study on Sanitation Improvement Plan for Haiphong City
Others
ADWF : Average Dry Weather Flow
AIDS : Acquired Immuno- Deficiency Syndrome
AJ : Aerated Jokaso AL : Aerated Lagoon AnA : Anaerobic Aerobic Process
ARI : Average Recurrence Interval AS : Activated Sludge
ASP : Activated Sludge Process BOD : Biochemical Oxygen Demand
BOT : Built, Operate, Transfer C : Carbon
CAS : Conventional Activated Sludge CCTV : Closed Circuit Television
CECS : Center for Environmental Chemistry Studies CEST : Center for Environmental Science and Technology
v
CH4 : Methane Cl : Chlorine
CNMS : Customer Network Management System CO2 : Carbon dioxide
COD : Chemical Oxygen Demand CPP : Contact Purification Process
CRES : Center for Regional and Environmental Studies CSO : Combined Sewer Overflow CW : Constructed Wetlands
DID : Densely Inhabited District DO : Dissolved Oxygen
EAR : Environmental Awareness-Raising EARET : Environmental Awareness-Raising, Education and Training
EE : Environmental Education EIA : Environmental Impact Assessment
EMP : Environmental Master Plan ES : Executive Seminars
F/S : Feasibility Study FC : Fecal Coliform
GDP : Gross Domestic Product GRP : Gross Regional Product
H : Hydrogen HCMC : Ho Chi Minh City HDPE : High Density Poly-Ethylene
HIV : Human Immunodeficiency Virus HPWSSP : Haiphong Water Supply & Sanitation Program
°C : degrees Celsius g/d : grams per day Gm : Gram
ha : Hectare kg : kilo gram
km : kilo meter km2 : Square kilo meter
lpcd : liter per capita per day m : Meter
m2 : square meter m3 : cubic meter
m3/d : cubic meter per day mg/l : milligram per liter
Nm3 : Normal cubic meter pg : Picogram
t/m3 : tonnes per cubic meter US$ : United States Dollar VND : Vietnamese Dong
wt% : weight percent
The Study on Sanitation Improvement Plan for Haiphong City, Vietnam
Final Report, Supporting Report Part A
A - 1
A. RESULTS OF FIELD SURVEY WORKS
A.1 First Study in Vietnam
A.1.1 Interview Survey of 500 Households
(1) Objective
The JICA Study Team has carried out 500 households opinion survey in order to understand Haiphong citizens’ opinion about the environmental problems, and also to know the citizens’ waste discharge manner.
(2) Method
1) Sampling
The survey was conducted during the period from 29 May to 13 June 2000.
2) Sampling
We have selected 500 households from the following categories of houses that are typical in Haiphong:
1. Government house 110 2. Private houses in residential areas 130 3. Private houses in commercial streets 135 4. Houses in polluted area 70 5. Houses in rural area 55 6. Total (1+2+3+4+5+6) 500
The 500 households were selected from the four (4) urban districts: Hong Bang, Le Chan and Ngo Quyen and one rural district of An Hai.
(3) Main Results
Interesting answers are summarized in the following table.
The Study on Sanitation Improvement Plan for Haiphong City, Vietnam
Final Report, Supporting Report Part A
A - 2
Some Questions and Interviewees’ Responses
Questions (Questions with “* “allow multiple
answers.)
Interviewees’ Responses
1. Do you think the environmental pollution exist in your neighborhood?
- Yes, serious 40% - Yes, but not serious 52% - Not at all 8 %
2. *What kind of environmental problems exist in your neighborhood?
3. *Who is the most important actor for solution of the environmental problem?
- Government authorities 71% - People 60% - Enterprise 30%
4. *What are the most effective actions for environmental improvement?
- Citizens’ self efforts to keep the city clean 87% - Improvement of URENCO’s service 68% - Education of people 66% - Making regulations & enforcement 55% - Enterprises’ action for pollution control 49%
5. *What can you do to protect the environment of Haiphong?
- No littering or illegal dumping 95% - Pay waste collection fees 74% - Educate children or others 69% - Participate in the neighborhood cleaning activities 52% - Nothing 0.2%
6. Do you think that your neighborhood is generally clean?
- Not so clean 70% - Dirty 18% - Clean 12%
7. Where do you take your waste? - URENCO’s handcarts 79% - Container 22% - Throw somewhere 9% (“somewhere” include streets, river, drainage, garden, pond)
8. Is there any waste collection service in your area?
- Yes 86% - No 14%
9. Are you satisfied with the service? - Very much satisfied 46% - Not very much satisfied 46% - Not satisfied 8%
10. Do you pay the garbage collection fees to fee collector?
- Yes 95% - No 5%
11. If the garbage fee increased to 2,000 Dong/person/month, are you going to pay this amount?
- Yes, though 2000 Dong is high 51% - Yes, 2000 is not high 27% - No, as it is too high 21%
The Study on Sanitation Improvement Plan for Haiphong City, Vietnam
Final Report, Supporting Report Part A
A - 3
A.1.2 Interview Survey of 100 Factories
(1) Objectives
The objectives of the survey were to identify the type and quantity of industrial solid waste, and to identify water supply and wastewater management of the factories.
(2) Methods
One hundred factories to include all type of industries existing in Haiphong, were selected to be interviewed. A questionnaire was prepared including the following main categories:
Content of Questionnaire
Type of question Number of question
A Questions concerning factory 8 B Questions concerning business 3 C Questions concerning solid waste management 6 D Questions concerning water supply 6 E Questions concerning sanitation 4 Total 27
The following instructions were given to interviews:
• Fill name of factory, type of business, contact person, address and district to the provided list
• Collect the basic data from about 125 factories to have some extra factories to visit if some directors refuse from interview. The total amount of interviewed factories should be 100.
• Ask the permission to come to interview the director, and make the appointment for the interview.
• Visit the factory, explain the purpose and the content of the questionnaire. If possible interview the director at the same time. If he cannot answer to the questions immediately, leave the questionnaire to him and agree time when you come and collect it.
The study area covered mainly four urban districts Hong Bang, Le Chan, Ngo Quyen and Kien An, and industrial areas in Quan Toan and along Do Son road.
Interviews were conducted during 6 weeks in June – July 2000. The number of interviewers was five.
The background information and results were collected to database and processed by Excel program.
The Study on Sanitation Improvement Plan for Haiphong City, Vietnam
Final Report, Supporting Report Part A
A - 4
(3) Results and Major Findings
The type of ownership, location and number of employees of the interviewed factories was as follows:
Type of Ownership, Location and Number of Employees of Interviewed Factories
Type of Ownership No Location (district)
No Number of Employees No
Private company 25 Le Chan 16 Less than 20 7 Provincial state enterprise 21 Hong Bang 24 21 – 50 17 National state enterprise 39 Ngo Quyen 38 51 – 100 14 Foreign joint venture 12 Kien An 2 101 – 200 18 Cooperative 3 An Hai 8 201 – 500 22 Kien Thuy 4 501 – 1000 11 Thuy Nguyen 8 Over 1000 11
Total 100 Total 100 Total 100
The biggest groups of interviewed factories were foundries and other metal factories, chemical factories, food processing factories, garment factories and shoe factories.
According to the preliminary data the total amount of solid waste was 11,119 ton/year (30.5 ton/day), of which non-hazardous industrial waste was 9,122 ton/year (25.0 ton/day) equivalent to 82 % from total amount. Amount of hazardous industrial waste was 107 ton/year (0.29 ton/day). Only seven of interviewed factories informed that they are producing hazardous industrial waste. Amount of household type waste was 1,890 ton/year (5.1 ton/day).
URENCO is collecting solid waste alone from 59 factories and jointly with the factories from 13 places. Twelve factories dispose their solid waste themselves and 16 factories are using other methods.
Most of the interviewed factories (38) are producing 100 – 500 m3 wastewater per month. 24 of the factories produce less than 50 m3, and 18 factories produce more than 1000 m3 wastewater per month. Only few of the interviewed factories have any kind of wastewater treatment and most of the small and middle size factories discharge their wastewater to the public sewer.
Seven of the interviewed factories did not have any septic tanks. Most of the factories have one or two septic tanks (44 %). Number and size of the septic tanks in the interviewed factories are as follows.
The Study on Sanitation Improvement Plan for Haiphong City, Vietnam
Final Report, Supporting Report Part A
A - 5
Number and Total Size of Septic Tanks
Number of septic tanks No Total size of septic tanks (m3) No 0 7 0 7
A.1.3 Survey for the Current Environmental Conditions
(1) Objective
“Survey for the Current Environmental Conditions” was carried out by Institute of Chemistry in order to gather most up-to-date data on the existing environmental conditions of the Study Area.
(2) Methods
1) Data and Map Collection and Assessment
The following data and information were collected from SADCo, Haiphong DOSTE and other relevant organizations.
• An existing land use map of study area with the scale of 1:10,000, • Data of water and bed sediment quality of lakes, rivers and channels, • Data of the current hydrological / hydro-geological condition of lakes,
rivers and channels, and • Tidal data of rivers
2) Water/Sediment Study
To investigate the present environmental conditions, forty (40) water samples and ten (10) sediment samples were collected and analyzed in May – June 2000 (see Figure A.1.3.1 and 1.3.2). The sampling points were selected based on the distribution of pollution sources, availability of existing data, land use and other factors. The samples were analyzed with the methods designated by Vietnamese Environmental Standard (TCVN 5942-1995) or other international standards, such as ISO and JIS.
The Study on Sanitation Improvement Plan for Haiphong City, Vietnam
Final Report, Supporting Report Part A
A - 8
Water Sampling and Analysis
Category Items/Remarks Sampling 20 locations in 4-5th May, 2000 (dry season)
20 locations in 15-16th June, 2000 (wet season)
Analysis On-site: temp., DO (mg/l), pH, EC, turbidity, smell, color Laboratory: BOD5, COD, SS, T-N, NH4-N, NO3-N, T-P, PO4-N, SO4, total coliform, fecal coliform, Cd, CN, Pb, Zn, Total Cr, Cr(VI), As, total Hg, Cu, Fe, and oil (n-Hexane extract)
Sludge Sampling and Analysis
Category Items/Remarks
Sampling 10 locations on 4-5th May, 2000 sampling: grab method, surface
Analysis Sludge depth, pH, moisture content, volatile solid, total solid, apparent density, BODSED, CODSED, T-N, T-P, Cd, CN, Pb, Zn, total Cr, and Cr(VI)
(3) Results and Major Findings
The major findings from the survey are summarized below.
1) Pollution by Sewage
Water bodies in the urbanized area (Tien Nga Lake, Sen Lake, Lam Tuong Lake, Du Hang Lake, Dong Khe (NE) Channel, SW Channel and An Kim Hai Channel) are heavily polluted by inflow of untreated sewage. BOD and COD values exceeded the Environmental Standard (TCVN5942-1995) (BOD 25 mg/l, COD 35 mg/l) in these lakes and channels. The coliform level in these water bodies is also high, and exceeds the standard (10,000 MPN) in many places. In less urbanized area of Kien An, Do Son and other areas, the situation is considerably better, and the pollution problems are localized.
2) Eutrophication
The levels of nutrients, i.e., nitrogen and phosphorous, are also high in urbanized area, and above TCVN5942-1995 for ammonia (1 mg-N/L). In many water bodies (e.g., An Kim Hai Chanel and Tien Nga Lake), water is exhibiting the signs of eutrophication; water hyacinth is growing uncontrollably, and algal bloom was also noted.
3) Pollution by Toxic Pollutants
The concentrations of heavy metals and other toxic substances in both water and sediment are generally low, and within the TCVN5942-1995 (surface water quality) and Dutch List values (soil pollution).
The Study on Sanitation Improvement Plan for Haiphong City, Vietnam
Final Report, Supporting Report Part A
A - 9
4) Complex Hydrological Condition
Many lakes and channels are interconnected, and the flow conditions are very complex due to oscillating water levels of tidal rivers and operation of tidal gates. In many water bodies, even the directions of flow are not constant influenced by the surge of backwater from Cam River and Lach Tray River during high tide. This explains the significant differences of water quality data (e.g., Thuong Ly Lake and SW Channel) collected in May and June.
A.1.4 Source-wise Unit Pollution Load Study
(1) Objective
The objective of “Source-wise Unit Pollution Load Study” was to investigate the unit pollution loads from the following sources: domestic, commercial, industrial, hospital, office/institutional, tourism, and infiltrated water of sewer.
(2) Methods
1) Sampling
Figure A.1.4.1 shows the locations of sampling points at which wastewater samples were taken. In total 144 water samples were taken from 11 pollution sources at intervals of 2 hours over the duration of 1 day. The flow rates were also measured at the time of sampling.
In addition, twelve (12) flow rate measurements were carried out at 3 locations in order to estimate the amount of infiltrated water in sewer lines before and after a large rain event in July, 2000.
The Study on Sanitation Improvement Plan for Haiphong City, Vietnam
Final Report, Supporting Report Part A
A - 11
2) Analysis
Water quality parameters were classified into 3 groups; Group1 for basic water quality, Group 2 for heavy metals and other indicators, and Group 3 for nutrients. All 144 samples were analyzed for Group 1 parameters. In addition, selected samples were analyzed for Group 2 and Group 3 parameters. All chemical analyses were carried out at the Institute of Chemistry in Hanoi with the methods designated by Vietnamese Environmental Standard (TCVN 5942-1995) or other international standards, such as ISO and JIS.
Analytical Items
Category Items/Remarks Sampling total 144 samples for water quality analysis
sampling : May-June, 2000
Analysis Group 1: BOD, COD, SS 144 samples Group 2: Fe, Mn, As, Cd, Cr, Cr(VI), Cu, CN, Pb,
Hg, F, Cl 4 samples
Group 3: NH4-N, T-N, T-P 6 samples
(3) Results and Major Findings
1) Domestic Source
The results of the study is given in Table A.1.4.1, A.1.4.2 and A.1.4.3. Table below summarizes the estimated unit pollution loads from domestic sources.
Calculated Unit Pollution Loads from Domestic Sources
Wastewater BOD COD SS Name l/c/d g/c/d g/c/d g/c/d
Remark
Multi-Story Apt. 1 128 176 304 401 raw wastewater Multi-Story Apt. 2 90 30 62 24 after septic tank Private House 100 15 75 12 gray water only
The pollution loads from the Multi-Story Apt. 1 were consistently higher than the expected ranges (BOD 30-50 g/c/d, SS 25-50 g/c/d) for unknown reason. The per capita pollution loads from Multi-Story 2 and Private House were closer to the expected ranges considering the facts that these represented samples after treatment by septic tank or gray water only.
2) Commercial and Institutional Sources
Table below summarizes the average concentrations of effluent from commercial and institutional sources.
The Study on Sanitation Improvement Plan for Haiphong City, Vietnam
Final Report, Supporting Report Part A
A - 12
Average Concentrations of Pollutants (Commercial and Institutional Sources)
Wastewater BOD COD SS Name m3/day mg/l mg/l mg/l
Remark
Hotel (City) 300 62 155 99 after septic tank Residential Complex 48 63 106 68 after pretreatment Electricity Co. (office) 15 52 109 29 after septic tank Hotel (Do Son) 38 111 178 25 after septic tank Hospital 500 122 215 98 after pretreatment Typical in Japan* variable 120-510 - 60-240 raw wastewater
based on Japan Sewerage Assoc. (1997)
The concentrations of pollutants were generally lower than the typical values, in part because the samples were taken after pretreatment.
3) Industrial Sources
Table below summarizes the average effluent concentrations of pollutants in industrial wastewater.
Average Concentrations of Pollutants (Industrial Sources)
Wastewater BOD COD SS Name
m3/day mg/l mg/l mg/l Remark
Seafood Factory 333 31 65 80 after pretreatment Paper Company 700 36 178 148 after pretreatment Enamel Factory 233 46 130 197 raw wastewater Brewery 500 772 895 194 raw wastewater
It was noted that the effluent quality was highly variable from factory to factory. Also it depended strongly on the operating condition of the factory. For examples, the batch of raw materials processed at the seafood factory on the day of the sampling was somewhat smaller than usual because the availability of the raw material was low (according to a factory operator). Samples from the seafood factory and the paper factory were taken after the pretreatment. These specific factors had to be taken into account in order to interpret the results.
4) Nutrient Levels
Table below summarizes the measured concentrations of nutrients (N, P).
The Study on Sanitation Improvement Plan for Haiphong City, Vietnam
Final Report, Supporting Report Part A
A - 13
Concentrations of Nutrients unit : mg/l
Location NH4-N T-N T-P Remark Multi-Story Apt. 2 55.6 57.0 2.97 after septic tank Residential Complex 43.9 49.5 2.85 after pretreatment Seafood Factory 3.2 6.5 0.65 after pretreatment Hospital 23.4 34.5 0.84 after pretreatment Electricity Company 77.6 85.0 0.46 after septic tank Hotel (Do Son) 42.7 56.0 2.39 after septic tank
The concentrations of nutrients are generally within the expected pollution load ranges.
5) Toxic Substances
Table below summarizes the measured concentrations of selected heavy metals and other pollutants.
Concentrations of Heavy Metals and Other Pollutants (unit: mg/l)
The concentrations of heavy metals and other pollutants were generally lower than the discharge standard, TCVN 5945-1995 at Seafood Company, Paper Company and Enamel Factory. The exceptions were iron and manganese, which were found at levels slightly higher than the TCVN 5945-1995. However, these substances are not as toxic as other heavy metals and they did meet the Japanese discharge standard. Hence, immediate health threat was not anticipated.
The Study on Sanitation Improvement Plan for Haiphong City, Vietnam
Final Report, Supporting Report Part A
A - 14
Table A.1.4.1 Results of Source Wise Pollutant Load Study (May 23-24, 2000)
The Study on Sanitation Improvement Plan for Haiphong City, Vietnam
Final Report, Supporting Report Part A
A - 17
A.1.5 Sewer Line and Drainage Channel Profile Study
(1) Objectives
The main objective was to supplement existing data on sewer line and drainage channel configurations.
For sewer lines existing data was available for 70 km of main combined sewers and 100 km of branch and tertiary combined sewers in Hong Bang District, Ngo Quyen District, and Le Chan District, including 22 wards.
For drainage channels existing data was available for 3 km of channels in Le Chan District and 3 km of channels in Ngo Quyen District.
The sewer surveys comprised 394 survey locations in the following areas.
• Main combined sewers on Da Nang Street, Le Lai Street, Le Loi Street, and Lach Tray Street in Ngo Quyen District, and on To Hieu Street and Tran Nguyen Han Street in Le Chan District
• Branch and tertiary combined sewers in 2 wards in Hong Bang District, 2 wards in Ngo Quyen District, 3 wards in Le Chan District, and 4 wards in Kien An District
• Main sewers in Do Son Town
The sewer surveys in Ngo Quyen and Hong Bang Districts were done to supplement existing data. The surveys in the wards in the 4 urban districts and Do Son Town were done, because data was not available for these areas.
The channel surveys comprised 106 survey locations in the following channels.
• An Kim Hai Channel • Channel connecting Northeast (NE) Channel to An Kim Hai Channel • Channel connecting Southwest (SW) Channel to An Kim Hai Channel • Phu Luu drainage channel in Kien An District
The drainage channel surveys were done, because data was not available for these channels.
(2) Methods
The sewer survey was implemented to provide measurements of sewer line profiles at selected manholes. The measured data includes sizes of sewers at manholes and depth from ground level to sewer inverts. Measurements were done using scaled measuring rods. Measurements of ground levels relative to common datum was not possible, because of time constraints.
The channel survey was implemented to provide measurements of drainage channel profiles at selected intervals generally not exceeding 100 m. The measured data included top widths of channel, estimated channel cross-sectional areas relative to bottom of sediment layer, and cross-sectional areas of sediment layer. Channel top widths were measured by using a tape or a scaled rope. Water depths and sediment
The Study on Sanitation Improvement Plan for Haiphong City, Vietnam
Final Report, Supporting Report Part A
A - 18
layers were measured by using scaled measuring rods. Measurements of ground levels relative to common datum was not possible, because of time constraints.
(3) Survey Results
Results from the sewer survey are summarized in the following table. The areas of the sewer survey are flat. Consequently, the shallow depth of the sewers indicates that the sewer gradients are low.
Results from Sewer Line Survey
Area Name
Survey Locations
(No.)
Average Depth of Sewer Invert from
Ground Level (cm)
Average Depth of Sewer Crown from
Ground Level (cm)
Streets in Ngo Quyen District 46 1.68 1.04 Streets in Le Chan District 17 1.61 1.00 2 Wards in Hong Bang District 87 1.30 0.67 2 Wards in Ngo Quyen District 49 0.88 0.54 3 Wards in Le Chan District 114 1.19 0.74 4 Wards in Kien An District 55 1.35 0.89 Do Son Town 26 1.08 0.68 TOTAL 394
Results from the channel survey are summarized in the following table. The large amount of sediment indicates that the hydraulic capacities of the channels are low.
Results from Drainage Channel Survey
Channel Name Survey Locations
(No.)
Average Top Width
(m)
Average Sediment
Layer Area (m2)
Average % of Sediment of Total Area
(%) An Kim Hai Channel 80 13.26 11.76 39.5% Channel from NE Channel to An Kim Hai Channel
10 13.13 12.03 43.6%
Channel from SW Channel to An Kim Hai Channel
10 9.18 7.02 49.8%
Phu Luu channel in Kien An 6 7.52 4.06 40.3% TOTAL 106
A.1.6 Study of Leachate from Solid Waste Disposal Site
(1) Objectives
This Study is carried out, in order to evaluate the state of existing landfill site and the effect on the surrounding environment of the site.
(2) Methods
Whole study works is carried out by the Institute of Oceanology in Haiphong based on the contract with the JICA Study Team.
The Study on Sanitation Improvement Plan for Haiphong City, Vietnam
Final Report, Supporting Report Part A
A - 19
The study includes sampling of leachate and groundwater in and around Trang Cat landfill site, a laboratory analysis of the leachate and groundwater samples, and reporting of the analytical works. For the groundwater sampling, the boring works and installation of a 10m depth well was carried out in this study. The sampling works are carried our in two times of dry season and rainy season.
1) Number of samples for analysis and sampling points
The Study on Sanitation Improvement Plan for Haiphong City, Vietnam
Final Report, Supporting Report Part A
A - 22
(3) Sampling place: Trang Cat landfill site.
(4) Sampling date: two times
• The first : 22 may 2000. • The second : 18 July 2000.
(5) Sampling points:
On dry season at 5 points (from 1-5) showed at the map.
On rainy season, samples were collected at 7 points (from 1-7) showed at the map.
(6) Person in charge:
The first time : Dr. Luu Van Dieu.
The second time : MSC. Pham Van Luong.
(7) Methodology:
1) The kinds of samples :
• The leachate samples were collected at 5 points : pond1, pond2, and drainage canal, fish pond and fresh pond inside the national dam.
• The ground water samples were collected at 2 points: + The first point at the well with 10m depth + The second point at the well with 45m depth
The wells were drilled and put into plastic tube; in the near bottom there are filter tubes.
2) Analysis methods
(a) Temperature (°C)
It was measured by using pH meter.
(b) pH
It was measured at the field by pH portable meter. 704 pH meter, Metrohm, Switzerland. The calibration was carried out according to the machine manual.
(c) Chlorinity (‰)
It was determined by Mohr titration method with silver nitrate and color indicator - K2CrO4..
(d) Color (CTU).
It was measured by spectrophotometric method, using DR/ 2000 spectrophotometer (HACH, USA).
The Study on Sanitation Improvement Plan for Haiphong City, Vietnam
Final Report, Supporting Report Part A
A - 23
(e) Turbidity (NTU)
It was measured by a turbidity meter, Model 972, ELE.
(f) Alkalinity as CaCO3 (mg-CaCO3/L)
It was determined by titration method with end point determine by pH meter at pH = 4.5.
(g) Total suspended solid (TSS) (mg/L)
It was determined by gravimetric method. The water samples were filtered through a weighed glass fiber filter and residue retained on the filter was dried to a constant weight at 105oC.
(h) Sulfate (SO-24) (mg/L)
The gravimetric method was used for determining the sulfate. Sulfate was precipitated in a hydrochloric acid medium as barium sulfate by addition of barium chloride into the sample. The precipitate was filter washed with water until free of chlorides. BaSO4 was dried at constant weight and weighed.
(i) Five days biochemical oxygen demand (BOD5) (mg/L)
The seeded dilution method was used for determining BOD5 (according to standard method for the examination of water and wastewater, 19th edition 1995 by APHA - AWWA - WPCF Washington.)
(j) Chemical oxygen demand (COD) (mg/L)
The chemical oxygen demand was determined by the dichromate reflux method. The sample was digested in strongly acid solution with a known excess of potassium dichromate. After digestion, the remaining unreduced potassium dichromate was titrated with ferrous ammonium sulfate to determine the amount of potassium dichromate consumed and the oxidizable organic matter was calculated in terms of oxygen equivalent.
The silver sulfate and mercury sulfate were used as catalyst and silver sulfate reacts with chloride, to produce precipitates.
(k) Oil content (mg/L)
It was determined by the infrared absorption photometry method, using “ Oil - 105 portable oil meter”, Yamaco, Japan.
(l) Nitrite (NO-2) (µg-N/L)
It was determined by spectrophotometric method. The method base on the reaction of nitrite with an aromatic amine, sulphamilamide, which leads to the formation of a diazomium compound at pH = 1,5 - 2.0. This diazo compound couples with a second aromatic amine, N-(1-naphtyl)- ethylenediamine to form the highly colored azo dye. The extinction of the dye then was measured at 543nm.
The Study on Sanitation Improvement Plan for Haiphong City, Vietnam
Final Report, Supporting Report Part A
A - 24
The equipment was used to determine to be UV - visible spectrophotometer; Cary 1E (Varian).
(m) Nitrate (NO-3) (µg-N/L)
The cadmium - reduction method was used. The nitrate was reduced to nitrite in a reduction column filled with copper - coasted cadmium granules. The nitrite formed was then determined as above method.
The nitrate concentration was calculated by minus the previous nitrite concentration of the sample.
(n) Ammonia (µg-N/L)
The indophenols blue method was used. In moderate alkaline solution, ammonia reacts with hypochlorite to form monochloramine that in the presence of phenol, catalytic amounts of nitroprusside ions and excess hypochlorite, gives indophenols blue. The absorbency of the solution was measured by UV - visible spectrophotometer at 630nm.
(o) Total Nitrogen (µg-N/L)
Determine the organic nitrogen by the Kjeldahl method. In the presence of sulfuric acid, potassium sulfate and mercuric sulfate catalyst, amino nitrogen of many organic materials was converted to ammonium sulfate (in Kjeldahl flask). After the mercury ammonium complex in the digestion was decomposed by sodium thiosulfate, the ammonia was distilled from alkaline medium and absorbed in boric acid. The ammonium in the distillate was titrated with sulfuric acid and mix indicator (methyl red and ethylene blue).
The persulfate digestion method was used to convert all phosphorus compound both soluble and insoluble, and organic and inorganic species in to phosphate. After that stannous chloride method was used to determine phosphate with the equipment to be UV- visible spectrophotometer.
(q) Cyanide (CN-) (µg/L)
The calorimetric method was used to determine cyanide. The cyanide in the alkaline distillate from the preliminary treatment procedure was converted to cyanogen chloride (CNCl) by reaction with chloramines T at a pH < 8. Then addition of a pyridine barbituric acid reagent, the CNCl forms a red - blue dye. The absorbance was at 578 nm by using UV- visible spectrophotometer.
The Study on Sanitation Improvement Plan for Haiphong City, Vietnam
They were determined by atomic absorption spectrophotometric method with equipment: Atomic absorption spectrophotometer, Perkin - Elmer, model AA3300, USA.
(s) Mercury (µg/L)
It was determined by cold- vapor atomic absorption spectrophotometric method with atomic absorption spectrophotometer, Perkin - Elmer. Model AA3300,USA
(t) Arsenic (µg/L)
It was determined by hydride generation/atomic absorption spectrophotometric method with AAS Perkin - Elmer, AA3300 USA.
(8) Results and Findings
1) Ground Water Quality
Water quality of two wells is compared with the Ground water quality standard of Vietnam (TCVN 5944 - 1995) that presented at two following tables.
Ground water quality of well 1 (10m depth) in two seasons
Items Parameter Unit Dry Season Rainy Season Limitation value 1 pH - 6.86 7.25 6.5-8.5 2 Color TCU 46 244 5-50 3 SO4
At the above table, it is showed that: in the well 1 (10m depth) there are some characteristics as:
• The values of pH, color in dry season, sulfate in rainy season; TSS, NO3-, CN- , Cd, Pb, Cu, Zn, As, Hg-T, Fe, Cr(VI) are in limitation value of ground water quality standard of Vietnam ( TCVN 5944 - 1995).
The Study on Sanitation Improvement Plan for Haiphong City, Vietnam
Final Report, Supporting Report Part A
A - 26
• The value of color in rainy season is over the limitation about 4.9 times. Chloride concentration is higher than that in limitation value about 9.6 times. Coliform is exceeding the limitation about 1533 times in dry and 367 times in rainy season.
• In the rainy season, Sulfate, TSS, Cyanide concentration and Coliform and fecal coliform are lower than that in dry season, by in hand the concentrations of heavy metals as: cadmium, Copper, Zinc, Iron are higher.
Water Quality Of The Well 2 (45m depth)
Item Parameter Unit Dry Season Rainy Season Limitation value 1 pH - 7.11 7.00 6.5-8.5 2 Color TCU 28 18 5-50 3 SO4
It shows that: in the well 2 (45m depth) the water quality is as follows:
• The parameter as : pH, Color, sulfate, TSS, NO3-, CN-, Cd, Pb, Cu, Cr(VI),
Zn, As, Hg, Fe, chloride, fecal coliform in rainy season are in the range limitation values.
• Coliform is higher limitation value of 767 times in the dry and 7 times in rainy season.
• Fecal coliform is higher in dry season and over the limitation value. • In the rainy season, pH, Color, and concentrations of TSS, Cyanide,
Heavy metals (Pb, Cr(VI), Zn, Fe), Coliform and fecal coliform are lower than that in dry season.
• Commonly, the water of two wells are polluted seriously by coliform and fecal coliform, and water in the well 2 ( 45m depth) better than that in the well 1 ( 10m depth).
2) Leachate water quality
For assessment of leachate water quality at Trang Cat landfill site, the industrial wastewater standard of Vietnam (TCVN 5945 - 1995) in used. The
The Study on Sanitation Improvement Plan for Haiphong City, Vietnam
Final Report, Supporting Report Part A
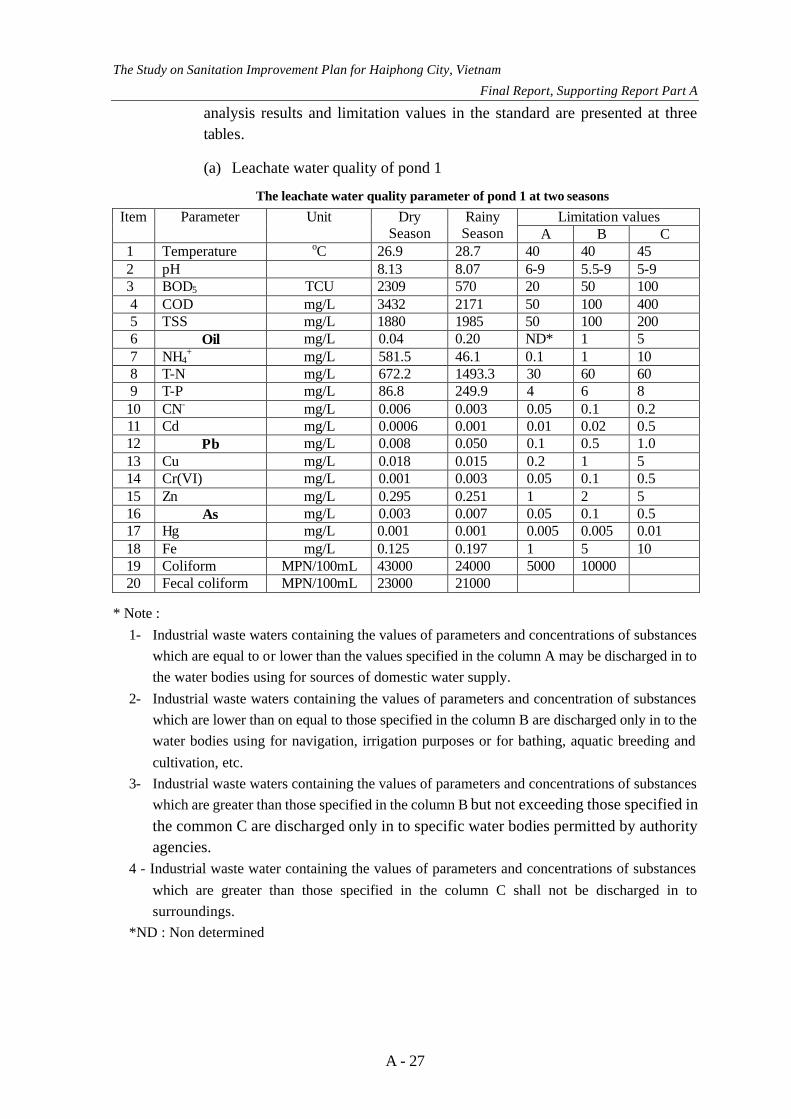
A - 27
analysis results and limitation values in the standard are presented at three tables.
(a) Leachate water quality of pond 1
The leachate water quality parameter of pond 1 at two seasons
* Note : 1- Industrial waste waters containing the values of parameters and concentrations of substances
which are equal to or lower than the values specified in the column A may be discharged in to the water bodies using for sources of domestic water supply.
2- Industrial waste waters containing the values of parameters and concentration of substances which are lower than on equal to those specified in the column B are discharged only in to the water bodies using for navigation, irrigation purposes or for bathing, aquatic breeding and cultivation, etc.
3- Industrial waste waters containing the values of parameters and concentrations of substances which are greater than those specified in the column B but not exceeding those specified in the common C are discharged only in to specific water bodies permitted by authority agencies.
4 - Industrial waste water containing the values of parameters and concentrations of substances which are greater than those specified in the column C shall not be discharged in to surroundings.
*ND : Non determined
The Study on Sanitation Improvement Plan for Haiphong City, Vietnam
Final Report, Supporting Report Part A
A - 28
In water of pond 1:
• The parameters as pH, CN-, Cd, Pb, Cu, Cr(VI), Zn, As, Hg, Fe are in limitation values.
• The parameters are higher than that in limitation values of Vietnam standard as following:
+ BOD5 is higher the limitation value about 23 times in dry season and 5.7 times in rainy season.
+ COD in higher the limitation value of C column to be 8.6 times in the dry season and 5.4 times in the rainy season.
+ TSS is higher the limitation value of B column about 1.9 times in dry season and 2.0 times in rainy season.
+ Oil contents are higher the value of A column in two seasons.
+ NH4+ contents are higher the value of C column to be about 58 times in
dry and 4.6 times in rainy season.
+ T-N concentrations are higher the value of C column as 11 times in dry and 31 times in rainy season.
+ T-P concentrations are higher the value in C Column as about 4.3 times in dry season and 24 times in rainy season.
+ Fecal coliform in the water body of pond 1 is high very much. So the wastewater in the pond 1 is heavy polluted, it is treated carefully before discharged in to surround.
The Study on Sanitation Improvement Plan for Haiphong City, Vietnam
Final Report, Supporting Report Part A
A - 29
(b) Leachate water quality of pond 2
The leachate water quality parameters of pond 2 in two seasons.
Limitation values Item Parameter Unit Dry Season Rainy Season A B C
• In the leachate water of pond 2 there are the following parameters to be
lower than the limitation values of industrial waste water standard of Vietnam: temperature, pH, CN-, Cd, Pb, Cu, Cr(VI), Zn, As, Hg, Fe, and the following parameters are higher the limitation values of the standard:
• BOD5 is higher than the limitation of the C column about 18 times in the rainy season.
• TSS is higher than that at the column C about 5,4 times in the dry and 5 times in the rainy season.
• Oil contents are higher than the values at column A. • NH4
+ is higher than the value at the C column about 26 times in the dry and 19 times in the rainy season.
• T-N is higher than the values at the C column about 9 times in dry and 17 times in rainy season.
• T-P is higher than the values at the C Column about 10 times in the day 26 times in the rainy season.
• Coliform is higher than the values of B column about 2.3 times in the dry and 1.5 times in the rainy season.
• Fecal coliform density is high very much. So the wastewater at the pond 2 is not discharged in to surroundings.
The Study on Sanitation Improvement Plan for Haiphong City, Vietnam
Final Report, Supporting Report Part A
A - 30
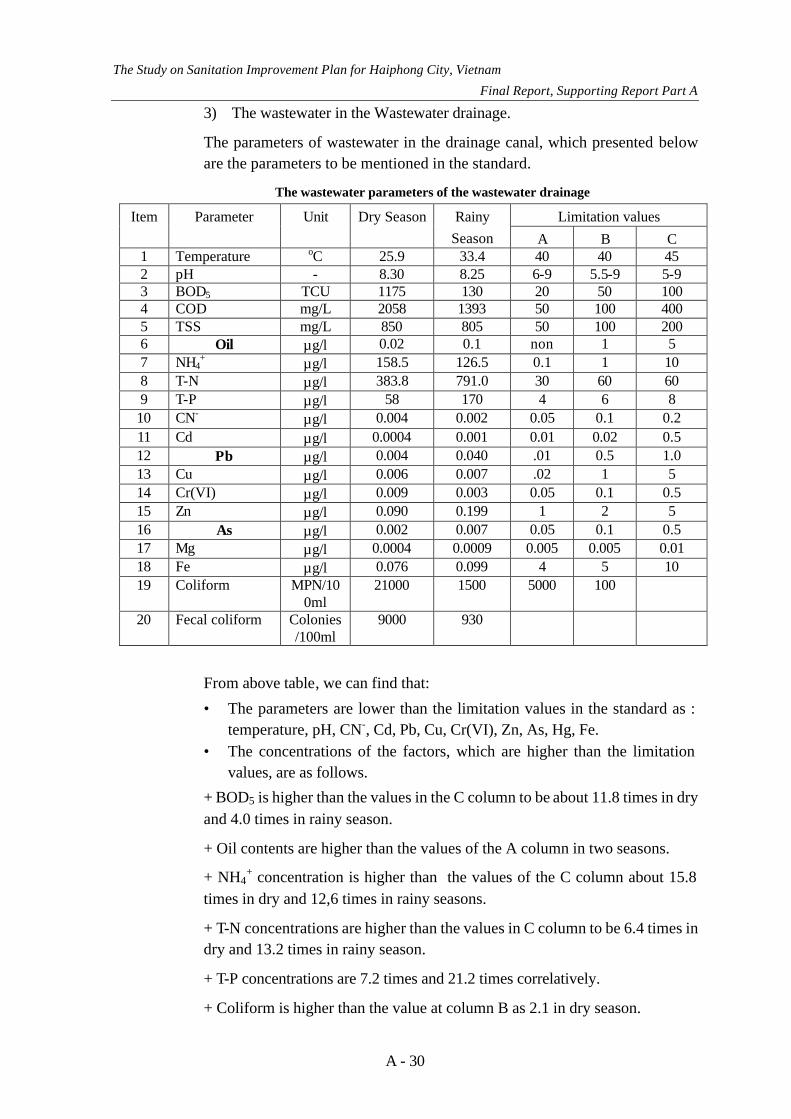
3) The wastewater in the Wastewater drainage.
The parameters of wastewater in the drainage canal, which presented below are the parameters to be mentioned in the standard.
The wastewater parameters of the wastewater drainage
Limitation values Item Parameter Unit Dry Season Rainy Season A B C
• The parameters are lower than the limitation values in the standard as : temperature, pH, CN-, Cd, Pb, Cu, Cr(VI), Zn, As, Hg, Fe.
• The concentrations of the factors, which are higher than the limitation values, are as follows.
+ BOD5 is higher than the values in the C column to be about 11.8 times in dry and 4.0 times in rainy season.
+ Oil contents are higher than the values of the A column in two seasons.
+ NH4+ concentration is higher than the values of the C column about 15.8
times in dry and 12,6 times in rainy seasons.
+ T-N concentrations are higher than the values in C column to be 6.4 times in dry and 13.2 times in rainy season.
+ T-P concentrations are 7.2 times and 21.2 times correlatively.
+ Coliform is higher than the value at column B as 2.1 in dry season.
The Study on Sanitation Improvement Plan for Haiphong City, Vietnam
Final Report, Supporting Report Part A
A - 31
+ Fecal coliform density is high very much, so the water in the drainage has been treated more
The leachate water in the pond1 and pond2 and wastewater drainage of Trang Cat landfill site is polluted by organic matter, TSS, Oil, nutrients (NH4
+, T-N, T-P) and coliform and fecal coliform. The water quality is increased from pond1 to the drainage but pollutants in them are always higher the values in C column. The water is necessary to treat before discharge in to surroundings.
4) The water quality of aquatic cultivation pond (at point 6)
Because of the point 6 is the aquatic brackish cultivation pond, the coastal water quality standard is used for assessment.
Only parameters, which investigated, are in the standard will be presented below.
The water quality parameter in the aquatic cultivation in rainy season
Limitation values Item Parameter Unit Results A B C
*Note : - A column : the standard of water is applied for bathing and recreation area. - B : applied for aquatic cultivation area. - C : applied for the other areas. *Coastal water quality standard (TCVN 6943 - 1995) BOD5, TSS, Oil, ammonia, zinc and iron polluted the water in the rainy season.
5) Surface water quality at point 7
Because of the water samples were collected at point 7 which are used for bathing of the local population, the surface water quality standard of Vietnam (TCVN 5942 - 1995) is used for assessment of pollution degree of the water body.
The Study on Sanitation Improvement Plan for Haiphong City, Vietnam
Final Report, Supporting Report Part A
A - 32
The results of investigation at July are presented below. In the table, only parameters which are presented at the standard will be considered.
The results of investigation of water samples at point 7
Limitation values Items Parameter Unit Results at July A B
Notes: Values in the column A are applied to the surface water using for source of domestic water supply with appropriate treatments. Values in the column B are applied to the surface water for the other purposes.
The water of pond 7 was polluted by some substances as:
• Organic matter; it is expressed by indexes as : • + BOD5 is higher than the limitation value at column B about 4.4 times. • + COD is higher than the limitation value at column B about 4.5 times.
• Total suspended solid is higher than the limitation value at column A about 3 times.
• Nitrite (NO2-) is higher the value at B column about 3.0 times.
6) Common remarks
(a) Leachate water in two ponds (1 and 2) and wastewater drainage
They were polluted seriously by organic water (BOD5 and COD are high very much) nutrients (N, P), total suspended solid (TSS) and coliform and fecal coliform. Though the water have been treated by microorganisms, the pollutant contents are always high very much.
The Study on Sanitation Improvement Plan for Haiphong City, Vietnam
Final Report, Supporting Report Part A
A - 33
(b) The water qualities of the wells and ponds, which are near of landfill site, have been affected.
The water was polluted by organic matter, ammonia, coliform and fecal coliform on high degree
(c) It is necessary to retreat more before discharge the leachate water into surround environment.
7) Consideration and comparison of water qualities
The water qualities for each season will be summarized in Tables.
(a) Removal of organic matters
The chloride concentrations in rainy season are almost same in Pond 1 & 2. It shows that major leakage or dillution was not occured.
In dry season, there is not a big difference between the figures of BOD and COD of Pond 1 and those of Pond 2. It means that a removal of organic matters in Pond 1 is not effective.
Charactorristics of leachate is shown at the ratio of BOD/COD. The values of this ratio are not so small. Therefore, the organic matters in leachate might be biodegradable.
(b) Groundwater
Chloride and Nitrate/Nitrite are high in Well 1 & 2. There might be affection of river/sea or leachate. The pond at the west side of existing landfill site, section-7, shows low chloride besides another points. Therefore, the sea and a landfill site might not affect this pond. The permeability of soil materials is low enough.
(c) Ratio of rainy season/ dry season
The ratio shows almost similar results like other landfill sites. In rainy season, Nitrate and Nitrite are increasing. On the other hands, organic matters are not changing or decreasing.
Some items show the strange results. There might be some mistakes or mixture of SS occurred.
The Study on Sanitation Improvement Plan for Haiphong City, Vietnam
Final Report, Supporting Report Part A
A - 34
Leachate and Groundwater Quality in Rainy Season
Items Parameter Unit Well 1 Well 2 Pond 1 Pond 2 Drainage Fish Pond Site 7 1 Temperature C 28.7 28.7 33.3 37.4 33.4 32.1 31.6 2 pH - 7.25 7 8.07 8.3 8.25 8.01 7.72 3 Color TCU 244 18 8175 7575 4280 44 35 4 Turbidity NTU 92 127 2010 1880 1160 45 51 5 Alkalinity as
The objective of the survey is to estimate the quantity of generation of household waste in Haiphong.
The Study on Sanitation Improvement Plan for Haiphong City, Vietnam
Final Report, Supporting Report Part A
A - 35
(2) Methods
1) Introduction
The generation quantity is estimated by knowing the following two factors:
• Unit generation rate per person per day by area/house category • Population by area/house category
The procedure of the survey is as follows:
• Determination of categorization of area/house • Selection of houses by category and collection of population data • Sample waste collection and measurement of weight • Estimation of generation quantity of the city
2) Selection of houses by category and collection of population data
In general, household waste generation quantity depends significantly on income level of households. The higher the income, the larger the waste generation quantity. However, in Haiphong, as result of a preliminary survey, we have found the opposite correlation between the two factors. The lower the income of household, the larger the quantity of household waste generation. This is mainly because of use of charcoal briquette for cooking in lower income houses.
Furthermore, we have also found that there is no reliable data on population by income category in Haiphong. In view of this situation, and considering that the household waste generation quantity differs by types of house/housing area, we have categorized houses/area as follows:
a. Individual houses in residential area b. Individual houses in residential/commercial area c. Individual houses located on main streets d. Individual terraced houses of state-owned e. Multi-storied apartments of state-owned f. Farmer’s houses
We have selected 20 households from each of the 6 categories. The total households selected were 120 households.
Estimation of Unit Generation Rate
At the final stage of the estimation of the household waste generation quantity, we have further grouped different categories of houses into the following two groups, i.e. non-farmer houses and farmer houses. Average unit generation rate of the former (non-farmers’ households) was estimated by averaging the unit waste generation rates of the 5 different house categories a, b, c, d and e above. Unit generation rate of the latter (farmers’ households) is estimated directly from the unit generation rate of the house category f. The reasons for the above grouping are as follows:
The Study on Sanitation Improvement Plan for Haiphong City, Vietnam
Final Report, Supporting Report Part A
A - 36
• Population data with distinction of farmers and non-farmers are available. However, reliable population data by the different categories of houses are not available.
• There are significant difference in the generation rates between farmers and non-farmers.
3) Sample waste collection and measurement of weight
Before starting the sample waste collection and measurement, the surveyors visited all the households selected, and explained the purpose of the survey and instructed them as to how they should put their waste into the plastic bags that were delivered by the surveyors. The surveyors revisited each household, collected the plastic bags containing waste, and measured their weights everyday for the consecutive 8 days. The result was recorded on the sheet. However, the data of the first day were disregarded as the first day samples may contain waste generated prior to the survey.
Unit generation rate of each housing category was estimated by the following formula:
A = B ÷ C ÷ 7 days
A: Average unit generation rate per person per day of each category
B: Weight of sample waste collected from 20 households for 7 days.
C: Number of persons staying in the 20 houses during the survey.
(3) Results and Major Findings
1) Unit Generation Rates
Unit generation rates of the surveyed households by category are shown below.
Unit Generation Rates
Category of Household
Ward
District
Per Capita Generation
(gram/person/day) A. NON FARMERS’ HOUSE 1. Individual households in
residential area Minh Khai Hong Bang 379
2. Individual houses in residential/commercial area
Tran Nguyen Han Le Chan 451
3. Individual houses located on main street
Quan Tru Kien An 566
4. Individual terraced house of state-owned
Cat Bi Ngo Quyen 698
5. Multi-storied apartment of state-owned
Van My Ngo Quyen 521
Average of the above 5 523 B. FARMERS’ HOUSE 6. Farmer’s house Dong Thai An Hai 128
The Study on Sanitation Improvement Plan for Haiphong City, Vietnam
Final Report, Supporting Report Part A
A - 37
The unit generation rates of the two major categories are as follows:
2) Household Waste Generation Quantity in Haiphong
Based on the unit generation rates estimated above and the population data obtained and shown below, it is estimated that the total household waste generation in Haiphong City is 489 ton/day. Of which 217 ton/day is generated in the three urban districts of Hong Bang, Le Chan and Ngo Quyen, 31 ton/day in Kien An urban district, and 9 ton/day in Do Son Town.
Estimated Household Waste Generation in Haiphong City Population (person) Unit generation rate
(kg/person/day) Generation quantity (ton/day)
Category Non- farmers (person
Farmers (person)
Non-farmers’ house
Farmers’ house
Non-farmers’ house
Farmers’ House
Total
a b c d e = a x c/1000
f = b x d/1000
g = e + f
1. 3 Urban Districts (Hong Bang, Le Chan, Ngo Quyen)
412,228 7,585 0.523 0.128 216 1 217
2. Kien An District 54,620 19,980 0.523 0.128 29 3 31 3. Do Son Town 12,793 18,202 0.523 0.128 7 2 9 4. Other districts 212,045 946,919 0.523 0.128 111 121 232 5. Total 691,686 992,686 362 127 489
3) Reasons for Negative Correlation between Income and Waste Generation
As result of the observation and some hearing, we consider that the major reasons for negative correlation between income and waste generation quantity are as follows:
(a) The lower the income of households, the more frequently they use charcoal briquette for cooking. Households of higher income tend to use gas for cooking. One charcoal ash is as heavy as 0.5 kg. One typical low-income household uses two briquettes per day on average.
(b) Higher income household people tend to choose vegetables, from which sellers already have substantially removed unnecessary parts. It is estimated that kitchen waste shares a half of the household waste on average.
(c) People who eat lunch at restaurants are more in percentage in higher income category than in lower income category, which leads to the situation where kitchen waste generation is lower in higher income category.
The Study on Sanitation Improvement Plan for Haiphong City, Vietnam
Final Report, Supporting Report Part A
A - 38
A.1.8 Solid Waste Collection Quantity Survey
(1) Objective
The JICA Study Team has conducted solid waste collection quantity survey to know waste quantity (weight in terms of ton) collected by the following three companies:
• URENCO (collects waste from Hong Bang, Le Chan and Ngo Quyen urban districts)
• Kien An Urban Works Company • Do Son Public Works Company
(2) Survey Method
A truck scale was used for measurement. It was a half-scale truck scale rented from the Police. The measurement was done during the following periods:
15 – 21 May for URENCO and Kien An Urban Works Company
23 – 29 May for Do Son Public Works Company
During the measurement period, URENCO and Kien An Urban Works Company transported all collected waste to Trang Cat landfill site, and Do Son Public Works Company transported collected waste to Do So landfill site.
During the above measurement period, we measured weight of all vehicles that carried solid waste into the landfill sites. Weight of solid waste carried by a vehicle in one trip was measured by subtracting A from B, where A is weight of vehicle without waste load, and B is weight of the same vehicle with waste load. Weights of vehicle without waste load were measured one time for each vehicle.
(3) Results
1) Daily Average Waste Collection Quantity
An aggregate waste amount collected by the three companies is 477 ton/day on average. URENCO collects 367 ton/day; Kien An 61 ton/day, Do Son 50 ton/day. In case of Do Son, the measurement period (end of May) was already a high season for tourism, and waste collection amount is larger than other seasons. Considering the information given by Do So Public Works Company, the JICA Study Team has estimated that an average daily waste collection by Do Son Company throughout the year would be 44 ton/day.
2) Trips and Average Load
Aggregate number of trips made by vehicles of the three companies was 132 trips/day on average. Average waste load was 3.6 ton/trip/vehicle. Details are shown in the following table:
The Study on Sanitation Improvement Plan for Haiphong City, Vietnam
Final Report, Supporting Report Part A
A - 39
Average Waste Collection Quantity, Number of Trips and Waste Load
URENCO Kien An Company
Do Son Company
Total
a b c d = a+b+c Average collection (ton/day)
366.5 60.6 50.1 477.2
Average number of trips (trips/day)
97.9 15.6 18.5 132.0
Average load per trip (ton/trip/vehicle)
3.75 3.89 2.70 3.62
3) Number of Waste Collection Vehicles Used
During the measurement period, URENCO used about 25 vehicles every day, of which compactor truck 12 units, IFA 11 units, and Container vehicle 2 units. Kien An Company only has only IFA dump trucks. The company used about 4 IFA trucks daily on average. Do Son has 3 trucks, i.e., 2 IFA dump trucks and 1 other truck, and those trucks were used during the measurement period.
Collection Ratio by Work-Shift
URENCO Kien An Company
Do Son Company
a b c 1st shift: 06:30 – 13:30 16% 45% 47% 2nd shift: 13:30 – 21:00 67% 53% 53% 3rd shift: 21:00 – 06:30 18% 8% 0%
4) Collection Quantity by Types of Vehicle
URENCO uses three (3) types of vehicles; IFA dump truck, compactor and hooklift truck carrying 12 m3 container. The hooklift trucks and 12 containers were given by FINNIDA. As shown in the following table, the hooklift truck carries the largest quantity of waste per truck per day. This indicates that the hooklift truck is the most efficient in the three types of collection trucks.
Waste Collection Quantity by Type of Collection Vehicle
IFA Dump Truck
Compactor Hooklift Truck with 12 m3 Container
Waste collection quantity (ton/vehicle/day)
12.5 13.7 35.2
Indicator 100 110 282
A hooklift truck carries 12 m3 containers filled with waste, and does not have to wait for waste loading into the truck. One hooklift truck can carry as many as 8 containers per day.
On the other hand the other types of vehicles (IFA and compactor) have to wait for about 1 hour for full loading of waste. The long loading time leads to less number of trips (3.5 trip/truck/day on average for IFA, 3.9 trip/truck/day for compactor) as compared to hooklift/container system.
The Study on Sanitation Improvement Plan for Haiphong City, Vietnam
Final Report, Supporting Report Part A
A - 40
A.1.9 Solid Waste Composition Analysis
(1) Objectives
Generally, treatment and disposal method of solid waste is examined and selected partly based on the waste composition. For example, contents of organic matters affects the estimated volume of the waste after land-filled. Plastic content can suggest possibility of recycling activity. The objectives of the survey is to clarify the waste composition carried into the land fill site.
(2) Methods
The survey was contracted out to Haiphong Institute of Oceanology.
About 100 to 150 kg of the waste is sampled each time from the compactor of URENCO. The waste was unloaded on the plastic sheet spread on the ground, then a pile of the waste was divided by a crossing line into 4 smaller piles. Diagonal 2 small piles of 4 were selected and mixed again, and then divided into 4 smaller piles again. This process was repeated until the waste amount of each pile became less than 50 kg. Then one of the pile was selected as a sample. The following parameters were measured and recorded.
• Bulk density on wet base • Physical composition on wet base • Physical composition on dry base • Chemical composition, i.e., water, ash and combustible content
Bulk density was measured by using a wooden box and a scale on site of the sampling. Physical composition which means the sorting of the waste according to the component was also carried out on site. The sample was sorted into 12 types of the material following the environmental quality analysis guidelines issued by the MOSTE.
After the sorting, the waste samples were brought to a laboratory in the Institute and were dried up by dryers. The sample was placed in a oven dryer and kept in the temperature of 105 °C for 2 days. When the weight of samples no more changed, it was recognized that the sample was completely dried up. Difference in the weight before and after drying was determined as the weight of water. The weight of each component was measured and small part of each component was taken to measure ash content. A small sample was put into the melting pot and placed in the oven at 800 °C for 3 hours or more to incinerate it.. The weight was determined as ash weight.
The Study on Sanitation Improvement Plan for Haiphong City, Vietnam
Final Report, Supporting Report Part A
A - 41
(3) Results and Major Findings
Bulk density, composition on wet base and dry base are shown in the tables. Bulk density ranged 0.44 to 0.47 and their average was 0.45. This is similar to those already reported in other studies.
It is remarkable that particle more than 5 mm shares 41.16% in wet base and 42.97% in dry base. Share of the particle less than 5 mm stands second. These categories may contain various matters, and residue of briquette used for cooking may contribute to such a large share.
In a chemical composition, water shares about 40% in average, which seems normal for the waste of the Asian tropic countries.
Bulk Density and Physical Composition on Wet Base (%) Wet Base 22-May 29-May 5-Jun Average
The Study on Sanitation Improvement Plan for Haiphong City, Vietnam
Final Report, Supporting Report Part A
A - 43
A.2 Second Study in Vietnam
A.2.1 Drainage Topographic Survey
(1) Objective
The main objective of the Drainage Topographic Survey was to prepare maps and cross-section drawings of the existing and planned drainage system in Haiphong.
(2) Method
1) Survey Area
The survey areas are shown in Figure A.2.1.1 The areas include An Kim Hai Channel and the proposed Phuong Luu Lake area.
Survey Area
Name Area An Kim Hai Channel 11 km x 50 m both sides
Cross Section: 50 m interval Proposed Phuong Luu Lake about 100 ha
2) Survey Method
The survey was carried out in November-December 2000 by a team of local consultants. The survey was done in 2 steps. In the first step, existing maps and other data from local institutes were obtained, and representative cross-sections along the channel were surveyed in order to determine the requirements for detailed survey. Then, detailed survey was designed and carried out.
Summary of To pographic Survey
Survey Method Tachymetric method Instrument • Digital Total Station SET 5E and SET 3100
(JAPAN) • Site Data Input: DR48
Reference Document
• Code of setting up topographic map, 96TCN-90 issued by State Topogtraphic Map Measurement Department
• Code of setting up land map issued by Land Map Measurement Department
The specification of the topographical survey has been made by the Geotechnical and Survey Expert of JICA Study Team. Field works and collection of existing topographical data were carried out by a local staff under supervision of Sewerage and Drainage Planner and Geotechnical and Survey Expert.
The Study on Sanitation Improvement Plan for Haiphong City, Vietnam
Final Report, Supporting Report Part A
A - 44
(3) Results and Major Findings
1) General
The survey of the An Kim Hai Channel has extended about 30-50 m to the both sides of the channel. Cross-sections of the channel have been measured with 50 m intervals (total number of cross-sections 209).
2) Topographical Maps
The results of topographical and land use surveys are presented on maps in scale 1/500, which show data of elevations and existing buildings and other structures.
2) Cross-sectional Drawings
In total 209 cross-sections were investigated at an average interval of about 50 m. The drawings of channel cross-sections are at scale H: 1/200, V: 1/100. The cross-sectional drawings include the data of water and bottom levels, ground levels on the channel banks, thickness of sediments and locations of existing houses and other structures.
3) Map Preparation
All the maps and drawings were made by AutoCAD software. Elevations are according to Haiphong City Datum.
The Study on Sanitation Improvement Plan for Haiphong City, Vietnam
Final Report, Supporting Report Part A
A - 46
A.2.2 Sewerage Topographic Survey
(1) Objectives
The main objectives of the survey were:
- to identify the locations of existing sewerage and drainage systems, - to know the main directions of water flows, and - to produce base maps for the Feasibility Study.
(2) Methods
1) Survey Area
The survey areas are shown in Figure A.2.2.1. The survey area covered proposed Vinh Niem WWTP area, 3 alternative locations for a pumping station and sewer lines in urban area (Phase 1 area).
Survey Area
Name Area Proposed Vinh Niem WWTP Area
70 ha + surrounding area
Alternative Locations for Pumping Station
3 locations, about 3,000 m2 each
Sewer Lines Trunk and branch sewers in Phase 1 area (13 phuongs, 11 km2)
2) Survey Method
The survey was carried out in November-December 2000 by a team of local consultants. The survey was done in 2 steps. In the first step, existing maps and other data from local institutes were obtained, and representative cross-sections along the channel were surveyed in order to determine the requirements for detailed survey. Then, detailed survey was designed and carried out.
Summary of Topographic Survey
Survey Method Tachymetric method Instrument • Digital Total Station SET 5E and SET 3100
(JAPAN) • Site Data Input: DR48
Reference Document
• Code of setting up topographic map, 96TCN-90 issued by State Topogtraphic Map Measurement Department
• Code of setting up land map issued by Land Map Measurement Department
The specification of the topographical survey has been made by the Geotechnical and Survey Expert of JICA Study Team. Field works and
The Study on Sanitation Improvement Plan for Haiphong City, Vietnam
Final Report, Supporting Report Part A
A - 47
collection of existing data have been carried out by a local staff under supervision of Sewerage and Drainage Planner and Geotechnical and Survey Expert.
(3) Results and Major findings
1) Sewer Network Survey
Total amount of work consisted of 30 km main sewers along 20 main streets in City Center and branch sewers in 13 wards (phuongs).
Detailed survey of branch sewers was carried out in the following wards: Cau Tre, Du Hang, Dong Hai, Gia Vien, Hang Kenh, Ho Nam, Lac Vien, Lac Tray, Le Loi, Luong Khanh Thien, May To, Trai Cau and Tran Nguyen Han.
Base maps (plan drawings) of the main and branch sewer locations are in scale 1/500. Longitudinal drawings of the main sewers are also presented in scale H: 1/500, V: 1/100 on the base maps.
The base maps present the exact locations of the sewers, manholes, river outlets, channel outlets, and lake outlets in the coordinate system of the city. The drawings present also the land use of the sewer corridors, including road corridors, housing, and other structures and infrastructure.
The dimensions and size of each main sewer section and connecting pipes are presented in the drawings. For each manhole the level of the ground surface and invert levels of all sewer pipes connected to the manhole are presented on the drawings, including connecting pipes from gully pots and other inlet structures.
2) WWTP and Pumping Stations
The results of topographical and land use surveys for the Treatment Plant and alternative sites of the pumping station were presented on maps in scale 1/500. The maps included elevations and the locations of existing buildings and other structures.
3) Map Preparation
All the maps and drawings were made by AutoCAD software. Elevations are according to Haiphong City Datum.
The Study on Sanitation Improvement Plan for Haiphong City, Vietnam
Final Report, Supporting Report Part A
A - 49
A.2.3 Topographic Survey for Trang Cat Landfill
(1) Objective
The main objective of the Topographic Survey for Trang Cat Landfill was to supplement and up-date the existing maps of the Tran Cat Landfill area. The results of the survey were used in the Feasibility Study.
(2) Method
1) Survey Area
The survey area is shown in Figure A.2.3.1. The survey area was the proposed Trang Cat Landfill (33 ha) and surrounding area.
Survey Area
Name Area Trang Cat Landfill Phase 3 Area
total 150 ha including surrounding area
2) Survey Method
The survey was carried out in November-December 2000 by a team of local consultants. The survey was done in 2 steps. In the first step, existing maps and other data from local institutes were obtained, and representative cross-sections along the channel were surveyed in order to determine the requirements for detailed survey. Then, detailed survey was designed and carried out.
Summary of Topographic Survey
Survey Method Tachymetric method Instrument • Digital Total Station SET 5E and SET 3100
(JAPAN) • Site Data Input: DR48
Reference Document
• Code of setting up topographic map, 96TCN-90 issued by State Topogtraphic Map Measurement Department
• Code of setting up land map issued by Land Map Measurement Department
The specification of the topographical survey has been made by the Geotechnical and Survey Expert of JICA Study Team. Field works and collection of data have been carried out by a local staff under supervision of Sewerage and Drainage Planner and Geotechnical and Survey Expert.
The Study on Sanitation Improvement Plan for Haiphong City, Vietnam
Final Report, Supporting Report Part A
A - 50
(3) Results and Major Findings
The results of topographical surveys for the Tran Cat Landfill area are presented on the map in scale 1/500 including e.g. data of elevations, dykes, roads, channels and existing structures.
All the maps and drawings have been made by AutoCAD software. Elevations are according to Haiphong City Datum.
The Study on Sanitation Improvement Plan for Haiphong City, Vietnam
Final Report, Supporting Report Part A
A - 52
A.2.4 Geological Survey for Sewerage Project
(1) Objective
The main objective of the geological surveys for sewerage component was to identify the soil conditions and the geotechnical design parameters of soil strata at the selected sites of the planned Waste Water Treatment Plant and the main pumping station.
The results were used for the preliminary design of foundations and earth works in the Feasibility Study.
(2) Method
1) Survey Locations
The survey was carried out in November-December 2000 by a team of local consultant. Figure A2.4.1 shows the locations of the bore holes. In total 8 bore holes were made for the survey.
Number of Bore Holes
Name Number of Bore Holes
Depth
Vinh Niem WWTP Site 6 Proposed Pumping Station Sites 2 Total 8
About 30 m
The location of the Treatment Plant is in Vinh Niem area on the northern side of Lach Tray River and the survey area was about 50 ha. Two alternative sites of a main pumping station were also investigated. The both sites are located along National Highway No 5 at Dong Khe and An Bien Wards.
2) Survey Method
Soil conditions have been investigated with rotary drillings, with soil sampling and with standard penetration tests (SPT) with 3.0 m intervals.
Disturbed soil samples were taken during SPT and undisturbed samples have been obtained with thin-wall sampling tube. Selected soil samples have been tested in soil laboratory and the following physical properties have been determined:
• specific gravity ( Gs ) • particle size distribution • water content ( w, % ) • degree of saturation • Atterberg limits ( wL, wP, % ) • Plasticity index ( IP ) • angle of internal friction ( ϕo )
The Study on Sanitation Improvement Plan for Haiphong City, Vietnam
Final Report, Supporting Report Part A
A - 53
• cohesion ( c ) • natural and dry density ( γw ,c) • void ratio ( eo) • coefficient of permeability (k , cm/s) • Compressibility (E , kN/m2 , Cc)
Angle of internal friction ( ϕ ) and cohesion ( c ) have been determined with direct shear box test and with tri-axial test and compressibility with two-dimensional compression test (oedometer test).
In addition the following chemical analyses were carried out.
• Ignition loss (% of dry solids) • Total organic matters (% of dry solids) • Cation exchange capacity (meq/100 g soil)
The specification of the geological survey has been made by the Geotechnical and Survey Expert of JICA Study Team. Investigation methods and the specification are based on site visits, general geology of the area and on the international and local codes of practice for site investigations. Field works and laboratory tests as well as reporting have been carried out by a local company under the supervision of JICA Study Team.
(3) Results and Major Findings
1) General
Field works of the geological surveys for sewerage project were started at the end of November 2000, and the Report of Soil Investigations was completed at the end of December, 2000. Borehole logs and testing results are attached in Data Book.
2) Vinh Niem WWTP Area
The site of the Water Treatment Plant is situated at the end of South- West Channel along Lach Tray River in the South-West part of the project area. The area is mainly rice field and some irrigation channels cross the area. Ground surface is in general on level +2.5 to 3.0 m. Only access road for vehicles comes from Thien Loi Road and ends to the northern corner of the site. The site borders Lach Tray River and a dyke in the South and the South -West Channel in the West.
Top layer is backfill material composed of soft organic clay. This layer is about 0.5 m – 0.9 m thick. Under this top soil there are from high to low plastic clays containing some organic matter (Layers 2 – 4). These clayey soils are from very soft to soft with consistency and they reach to the depth of 13.3 m – 16.5 m. N-values of SPT tests are N= 0 - 3. Under these soft soils there are from low to high plastic firm clays (Layers 5 – 7, N = 4 – 11). Boreholes have ended in firm clay at the depth of the 30.0 m.
The Study on Sanitation Improvement Plan for Haiphong City, Vietnam
Final Report, Supporting Report Part A
A - 54
Water content of very soft clays is w = 36% - 56%, natural density γw = 15.8 – 18.1 kN/m3, internal friction angle ϕ = 2 - 50 and cohesion c = 5 to 7 kN / m2 (tri-axial tests). In firm clay the corresponding values have been w = 30% - 41%, γw = 17.5 – 18.3 kN / m3, ϕ = 4 - 80 and cohesion c = 5 to 9 kN / m2. Soils are compressible and compression index Cc varies from 0.14 to 0.40.
The geotechnical design parameters of soil layers from top to bottom are the following: Layer 1 : Backfill, organic clay, thickness 0.5 m – 0.9 m The layer will, in general, be removed and parameters have not been determined. Layer 2 : Very soft high plastic clay with some organic (thickness 2.3 m – 6.3 m)
N-value W Gs γn e0 ϕ0 c Cc k % g/cm3 kN/m3 kN/m2 cm/s 0.7 56 2.70 16.0 1.70 2 3 0.40 45-E-7
The Cation Exchange Capacity is high (35 meq/100g ). Content of organic matters is 5.4 %. Layer 3 : Very soft low plastic clay with some organic (thickness 4.7 m – 6.0 m)
N-value W Gs γn e0 ϕ0 c Cc k % g/cm3 kN/m3 kN/m2 cm/s 2 –3 35 2.69 18.1 1.00 5 5 0.14 20-E-7
The Cation Exchange Capacity is moderately high (12 - 26 meq/100g). Content of organic matters is 1.9 - 5.2 %. Layer 4 : Very soft high plastic clay with some organic (thickness 1.3 m – 8.5 m); N-value of this layer is N = 1, other design parameters are same as for layer 2. The Cation Exchange Capacity is high (48 meq/100g ). Content of organic matters is 6.9 %. Layer 5 : Stiff low plastic clay (thickness 2.0 m – 7.6 m)
N-value W Gs γn e0 ϕ0 c Cc k % g/cm3 kN/m3 kN/m2 cm/s 9 -11 35 2.72 18.3 0.96 6 8 0.14 (* 45-E-7
(* estimated on the basis of index properties The Cation Exchange Capacity is moderate high (20 meq/100g). Content of organic matters is 1.2 %. Layer 6 : Firm low plastic clay (thickness > 7 m)
N-value W Gs γn e0 ϕ0 c Cc k % g/cm3 kN/m3 kN/m2 cm/s 6 –7 40 2.71 17.5 1.20 6 7 0.26 0.6-E-7
The Cation Exchange Capacity is moderately high (18 meq/100g). Content of organic matters is 2.1 %. Layer 7 : Stiff low plastic clay
The Study on Sanitation Improvement Plan for Haiphong City, Vietnam
Final Report, Supporting Report Part A
A - 55
This layer has been encountered only in one borehole (BH6) at the depth of 23 m. N-values are N = 8 – 11. Only water content (w = 30%) , Atterberg Limits and specific gravity (Gs = 2.72 g/cm2 ) have determined for this layer. Other properties can be regarded similar to layer 5. Ground water (perched water) has been about 0.6 m from ground surface.
3) Pumping Station
The alternative sites of the main pumping station are located at Dong Khe and An Bien Wards next to National Highway No 5. The sites are at the urban area and geotechnical conditions are similar to the both sites. Ground surface is on level +3.0 - +3.2 m.
Top layer is made of clay, sand and gravel. This layer is about from 0.7 m to 1.1 m thick. Under this top soil, there is low and high plastic clay containing some organic matter. Soil is very soft to the depth of about 18.5 – 19.5 m (N-values of SPT tests N= 1 - 3) and becomes stiffer in deeper (N = 6 - 10). Thin (0.5 m) sand layer has been met at the depth of 27.8 m in borehole BH8. The depth of the boreholes is 30.0 m.
The geotechnical design parameters of soil layers from top to bottom are the following:
N-value W Gs γn e0 ϕ0 c E k % g/cm3 kN/m3 kN/m2 kN/m2 m/s 18 6 12
(* values estimated on the basis of older investigations Layer 2 : Very soft high plastic clay with some organic (thickness 0.4 –1.7 m) The properties of this layer have not been determined, but on the basis of soil type they can be regarded the same as for layer 4. Layer 3 : Low plastic clay, very soft (thickness 2.1 –4.1 m)
N-value W Gs γn e0 ϕ0 c Cc k % g/cm3 kN/m3 kN/m2 cm/s 1 –2 38 2.69 17.6 1.11 5 4 0.22 1.0-E-7
Layer 4 : High plastic clay, very soft (thickness 13.1 –15.3 m)
N-value W Gs γn e0 ϕ0 c Cc k % g/cm3 kN/m3 kN/m2 cm/s 1 –2 53 2.70 16.0 1.60 2 2 0.40 1.2-E-7
N-value W Gs γn e0 ϕ0 c Cc k % g/cm3 kN/m3 kN/m2 cm/s 7 – 9 34 2.72 18.0 1.10 5 8 0.24 0.7-E-7
Ground water (perched water) has been about 0.6 m from ground surface .
The Study on Sanitation Improvement Plan for Haiphong City, Vietnam
Final Report, Supporting Report Part A
A - 56
ダミー裏白
The Study on Sanitation Improvement Plan for Haiphong City, Vietnam
Final Report, Supporting Report Part A
A - 58
Figure A.2.4.1 (A3 版裏)
The Study on Sanitation Improvement Plan for Haiphong City, Vietnam
Final Report, Supporting Report Part A
A - 60
Figure A.2.4.2 (A3 版裏)
The Study on Sanitation Improvement Plan for Haiphong City, Vietnam
Final Report, Supporting Report Part A
A - 61
A2.5 Geological Survey for Trang Cat Landfill
(1) Objective
The main objective of the geological surveys for Trang Cat Waste Disposal was to identify the soil conditions and the geotechnical design parameters of soil strata at the planned extension area of the Tran Cat Landfill. The results were used to the preliminary design of the landfill in the Feasibility Study.
(2) Method
1) Survey Locations
In total 10 bore holes and 2 observation wells were made in and around the proposed Trang Cat Phase III area.
Number of Bore Holes
Name Number Depth Boreholes 10 30-32 m Observation Wells 2 9 and 43 m Total 12 -
2) Survey Method
Soil conditions have been investigated with rotary drillings, with soil sampling and with standard penetration tests (SPT) with 3.0 m intervals. In addition, observation wells were installed for observations of ground water levels and for water sampling.
Disturbed soil samples were taken during SPT and undisturbed samples have been obtained with thin-wall sampling tube. Selected soil samples have been tested in soil laboratory and the following physical properties have been determined:
• specific gravity ( Gs ) • particle size distribution • water content ( w, % ) • degree of saturation • Atterberg limits ( wL, wP, % ) • Plasticity index ( IP ) • angle of internal friction ( ϕo ) • cohesion ( c ) • natural and dry density ( γw ,c) • void ratio ( eo) • coefficient of permeability (k , cm/s) • Compressibility (E , kN/m2 , Cc)
The Study on Sanitation Improvement Plan for Haiphong City, Vietnam
Final Report, Supporting Report Part A
A - 62
Angle of internal friction ( ϕ ) and cohesion ( c ) have been determined with direct shear box test and with tri-axial test and compressibility with two-dimensional compression test (oedometer test).
In addition the following chemical analyses were carried out.
• Ignition loss ( % of dry solids ) • Total organic matters (% of dry solids) • Cation exchange capacity (meq/100 g soil)
The specification of the geological survey has been made by the Geotechnical and Survey Expert of JICA Study Team. Investigation methods and the specification were based on site visits, general geology of the area and on the international and local codes of practice for site investigations. Field works and laboratory tests as well as reporting have been carried out by a local company under the supervision of JICA Study Team.
(3) Results and Major Findings
1) General
Field works of the geological surveys for the Tran Cat Landfill area were started on 27 November 2000 and completed 12 December 2000. The Report of Soil Investigations was completed at the beginning of January 2001. The total number of boreholes was 10 and the depth of the boreholes was 30-32 m. Two (2) observation wells (stand pipes), 9 m and 43 m deep, were installed for ground water monitoring. In-situ permeability tests were made in one borehole, in depths between 1 m to 20 m. The borehole logs and testing results are attached in Data Book.
2) Site Conditions
The site has originally been flood area of Cam River. At the moment there are mainly old fishing ponds and borrow pits of clay for dyke material at the site. At the western side of the area there is a landfill of domestic waste. The site is surrounded by about 3 – 4 m high dykes and some lower embankments across the area. The material of the dykes and embankments is clay and gravely clay.
The bottom level of ponds is about + 2.3 - + 2.5 m and water depth during investigations was about 1.0 m. Ground level outside the dikes is between + 2.2 and + 2.5 m. The top level of the dykes is mainly +6.4 m and the top levels of the embankments between the dykes are +3.9 - +4.4 m.
3) Soil Condition
Material of the dykes and embankments is mainly clay containing also clayey sand and stones. The upper soil layers are very soft sandy clay (Layer 1) and from very soft to soft plastic silt (Layers 2 and 3) with occasionally some organic matter and shells of clams. These very soft layers reach under the western dyke to the depth of about 13 m - 19 m, under the eastern dyke to the
The Study on Sanitation Improvement Plan for Haiphong City, Vietnam
Final Report, Supporting Report Part A
A - 63
depth of about 18 m – 24 m and to the depth of about 23 m – 28 m in the middle part of the area. Soil in deeper is firm to stiff lean clay. Dense sand layers have been encountered at the depth of about 20 - 30 m in boreholes BH1, BH6 and BH8.
Water content of very soft sandy clays is w = 27% - 30%, natural density γw = 17.5 kN / m3 and N-values of SPT are N = 0 – 2. Internal friction angle of sandy clays has been ϕ = 3 to 240 and cohesion c = 8 to16 kN / m2. In soft plastic silt the corresponding values have been w = 50% - 67%, γw = 16.0 - 17.1 kN / m3, N = 1 –4 , ϕ = 2 to 80 and cohesion c = 8 to 12 kN / m2 . These soils are compressible and compression index Cc is from 0.16 to 0.45.
Ground water (perched water) level has been met at the depth of 0.3 m - 1.4 m from ground surface. In the deeper observation well ground water has been on level –1.1 m. Soils have low water permeability varying between k-values 0.04 – 65 x 10-7 cm/s.
The geotechnical design parameters of soil layers ( recommended average values ) from top to bottom are the following:
The Study on Sanitation Improvement Plan for Haiphong City, Vietnam
Final Report, Supporting Report Part A
A - 64
Layer 0 : Fill material , stiff clay, gravely and silty clay (embankments and dykes ) (*
N-value W Gs γn e0 ϕ0 c E k % g/cm3 kN/m3 kN/m2 kN/m2 cm/s 18 6 12
(* values are according to older investigations Layer 1 : very soft sandy clay ( from ground surface to depth of 8 –10 m )
N-value W Gs γn e0 ϕ0 c Cc K % g/cm3 kN/m3 kN/m2 cm/s 1 – 2 29 2.62 17.5 1.0 10 10 0.16 7-E-7
The cation Exchange Capacity is moderately high (5.25 meq/100g). Content of organic matters is 4.8 – 5.2%. Layers 2 and 3 (3C) : very soft silt ( thickness from 6.1 m to 20.2 m )
N-value W Gs γn e0 ϕ0 c Cc K % g/cm3 kN/m3 kN/m2 cm/s 1 – 2 60 2.63 16.5 1.50 5 10 0.45 1.0-E-7
The cation Exchange Capacity is high (13.5 – 27.5 meq/100g). Content of organic matters is 8 – 10%. Layer 4 : stiff lean clay ( thickness from 0 m to 7.3 m )
N-value W Gs γn e0 ϕ0 c E K % g/cm3 kN/m3 kN/m2 kN/m2 cm/s 10 -12 37 2.66 18.4 0.98 7 40 3000 0.1-E-7
The Cation Exchange Capacity is high (15.75 meq/100g ). Content of organic matters is 8 %. Layer 5 ( 5B, 5C) : soft to firm silty and sandy clay (under layer 4 or 3)
N-value W Gs γn e0 ϕ0 c Cc K % g/cm3 kN/m3 kN/m2 cm/s 4 - 6 46 2.65 18.0 1.14 14 29 0.17 0.1-E-7
The Cation Exchange Capacity is moderate high (12.3 meq/100g). Content of organic matters is 8.8 %. Layers 3B and 6 : medium dense to dense fine sand
N-value W Gs γn e0 ϕ0 c E K % g/cm3 kN/m3 kN/m2 kN/m2 cm/s >20 20 2.63 18.0 0.5 38
Ground water level -1.0 - +1.0 m (static level)
The Study on Sanitation Improvement Plan for Haiphong City, Vietnam
Final Report, Supporting Report Part A
A - 66
A.2.6 Environmental Impact Assessment for Drainage Project
(1) Objectives
The survey of “Environmental Impact Assessment for Drainage Project” was conducted in order to gather information necessary to assess environmental impact of the proposed project. The survey also included preliminary assessment of the environmental impacts as well as proposal of mitigation measures and monitoring programs.
(2) Method
Figure A.2.6.1 shows the survey area, which covers An Kim Hai Channel (about 10 km), proposed Phuong Luu Lake area (about 42 ha), as well as the area benefited from the project, i.e., the urban center. The survey was designed by the JICA Study Team based on the results of the Initial Environmental Evaluation (IEE) and the results of the discussions with DOSTE and other relevant organizations. The EIA survey was carried out in Nov.-Dec. 2000 by a team of local consultants in accordance with relevant laws and regulations, under the supervision of the JICA Study Team.
(3) Results and Major Findings
Detailed results of the survey have been reported by the local consultant (CCET, 2000), and summarized in the section on Environmental Impact Assessment, Part C2 of the Supporting Report. Only brief summaries of the results are presented here.
1) Data Collection
Relevant data and information were collected from local authorities and other sources. The collected information includes maps, meteorological data, topographic data, geological data, land use data, socio-economic data, etc.
2) Water/Sediment Quality Survey
In total 12 surface water samples and 12 sediment samples were collected from the proposed project area and analyzed. The analyzed items are summarized below.
The Study on Sanitation Improvement Plan for Haiphong City, Vietnam
Final Report, Supporting Report Part A
A - 67
Items of Water Quality Survey
Category Items/Remarks Sampling 12 locations along An Kim Hai Channel Frequency 1 time Items flow rate/direction, temp., DO, pH, EC, turbidity, salinity,
smell, BOD5, COD, SS, T-N, NH4-N, NO3-N, NO2-N, T-P, SO4, total coliform, total bacteria, Cd, CN, Pb, Zn, Total Cr, Cr(VI), As, Hg, Cu, Fe and oil (n-Hexane extract)
(same as water quality survey) Frequency 1 time Analysis Sludge depth, pH, moisture content, volatile solid, total
solid, apparent density, BODSED, organic matter, T-N, T-P, Cd, CN, Pb, Zn, total Cr, Cr(VI), Hg and PCB
Surface Water: The results indicated that the surface water of An Kim Hai channel is heavily contaminated by sewage, and the water quality exceeded the Vietnamese surface water quality standard (TCVN 5942-1995) for BOD, COD, nitrogen and Fe.
Sediment: The sediment is also polluted by sewage. However, the concentrations of heavy metals and other toxic substances in sediment samples are relatively low, and satisfied international standards for sediment quality. This is because there are not many industrial pollution sources in the area, which discharge toxic substances to the channel.
3) Socio-Economic Survey
In order to assess current socio-economic condition of the project area, a socio-economic survey based on a questionnaire, which consisted of about 50 questions regarding socio-economic and sanitary conditions, was carried out.
Sample Size for Socio-Economic Survey
Surveyed Area Sample Size Along An Kim Hai Channel 100 City Center (beneficiary) 50 Total 150
In total 150 local residents (samples) were interviewed, of which 100 samples were taken along An Kim Hai Channel, and remaining 50 samples from the
The Study on Sanitation Improvement Plan for Haiphong City, Vietnam
Final Report, Supporting Report Part A
A - 68
city centers where people are benefited from the proposed project. It should be noted that the interview survey along the channel covered wider area than the area directly affected by the project.
An Kim Hai Area: Main occupations of the residents along the An Kim Hai Channel are civil servants (12 %), manual workers (11 %), small business (9 %) and so forth. The local residents have average monthly income of about 1,059,000 VND/month/household; the residents may be roughly described as low-to middle income level. The main sources of income are private business (48 %), pension (36 %), agriculture and aquaculutre (5 %), state salary (18 %) and other (16 %). 72 % of the households have land use entitlement, and 8 % belong to the state. 17 % of the households own agricultural or aquaculture area.
Beneficiary: The reported average income is 1,160,000 VND/month/household, varying 200,000 – 5,000,000 VND/month/household. Living standard is much higer in the urban area than the rural area.
4) Land use Survey
Based on existing maps and data collected from local authorities, the land use condition of the project area was clarified, and a land use map was produced.
5) Assessment of Environmental Impact
Preliminary assessment of environmental impact was carried out for pre-construction phase, construction phase and operation phase of the project. Matrix method was adopted in order to identify and compare both positive and negative impacts over broad aspects of environmental impacts. Among the important environmental impacts are:
- resettlement of affected residents (approx. 1,044 households)
- pollution associated with dredging/transportation/disposal of sludge
6) Mitigation Measures and Monitoring Programs
A number of mitigation measures were proposed in order to minimize environmental impacts. They include outline of resettlement plan, measures to control air pollution and noise, measures to control water pollution, and other measures. Monitoring programs were also developed so that the environmental impacts during the pre-construction, construction and operation stages of the project can be monitored.
The Study on Sanitation Improvement Plan for Haiphong City, Vietnam
Final Report, Supporting Report Part A
A - 70
A.2.7 Environmental Impact Assessment for Sewerage Project
(1) Objectives
The survey of “Environmental Impact Assessment for Sewerage Project” was conducted in order to gather information necessary to assess environmental impact of the proposed project. The survey also included preliminary assessment of the environmental impacts as well as proposal of mitigation measures and monitoring programs.
(2) Method
Figure A.2.7.1 shows the survey area, which covers the proposed Vinh Niem WWTP area, proposed pumping station area (3 alternative locations in Dang Gian ward), and urban center where sewer lines will be constructed. The survey was designed by the JICA Study Team based on the results of the Initial Environmental Evaluation (IEE) as well as the results of the discussions with DOSTE and other relevant organizations. The survey was carried out in Nov.-Dec. 2000 by a team of local consultants in accordance with relevant laws and regulations, under the supervision of the JICA Study Team.
(3) Results
Detailed results of the survey have been reported by the local consultant (CCET, 2000), and summarized in the section on Environmental Impact Assessment, Part C3 of the Supporting Report. Only brief summaries of the results are presented here.
1) Data Collection
Relevant data and information were collected from local authorities and other sources. The collected information includes maps, meteorological data, topographic data, geological data, land use data, socio-economic data, etc.
2) Water/Sediment Quality Survey
In total 18 surface water samples and 5 groundwater samples were collected from Lach Tray River and from the vicinities of the proposed Vinh Niem WWTP. Table below summarizes the analytical items.
The Study on Sanitation Improvement Plan for Haiphong City, Vietnam
Other: 1 location Frequency Lach Tray River: 4 times
Other: 2 times Items temp., DO (mg/l), pH, EC, turbidity, salinity, smell,
BOD5, COD, SS, T-N, NH4-N, NO3-N, NO2-N, T-P, SO4, total coliform, total bacteria, Cd, CN, Pb, Zn, Total Cr, Cr(VI), As, total Hg, Cu, Fe and oil (n-Hexane extract)
Water Current Lach Tray River (near the proposed discharge point) 12 times (4 times x 3 days depending on tidal cycle)
Items of Sediment Quality Survey
Category Items/Remarks Sampling 4 locations (Lach Tray River and SW Channel), surface Frequency 1 time Analysis Sludge depth, pH, moisture content, volatile solid, total
solid, apparent density, BODSED, T-N, T-P, Cd, CN, Pb, Zn, total Cr, Cr(VI), Hg, and PCB
Existing water quality data from the proposed alternative sites for pumping station were also compiled.
Hydrology: To investigate the impacts of tide/flow of Lach Tray River on the discharge of effluent from Vinh Niem WWTP, hydrological characteristics of Lach Tray River was investigated in Nov. 2000. It was found that Lach Tray River around Vinh Niem area exhibits strong tidal characteristics, and the flow rate varies –355 m3/s to 382 m3/s depending on the tidal condition.
Surface Water: The results indicated that Lach Tray River, to which the effluent from the Vinh Niem WWTP will be discharged, is not heavily polluted. Most parameters including heavy metals and nutrients were within the environmental standards TCVN 5942-1995: BOD is in the order of 6.0 – 8.2 mg/l (TCVN 5942-1995 25 mg/l). However, SS (5 – 173 mg/l) was higher than the standard (80 mg/l) in some samples.
Groundwater: The groundwater samples from the Vinh Niem area were also relatively free from pollution, although salinity level is somewhat high presumably due to saltwater intrusion from the coastal area. Coliform level also exceeded the environmental standard (TCVN 5944-1995).
The Study on Sanitation Improvement Plan for Haiphong City, Vietnam
Final Report, Supporting Report Part A
A - 72
Sediment: 2 samples from Lach Tray River and 2 samples from SW Channel were collected and analyzed in Nov. 2000. All parameters were within the acceptable ranges of international soil quality standards.
3) Air Quality Survey
An air quality survey (meteorology, NO2, CO, NH3, H2S and Dust) was carried out at 4 locations in Haiphong, including in Vinh Niem area.
Items of Air Quality Survey
Category Items/Remarks Location 4 locations Frequency 7 days Items temperature, wind direction, wind speed (every 2 hours)
The results indicated that the air in Vinh Niem area is not particularly polluted, which was expected because there are not many major pollution sources in the area. Only the concentrations of H2S and NH3 exceeded the national ambient air quality standard (TCVN5938-1995) which may be attributed to the natural emission from paddy area and from the SW Channel.
4) Socio-Economic Survey
In total 30 local residents in Vinh Niem area were interviewed in order to identify their socio-economic and sanitation conditions. Similar survey using the same questionnaire was also carried out in the city center, where people are expected to be benefited from the proposed project.
Vinh Niem area: The general residents in Vinh Niem are characterized as middle-class farmers with average income of 726,000 VND/month/household varying from 280,000 to 2,000,000 VND/month/household. The residents are mainly engaged in farming (43 %), and 17 % are shop keepers. 63 % of the interviewed households have 1,000-1,440 m2 of land for cultivation.
Beneficiary: The reported average income is 1,160,000 VND/month/household, varying 200,000 – 5,000,000 VND/month/household. Living standard is much higer in the urban area than the rural area.
5) Land use Survey
Based on the existing maps, the result of the topographical survey and the land use data from local authorities, the land use condition of the project area was clarified, and a land use map was produced.
The Study on Sanitation Improvement Plan for Haiphong City, Vietnam
Final Report, Supporting Report Part A
A - 73
6) Assessment of Environmental Impact
Preliminary assessment of environmental impact was carried out for pre-construction phase, construction phase and operation phase of the project. Matrix method was utilized in order to identify and compare both positive and negative impacts over broad aspects of environmental impacts. Among the important environmental impacts are:
- land acquisition (42 ha) and resettlement (23 households)
- disposal of sludge from WWTP and sewer lines
7) Mitigation Measures and Monitoring Programs
A number of mitigation measures were proposed in order to minimize environmental impacts. They include outline of resettlement plan, measures to control pollution, etc. In addition to mitigation measures, monitoring programs were also developed so that the environmental impacts during the pre-construction, construction and operation stages of the project can be monitored.
The Study on Sanitation Improvement Plan for Haiphong City, Vietnam
Final Report, Supporting Report Part A
A - 75
A.2.8 Environmental Impact Assessment for Solid Waste Management
(1) Objectives
The survey of “Environmental Impact Assessment for Solid Waste Management Project” was conducted in order to gather information necessary to assess environmental impact of the proposed project. The survey also included preliminary assessment of the environmental impacts as well as proposal of mitigation measures and monitoring programs.
(2) Method
Figure A.2.8.1 shows the survey area, which covers the proposed Trang Cat Phase 3 Project area and its vicinities. The survey was designed by the JICA Study Team based on the results of the Initial Environmental Evaluation (IEE) as well as the results of the discussions with DOSTE and other relevant organizations. The survey was carried out in Nov. -Dec. 2000 by a team of local consultants in accordance with relevant laws and regulations, under the supervision of the JICA Study Team.
(3) Results
Detailed results of the survey have been reported by the local consultant (ENCEN, 2000), and summarized in the section on Environmental Impact Assessment, Part C4 of the Supporting Report. Only brief summary of the results are presented here.
1) Data Collection
Relevant data and information were collected from local authorities and other sources. The collected information includes maps, meteorological data, topographic data, geological data, land use data, socio-economic data, etc.
2) Water/Sediment Quality Survey
In total 6 surface water samples, 5 groundwater samples, and 3 sediment samples were collected from the project area.
The Study on Sanitation Improvement Plan for Haiphong City, Vietnam
groundwater : 5 locations (depth 9 – 35 m) Frequency surface water : 2 times (ebb tide, flood tide)
groundwater : 1 time Items temp., DO (mg/l), pH, EC, turbidity, salinity, smell,
BOD5, COD, SS, T-N, NH4-N, NO3-N, NO2-N, T-P, SO4, total coliform, total bacteria, Cd, CN, Pb, Zn, Total Cr, Cr(VI), As, Hg, Cu, Fe and oil (n-Hexane extract)
Items of Sediment Quality Survey
Category Items/Remarks Sampling 3 location, surface sample Frequency 1 time Analysis Sludge depth, pH, moisture content, volatile solid, total
solid, apparent density, BODSED, T-N, T-P, Cd, CN, Pb, Zn, total Cr, Cr(VI), Hg, and PCB
It was found that the water and sediment in and around the proposed project area are not heavily polluted. This also suggests that the environmental impact of the existing landfill is limited for the time being.
Surface Water: The concentrations of iron (measured 0.86-3.78 mg/l; standard 0.10 mg/l), oil (measured 0.011-0.31mg/l; standard, not detected) and SS (measured 15-90 mg/l; standard 80 mg/l) were found above the environmental standards (TCVN5942-1995). Iron and SS are probably natural origin, and the oil is from the discharge from ships and boats. Concentrations of all other items including heavy metals were below the environmental standards.
Groundwater: Only iron (measured 0.12-10.52 mg/l; std. 1-5 mg/l) was found above the environmental standard (TCVN5944-1995).
Sediment: Because there is no sediment quality standard in Vietnam, the results were compared against sediment quality standards in European Countries. All samples satisfied international sediment quality standards.
3) Air Quality Survey
An air quality survey (meteorology, NO2, CO, NH3, H2S, odor and dust) was carried out along the existing access road to Trang Cat Landfill site, which is regularly used by collection trucks.
The Study on Sanitation Improvement Plan for Haiphong City, Vietnam
Final Report, Supporting Report Part A
A - 77
Items of Air Quality Survey
Category Items/Remarks Location 1 location Frequency 7 days Items temperature, wind direction, wind speed (every 2 hours)
Traffic Survey (number of vehicle, direction, type, collection vehicle)
At the same time, traffic volume was recorded. The noise level is in the order of 42 – 63 dB(A) indicating relatively quiet environment as expected from the low local traffic volume. However, during a busy hour, as many as 15 heavy collection trucks/hour pass through the narrow road, which is only 4 – 5 m wide.
6) Social Survey
In order to investigate the environmental impact of the proposed project, 20 local residents in the area (10 along the existing access road and 10 near the proposed Trang Cat Phase 3 site) were interviewed. The results indicated that nearly a half of the residents in the area are farmers, while about 20 % of the residents near the Tran Cat Phase 3 area are fishermen (aquaculture). The average income level is about 914,000 VND/month/household in Vinh Niem area and 1,370,000 VND/month/household in Nam Hai area. Among the main environmental complaints from the local residents were traffic of collection trucks and offensive odor from the existing landfill.
The Study on Sanitation Improvement Plan for Haiphong City, Vietnam
Final Report, Supporting Report Part A
A - 78
7) Assessment of Environmental Impacts
Preliminary assessment of environmental impact was carried out for pre-construction phase, construction phase and operation phase of the project. Assessment of impacts in post-operation phase is also included. Matrix method was used in order to identify and compare both positive and negative impacts over broad aspects of environmental impacts. See Section C, Environmental Impact Assessment, for details.
8) Mitigation Measures and Monitoring Programs
A number of mitigation measures were proposed in order to minimize environmental impacts. In addition to mitigation measures, monitoring programs were also developed so that the environmental impacts during the pre-construction, construction and operation stages of the project can be monitored.
The Study on Sanitation Improvement Plan for Haiphong City, Vietnam
Final Report, Supporting Report Part A
A - 80
A.2.9 Recycling Materials Market Survey
The JICA Study Team has conducted a recycling materials market survey in October and November 2000 in Haiphong. The survey and its results are outlined as follows:
(1) Survey Objective
The objective is to estimate quantity and value of the recyclable materials traded in Haiphong. Kinds of materials surveyed include the following:
1. Paper
2. Plastics
3. Metals
4. Glasses
5. Food and others
There are some industrial waste materials that are reused or recycled within the factory that generates these materials, or exchanged/traded between the factories without going through the hands of intermediary traders. These types of industrial waste materials are out of the scope of the current survey.
(2) Survey Method
We have followed the following methods and procedures.
1. Study the structure of the recycle materials market
2. Visit and interview with traders of all levels as well as end users of recyclable materials (manufacturers)
3. Analysis of the data collected, and make assumptions
4. Estimation of quantity and value of recyclable materials collected in Haiphong based on the data and assumptions
Market Situation, Difficulty Encountered and Solution:
The recyclable materials market has the following situation:
1. There are many traders of different level in the market. In terms of number, most of them are individual traders
2. Some primary traders do not necessarily sell materials to the secondary traders, but they sometimes sell to final traders or even to the end users.
Because of the above situation,
1. We could not interview all the traders operating in Haiphong
The Study on Sanitation Improvement Plan for Haiphong City, Vietnam
Final Report, Supporting Report Part A
A - 81
2. Double counting or even triple counting might result if we simply add up quantity data of each traders surveyed.
In view of the above situation, we used mainly quantity data of the end users in order to estimate quantity of recyclable materials traded in Haiphong. We also made assumptions on the relationship between players of different levels in order to estimate the total quantity
(3) Major Findings
1) Players of Markets
Recyclable materials market consists of the following players:
a. Generators of recyclable materials
b. Traders of different levels
1. Primary collector (junk buyer, scavenger)
2. Secondary trader
3. Final trader
c. End users
2) Relationship between the Players
General flow of the recyclable materials is as follows:
Generators (Households and enterprises)
Traders of Different Levels
End Users
Primary traders do not necessarily sell materials to the secondary traders. There are cases where the primary traders sell materials to final traders or even to the end users.
Some items such as used paper are sold to end users (paper manufacturers) located not only inside Haiphong City but also to those located outside Haiphong City. On the other hand, Haiphong end users of some materials including used plastics purchase materials from not only Haiphong but also from neighborhood provinces.
The Study on Sanitation Improvement Plan for Haiphong City, Vietnam
Final Report, Supporting Report Part A
A - 82
Trade Relationship between Traders
3) Quantity and Value of Recyclable Materials Collected in Haiphong
(a) Summary
As shown in the table, total quantity of recyclable materials collected and traded in Haiphong is estimated to be 13,272 ton/year or 36.4 ton/day on average. This corresponds to about 8.3% of the waste collected by the URENCO (367 ton/day). Total value of the recyclable materials collected and traded in Haiphong is estimated to be about 30 billion Dong (approximately US$ 2.1 million) per year. See the table and charts below.
In addition, there are industrial waste materials that are either internally reused/reprocessed inside the factories or sold to other factories as industrial inputs without going through any traders. Amount of such industrial waste materials is estimated to be about 50 ton/day through the two factory surveys conducted by the JICA Study Team in 2000.
Primary Traders
Secondary Traders
Final Traders
End Users (Manufacturers)
Generators
The Study on Sanitation Improvement Plan for Haiphong City, Vietnam
Final Report, Supporting Report Part A
A - 83
Quantity and Value of Recyclable Materials Collected and Traded in Haiphong
Kinds of Materials
Quantity of Materials Collected and Traded in
Haiphong (Ton/year)
Value of Materials Collected and Traded in Haiphong
Million (million Dong/year) 1. Paper 6,768 (51%) 9,964 (33%) 2. Plastics 3,120 (24%) 11,012 (37%) 3. Metals 2,580 (19%) 8,543 (28%) 4. Glasses 384 (3%) 154 (1%) 5. Others 420 (3%) 479 (2%) 6. Total 13,272 (100%) 30,153 (100%) 7. Total on Daily Base
36.4 ton/day
83 million Dong/day
Quantity of Recyclable Materials Collected in Haiphong(Total: 13,272 ton/year = 36.4 ton/day)
6,768
3,1202,580
384 420
01,0002,0003,0004,0005,0006,0007,0008,000
1. Paper 2. Plastics 3. Metals 4. Glasses 5. Others
ton/
year
Note: Major items of “Others” are food, shoes, and duck’s feather.
Value of Recyclable Materials Collected in Haiphong (Total:30,153 million Dong/month)
9,96411,012
8,543
154 4790
2,000
4,000
6,000
8,000
10,000
12,000
1. Paper 2. Plastics 3. Metals 4. Glasses 5. Others
Mill
ion
Don
g/ye
ar
The Study on Sanitation Improvement Plan for Haiphong City, Vietnam
Final Report, Supporting Report Part A
A - 84
(b) Distinction between Materials Recovered from Generation Sources and Those Recovered/scavenged from Waste
Materials collected from the generation sources before being discharged as waste is much more significant than those recovered/scavenged from waste. In terms of quantity, the former shares 88 %, and the latter shares 12%. In terms of value, the former shares 91%, and the latter shares 9% as shown in the following table and charts.
In case of the latter, materials are recovered/scavenged from two different types of places, i.e., waste transfer points and the landfill site. It is mainly URENCO workers who recover materials at the transfer points, while it is scavengers who scavenge materials from the landfill site.
Recyclable Materials Quantity and Value by Collection Sources
Quantity Collected
(ton/year) Value Paid by End Users
(Million Dong/year)
1. Collected from Waste (transfer point & Landfill site) 11,685 88% 27,527 91%
2. Collected from Generation Source
1,587 12% 2,626 9% 3. Total 13,272 100% 30,153 100%
Quantity of Recyclable Materials by Collection Source (Total:13,272 ton/year = 36.4 ton/day)
88%
12%
1. Collected fromGeneration Sources
2. Collected from Waste(transfer point & LandfillSite)
The Study on Sanitation Improvement Plan for Haiphong City, Vietnam
Final Report, Supporting Report Part A
A - 85
Value of Recyclable Materials by Collection Source (Total:
30,153 million Dong/year)
91%
9%
1. Collected from Generation Sources
2. Collected from Waste (transfer point & Landfill Site)
(c) Recyclable Materials by Kinds and Collection Sources
The following table shows quantity of recyclable materials by kinds and by collection sources.
Quantity of Recyclable Materials by Kinds and by Sources
The Study on Sanitation Improvement Plan for Haiphong City, Vietnam
Final Report, Supporting Report Part A
A - 86
The table shows the proportion of materials (all surveyed items) by collection sources as follows:
a. Materials recovered from generation sources: 88%
b. Materials recovered from transfer points: 11%
c. Materials scavenged from waste at landfill site: 1%
Materials scavenged from the landfill site are very small. They share only 1 % of the whole materials recovered from both generation sources and waste. Only exception is glass. 61% of recyclable glass material is recovered from transfer points, 10 % from the landfill site, and the remaining 29% from the sources.
The following table shows value of recyclable materials by kinds and by collection sources. The table shows that value of recyclable materials scavenged from waste at the landfill site is 1%; those recovered from transfer points 8%, and the remaining 91% from the generation sources.
Value of Recyclable Materials by Sources of Collection
Unit: 1000 Dong/year
Recovered/Scavenged from Waste
Collected at Generation Sources
a
At Transfer Points
b
Collected from Waste at Trang
Cat Landfill Site c
Sub Total b+c = d
Total a+d =
e 1. Paper 9,148,968 707,928 107,316 815,244 9,964,212
The Study on Sanitation Improvement Plan for Haiphong City, Vietnam
Final Report, Supporting Report Part A
A - 87
A.2.10 Hazardous Industrial Waste Survey
The JICA Study Team has conducted a hazardous industrial waste survey in October and November 2000 in Haiphong. The survey is outlined as follows:
(1) Survey Objective
The objective is to prepare an inventory of hazardous industrial waste generated in Haiphong City area. The Vietnamese Hazardous Waste Regulation 155/1999 is used for definition and categorization of hazardous waste.
(2) Survey Method
We have followed the following methods and procedures.
1. Identification of all factories in Haiphong that generate hazardous industrial waste.
2. Based on the following information and procedure, we have identified 28 factories together that are listed in Table A.2.10.1 hereto attached to this section.
a. Results of the 100 Factory Survey conducted by the JICA Study Team in June 2000, 8 factories, among the 100 factories, were identified as generating hazardous waste.
b. Information of Haiphong DOSTE, based on which, additional 20 factories were identified as generating hazardous industrial waste. According to DOSTE’s data, no other factories in Haiphong generate hazardous waste.
3. Visit and interview all the 28 factories identified, and recorded necessary data in the recording sheets.
4. Analyze data obtained, and compile the inventory.
(3) Results (Inventory of Hazardous Waste Generated)
1) Factories that Generate Hazardous Industrial Waste
As result of the survey, it has been found that there are 17 factories in Haiphong that generate hazardous industrial waste that are determined so based on the Vietnamese Regulation 155/1999. See Table A.2.10.2 attached to this section.
Of the 17 factories that generate hazardous industrial waste, 13 factories either recycle or sell the generated hazardous waste or materials.
It is estimated that total generation amount of hazardous industrial waste is 778 ton/year or 2.13 ton/day on average. The inventory of the hazardous industrial waste in Haiphong is shown in Table A.2.10.3 here to attached to this section.
The Study on Sanitation Improvement Plan for Haiphong City, Vietnam
Final Report, Supporting Report Part A
A - 88
2) Material Recycled and Waste Disposed
Of the 778 ton/year of hazardous industrial waste, as much as 415 ton/year (1.14 ton/day) that corresponds to 54% is recycled or sold. The remaining waste 363 ton/year (0.99 ton/day) is the hazardous industrial waste that are disposed as waste.
Hazardous Industrial Waste Recycled or Disposed as Waste
Generation Quantity Percent (%) 1. Recycled or Sold 1.14 ton/day 53% 2. Disposed as Waste 0.99 ton/day 47% 3. Total (1+2) 2.13 ton/day 100%
53%
47% Recycled (1.14 t/d)
Disposed as Waste (0.99 t/d)
Hazardous Industrial Waste Recycled and Disposed as Waste (Total: 2.13 ton/day)
3) Types of Hazardous Industrial Waste Generated including Those Recycled
Of the 778 ton/year of hazardous industrial waste generated, waste of footwear manufactures share the largest portion, i.e. 246 ton/day (31.6%), the second is waste oil or cloth containing waste oil 208 ton/year (27%), the third is cement fibro board containing asbestos 200 ton/year (26%). See the table below.
The Study on Sanitation Improvement Plan for Haiphong City, Vietnam
Final Report, Supporting Report Part A
A - 89
Hazardous Industrial Waste by Type Including That Recycled
Generation Type of Hazardous Waste Code by (155/1999) (Ton/year) (Ton/day)
Percent (%)
1. Leather, rubber, sponge attached with glue, generated from footwear companies
A3050 246 0.67 31.6
2. Waste oil or cloth containing waste oil
A3020 208 0.57 26.7
3. Cement fibro board containing asbestos
A2050 200 0.55 25.7
4. Coal cinder containing PbO or PbO2
A1020 50 0.14 6.4
5. Steam solvent evaporating from a paint company
A3080 40 0.11 5.1
6. Paint & liquid color powder, containers contaminated with chemicals
A4070 23 0.06 2.9
7. Phosphate salt contaminated container or materials
4) Focus on Hazardous Industrial Waste that Need Close and Careful Attention
(a) Factories to be Closely Monitored
There are 8 factories that generate non-recycled hazardous industrial waste that is disposed as waste. Total amount of such waste is 0.99 ton/day or 363 ton/year. Of the 8 factories, 4 factories are footwear-manufacturing companies (Foreign/Local Joint Venture). The other companies are Enamel-ware Factory, Rubber & Plastic Company, Haiphong Toaxe Factory (railroad car & spare parts manufacturer), and Haiphong Paint Company. The Inventory of Non-Recycled Hazardous Industrial Waste is shown in Table A.2.10.4 hereto attached to this section. These factories and waste need to be closely monitored and controlled.
(b) Types of Non-Recycled Hazardous Industrial Waste
Of 0.99 ton/day of hazardous industrial waste disposed as waste; 0.57 ton/day (57%) is the waste generated from footwear manufacturers (Foreign/Local Joint Venture); 0.28 ton/day (29%) is waste oil or waste cloth containing waste oil; 0.11 ton/day (11%) is steam solvent evaporating from a paint
The Study on Sanitation Improvement Plan for Haiphong City, Vietnam
Final Report, Supporting Report Part A
A - 90
manufacturer; and the remaining 0.03 ton/day (3%) is bad paint and liquid color powder.
Remark:
Special attention should be paid to Haiphong Paint Company that generate steam solvent that evaporates into air, and bad paint and liquid color powder that the company stores inside the factory.
Non-Recycled Hazardous Industrial Waste by Type
Generation Type of Hazardous Waste Code by (155/1999) (Ton/year) (Ton/day)
Percent (%)
1. Leather, rubber, sponge attached with glue, generated from footwear companies
Non-Recycled Hazardous Industrial Waste by Type (Total: 0.99 ton/day)
The Study on Sanitation Improvement Plan for Haiphong City, Vietnam
Final Report, Supporting Report Part A
A - 91
(c) Methods of Disposal of Non-Recycled Hazardous Industrial Waste
Of the 0.99 ton/day of non-recycled hazardous industrial waste that is disposed as waste, 0.7 ton/day (71%) is incinerated at Hung Tinh incinerator (private company) located at Trang Cat Commune, 0.16 ton/day (16%) is dumped at Trang Cat Landfill Site. The remaining 0.13 ton/day (13%) is disposed of by factory itself.
Non-Recycled Hazardous Industrial Waste Generation Quantity by Disposal Method
Disposal Method Disposal Quantity (Ton/day)
Percent (%)
1. Incineration at Hung Tinh incinerator 0.70 70% 2. Disposed at Trang Cat Landfill Site 0.16 16% 3. Disposed by factory 0.13 14% 4. Total (1+2+3) 0.99 100%
Non-Recycled Hazardous Industrial Waste by Disposal Method (Total: 0.99 ton/day)
The Study on Sanitation Improvement Plan for Haiphong City, Vietnam
Final Report, Supporting Report Part B
B - 1
B. IMPLEMENTATION OF PILOT PROJECT
B.1 Objectives and Outline of Pilot Project
The objectives of the Pilot Project are the followings:
i) to transfer technology of operation and maintenance of wastewater treatment, ii) to demonstrate treatment technologies and thereby raise the environmental
awareness of the citizens, and iii) to investigate appropriate technologies for water purification and treatment.
There are two components of the pilot project. The first is to treat polluted ambient water by Contact Purification Process (CPP). The other is to treat wastewater by Activated Sludge Process (ASP). The locations of the pilot project plants are shown in the Figure B.1.
B.2 Contact Purification Unit
(1) Selection of Technology
As an example of appropriate technologies to treat polluted ambient water, such as water from channel and lakes, Contact Purification Process (CPP) was selected based on the fact that this process requires little or no energy to operate, low investment cost, little maintenance, locally available materials, and low land requirement.
(2) Outline of CPP
Figure B.2 shows the design of the plant. The plant was designed to treat the polluted water from Southeast channel at the design capacity of 12 m3 per day. The plant is installed near Vinh Niem Tidal Gate (Figure B.3). Oyster shell, which was collected from Bac Dang River in Ha Nam Island, is used for the contact media.
(3) Installation
Installation of CPP was completed in June 2000 and the test operations were made in July 2000. In the 2nd phase during October 2000 to January 2001, the following tasks are carried out:
• optimization of systems • regular operation and samplings • assessment of performance • technology transfer
The operation was started in October 2000 by the Study Team by subletting daily operation work to a Vietnamese contractor with the cooperation of HPPC, in particular SADCO, and continued until late January 2001.
The Study on Sanitation Improvement Plan for Haiphong City, Vietnam
Final Report, Supporting Report Part B
B - 2
(4) Optimization of Systems
• Power supply: Although new electric line was installed, operation was hampered due to frequent power failures. One electric generator was installed to prevent operation stoppage.
• Standby motor: There was also a motor failure. Hence, a standby motor was installed.
(5) Regular Operation and Samplings
The regular operation of the units was started in late October 2000, and continued until January 2001. The following water quality parameters are monitored during the operation of the units.
Sampling Points, Frequency and Items
Sampling Point 11 points (inlet, outlet, and between reactors) Sampling Frequency 10 times (approx. 1 time/week) Items Temperature, BOD5, COD, SS, NH4-N, NO2-N,
NO3-N, T-N, T-P, DO, pH
In addition to this monitoring, daily monitoring of several parameters (pH, DO, COD, transparency) has been carried out by SADCO.
(6) Assessment of Performance
Figure below shows a snapshot of BOD5 concentrations in the contact purification unit, which consists of a primary sedimentation tank, 8 contact purification reactors (sub-unit) and a final sedimentation tank in series.
The Study on Sanitation Improvement Plan for Haiphong City, Vietnam
Final Report, Supporting Report Part B
B - 3
In this case, most of the BOD5 load was removed within the first 3 reactors, and the overall BOD5 removal efficiency was 90 %. The influent BOD5 concentration (i.e., canal water) was about 8 mg/l, and the effluent BOD5 concentration from the final sedimentation tank was 0.8 mg/l. Table below summarizes the results from the operation during October 30-December 18, 2000 (8 samples).
Average Performance of Contact Purification Unit (preliminary)
Unit BOD5 COD SS T-N T-P Influent mg/L 5.46 40.43 75.63 13.72 1.29
* : Environmental Standard TCVN5942-1995 (column B) ** : as NO3-N
About 40 % removals of BOD, SS and T-N were achieved. It was also demonstrated that the system was relatively stable even the quality of influent fluctuated significantly (e.g., 1.01 – 12.8 mg/l in BOD5) due to the tidal fluctuation and operation of tidal gate.
Complete water quality data is provided in Data Book.
0
2.5
5
7.5
10
Influ
ent
Prim
ary
Sed
.Ta
nk
Rea
ctor
-1
Rea
ctor
-2
Rea
ctor
-3
Rea
ctor
-4
Rea
ctor
-5
Rea
ctor
-6
Rea
ctor
-7
Rea
ctor
-8
Fin
al S
ed.
Tank
BO
D5
(mg/
l)
0%
20%
40%
60%
BO
D5
Rem
oval
(%
)
BOD5 Removal (%)
BOD5 (mg/l)
Removal of BOD5 by Contact Purification Unit (Oct. 30 2000)
The Study on Sanitation Improvement Plan for Haiphong City, Vietnam
Final Report, Supporting Report Part B
B - 4
(7) Construction and Operation Cost
The collection of oyster shells and procurement of drams for CPP was 3,250 US$. The installation and test operation cost for CPP was 15,500 US$. The regular operation and evaluation cost for CPP was 26,890 US$.
B.3 Activated Sludge Unit
(1) Selection of Technology
Eight treatment technologies representing broad classes of wastewater treatment technologies were considered for the pilot project. These are as follows,
The 8 possible options for the Pilot Project were compared with respect to 12 selection criteria as explained below. The selection matrix is given in Table B-1.
1. Contribution to the selection of future technology and technology transfer
One of the objectives of the pilot project is to help examine the appropriate wastewater treatment process suitable for Hai Phong City. Another major objective is to transfer technology for the operation and maintenance of wastewater treatment to the Vietnamese side. In this regard, all eight treatment-technologies considered here can meet the objective.
2. Environmental awareness raising
The focus of the pilot project in the JICA Study is to demonstrate useful technology to Vietnamese side as a viable wastewater treatment process. With the implementation of the pilot project, the importance and significance of the wastewater treatment for preserving and improving the environment will be clearly established, which will raise the environmental awareness. In this regard, all eight treatment-technologies considered here can meet the objective.
3. Proven technology
Not all treatment process is suitable for every place. In case of SP and AL, certain local factors like temperature and sunlight plays some crucial role in the treatment process. For CW, climate, soil condition, and choice of plant are important. The AnA process depends on pollution load and operation
The Study on Sanitation Improvement Plan for Haiphong City, Vietnam
Final Report, Supporting Report Part B
B - 5
condition, among others. On the other hand, OD, AS, AJ and MT are rather independent of local conditions.
4. Effectiveness of small scale operation
Each treatment process has a limitation of scale below which it is not possible to operate that process effectively. AS, AJ, AnA and MT can be operated with small volume. Other process requires around ten times more influent volume for treatment to operate properly, and therefore not suitable as pilot project option.
5. Small land requirement
As an off-site treatment technology, AS and MT requires lowest land area. The land requirements for OD, AL and SP are around 4, 40 and 120 times that of AS, respectively.
6. Short construction time
Because of rather short time frame for the pilot project implementation and operation in the Study, the construction of the pilot project has to be completed within short time. Processes like SP, AL and CW requires long construction period. AS, AJ, OD and MT can be constructed quickly.
7. Short start-up time
Any biological wastewater treatment process requires a start-up time until it reaches steady state condition. For example, it can take few months to stabilize a SP while it will take only few weeks for AS and few days for MT. For pilot project in the Study, a process has to be selected that requires short start-up time.
8. Low construction cost
To get a reliable result, pilot project has to be constructed with full consideration of scale of effective operation (as explained in item 4). In case of SP or AL as a pilot project technology process, it has to be constructed in bigger scale (for example, ten times the size of possible AS process). On the other hand, AS, AJ and MT can be constructed in small scale with low budget yet providing useful experience.
9. Not yet implemented or planned in public sector
A SP is planned in the FINNIDA project to be constructed in near future. In the Nomura Hai Phong Industrial Zone, an AS is working. However, that was constructed in private sector and may not be made available to the public sector as a demonstration plant.
10. Availability of local contractor for implementation and O&M
Based on the preliminary information, the local contractors have some difficulties in construction and operation of CW, AJ and AnA. Qualified local contractors can implement other process technology.
11. Unit construction and O&M cost
The Study on Sanitation Improvement Plan for Haiphong City, Vietnam
Final Report, Supporting Report Part B
B - 6
From the point of full-scale operation, unit construction and O&M cost is high for the AS and MT processes. The cost is relatively smaller for OD and AJ process. It is less expensive to have other four processes considered here as full-scale treatment technology.
12. Other requirements or usefulness for future reference
Although it is not possible to ascertain that which process is most suitable for Hai Phong in 2020 at this stage of the Study, it can be anticipated that MT would be too high technology to be adopted. Also, AS and AJ may not be the appropriate technology considering the present and expected land use and economic situation as well as the technology level expected in the coming 20 years. One of other five remaining technologies or some combination will probably be the most appropriate.
Activated sludge is one of the most advanced wastewater technologies and the knowledge and experience acquired can be utilized for the others. In particular, they can be useful for operating OD process, which considerably shares common technology with activated sludge. Thus, activated sludge option was adopted due mainly to the following reasons.
(i) Appropriateness as pilot project
In compliance with the agreed schedule for the Study, the Pilot Project construction would be completed within 4 months of the first work in Vietnam and operated for demonstration in the subsequent second work in Vietnam. In order to be implemented as Pilot Project, the option should essentially meet the criteria of Proven Technology, Effectiveness of Small-Scale Operation, Small Land Requirement and Short Construction/Start Up Time. Activated Sludge option meets all these.
(ii) Meet the objectives of pilot project
Activated Sludge technology is the most advanced one and might not be selected for Haiphong. However, this technology includes the basic technology of biological treatment, which is common to many treatment methods. The transfer of technology would help operation of treatment plants of various types. Demonstration of the treatment would surely contribute much to the environmental awareness rising among the concerned people including Haiphong citizens.
(2) Outline of ASP
Figure B.4 shows the design of the plant. The plant is designed to treat sewage from the residential area at the design capacity of 6 m3/day. The plant is installed at Dong Quoc Binh Pumping Station in Ngo Quyen District (Figure B.5).
The Study on Sanitation Improvement Plan for Haiphong City, Vietnam
Final Report, Supporting Report Part B
B - 7
(3) Installation
Installation of ASP was completed in June 2000 and the test operations were made in July 2000. In the 2nd phase during October 2000 to January 2001, the following tasks are carried out:
• optimization of systems • regular operation and samplings • assessment of performance • technology transfer
The operation was started in October 2000 by the Study Team by subletting daily operation work to a Vietnamese contractor with the cooperation of HPPC, in particular SADCO, and continued until late January 2001.
(4) Optimization of Systems
• Seed sludge: First startup with seed sludge was failed. Presumed reason was the variance of microorganism species in the seed sludge. Because of low amount of influent in the plant and long sludge retention time (SRT) and hydraulic retention time (HRT), microorganism species were not typical of activated sludge process. Hence, seed sludge from another activated sludge plant was introduced checking that plant was operating under conventional activated sludge condition. The startup went successfully.
• Plate in sedimentation tank: It was observed that sludge wasting occuring, which is typical to a small scale plant. The major reason presumed was the insufficient settlement in the secondary sedimentation tank due to short-circuiting. A plate was installed in the secondary sedimentation tank to prevent the short-circuiting and to ensure required retention.
• Plate in aeration tank: To ensure the required hydraulic retention time (HRT), another plate was installed in the aeration tank.
• Oxygen transfer: It was observed that the MLSS (mixed liquor suspended solid) increase was slow. Presumed reason was poor balance for providing oxygen to MLSS. In order to maintain required dissolved oxygen level everywhere in the aeration tank, two new branch pipes were connected to air supply pipe, each branch pipe are capable of providing to two diffusers. Branch pipes were supplying air to four diffusers at the same time before the optimization work.
• Power supply: To prevent operation stoppage, one generator was installed in this plant.
(5) Regular Operation and Samplings
The regular operation of the units was started in late October 2000, and continued until January 2001. The following water quality parameters are monitored during the operation of the units.
The Study on Sanitation Improvement Plan for Haiphong City, Vietnam
Final Report, Supporting Report Part B
B - 8
Sampling Points, Frequency and Items
Sampling Point Inlet and Outlet Sampling Frequency 20 times(approx. 2 times/week) Items Temperature, BOD5, COD, SS, NH4-N, NO2-N,
NO3-N, T-N, T-P, DO, pH
In addition to this monitoring, daily monitoring of several parameters (pH, DO, COD, transparency) has been carried out by SADCO.
(6) Assessment of Performance
Figure below shows the BOD5 concentrations of influent and effluent to/from the activated sludge unit.
Removal of BOD5 by Activated Sludge Unit (Oct.-Dec., 2000)
Initially, the system was not stable, and the efficiency of the system was low (50 – 60 % for BOD5 removal). However, as the unit was optimized, and the system became stable, it was demonstrated that nearly 80 – 90 % removal of BOD5 load could be achieved constantly. Table below summarizes the recent results from the measurements in December, 2000 (5 samples).
0
100
200
300
21-O
ct
31-O
ct
10-N
ov
20-N
ov
30-N
ov
10-D
ec
20-D
ec
30-D
ec
Date
BO
D5
(mg/
l)
InfluentEffluent
The Study on Sanitation Improvement Plan for Haiphong City, Vietnam
Final Report, Supporting Report Part B
B - 9
Average Performance of Activated Sludge Unit in December 2000 (preliminary)
Standard* mg/L 50 100 100 60 6 * : Discharge Standard TCVN5945-1995 (column B)
The effluent from the unit satisfied the Discharge Standard (TCVN 5945-1995) for BOD, COD and SS.
Complete water quality data is provided in Data Book.
(7) Construction and Operation Cost
The procurement cost of the ASP was 59,545 US$. The installation and test operation cost for ASP was 37,000 US$. The regular operation and evaluation cost for ASP was 16,610 US$.
B.4 Technology Transfer
(1) On the Job Technology Transfer
Under the supervision of the JICA Study Team, SADCO participated in the operation of the contact purification unit and the activated sludge plant. This provided SADCO with unique and invaluable opportunities to learn how to:
• operate and maintain water purification systems • optimize system performance • trouble-shoot real problems •
(2) Plant Handover
After successful demonstration, both the Pilot Plant is handed over to Project management Unit (PMU) with the approval of JICA Head Office. PMU decided to donate the plants to Haiphong Private University’s Department of Environmental Engineering. This will give the students a valuable opportunity to learn the system mechanism and operation technique. This will also provide access to such process by all relevant agencies in Haiphong, namely, SADCO and DOSTE. Moreover, it will promote environmental awareness among the general public of Haiphong.
An operation manual is also prepared by the Study Team and handed over to PMU. This include process description, operation procedure, trouble shooting and suggested remedial methods. This will ensure smooth operation of the plants in future.
The Study on Sanitation Improvement Plan for Haiphong City, Vietnam
Final Report, Supporting Report Part B
B - 13
Figure B.3 Picture of theContact Purification Plant
The Study on Sanitation Improvement Plan for Haiphong City, Vietnam
Final Report, Supporting Report Part B
B - 15
Figure B.5 Picture of the Activated Sludge Plant
The Study on Sanitation Improvement Plan for Haiphong City, Vietnam
Final Report, Supporting Report Part C
C - 1
C. Environmental Impact Assessment
C.1 General Matters of Environmental Impact Assessment
C.1 1 Introduction
C.1.1.1 Objectives of the Study and Definitions of the Study Area
The objectives of the Study on Sanitation Improvement Plan for Haiphong City in the Socialist Republic of Vietnam comprises the following three main components:
1) To formulate sanitation improvement plan for Haiphong City (Sanitation Master Plan) on the water supply, drainage, sewerage and solid waste management system
2) To conduct feasibility study on the selected priority projects 3) To implement the Pilot Project for water purification, and 4) To transfer technology to the counterpart personnel in the course of the Study.
The original Study Area covered the four urban districts, Ngo Quyen, Hong Bang and Le Chan in the City center and Kien An, Do Son town, new development area and newly planned industrial areas comprising Quan Toan, Minh Duc and Dinh Vu.
However, during the project it was agreed to have some areas located outside of/and adjacent to the Study Area to be considered for the Sanitation Master Plan to secure continuity of sanitation improvement plan worked out for the Study Area, and to take into account the demand generation in the area into the facility plan to be worked out for the Study Area.
The Effective Study Area for the Study comprises the Study Area and Augmented Area as follows:
Population (1999) (persons)
Area (km2)
Study Area 554,591 152.3 Augmented Area 104,130 56.9 Effective Study Area Total 658,721 209.2 Haiphong City 1,677,465 1,507.7
C.1.1.2 Environmental Impact Assessment
This Environmental Impact Assessment (EIA) report is based on the three separate EIA surveys carried out by Vietnamese sub-contractors in November – December 2000. Their work included collection of existing environmental data, air, water and sediment quality surveys, socio-economic surveys, and preliminary assessment of environmental impacts.
Based on the collected data and information, detailed EIA was carried out by the Study Team. In general all priority projects have positive impacts on environmental health and living conditions of citizen by improving drainage, sewerage and solid waste management system in Haiphong.
The Study on Sanitation Improvement Plan for Haiphong City, Vietnam
Final Report, Supporting Report Part C
C - 2
This EIA report was prepared based on the following objectives.
• To describe the content of the project • To describe the existing environmental legislation and regulations • To describe baseline data and environmental status of the project areas • To compare project alternatives • To assess impacts on air, aquatic, terrestrial and human environment • To propose mitigation measures • To propose monitoring programs
This EIA report was based on:
• Collecting and analyzing background data • Updating data from previous EIAs and feasibility studies • Review of documents • Site visits • Sampling and analyzing air, noise, surface water, groundwater and sediment
samples from the project area • Conducting socio-economic surveys in the project areas • Determining impacts of the projects • Proposing mitigation measures and monitoring programs
C.1.2 Environmental Policies and Legislation
C.1.2.1 Vietnamese Environmental Law, Standards and Regulations
C.1.2.1.1 Environmental Management
The Ministry of Science, Technology and Environment (MOSTE) is the top decision-making body with overall responsibility within the environmental sector. MOSTE’s main role is to assist the Government in the strategies and policy-planning issues related to science, technology and environment. Besides the Ministry, there are several other agencies involved in the management and protection of the environment.
Within the Ministry, the National Environmental Agency (NEA) is the environmental arm, whose main task is to act as coordinating body for other Ministries with environmental responsibilities. It is also in charge of developing legislation and regulations, programs, control and monitoring systems to enforce the protection of the environment throughout the country.
Depending on the local People’s Committee, the local environmental authorities have an important role in environmental management and enforcement of regulations.
The Study on Sanitation Improvement Plan for Haiphong City, Vietnam
Final Report, Supporting Report Part C
C - 3
National Program on the Environment and Sustainable Development: Framework of Action was published in 1990 and approved by the chairman of the Council of Ministers in June 1992. The framework has seven action programs:
• Urban development and population control • Management of watershed forests • Management of coastal regions and river mouths • Protection of wetland • Maintenance of biodiversity • Creation and maintenance of reserves and national parks for wild animals and
plants • Pollution control and waste treatment
A large number of environmental protection laws and regulations have been passed and promulgated over the past few years. Some of the most important are listed as follows:
Vietnamese Environmental Laws and Regulations
Number and data of law Name of law Decree No.22/CP 22.5.1993 Tasks, Power and Organization of MOSTE 27.12.1993 Law on Environmental Protection issued according to the
order 29-L/CTN 10.1.1994 Decree 175/CP 18.10.1994 Guidance for implementation of the Law on Environmental
Protection Decree No.42/CP 16.7.1996 Issuing Regulation of Construction and Investment
Management Order No.199/TTg 3.4.1997 Measurements in Solid Waste Management in Town and
Industrial Areas Decision No.2920-QD/MTg 21.12.1996
Application of Vietnam Environmental Standards
Decree No.26/CP 26.4.1996 Regulation on Punishment for Administratively Violating Environmental Protection Legislation
Interministral Circular No 1485/TTLB 28.10.1994
A guidelines on organization, authority and scope of activities of the inspection of environmental protection
Circular No 490/1998/TT-BKNHCNMT 29.4.1998
Guidance on Setting up and Appraising the Environmental Impact Assessment Report for Investments Project
C.1.2.1.2 The Law on Environmental Protection
In Vietnam the basic national environmental policy is based on the Law on Organization of the Government (September 30, 1992), the Law on Environmental Protection (December 27, 1993) and the Decree No. 175/CP (October 18, 1994). The Law on Environmental Protection provides the basic framework for the environmental protection and management in Vietnam. The Law mandates the Central Government’s overall responsibility for environmental protection. In general, the Law on Environmental Protection stipulates:
• That polluting activities are strictly prohibited
The Study on Sanitation Improvement Plan for Haiphong City, Vietnam
Final Report, Supporting Report Part C
C - 4
• That environmental impact assessment of new projects and existing facilities are required
• That the introduction of new technologies or alien species is controlled • That the government may demand financial contributions for those causing
damage to the environment • Inspection procedures to ensure compliance with the Law • Procedures for dealing with environmental accidents
The general provisions of the law are described in Chapter 1, which defines the meaning of the term. Article 2 defines waste, pollutants and environmental pollution as follows:
“Wastes mean substances discharged from daily life, production processes or other activities. Wastes may be in a solid, gaseous, liquid or other forms. Pollutants mean factors that render the environment noxious. Environmental pollution means alteration in the properties of the environment, violating environmental standards.”
C.1.2.1.3 Laws and Regulations on Environmental Impact Assessment
According to the Law on Environmental Protection, Article 18:
Organizations, individuals when constructing, renovating production areas, population centers or economic, scientific, technical, health, cultural, social, security and defense facilities, owners of foreign investment or joint venture projects, and owners of other socio-economic development projects, must submit EIA reports to the State Management Agency for environmental protection for appraisal. The result of the appraisal of EIA reports shall constitute one of the bases for competent authorities to approve the projects or authorize their implementation. The Government shall stipulate in detail the formats for the preparation and appraisal of EIA reports and shall issue specific regulations with regard to special security and defense establishments mentioned in Article 17 and in this article. The National Assembly shall consider and make decision on projects with major environmental impacts. A schedule of such types of projects shall be determined by the Standing Committee of the National Assembly.
In October 18, 1994, the Government of Vietnam issued a decree providing Guidance for the Implementation of the Law on Environmental Protection, which includes assessment of environmental impacts. This decree, together with other documents needed for an EIA, was published in 1995 by MOSTE as a separate guideline document.
Guidance for Environmental Impact Assessment for Technical-Economic Projects was proposed by MOSTE in September 1993 (No 1485/Mtg). Considering this statement, and an Instruction No 73/Ttg signed by the Prime Minister on December 27, 1993, Haiphong People’s Committee has promulgated Instructions on Environmental Impact Assessment of Technical-Economic Projects No 49 CT/UB.
The Study on Sanitation Improvement Plan for Haiphong City, Vietnam
Final Report, Supporting Report Part C
C - 5
C.1.2.1.4 Approval Procedure of EIA
The Ministry of Science, Technology and Environment is the responsible authority of the approval of Environmental Impact Assessments. The EIA can, however, be appraised by the local DOSTE and further be delivered to HPPC for approval. The EIA-appraisal Council of DOSTE consists of the Chairman, Vice Chairman and Secretary (Director, Deputy Director and Director of Environmental Department of DOSTE) and 6 experts from different departments, depending on the project.
The EIA of this project will be appraised by the Council as a category: New project, and further submitted to MOSTE for approval. The period of time for appraising an EIA report can not be longer than two months from the date all related documents are received. If the local DOSTE approves the EIA, there will not be any additional two months approval time for MOSTE. The EIA will be, in general, approved in the next appraisal meeting of the council of MOSTE.
C.1.2.2 Vietnamese Environmental Standards and Regulations
The Government shall stipulate the nomenclature of environmental standards and delegate the authority at different levels for promulgating and supervising the implementation of such standards.
MOSTE has published 1995 Vietnamese Environmental Standards, and standardization work is in progress. In cases, where the applicable Vietnamese standard is inadequate, not regulated or applicable, project agencies must obtain MOSTE’s approval for the use of equivalent standards of the countries that have provided the technology and equipment to Vietnam, or apply equivalent standard from a third country. At least the following environmental standards are related to wastewater discharge and use of sludge as fertilizer.
Vietnamese environmental standards (MOSTE 1995)
Number of standard Name of Standard TCVN 5298 - 1995 Requirements to the use of wastewater and their sludge for
watering and fertilizing purpose TCVN 5524 - 1995 General requirements for protecting surface water against pollution TCVN 5525 - 1995 General requirements for protection of underground water TCVN 5942 - 1995 Surface water quality standard TCVN 5943 - 1995 Coastal water quality standard TCVN 5944 - 1995 Groundwater quality standard TCVN 5945 - 1995 Industrial wastewater discharge standards TCVN 5993 - 1995 Guidance on the preservation and handling of samples (ISO
5667-3:1985) TCVN 5994 - 1995 Guidance on sampling from natural lakes and man-made lakes
(ISO 5667-4:1987) TCVN 5996 - 1995 Guidance on sampling on rivers and streams (ISO 5667-6:1990) TCVN 5997 - 1995 Guidance on the sampling of wet deposition (ISO 5667-8:1993) TCVN 5998 - 1995 Guidance on sampling from marine waters (ISO 5667-9:1992) TCVN 5999 - 1995 Guidance on sampling of wastewater (ISO 567-10:1992) TCVN 6000 - 1995 Guidance on sampling of groundwater (ISO 5667-11:1992)
The Study on Sanitation Improvement Plan for Haiphong City, Vietnam
Final Report, Supporting Report Part C
C - 6
Water quality limits according to the Vietnamese standards (MOSTE 1995)
Besides water related standards there are several standards concerning air quality, noise and soil quality. TCVN 5302-1995 is the General Requirements for Soil Reclamation.
The standard TCVN 5298-1995 defines the requirements for use of wastewater and sludge for watering and fertilizing purposes. According to the requirements in the standard, the wastewater and sludge should not content any harmful and toxic matters and the sludge can only be used for fertilizing purposes after treatment of toxic matters. The wastewater and sludge should be tested before use and under control of environmental management authority. However, there are no required parameters and no maximum allowable concentrations for parameters in the standard.
The Study on Sanitation Improvement Plan for Haiphong City, Vietnam
Final Report, Supporting Report Part C
C - 7
Vietnamese Air Quality and Noise Standards (MOSTE 1995)
Number of standard Name of Standard TCVN 5937 - 1995 Air quality – Ambient air quality standards TCVN 5938 - 1995 Air quality – Maximum allowable concentrations of hazardous
substances in ambient air TCVN 5939 - 1995 Air quality – Industrial emission standards – Inorganic substances
and dusts TCVN 5940 - 1995 Air quality – Industrial emission standards – Organic substances TCVN 5970 - 1995 Air quality – Planning of ambient air quality monitoring (ISO/TR
4227:1989)
TCVN 5948 - 1995 Acoustics – Road and vehicle noise – Maximum permitted noise level
TCVN 5949 - 1995 Acoustics – Noise in pubic and residential areas – Maximum permitted noise level
TCVN 5964 - 1995 Description and measurement of environmental noise Part 1: Basic quantities and procedures (ISO 1996/1:1982)
TCVN 5965 – 1995 Description And measurement of environmental noise – Part 3: Application to noise limits (ISO 1996/3:1987)
C.1.2.3 Japanese Environmental Guidelines
Environmental Consideration Guideline for Development Studies (JICA, 1994), OECF Environmental Guidelines (2nd Version) (OECF, 1995), Guide to Preparing an Environmental Impact Assessment (OECF, 1996) and JBIC Environmental Guidelines for ODA Loans (JBIC, 1999) have been followed in the preparation of Environmental Impact Assessment of the project.
The guidelines give guiding principles related to environmental consideration by JICA and JBIC in its appraisal of a project. They also give the environmental matters to be considered and environmental measures to be prepared by the recipient country in the planning and preparation stages of a project.
Basic rules for environmental consideration are as follows: A project is to comply with regulations stipulated in the laws and standards of the recipient country relating to the environment. Monitoring and evaluation of project related environmental issues should be carried out. In the planning and implementation of a project, there is to be adequate consideration for people who will be relocated and resettled involuntary and/or lose a major source of income because of the project. The cost of mitigation measures to conserve the environment, including social environment, is to be included in the project cost.
The Study on Sanitation Improvement Plan for Haiphong City, Vietnam
Final Report, Supporting Report Part C
C - 8
C.1.3 Vietnamese Laws for Land Use and Resettlement Procedures
C.1.3.1 Legal framework
C.1.3.1.1 Relevant Legal Vietnamese Documents • The Land Law No. 24/L/CTN issued 14 July 1993 by the National Assembly of
the Socialist Republic of Vietnam • Decree 87/CP issued 17 August 1998 by the GOV to set the price ranges for
categories of land • Decree 22/CP issued 24 April 1998 of GOV to provide guideline for
compensation for appropriation of land for defense, security, national and public interests
• Decree 60/CP issued 5 July 1994 of GOV regulating the property ownership and the right to use urban residential land
• Decree 64/CP issued 15 September 1995 of the GOV regulating the allocation of agricultural land to households and individual for long-term use for agricultural production
• Decree 61/CP issued 5 July 1994 of GOV regulating dwelling house purchase, sale and business
C.1.3.1.2 Actions Required by GOV to Enable Compensation, Resettlement and Rehabilitation to be Implemented according the Resettlement Action Plan Policies
To comply with the RAP policy and to ensure that the proposed entitlements are not in conflict with the Vietnamese regulations, special decisions regarding eligibility to compensation and unit prices of compensation have been identified as necessary.
(1) Eligibility to Compensation - Decree 22/CP
Article 7 stipulates that the person whose land is recovered and who has not one of the conditions stipulated in Article 6 of this decree or who has violated the plan already ratified by the competent level and such violation has been announced, or who illegally occupied land shall not receive compensation when the State recover the land. In case of necessity, the People’s Committee of the province or city under the Central Government shall consider and decide on the case.
Waiver of to ensure that the objective of this RAP are met, a special decision of the Government regarding waiver of Article 7 is needed to permit assistance and rehabilitation measures for illegal users of land as proposed in this RAP.
(2) Price of Land for Calculation of Compensation -Decree 87/CP and 22/CP
Article 4 of Decree 87/CP states that compensation prices for land must be within the Government’s range of minimum and maximum price.
The Study on Sanitation Improvement Plan for Haiphong City, Vietnam
Final Report, Supporting Report Part C
C - 9
Article 8 of Decree 22/CP stipulates that the price of land for calculation of losses will be decided on the basis of the local current price multiplied by the coefficient k in order to ensure compatibility of the compensation with the profitability and the price of assignment of the land use right in the locality. The Ministry of Finance should guide the methods of determining the coefficient k after consulting with the Ministry of Construction, the Ministry of Agricultural and Rural Development, the General Land Administration and Government Price Committee. The price of land for calculation of compensation shall be decided by the Chairman of the People’s Committee of the province or city under Central Government for each project at the proposal of the Finance-Pricing Service with the participation of the related branches.
However, the provisions of 87/CP and 22/CP decree do not ensure compensation and replacement cost, a special decision by the GOV regarding waiver of Article 4 of 87/CP and Article 8 of Decree 22/CP would be required. This is to ensure that the objectives of this RAP are met. Unit prices for land will be established ensuring compensation at market value.
The Prime Minister of Vietnam in approving the policies and objectives set forth in this RAP has granted the waiver to the above mentioned Article 4 of 87/CP and Article 7 and 8 of 22/CP.
C.1.3.2 Objectives and Principle of the Resettlement Plan
The main objective of the RAP is to ensure punctual land acquisition for project implementation, to minimize possible adverse impacts of involuntary resettlement and to provide a frame work for policies, entitlement and implementation of the project facilitating Project Affected People (PAP) efforts to improve their living standards, income earning capacity and production levels, or at least restore them to the pre-project level.
C.1.3.3 Implementation Organization
The Hai Phong People’s Committee (HPPC) is the principal authority at each level of Government (province, city, district, and commune). The implementation of all regulation is under their responsibility within their respective territory.
The HPPC will be responsible for:
• Establishing a resettlement committee • Issuing the land and structure compensation price units • Approving the compensation amount • Providing instructions to identify legal and illegal PAP and other instruction
necessary for implementation • Allocating the land necessary for the project
The Study on Sanitation Improvement Plan for Haiphong City, Vietnam
Final Report, Supporting Report Part C
C - 10
• Assigning tasks to each district within territory
The People’s Committee of Haiphong shall direct the establishment of a Resettlement Committee (or a Council of Compensation for damage in ground clearing) as provided for Decree 22/1998/ND-CP in Chapter VI. The Resettlement Committee shall be presided over by the Chairman or Vice Chairman of the People Committee of the City. The other members comprises at least a standing representative from PIO, the People’s Committee at the district or ward level, Services of Urban Public Works, Land Administration, Finance, Construction and Department of Planning and Investment, and representatives of the project affected people (PAP).
The Resettlement Committee will be responsible for the following tasks:
• Planing and implementing land acquisition activities according to RAP • Establishing the compensation rates and presenting them to the People’s
Committee for approval • Public consultation and information dissemination to the affected people and
general public about the project • Reporting on the land acquisition process to the City People’s Committee and
the financier of the project
Project Implementing Organization (PIO) has the following responsibilities:
• Coordination with the district Resettlement Committee and overall responsibility for implementation of RAP including all necessary detailed measurement survey
• Compensation assessment and payment • Provision of required funds to implement RAP in a timely manner • Rehabilitation planning and implementation • Public information, consultancy and grievance redress • Internal monitoring and evaluation of RAP implementation
External monitoring agency is an agency specialized in social science will be contracted by PIO to carry out external monitoring and evaluation. They will submit periodic report on the progress and impacts of the RAP implementation and make recommendation regarding the issues, if any, which need to be addressed.
C.1.3.4 Information Campaigns and Public Hearings
C.1.3.4.1 Objectives of the Information Campaign and Consultation
Information dissemination, consultation and participation of PAP and involved agencies are needed to:
• Reduce the potential for conflicts
The Study on Sanitation Improvement Plan for Haiphong City, Vietnam
Final Report, Supporting Report Part C
C - 11
• Minimize the risk of project delays • Enable the project to design the resettlement and rehabilitation programs as a
comprehensive development programs to fit the need and priorities of the affected people, thereby maximizing the economic and social benefit of project investment
The objective of the project Public Information Campaign and PAP consultation program are as follows:
• To share fully information about the proposed project, it’s component and its activities with the PAP.
• To obtain information about the needs and priorities of the PAP, as well as information about the reactions to proposed policies and activities.
• To attain the cooperation and participation of the PAP and communities in activities required to be taken for resettlement planning and implementation.
• To ensure transparency in all activities related to land acquisition, resettlement and implementation.
There are two phases to the public information campaign and PAP.
Phase I : During resettlement planning and RAP preparation activities
This phase will consist of land demarcation and Detailed Measurement Survey (DMS) of affected assets, consultation with and information dissemination to the PAP on the objectives of the project and likely impact, resettlement policies and procedures, implementation schedule, and available options for affected land.
Phase II : During the implementation of resettlement and rehabilitation activities
This phase will consist of continued information dissemination and consultation regarding: resettlement policies and procedures, calculation and payment of compensation, clearance from the project area, and civil work.
C.1.3.4.2 Information Campaign and PAP & Agency Consultation During RAP Preparation
During the phase of detailed resettlement planning and RAP preparation, the following the activities will be carried out sequentially.
Activity 1: Media Campaign Prior to the Survey
Information to the general public in the project area will be given by the public notice. The contents of the media campaign include the following items: a description of project components, the contents and schedule for the survey, and a request for PAP to prepare their eligibility document to show to the survey team.
Activity 2: Verbal Information, Dissemination to and Consultation with PAP
The Study on Sanitation Improvement Plan for Haiphong City, Vietnam
Final Report, Supporting Report Part C
C - 12
During the DMS each PAP will be informed about the compensation policy and entitlements, resettlement options and consulted about preliminary preferences according to their eligibility.
Activity 3: Information, Dissemination to and Consultation with Local Authorities during RAP Preparation
PIO will consult the People's committee regarding the following: (i) project components, (ii) proposed policies and procedures, (iii) implementation schedule, (iv) roles and responsibilities of the responsible committee and agencies, and (v) options for compensation for land.
C.1.3.4.3 Information Campaign and Consultation during RAP Implementation
Activity 1: Public meeting
Immediately after the RAP is approved by the GOV, all PAP and interested general public will be invited to attend a public meeting at which the following information will be given.
• Project components - plans for rehabilitation of the existing combined sewer network and drainage channels and regulations lake
• The needs for land and project impacts • The agreed RAP policy and PAP, rights and entitlement, including the rights to
lodge a complaint • The institutional arrangement for the implementation of the RAP, including
grievance procedures • The implementation schedule
Activity 2: Information Distributed direct to each Household Following Pricing Application
After the unit prices have been established, the Resettlement Committee will apply unit prices to affected assets, calculate compensation entitlement and complete the Assets Compensation Form for each affected household. Each household will be provided with a copy of the Assets Compensation Form showing the household's affected assets and compensation entitlement. PAP will be required to sign the Assets Compensation Form to indicate their agreement with the assessment. Any complaints will be recorded at this time.
C.1.3.5 Grievance Procedure
In order to ensure that PAP have avenues for redressing their grievances related to any aspect of land acquisition and resettlement, detailed procedures for redress of grievances have been established for the Project.
The Study on Sanitation Improvement Plan for Haiphong City, Vietnam
Final Report, Supporting Report Part C
C - 13
Contents of the grievances lodged by an affected person can relate to aspects of the land acquisition and resettlement program including the compensation rates being offered for their losses. Records of all grievance and option statements will be maintained by PIO.
PAP will be exempt from all administrative and legal fees. The detailed procedure for the redressal of the grievances and the appeals process will be widely published among the PAP.
C.1.3.6 Monitoring
C.1.3.6.1 Internal monitoring
PIO will be responsible for conducting regular internal monitoring of the implementation of RAP.
The main indicators that will be monitored regularly are:
• Compensation assessment and accuracy • Payment of compensation to the affected people in the various categories
according to the level of compensation. • Public information and public consultation • Grievance procedures • Provision of subsistence and rehabilitation allowances. • Provision of training to PAP • Job creation • The linkage of resettlement and commencement of civil works
The project management unit of PIO and a member of the Resettlement Committee will be responsible for internal monitoring activities. They will collect information on a regular basic, and maintain a database of resettlement monitoring information, which will be successively updated every 3 months.
C.1.3.6.2 External monitoring
An agency specialized in social sciences will be responsible for conducting independent external monitoring and evaluation of RAP implementation and affects. The monitoring reports are to be conducted and submitted every 3 months. This agency will be called the Monitoring Organization (MO).
In addition to verifying the information furnished in the internal supervision and monitoring reports of PIO, MO will visit a sample of 2% of household PAP on an annual basic to:
The Study on Sanitation Improvement Plan for Haiphong City, Vietnam
Final Report, Supporting Report Part C
C - 14
• Determine whether the prescheduled for PAP participation and delivery of compensation and other rehabilitation entitlement have been carried out in accordance with RAP.
• Assess if the objective of the RAP of enhancement or at least restoration of living standards, income earning capacity and production level have been met.
• Gather qualitative indication of the social and economic impact of project implementation on the PAPs.
• Suggest modification in the implementation procedures of RAP, as required, to achieve the RAP principles and objectives.
(1) Monitoring Indicators
The following indicators will be monitored and evaluated. Indicator Activity Payment of compensation
(i) Payment of compensation to be made to all affected person sufficiently before acquisition of land, structures and other assets and sufficiently before temporary possession of assets; (ii) adequacy of the method for determining valuation and compensation for land (arable, residential and commercial), crops and trees, public facilities, structures and other assets; (ii) adequacy of payment to replace the affected assets, including compensation for temporary damages and losses; and (iv) compensation for affected structures should be equivalent to the replacement cost of material and labor based on standards and special features of construction and no deduction should be made for depreciation or value of salvageable material.
Linkage of resettlement and construction
Resettlement activities, with the exception of PAP training, should be completed at least one month before the start of physical works.
Provision of jobs Person who are entitled to job placement should be ensured to be provided jobs.
Provision of training to PAP
Person who are entitled to training in a current or new occupation or skill will be provided training for a maximum period of 6 months in a qualified training institution.
Restoration of economic activities
Affected persons should be monitored for restoration income earning capacity and production levels.
Public consultation Affected persons should be informed and consulted about RAP policies and procedures.
Level of satisfaction
The level of satisfaction of affected person with various aspects of RAP will be monitored and recorded. The operation of the mechanisms of grievances redress and the speed of redress of the grievance will be monitored.
Standards of living Throughout the implementation process, the trends in living standards will be observed and the potential problems in the restoration of living standard will be identified and reported.
(2) Monitoring Methodology
The first responsibility of Monitoring Agency will be to determine will adequacy of compensation rates.
The Study on Sanitation Improvement Plan for Haiphong City, Vietnam
Final Report, Supporting Report Part C
C - 15
Monitoring during RAP implementation will be carried out according to the indicators mentioned above. Monitoring information will be obtained from (a) PIO and Resettlement Committee, (b) local People's Committees, and (c) PAP.
To verify to quantitative aspect of implementation, sample surveys of various types of impact will be conducted based on internal monitoring reports submitted by PIO. A stratified sample will be taken of 20 % of the PAP every 6 months.
• Data and information will be gathered by • Questionnaires, to be personally administered • Direct interviews with affected households • Specific focus group interviews aimed at identifying the specific problem issues
related to groups such as farmers, women heads of households, etc. • Community Meetings where problems are discussed and solutions identified
(3) Reporting
A Monitoring Report of Resettlement should prepared and submitted to PIO by the last day of every quarter. The Report should contain: (i) a report of progress of RAP implementation; (ii) deviations, if any, from the provisions and principles of the RAP; (iii) identification of problem issues and recommended solutions, so that’s PIO is informed about the ongoing situation, and can resolve problem in a timely manner; and (iv) report on the follow - up of problem and issues identified in the previous report.
The Follow-up Monitoring Reports will be discussed during a meeting between MO and PIO held immediately after the submission of the report. Necessary follow - up activities will be taken based on the problems and issues identified during reports and follow - up discussions.
C.1.3.7 Costs and Budget
PIO will disburse land acquisition and resettlement funds directly to the PAPs for compensation or to the HPPC for land acquisition.
The rates of compensation and cash entitlements for rehabilitation and allowances payable to the PAP will be adjusted annually on April 1, based on the actual annual inflation rate. PIO together with various agencies will determine the annual inflation rate and ensure the necessary annual adjustments are made to compensation rates and to all cash entitlements.
Implementation costs include costs already made for land demarcation and survey, costs of payment (salaries, per diem) for resettlement committees and for monitoring costs.
Unit prices for cost estimates of structures losses have been established according to HPPC housing classification and construction prices. The rates are adjusted based on the current market rates and reflect replacement cost.
The Study on Sanitation Improvement Plan for Haiphong City, Vietnam
Final Report, Supporting Report Part C
C - 16
C.1.3.8 Implementation Schedule
RAP preparation and implementation require the participation of various institutions and agencies. The more involvement the more time is needed for reaching an agreement. The issues to be dealt with are also of conflicting interest.
Therefore, careful and punctual preparation for implementation of RAP is as important as preparation of the actual plan. PIO, who bears the responsibility for the implementation of RAP, should start preparation for the task as soon as possible. Even when detailed designs are not yet available a lot of preparation can be done. Setting up of a Resettlement Committee training of the Committee, establishment of unit prices, planing for the public information campaign etc, are examples of the tasks that could already be commenced now to ensure the success of RAP.
Establishment of the Resettlement Committee
After receiving instructions from the Prime Minister to begin implementing the RAP, the HPPC will establish the Resettlement Committee and confirm the roles and responsibility of the Committee.
Training of the Resettlement Committee
After the Resettlement Committee is established, the members will be trained by PIO regarding by RAP policies and implementation procedures.
Establishment of Detailed Compensation Rates
The rates of affected land, structures, and other fixed assets determined for estimation of resettlement costs will be up dated at the time of acquisition of assets to reflect prevailing market rates. Rates establish for affected structures will be based on ' affected' area and at replacement cost without depreciation and without deduction for salvageable materials. Rates for structures will be calculated for affected area.
Launching of information programs
The compensation Committee will launch regular information programs for affected people and residents in the project area about the project. This program should be start right after the project is approved.
Compensation and entitlement for PAP
After the prices rate as made, the Compensation Committee will apply price rates for each type of losses incurred by affected people. Then compensation calculation should be carried out, form of compensation should also be finished for each affected person.
Rearrangement of existing assets and site clearance
Destruction and rebuild of structures and clearing of ponds, lakes must be finished one month before the project implementation.
The relation between resettlement and implementation progress
To ensure that all PAP are arranged before construction, land clearance and resettlement must be finished one month before construction of project component including: Compensation for land acquisition, houses, other structures and assets including trees; resettlement of all PAP and trees and crop clearance
Monitoring of resettlement
Internal monitoring activities and reporting will be carried out right after the commencement of resettlement plan according to the designed outline. Contracts will be made with external supervisors to determine the cost estimation according to replacement price and to carry out monitoring, reporting according to the set outlines.
The Study on Sanitation Improvement Plan for Haiphong City, Vietnam
Final Report, Supporting Report Part C
C - 17
The progress of the RAP procedures will be shown in table below.
Implementation Procedures and Schedule of Resettlement Action Plan
Feasibility Study Financial arrangements Approval of the Project Detailed designs Implementation Land acquisition and resettlement
Detailed measurement survey Preparation of Final Resettlement Action Plan
Approval of RAP Establishment of Resettlement Committee
Training of Resettlement Committee
Preparation of compensation unit prices
Public information campaigns Compensations for PAPs Land acquisition and site clearance
Monitoring
The Study on Sanitation Improvement Plan for Haiphong City, Vietnam
Final Report, Supporting Report Part C
C - 18
C.1. 4 Baseline Data in Study Area
C.1.4.1 Climate
The climate of Hai Phong City is dominated by the monsoons with two clear seasons: the rainy season coincide with the hot season (from March to October), and the dry season coincide with cold season (from November to March).
The annual average temperature is about 23o. The average temperature in winter is 190C, in summer 260C. The coldest month is January (> 110C) and the hottest month is July (280C). The monthly changes in temperature are shown in table below.
Temperature (°C) in Hai Phong City Month 1 2 3 4 5 6 7 8 9 10 11 12
T min 6.0 5.2 6.1 12.0 16.8 20.9 21.8 21.8 15.6 13.5 9.3 4.9 T max 30.4 31.3 35.0 35.5 38.7 37.5 37.3 36.5 35.1 33.7 33.1 28.6
Tmin: minimum temperature (0C) Tmax: maximum temperature (0C) TAverage: average temperature (0C) Source: Phu Lien meteorological station in 1957-1997
The annual average precipitation varies between 1,100 – 1,850 mm, mean being 1754 mm. The rainfall concentrates from May to September, accounting for 77% of the total rainfall in the year. During rainy season maximum rainfall can reach 100 mm/day, while in other months it is only 10-15 mm/day. The highest average rainfall is in August and the lowest average rainfall is in December.
Monthly Precipitation (mm) in Hai Phong City
Month 1 2 3 4 5 6 7 8 9 10 11 12
R max 68.0 37.3 53.6 184 184 167 224 362 182 343 149 35.2
R n 8.9 14.3 18.0 13.9 12.2 14.7 13.8 16.6 13.0 10.2 6.0 4.6 Rmax: Average highest rainfall of month Raverage: Average monthly rainfall Rn: Average number of rainy day Source: Phu Lien meteorological station in 1957-1997
The annual average evaporation is 698 mm, representing 40% - 45% of the total annual precipitation. In the dry season (especially from February to April), evaporation rate accounts for only 15% of the total annual evaporation. The highest evaporation is 33% from September to November. The humidity in Hai Phong is quite high, the average humidity being 85% and it’s at its highest in February-April.
Source: Phu Lien meteorological station in 1957-1997
The Study on Sanitation Improvement Plan for Haiphong City, Vietnam
Final Report, Supporting Report Part C
C - 19
Monthly Average Humidity (%)
Month 1 2 3 4 5 6 7 8 9 10 11 12 Year Ave.
Humidity 84 88 91 90 87 86 86 88 85 81 77 77 85
Source: Phu Lien meteorological station in 1957-1997
Solar radiation is minimum (the figure is 220 cal/cm2/day) at the end of winter and reaches the maximum value (the figure is 451 cal/cm2/day) in the summer.
Data of total solar radiation value (cal/cm2/day) in 1999
There are 1676 illuminate hours/year, it means average 4.4 hours/day. In the summer from May to October, this figure is considerable higher, about 6.3 hours/ day. In the winter the illuminate hours is much lower, about 1.4 – 2.8 hours per day.
The wind velocity varies between 2.3m/s - 3.1m/s, averaging 2.6m/s. The average maximum wind velocity are in the south-east monsoon period 20 – 24 m/s and in other months 10 – 16m/s. Typhoons originated outside the region, but have great importance on the coastal area. Several typhoons with a wind velocity of over 40m/s have occurred. In 1992-1994, wind velocity varies from 0 to 30m/s with average wind velocity of 6.0m/s.
There are two main wind directions in the project, north-eastern wind in winter and south-east in summer. The measured wind directions in 1992-1994 are mainly north-west and north-east in October-February and south and south-east in February-October.
Dominant Wind Direction and Mean Velocity in 1992-1994
Source: Phu Lien meteorological station in 1957-1997 period
C.1.4.2 Hydrography
C.1.4.2.1 Major Hydrological Network in the City Area
The Bac Bo plain, the Red River delta, has a dense network of rivers.The main rivers in the Haiphong area are the Da Bach river (the Bach Dang river), the Kinh Thay river (the Cam river), the Lach Tray river, the Van Uc river and the Thai Binh river. Besides these main rivers, there are several small rivers like An Kim Hai system, (also called the Sai river, the Re river and the Tam Bac river) and the Da Do river. These two are the raw water sources to water treatment plants, and are separated with tidal gates from other river systems. Therefore the changes in water level and impact of tide on these rivers are very limited.
The Study on Sanitation Improvement Plan for Haiphong City, Vietnam
Final Report, Supporting Report Part C
C - 20
Hydrologically the rivers are not independent. A large number of channels for irrigation and drainage and new connections between rivers have been built during centuries. Thus the main rivers have several mutual connections, both natural and man-made, making the whole concept of a catchment an ill-defined one. Due to the numerous interconnections between the rivers, it is impossible to define a basin area for most of rivers. The total drainage area can be estimated to be 17,000 km2.
Characteristic to Bac Bo plain rivers is low gradient, which is on average 2 to 5 cm/km. This and wide riverbeds lead to low flow velocities in the rivers. The water levels vary strongly in the main rivers due to the morphological parameters of the river reach and do not directly correspond to the flow regime. In dry periods typical monthly level variations are less than one meter. During flood peaks water level rises at some sites by only 1 to 2 meters, while at some sites the increase can be up to 6 to 8 meters.
The mean specific flow in upper Thai Binh river system is over 20 l/s/km2. It decreases downstream, both due to lower precipitation and due to water intake for irrigation. Over 80 % of the flow occurs in June – September, only 5 % in December – March.
During the highest floods, the maximum specific flow exceeds 1,000 l/s/km2 at the headwater stations, in the main streams it is smaller. The high flow usually occurs in July or August, but it may occur in any month from May to October. The minimum specific flows vary considerably from station to station. At some stations the minimum flow is below 1 l/s/km2, while at the others the extreme flows are over 2
l/s/km2. This variation is partly due to water use for irrigation and other purposes. The time of minimum flow is also variable: it usually occurs in January – April. But even some rainy season occurrences have been observed.
C.1.4.2.2 Tide Regime
Tide is the main cause of water changes in river around Haiphong City. It also affects the hydrological condition, water quality and water discharge at tidal gates. The tide in Red River Delta penetrates 180m deep to the mainland. The highest tide amplitudes observed in three observing stations are presented in table below.
The distribution of the flow rate in the year is uneven. The year is divided into two seasons: the flood season and low water season. The flood season usually lasts 4 months, from June to September. The flood flow is high, can account for 85 % of the total flow in the year. The low water season lasts from October to May next year.
The Lach Tray River, like other rivers in Haiphong, is affected by diurnal tide regime, the rising time and falling time of the tide are approximately equal. In average a tide cycle is 14 - 15 days. The tidal regimes within a tide cycle are different and a tide cycle can be divided into three stages:
The Study on Sanitation Improvement Plan for Haiphong City, Vietnam
Final Report, Supporting Report Part C
C - 21
Maximum Amplitude (cm) Measured in Three Sea Monitoring Stations
Source: Hon Dau monitoring station- North-eastern Meteorological Station, Meteorological Bureau, 1998.
1. The low tide stage: usually covers the first and last 2 - 3 days of the tide cycle, with small tide amplitude, about 50 cm.
2. The medium tide stage: from the fourth day to the seventh day of the tide cycle. 3. The high tide stage: From the eighth to the twelfth day of the tide cycle. The tide
amplitude is rather large, may reach 3 m.
The high tide has no clear seasonal fluctuation, although it occurs mainly in June - July or December - January. Its main influence is the change of tide level and salinity. The flow velocity at the upstream (18 km/h in the Red River) is higher than at the downstream (10 km/h in the Red River). At the high tide level, the saline water intrudes up to the upstream of rivers. However, the distance of this intrusion is very much less than the maximum distance of tide fluctuation. The time when occur ebbs and flows also vary. In the year, ebbs and flows may occur at any time during the day.
• Diurnal tide fluctuation cycle: Most of the time, about 25 days in a month, occurs diurnal tide fluctuation. The tide cycles are equal, bout 24 h 24'. During this period there may be 2 ebbs and flows in a day, but this occurs maximum only 2 - 3 days a month.
• Semi-monthly cycle: High tide usually occurs during 2 - 3 days when the moon reaches the highest latitude in the North and the South. The water level change rapidly (may be at the rate of 0.5 m/h).
• Low tide usually occurs during 2 - 3 days when moon passes across the equator plane. The water level fluctuation is inconsiderable, sometime stands still.
• Seasonal cycle: The tides also have semi-annual cycles. The highest tide occurs at the summer solstice (23 June) and winter solstice (23 December), whereas the lowest tide occurs at spring equinox and autumn equinox (21 March and 21 September respectively).
• Long term cycle: Among long-term tide cycle, only the 9-year cycle has considerable impacts on the characteristic of the tide.
The Study on Sanitation Improvement Plan for Haiphong City, Vietnam
Final Report, Supporting Report Part C
C - 22
• Influence of tides: Tides influence on the hydro-environmental characteristics and water quality of the lower part of all rivers in the study area. The two main impacts are the tide current and salt water intrusion.
• Tide current: Tidal movements of the rivers in the area are different. • In the Red river the rising tide current velocity is 18 km/h and the falling tide
current velocity is 10 km/h. • In the Thai Binh river the rising tidal current velocity is 12 - 15 km/s.
C.1.4.3 Geotechnical and Hydrogeological Characteristics
C.1.4.3.1 Geotechnical Characteristics
The major part of Haiphong City is occupied by Quaternary sediment with the depth varies between 40-60m. To assess the foundation for construction work, the most important point is the surface structure. Except the mountainous area of Kien An, the remaining land is alluvium land. Borehole investigation shows that sediment layers are arranged similar from the top to the bottom as the following:
• Clay layers on the surface with the average depth of 0.4 -2.0m, which can bear the load intensify from 1-1.2 kg/cm2
• The following layers consist of organic silts, sand land to be arranged disorderly with the average depth of 5-20.00mm. The load intensify is 0.5kg/cm2
• The next layer is organic silts with the depth from 3-22m and load intensify from 0.3-0.70kg/cm2
• The clay layer with the depth from 2-26m load intensify from 0.5-0.70kg/cm2. • The last is thin layer turning to stones layer with depth 8-30.0 • Except the mountainous land of Kien An, the land is not so good for the
foundation such as mud-sandy land, clay-land • The clay layer with can bear the load intensify of over 1kg/cm2 to be allocated
deeply
The study area can be divided into the following zones:
1. Zone with good geological condition: R = 1 - 2 kg/cm2, but with slope > 30 % 2. Zone with good geological condition: R = 1 - 2 kg/cm2 3. Zone with moderate geological condition: R = 0.7 - 0.8 kg/cm2 4. Zone with poor geological condition: R = 0.4 - 0.5 kg/cm2, but the silty clay
layer is at shallow depth, requiring simple foundation engineering 5. Zone with very poor geological condition: R = 0.2 - 0.4 kg/cm2 and the silty
clay is at great depth, > 10 m
C.1.4.3.2 Hydrogeological Characteristics
According to the results of hydrogeological investigations of various research organizations, in the project area there are two water bearing units which may be subject to the direct impacts of the project: The porous aquifer in the Holocene
The Study on Sanitation Improvement Plan for Haiphong City, Vietnam
Final Report, Supporting Report Part C
C - 23
sediments (QIV1-2 hh1) and the aquifer in Middle - Upper Pleistocene sediments (QII-III)
• The porous aquifer in the Holocene sediments (QIV1-2 hh1) has a thickness varying between 5 - 10 m. The discharge of wells reach 1 l/s, with specific capacity 0.16 l/sm. Water quality of the most of dug wells is brackish water.
• The aquifer in Middle - Upper Pleistocene sediments (QII-III) in the project area occurs at the depth of 40 - 65 m, with a thickness varying from 20 to 25 m, increasing in the direction from North to South. In lithologic composition it is mainly composed of sand, cobbles, gravel (the recharge source of the groundwater are mainly rain water and surface water from the Lach Tray river). The water is fresh, colorless, but salty. The static water level varies from 8 to 12 m below the surface.
C.1.4.4 Fauna and Flora
C.1.4.4.1 Aquatic Fauna
Assessment of fauna mainly based on data collected by Ecological and Biological Institute in 1998 and1999 in Haipong City, Thuy Nguyen district, and urban section of Haiphong City. The ecosystem in Haiphong is diversified, being characterized by terrestrial animals in the low coastal delta interpercolated with limestone, paddy fields, gardens and cities. To aquatic animals include representatives of fresh water, blackish water in river mouths and estuaries.
The population density of zooplankton is the highest in the lakes, such as Tam Bac lake over 7,000 organisms /m3, and the channels have lowest population, only 400 organisms /m3. Population density of river Zooplankton is about 3,000 organisms/m3. Especially Rotifera species are concentrated on most of sewage channels, ponds and lakes.
The results of analyzing zoobenthos samples collected from some fresh water bodies of Haiphong in December 1999 show that the composition of zoobenthos groups in water bodies in the urban area of Haiphong is poor. Shrimps, crabs, clams and snails live mainly in ponds and rice fields around the city.
The most common fishes in the lakes and ponds in urban area of Haiphong city are natural species widespread in the Bac Bo plain such as different kind of carps and tilapia.
C.1.4.4.2 Aquatic and Terrestrial Flora
The vegetation cover in the urban area consists mainly of planted greenery and trees. However, this greenery system is poor in varieties and small in quantity. Along the roads there are also grassland with short-term and long-term herbaceous plants, aquatic and hydrophilic grasses (distributed in ponds, lakes and channels) and shrubs (consisting of climbing trees, creeping shrubs and bushes), sparsely
The Study on Sanitation Improvement Plan for Haiphong City, Vietnam
Final Report, Supporting Report Part C
C - 24
distributed. The natural vegetation cover is very poor in variety, small in area and sparsely distributed and has no economic or environmental value.
The flora in the study area is clearly represented by street greenery, wasteland shrubs and agricultural crops in the outskirts of the city. There are no endangered plants in the study area.
Water bodies are partly or wholly covered by water plants, the most common being water hyacinth, duckweed and water spinach.
The Study on Sanitation Improvement Plan for Haiphong City, Vietnam
Final Report, Supporting Report Part C
C - 25
C.2 Environmental Impact Assessment for Drainage Project
C.2.1 Project Description
C.2.1.1 Project Area and Components of the Project
Phase 1 of the drainage improvement plan in the Central Area has been selected as the Drainage Priority Project, see Figure C.2.1.1. The project components are rehabilitation of An Kim Hai Channel, length about 10 km, and construction of Phuong Luu Lake, size about 24 ha. The proposed implementation period is from 2004 to 2008.
The rehabilitation needs of An Kim Hai Channel comprise the following:
• Wastewater is discharged to the channels and lakes without treatment causing pollution and poor sanitary conditions
• Sludge has accumulated on the bottoms of the channels and lakes, reducing the needed hydraulic capacity of the system
• Maintenance roads do not exist along the channels and lakes preventing effective maintenance
• Encroachment of illegal housing has occurred along the channels and lakes preventing maintenance and reducing the storage and hydraulic capacity of the channel
Phuong Luu Lake is needed to to integrate the Northeast and Southwest catchment areas and to increase the total storage capacity of the drainage system in the Central Area. Construction of Phuong Luu Lake consists of the following measures.
• Excavation of lake and embankment works • Roads and recreation area around the lake • Channel or closed conduit connections to Northeast Channel and An Kim Hai
Channel
C.2.1.2 Planning Concept and Design Criteria
Design scale of An Kim Hai Channel rehabilitation and construction of Phuong Luu Lake is based on the Master Plan. The channel is to be rehabilitated for a design storm with a 5 year ARI and a design tidal level with a 10 year ARI for the Central Area. The design requirements in the Haiphong Sewerage and Drainage Master plan are adopted.
The main planning issues for rehabilitating An Kim Hai Channel are listed below. Alternatives for each planning issue have been identified, defined and the most appropriate alternative is selected for technical design.
• Irrigation function • Hydraulic layout of the channel • Need for widening of the channel • Locations and widths of maintenance roads
The Study on Sanitation Improvement Plan for Haiphong City, Vietnam
Final Report, Supporting Report Part C
C - 26
• Embankment works and channel cross-sections • Construction of interceptor sewers along banks of channel • Lach Tray River tidal gate • Du Hang Lake connection