1 The Subprime Mortgage Crisis: Anatomy of a Market Failure Kenneth A. Posner [email protected]212.761.4524 March 10, 2008 Morgan Stanley does and seeks to do business with companies covered in Morgan Stanley Research. As a result, investors should be aware that the firm may have a conflict of interest that could affect the objectivity of Morgan Stanley Research. Investors should consider Morgan Stanley Research as only a single factor in making their investment decision. Customers of Morgan Stanley in the US can receive independent, third-party research on companies covered in Morgan Stanley Research, at no cost to them, where such research is available. Customers can access this independent research at www.morganstanley.com/equityresearch or can call 1-800- 624-2063 to request a copy of this research. For analyst certification and other important disclosures, refer to Disclosure Section.
Transcript
1
The Subprime Mortgage Crisis: Anatomy of a Market Failure
Morgan Stanley does and seeks to do business with companies covered in Morgan Stanley Research. As a result, investors should be aware that the firm may have a conflict of interest that could affect the objectivity of MorganStanley Research. Investors should consider Morgan Stanley Research as only a single factor in making their investment decision. Customers of Morgan Stanley in the US can receive independent, third-party research on companies covered in Morgan Stanley Research, at no cost to them, where such research is available. Customers can access this independent research at www.morganstanley.com/equityresearch or can call 1-800-624-2063 to request a copy of this research.For analyst certification and other important disclosures, refer to Disclosure Section.
• Driven by advances in information technology, securitization has transformed the financial markets in the US for a wide range of asset classes, at the expense of traditional bank financing
• Rating agencies, investment banks, guarantors played a major role in the growth of this market
Mortgage brokers: a major force, should they be regulated?
0
10
20
30
40
50
60
1988
1989
1990
1991
1992
1993
1994
1995
1996
1997
1998
1999
2000
2001
2002
2003
2004
2005
2006
2007
E20
08E
Thousands
Source: Wholesale Access Broker Studies
33
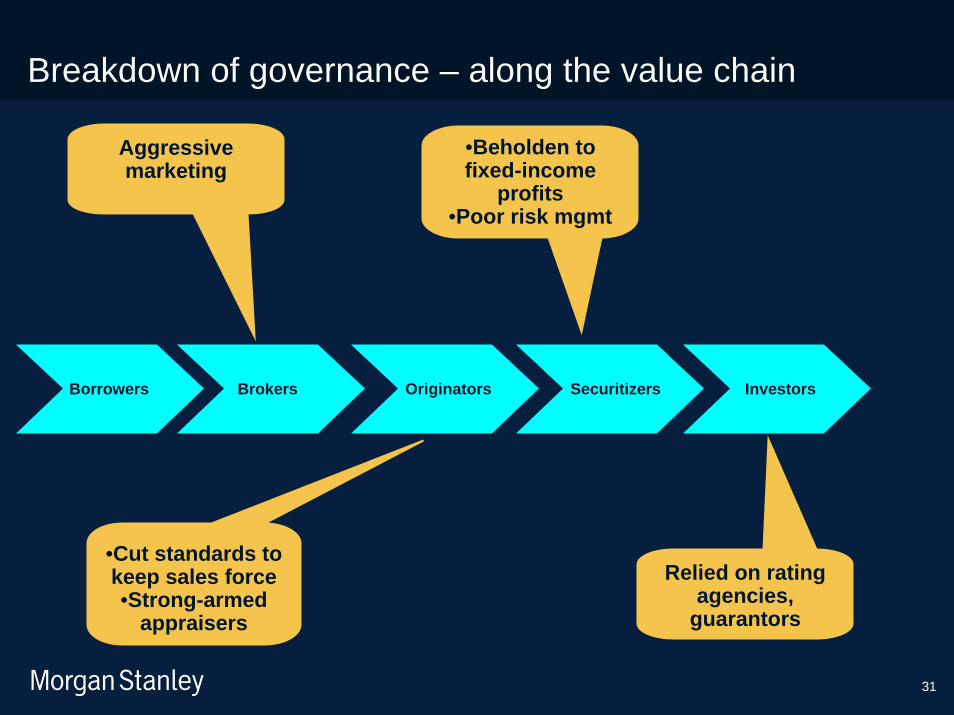
Problems with market governance
No one sees the entire market
Time lags in emergence of losses
34
The bust
Home prices Availability of credit
Global liquidity
Sub-prime losses
Underwriting standards
35
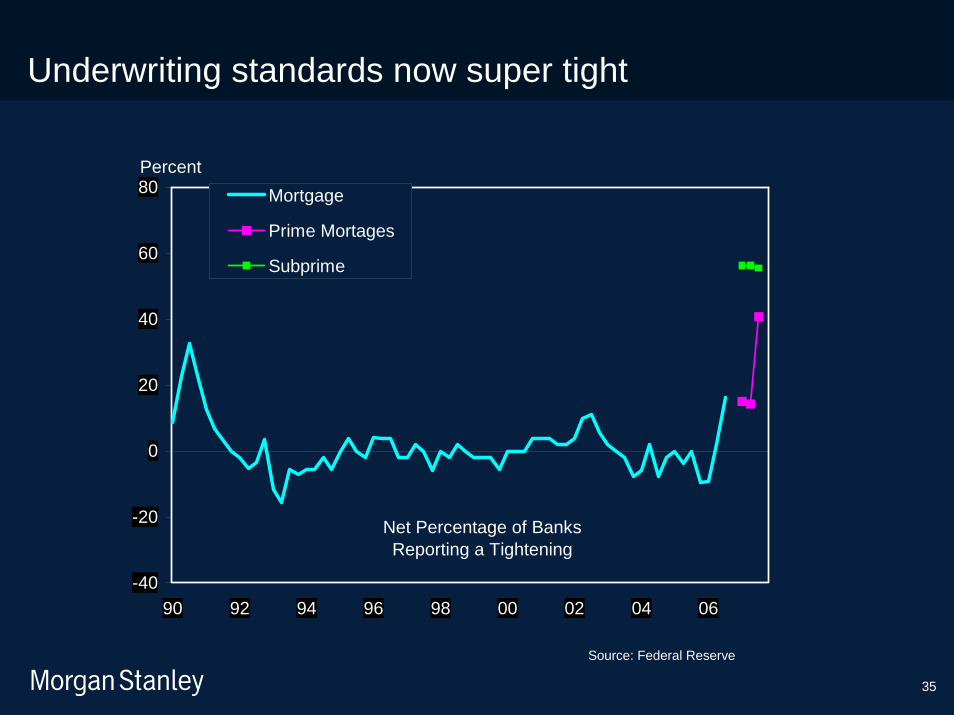
Underwriting standards now super tight
-40
-20
0
20
40
60
80
90 92 94 96 98 00 02 04 06
Mortgage
Prime Mortages
Subprime
Percent
Net Percentage of Banks Reporting a Tightening
Source: Federal Reserve
36
Looking Ahead
37
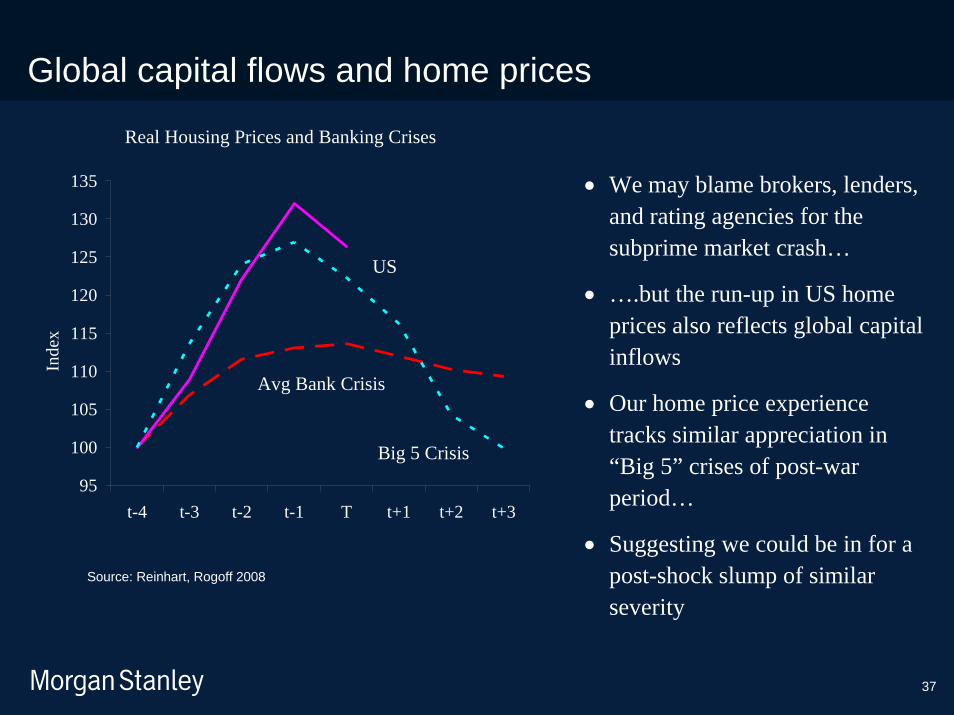
Global capital flows and home prices
Real Housing Prices and Banking Crises
95
100
105
110
115
120
125
130
135
t-4 t-3 t-2 t-1 T t+1 t+2 t+3
Inde
x
Avg Bank Crisis
US
Big 5 Crisis
• We may blame brokers, lenders, and rating agencies for the subprime market crash…
• ….but the run-up in US home prices also reflects global capital inflows
• Our home price experience tracks similar appreciation in “Big 5” crises of post-war period…
• Suggesting we could be in for a post-shock slump of similar severity
Source: Reinhart, Rogoff 2008
38
Market expects home prices to decline over 20% in the next three years
-2.4%
-11.9%
-7.6%
-4.9%
1.9% 1.9%
-14.0%
-12.0%
-10.0%
-8.0%
-6.0%
-4.0%
-2.0%
0.0%
2.0%
4.0%
2007A 2008 2009 2010 2011 2012
Y/Y Change
Source: Radar Logic, Morgan Stanley Research
39
Global capital flows and GDP
Real GDP Growth per Capita and Banking Crises
(PPP basis)
-2-1012345
t-4 t-3 t-2 t-1 t t+1 t+2
Perc
ent Avg Banking Crisis
US
Top 5 Crisis
• However, US economic growth wasn’t as strong in the run-up as was the case in the “Big 5” financial crises
• So hopefully the economic aftermath for us will be more moderate
Source: Reinhart, Rogoff 2008
40
Disclosure section
Morgan Stanley ModelWare is a proprietary analytic framework that helps clients uncover value, adjusting for distortions and ambiguities created by local accounting regulations. For example, ModelWare EPS adjusts for one-time events, capitalizes operating leases (where their use is significant), and converts inventory from LIFO costing to a FIFO basis. ModelWare also emphasizes the separation of operating performance of a company from its financing for a more complete view of how a company generates earnings.
The information and opinions in Morgan Stanley Research were prepared by Morgan Stanley & Co. Incorporated, and/or Morgan Stanley Dean Witter C.T.V.M. S.A. and their affiliates (collectively, "Morgan Stanley").
For important disclosures, stock price charts and rating histories regarding companies that are the subject of this report, please see the Morgan Stanley Research Disclosure Website at www.morganstanley.com/researchdisclosures, or contact your investment representative or Morgan Stanley Research at 1585 Broadway, (Attention: Equity Research Management), New York, NY, 10036 USA .
Analyst CertificationThe following analysts hereby certify that their views about the companies and their securities discussed in this report are accurately expressed and that they have not received and will not receive direct or indirect compensation in exchange for expressing specific recommendations or views in this report: Kenneth Posner.
Unless otherwise stated, the individuals listed on the cover page of this report are research analysts Unless otherwise stated, the individuals listed on the cover page of this report are research analysts.
Global Research Conflict Management PolicyMorgan Stanley Research has been published in accordance with our conflict management policy, which is available at www.morganstanley.com/institutional/research/conflictpolicies.
Important US Regulatory Disclosures on Subject CompaniesThe following analyst, strategist, or research associate (or a household member) owns securities (or related derivatives) in a company that he or she covers or recommends in Morgan Stanley Research: Kenneth Posner - Discover Financial Services (common stock). Morgan Stanley policy prohibits research analysts, strategists and research associates from investing in securities in their sub industry as defined by the Global Industry Classification Standard ("GICS," which was developed by and is the exclusive property of MSCI and S&P). Analysts may nevertheless own such securities to the extent acquired under a prior policy or in a merger, fund distribution or other involuntary acquisition.As of February 29, 2008, Morgan Stanley beneficially owned 1% or more of a class of common equity securities of the following companies covered in Morgan Stanley Research: AerCap, Ambac Financial Group, American Express Co., Citigroup Inc., Freddie Mac, MasterCard, Merrill Lynch, MGIC Investment, National City, PMI Group, The CIT Group, Washington Mutual.As of February 29, 2008, Morgan Stanley held a net long or short position of US$1 million or more of the debt securities of the following issuers covered in Morgan Stanley Research (including where guarantor of the securities): Ambac Financial Group, American Express Co., Capital One Financial Corp, Citigroup Inc., Countrywide Financial Corp., Discover Financial Services, Fannie Mae, Fidelity Natl. Financial, Freddie Mac, MBIA, Inc., Merrill Lynch, MGIC Investment, National City, Nelnet, PHH Corp., PMI Group, SLM Corporation, The CIT Group, Washington Mutual.Within the last 12 months, Morgan Stanley managed or co-managed a public offering of securities of AerCap, Babcock & Brown Air Limited, Citigroup Inc., Discover Financial Services, Fannie Mae, Freddie Mac, Nelnet, SLM Corporation.Within the last 12 months, Morgan Stanley has received compensation for investment banking services from AerCap, Ambac Financial Group, American Express Co., Capital One Financial Corp, Citigroup Inc., Countrywide Financial Corp., Fannie Mae, Fidelity Natl. Financial, Freddie Mac, MBIA, Inc., Merrill Lynch, MGIC Investment, National City, Nelnet, NewStar Financial Inc., PMI Group, The CIT Group, Washington Mutual.
41
Disclosure sectionIn the next 3 months, Morgan Stanley expects to receive or intends to seek compensation for investment banking services from Advance America, AerCap, American Express Co., Capital One Financial Corp, Citigroup Inc., Countrywide Financial Corp., Fannie Mae, Freddie Mac, Merrill Lynch, National City, Nelnet, NewStar Financial Inc., PMI Group, The CIT Group, Washington Mutual.Within the last 12 months, Morgan Stanley & Co. Incorporated has received compensation for products and services other than investment banking services from Ambac Financial Group, American Express Co., Capital One Financial Corp, Citigroup Inc., Countrywide Financial Corp., Discover Financial Services, Fannie Mae, Fidelity Natl. Financial, Freddie Mac, MBIA, Inc., Merrill Lynch, National City, Nelnet, NewStar Financial Inc., PMI Group, The CIT Group, Washington Mutual.
Within the last 12 months, Morgan Stanley has provided or is providing investment banking services to, or has an investment banking client relationship with, the following company: Advance America, AerCap, Ambac Financial Group, American Express Co., Capital One Financial Corp, Citigroup Inc., Countrywide Financial Corp., Fannie Mae, Fidelity Natl. Financial, Freddie Mac, MBIA, Inc., Merrill Lynch, MGIC Investment, National City, Nelnet, NewStar Financial Inc., PMI Group, The CIT Group, Washington Mutual.
Within the last 12 months, Morgan Stanley has either provided or is providing non-investment banking, securities-related services to and/or in the past has entered into an agreement to provide services or has a client relationship with the following company: Ambac Financial Group, American Express Co., Capital One Financial Corp, Citigroup Inc., Countrywide Financial Corp., Discover Financial Services, Fannie Mae, Fidelity Natl. Financial, Freddie Mac, MBIA, Inc., Merrill Lynch, MGIC Investment, National City, Nelnet, NewStar Financial Inc., PMI Group, SLM Corporation, The CIT Group, Washington Mutual.
The research analysts, strategists, or research associates principally responsible for the preparation of Morgan Stanley Research have received compensation based upon various factors, including quality of research, investor client feedback, stock picking, competitive factors, firm revenues and overall investment banking revenues.
An employee or director of Morgan Stanley & Co. Incorporated is a director of Discover Financial Services, MGIC Investment.
Morgan Stanley & Co. Incorporated makes a market in the securities of NewStar Financial Inc
Certain disclosures listed above are also for compliance with applicable regulations in non-US jurisdictions.
42
Disclosure section (cont.)
STOCK RATINGSMorgan Stanley uses a relative rating system using terms such as Overweight, Equal-weight or Underweight (see definitions below). Morgan Stanley does not assign ratings of Buy, Hold or Sell to the stocks we cover. Overweight, Equal-weight and Underweight are not the equivalent of Buy, Hold and Sell. Investors should carefully read the definitions of all ratings used in Morgan Stanley Research. In addition, since Morgan Stanley Research contains more complete information concerning the analyst's views, investors should carefully read Morgan Stanley Research, in its entirety, and not infer the contents from the rating alone. In any case, ratings (or research) should not be used or relied upon as investment advice. An investor's decision to buy or sell a stock should depend on individual circumstances (such as the investor's existing holdings) and other considerations.
Global Stock Ratings Distribution(as of February 29, 2008)For disclosure purposes only (in accordance with NASD and NYSE requirements), we include the category headings of Buy, Hold, and Sell alongside our ratings of Overweight, Equal-weight and Underweight. Morgan Stanley does not assign ratings of Buy, Hold or Sell to the stocks we cover. Overweight, Equal-weight, and Underweight are not the equivalent of buy, hold, and sell but represent recommended relative weightings (see definitions below). To satisfy regulatory requirements, we correspond Overweight, our most positive stock rating, with a buy recommendation; we correspond Equal-weight to hold and Underweight to sell recommendations, respectively.
Data include common stock and ADRs currently assigned ratings. An investor's decision to buy or sell a stock should depend on individual circumstances (such as the investor's existing holdings) and other considerations. Investment Banking Clients are companies from whom Morgan Stanley or an affiliate received investment banking compensation in the last 12 months.
43
Disclosure section (cont.)
Analyst Stock RatingsOverweight (O). The stock's total return is expected to exceed the average total return of the analyst's industry (or industry team's) coverage universe, on a risk-adjusted basis, over the next 12-18 months.
Equal-weight (E). The stock's total return is expected to be in line with the average total return of the analyst's industry (or industry team's) coverage universe, on a risk-adjusted basis, over the next 12-18 months.
Underweight (U). The stock's total return is expected to be below the average total return of the analyst's industry (or industry team's) coverage universe, on a risk-adjusted basis, over the next 12-18 months.
More volatile (V). We estimate that this stock has more than a 25% chance of a price move (up or down) of more than 25% in a month, based on a quantitative assessment of historical data, or in the analyst's view, it is likely to become materially more volatile over the next 1-12 months compared with the past three years. Stocks with less than one year of trading history are automatically rated as more volatile (unless otherwise noted). We note that securities that we do not currently consider "more volatile" can still perform in that manner.
Unless otherwise specified, the time frame for price targets included in Morgan Stanley Research is 12 to 18 months.
Analyst Industry ViewsAttractive (A): The analyst expects the performance of his or her industry coverage universe over the next 12-18 months to be attractive vs. the relevant broad market benchmark, as indicated below.In-Line (I): The analyst expects the performance of his or her industry coverage universe over the next 12-18 months to be in line with the relevant broad market benchmark, as indicated below.Cautious (C): The analyst views the performance of his or her industry coverage universe over the next 12-18 months with caution vs. the relevant broad market benchmark, as indicated below.Benchmarks for each region are as follows: North America - S&P 500; Latin America - relevant MSCI country index or MSCI Latin America Index; Europe - MSCI Europe; Japan - TOPIX; Asia - relevant MSCI country index
Other Important DisclosuresMorgan Stanley produces a research product called a "Tactical Idea." Views contained in a "Tactical Idea" on a particular stock may be contrary to the recommendations or views expressed in this or other research on the same stock. This may be the result of differing time horizons, methodologies, market events, or other factors. For all research available on a particular stock, please contact your sales representative or go to Client Link at www.morganstanley.com.
For a discussion, if applicable, of the valuation methods used to determine the price targets included in this summary and the risks related to achieving these targets, please refer to the latest relevant published research on these stocks.
Morgan Stanley Research does not provide individually tailored investment advice. Morgan Stanley Research has been prepared without regard to the individual financial circumstances and objectives of persons who receive it. The securities/instruments discussed in Morgan Stanley Research may not be suitable for all investors. Morgan Stanley recommends that investors independently evaluate particular investments and strategies, and encourages investors to seek the advice of a financial adviser. The appropriateness of a particular investment or strategy will depend on an investor's individual circumstances and objectives. The securities, instruments, or strategies discussed in Morgan Stanley Research may not be suitable for all investors, and certain investors may not be eligible to purchase or participate in some or all of them.
Morgan Stanley Research is not an offer to buy or sell or the solicitation of an offer to buy or sell any security/instrument or to participate in any particular trading strategy. The "Important US Regulatory Disclosures on Subject Companies" section in Morgan Stanley Research lists all companies mentioned where Morgan Stanley owns 1% or more of a class of common securities of the companies. For all other companies mentioned in Morgan Stanley Research, Morgan Stanley may have an investment of less than 1% in securities or derivatives of securities of companies and may trade them in ways different from those discussed in Morgan Stanley Research. Employees of Morgan Stanley not involved in the preparation of Morgan Stanley Research may have investments in securities or derivatives of securities of companies mentioned and may trade them in ways different from those discussed in Morgan Stanley Research. Derivatives may be issued by Morgan Stanley or associated persons.
44
Disclosure section (cont.)Morgan Stanley and its affiliate companies do business that relates to companies/instruments covered in Morgan Stanley Research, including market making and specialized trading, risk arbitrage and other proprietary trading, fund management, commercial banking, extension of credit, investment services and investment banking. Morgan Stanley sells to and buys from customers the securities/instruments of companies covered in Morgan Stanley Research on a principal basis.With the exception of information regarding Morgan Stanley, research prepared by Morgan Stanley Research personnel are based on public information. Morgan Stanley makes every effort to use reliable, comprehensive information, but we make no representation that it is accurate or complete. We have no obligation to tell you when opinions or information in Morgan Stanley Research change apart from when we intend to discontinue research coverage of a subject company. Facts and views presented in Morgan Stanley Research have not been reviewed by, and may not reflect information known to, professionals in other Morgan Stanley business areas, including investment banking personnel.Morgan Stanley Research personnel conduct site visits from time to time but are prohibited from accepting payment or reimbursement by the company of travel expenses for such visits.The value of and income from your investments may vary because of changes in interest rates or foreign exchange rates, securities prices or market indexes, operational or financial conditions of companies or other factors. There may be time limitations on the exercise of options or other rights in your securities transactions. Past performance is not necessarily a guide to future performance. Estimates of future performance are based on assumptions that may not be realized. Unless otherwise stated, the cover page provides the closing price on the primary exchange for the subject company's securities/instruments.To our readers in Taiwan: Information on securities/instruments that trade in Taiwan is distributed by Morgan Stanley Taiwan Limited ("MSTL"). Such information is for your reference only. The reader should independently evaluate the investment risks and is solely responsible for their investment decisions. Morgan Stanley Research may not be distributed to the public media or quoted or used by the public media without the express written consent of Morgan Stanley. Information on securities/instruments that do not trade in Taiwan is for informational purposes only and is not to be construed as a recommendation or a solicitation to trade in such securities/instruments. MSTL may not execute transactions for clients in these securities/instruments.To our readers in Hong Kong: Information is distributed in Hong Kong by and on behalf of, and is attributable to, Morgan Stanley Asia Limited as part of its regulated activities in Hong Kong. If you have any queries concerning Morgan Stanley Research, please contact our Hong Kong sales representatives.Morgan Stanley Research is disseminated in Japan by Morgan Stanley Japan Securities Co., Ltd.; in Hong Kong by Morgan Stanley Asia Limited (which accepts responsibility for its contents); in Singapore by Morgan Stanley Asia (Singapore) Pte. (Registration number 199206298Z) and/or Morgan Stanley Asia (Singapore) Securities Pte Ltd (Registration number 200008434H), regulated by the Monetary Authority of Singapore, which accepts responsibility for its contents; in Australia by Morgan Stanley Australia Limited A.B.N. 67 003 734 576, holder of Australian financial services licence No. 233742, which accepts responsibility for its contents; in Korea by Morgan Stanley & Co International plc, Seoul Branch; in India by Morgan Stanley India Company Private Limited; in Canada by Morgan Stanley Canada Limited, which has approved of, and has agreed to take responsibility for, the contents of Morgan Stanley Research in Canada; in Germany by Morgan Stanley Bank AG, Frankfurt am Main, regulated by Bundesanstalt fuer Finanzdienstleistungsaufsicht (BaFin); in Spain by Morgan Stanley, S.V., S.A., a Morgan Stanley group company, which is supervised by the Spanish Securities Markets Commission (CNMV) and states that Morgan Stanley Research has been written and distributed in accordance with the rules of conduct applicable to financial research as established under Spanish regulations; in the United States by Morgan Stanley & Co. Incorporated, which accepts responsibility for its contents. Morgan Stanley & Co. International plc, authorized and regulated by Financial Services Authority, disseminates in the UK research that it has prepared, and approves solely for the purposes of section 21 of the Financial Services and Markets Act 2000, research which has been prepared by any of its affiliates. Private U.K. investors should obtain the advice of their Morgan Stanley & Co. International plc representative about the investments concerned. In Australia, Morgan Stanley Research, and any access to it, is intended only for "wholesale clients" within the meaning of the Australian Corporations Act. RMB Morgan Stanley (Proprietary) Limited is a member of the JSE Limited and regulated by the Financial Services Board in South Africa. RMB Morgan Stanley (Proprietary) Limited is a joint venture owned equally by Morgan Stanley International Holdings Inc. and FirstRand Investment Holdings Limited, which is wholly owned by FirstRand Limited.The information in Morgan Stanley Research is being communicated by Morgan Stanley & Co. International plc (DIFC Branch), regulated by the Dubai Financial Services Authority (the DFSA), and is directed at wholesale customers only, as defined by the DFSA. This research will only be made available to a wholesale customer who we are satisfied meets the regulatory criteria to be a client.The information in Morgan Stanley Research is being communicated by Morgan Stanley & Co. International plc (QFC Branch), regulated by the Qatar Financial Centre Regulatory Authority (the QFCRA), and is directed at business customers and market counterparties only and is not intended for Retail Customers as defined by the QFCRA.The trademarks and service marks contained in Morgan Stanley Research are the property of their respective owners. Third-party data providers make no warranties or representations of any kind relating to the accuracy, completeness, or timeliness of the data they provide and shall not have liability for any damages of any kind relating to such data. The Global Industry Classification Standard ("GICS") was developed by and is the exclusive property of MSCI and S&P.Morgan Stanley Research, or any portion hereof may not be reprinted, sold or redistributed without the written consent of Morgan Stanley.Morgan Stanley Research is disseminated and available primarily electronically, and, in some cases, in printed form.Additional information on recommended securities/instruments is available on request.
45
The Americas1585 BroadwayNew York, NY 10036-8293United StatesTel: +1 (1)212 761 4000