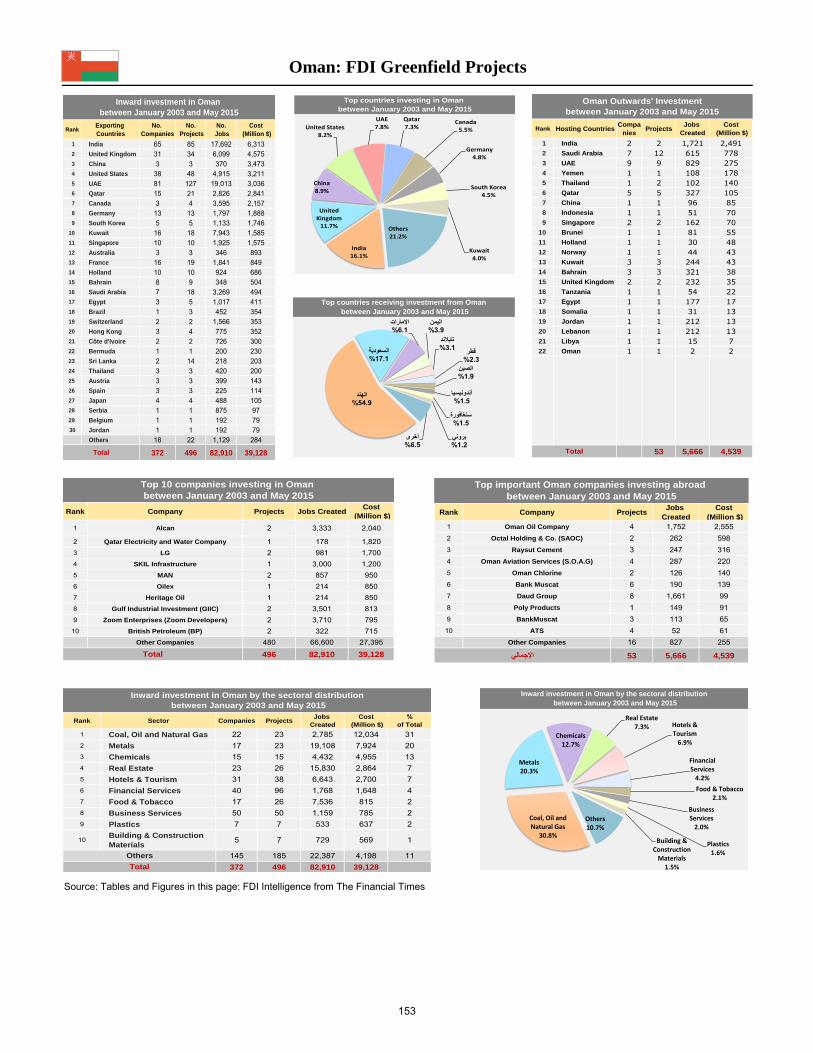
The Sultanate of Oman: Inward and Outward FDI
4.2 Population (million)
309,500 Area (Km2)
2,092 Coastline (Km)
Oil, copper, asbestos and
some marble, limestone Natural resources
I – Inward Investments In 2014, Oman succeeded in attracting FDIs worth 1180 million dollars according to UNCTAD estimations, which represent 2.7% of the Arab total for the same year. FDI balances incoming to Oman amounted to some 19.7 billion dollars by the end of 2014, which represent 2.5% of the Arab total for the same period. As for Oman's activity in terms of new FDIs (greenfield), the FDI Markets database published by the Financial Times for the period from January 2003 to May 2015 shows the following: • 496 FDI projects are being implemented in Oman by 372 Arab and foreign companies. It is estimated that the total investment cost of these projects, which employ roughly 83 thousand workers is about $ 39 billion. • India, UK, China, USA, UAE, Qatar, Canada, Germany, South Korea and Kuwait respectively were on the list of the most important countries investing in Oman, in terms of investment cost of the projects. The share of India, UK and China accounted for around 60% of the total. • Arab and foreign investments incoming to Oman are concentrated in the coal, oil and gas sector with a percentage of 30.8%, while 20.3% are in the minerals sector and 12.7% in the chemicals sector. • Alcan Canadian mining company came on top of the list of the 10 most important companies investing in Oman where it implements 2 projects with an investment cost estimated at 2 billion dollars. II – Outward Investments In 2014, Oman succeeded in exporting FDIs worth 1164 million dollars according to UNCTAD estimations, which represent 3.5% of the Arab total for the same year. Outward FDI balances from Oman amounted to some 7453 million dollars by the end of 2014, which represent 3% of the Arab total for the same period. As for Oman's investment activity abroad according to the FDI Markets database for the period from January 2003 to May 2015, it was as follows: • The number of Omani FDI projects abroad amounted to 63 projects that are being implemented by the Sultanate companies. Estimations reveal that the overall investment cost of those projects, which employ some 505 workers, is close to 222 million dollars. • India, KSA, UAE, Yemen, Thailand, Qatar, China, Indonesia, Singapore and Brunei respectively were on the list of the most important countries receiving Omani investments, in terms of investment cost of the projects. The share of UAE, UK and Turkey accounted for around 78% of the total. • Oman Oil Company came on top of list of the most important Omani companies investing abroad, as it is implementing 4 projects with an investment cost estimated at 2.6 billion dollars approximately.
152
Oman: FDI Greenfield Projects
Source: Tables and Figures in this page: FDI Intelligence from The Financial Times
Rank Sector Companies ProjectsJobs
CreatedCost
(Million $)%
of Total
1 Coal, Oil and Natural Gas 22 23 2,785 12,034 312 Metals 17 23 19,108 7,924 203 Chemicals 15 15 4,432 4,955 134 Real Estate 23 26 15,830 2,864 75 Hotels & Tourism 31 38 6,643 2,700 76 Financial Services 40 96 1,768 1,648 47 Food & Tobacco 17 26 7,536 815 28 Business Services 50 50 1,159 785 29 Plastics 7 7 533 637 2
10 Building & Construction Materials
5 7 729 569 1
145 185 22,387 4,198 11372 496 82,910 39,128 Total
Inward investment in Oman by the sectoral distribution between January 2003 and May 2015
Others
Rank Company Projects Jobs CreatedCost
(Million $)
1 Alcan 2 3,333 2,040
2 Qatar Electricity and Water Company 1 178 1,8203 LG 2 981 1,7004 SKIL Infrastructure 1 3,000 1,2005 MAN 2 857 9506 Oilex 1 214 8507 Heritage Oil 1 214 8508 Gulf Industrial Investment (GIIC) 2 3,501 8139 Zoom Enterprises (Zoom Developers) 2 3,710 79510 British Petroleum (BP) 2 322 715
Other Companies 480 66,600 27,395
496 82,910 39,128Total
Top 10 companies investing in Oman between January 2003 and May 2015
Rank Company ProjectsJobs
CreatedCost
(Million $)1 Oman Oil Company 4 1,752 2,5552 Octal Holding & Co. (SAOC) 2 262 5983 Raysut Cement 3 247 3164 Oman Aviation Services (S.O.A.G) 4 287 2205 Oman Chlorine 2 126 1406 Bank Muscat 6 190 1397 Daud Group 8 1,661 998 Poly Products 1 149 919 BankMuscat 3 113 6510 ATS 4 52 61
Other Companies 16 827 255
53 5,666 4,539
Top important Oman companies investing abroad between January 2003 and May 2015
اإلجمالي
Inward investment in Oman by the sectoral distribution between January 2003 and May 2015
Coal, Oil and Natural Gas
30.8%
Metals20.3%
Chemicals12.7%
Real Estate7.3% Hotels &
Tourism6.9%
Financial Services
4.2%
Food & Tobacco2.1%
Business Services
2.0%
Plastics1.6%
Building & Construction
Materials1.5%
Others10.7%
RankExporting Countries
No. Companies
No. Projects
No. Jobs
Cost (Million $)
1 India 65 85 17,692 6,3132 United Kingdom 31 34 6,099 4,5753 China 3 3 370 3,4734 United States 38 48 4,915 3,2115 UAE 81 127 19,013 3,0366 Qatar 15 21 2,826 2,8417 Canada 3 4 3,595 2,1578 Germany 13 13 1,797 1,8889 South Korea 5 5 1,133 1,746
10 Kuwait 16 18 7,943 1,58511 Singapore 10 10 1,925 1,57512 Australia 3 3 346 89313 France 16 19 1,841 84914 Holland 10 10 924 68615 Bahrain 8 9 348 50416 Saudi Arabia 7 18 3,269 49417 Egypt 3 5 1,017 41118 Brazil 1 3 452 35419 Switzerland 2 2 1,566 35320 Hong Kong 3 4 775 35221 Côte d'Ivoire 2 2 726 30022 Bermuda 1 1 200 23023 Sri Lanka 2 14 218 20324 Thailand 3 3 420 20025 Austria 3 3 399 14326 Spain 3 3 225 11427 Japan 4 4 488 10528 Serbia 1 1 875 9729 Belgium 1 1 192 7930 Jordan 1 1 192 79
Others 18 22 1,129 284
372 496 82,910 39,128
Inward investment in Oman between January 2003 and May 2015
Total
Rank Hosting CountriesCompa
niesProjects
Jobs Created
Cost (Million $)
1 India 2 2 1,721 2,491
2 Saudi Arabia 7 12 615 778
3 UAE 9 9 829 275
4 Yemen 1 1 108 178
5 Thailand 1 2 102 140
6 Qatar 5 5 327 105
7 China 1 1 96 85
8 Indonesia 1 1 51 70
9 Singapore 2 2 162 70
10 Brunei 1 1 81 55
11 Holland 1 1 30 48
12 Norway 1 1 44 43
13 Kuwait 3 3 244 43
14 Bahrain 3 3 321 38
15 United Kingdom 2 2 232 35
16 Tanzania 1 1 54 22
17 Egypt 1 1 177 17
18 Somalia 1 1 31 13
19 Jordan 1 1 212 13
20 Lebanon 1 1 212 13
21 Libya 1 1 15 7
22 Oman 1 1 2 2
53 5,666 4,539
Oman Outwards' Investmentbetween January 2003 and May 2015
Total
Top countries investing in Oman between January 2003 and May 2015
India16.1%
United Kingdom
11.7%
China8.9%
United States8.2%
UAE7.8%
Qatar7.3%
Canada5.5%
Germany4.8%
South Korea4.5%
Kuwait4.0%
Others21.2%
Top countries receiving investment from Oman between January 2003 and May 2015
153
Source of Tables and Figures in this page: International Trade Center
Oman : Imports and Exports of Goods
Top 10 countries exporting goods to Oman 2014
UAE33%
Japan12%
China5%
India4%
United States
4%
Saudi Arabia
4%Brazil
4% South Korea
4%
Germany3%
Italia2%
Others25%
Value (thousand $) % Imports
1 United Arab Emirates 9,515,135 32.5
2 Japan 3,579,210 12.2
3 China 1,405,909 4.8
4 India 1,265,673 4.3
5 United States 1,264,743 4.3
6 Saudi Arabia 1,201,454 4.1
7 Brazil 1,139,552 3.9
8 South Korea 1,073,453 3.7
9 Germany 863,393 2.9
10 Italia 572,900 2.0
7,423,518 24.9
29,304,940
Others
Total
Rank Exporting CountryOman Imports
Top 10 countries exporting goods to Oman2014
Value (thousand $) % Exports
1 France 30,163,806 56.2
2 United Arab Emirates 5,459,257 10.2
3 South Korea 3,727,153 6.9
4 Saudi Arabia 2,061,112 3.8
5 Japan 1,599,611 3.0
6 Pakistan 1,502,706 2.8
7 China 1,337,764 2.5
8 India 1,118,963 2.1
9 United States 749,804 1.4
10 Kuwait 482,875 0.9
5,501,767 9.8
53,704,818Total
Top 10 countries importing goods from Oman2014
Rank Importing CountryOman Exports
Others
Top 10 countries importing goods from Oman 2014
France56%
UAE10%
South Korea
7%
Saudi Arabia
4%
Japan3%
Pakistan3%
China3%
India2%
United States
1%
Kuwait1%
Others10%
Value (thousand $) % World Exports
1 Mineral fuels, oils, distillation products, etc 39,038,893 1.3
2 Vehicles other than railway, tramway 4,714,118 0.3
3 Organic chemicals 1,845,311 0.4
4 Aluminium and articles thereof 979,147 0.6
5 Plastics and articles thereof 928,208 0.2
6 Ores, slag and ash 709,132 0.3
7 Fertilizers 658,162 1.0
8 Iron and steel 610,337 0.1
9 Electrical, electronic equipment 543,441 0.0
10 Articles of iron or steel 448,417 0.1
3,229,656 3.6
53,704,822Total
Top 10 goods (products) exported by Oman 2014
Rank Exported GoodsExports
Others
Top 10 goods (products) exported by Oman 2014
Mineral fuels, oils,
distillation products, etc
72.7%
Vehicles other than railway,
tramway8.8%
Organic chemicals
3.4%
Aluminium and articles
thereof1.8%
Plastics and articles thereof
1.7%
Ores, slag and ash
1.3%
Fertilizers1.2%
Iron and steel1.1%
Electrical, electronic equipment
1.0%
Articles of iron or steel
0.8%
Others6.0%
Value (thousand $) % World Imports
1 Vehicles other than railway, tramway 6,446,133 0.5
2 Machinery, nuclear reactors, boilers, etc 3,291,974 0.2
3 Mineral fuels, oils, distillation products, etc 1,904,265 0.1
4 Electrical, electronic equipment 1,760,009 0.1
5 Iron and steel 1,263,814 0.3
6 Articles of iron or steel 1,120,641 0.4
7 Ores, slag and ash 1,055,240 0.4
8 Organic chemicals 1,021,439 0.2
9 Plastics and articles thereof 770,350 0.1
10 Dairy products, eggs, honey, edible animal product nes 675,732 0.7
9,995,338 12.8
29,304,935Total
Top 10 goods (products) imported by Oman 2014
Rank Imported GoodsImports
Others
Top 10 goods (products) imported by Oman 2014
Vehicles other than
railway, tramway
22%
Machinery,
nuclear reactors,
boilers, etc11%
Mineral
fuels, oils7%
Electrical, electronic
equipment6%
Iron and
steel4%
Articles of iron or steel
4% Ores, slag and ash
4%
Organic chemicals
3%
Plastics and articles thereof
3%
Dairy products
2%
Others34%
154
Capital: Muscat 2013 2014Currency: Omani rial (OMR) Exchange rate (LCU per USD): 0.384 0.384
Basic Information: UnitUSD billion
%
USD
%
%
USD billion
%
USD billion
USD billion
USD billion
Month
%
Million people
%
Foreign direct investment (FDI) UnitFDI Flow
Inward USD millionOutward USD million
FDI StockInward USD millionOutward USD million
Source: UNCTAD
Technological Environment and Differentiation
4,029 4,905 6,289 7,453
1,233 877 1,384 1,164
15,861 16,901 18,527 19,707
2011 2012 2013 2014
874 1,040 1,626 1,180
3.6 4.1 4.2 4.4-- -- -- --
4.6 5.1 5.1 4.811.5 11.1 13.6 12.7
41.5 43.0 43.5 47.316.0 18.1 18.6 18.8
6.6 2.2 -15.0 -13.059.3 58.3 45.0 50.9
45.9 48.8 56.0 54.15.1 1.7 -9.5 -8.9
19,001.8 14,887.1 15,796.21.2 1.0 1.0 2.6
Oman: Overall Performance and Position in DIAI
Performance in Dhaman Investment Attractiveness Index (DIAI) 2015
Performance in DIAI's Core Components
2013 2014 2015 201677.0 77.8 62.9 68.84.7 2.9 4.6 3.1
21,417.1
Nominal GDP
Real GDP Growth
GDP per Capita
Inflation (average consumer prices)
General Government Total Expenditure and Net Lending (% of GDP)
Current Account Balance
Current Account Balance (% of GDP)
Exports of Goods and Services
Imports of Goods and Services
Gross Official Reserves
Total reserves in months of imports
Total Gross External Debt (% of GDP)
Population
Unemployment (% of total labor force)Source: International Monetary Fund (IMF)
61.2 51.9
26.5
51.9 47.1
23.3
57.4 50.9
29.7
0.0
20.0
40.0
60.0
80.0
Prerequisites Underlying Factors Positive Externalities
Performance in DIAI's three main axes
Oman Arab Region World Average
0.0
10.0
20.0
30.0
40.0
50.0
60.0
70.0
80.0
90.0
100.0
Macroeconomic Stability
Financial Structure and Development
Institutional environment
Business Environment
Market Access and Market Potential
Human and Natural ResourcesCost Components
Logistics Performance
Telecommunications and Information Technology
Agglomeration Economies
Technological Environment and Differentiation
Oman Arab Region World Average
46.4 40.4
45.8 51
67
55
0.0
20.0
40.0
60.0
80.0
Oman Arab Region World Average
Performance in DIAI
Score Rank
155