38
The Sun – Our Star Chapter 8
| Date post: | 17-Dec-2015 |
| Category: |
Documents |
| Upload: | shana-nash |
| View: | 217 times |
| Download: | 0 times |

The Sun – Our StarChapter 8

The preceding chapter described how we can get information from a spectrum. In this chapter, we apply these techniques to the sun, to learn about its complexities.
This chapter gives us our first close look at how scientists work, how they use evidence and hypothesis to understand nature. Here we will follow carefully developed logical arguments to understand our sun.
Most important, this chapter gives us our first detailed look at a star. The chapters that follow will discuss the many kinds of stars that fill the heavens, but this chapter shows us that each of them is both complex and beautiful; each is a sun.
Guidepost

I. The Solar AtmosphereA. Heat Flow in the SunB. The PhotosphereC. The ChromosphereD. The Solar CoronaE. Helioseismology
II. Solar ActivityA. Sunspots and Active RegionsB. The Sunspot CycleC. The Sun's Magnetic CycleD. Magnetic Cycles on Other StarsE. Chromospheric and Coronal ActivityF. The Solar Constant
Outline

III. Nuclear Fusion in the SunA. Nuclear Binding EnergyB. Hydrogen FusionC. The Solar Neutrino Problem
Outline (continued)

General Properties of the Sun
• An average star (size, temperature)
• Apparent magnitude is -26.7 (Absolute visual magnitude = 4.83)
• Central temperature = 15 million degrees K
• 333,000 times Earth’s mass
• 109 times Earth’s diameter
• Consists entirely of gas (ave. density = 1.4 g/cm3)
• Only appears so bright because it is so close.
• Spectral type G2 (yellow/green max intensity)
• Surface temperature = 5800 degrees K

Very Important Warning:
Never look directly at the sun through
a telescope or binoculars!!!
This can cause permanent eye damage – even blindness.
Use a projection technique or a special sun viewing filter.

The Solar Atmosphere
Hea
t F
low
Solar interior
Temp. increases inward
Only visible during solar eclipses
Apparent surface of the sun

• Apparent surface layer of the sun
The Photosphere
The solar corona
• Depth about 500 km• Temperature about 5800 degrees K• Contains man highly opaque hydrogen ions• Absorbs and re-emits radiation produced in the solar interior
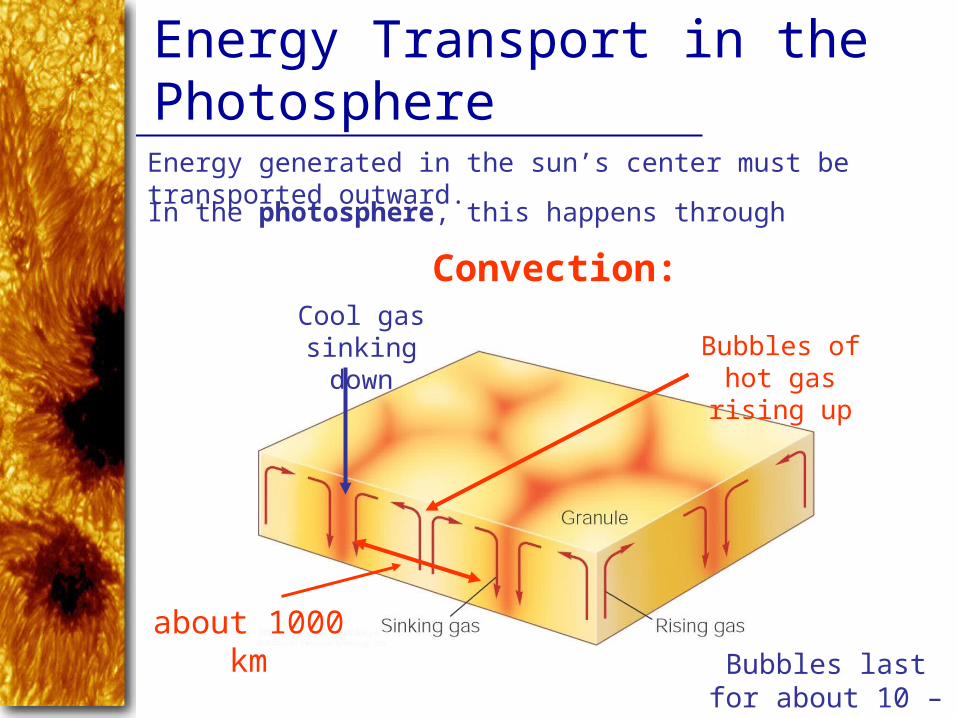
Energy Transport in the PhotosphereEnergy generated in the sun’s center must be transported outward.
In the photosphere, this happens through
Convection:
Bubbles of hot gas rising up
Cool gas sinking down
about 1000 kmBubbles last for
about 10 – 20 min.

Granulation
… is the visible consequence of convection

The Chromosphere
Chromospheric structures visible in Hα emission (filtergram)
• Region of sun’s atmosphere just above the photosphere.• A source of visible,
ultraviolet, and X-ray lines from highly ionized gases
• Temperature increases gradually from 4500 oK to 10,000 oK, then jumps to 1 million oK
Transition region
Filaments

The Chromosphere (2)
Spicules: Filaments of cooler gas from the photosphere, rising up into the chromosphere.
Visible in Hα emission.
Each one lasting about 5 – 15 min.

The Layers of the Solar Atmosphere
Visible
Photosphere
Ultraviolet
Chromosphere
Coronal activity, seen in visible
light
Corona
Sun Spot Regions
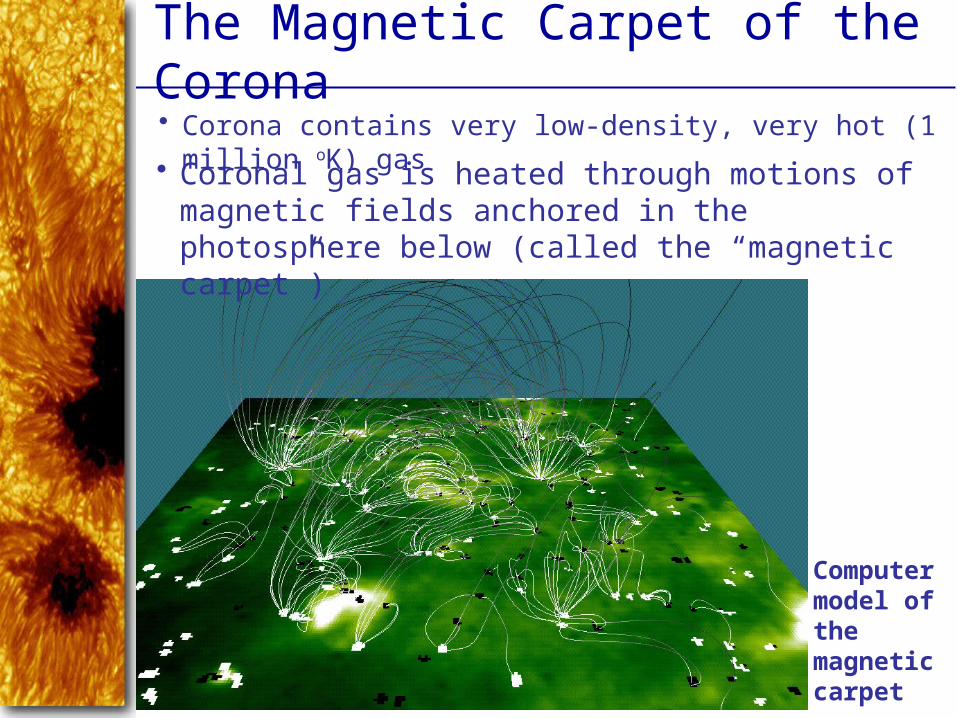
The Magnetic Carpet of the Corona• Corona contains very low-density, very hot (1 million oK) gas
• Coronal gas is heated through motions of magnetic fields anchored in the photosphere below (called the “magnetic carpet”)
Computer model of the magnetic carpet
The Solar Wind
A constant flow of particles from the sun moving away at a velocity of 300 – 800 km/s.
The Sun is constantly losing mass at a rate of 107 tons/year
(which is only 10-14 of its mass per year)

HelioseismologyThe solar interior is opaque (i.e. it absorbs light) out to the photosphere.
The only way to investigate solar interior is through Helioseismology which is analysis of vibration patterns visible on the solar surface.
There are approx. 10 million wave patterns!

Sun Spots
Cooler regions of the photosphere (T ≈ 4240 K).
Only appear dark against the bright sun. Would still be
brighter than the full moon when placed on the night sky!

Sun Spots (2)
Active Regions
Visible
Ultraviolet

Face of the Sun
Solar Activity, seen in soft X-rays
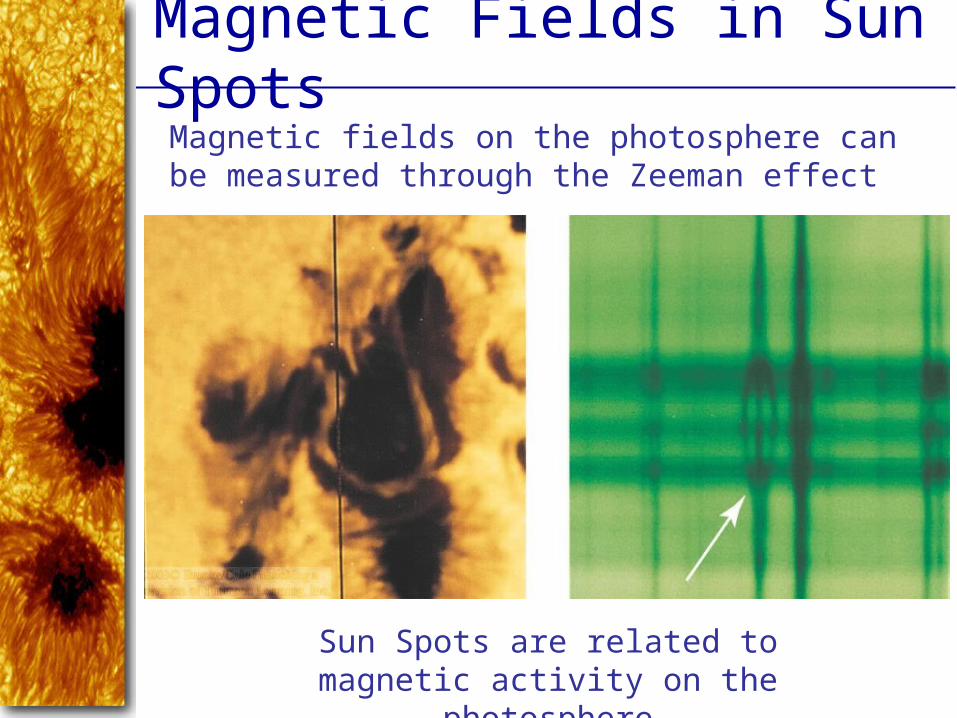
Magnetic Fields in Sun SpotsMagnetic fields on the photosphere can be measured through the Zeeman effect
Sun Spots are related to magnetic activity on the photosphere

Sun Spots (3)Magnetic field in sun spots is about 1000 times stronger than average.
In sun spots, magnetic field lines emerge out of the photosphere.
Magnetic North Poles
Magnetic South Poles

Magnetic Field Lines
Magnetic North Pole
Magnetic South Pole
Magnetic Field Lines

Star Spots?
Other stars might also have sun spot activity:
Image constructed
from changing Doppler shift
measurements

The Solar Cycle
11-year cycle
Reversal of magnetic polarity
After 11 years, North/South order of leading/trailing sun spots is reversed
Total solar cycle is 22 years
minimum maximum

The Solar Cycle (2)Maunder Butterfly Diagram
Sun spot cycle starts out with spots at higher latitudes on the sun
Sun spots progress to lower latitudes (towards the equator) throughout the cycle.

The Sun’s Magnetic Dynamo
This differential rotation might be responsible for magnetic activity of the sun.
The sun rotates faster at the equator than near the poles (25 days at equator, 27.8 days at 45˚ latitude)

Magnetic Loops
Magnetic field lines

The Sun’s Magnetic Cycle
After 11 years, the magnetic field pattern becomes so
complex that the field structure is re-arranged.
New magnetic field structure is similar to the original one,
but reversed!
New 11-year cycle starts with reversed magnetic-field
orientation

The Maunder Minimum
Historical data indicate a very quiet phase of the sun, around 1650 – 1700: The Maunder Minimum
The sun spot number also fluctuates on much longer time scales:

Magnetic Cycles on Other Stars
Two strong emission lines of
ionized calcium (H and K) from
the sun also seen from stars, which indicates
magnetic activity for other stars.

Prominences
Looped Prominences are gas ejected from the sun’s photosphere, flowing along magnetic loops
Relatively cool gas (60,000 – 80,000 oK)
May be seen as dark filaments against the bright background of
the photosphere

Eruptive Prominences
(Ultraviolet images)
Extreme events (solar flares) can significantly influence Earth’s magnetic field structure and cause northern lights (aurora borealis).

Space Weather
Solar Aurora
Sound waves
produced by a
solar flare
~ 5
min
utes
Coronal mass ejections

Coronal Holes
X-ray images of the sun reveal coronal holes.
These arise at the foot points of open field lines and are the origin of the solar wind.

Energy ProductionEnergy generation in the sun (and all other stars) is from nuclear fusion
Stars fuse together 2 or more lighter nuclei to produce heavier ones.
Nuclear fusion can produce energy up to the production of iron;
For elements heavier than iron, energy is released by nuclear fission (power plant).
Binding energy is due to strong force.
Strong force is strongest of the 4 known forces: electromagnetic, weak, strong, gravitational.

Energy Generation in the Sun: The Proton-Proton Chain
Basic reaction:4 1H 4He + energy
Four 1H (protons) have slightly more mass than one 4He (helium nucleus)
Energy gain per reaction is small, but there are many reactions.
Protons need large velocity (high temperature) to overcome
Coulomb barrier (electrostatic repulsion between protons).
Sun has 1038 reactions, transforming 5 million tons of mass into energy every second, to balance its own gravity.
Temp. greater than 10 million 0K

The Solar Neutrino ProblemThe solar interior can not be observed directly because it is highly opaque to radiation.
But neutrinos can penetrate huge amounts of material without being absorbed.
Davis solar neutrino experiment
Early solar neutrino experiments detected a much lower flux of neutrinos than expected (the “solar neutrino problem”).
Recent results have proven that neutrinos change (“oscillate”) between different types (“flavors”), thus solving the solar neutrino problem.

sunspotgranulationconvectionsupergranulelimblimb darkeningtransition regionfiltergramfilamentspiculecoronagraphmagnetic carpetsolar windhelioseismologyactive regionZeeman effectMaunder butterfly diagram
differential rotation
dynamo effectBabcock modelprominenceflarereconnectionauroracoronal holecoronal mass ejection (CME)
solar constantMaunder minimumweak forcestrong forcenuclear fissionnuclear fusionCoulomb barrierproton–proton chaindeuteriumneutrino
New Terms


