4257 Research Article Introduction Information transfer between neurons is controlled by an efficient process of regulated exocytosis of neurotransmitters stored in synaptic vesicles (SVs). In nerve terminals, SVs are organized in distinct functional pools, a large reserve pool (RP) in which SVs are restrained by the actin-based cytoskeleton, an actively recycling pool and a quantitatively smaller readily releasable pool (RRP) in which SVs are free to approach the presynaptic active zone and fuse with it upon stimulation (Rizzoli and Betz, 2005). Synapsins, a family of abundant SV- associated phosphoproteins (Greengard et al., 1993; Hilfiker et al., 1999), play a prominent role in the regulation of SV trafficking and their involvement in human pathology, namely epilepsy, has been recently recognized (Garcia et al., 2004). Synapsins regulate the pre-docking steps of exocytosis by anchoring SVs to the actin cytoskeleton and regulating their availability for exocytosis through their phosphorylation- induced dissociation from SVs and/or actin filaments (Benfenati et al., 1992a; Benfenati et al., 1992b; Ceccaldi et al., 1995; Jovanovic et al., 1996; Hosaka et al., 1999; Chi et al., 2001; Chi et al., 2003; Bonanomi et al., 2005). Moreover, synapsins have been reported to play additional roles in the later steps of neurotransmitter release, including priming and fusion (Hilfiker et al., 1998; Hilfiker et al., 2005; Humeau et al., 2001). Synapsins are encoded by three genes (SYN1, SYN2 and SYN3) in mammals (Südhof et al., 1989; Porton et al., 1999) and alternative splicing of these genes gives rise to at least eight different isoforms composed of a mosaic of individual and common domains, the latter of which (domains A, C and E) are highly conserved evolutionarily from invertebrates to man (Kao et al., 1999). In particular, the C-terminal domain E, shared by all A-type synapsin isoforms, plays a fundamental role in synapsin function. Indeed, it is implicated in both the pre-docking and the post-docking steps of synaptic vesicle exocytosis (Pieribone et al., 1995; Hilfiker et al., 1998; Hilfiker et al., 2005) and appears to be required for the correct targeting of the synapsins to synaptic vesicles (Gitler et al., 2004a). However, thus far the exact role of domain E in neuroexocytosis has never been investigated in mammalian synapses. In synapsin knockout mice epilepsy seems to be caused by a specific deficit in inhibitory transmission (Li et al., 1995; Rosahl et al., 1995; Terada et al., 1998; Gitler et al., 2004b) and domain E is deleted in the truncation mutant of synapsin I found in X-linked human epilepsy (Garcia et al., 2004), it therefore seemed important to investigate the precise role of the synapsin domain E in mammalian inhibitory synapses. To this aim, we generated cell-specific transgenic mice that Synapsins are synaptic-vesicle-associated phosphoproteins implicated in the regulation of neurotransmitter release and excitability of neuronal networks. Mutation of synapsin genes in mouse and human causes epilepsy. To understand the role of the highly conserved synapsin domain E in the dynamics of release from mammalian inhibitory neurons, we generated mice that selectively overexpress the most conserved part of this domain in cerebellar Purkinje cells. At Purkinje-cell–nuclear-neuron synapses, transgenic mice were more resistant to depression induced by short or prolonged high-frequency stimulations. The increased synaptic performance was accompanied by accelerated release kinetics and shorter synaptic delay. Despite a marked decrease in the total number of synaptic vesicles, vesicles at the active zone were preserved or slightly increased. The data indicate that synapsin domain E increases synaptic efficiency by accelerating both the kinetics of exocytosis and the rate of synaptic vesicle cycling and decreasing depression at the inhibitory Purkinje-cell–nuclear-neuron synapse. These effects may increase the sensitivity of postsynaptic neurons to inhibition and thereby contribute to the inhibitory control of network activity. Key words: Synaptic vesicle release, Exocytosis, Synapsin, Synaptic plasticity, Cerebellum, Transgenic Summary The synapsin domain E accelerates the exo- endocytotic cycle of synaptic vesicles in cerebellar Purkinje cells Anna Fassio 1 , Daniela Merlo 1, *, Jonathan Mapelli 2 , Andrea Menegon 3 , Anna Corradi 1 , Maurizio Mete 1 , Simona Zappettini 1 , Giambattista Bonanno 1,4 , Flavia Valtorta 3 , Egidio D’Angelo 2 and Fabio Benfenati 1,5,‡ 1 Center of Neuroscience and Neuroengineering, Department of Experimental Medicine, University of Genoa, Italy 2 Department of Cellular and Molecular Physiology and Pharmacology, University of Pavia, Italy 3 San Raffaele Scientific Institute, ‘Vita Salute’ University and I.I.T. Unit of Molecular Neuroscience, Milan, Italy 4 Center of Excellence for Biomedical Research, University of Genoa, Italy 5 Unit of Neuroscience, The Italian Institute of Technology, Morego Central Laboratories, Genoa, Italy *Present address: Department of Cell Biology and Neuroscience, Istituto Superiore di Sanità, Rome, Italy ‡ Author for correspondence (e-mail: [email protected]) Accepted 26 July 2006 Journal of Cell Science 119, 4257-4268 Published by The Company of Biologists 2006 doi:10.1242/jcs.03194 Journal of Cell Science
Transcript
4257Research Article
IntroductionInformation transfer between neurons is controlled by anefficient process of regulated exocytosis of neurotransmittersstored in synaptic vesicles (SVs). In nerve terminals, SVs areorganized in distinct functional pools, a large reserve pool (RP)in which SVs are restrained by the actin-based cytoskeleton, anactively recycling pool and a quantitatively smaller readilyreleasable pool (RRP) in which SVs are free to approach thepresynaptic active zone and fuse with it upon stimulation(Rizzoli and Betz, 2005). Synapsins, a family of abundant SV-associated phosphoproteins (Greengard et al., 1993; Hilfiker etal., 1999), play a prominent role in the regulation of SVtrafficking and their involvement in human pathology, namelyepilepsy, has been recently recognized (Garcia et al., 2004).Synapsins regulate the pre-docking steps of exocytosis byanchoring SVs to the actin cytoskeleton and regulating theiravailability for exocytosis through their phosphorylation-induced dissociation from SVs and/or actin filaments (Benfenatiet al., 1992a; Benfenati et al., 1992b; Ceccaldi et al., 1995;Jovanovic et al., 1996; Hosaka et al., 1999; Chi et al., 2001; Chiet al., 2003; Bonanomi et al., 2005). Moreover, synapsins havebeen reported to play additional roles in the later steps ofneurotransmitter release, including priming and fusion (Hilfikeret al., 1998; Hilfiker et al., 2005; Humeau et al., 2001).
Synapsins are encoded by three genes (SYN1, SYN2 andSYN3) in mammals (Südhof et al., 1989; Porton et al., 1999)and alternative splicing of these genes gives rise to at least eightdifferent isoforms composed of a mosaic of individual andcommon domains, the latter of which (domains A, C and E)are highly conserved evolutionarily from invertebrates to man(Kao et al., 1999). In particular, the C-terminal domain E,shared by all A-type synapsin isoforms, plays a fundamentalrole in synapsin function. Indeed, it is implicated in both thepre-docking and the post-docking steps of synaptic vesicleexocytosis (Pieribone et al., 1995; Hilfiker et al., 1998; Hilfikeret al., 2005) and appears to be required for the correct targetingof the synapsins to synaptic vesicles (Gitler et al., 2004a).However, thus far the exact role of domain E inneuroexocytosis has never been investigated in mammaliansynapses. In synapsin knockout mice epilepsy seems to becaused by a specific deficit in inhibitory transmission (Li et al.,1995; Rosahl et al., 1995; Terada et al., 1998; Gitler et al.,2004b) and domain E is deleted in the truncation mutant ofsynapsin I found in X-linked human epilepsy (Garcia et al.,2004), it therefore seemed important to investigate the preciserole of the synapsin domain E in mammalian inhibitorysynapses.
To this aim, we generated cell-specific transgenic mice that
Synapsins are synaptic-vesicle-associated phosphoproteinsimplicated in the regulation of neurotransmitter releaseand excitability of neuronal networks. Mutation ofsynapsin genes in mouse and human causes epilepsy. Tounderstand the role of the highly conserved synapsindomain E in the dynamics of release from mammalianinhibitory neurons, we generated mice that selectivelyoverexpress the most conserved part of this domain incerebellar Purkinje cells. At Purkinje-cell–nuclear-neuronsynapses, transgenic mice were more resistant todepression induced by short or prolonged high-frequencystimulations. The increased synaptic performance wasaccompanied by accelerated release kinetics and shorter
synaptic delay. Despite a marked decrease in the totalnumber of synaptic vesicles, vesicles at the active zone werepreserved or slightly increased. The data indicate thatsynapsin domain E increases synaptic efficiency byaccelerating both the kinetics of exocytosis and the rate ofsynaptic vesicle cycling and decreasing depression at theinhibitory Purkinje-cell–nuclear-neuron synapse. Theseeffects may increase the sensitivity of postsynaptic neuronsto inhibition and thereby contribute to the inhibitorycontrol of network activity.
The synapsin domain E accelerates the exo-endocytotic cycle of synaptic vesicles in cerebellarPurkinje cellsAnna Fassio1, Daniela Merlo1,*, Jonathan Mapelli2, Andrea Menegon3, Anna Corradi1, Maurizio Mete1,Simona Zappettini1, Giambattista Bonanno1,4, Flavia Valtorta3, Egidio D’Angelo2 and Fabio Benfenati1,5,‡
1Center of Neuroscience and Neuroengineering, Department of Experimental Medicine, University of Genoa, Italy2Department of Cellular and Molecular Physiology and Pharmacology, University of Pavia, Italy3San Raffaele Scientific Institute, ‘Vita Salute’ University and I.I.T. Unit of Molecular Neuroscience, Milan, Italy4Center of Excellence for Biomedical Research, University of Genoa, Italy5Unit of Neuroscience, The Italian Institute of Technology, Morego Central Laboratories, Genoa, Italy*Present address: Department of Cell Biology and Neuroscience, Istituto Superiore di Sanità, Rome, Italy‡Author for correspondence (e-mail: [email protected])
Accepted 26 July 2006Journal of Cell Science 119, 4257-4268 Published by The Company of Biologists 2006doi:10.1242/jcs.03194
Jour
nal o
f Cel
l Sci
ence
4258
selectively overexpress the most conserved part of the Edomain (pepE) in cerebellar Purkinje cells (PCs). The resultsindicate that, notwithstanding a decrease in the RP of SVs,the endogenous expression of this peptide increases theperformance of the inhibitory PC deep cerebellar nuclei(DCN) synapse by accelerating the kinetics ofneurotransmitter release and making the synapse lesssusceptible to depression.
ResultsGeneration of L7-pepE miceThe C-terminal part of the synapsin domain E is remarkablyconserved among mammalian A-type isoforms and in synapsinorthologues throughout the animal kingdom. To address thequestion of the functional role of this sequence in mammaliansynapses, we specifically overexpressed it in a single neuronalpopulation. A minigene was made by hybridization of twocomplementary oligonucleotides and cloned into the PC-specific expression vector L7�AUG. When expressed, theminigene was expected to induce a 25-mer peptide,corresponding to the last 25 residues of domain E from rat andmouse synapsins Ia (Fig. 1A). After injection of the L7-pepEconstruct into zygotes derived from the hybrid mouse strainC57Bl6�DBA2, four positive transgenic mouse lines (Tg-1 to
Journal of Cell Science 119 (20)
Tg-4) were identified by PCR analysis (Fig. 1B). Two lines(Tg-1 and Tg-2) were amplified, crossed to homozygosity andbred through at least eight generations. Reverse transcriptase(RT)-PCR analysis on total RNA extracted from cerebellum,cerebral cortex and corpus striatum demonstrated that the L7-pepE transgene was expressed only in the cerebellum of bothlines of L7-pepE transgenic mice (Fig. 1C and data not shown).Consistently, in situ hybridization experiments revealed thatthe transgene mRNA was specifically, abundantly andhomogeneously expressed in the PC layer of the cerebellarcortex (Fig. 1D). No detectable expression was observed in anyother brain region, except for the retina (not shown), and anidentical pattern of expression was observed in both Tg-1 andTg-2 mice.
Cerebellar structure and PC terminals at DCN arenormal in L7-pepE miceThe gross morphology of the brains from transgenic mice wasvirtually identical to that of their control littermates. Basichistological analysis with Nissl staining showed that thecerebellum of transgenic mice was normal in size and externalappearance with regular foliation and layering of the cerebellarcortex (Fig. 2A, panels a,b). As in control animals, PCs of L7-pepE mice specifically labelled for calbindin D-28K had a
characteristic morphology and displayed atypical dendritic tree in the molecular layer, theexpected cell-body density in the PC layer andregular projections to the DCN (Fig. 2A, panelsc-f). Thus, pepE overexpression in PCs had nodetectable effect of cerebellar structure and PCdifferentiation and maturation.
When cerebellar sections were doublestained with calbindin D-28K and anti-peptideE or anti-synapsin I antibodies, synapsinimmunoreactivity exhibited a comparable
Fig. 1. Construction and PC-specific expression ofthe L7-pepE transgene. (A) The L7-pepE transgenewas made by insertion of a synthetic mini-genecoding for the highly conserved 25 C-terminalamino acids of synapsin Ia (pepE; see box) into theL7�AUG vector. (B) PCR analysis of DNAprepared from tail biopsies revealed insertion of thetransgene in four distinct transgenic (Tg-1, Tg-2,Tg-3, Tg-4) mouse lines. WT, wild-type. (C) Theexpression of the L7-pepE transgene was assessedby RT-PCR experiments performed on total RNAprepared from the cerebella of wild-type (wt) andtwo L7-pepE (Tg-1 and Tg-2) mouse lines.Samples that were not incubated with reversetranscriptase (RT) are shown as negative controls.HPRT was used as an internal control. (D) In situhybridization was performed on sagittal (a,b) orcoronal (c-f) sections from the brains of wild-type(a,c,e) and Tg-1 (b) or Tg-2 (d,f) transgenic miceusing a 35S-labelled L7-pepE antisenseoligonucleotide probe. The hybridization signal,undetectable in wild-type sections, is intense intransgenic sections and exclusively restricted to thecerebellar cortex. At higher magnification (e,f),grains counterstained with cresyl violet areconcentrated in PC somata. Bars, 2.8 mm (a,b); 1.2mm (c,d); 100 �m (e,f).
Jour
nal o
f Cel
l Sci
ence
4259Synapsin domain E accelerates vesicle cycle
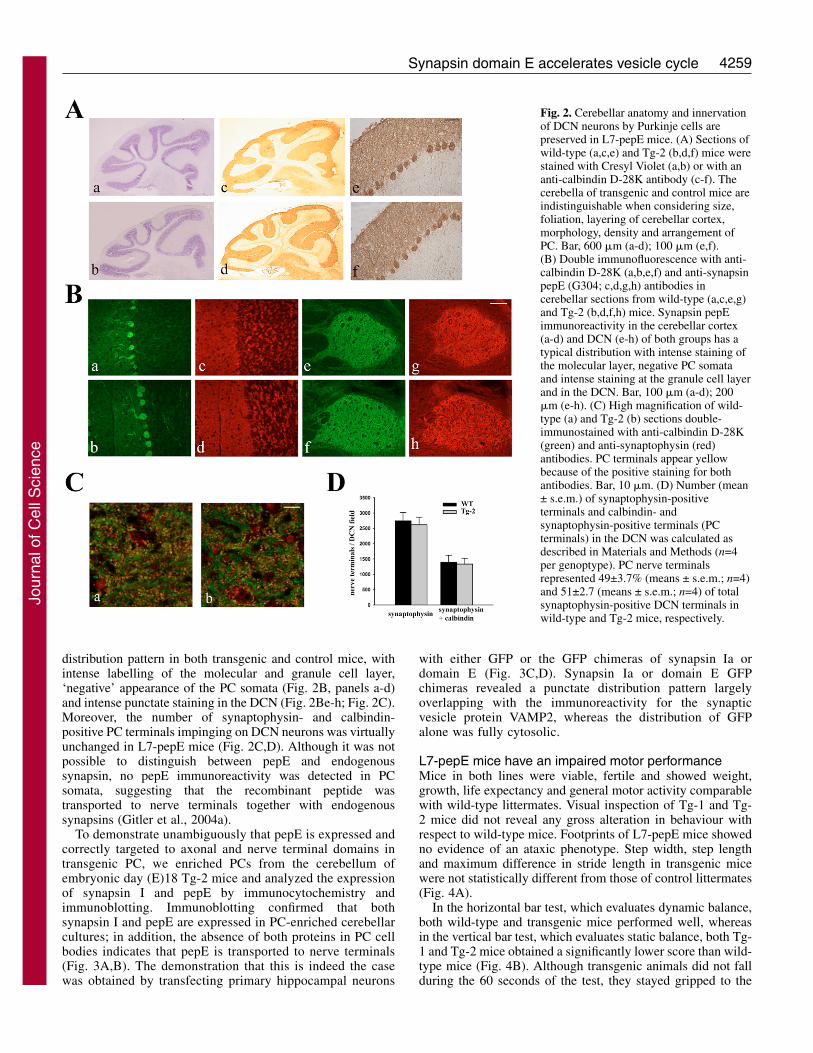
distribution pattern in both transgenic and control mice, withintense labelling of the molecular and granule cell layer,‘negative’ appearance of the PC somata (Fig. 2B, panels a-d)and intense punctate staining in the DCN (Fig. 2Be-h; Fig. 2C).Moreover, the number of synaptophysin- and calbindin-positive PC terminals impinging on DCN neurons was virtuallyunchanged in L7-pepE mice (Fig. 2C,D). Although it was notpossible to distinguish between pepE and endogenoussynapsin, no pepE immunoreactivity was detected in PCsomata, suggesting that the recombinant peptide wastransported to nerve terminals together with endogenoussynapsins (Gitler et al., 2004a).
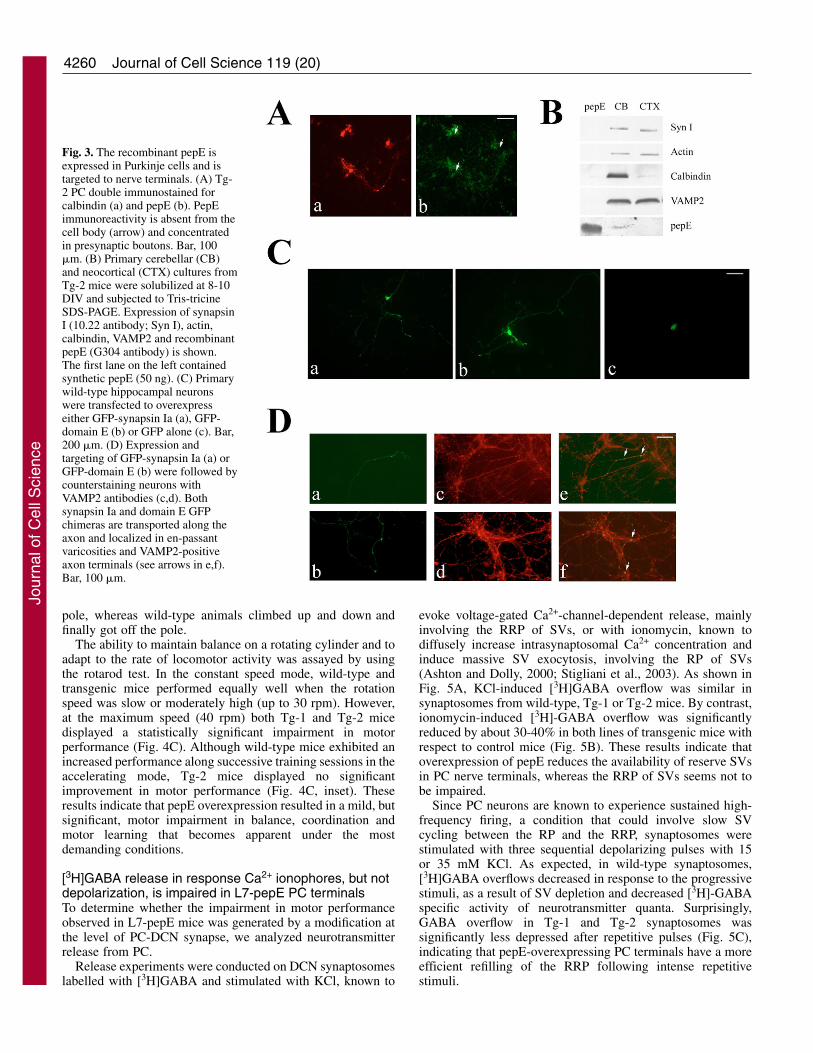
To demonstrate unambiguously that pepE is expressed andcorrectly targeted to axonal and nerve terminal domains intransgenic PC, we enriched PCs from the cerebellum ofembryonic day (E)18 Tg-2 mice and analyzed the expressionof synapsin I and pepE by immunocytochemistry andimmunoblotting. Immunoblotting confirmed that bothsynapsin I and pepE are expressed in PC-enriched cerebellarcultures; in addition, the absence of both proteins in PC cellbodies indicates that pepE is transported to nerve terminals(Fig. 3A,B). The demonstration that this is indeed the casewas obtained by transfecting primary hippocampal neurons
with either GFP or the GFP chimeras of synapsin Ia ordomain E (Fig. 3C,D). Synapsin Ia or domain E GFPchimeras revealed a punctate distribution pattern largelyoverlapping with the immunoreactivity for the synapticvesicle protein VAMP2, whereas the distribution of GFPalone was fully cytosolic.
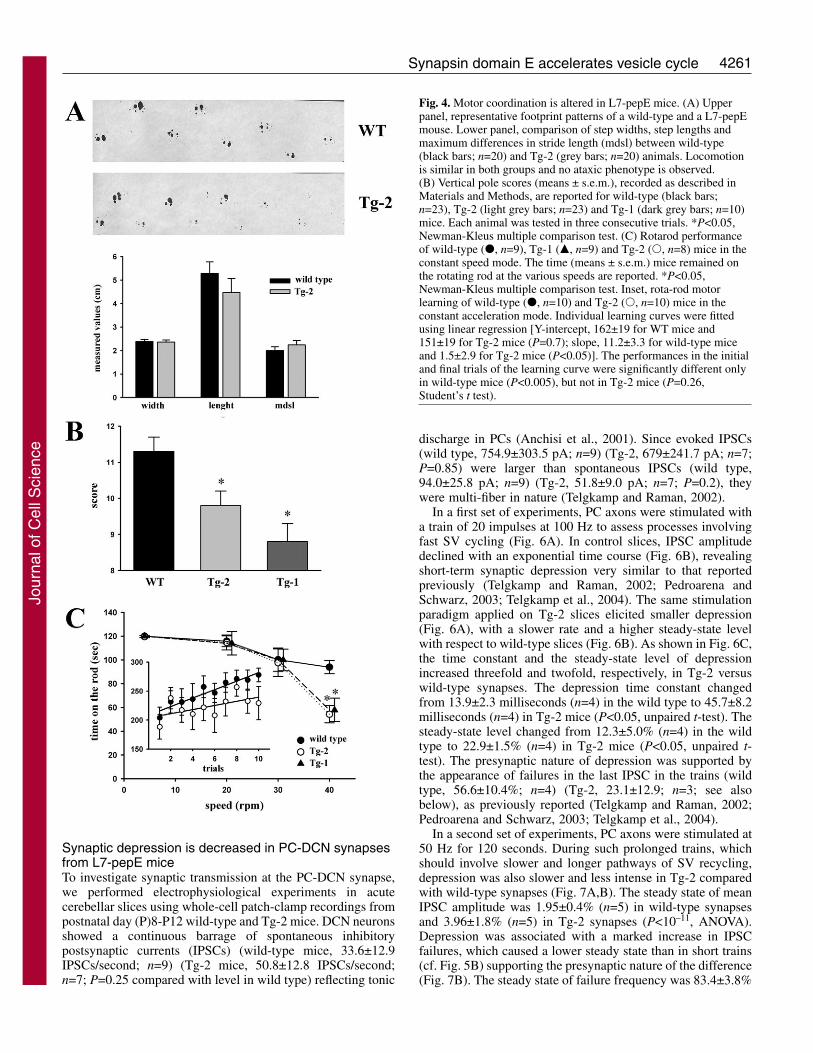
L7-pepE mice have an impaired motor performanceMice in both lines were viable, fertile and showed weight,growth, life expectancy and general motor activity comparablewith wild-type littermates. Visual inspection of Tg-1 and Tg-2 mice did not reveal any gross alteration in behaviour withrespect to wild-type mice. Footprints of L7-pepE mice showedno evidence of an ataxic phenotype. Step width, step lengthand maximum difference in stride length in transgenic micewere not statistically different from those of control littermates(Fig. 4A).
In the horizontal bar test, which evaluates dynamic balance,both wild-type and transgenic mice performed well, whereasin the vertical bar test, which evaluates static balance, both Tg-1 and Tg-2 mice obtained a significantly lower score than wild-type mice (Fig. 4B). Although transgenic animals did not fallduring the 60 seconds of the test, they stayed gripped to the
Fig. 2. Cerebellar anatomy and innervationof DCN neurons by Purkinje cells arepreserved in L7-pepE mice. (A) Sections ofwild-type (a,c,e) and Tg-2 (b,d,f) mice werestained with Cresyl Violet (a,b) or with ananti-calbindin D-28K antibody (c-f). Thecerebella of transgenic and control mice areindistinguishable when considering size,foliation, layering of cerebellar cortex,morphology, density and arrangement ofPC. Bar, 600 �m (a-d); 100 �m (e,f).(B) Double immunofluorescence with anti-calbindin D-28K (a,b,e,f) and anti-synapsinpepE (G304; c,d,g,h) antibodies incerebellar sections from wild-type (a,c,e,g)and Tg-2 (b,d,f,h) mice. Synapsin pepEimmunoreactivity in the cerebellar cortex(a-d) and DCN (e-h) of both groups has atypical distribution with intense staining ofthe molecular layer, negative PC somataand intense staining at the granule cell layerand in the DCN. Bar, 100 �m (a-d); 200�m (e-h). (C) High magnification of wild-type (a) and Tg-2 (b) sections double-immunostained with anti-calbindin D-28K(green) and anti-synaptophysin (red)antibodies. PC terminals appear yellowbecause of the positive staining for bothantibodies. Bar, 10 �m. (D) Number (mean± s.e.m.) of synaptophysin-positiveterminals and calbindin- andsynaptophysin-positive terminals (PCterminals) in the DCN was calculated asdescribed in Materials and Methods (n=4per genoptype). PC nerve terminalsrepresented 49±3.7% (means ± s.e.m.; n=4)and 51±2.7 (means ± s.e.m.; n=4) of totalsynaptophysin-positive DCN terminals inwild-type and Tg-2 mice, respectively.
Jour
nal o
f Cel
l Sci
ence
4260
pole, whereas wild-type animals climbed up and down andfinally got off the pole.
The ability to maintain balance on a rotating cylinder and toadapt to the rate of locomotor activity was assayed by usingthe rotarod test. In the constant speed mode, wild-type andtransgenic mice performed equally well when the rotationspeed was slow or moderately high (up to 30 rpm). However,at the maximum speed (40 rpm) both Tg-1 and Tg-2 micedisplayed a statistically significant impairment in motorperformance (Fig. 4C). Although wild-type mice exhibited anincreased performance along successive training sessions in theaccelerating mode, Tg-2 mice displayed no significantimprovement in motor performance (Fig. 4C, inset). Theseresults indicate that pepE overexpression resulted in a mild, butsignificant, motor impairment in balance, coordination andmotor learning that becomes apparent under the mostdemanding conditions.
[3H]GABA release in response Ca2+ ionophores, but notdepolarization, is impaired in L7-pepE PC terminalsTo determine whether the impairment in motor performanceobserved in L7-pepE mice was generated by a modification atthe level of PC-DCN synapse, we analyzed neurotransmitterrelease from PC.
Release experiments were conducted on DCN synaptosomeslabelled with [3H]GABA and stimulated with KCl, known to
evoke voltage-gated Ca2+-channel-dependent release, mainlyinvolving the RRP of SVs, or with ionomycin, known todiffusely increase intrasynaptosomal Ca2+ concentration andinduce massive SV exocytosis, involving the RP of SVs(Ashton and Dolly, 2000; Stigliani et al., 2003). As shown inFig. 5A, KCl-induced [3H]GABA overflow was similar insynaptosomes from wild-type, Tg-1 or Tg-2 mice. By contrast,ionomycin-induced [3H]-GABA overflow was significantlyreduced by about 30-40% in both lines of transgenic mice withrespect to control mice (Fig. 5B). These results indicate thatoverexpression of pepE reduces the availability of reserve SVsin PC nerve terminals, whereas the RRP of SVs seems not tobe impaired.
Since PC neurons are known to experience sustained high-frequency firing, a condition that could involve slow SVcycling between the RP and the RRP, synaptosomes werestimulated with three sequential depolarizing pulses with 15or 35 mM KCl. As expected, in wild-type synaptosomes,[3H]GABA overflows decreased in response to the progressivestimuli, as a result of SV depletion and decreased [3H]-GABAspecific activity of neurotransmitter quanta. Surprisingly,GABA overflow in Tg-1 and Tg-2 synaptosomes wassignificantly less depressed after repetitive pulses (Fig. 5C),indicating that pepE-overexpressing PC terminals have a moreefficient refilling of the RRP following intense repetitivestimuli.
Journal of Cell Science 119 (20)
Fig. 3. The recombinant pepE isexpressed in Purkinje cells and istargeted to nerve terminals. (A) Tg-2 PC double immunostained forcalbindin (a) and pepE (b). PepEimmunoreactivity is absent from thecell body (arrow) and concentratedin presynaptic boutons. Bar, 100�m. (B) Primary cerebellar (CB)and neocortical (CTX) cultures fromTg-2 mice were solubilized at 8-10DIV and subjected to Tris-tricineSDS-PAGE. Expression of synapsinI (10.22 antibody; Syn I), actin,calbindin, VAMP2 and recombinantpepE (G304 antibody) is shown.The first lane on the left containedsynthetic pepE (50 ng). (C) Primarywild-type hippocampal neuronswere transfected to overexpresseither GFP-synapsin Ia (a), GFP-domain E (b) or GFP alone (c). Bar,200 �m. (D) Expression andtargeting of GFP-synapsin Ia (a) orGFP-domain E (b) were followed bycounterstaining neurons withVAMP2 antibodies (c,d). Bothsynapsin Ia and domain E GFPchimeras are transported along theaxon and localized in en-passantvaricosities and VAMP2-positiveaxon terminals (see arrows in e,f).Bar, 100 �m.
Jour
nal o
f Cel
l Sci
ence
4261Synapsin domain E accelerates vesicle cycle
Synaptic depression is decreased in PC-DCN synapsesfrom L7-pepE miceTo investigate synaptic transmission at the PC-DCN synapse,we performed electrophysiological experiments in acutecerebellar slices using whole-cell patch-clamp recordings frompostnatal day (P)8-P12 wild-type and Tg-2 mice. DCN neuronsshowed a continuous barrage of spontaneous inhibitorypostsynaptic currents (IPSCs) (wild-type mice, 33.6±12.9IPSCs/second; n=9) (Tg-2 mice, 50.8±12.8 IPSCs/second;n=7; P=0.25 compared with level in wild type) reflecting tonic
discharge in PCs (Anchisi et al., 2001). Since evoked IPSCs(wild type, 754.9±303.5 pA; n=9) (Tg-2, 679±241.7 pA; n=7;P=0.85) were larger than spontaneous IPSCs (wild type,94.0±25.8 pA; n=9) (Tg-2, 51.8±9.0 pA; n=7; P=0.2), theywere multi-fiber in nature (Telgkamp and Raman, 2002).
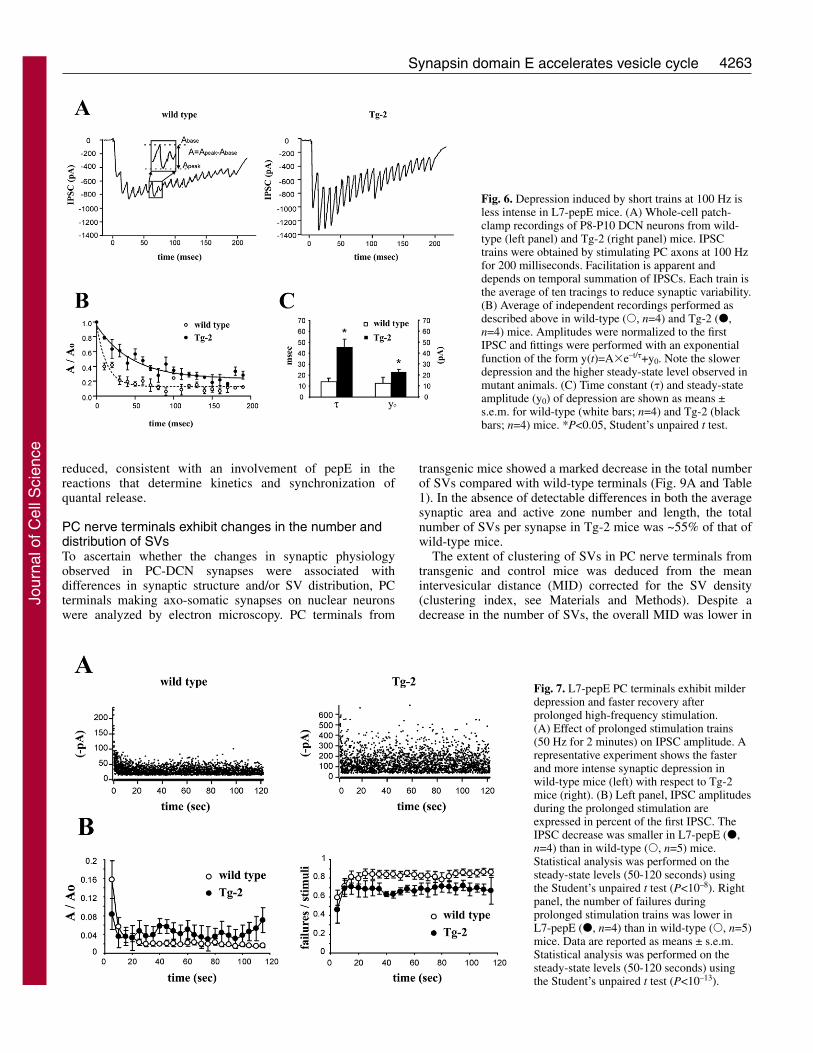
In a first set of experiments, PC axons were stimulated witha train of 20 impulses at 100 Hz to assess processes involvingfast SV cycling (Fig. 6A). In control slices, IPSC amplitudedeclined with an exponential time course (Fig. 6B), revealingshort-term synaptic depression very similar to that reportedpreviously (Telgkamp and Raman, 2002; Pedroarena andSchwarz, 2003; Telgkamp et al., 2004). The same stimulationparadigm applied on Tg-2 slices elicited smaller depression(Fig. 6A), with a slower rate and a higher steady-state levelwith respect to wild-type slices (Fig. 6B). As shown in Fig. 6C,the time constant and the steady-state level of depressionincreased threefold and twofold, respectively, in Tg-2 versuswild-type synapses. The depression time constant changedfrom 13.9±2.3 milliseconds (n=4) in the wild type to 45.7±8.2milliseconds (n=4) in Tg-2 mice (P<0.05, unpaired t-test). Thesteady-state level changed from 12.3±5.0% (n=4) in the wildtype to 22.9±1.5% (n=4) in Tg-2 mice (P<0.05, unpaired t-test). The presynaptic nature of depression was supported bythe appearance of failures in the last IPSC in the trains (wildtype, 56.6±10.4%; n=4) (Tg-2, 23.1±12.9; n=3; see alsobelow), as previously reported (Telgkamp and Raman, 2002;Pedroarena and Schwarz, 2003; Telgkamp et al., 2004).
In a second set of experiments, PC axons were stimulated at50 Hz for 120 seconds. During such prolonged trains, whichshould involve slower and longer pathways of SV recycling,depression was also slower and less intense in Tg-2 comparedwith wild-type synapses (Fig. 7A,B). The steady state of meanIPSC amplitude was 1.95±0.4% (n=5) in wild-type synapsesand 3.96±1.8% (n=5) in Tg-2 synapses (P<10–11, ANOVA).Depression was associated with a marked increase in IPSCfailures, which caused a lower steady state than in short trains(cf. Fig. 5B) supporting the presynaptic nature of the difference(Fig. 7B). The steady state of failure frequency was 83.4±3.8%
Fig. 4. Motor coordination is altered in L7-pepE mice. (A) Upperpanel, representative footprint patterns of a wild-type and a L7-pepEmouse. Lower panel, comparison of step widths, step lengths andmaximum differences in stride length (mdsl) between wild-type(black bars; n=20) and Tg-2 (grey bars; n=20) animals. Locomotionis similar in both groups and no ataxic phenotype is observed.(B) Vertical pole scores (means ± s.e.m.), recorded as described inMaterials and Methods, are reported for wild-type (black bars;n=23), Tg-2 (light grey bars; n=23) and Tg-1 (dark grey bars; n=10)mice. Each animal was tested in three consecutive trials. *P<0.05,Newman-Kleus multiple comparison test. (C) Rotarod performanceof wild-type (�, n=9), Tg-1 (�, n=9) and Tg-2 (�, n=8) mice in theconstant speed mode. The time (means ± s.e.m.) mice remained onthe rotating rod at the various speeds are reported. *P<0.05,Newman-Kleus multiple comparison test. Inset, rota-rod motorlearning of wild-type (�, n=10) and Tg-2 (�, n=10) mice in theconstant acceleration mode. Individual learning curves were fittedusing linear regression [Y-intercept, 162±19 for WT mice and151±19 for Tg-2 mice (P=0.7); slope, 11.2±3.3 for wild-type miceand 1.5±2.9 for Tg-2 mice (P<0.05)]. The performances in the initialand final trials of the learning curve were significantly different onlyin wild-type mice (P<0.005), but not in Tg-2 mice (P=0.26,Student’s t test).
Jour
nal o
f Cel
l Sci
ence
4262
(n=5) in wild-type and 69.0±3.9% (n=5) in Tg-2 synapses(P<10–7 using �2 test).
It should be noted that in these experiments DCN neurons
were maintained at negative membrane potential. Under theseconditions, the previously reported forms of long-term synapticplasticity of the PC-DCN synapse (Morishita and Sastry, 1996;Ouardouz and Sastry, 2000; Aizenmann et al., 1998) werevery unlikely to occur because they require membranedepolarization. Moreover, to rule out the possibility that pepEoverexpression affects PC spike firing, PC recordingsperformed at P15 revealed comparable spontaneous PCdischarge frequencies in wild-type (5.05±0.67 Hz; n=12) andTg-2 L7-pepE (5.22±0.40 Hz; n=14) slices (P=0.83, unpairedStudent’s t-test).
The kinetics of GABA release from L7-pepE PCterminals is acceleratedA further indication for a role of pepE in the regulation of RRPdynamics came from measurements of the time course ofsingle IPSCs and of the synaptic delay in PC-DCN synapsesof wild-type and Tg-2 mice. As shown in Fig. 8A,C, the IPSCrise and decay times were significantly reduced in transgenicnerve terminals (wild type rise time, 1.5±0.2 milliseconds;n=9; decay time, 17.4±3.0 milliseconds; n=7) (Tg-2 rise time,1.0±0.1 milliseconds; n=7; P<0.05; decay time, 9.6±0.9milliseconds; n=7; P<0.05). Moreover, the synaptic delay wassignificantly shorter in Tg-2 (1.4±0.1 milliseconds; n=7)compared with wild-type synapses (1.9±0.2 milliseconds;n=9; P<0.05). The large and consistent differences in synapticdelay (about 500 �seconds) observed between wild-type andTg-2 mice are unlikely to be attributable to changes in thedistance between stimulating and recording electrodes, sincethe stimulating electrode was always placed within 100±20�m from recorded DCN cells and, with an estimatedconduction velocity of PC axons of 0.7 m/second (Clark et al.,2005), the jitter of delay would be only ±28 �seconds.Although the possibility of different conduction velocity oraxon tortuosity cannot be excluded, no changes in synapticmorphology supporting a longer or slower diffusion of GABAwere detected in transgenic mice (see Fig. 2C and Table 1).These data imply that the time needed to release a SV is
Journal of Cell Science 119 (20)
Fig. 5. [3H]-GABA release from L7-pepE DCN synaptosomes isimpaired in response to ionomycin, but it is more efficient afterrepetitive depolarization. (A) DCN synaptosomes from wild-type(black bars), Tg-1 (light grey bars) and Tg-2 (dark grey bars) weredepolarized with 12, 15 or 35 mM KCl. Results are expressed asstimulus-evoked overflow, means ± s.e.m. of 5-10 independentexperiments. (B) DCN synaptosomes from wild-type, Tg-1 and Tg-2mice were treated as in A, except that [3H]-GABA release wasinduced by 0.5 �M ionomycin. Bars are means ± s.e.m. of 6-8independent experiments. *P<0.05, Dunnett’s multiple comparisontest vs wild-type. (C) DCN synaptosomes from wild-type (�), Tg-1(�) and Tg-2 (�) mice were treated as in A and subjected to threesequential depolarizing pulses with either 15 mM (left panel) or 35mM (right panel) KCl. [3H]-GABA release evoked by each pulse isexpressed in percent of the release evoked by the first stimulus(means ± s.e.m. of four to five independent experiments). *P<0.05and **P<0.001, one way ANOVA followed by Duncan’s multiplecomparison test.
Table 1. Morphometric analysis of PC terminalultrastructure
Wild type TransgenicParameter (n=3) (n=3)
Synapse area (�m2) 1.14±0.10 1.13±0.09NS
AZ length (�m) 0.43±0.03 0.44±0.02NS
SV/synapse 153±10 88±6**SV<200 nm from AZ or synapse 19.1±1.3 22.8±3.2NS
SV>200 nm from AZ or synapse 134±10 65±3***Mean distance from AZ 658±48 431±18**SV<200 nm from AZ 122±3 116±4NS
SV>200 nm from AZ 732±47 549±13*Mean intervesicular distance 771±51 650±26NS
Mean clustering index 0.88±0.05 1.05±0.01*
Parameters (means ± s.e.m.) were calculated from the EM images of 60and 54 synapses from three wild-type and three Tg-2 mice, respectively.Individual PC-DCN synapses were analyzed as described in Materials andMethods to give mean individual values. Statistical analysis was performedusing the unpaired Student’s t-test. *P<0.05; **P<0.01; ***P<0.0005; NS,not significant. AZ, active zone; SV, synaptic vesicles. The clustering indexwas calculated, for each synapse, as the ratio between the predictedintervesicular distance for a homogeneously distributed vesicle populationand the measured intervesicular distance.
Jour
nal o
f Cel
l Sci
ence
4263Synapsin domain E accelerates vesicle cycle
reduced, consistent with an involvement of pepE in thereactions that determine kinetics and synchronization ofquantal release.
PC nerve terminals exhibit changes in the number anddistribution of SVsTo ascertain whether the changes in synaptic physiologyobserved in PC-DCN synapses were associated withdifferences in synaptic structure and/or SV distribution, PCterminals making axo-somatic synapses on nuclear neuronswere analyzed by electron microscopy. PC terminals from
transgenic mice showed a marked decrease in the total numberof SVs compared with wild-type terminals (Fig. 9A and Table1). In the absence of detectable differences in both the averagesynaptic area and active zone number and length, the totalnumber of SVs per synapse in Tg-2 mice was ~55% of that ofwild-type mice.
The extent of clustering of SVs in PC nerve terminals fromtransgenic and control mice was deduced from the meanintervesicular distance (MID) corrected for the SV density(clustering index, see Materials and Methods). Despite adecrease in the number of SVs, the overall MID was lower in
Fig. 6. Depression induced by short trains at 100 Hz isless intense in L7-pepE mice. (A) Whole-cell patch-clamp recordings of P8-P10 DCN neurons from wild-type (left panel) and Tg-2 (right panel) mice. IPSCtrains were obtained by stimulating PC axons at 100 Hzfor 200 milliseconds. Facilitation is apparent anddepends on temporal summation of IPSCs. Each train isthe average of ten tracings to reduce synaptic variability.(B) Average of independent recordings performed asdescribed above in wild-type (�, n=4) and Tg-2 (�,n=4) mice. Amplitudes were normalized to the firstIPSC and fittings were performed with an exponentialfunction of the form y(t)=A�e–t/�+y0. Note the slowerdepression and the higher steady-state level observed inmutant animals. (C) Time constant (�) and steady-stateamplitude (y0) of depression are shown as means ±s.e.m. for wild-type (white bars; n=4) and Tg-2 (blackbars; n=4) mice. *P<0.05, Student’s unpaired t test.
Fig. 7. L7-pepE PC terminals exhibit milderdepression and faster recovery afterprolonged high-frequency stimulation.(A) Effect of prolonged stimulation trains(50 Hz for 2 minutes) on IPSC amplitude. Arepresentative experiment shows the fasterand more intense synaptic depression inwild-type mice (left) with respect to Tg-2mice (right). (B) Left panel, IPSC amplitudesduring the prolonged stimulation areexpressed in percent of the first IPSC. TheIPSC decrease was smaller in L7-pepE (�,n=4) than in wild-type (�, n=5) mice.Statistical analysis was performed on thesteady-state levels (50-120 seconds) usingthe Student’s unpaired t test (P<10–8). Rightpanel, the number of failures duringprolonged stimulation trains was lower inL7-pepE (�, n=4) than in wild-type (�, n=5)mice. Data are reported as means ± s.e.m.Statistical analysis was performed on thesteady-state levels (50-120 seconds) usingthe Student’s unpaired t test (P<10–13).
Jour
nal o
f Cel
l Sci
ence
4264
transgenic mice, resulting in a significantly higher clusteringindex with respect to wild-type mice (Table 1). In addition, SVswere more concentrated in proximal shells, as shown by asignificant decrease in the mean distance from the active zone(Table 1 and inset of Fig. 9B).
A detailed morphometric analysis of SV distribution withinPC terminals (Fig. 9B) indicated that the decrease in SVdensity was highly significant at distances between 400 and1400 nm from the active zone. These data are consistent withprevious results obtained after injection of pepE in invertebrateexcitatory synapses and can explain the decreased response inGABA release to ionomycin observed in transgenic animals.Interestingly, SVs within 200 nm of the active zone were totallypreserved or even slightly increased, reaching significance(P<0.05) in the 50-100 nm shell.
DiscussionTo investigate the functional role of the highly conserveddomain E of synapsin in a central inhibitory synapse, weselectively overexpressed the most conserved sequence of thedomain in cerebellar PC in two independent transgenic lines.The recombinant peptide was expressed at detectable levels,was virtually absent from PC somata and was correctly targetedto nerve terminals in the presence of endogenous synapsins,consistent with a positive role of this domain in synapsintargeting to nerve terminals (Gitler et al., 2004a). Despite an
Journal of Cell Science 119 (20)
Fig. 8. The kinetics of release is faster in L7-pepE mice.(A) Representative IPSCs recorded from DCN neurons from wild-type and Tg-2 mice. IPSC traces were normalized to identical peakamplitudes. (B) Representative IPSCs recorded from PC-DCNsynapses showing the shortening of the synaptic delay in IPSC in Tg-2 mice with respect to wild-type mice. (C) The histogram shows themean values (± s.e.m.) for IPSC rise, decay and delay times obtainedfrom wild-type (white bars; n=9) and Tg-2 (black bars; n=7) mice.IPSC rise time was measured as the time needed to rise from 10% to90% of peak amplitude. IPSC decay time was evaluated byexponential fitting of the decay with the exponential functiony(t)=A�e–t/�. Statistical analysis was performed using the Student’sunpaired t test; *P<0.05.
Fig. 9. SV density and distribution isaltered in L7-pepE mice.(A) Representative electron micrographsof PC terminals on DCN somata fromwild-type (WT, left panel) and Tg-2(right panel) mice. Bar, 1 �m. (B)Distribution of SVs in PC terminals fromwild-type (black bars; n=60) and Tg-2(grey bars; n=54) mice. The absolutenumber of SVs (means ± s.e.m.) locatedwithin successive 50 nm shells from theactive zone (AZ) is shown. Thefrequency distribution of SVs as afunction of the distance from the AZ wasanalyzed using the Kolgomorov-Smirnovand Mann-Whitney tests; P<0.05 for the50-100 nm shell; P<0.01 for the intervalsbetween 400 and 1400 nm. Inset, toanalyze the distribution pattern of SVs,the number of SVs in the various shellswas expressed in percent of the total SVnumber for each PC terminal of wild-type (WT, upper panel) and Tg-2 (lowerpanel) mice. The solid traces and dottedlines represent the mean and s.e.m.values, respectively.
Jour
nal o
f Cel
l Sci
ence
4265Synapsin domain E accelerates vesicle cycle
impaired motor performance, transgenic mice had a normalcerebellar structure, PC morphology and density of PCterminals onto DCN neurons. Interestingly, PC terminals ofL7-pepE mice displayed an accelerated kinetics of exocytosisand a marked resistance to depression evoked by high-frequency stimulation. This increased synaptic performancewas associated with a marked decrease in the number of SVsaway from the active zone, whereas SVs close to the activezone were preserved or slightly increased.
The phenotype of L7-pepE mice points to a specific role ofthe synapsin domain E in the regulation of SV trafficking atboth pre- and post-docking steps, involving both the RP andthe RRP of SVs. In both the squid giant synapse (Hilfiker etal., 1998) and mammalian PC-DCN synapses (this study),overexpression of pepE induced a marked depletion of SVs inthe RP, leaving the RRP virtually unaffected. This effect is inagreement with the inhibition of the actin and synapsininteractions by pepE recently reported by our laboratory(Hilfiker et al., 2005), which might induce induce loss of SVsbound to the actin cytoskeleton.
On the other hand, the acceleration of SV cycling and thekinetics of SV fusion found in the PC-DCN synapses isopposite to that observed in the squid giant synapse. Althoughthese observations strengthen a central role of domain E in thepostdocking steps of neurotransmitter release, they reveal amore complex role of domain E in mammalian centralinhibitory synapses. Thus, it is possible that pepE acceleratesSV cycling within the RRP by interfering with the interactionsof SV-associated synapsins with the actin-rich cytomatrix ofthe active and periactive zones (Bloom et al., 2003; Hilfiker etal., 2005), which, in mammalian synapses, might slow downSV cycling. This interpretation is supported by the observationthat, in hippocampal nerve terminals, the disruption of the actincytoskeleton resulted in both synapsin dispersion and fasterSV cycling (Sankaranarayanan et al., 2003). However, thepossibility that that peptide E interferes with a synapsininteractor that negatively regulates the rate of release cannot beexcluded. Interestingly, the C-terminal region of synapsin hasbeen reported to interact with Rab3A, a SV-associated GTPaseregulating the final steps of release (Geppert et al., 1997;Giovedì et al., 2004a; Giovedì et al., 2004b; Schluter et al.,2006).
The phenotype of L7-pepE mice also confirms that therelative functional importance of the RP and RRP of SVs insustaining release varies between neurons with differentpatterns of electrical activity. During short high-frequencytrains that are likely to involve ‘kiss-and-run’ mechanisms andfast SV recycling pathways (Valtorta et al., 2001), mutant miceshowed both a lower depression rate and a higher steady-stateresponse than wild-type mice. Although the former effectmight reflect lower release probability, this would imply nochange in the steady-state level (Brenowitz and Trussell, 2001).The concomitant higher steady state observed suggests that thelower depression is due to an acceleration of SV cycling thatallows faster refilling and slower depletion of the RRP.
It has been recently reported that mice lacking all synapsinisoforms have distinct deficits in excitatory and inhibitorysynapses. Thus, glutamatergic terminals display normal releaseevoked by single stimuli and enhanced depression, whereasGABAergic terminals exhibit a decreased release in responseto single stimuli and no effect on depression (Gitler et al.,
2004b). Indeed, the recycling capacity of the RRP tends to beadapted to the activity pattern and is higher in terminalsundergoing tonic high-frequency activity than in terminalsexperiencing infrequent phasic activation. Although the latterterminals take advantage of a large RP during bursting activity,the former have to rely on efficient recycling mechanisms (forreviews, see Brodin et al., 1997; Rizzoli and Betz, 2005). Invivo, PC neurons typically discharge at high frequencies(Thach, 1968; Thach, 1970; McDevitt et al., 1987). Thus,because of the very high basal firing rate, PCs are likely to relypredominantly on efficient recycling of the RRP rather than onSV recruitment from the RP. This is also suggested by thesimilar lower depression found in mutant mice during bothshort and sustained high-frequency trains, in the presence of asubstantial depletion of the RP. Such RP depletion becomesapparent only under conditions of massive exocytosis thatrelease SV from all nerve-terminal pools.
The data presented here demonstrate that overexpression ofdomain E increases synaptic strength at PC-DCN inhibitorysynapses and participates in the motor behaviour phenotypeobserved in transgenic mice. These results might haveimportant implications as to the role of synapsins in theregulation of central inhibitory synapses and networkexcitability. Synapsin knockout mice display a strong epilepticphenotype attributable to a specific deficit in inhibitorytransmission (Terada et al., 1999; Gitler et al., 2004b).Moreover, the recently reported X-linked human epilepsyassociated with a non-sense mutation of the SYN1 geneinvolves a truncation of the synapsin I C-terminal region thatincludes domain E (Garcia et al., 2004). It is tempting tospeculate that the absence of this domain plays a crucial rolein the impairment of synaptic inhibition leading to epileptiformactivity.
Materials and MethodsGeneration of L7-pepE miceA minigene (PepE) was made by hybridization of two complementaryoligonucleotides producing a double stranded product with 5� overhangscompatible with BamHI restriction sites and coding for the last 25 residues of therat synapsin Ia domain E. The sequences of the two oligonucleotides are as follows:PepE sense, 5�-GATCCGCCACCATGAGCCTGAGCCAGGACGAGGTGAAGG-CCGAGACCATCAGAAGCCTGAGAAAGAGCTTCGCCAGCCTGTTCAGCG-ACTAAG-3�; PepE antisense, 5�-ATCCTTAGTCGCTGAACAGGCTGGCGA-AGCTCTTTCTCAGGCTTCTGATGGTCTCGGCCTTCACCTCGTCCTGGCTC-AGGCTCATGGTGGCG-3�. The L7-pepE vector was constructed by inserting thisfragment into the BamHI site of pL7DAUG in which all the potential start codonswere eliminated (De Zeeuw et al., 1998; Zhang et al., 2002). Thus, translation couldonly be initiated from the start codon provided within the inserted minigene, whichwas optimized with a Kozak sequence for efficient translation in mammalian cells(Kozak, 1986). The L7-PepE transgene, digested with HindIII/EcoRI, was injectedinto fertilized mouse eggs. Four positive transgenic lines were identified by PCRanalysis and two of them (Tg-1 and Tg-2) were crossed to homozygosity. All animalprocedures were approved by the Animal Care Committee of the University ofGenova and by the Italian Ministry of Health.
RT-PCR analysisRNA was extracted from brain tissue using TRI Reagent (Sigma). Reversetranscription was conducted with random examers and SuperScript II Reversetranscriptase (Invitrogen) as described previously (Corradi et al., 2003). Primers(forward, 5�-CAGGCCAGAACCCAGAAAG-3�; reverse, 5�-ATCCTTAGTCGC-TGAACAGG-3�) specific for the cDNA region encoding the L7-PepE were usedfor PCR amplification. Hypoxanthine guanine phosphoribosyltransferase (HPRT)primers used for normalization were 5�-TCCCTGGTTAAGCAGTACAG-3�(forward) and 5�-GACGCAGCAACTGACATTTC-3� (reverse).
In situ hybridizationAntisense oligonucleotides of 45 or 30 bases in length specific for the cDNA regionencoding the L7-PepE were labelled at the 3� end using [35S]ATP (Amersham) and
Jour
nal o
f Cel
l Sci
ence
4266
terminal deoxynucleotidyl transferase (Roche). The hybridization of brain cryostatsections (14 �m thick) was carried out as previously described (Zoli et al., 1995).Briefly, sections were fixed with 4% paraformaldehyde (PFA), washed in 0.1Mphosphate-buffered saline (PBS), acetylated and delipidated in ethanol andchloroform. After a 3 hour prehybridization in 0.6 M NaCl, 0.01 M dithiothreitol,0.1 M Tris-HCl (pH 7.4), 0.05 M EDTA, 5% Denhardt’s solution, 1 mg/ml Poly(A)(Roche), 10 mg/ml t-RNA, 1 mg/ml herring sperm DNA (Promega), 50%formamide at 37°C, sections were hybridized for 20 hours at 37°C with the labelledoligonucleotides. Sections were washed twice in 2� standard citrate solution (SSC,3 M NaCl, 0.3 M sodium citrate) at room temperature, four times in 2� SSC at 54or 48°C and twice in 1� SSC at room temperature. Sodium thiosulfate (63 mM)and �-mercaptoethanol (14.3 mM) were added to all washing solutions. Afterrinsing in ice-cold distilled water and drying, sections were first exposed to low-resolution autoradiographic film (Amersham) and then to high-resolutionphotographic emulsion (Kodak) for 1-2 months.
ImmunohistochemistryMice were perfused under deep anesthesia (33 mg/kg xylazine and 33 mg/kgketamine) with 0.1 M PBS followed by 4% paraformaldehyde (PFA) in 0.1 M PBS.After perfusion, brains were postfixed for 2 hours in 4% (w/v) PFA and transferredto 15% (w/v) sucrose in 0.1 M PBS and incubated overnight at 4°C. Cryostatsections (14 �m thick) were mounted on superfrost slides (Menzel-Glaser) andstored at –80°C for up to 15 days. Immunohistochemistry was performed aspreviously described (Fassio et al., 2000) using the following antibodies:monoclonal anti-calbindin D-28K (Sigma), anti-VAMP2 (Synaptic Systems),polyclonal anti-synaptophysin (G111), anti-synapsin I (G177) and anti-synapsinpepE (G304) raised in our laboratory (Valtorta et al., 1988; Pieribone et al., 1995;Vaccaro et al., 1997). Primary antibodies were detected using either the avidin-biotinmethod with diaminobenzidine as a chromogen (Vector Laboratories) or AlexaFluor 488- and 546-conjugated secondary antibodies (Invitrogen). Specimens wereviewed with an epifluorescence Olympus inverted microscope. Images wererecorded with a Hamamatsu C4742-98 ORCA II camera and processed using ImagePro Plus 4.5 (Media Cybernetics). DCN sections, double-labeled with anti-calbindinand anti-synaptophysin antibodies, were subjected to confocal scanning microscopy(Biorad MRC1024). Stacks of images were acquired in the DCN region at 1.5 �mintervals along the z-axis. Based on synaptophysin staining, synaptic masks weregenerated by using the granulometric algorithm (Prodanova et al., 2006). Thesynaptic signal of calbindin was obtained by applying the synaptic mask to thecalbindin signal. Nerve terminal counts were performed by using the ‘analyzeparticle’ function of the Image J program (NIH, Bethesda, MD).
Primary culturesPrimary cultures of PC were prepared from E18 Tg-2 mice following thereported procedure (Tabata et al., 2000). Cultures were either subjected toimmunocytochemistry with anti-calbindin and anti-pepE antibodies or harvested,solubilized in stop solution and subjected to SDS-PAGE in Tris-Tricine (Schaggerand von Jagow, 1987) and immunoblotting of PVDF membranes with anti-pepEantibodies.
Primary hippocampal neurons obtained from E18 wild-type embryos (Banker andCowan, 1977) were transfected at 5 days in vitro (DIV) with either pEGFP, pEGFP-synapsin Ia or pEGFP-domain E vector using Effectene (Qiagen). Expression andtargeting of GFP or of the GFP chimeras were followed at 7-9 DIV by fluorescencemicroscopy of neurons labelled with anti-VAMP2 antibodies.
Behavioral analysisMice (3 months old, weighing 20-25 g) housed under standard temperature,humidity and light/dark cycle underwent the following tests during the light phase:
Horizontal bar test The mouse was placed on a round (2 cm diameter, 50 cm length) rod 35 cm elevatedfrom the bench. The latency to fall was measured in three separate trials (with a 5minute intertrial interval). Each trial ended at 180 seconds.
Vertical pole test The mouse was placed facing up on a pole (2 cm diameter, 50 cm long). The endof the pole was then gradually lifted to a vertical position and the time the mousestayed on the pole was recorded for a maximum of 60 seconds. Time values wereconverted to a pole test score as follows: stayed on 60 seconds and climbed halfwaydown the pole=8; climbed to the lower half of the pole=9; climbed down and gotoff the pole in 51-60 seconds=10, 41-50 seconds=11, 31-40 seconds=12, 21-30seconds=13, 11-20 seconds=14, 1-10 seconds=15 (McIlwain et al., 2001). Scoreslower than 8 refer to animals that fall from the pole, an event that never occurredwith transgenic animals. Each animal was tested in three consecutive trials.
Rota-rod testMice were tested with the rota-rod (Ugo Basile, Via G. Borghi 43, 20125 Comerio,VA, Italy) under conditions of either constant speed or constant acceleration (Nolanet al., 2003). In the constant-speed test, mice were first trained until they could
remain on the rod at 4 rpm for three consecutive 120-second trials. The next daythe mice were placed back on the rod for a trial at 40 rpm. The time a mouse couldremain on the rota rod (maximum 120 seconds) was recorded and the process wasrepeated for speeds of 30, 20 and 4 rpm. Animals were given four trials per daywith a 1-hour inter-trial interval. In the accelerating test, mice were placed on therota rod starting at 4 rpm, slowly accelerating to 40 rpm. The maximum observationtime was 5 minutes. Animals were tested for 3 consecutive days, receiving fourtrials on day 1 and three trials on both days 2 and 3, with a 1-hour inter-trial interval.
Gait analysisMice were put in a dark tunnel (7 cm wide, 50 cm long, 10 cm high) with whitepaper on the floor. Before traversing the tunnel, the hindpaws of the animals weredipped in non-toxic black ink (Feil et al., 2003). Footprints were analyzed using the‘Footprint 1.22’ software (Klapdor et al., 1997) to calculate stride width, stridelength and maximum difference in stride-length values.
[3H]GABA release from DCN synaptosomesMice were killed by decapitation and DCN were rapidly dissected out. Percoll-purified synaptosomes were prepared as previously described (Dunkley et al., 1988).Synaptosomes were resuspended in physiological medium with the followingcomposition (mM): NaCl 125, KCl 3, MgSO4 1.2, CaCl2 1.2, NaH2PO4 1, NaHCO3
22, glucose 10 (pH 7.4 when equilibrated with 95% O2 and 5% CO2); and incubatedat 37°C for 15 minutes in the presence of 0.04 �M [3H]GABA. After labelling,aliquots of the suspensions (<100 �g protein/filter) were stratified onto microporousfilters at the bottom of parallel superfusion chambers maintained at 37°C (Raiteriand Raiteri, 2000) and superfused with standard medium at 0.5 ml/minute. Underthese conditions, synaptosomes constitute less than a monolayer and indirect effectsmediated by compounds released by neighbouring particles are virtually absent.After a 33-minute equilibration period, four 3-minute fractions were collected.Synaptosomes were exposed to a 90-second pulse of high KCl (12, 15 or 35 mM)or ionomycin (0.5 mM) at the end of the first fraction collected (t=39 minutes). Insome experiments, three successive high-KCl pulses were applied to the samesynaptosomal preparation at 18-minute intervals (t=39, 57 and 75 minutes).Aminooxyacetic acid (50 �M) was present throughout the experiment to prevent[3H]-GABA metabolism. Collected samples and filters were counted forradioactivity. The amount of radioactivity present in each sample was calculated asfractional rate and the stimulus-evoked overflow was estimated by subtracting basalrelease from the radioactivity measured in the samples collected during and afterthe stimulation pulse.
Electrophysiological recordings in cerebellar slicesWhole-cell patch-clamp recordings from cerebellar slices were performed followingstandard procedures (D’Angelo et al., 1995; Hansel et al., 2001; Sola et al., 2004).Parasagittal slices (220 �m thick) were taken from the cerebellar vermis of P8-P12mice decapitated after deep halothane anesthesia. During the slicing procedure, thecerebellar vermis was immersed in a cold solution containing (mM): K-gluconate130, KCl 15, EGTA 0.2, HEPES 20, Glucose 10 (pH 7.4 with NaOH). Beforerecording, slices were incubated at 32°C for at least 30 minutes in oxygenatedbicarbonate-buffered saline (standard Krebs solution) containing (mM): NaCl 120,KCl 2, MgSO4 1.2, NaHCO3 26, KH2PO4 1.2, CaCl2 2, glucose 11 (pH 7.4 whenequilibrated with 95% O2 and 5% CO2). Slices were then transferred into therecording chamber and perfused at 1.5 ml/minute with oxygenated Krebs solutionat room temperature (20-23°C). The Krebs solution was added with 50 mM D-APV (D-2-amino-5-phosphonovaleric acid) and 20 mM CNQX (6-cyano-7-nitroquinoxaline-2,3-dione) (Tocris). Slices were visualized with an uprightepifluorescence microscope (Zeiss Axioskop 2FS), equipped with a �63 water-immersion objective (0.9 NA) and DIC optics, using infrared illumination(illumination filter 750 nm) and an IR CCD camera (T.I.L.L. Photonics). Recordingswere obtained using a MultiClamp 700A amplifier (Molecular Devices).
Whole-cell recordings were performed from large spheroidal neurons (maximumdiameter 15-30 �m) identified with DIC-IR Nomarsky interference contrast. Theseneurons showed spontaneous firing at >10 Hz in cell-attached before obtaining thewhole-cell configuration. The input resistance measured by recording the responseto –10 mV voltage steps delivered from the holding potential of –65 mV was440.9 54.1 M (n=10). Thus, these neurons corresponded to type-I DCN projectionneurons according to the previously reported classification (Czubayko et al., 2001)(see also Anchisi et al., 2001). The patch-pipette contained (mM): Cs2SO4 81, NaCl4, MgSO4 2, CaCl2 0.02, BAPTA 0.1, glucose 15, ATP-Mg 3, GTP 0.1, HEPES 15,QX314 1.5. This solution maintained resting free [Ca2+] at 100 nM and pH wasadjusted to 7.2 with CsOH. Patch-clamp pipettes filled with this solution had aresistance of 1-2 M before seal formation. After obtaining the whole-cellconfiguration, membrane potential of DCN neurons was kept at –65 mV. PC axonswere stimulated via a stimulus isolation unit with a bipolar silver wire, whose activefilament was inserted into a glass pipette (10 �m tip diameter) filled with standardKrebs solution. The stimulating electrode was placed at 100 20 �m from therecorded DCN neuron. IPSCs were elicited at a basal frequency of 0.1 Hz withconstant stimulation intensity. Two types of high-frequency trains were applied: (1)200 milliseconds at 100 Hz to analyze short-term plasticity regulated by RRP and
Journal of Cell Science 119 (20)
Jour
nal o
f Cel
l Sci
ence
4267Synapsin domain E accelerates vesicle cycle
(2) 120 seconds at 50 Hz to investigate the involvement of the RP. IPSC peak valuewas calculated as the difference between peak and base (see Fig. 5). Under the sameconditions, PC spike firing was monitored using loose cell-attached recordings thatdo not perturb basal discharge frequency (Forti et al., 2006).
Electron microscopyChopper sections containing DCN from three wild-type and three Tg-2 mice werefixed for 30 minutes at room temperature with 2% PFA, 1% glutaraldehyde, 1%sucrose in cacodylate buffer (100 mM, pH 7.4), washed five times in cacodylatebuffer, and postfixed for 1 hour with 1% OsO4 in the same buffer. Samples weresubsequently washed five times for 5 minutes with cacodylate buffer, dehydratedand embedded in Epon 812 (Ceccarelli et al., 1973). Silver-gray sections were cuton a microtome (Reichert-Jung Ultracut), stained with 4% uranyl acetate, 0.4% leadcitrate, and examined in a Hitachi H-7000 electron microscope. The identificationof the PC-DCN synapses was carried out based on the following criteria: (1) Graytype II ‘symmetrical’ synapses; (2) elliptical and dispersed SVs; (3) location onsoma or proximal dendrites of DCN neurons (Chan-Palay, 1977). All theencountered synapses whose features made them recognizable as PC nerve endingswere analyzed. The geometrical parameters of the nerve endings as well as the SVdensity measured in samples from wild-type mice were virtually identical to thosereported (Chan-Palay, 1977), indicating that the sample was representative of thewhole population of PC nerve endings.
Morphometric analysisDigitized electron micrographs of PC-DCN synapses were subjected to computer-assisted morphometric analysis to calculate the following parameters: nerveterminal area, length of the synaptic contact, number and length of active zone,number of SVs and, for each SV, the distance from the closest active zone and themean distance from all surrounding SVs (mean intervesicular distance, MID, ameasure of SV clustering). Since MID depends on SV density, a clustering indexwas obtained, corresponding to the ratio between the MID calculated for a simulatedhomogeneous SV distribution and the measured MID. The area occupied bymitochondria (which was similar in the two experimental groups) was subtractedfrom the total area. Parameters were calculated from the EM images of 60 synapsesfrom three wild-type mice and 54 synapses from three transgenic mice. Within eachanimal, individual PC-DCN synapses were analyzed to give mean individual valuesthat were subsequently averaged within the same experimental group. To analyzeSV distribution with respect to the active zone, the calculated distances of SVs fromactive zone within each nerve terminal were grouped into 50 classes of 50 nm. Fromthe frequency of SVs whose distance from the active zone was falling in the variousclasses, frequency distribution histograms were obtained for each nerve terminaland were subsequently averaged within the same experimental group.
Statistical analysisData are reported as mean ± s.e.m. and statistical analysis was performed using theprogram Prism (GraphPad Software). Data were analyzed using one-way ANOVAfollowed by either the Student’s t-test or multiple comparison tests (either Dunnett,Duncan or Newman-Kleus test). Frequency distribution histograms were analyzedby the Kolmogorov-Smirnov normality test followed by either parametric or non-parametric tests (Student’s t-test and Mann-Whitney U test, respectively). Bothtypes of analysis gave fully comparable significance levels.
We thank P. Greengard (The Rockefeller University, New York, NY)for useful discussion and critical reading of the manuscript, L. Pozziand C. Tiveron (Telethon Transgenic Mice Service Center, IstitutoRegina Elena, Roma, Italy) for embryo injections, M. Zoli and A.Zanardi (University of Modena, Italy) for help with in situhybridization experiments, D. Ghezzi (Politecnico di Milano, Italy) forhelp with the morphometric analysis. This work was supported bygrants from the Italian Ministry of University (Cofin 2004 and 2005,FIRB ‘Neuroscienze’ and ‘Postgenomica’ to F.B., G.B., E.D’A. andF.V.), Fisher Foundation for Alzheimer’s Disease Research,Associazione Italiana Ricerca sul Cancro, Fondazione Franco e LuisaMariani and Consorzio Italiano Biotecnologie (to F.B.), ConsiglioNazionale delle Ricerche (Progetti Strategici Neuroscienze andGenomica Funzionale to F.B. and F.V.) and by projects of the EuropeanCommunity (Cerebellum QLG3-CT-2001-02256 and Spikeforce IST-2001035271 to E.D’A). The financial support of Telethon-Italy (grantno. GGP05134 to F.B and F.V.) is gratefully acknowledged.
ReferencesAizenman, C. D., Manis, P. B. and Linden, D. J. (1998). Polarity of long-term synaptic
gain change is related to postsynaptic spike firing at a cerebellar inhibitory synapse.Neuron 21, 827-835.
Anchisi, D., Scelfo, B. and Tempia, F. (2001). Postsynaptic currents in deep cerebellarnuclei. J. Neurophysiol. 85, 323-331.
Ashton, A. C. and Dolly, J. O. (2000). A late phase of exocytosis from synaptosomesinduced by elevated [Ca2+]i is not blocked by clostridial neurotoxins. J. Neurochem.74, 1979-1988.
Banker, G. A. and Cowan, W. M. (1977). Rat hippocampal neurons in dispersed cellculture. Brain Res. 126, 397-342.
Benfenati, F., Valtorta, F., Chieregatti, E. and Greengard, P. (1992a). Interaction offree and synaptic vesicle-bound synapsin I with F-actin. Neuron 8, 377-386.
Benfenati, F., Valtorta, F., Rubenstein, J. L., Gorelick, F. S., Greengard, P. andCzernik, A. J. (1992b). Synaptic vesicle-associated Ca2+/calmodulin-dependentprotein kinase II is a binding protein for synapsin I. Nature 359, 417-420.
Bloom, O., Evergren, E., Tomilin, N., Kjaerulff, O., Low, P., Brodin, L., Pieribone,V. A., Greengard, P. and Shupliakov, O. (2003). Colocalization of synapsin and actinduring synaptic vesicle recycling. J. Cell Biol. 161, 737-747.
Bonanomi, D., Menegon, A., Miccio, A., Ferrari, G., Corradi, A., Kao, H. T.,Benfenati, F. and Valtorta, F. (2005). Phosphorylation of synapsin I by cAMP-dependent protein kinase controls synaptic vesicle dynamics in developing neurons. J.Neurosci. 25, 7299-7308.
Brenowitz, S. and Trussell, L. O. (2001). Maturation of synaptic transmission at end-bulb synapses of the cochlear nucleus. J. Neurosci. 21, 9487-9498.
Brodin, L., Low, P., Gad, H., Gustaffson, J., Pieribone, V. A. and Shupliakov, O.(1997). Sustained neurotransmitter release: new molecular clues. Eur. J. Neurosci. 9,2503-2511.
Ceccaldi, P., Grohovaz, F., Benfenati, F., Chieregatti, E., Greengard, P. and Valtorta,F. (1995). Dephosphorylated synapsin I anchors synaptic vesicles to actin cytoskeleton:an analysis by videomicroscopy. J. Cell Biol. 128, 905-912.
Ceccarelli, B., Hurlbut, W. P. and Mauro, A. (1973). Turnover of transmitter andsynaptic vesicles at the frog neuromuscular junction. J. Cell Biol. 57, 499-524.
Chan-Palay, V. (1977). Cerebellar Dentate Nucleus. Berlin: Springer Verlag.Chi, P., Greengard, P. and Ryan, T. A. (2001). Synapsin dispersion and reclustering
during synaptic activity. Nat. Neurosci. 4, 1187-1193.Chi, P., Greengard, P. and Ryan, T. A. (2003). Synaptic vesicle mobilization is regulated
by distinct synapsin I phosphorylation pathways at different frequencies. Neuron 10,69-78.
Clark B. A., Mansivois P., Branco T., London M. and Hausser M. (2005). The siteof action potential initiation in cerebellar Purkinje neurons. Nat. Neurosci. 8, 137-139.
Corradi, A., Croci, L., Broccoli, V., Zecchini, S., Previtali, S., Wurst, W., Amadio, S.,Maggi, R., Quattrini, A. and Consalez, G. G. (2003). Hypogonadotropichypogonadism and peripheral neuropathy in Ebf2-null mice. Development 130, 401-410.
Czubayko, U., Sultan, F., Thier, P. and Schwarz, C. (2001). Two types of neurons inthe rat cerebellar nuclei as distinguished by membrane potentials and intracellularfillings. J. Neurophysiol. 85, 2017-2029.
D’Angelo, E., De Filippi, G., Rossi, P. and Taglietti, V. (1995). Synaptic excitation ofindividual rat cerebellar granule cells in situ: evidence for the role of NMDA receptors.J. Physiol. Lond. 484, 397-413.
De Zeeuw, C. I., Hansel, C., Bian, F., Koekkoek, S. K. E., van Alphen, A. M., Linden,D. J. and Oberdick, J. (1998). Expression of a protein kinase C inhibitor in Purkinjecells blocks cerebellar LTD and adaptation of the vestibulo-ocular reflex. Neuron 20,495-508.
Dunkley, P. R., Heath, J. W., Harrison, S. M., Jarvie, P. E., Glenfield, P. J. and Rostas,J. A. (1988). A rapid Percoll gradient procedure for isolation of synaptosomes directlyfrom an S1 fraction homogeneity and morphology of subcellular fractions. Brain Res.441, 59-71.
Fassio, A., Evans, G., Grisshammer, R., Bolam, J. P., Mimmack, M. and Emson, P.C. (2000). Distribution of neurotensin receptor NTS1 in the rat CNS studied using anamino-terminal directed antibody. Neuropharmacology 39, 1430-1442.
Feil, R., Hartmann, J., Luo, C., Wolfsgruber, W., Schilling, K., Feil, S., Barski, J. J.,Meyer, M., Konnerth, A., De Zeeuw, C. I. et al. (2003). Impairment of LTD andcerebellar learning by Purkinje cell-specific ablation of cGMP-dependent proteinkinase I. J. Cell Biol. 163, 295-302.
Forti, L., Cesana, E., Mapelli, J. and D’Angelo, E. (2006). Ionic mechanisms ofautorhythmic firing in cerebellar Golgi cells. J. Physiol. 574, 711-729.
Garcia, C. C., Blair, H. J., Seager, M., Coulthard, A., Tennant, S., Buddles, M.,Curtis, A. and Goodship, J. A. (2004). Identification of a mutation in synapsin I, asynaptic vesicle protein, in a family with epilepsy. J. Med. Genet. 41, 183-186.
Geppert, M., Goda, Y., Stevens, C. F. and Südhof, T. C. (1997). The small GTP-bindingprotein Rab3A regulates a late step in synaptic vesicle fusion. Nature 387, 810-814.
Giovedì, S., Vaccaro, P., Valtorta, F., Darchen, F., Greengard, P., Cesareni, G. andBenfenati, F. (2004a). Synapsin is a novel Rab3 effector protein on small synapticvesicles. I. Identification and characterization of the synapsin I-Rab3 interactions invitro and in intact nerve terminals. J. Biol. Chem. 279, 43760-43768.
Giovedì, S., Darchen, F., Valtorta, F., Greengard, P. and Benfenati, F. (2004b).Synapsin is a novel Rab3 effector protein on small synaptic vesicles. II. Functionaleffects of the Rab3A-synapsin I interaction. J. Biol. Chem. 279, 43769-43779.
Gitler, D., Xu, Y., Kao, H. T., Lin, D., Lim, S., Feng, J., Greengard, P. and Augustine,G. J. (2004a). Molecular determinants of synapsin targeting to presynaptic terminals.J. Neurosci. 24, 3711-3720.
Gitler, D., Takagishi, Y., Feng, J., Ren, Y., Rodriguiz, R., Wetsel, W. C., Greengard,P. and Augustine, G. J. (2004b). Different presynaptic roles of synapsins at excitatoryand inhibitory synapses. J. Neurosci. 24, 11368-11380.
Jour
nal o
f Cel
l Sci
ence
4268
Greengard, P., Valtorta, F., Czernik, A. J. and Benfenati, F. (1993). Synaptic vesiclephosphoproteins and regulation of synaptic function. Science 259, 780-785.
Hansel, C., Linden, D. J. and D’Angelo, E. (2001). Beyond parallel fiber LTD: thediversity of synaptic and non-synaptic plasticity in the cerebellum. Nat. Neurosci. 4,467-475.
Hilfiker, S., Schweizer, F. E., Kao, H. T., Czernik, A. J., Greengard, P. and Augustine,G. J. (1998). Two sites of action for synapsin domain E in regulating neurotransmitterrelease. Nat. Neurosci. 1, 29-35.
Hilfiker, S., Pieribone, V. A., Czernik, A. J., Kao, H. T., Augustine, G. J. andGreengard, P. (1999). Synapsins as regulators of neurotransmitter release. Philos.Trans. R. Soc. Lond. B Biol. Sci. 354, 269-279.
Hilfiker, S., Benfenati, F., Doussau, F., Nairn, A. C., Czernik, A. J., Augustine, G. J.and Greengard, P. (2005). Structural domains involved in the regulation of transmitterrelease by synapsins. J. Neurosci. 25, 2658-2669.
Hosaka, M., Hammer, R. E. and Südhof, T. C. (1999). A phospho-switch controls thedynamic association of synapsins with synaptic vesicles. Neuron 24, 377-387.
Humeau, Y., Dousseau, F., Vitiello, F., Greengard, P., Benfenati, F. and Poulain, B.(2001). Synapsin controls transition between multiple synaptic vesicle stores duringshort-term plasticity. J. Neurosci. 21, 4195-4206.
Jovanovic, J. N., Benfenati, F., Siow, Y. L., Sihra, T. S., Sanghera, J. S., Pelech, S. L.,Greengard, P. and Czernik, A. J. (1996). Neurotrophins stimulate phosphorylationof synapsin I by MAP kinase and regulate synapsin I-actin interactions. Proc. Natl.Acad. Sci. USA 93, 3679-3683.
Kao, H. T., Porton, B., Hilfiker, S., Stefani, G., Pieribone, V. A., DeSalle, R. andGreengard, P. (1999). Molecular evolution of the synapsin gene family. J. Exp. Zool.285, 360-377.
Klapdor, K., Dulfer, B. G., Hammann, A. and Van der Staay, F. J. (1997). A low costmethod to analyze footprint patterns. J. Neurosci. Methods 75, 49-54.
Kozak, M. (1986). Pont mutation define a sequence flanking the AUG initiator codon thatmodulates translation by eukaryotic ribosomes. Cell 47, 481-483.
Li, L., Chin, L. S., Shupliakov, O., Brodin, L., Sihra, T. S., Hvalby, O., Jensen, V.,Zheng, D., McNamara, J. O., Greengard, P. et al. (1995). Impairment of synapticvesicle clustering and of synaptic transmission, and increased seizure propensity, insynapsin I-knockout mice. Proc. Natl. Acad. Sci. USA 92, 9235-9239.
McDevitt, C. J., Ebner, T. J. and Bloedel, J. R. (1987). Changes in the responses ofcerebellar nuclear neurons associated with the climbing fiber response of Purkinje cells.Brain Res. 425, 14-24.
McIlwain, K. L., Merriweather, M. Y., Yuva-Paylor, L. A. and Paylor, R. (2001).The use of behavioral test batteries: effects of training history. Physiol. Behav. 73,705-717.
Morishita, W. and Sastry, B. R. (1996). Postsynaptic mechanisms underlying long-termdepression of GABAergic transmission in neurons of the deep cerebellar nuclei. J.Neurophysiol. 76, 59-68.
Nolan, M. F., Malleret, G., Lee, K. H., Gibbs, E., Dudman, J. T., Santoro, B., Yin,D., Thompson, R. F., Siegelbaum, S. A., Kandel, E. R. et al. (2003). Thehyperpolarization-activated HCN1 channel is important for motor learning andneuronal integration by cerebellar Purkinje cells. Cell 115, 551-564.
Ouardouz, M. and Sastry, B. R. (2000). Mechanisms underlying LTP ofinhibitory synaptic transmission in the deep cerebellar nuclei. J. Neurophysiol. 84,1414-1421.
Pedroarena, C. M. and Schwarz, C. (2003). Efficacy and short-term plasticity atGABAergic synapses between Purkinje and cerebellar nuclei neurons. J. Neurophysiol.89, 704-715.
Pieribone, V. A., Shupliakov, O., Brodin, L., Hilfiker-Rothenfluh, S., Czernik, A. J.and Greengard, P. (1995). Distinct pools of synaptic vesicles in neurotransmitterrelease. Nature 37, 493-497.
Porton, B., Kao, H. T. and Greengard, P. (1999). Characterization of transcripts fromthe synapsin III locus. J. Neurochem. 73, 2266-2271.
Prodanova, D., Heeromac, J. and Marania, E. (2006). Automatic morphometry of
synaptic boutons of cultured cells using granulometric analysis of digital images. J.Neurosci. Methods 151, 168-177.
Raiteri, L. and Raiteri, M. (2000). Synaptosomes still viable after 25 years ofsuperfusion. Neurochem. Res. 25, 1265-1274.
Rizzoli, S. O. and Betz, W. J. (2005). Synaptic vesicle pools. Nat. Rev. Neurosci. 6, 57-69.
Rosahl, T. W., Spillane, D., Missler, M., Herz, J., Selig, D. K., Wolff, J. R., Hammer,R. E., Malenka, R. C. and Südhof, T. C. (1995). Essential functions of synapsins Iand II in synaptic vesicle regulation. Nature 375, 488-493.
Sankaranarayanan, S., Atluri, P. P. and Ryan, T. A. (2003). Actin has a molecularscaffolding, not propulsive, role in presynaptic function. Nat. Neurosci. 6, 127-135.
Schagger, H. and von Jagow, G. (1987). Tricine-sodium dodecyl sulfate-polyacrylamidegel electrophoresis for the separation of proteins in the range from 1 to 100 kDa. Anal.Biochem. 166, 368-379.
Schluter, O. M., Basu, J., Südhof, T. C. and Rosenmund, C. (2006). Rab3 superprimessynaptic vesicles for release: implications for short-term synaptic plasticity. J.Neurosci. 26, 1239-1246.
Sola, E., Prestori, F., Rossi, P., Taglietti, V. and D’Angelo, E. (2004). Increasedneurotransmitter release during long-term potentiation at mossy fibre-granule cellsynapses in rat cerebellum. J. Physiol. 557, 843-861.
Stigliani, S., Raiteri, L., Fassio, A. and Bonanno, G. (2003). The sensitivity ofcatecholamine release to botulinum toxin C1 and E suggest selective targeting ofvesicles set into the readily releasable pool. J. Neurochem. 85, 409-421.
Südhof, T. C., Czernik, A. J., Kao, H. T., Takei, K., Johnston, P. A., Horiuchi, A.,Kanazir, S. D., Wagner, M. A., Perin, M. S., De Camilli, P. et al. (1989). Synapins:mosaic of shared and individual domains in a family of synaptic vesiclephosphoproteins. Science 245, 1474-1480.
Tabata, T., Sawada, S., Araki, K., Bono, Y., Furuya, S. and Kano, M. (2000). Areliable method for culture of dissociated mouse cerebellar cells enriched for Purkinjeneurons. J. Neurosci. Methods 104, 45-53.
Telgkamp, P. and Raman, I. M. (2002). Depression of inhibitory synaptic transmissionbetween Purkinje cells and neurons of the cerebellar nuclei. J. Neurosci. 22, 8447-8457.
Telgkamp, P., Padgett, D. E., Ledoux, V. A., Woolley, C. S. and Raman, I. M. (2004).Maintenance of high-frequency transmission at Purkinje to cerebellar nuclear synapsesby spillover from boutons with multiple release sites. Neuron 41, 113-126.
Terada, S., Tsujimoto, T., Takei, Y., Takahashi, T. and Hirokawa, N. (1999).Impairment of inhibitory synaptic transmission in mice lacking synapsin I. J. Cell Biol.145, 1039-1048.
Thach, W. T. (1968). Discharge of Purkinje and cerebellar nuclear neurons during rapidlyalternating arm movements in the monkey. J. Neurophysiol. 31, 785-797.
Thach, W. T. (1970). Discharge of cerebellar neurons related to two maintained posturesand two prompt movements. II. Purkinje cell output and input. J. Neurophysiol. 33,527-536.
Vaccaro, P., Dente, L., Onofri, F., Zucconi, A., Martinelli, S., Valtorta, F., Greengard,P., Cesareni, G. and Benfenati, F. (1997). Epitope mapping on mammalian synapsinsusing phage display libraries. Mol. Brain Res. 52, 1-16.
Valtorta, F., Villa, A., Jahn, R., De Camilli, P., Greengard, P. and Ceccarelli, B.(1988). Localization of synapsin I at the frog neuromuscular junction. Neuroscience24, 593-603.
Valtorta, F., Meldolesi, J. and Fesce, R. (2001). Synaptic vesicles: is kissing a matterof competence? Trends Cell Biol. 11, 324-328.
Zhang, X., Zhang, H. and Oberdick, J. (2002). Conservation of the developmentallyregulated dendritic localization of a Purkinje cell-specific mRNA that encodes a G-protein modulator: comparison of rodent and human Pcp2(L7) gene structure andexpression. Brain Res. Mol. Brain Res. 105, 1-10.
Zoli, M., Le Novere, N., Hill, J. A. and Changeux, J. P. (1995). Developmentalregulation of nicotinic ACh receptor subunit mRNAs in the rat central and peripheralnervous systems. J. Neurosci. 15, 1912-1939.


![[2011] FWAA 4257 - SDAsda.org.au/download/enterprise-agreements/MYER-STORES-AGREEMENT-2010.pdf1 [2011] FWAA 4257 DECISION Fair Work Act 2009 s.185—Enterprise agreement Myer Pty Ltd](https://static.documents.pub/doc/80x56/5ecfc579bd68490aa3731ce8/2011-fwaa-4257-1-2011-fwaa-4257-decision-fair-work-act-2009-s185aenterprise.jpg)


