70 Costs Associated with Development and Implementation of Comprehensive Nutrient Management Plans Part I—Nutrient Management, Land Treatment, Manure and Wastewater Handling and Storage, and Recordkeeping Manure and wastewater handling and storage costs Manure and wastewater storage and handling includes components and activities associated with the produc- tion facility, feedlot, manure and wastewater storage and treatment structures and areas, and any areas or mechanisms used to facilitate transfer of manure and wastewater. For most CNMPs, addressing this element requires a combination of conservation practices, management activities, and facility upgrades designed to meet the production needs of the livestock opera- tion while addressing environmental concerns specific to each operation. Manure and wastewater storage and handling needs are highly specific to the condition and location of each facility, and differ from farm to farm. This study adopts a generalized approach to estimat- ing needs and costs for this element by identifying major cost items and making broad assumptions about CNMP needs. There are many types of CNMP-related costs on specific farms, and it is impractical to simu- late the full array of potential cost items. This analysis focuses on the needs and costs that generally would be representative of the industry. Needs and costs were identified so that they would reasonably repre- sent alternatives. For example, composting was se- lected as the basis for estimating the costs of manag- ing mortality on poultry and swine farms. There are acceptable alternatives to composting, but the costs generally are about the same. The needs and costs assigned to a specific farm in the model simulation may differ from those that would be identified for a specific farm in an actual CNMP. However, it is ex- pected that the overall estimates derived from the model simulation will be representative of the total CNMP costs for this element. The analytical framework used to derive CNMP needs and costs for the manure and wastewater handling and storage element is based on the model farms described previously (see tables 2–5). Components of the ma- nure and wastewater storage and handling element were identified for each model farm. Not every model farm has every component. The objective was to define adequate components to meet the criteria established in the NRCS CNMP Technical Guidance and applicable NRCS conservation practice standards. The team was guided by the NRCS Agricultural Waste Management Field Handbook (AWMFH) (NRCS, 1992). The appropriate components of a typical manure management system for each model farm were based on chapter 9 of the AWMFH. Major cost items for manure and wastewater storage and handling are broken down into the following components: • Mortality management (poultry and swine) • Lot upgrades • Clean water diversions (including roof runoff management, earthen berms, and grassed water- ways) • Liquid treatment (small dairies) • Collection and transfer (including solids, liquid, contaminated runoff, and pumping) • Settling basins • Solids storage • Liquid storage • Slurry storage • Runoff storage ponds In all but one case, it was assumed that farms would not switch from one production system to another (i.e., switch from one representative farm to another) because of implementing a CNMP. An exception was made, however, for large dairies in the Dairy Belt that reported a solids-based manure handling system in the farmer surveys. The team felt that these large dairies would find it too labor intensive to continue to handle manure as a solid and meet CNMP criteria, and would convert to a liquid system with a waste storage pond. Cost estimates for conservation practices for pastured livestock are included in the manure and wastewater handling and storage element. Components for farms with pastured livestock types include: • Fencing • Water well • Watering facility • Heavy use area protection • Windbreak or shelter break establishment • Solids storage • Filter strip Manure and wastewater handling and storage costs were estimated for the system associated with the dominant livestock type on each farm. Many of these farms, however, have other confined livestock types on the farm. The assumption was made that costs associated with addressing CNMP needs for the sec- ondary livestock types on the farm, for the most part,
Transcript
70
Costs Associated with Development and Implementation of Comprehensive Nutrient Management Plans
Part I—Nutrient Management, Land Treatment, Manure and Wastewater Handling and Storage, and Recordkeeping
Manure and wastewaterhandling and storage costs
Manure and wastewater storage and handling includescomponents and activities associated with the produc-tion facility, feedlot, manure and wastewater storageand treatment structures and areas, and any areas ormechanisms used to facilitate transfer of manure andwastewater. For most CNMPs, addressing this elementrequires a combination of conservation practices,management activities, and facility upgrades designedto meet the production needs of the livestock opera-tion while addressing environmental concerns specificto each operation. Manure and wastewater storage andhandling needs are highly specific to the condition andlocation of each facility, and differ from farm to farm.
This study adopts a generalized approach to estimat-ing needs and costs for this element by identifyingmajor cost items and making broad assumptions aboutCNMP needs. There are many types of CNMP-relatedcosts on specific farms, and it is impractical to simu-late the full array of potential cost items. This analysisfocuses on the needs and costs that generally wouldbe representative of the industry. Needs and costswere identified so that they would reasonably repre-sent alternatives. For example, composting was se-lected as the basis for estimating the costs of manag-ing mortality on poultry and swine farms. There areacceptable alternatives to composting, but the costsgenerally are about the same. The needs and costsassigned to a specific farm in the model simulationmay differ from those that would be identified for aspecific farm in an actual CNMP. However, it is ex-pected that the overall estimates derived from themodel simulation will be representative of the totalCNMP costs for this element.
The analytical framework used to derive CNMP needsand costs for the manure and wastewater handling andstorage element is based on the model farms describedpreviously (see tables 2–5). Components of the ma-nure and wastewater storage and handling elementwere identified for each model farm. Not every modelfarm has every component. The objective was todefine adequate components to meet the criteriaestablished in the NRCS CNMP Technical Guidanceand applicable NRCS conservation practice standards.
The team was guided by the NRCS Agricultural WasteManagement Field Handbook (AWMFH) (NRCS, 1992).The appropriate components of a typical manuremanagement system for each model farm were basedon chapter 9 of the AWMFH. Major cost items formanure and wastewater storage and handling arebroken down into the following components:
• Mortality management (poultry and swine)• Lot upgrades• Clean water diversions (including roof runoff
management, earthen berms, and grassed water-ways)
• Liquid treatment (small dairies)• Collection and transfer (including solids, liquid,
In all but one case, it was assumed that farms wouldnot switch from one production system to another(i.e., switch from one representative farm to another)because of implementing a CNMP. An exception wasmade, however, for large dairies in the Dairy Belt thatreported a solids-based manure handling system in thefarmer surveys. The team felt that these large dairieswould find it too labor intensive to continue to handlemanure as a solid and meet CNMP criteria, and wouldconvert to a liquid system with a waste storage pond.
Cost estimates for conservation practices for pasturedlivestock are included in the manure and wastewaterhandling and storage element. Components for farmswith pastured livestock types include:
• Fencing• Water well• Watering facility• Heavy use area protection• Windbreak or shelter break establishment• Solids storage• Filter strip
Manure and wastewater handling and storage costswere estimated for the system associated with thedominant livestock type on each farm. Many of thesefarms, however, have other confined livestock typeson the farm. The assumption was made that costsassociated with addressing CNMP needs for the sec-ondary livestock types on the farm, for the most part,
71
Costs Associated with Development and Implementation of Comprehensive Nutrient Management Plans
Part I—Nutrient Management, Land Treatment, Manure and Wastewater Handling and Storage, and Recordkeeping
could be incorporated into the system costs for thedominant livestock type. Any additional costs wereassumed minor and were not estimated. For severalcomponents, however, costs were based on theamount of recoverable manure produced on the farm(handling and transport weight), which includedrecoverable manure from all livestock types on thefarm. (See appendix B for details on the calculation ofrecoverable manure and the amount for handling andtransport.)
CNMP costs for the manure and wastewater storageand handling element were estimated for each farm.Costs were defined on a per-animal or per-animal-unitbasis wherever possible so that the final cost estimatewould more closely represent the existing productioncapacity of each individual operation. For poultry,costs were estimated on a per-house basis. For thispurpose it was assumed a broiler house would hold25,000 birds, a layer or pullet house would hold 50,000birds, and a turkey house would hold 5,000 birds forslaughter or 8,000 birds for breeding.
To obtain estimates of CNMP-related costs for manureand wastewater handling and storage components,information is needed on per-unit costs and on CNMPneeds for each component. Most per-unit cost esti-mates were based on literature values or values takenfrom the NRCS Field Office Technical Guide.
However, no data are available on CNMP needs forthis element, nor can CNMP needs be derived fromother databases, as was done for nutrient managementcosts, land treatment costs, and off-farm export costs.CNMP needs for manure and wastewater handling andstorage components were estimated by a team ofexperts using a consensus approach to approximatewhat the needs might be. The team of experts con-sisted of agricultural engineers, environmental engi-neers, economists, and agronomists with extensiveexperience working with livestock producers andgovernment technical assistance programs. Teammembers also consulted with other experts who hadknowledge about specific industries or areas of thecountry.
To simplify the process of estimating CNMP needs forthis element, three groups of "virtual" farms wereestablished: the 25 percent of farms with the lowestneeds, the 25 percent of farms with the highest needs,and the 50 percent of farms with average needs. For
each of the three groups, the percentage of farmsneeding upgrades was estimated by the team. The finalestimate of CNMP needs for each component was thenobtained as a weighted total. CNMP needs were esti-mated as percentages that can be interpreted in twoways:
• The percentage of the total cost that the averagefarm would incur in upgrading facilities to meetCNMP guidelines.
• The percentage of farms in a group that wouldneed to add a component, incurring the full cost.
These two interpretations of the needs percentagesare analytically equivalent. However, one of these twointerpretations may be more appropriate than theother for specific components.
Separate cost estimates were made for capital expen-ditures (equipment and structures), operating costs,and maintenance costs. All costs are presented asannual costs. Capital costs are converted to annualcosts by amortizing the total cost over 10 years withan 8 percent interest rate. Operating costs are largelylabor costs, but also include fuel and other costswhere appropriate. The standard wage rate used forlabor was $10 per hour. Maintenance costs wereestimated as 3 percent of the capital costs.
Specific estimates of CNMP needs and costs for eachcomponent were made for farms with more than 35AU of confined livestock types. Farms with less than35 AU where confined livestock types were dominant(42,565 farms) were judged to be too diverse withrespect to the type of production technologies em-ployed in producing livestock to apply the standard setof representative farms. Small farms tend to use smalllots and pastured environments to a greater extentthan the larger farms for which the set of representa-tive farms were derived. Furthermore, CNMPs forthese smaller farms would most likely address only asubset of the components that would be addressed forlarger farms, focusing on situations and practicesassociated with environmental impacts. (Pasturedlivestock farms with less than 35 AU were not explic-itly excluded, but few were included in the set offarms that may need a CNMP because of the smallquantities of recoverable manure produced.)
Manure and wastewater handling and storage costs forfarms with less than 35 AU of confined livestock types(and where pastured livestock were not dominant)
72
Costs Associated with Development and Implementation of Comprehensive Nutrient Management Plans
Part I—Nutrient Management, Land Treatment, Manure and Wastewater Handling and Storage, and Recordkeeping
were estimated based on costs derived for smalldairies. (Most of these farms either had milk cows orswine as the dominant livestock type. See appendix A,table A–5.) Operating costs per AU were estimatedusing the average capital cost for dairies with 35 to 60AU. Capital costs per AU were estimated as 50 percentof the average capital cost for dairies with 35 to 60 AU.The total manure and wastewater handling and stor-age costs for these small farms were obtained bymultiplying the per-AU costs times the number of AUfor confined livestock types on the farm.
A description of each component and how the costswere derived follows. The per-unit costs and assump-tions of CNMP needs derived by the team of expertsfor each model farm are summarized in appendix E.The overall cost estimates for manure and wastewaterhandling and storage are presented in the last part ofthis section.
Mortality management
The cost of mortality management is included for allpoultry and swine farms. For dairy and fattened cattle,it was assumed that existing mortality managementpractices would be adequate in most cases. Variousacceptable methods are used to manage poultry andswine mortality, such as composting, incineration,burial pits, and freezing. Composting was selected asthe representative technology for assessing CNMPcosts.
Poultry
The cost of mortality management for poultry wasdetermined on a per-house basis. A concrete slabcovered with a timber structure comprised thecomposting facility. Capital and operating costs of thestructure were based on costs reported by the NorthCarolina Cooperative Extension (1999) for a 100,000-bird broiler flock. The cost of the timber structure andconcrete floor was $3,600, and the cost of water ser-vice for the facility was $150, resulting in an annualcapital cost of $559. Operating costs included labor(27.5 hours per flock at $10 per hour) and machineryrental ($20 per hour at 51 hours per year), for a total of$2,533 per year. For the 25,000-bird broiler house usedas the standard house size in this study, annual costswere $140 for capital and $633 for operating costs.
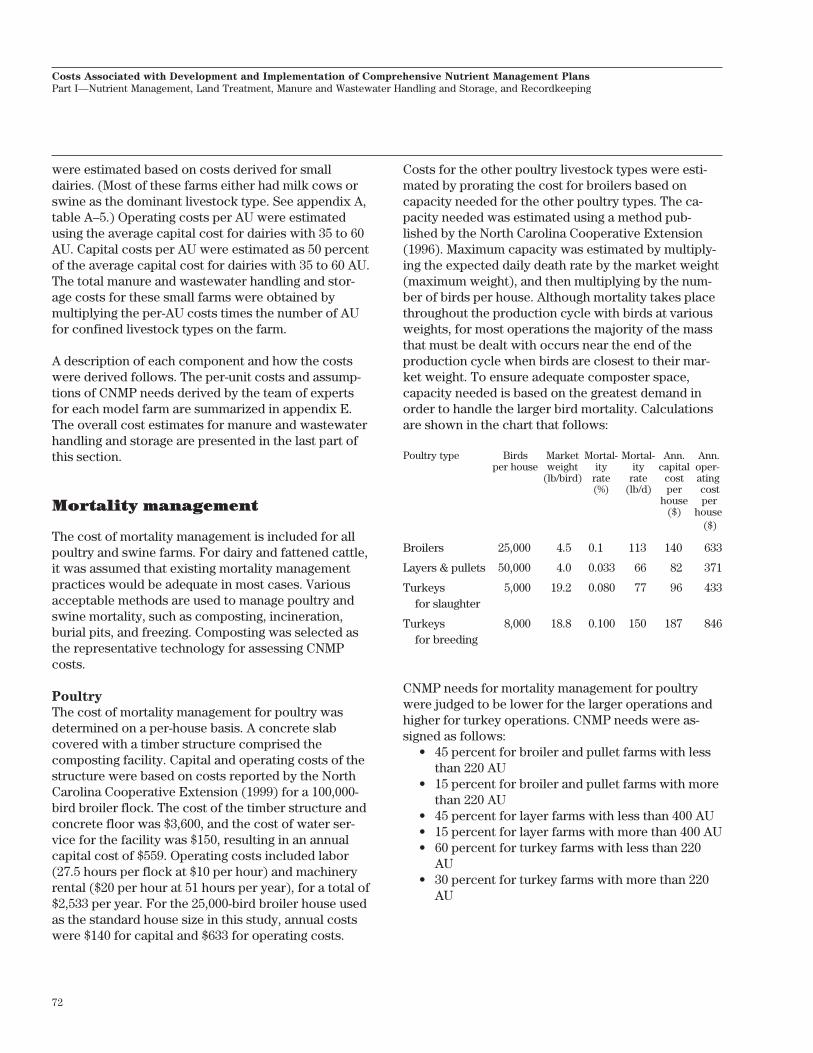
Costs for the other poultry livestock types were esti-mated by prorating the cost for broilers based oncapacity needed for the other poultry types. The ca-pacity needed was estimated using a method pub-lished by the North Carolina Cooperative Extension(1996). Maximum capacity was estimated by multiply-ing the expected daily death rate by the market weight(maximum weight), and then multiplying by the num-ber of birds per house. Although mortality takes placethroughout the production cycle with birds at variousweights, for most operations the majority of the massthat must be dealt with occurs near the end of theproduction cycle when birds are closest to their mar-ket weight. To ensure adequate composter space,capacity needed is based on the greatest demand inorder to handle the larger bird mortality. Calculationsare shown in the chart that follows:
Poultry type Birds Market Mortal- Mortal- Ann. Ann.per house weight ity ity capital oper-
(lb/bird) rate rate cost ating(%) (lb/d) per cost
house per($) house
($)
Broilers 25,000 4.5 0.1 113 140 633
Layers & pullets 50,000 4.0 0.033 66 82 371
Turkeys 5,000 19.2 0.080 77 96 433for slaughter
Turkeys 8,000 18.8 0.100 150 187 846for breeding
CNMP needs for mortality management for poultrywere judged to be lower for the larger operations andhigher for turkey operations. CNMP needs were as-signed as follows:
• 45 percent for broiler and pullet farms with lessthan 220 AU
• 15 percent for broiler and pullet farms with morethan 220 AU
• 45 percent for layer farms with less than 400 AU• 15 percent for layer farms with more than 400 AU• 60 percent for turkey farms with less than 220
AU• 30 percent for turkey farms with more than 220
AU
73
Costs Associated with Development and Implementation of Comprehensive Nutrient Management Plans
Part I—Nutrient Management, Land Treatment, Manure and Wastewater Handling and Storage, and Recordkeeping
Swine
Estimates of mortality management costs for swinewere based on a composting facility consisting of aconcrete pad with walls constructed of large roundbales and covered with a tarp, and a fence to keepanimals out. Included in the system are a carcasscutter and grinder. (Costs for this system are de-scribed by Ken Foster in Cost Analysis of Swine
Mortality Composting, Purdue University.)
The annual cost of the cutter and grinder is $1,248,which would need to be incurred only once per opera-tion regardless of the size of the operation. Othercapital costs (concrete slab, fence, tarp, bales) werereported by Foster for a farrow-to-finish operationwith a maximum capacity of about 250 animal units tobe $549 per year. Annual operating costs (labor, saw-dust, fuel, and utilities) for this system were reportedto be $350 per year. On an animal unit basis, thesecosts convert to $2.20 per animal unit for the addi-tional capital costs and $1.40 per animal unit for oper-ating costs.
Because swine operations have only recently begun toaddress mortality management practices as an integralpart of their operation, CNMP needs were set at 70percent for all sizes and types of swine operations.
Feedlot upgrades
The cost of feedlot upgrades was applied only to cattleon feed (fattened cattle and confined heifers) andconsists of improving the open lot area where cattleare held to ensure the proper functioning of collectionsystems. It includes grading to enhance drainage and aconcrete pad to protect drainage collection and diver-sion areas during manure collection activities. (Theselot upgrades exclude the costs of berm constructionfor diverting contaminated water into the storagepond, which are costed separately.)
A 750-head fattened cattle operation was used as abasis for deriving representative costs for this compo-nent. Costs were estimated assuming installation of111 cubic yards of concrete (6,000 square feet) at $200per cubic yard, and 1,700 cubic yards of earthmovingand shaping at $2.00 per cubic yard. (These costs weretaken from the Iowa State Beef Feedlot SystemManual—PM 1867, January 2001.) The total capital
cost is thus $25,600 per 750-head operation, or $34 perhead. The amortized annual cost is $5.09 per head.
Most operations typically have addressed this compo-nent as a part of their existing management systems,so needs were judged to be comparatively low, asfollows:
• 15 percent for fattened cattle farms with a scrapeand stack operation
• 30 percent for confined heifer farms with ascrape and stack operation
• 30 percent for the smaller fattened cattle farmswith manure pack
• 5 percent for the larger fattened cattle farms withmanure pack
Clean water diversions
Clean water diversions are used to minimize theamount of rainfall runoff that can come in contact withareas of the animal production operation where ma-nure and wastewater are present, primarily the openlot areas. The types of clean water diversions used inthis study were roof runoff management, earthenberms with a surface outlet, earthen berms with under-ground pipe outlets, and grassed waterways. Becausediversions were only essential for operations with anopen lot, clean water diversions were not applied tooperations that only confined animals in buildings.
Roof runoff management
Gutters and downspouts were used to capture rainfallon the roofs of buildings to route the water from theproduction area. This kind of clean water diversionwas applied to dairy, turkey, and swine operations thatprovided outside access to animals. Fattened cattleoperations were not included because typically theseanimals are raised in a feedlot without any buildings orstructures within the confinement area.
The per-unit costs used were taken from the NRCSField Office Technical Guide, Section 1, Annual CostList. The installation cost for a standard gutter anddownspout used in most areas of the United States is$2.25 per foot. In areas of higher rainfall, such as theSoutheast, a larger gutter is needed at a cost of $4.50per foot. Since downspouts are often damaged byanimals and machinery, repairs and maintenancewere assumed to be an additional 7 percent of the
74
Costs Associated with Development and Implementation of Comprehensive Nutrient Management Plans
Part I—Nutrient Management, Land Treatment, Manure and Wastewater Handling and Storage, and Recordkeeping
installation cost. (This 7 percent is in addition to themaintenance costs estimated as 3 percent of all capitalcosts, bringing the total percentage for maintenancecost for this component to 10 percent.) The estimatedquantities of gutters and downspouts used per typeand location of facility were based on average buildingsize and typical building capacities. Dairy costs werebased on 200 feet of gutters and 40 feet of downspoutsfor a 100-cow dairy, and converted to a per-head basis.The annual capital cost for dairies, including mainte-nance and repair, was $2.37 per head in the Southeastand $1.18 per head for other regions. For turkeyranches, the annual capital cost was $473 per house,assuming 800 feet of gutter and 160 feet of down-spouts per house. For swine farms with buildings andoutside access, the annual capital cost was $0.85 peranimal unit, based on 200 feet of gutter and 40 feet ofdownspouts for a 140-AU operation.
Roof runoff management has been a neglected compo-nent on some systems, but is commonly present onother systems. Larger operations are expected to havefewer needs than smaller operations. CNMP needswere assigned as follows:
• 30 percent for swine farms with buildings andoutside access
• 90 percent for turkey ranches• 80 percent for Dairy Belt dairies #1 and #2 (solids
systems) with up to 270 AU• 45 percent for Dairy Belt dairies #1 and #2 with
more than 270 AU• 40 percent for all other dairies
Earthen berms with underground pipe outlets
This type of clean water diversion was used for fat-tened cattle operations with a manure pack method ofmanaging waste as well as for all dairy operations.These operations generally take advantage of the reliefof the land to provide drainage within the lot. Often,these operations have dry or intermittent streams(swales) that run through the feedlot areas. To controlclean water upgradient of the lot, a small earthen bermis installed across the swale above the feedlot or lot tocatch the clean runoff and then outlet the waterthrough an underground pipe to some point down-stream of the feedlot area.
The cost of installing the earthen berm associated withthis system addressed the cost of hauling and shapingactivities. The berm used for this type of system isconsiderably shorter than those for other diversion
practices because its only function is to create atemporary pool that will drain out through the under-ground pipe. Although the berm length is considerablyshorter than the other berms described in this section,it is usually higher to create sufficient hydraulic pres-sure to discharge through a long pipeline. The as-sumed dimensions of the berm were based on a trap-ezoidal shape with an 8-foot top width, 3 horizontal to1 vertical side slopes, and 3 feet of average height (1.9cubic yards per foot of length) for a length of 30 feetper berm. The cost per cubic yard was $2 installed, or$115 per berm. The estimate for the underground out-let pipe was based on a 12-inch diameter corrugatedmetal pipe, and unit costs reflect the cost of pipe andinstallation activities, such as excavation, laying thepipe, and backfill. Lengths were estimated based onprofessional judgment of a typical distance through afeedlot based on a particular size of operation. Largeroperations could require more than one berm and pipeoutlet per feedlot. Per-unit costs were taken from theNRCS Field Office Technical Guide, Section 1, AnnualCost List. Cost estimates were developed for threedifferent-sized operations as follows.
Number Linear Pipe Number Berm Total Cost Annualof feet of cost of 30- cost cost per cost peranimals pipe per foot ($) installed animal animal
foot ($) berms ($) ($) ($)
75 200 12 1 115 2,515 34 5.07
150 360 12 1 115 4,435 30 4.47
600 1,200 12 3 345 14,745 25 3.58
Using these three cost estimates, the following ruleswere established for assigning costs to farms on a per-head basis:
• If the number of head is less than 100, then thecost per head is $5.07.
• If the number of head is between 100 and 300,then the cost per head is $4.47.
• If the number of head is more than 300, then thecost per head is $3.58.
Most of these operations already have this practice inplace or do not need it because of the characteristicsof the terrain near the facility. Some systems in someregions of the country, however, were judged to haverelatively high needs. CNMP needs were assigned asfollows:
• 20 percent for the smaller fattened cattle farms• 10 percent for the larger fattened cattle farms
75
Costs Associated with Development and Implementation of Comprehensive Nutrient Management Plans
Part I—Nutrient Management, Land Treatment, Manure and Wastewater Handling and Storage, and Recordkeeping
• 50 percent for dairy representative farm #1(Dairy Belt)
• 50 percent for dairy representative farm #2 inDairy Belt with <270 AU
• 30 percent for dairy representative farm #2 inDairy Belt with >270 AU
• 20 percent for dairy representative farm #2 inWest and Southeast
• 30 percent for dairy representative farm #3• 40 percent for dairy representative farm #4• 20 percent for dairy representative farm #5 in
Southeast and in West with <270 AU• 10 percent for dairy representative farm #5 in
West with >270 AU
Grassed waterways
Grassed waterways are shaped channels that areseeded to establish vegetation. They are used for cleanwater diversion in areas that receive sufficient annualrainfall that vegetation can be maintained naturallyand where the runoff-contributing watershed is rela-tively small. These waterways are more efficient thanan earthen berm because they can handle larger flowswithout concern of erosion. This is a typical practiceused east of the Mississippi River. This practice wasused to represent the clean water diversion treatmentneeds for fattened cattle operations and confinedheifer operations that utilize a stack and scrape ma-nure management system. Only 15 percent of theseoperations were assumed to need to install this prac-tice because of its common use.
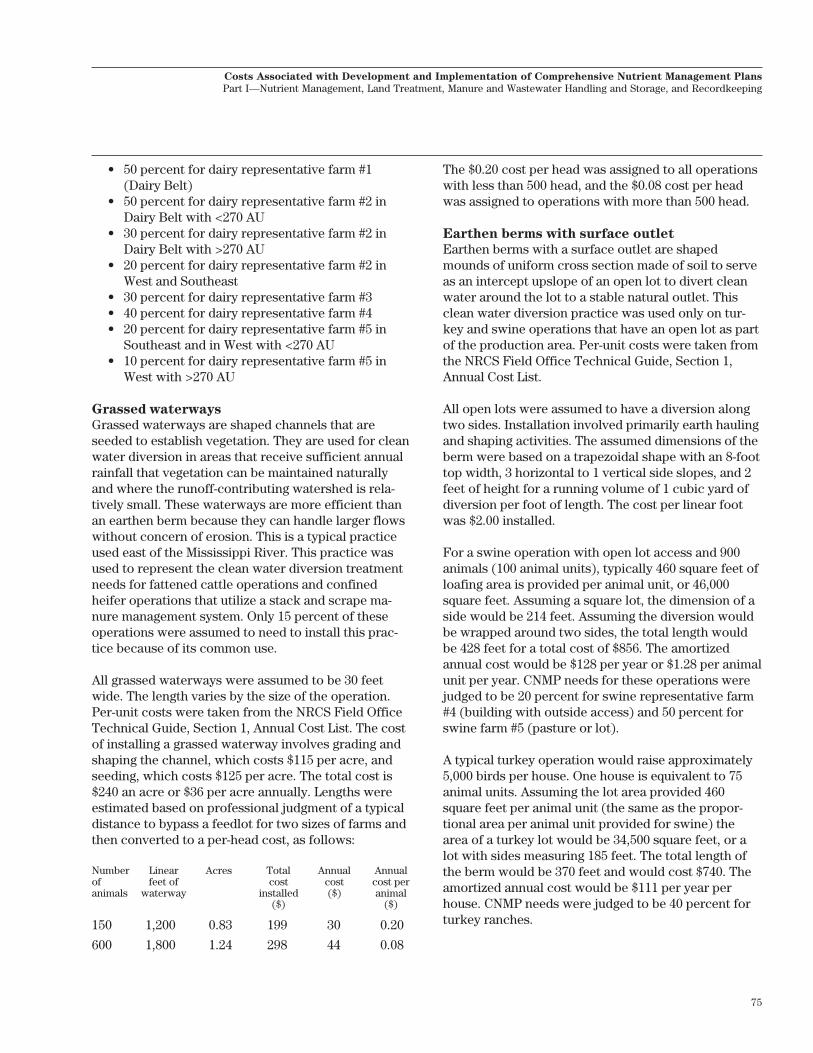
All grassed waterways were assumed to be 30 feetwide. The length varies by the size of the operation.Per-unit costs were taken from the NRCS Field OfficeTechnical Guide, Section 1, Annual Cost List. The costof installing a grassed waterway involves grading andshaping the channel, which costs $115 per acre, andseeding, which costs $125 per acre. The total cost is$240 an acre or $36 per acre annually. Lengths wereestimated based on professional judgment of a typicaldistance to bypass a feedlot for two sizes of farms andthen converted to a per-head cost, as follows:
Number Linear Acres Total Annual Annualof feet of cost cost cost peranimals waterway installed ($) animal
($) ($)
150 1,200 0.83 199 30 0.20
600 1,800 1.24 298 44 0.08
The $0.20 cost per head was assigned to all operationswith less than 500 head, and the $0.08 cost per headwas assigned to operations with more than 500 head.
Earthen berms with surface outlet
Earthen berms with a surface outlet are shapedmounds of uniform cross section made of soil to serveas an intercept upslope of an open lot to divert cleanwater around the lot to a stable natural outlet. Thisclean water diversion practice was used only on tur-key and swine operations that have an open lot as partof the production area. Per-unit costs were taken fromthe NRCS Field Office Technical Guide, Section 1,Annual Cost List.
All open lots were assumed to have a diversion alongtwo sides. Installation involved primarily earth haulingand shaping activities. The assumed dimensions of theberm were based on a trapezoidal shape with an 8-foottop width, 3 horizontal to 1 vertical side slopes, and 2feet of height for a running volume of 1 cubic yard ofdiversion per foot of length. The cost per linear footwas $2.00 installed.
For a swine operation with open lot access and 900animals (100 animal units), typically 460 square feet ofloafing area is provided per animal unit, or 46,000square feet. Assuming a square lot, the dimension of aside would be 214 feet. Assuming the diversion wouldbe wrapped around two sides, the total length wouldbe 428 feet for a total cost of $856. The amortizedannual cost would be $128 per year or $1.28 per animalunit per year. CNMP needs for these operations werejudged to be 20 percent for swine representative farm#4 (building with outside access) and 50 percent forswine farm #5 (pasture or lot).
A typical turkey operation would raise approximately5,000 birds per house. One house is equivalent to 75animal units. Assuming the lot area provided 460square feet per animal unit (the same as the propor-tional area per animal unit provided for swine) thearea of a turkey lot would be 34,500 square feet, or alot with sides measuring 185 feet. The total length ofthe berm would be 370 feet and would cost $740. Theamortized annual cost would be $111 per year perhouse. CNMP needs were judged to be 40 percent forturkey ranches.
76
Costs Associated with Development and Implementation of Comprehensive Nutrient Management Plans
Part I—Nutrient Management, Land Treatment, Manure and Wastewater Handling and Storage, and Recordkeeping
Liquid treatment
Small dairy operations that remove solids daily orweekly would continue to handle their manure as asolid and use a liquid treatment approach to handle theliquid component. Generally, cows on these operationsare kept on pasture most of the day. However, they arebrought in to be milked, and as a result spend sometime in an open lot. During storms, runoff from theopen lot would contain manure and related wastes, butthis would normally be a small volume. Milk-housewashings would also generate small amounts of waste-water. For these operations it was assumed that therunoff and milk-house washings could be handled witha biofilter. A biofilter is a small, vegetated area thatfunctions similar to a wetland by capturing the runoffand bioprocessing it through infiltration of nutrientsinto the soil for use by the vegetation. Use of a biofilterfor liquid treatment precludes the need for collection,transfer, or storage of liquid wastes on these farms.
For the purposes of this simulation, the biofilter wasassumed to be a vegetated filter strip of 12,000 squarefeet, at $0.25 per square foot for a cost of $3,000. Theconstruction of the filter would be accomplished byland grading equipment. Based on an average sizeoperation of 75 milk cows, the capital cost is $6.00 percow annually.
A liquid treatment component was included for dairyrepresentative farms #1 and #2 with less than 135 AUper farm. CNMP needs were judged to be high for thiscomponent; 65 percent for farm #1 and 75 percent forfarm #2.
Collection and transfer
The collection and transfer component addresses theinstallation and operation of practices associated withhandling the manure and wastewater within the pro-duction area. The type of collection used depends onthe type of animal feeding operation, consistency ofthe manure handled, and the type of managementsystem used. Management systems for animals raisedin buildings address a single manure consistency,either a liquid/slurry or a solid. Operations that useopen lots generally need to address both solids andliquids because manure and contaminated runoff aregenerally handled separately.
CNMP costs were determined for three types of collec-tion systems: solids collection, liquid collection withflush systems, and contaminated runoff collection. Forthe last two types of collection systems, a liquid pump-ing system is needed to transfer the wastewater to astorage structure and/or from the storage structure toland application equipment. For solids, manure istransferred to a solids storage facility during collec-tion.
Almost all model farms include either a collection or atransfer component, or both. Representative farmsthat predominantly handle manure as a slurry, how-ever, have storage pits either under the building oradjacent to the housing facility, requiring only rinsingto collect the manure. For these representative farms,it was assumed that the collection structures would beadequate and that only a transfer component may beneeded. These farms include veal, swine representa-tive farms #2 and #3, dairy representative farms #1 and#2 with more than 135 AU, and dairy representativefarm #3. Dairy representative farms #1 and #2 with lessthan 135 AU have a liquid treatment component (filterstrip for milk-house washings) and so would not needa collection or transfer component.
Solids collection
Solids collection is a component for all operationsexcept for swine and dairy farms with complete liquidor slurry systems, layer farms with liquid systems, andveal farms. Generally, most operations have an ad-equate collection system already in place, so CNMPneeds are expected to be low. CNMP needs werejudged to be 10 percent for all but the cases listedbelow:
• 2 percent for broiler farms• 15 percent for turkey farms (representative
farms #1 and #2)
Solids collection for dairy, fattened cattle, confinedheifers, and for swine raised in a building with outsideaccess or in a pasture or lot was assumed to consist ofa tractor scraper used to collect and pile the manureon a concrete slab. Costs are based on the amount ofmanure to be handled, which is estimated in appendixB. The scrape operation costs are based on a 37-hptractor with scraper at a purchase price of $22,000.Assuming this equipment is dedicated 80 percent tothis function, the annual cost is $3,591. Conventionalguidelines for estimating annual operating costs—fuel,oil, and labor—for equipment used on an intermittent
77
Costs Associated with Development and Implementation of Comprehensive Nutrient Management Plans
Part I—Nutrient Management, Land Treatment, Manure and Wastewater Handling and Storage, and Recordkeeping
basis, as in this case, is 15 percent of the purchaseprice (Tilmon and German, 1997). Thus, the annualoperating costs were estimated to be $3,300 per year.The cost per ton was determined for a 150-head dairyoperation, which was then used for all dairy, fattenedcattle, confined heifer, and swine farms that had asolids collection component. A 150-head dairy opera-tion has about 200 animal units and produces about580 tons of manure at transport and handling weight(assuming about 2.2 tons of manure as excreted atoven-dry weight, converting to a handling weight bymultiplying by 2, and adjusting for recoverability witha 0.65 recovery factor). Thus, capital costs are $6.20per ton of solids and operating costs are $5.70 per ton.
The cost of solids collection for broilers, pullets,turkeys, and layers with a high-rise or shallow pitproduction system that raise poultry in confinementbuildings was based on the assumption that the build-ings are partly cleaned out after each flock and com-pletely cleaned out once per year. A custom rate wasused, and since most of the cost is labor, it was catego-rized as an operating cost, even though a portion of thecost covers the cost of the equipment. The custom rateused was determined based on several sources ofinformation obtained from University Extension Ser-vice and private industry sources. The rates variedfrom $0.02 to $0.07 per square foot depending on thesize of the house and regional location. However, thepredominant price range was from $0.04 to $0.065(including both annual cleanout and four to five cake-outs per year.) Averaging the costs from the sourcesconsidered provided a custom rate of $0.053 cents persquare foot of house. An average size broiler andturkey house is about 20,000 square feet, producing anannual cleanout cost estimate of $1,060 per house. Theaverage size of a layer or pullet house with a 50,000-bird capacity is about 24,000 square feet, producing anannual cleanout cost of $1,272 per house.
For layer operations that use a mechanical belt systeminstalled beneath the layer cages, manure falls directlyonto the belt, and periodically the belt empties itselfonto a stacking area. For layer operations that use ascraper type system, the litter produced is removedfrom the building by mechanical scrapers and depos-ited in a stacking area. Solids collection for these twotypes of operations was viewed as the activity to movethe litter deposited in the stacking areas at the ends ofbuildings to a central storage area or directly intotrucks for transport off-farm. Cost was based on
equipment rental rates for a 150-hp front-end loader (3yard bucket) at $15.08 per hour and an operator costof $10.00 per hour. Based on a weekly manure produc-tion of about 42 tons of litter per house (50,000 birds),the time needed to move the litter is approximately 1.5hours per week per house for 78 hours per year, or$1,956 per house annually.
Liquid collection with flush systems
The flush system is used commonly by dairy, swine,and layer operations that handle their wastes as aliquid. Waste is collected by the flushing of floor gut-ters within the barn to move waste and water to acollection tank, where it is transferred to a holdingpond or lagoon by gravity or a transfer pump. Existingflush operations are assumed to have most of thesystem in place. Therefore, systems would only needto be upgraded to be consistent with any modificationsin the storage and handling systems. Componentsassumed to be needed were a flush tank, collectiontank, transfer pipe, and a pit agitation pump. CNMPneeds were judged to be comparatively low for thefollowing representative farms with flush systems:
• 10 percent for swine representative farm #1(liquid system with lagoon or storage pond)
• 10 percent for layer representative farm #2 (flushto lagoon)
• 30 percent for dairy representative farm #4(liquid system with lagoon or storage pond) withless than 270 AU
• 40 percent for dairy representative farm #5(liquid system with lagoon or storage pond) withless than 270 AU
• 20 percent for dairy representative farm #4 or #5with more than 270 AU
Costs for three sizes of dairy farms were used as thebasis for flush cost systems. The base system for thesmallest operations included two collection tanks (10feet wide by 20 feet long and 8 feet deep); a transferpipe (50 feet of 100-lb/in2 PVC); and an agitation pump(PTO driven impeller). Costs for larger systems wouldaccount for the increased size needed to handle moreanimals. Operating costs cover fuel, oil, electricity, andpump maintenance. For these systems, the cost of thepipe used to transfer the waste to the field for applica-tion was treated as a hauling cost, and the cost ofpumping to the field for irrigation is covered under thepumping transfer system costs. The dairy liquid collec-tion costs are summarized in table 26.
78
Costs Associated with Development and Implementation of Comprehensive Nutrient Management Plans
Part I—Nutrient Management, Land Treatment, Manure and Wastewater Handling and Storage, and Recordkeeping
The costs shown in table 26 were applied to dairyrepresentative farms #4 and #5. Dairies with less than150 head were assigned a capital cost of $28.99 perhead. Dairies with 150 to 250 head were assigned acapital cost of $24.57 per head. Dairies with more than250 head were assigned a capital cost of $23.10 perhead. Operating costs for all size farms were $11.84per head.
The same components are also needed for swineoperations with liquid wastes (swine representativefarm #1) and layer farms with liquid wastes (layerrepresentative farm #2). The costs above were con-verted to an animal unit basis for these swine farmsand to a per-house basis for the layer farms. Theannual capital cost was $20.70 per AU for swine farmswith less than 200 animal units, $17.55 per AU forfarms with 200 to 400AU, $16.50 per AU for farms withmore than 400 AU, and annual operating costs were$8.46 per AU for all size groups. For layers, the annualcapital cost was $3,157 per house, and the annualoperating cost was $1,291 per house.
Contaminated runoff collection
Earthen berms are used to divert rainfall runoff thathas come in contact with manure in the productionarea to a storage pond. These contaminated waterdivisions would be located on the down-gradient endof the production area. The types of contaminatedwater diversions typically used are earthen berms witha surface outlet and earthen berms with pipe outlets.
Contaminated water diversions are necessary compo-nents for all fattened cattle and confined heifer repre-sentative farms as well as turkey ranches and swinefarms with a pasture or lot (swine farm #5). It wasassumed that lots on dairy farms and swine farms witha building and open access would be small enough thatcontaminated water diversions would not be neededor would be incorporated into the structure of therunoff storage pond.
Typically, turkey operations and swine raised in apasture or lot would use an earthen berm with a sur-face outlet that diverts the runoff to a small storagepond. The construction is similar to earthen bermswith surface outlets used for clean water diversion.Based on costs used for the clean water diversionberms presented previously, the annual capital costwould be $111 per house for turkey ranches and $1.28per animal unit for swine. CNMP needs were judged tobe comparatively high for these farms, as follows:
• 50 percent for swine representative farm #5• 90 percent for turkey ranches
Fattened cattle and confined heifer operations use asimilar system; however, they would generally outletthe captured contaminated runoff through a pipe into aholding pond. These types of operations generally takeadvantage of the relief of the land to provide drainagewithin the lot. On the downslope end of the lot, anearthen berm is constructed that channels all lotrainfall runoff to a pipe outlet that conveys the con-taminated runoff water to a holding pond or lagoon.
The cost of the earthen berm was calculated based onthe following assumptions: the shape was trapezoidalwith an 8-foot top width, the side slopes were 3 hori-zontal to 1 vertical, and the height was 2 feet. The unitcost of the berm is $2.00 per linear foot, taken fromthe NRCS Field Office Technical Guide, Section 1,Annual Cost List. The length of the berm was equal tothe downslope width of the lot. The following ap-proach was used to determine the length of berm: firstit was assumed that each animal unit was provided 460square feet of lot space, then the total lot size wascomputed by multiplying the number of animal unitsby 460, and then the square root of the area was takento represent the berm length. The outlet pipe wasassumed to be a 12-inch diameter corrugated metalpipe (CMP). The unit cost for pipe, $12 per foot, re-flects the cost of the pipe and installation activities,such as excavation, laying the pipe, and backfill. The
Table 26 Cost estimates for liquid collection with flushsystems for dairy farms
Costs Associated with Development and Implementation of Comprehensive Nutrient Management Plans
Part I—Nutrient Management, Land Treatment, Manure and Wastewater Handling and Storage, and Recordkeeping
length of pipe needed on any particular site variesdepending on the distance from the berm to the stor-age pond. To simulate this variation, it was assumedthe length of pipe was 20 percent of the length ofdiversion.
Three size categories were used for assigning costs tothe fattened cattle and heifer farms:
Size 1 Size 2 Size 3
Animal number (head) 116 308 616
Area of lot (ft2) 53,130 141,080 283,360
Length of berm (ft) 230 376 532
Cost of berm ($) 460 752 1,064
Cost of berm per head ($) 3.96 2.44 1.72
Linear feet of pipe 46 75 106
CMP cost per foot ($) 12 12 12
Cost of pipe installed 4.76 2.93 2.07per head ($)
Annual cost per head ($) 1.31 0.80 0.56
Using these three cost estimates, the following ruleswere established for assigning capital costs to farmson a per-head basis:
• If the number of head is less than 200 then thecost per head is $1.31.
• If the number of head is between 200 and 450then the cost per head is $0.80.
• If the number of head is more than 450 then thecost per head is $0.56.
It was judged that the majority of fattened cattle andconfined heifer operations would need contaminatedwater diversions. CNMP needs were assigned asfollows:
• 55 percent for confined heifer and fattened cattlefarms with a scrape and stack manure handlingsystem in the South and West
• 40 percent for confined heifer and fattened cattlefarms with a scrape and stack manure handlingsystem in the Midwest and the Northeast
• 60 percent of the smaller fattened cattle opera-tions with manure pack
• 50 percent of the larger fattened cattle opera-tions with manure pack
Pumping transfer system
All model farms that must handle waste or wastewaterin a liquid or slurry form will need to facilitate thetransfer of that liquid or slurry from the storage struc-ture (storage pit, holding pond, lagoon, or runoffstorage pond) to the appropriate conveyance for landapplication. Some operations will own a pump for thispurpose, but the smaller operations would likely rentthe equipment. Costs were therefore estimated on aper-ton basis using a standard rental rate. Severalrental rates were obtained from the literature. Rentalrates varied depending on the geographic location, butthe rates were all within about 15 percent of eachother. The average rate was $140 per 8-hour day, or$17.50 per hour. The pumping rate used in the landapplication section was 500 gallons per minute, whichconverts to about 1.5 tons per minute (267 gallons perton), or 90 tons per hour, after allowing for about 20percent down time for setup or for moving the pump.Thus, the capital cost of the pump would be about$0.20 per ton. Operating costs would be minimal,consisting primarily of fuel costs. An operating cost of$0.06 per ton was based on the cost of 3 gallons of fuel($1.65 per gallon) per hour.
These costs would be appropriate for operations thatuse irrigation systems to land apply the wastewater.However, for smaller operations that use a tank truckand sprayer to land apply wastes, additional downtime needs to be factored into the costs to account forthe multiple trips to the field needed to empty theliquid storage facility. During these trips, the operatorwould still pay a rental charge but the pump would beidle. In the section on nutrient management costs, weassumed that operations with less than 1,000 tons ofliquid wastes per year would use a tank truck andsprayer for land application. Assuming the pumpwould only be operated 40 percent of the time forthese smaller operations, the pumping rate would beabout 45 tons per hour and thus capital costs would be$0.40 per ton. Operating costs would remain the sameat $0.06 per ton.
CNMP needs for pumping transfer systems wereassumed to be the same as the needs for storage (i.e.,runoff storage pond, slurry storage, or liquid storageponds or lagoons).
80
Costs Associated with Development and Implementation of Comprehensive Nutrient Management Plans
Part I—Nutrient Management, Land Treatment, Manure and Wastewater Handling and Storage, and Recordkeeping
Storage of solid wastes
The part of the manure that can be handled as a solid,including bedding material, is collected from produc-tion areas and stored until it can be land applied. Toefficiently use manure nutrients to fertilize crops, thewindow of opportunity to land apply manure is limited.Therefore, an essential part of a CNMP is manurestorage facilities that have enough capacity to holdmanure until the proper time for land application.
Solids storage is included as a CNMP component fordairy representative farms #1 and #2, fattened cattleand confined heifer farms with a scrape and stacksystem for manure handling, swine representativefarm #4 (building with outside access), and for allpoultry except layer farms with a flush to lagoonsystem. Fattened cattle farms and dairy farms in theWest with a manure pack system do not need a sepa-rate solids storage component, since the manure packis the method of storage. Similarly, swine farm #5 doesnot need a storage component because the solids canbe collected from the lot or pasture at the time ofapplication.
Conservation practice standards used in CNMP devel-opment do not require a minimum period of storagebecause the storage requirements would vary depend-ing on the crop growing season, the crops beinggrown, climate, and type of management system inplace. These factors determine what the storage ca-pacity should be on a particular farm. For purposes ofthis assessment, however, general minimum storagecapacities were established so that cost estimatescould be made. Consistent with typical managementpractices used in the poultry industry, the storagecapacity is assumed to be 1 year of litter productionfor all poultry types. For other animal sectors thestorage period is generally less than 1 year because thesolids can be handled more frequently and the limitingperiod of storage would be dictated by availability ofcropland to receive the manure. For most of the coun-try, it was assumed that 180 days (50 percent of thestorage period for poultry) represented the typicallength of storage because it would allow storage ofmanure through the winter and wet months of theyear. Model farms in the Southeast, in most cases, canproduce some type of crop year around, so would notneed a 180-day storage capacity. In the Southeaststorage time was set at 90 days. (For this purpose, the
Southeast States are Texas, Louisiana, Mississippi,Alabama, Georgia, Florida, and South Carolina.)
Storage costs were determined as the cost per ton ofsolids using the hauling weight to approximate thetons to be stored. The cost per ton was determinedusing a typical storage facility for a broiler operation.This cost per ton was then applied to all livestocktypes after adjusting for storage time needed. Forexample, the cost per ton, which was based on a 365-day storage capacity, was multiplied by 0.5 to estimatethe cost per ton for operations that only needed a 180-day storage capacity.
The solid storage structure for a typical broiler housewas used as the basis for calculating the costs ofstorage needs for all model farms. The storage cost forbroilers was based on a 1,600-square-foot timber shedwith end bays, push walls, and a concrete floor. Theshed cost $12,403, or $1,863 per year per house. Usingthe information presented in appendix B, table B–7, ontons of manure at transport weight, it was determinedthat the average amount of manure per poultry housewas about 267 tons per year, including bedding. Thus,the cost per ton is about $7 for all poultry farms. Forother livestock types except the Southeast, the costper ton is $3.50 after adjusting for the needed storagecapacity. Similarly, the cost per ton in the Southeast is$1.75 per ton. The total storage cost for each operationwas determined by multiplying these cost per tonvalues times the total tons of recoverable solid manure(at hauling weight) produced in a year.
Generally, the majority of operations are expected tohave an adequate solids storage system already inplace. The major exception is dairy farms in the DairyBelt that reported no solids storage in the NAHMSfarmer survey. CNMP needs for solids storage werejudged to be as follows:
• 100 percent for dairy farm #1 in the Dairy Belt• 20 percent for dairy farm #2 with 35 to 135 AU
and all sizes in the West• 40 percent for dairy farm #2 in the Dairy Belt
with 135 to 270 AU• 10 percent for dairy farm #2 in the Southeast
with more than 135 AU• 25 percent for fattened cattle and confined heifer
farms with a scrape and stack system• 40 percent for confined heifers in confinement
barns• 60 percent for swine representative farm #4
81
Costs Associated with Development and Implementation of Comprehensive Nutrient Management Plans
Part I—Nutrient Management, Land Treatment, Manure and Wastewater Handling and Storage, and Recordkeeping
• 55 percent for layer farms in the Southeast, West,and South Central regions with less than 400 AU
• 30 percent for layer farms in the Southeast, West,and South Central regions with more than 400 AU
• 40 percent for layer farms in the North Centraland Northeast region with less than 400 AU
• 20 percent for layer farms in the North Centraland Northeast region with more than 400 AU
• 40 percent for broiler farms in the East and pulletfarms in the North with less than 440 AU
• 50 percent for broiler farms in the West andturkey farms with less than 440 AU
• 60 percent for pullet farms in the South and Westwith less than 440 AU
• 25 percent for all broiler farms, pullet farms, andturkey farms with more than 440 AU
Storage of slurry wastes, liquidwastes, and contaminated runoff
Slurry wastes, liquid wastes, and contaminated runoffare normally stored in earthen or fabricated struc-tures. Earthen structures are also used to treat manurein an anaerobic, aerobic, or aerated lagoon. Whilelagoons and earthen storages look similar, the designprocess for each is different.
In this study, the nonsolid storage facilities weredesignated as liquid storage, slurry storage, and runoffstorage ponds. Liquid and slurry systems are differenti-ated by the consistency of the material being stored asdetermined by the livestock type and the total solidscontent of the manure. The breakpoint between liquidand slurry manure varies by livestock type. Liquidstorages and runoff storage ponds are identical inappearance. Liquid storage ponds as described heregenerally store more wash water than runoff water,while the runoff storage ponds generally store morerunoff water than wash water. Thus, a runoff storagepond for a small dairy will capture wash water as well.
Liquid storage
The category of liquid storage includes both liquidstorage and treatment lagoons. Most treatment la-goons provide a storage function as well as a treat-ment function. The design concept for anaerobiclagoons is to size the structure based on the treatmentvolume needed to degrade the organic material. Addi-tional volume is added for long-term storage of sludge(decay residuals) and storage volumes.
Liquid storage in ponds or lagoons is a component ofmanure management systems for some swine, dairy,and layer model farms. These typically are flush sys-tems where wastewater is gravity fed or pumped tostorage ponds or lagoons. Most of these operations areassumed to have adequate liquid storage or treatmentsystems in place. However, some may be in disrepair,under-capacity, or may need to be replaced entirely.CNMP needs for liquid storage, with the exceptionnoted below, were judged to be the following:
• 20 percent for dairy farm #4 in the Dairy Beltwith 35 to 135 AU
• 30 percent for dairy farm #4 in the Dairy Beltwith135 to 270 AU
• 40 percent for dairy farm #4 in the Dairy Beltwith more than 270 AU
• 30 percent for dairy farm #5 in the Southeast• 30 percent for dairy farm #5 in the West with less
than 270 AU• 20 percent for dairy farm #5 in the West with
more than 270 AU• 40 percent for layer farm #3 (flush to lagoon)• 20 percent for swine farm #1 for all sizes and
regions
It was recognized that a portion of the operationswould choose to convert from one method of handlingmanure to another method as long as improvementsare being made to the operation. Changes that willtake place cannot be predicted, so the general assump-tion was that the method of handling manure wouldremain the same after CNMP implementation. In thecase of representative farm #2 for the largest dairies inthe Dairy Belt, however, labor costs associated withproperly handling the manure as a solid would be toohigh, and the operator would most likely convert to aliquid system. Thus, CNMP needs are 100 percent forthe liquid storage component on these farms.
The cost of constructing a pond or lagoon was esti-mated for each model farm using a representativenumber of animals per farm for each model farm. Fordairy farms, the representative number of animals wasestimated as 137 percent of the number of milk cows,which accounts for the dairy herd plus dry cows (17percent) and calves and heifers (20 percent). Storagecapacity was assumed to be 180 days for all systems.The calculated annual cost was then converted to aper head basis (dairy), a per animal-unit basis (fat-tened cattle), or a per house basis (layers).
82
Costs Associated with Development and Implementation of Comprehensive Nutrient Management Plans
Part I—Nutrient Management, Land Treatment, Manure and Wastewater Handling and Storage, and Recordkeeping
Pond or lagoon sizes were developed using the NRCSAnimal Waste Management (AWM) engineering designprogram. AWM integrates all aspects of the sizingprocess to meet current NRCS conservation practicestandard criteria for Waste Storage Facility and WasteTreatment Lagoon. Where appropriate, a treatmentcomponent was included in the design. Categorieswere further defined to reflect regional differences. Atypical set of climate data (monthly precipitation andevaporation) was selected for each region representa-tive of the model farm. AWM then calculated manurevolume for 180-day storage, 180-day normal rainfall onthe pond surface, the rainfall on the pond surface froma 25-year 24-hour storm event, and as appropriate, the180-day runoff volume, for the most critical 6-monthperiod of the year based on location. Where the liquidis recycled for flushing, AWM allows the designer toreduce inputs. The AWM program also adjusted vol-umes for evaporation. The results from AWM gavepond/lagoon dimensions and final volume in gallons.
The installation costs were based on actual cost datafor equivalent systems. The costs per gallon werecalculated from the total cost of an installed pond/lagoon by the design storage volume. Costs wereobtained from various locations across the countryfrom NRCS engineers that had first-hand knowledge ofan actual system. The costs used in this assessmentreflect averages of the information received fromacross the country. Various systems were included inthe development of costs that included partially exca-vated ponds, complete earthen fill ponds, and flexiblemembrane lined ponds. Installation costs per gallonwere: 2.2 cents per gallon for pond/lagoons with acapacity of less than 1 million gallons, 1.8 cents pergallon for capacities from 1 million to 3 million gallons,and 1.5 cents per gallon for greater than 3 milliongallons.
Costs associated with liquid storage are shown in table27 for each model farm.
Slurry storage
Slurry storage in earthen pits, concrete tanks, or smallstorage ponds is a component of manure managementsystems for some swine, dairy, and veal model farms.These often are storage facilities beneath a slattedfloor. Storage facilities were designed for 120 days ofstorage to reflect common practice in the industry.Most of the dairy operations for representative farmnumber 3 and veal farms originally were slurry sys-tems, so most are assumed to already have adequatestorage systems. For swine farms with slurry systems,it was assumed that the majority would need extensiveupgrades to meet the 120-day storage requirement.CNMP needs for slurry storage were judged to be asfollows:
• 20 percent for dairy farm #3 in the Dairy Beltwith 35 to 135 AU
• 30 percent for dairy farm #3 in the Dairy Beltwith 135 to 270 AU
• 40 percent for dairy farm #3 in the Dairy Beltwith more than 270 AU
• 30 percent for veal farms• 50 percent for swine farm #3• 60 percent for swine farm #2
Slurry storage facility costs were estimated in thesame manner as liquid storage ponds and lagoons,using the same approach and the same costs pergallon. Costs associated with slurry storage are shownin table 28 for each model farm.
83
Costs Associated with Development and Implementation of Comprehensive Nutrient Management Plans
Part I—Nutrient Management, Land Treatment, Manure and Wastewater Handling and Storage, and Recordkeeping
Table 27 Per-unit cost estimates for liquid storage
Livestock Represent- Region Number Storage Total Annual Cost per unittype ative farm animals per unit size installation installation
farm used to (gal) cost costdesign pond ($) ($) ($)
Dairy 2,4 Dairy Belt 300 4,342,477 65,137 9,707 32.36 per headDairy 4 Dairy Belt 200 2,893,414 52,081 7,762 38.81 per headDairy 4 Dairy Belt 100 1,321,828 23,793 3,546 35.46 per headDairy 5 SE 100 1,580,733 28,453 4,240 42.40 per headDairy 5 SE 300 4,573,781 68,607 10,224 34.08 per headDairy 5 West 100 1,607,863 28,942 4,313 43.13 per headDairy 5 West 200 3,130,253 46,954 6,997 34.99 per headDairy 5 West 300 5,216,732 78,251 11,662 38.87 per headLayers 2 SE 50,000 7,054,470 105,817 15,770 15,770 per houseLayers 2 SE 200,000 26,515,403 397,731 59,274 14,818 per houseLayers 2 SC 200,000 25,387,588 380,814 56,752 14,188 per houseSwine 1 SE 83 AU 1,165,377 17,481 2,605 31.39 per AUSwine 1 SE 248 AU 3,222,244 48,334 7,203 29.04 per AUSwine 1 NC-NE 415 AU 5,384,140 80,762 12,036 29.00 per AUSwine 1 NC-NE 2,075 AU 26,408,062 396,121 59,034 28.45 per AUSwine 1 West 415 AU 6,577,275 98,659 14,703 35.43 per AUSwine 1 West 2,075 AU 32,348,499 485,227 72,313 34.85 per AU
Table 28 Per-unit cost estimate for slurry storage
Livestock Represent- Region Number AU Storage Total Annual Cost per unittype ative farm per farm unit size installation installation
used to (gal) cost costdesign ($) ($) ($)
storage unit
Dairy 3 Dairy Belt 200 Head 1,122,000 20,196 3,010 15.05 per headDairy 3 Dairy Belt 300 Head 1,683,000 30,294 4,515 15.05 per headDairy 3 Dairy Belt 100 Head 561,000 12,342 1,839 18.39 per headSwine 2 SE 83 287,363 6,322 942 11.35 per AUSwine 2 SE 248 708,225 15,581 2,322 9.36 per AUSwine 2 NC-NE 415 1,101,176 19,821 2,954 7.12 per AUSwine 2 NC-NE 2,075 5,245,933 78,689 11,727 5.65 per AUSwine 2 West 415 1,068,808 19,239 2,867 6.91 per AUSwine 2 West 2,075 5,037,143 75,557 11,260 5.43 per AUSwine 3 NC-NE 450 2,148,585 32,229 4,803 10.67 per AUVeal 1 All 415 1,101,176 19,821 2,954 7.12 per AU
84
Costs Associated with Development and Implementation of Comprehensive Nutrient Management Plans
Part I—Nutrient Management, Land Treatment, Manure and Wastewater Handling and Storage, and Recordkeeping
Runoff storage ponds
Open lots where animals are held produce contami-nated water during rainfall events in the form of run-off. Runoff storage ponds are constructed to captureand store this contaminated water. They are neededfor pasture-based swine operations (swine farm #5)and swine operations with a lot (swine farm #4),turkey ranches, dairy farms #1 and #2, fattened cattleand confined heifer farms with a scrape and stackmanure management system, and fattened cattlefeedlots with manure pack. These ponds will alsocollect the wash water used around dairies.
A majority of these farms do not have runoff storageponds, or the existing pond is inadequate. CNMP needsfor these farms were judged to be high, as follows:
• 80 percent for dairy farms #1 and #2• 90 percent for turkey ranches• 70 percent for fattened cattle farm #2• 40 percent for fattened cattle farm #1 and
confined heifer farm #2 (scrape and stack) in the Northeast and Midwest.
• 50 percent for fattened cattle farm #1 andconfined heifer farm #2 (scrape and stack)in the Southeast and West.
• 50 percent for swine farms #4 and #5
Costs for runoff storage ponds for dairy, fattenedcattle, swine farms, and confined heifer farms wereestimated in the same manner as liquid storage pondsand lagoons, using the same approach and the samecosts per gallon. Costs associated with runoff storageponds are shown in table 29 for each model farm.
Settling basins
Settling basins are expected to be a component for allfarms with runoff storage ponds. Runoff from openlots generally carries manure solids and sometimessoil particles with it. If these solids are allowed toreach the runoff storage ponds, the operator of thesystem is faced with the problem of handling a prima-rily liquid wastewater that contains some solids,
making land application of the liquid more difficultbecause of plugging of irrigation or spray nozzles. Theoperator also must address the removal of residualsolids from the liquid holding pond periodically toensure design capacity is maintained, which is anothercost to the operator. Because animal operations thatuse open lots must already handle both solids andliquids, most operations would prefer to separatesolids from the lot runoff before it can enter the runoffstorage pond. By separating the solids from the runoff,the solids can be managed more effectively and thestorage pond can be sized and operated more effi-ciently. While it is recognized that some operationswould continue to handle the runoff as a compositemixture, the added costs of dealing with the solids inthe runoff storage pond would easily offset the cost ofinstalling a settling basin. CNMP needs for settlingbasins were the same as those for runoff storageponds.
A settling basin consists of a small holding pond with aconcrete floor and an outlet structure to allow theliquid to pass through the basin. The outlet structure isa pipe that has a perforated riser at the inlet thatallows water level control to enhance settlement ofsolids. Before entering the storage pond, runoff passesthrough the settling basin where the solids are settledout and the liquid is outlet to the storage pond. Solidsare periodically removed and land applied or storedwith other manure solids on the farm.
The sizing of settling basins was based on a typicalopen lot area size for a given animal operation size andthe expected routed rainfall runoff volume associatedwith a 10 year-24 hour rainfall event on the open lot.Four size classes of operations—100 AU, 200 AU, 500AU, and 1,000 AU—were used to calculate costs on aper AU basis. The cost of the basin construction (landgrading, excavation, placing of earthen fill) would beabout $0.04 per gallon of temporary storage volume.The concrete bottom was assumed to be 6 inchesthick, with wire mesh reinforcement, at a cost of $200per cubic yard ($3.70 per square foot) installed. Theoutlet structure was cost at $780. The costs per AUfollow:
85
Costs Associated with Development and Implementation of Comprehensive Nutrient Management Plans
Part I—Nutrient Management, Land Treatment, Manure and Wastewater Handling and Storage, and Recordkeeping
Table 29 Per-unit cost estimates for runoff storage ponds
Livestock Represent- Region Number Pond size Total Annual Cost per unittype ative farm AU per installation installation
farm used to cost costdesign pond (gal) ($) ($) ($)
Dairy 1,2 Dairy Belt 200 head 1,355,750 24,404 3,637 18.18 per head
Dairy 2 Southeast 200 head 1,337,331 24,072 3,587 17.94 per head
Dairy 2 West 200 head 731,983 16,104 2,400 12.00 per head
Swine 5 Southeast 83 241,281 5,308 791 9.53 per AU
Swine 5 West 450 632,799 13,922 2,075 4.61 per AU
Swine 4 Midwest 450 1,398,349 25,170 3,751 8.34 per AU
Confined heifers 1 Northeast 50 395,232 8,695 1,296 25.92 per AU
Confined heifers 1 Southeast 50 400,076 8,802 1,312 26.23 per AU
Confined heifers 1 Midwest 50 308,505 6,787 1,011 20.23 per AU
Fattened cattle 1 Northeast 50 395,232 8,695 1,296 25.92 per AU
Fattened cattle 1 Southeast 50 400,076 8,802 1,312 26.23 per AU
Fattened cattle 1 Midwest 50 308,505 6,787 1,011 20.23 per AU
Fattened cattle 2 Southeast 100 535,736 11,786 1,756 17.56 per AU
Fattened cattle 2 Midwest 50 234,919 5,168 770 15.40 per AU
Fattened cattle 2 Midwest 100 399,713 8,794 1,311 13.11 per AU
Fattened cattle 2 Northern Plains 350 791,552 17,414 2,595 7.41 per AU
Fattened cattle 2 Northern Plains 750 1,608,964 28,961 4,316 5.75 per AU
Fattened cattle 2 Central Plains 750 1,673,838 30,129 4,490 5.99 per AU
Fattened cattle 2 Central Plains 1,500 3,321,639 49,825 7,425 4.95 per AU
Fattened cattle 2 West 250 317,391 6,983 1,041 4.16 per AU
Fattened cattle 2 West 750 1,136,631 20,459 3,049 4.07 per AU
Turkeys 2 East 500 1,350,897 24,316 3,624 540.87 per house
Turkeys 2 Midwest 500 1,167,101 21,008 3,131 467.28 per house
Turkeys 2 California 1100 2,285,140 41,133 6,130 415.87 per house
Turkeys 2 West other than 600 1,374,213 24,736 3,686 458.50 per houseCalifornia
AUs used Storage Size of Total cost Annualfor sizing volume concrete cost
bottom per AU(gal) (ft2) ($) ($)
100 17,000 600 3,682 5.49
200 50,000 800 5,743 4.28
500 108,600 1,000 8,828 2.63
1,000 206,700 1,200 13,492 2.01
These costs were assigned to CNMP farms based onthe size of operation, as follows:
• $5.49 per AU for farms with less than 135 AU• $4.28 per AU for farms with 135 to 300 AU• $2.63 per AU for farms with 300 to 1,000 AU• $2.01 per AU for farms with more than 1,000 AU
86
Costs Associated with Development and Implementation of Comprehensive Nutrient Management Plans
Part I—Nutrient Management, Land Treatment, Manure and Wastewater Handling and Storage, and Recordkeeping
Conservation practices forpastured livestock
Pastured livestock operations differ from conventionalfeeding operations in that the animals are raisedprimarily on pasture or range, rather than in a confinedenvironment. However, pastured and range animalssometimes are confined in the more conventionalsense to provide for ease of management. For ex-ample, in areas of the country where winter is severe,a common practice is to keep pastured or range ani-mals in a confined area with a dependable watersupply and access by the farmer to provide supple-mental feed. As a result, concentrations of manure areaccumulated in these confined areas, generally nearfeed bunks and watering sources. Sometimes theseconfinement areas are located adjacent to streams andwatercourses. The focus of a CNMP for these types ofoperations is to ensure a dependable source of wateraway from the streams to eliminate direct contact withwatercourses and provide for collection and handlingof recoverable manure generated in these concen-trated areas.
Costs associated with conservation practices forpastured livestock are grouped under the manure andwastewater storage and handling element, althoughthey include some costs associated with pasturemanagement that would be expected to be included ina CNMP for these farms. As shown in appendix A,24,697 farms with pastured livestock and few otherlivestock qualified as farms that may need a CNMPbecause of the amount of recoverable manure thatwould potentially be produced on these farms. Anadditional 36,575 farms had less than 35 AU of con-fined livestock types, but had beef cattle as the domi-nant livestock type on the farm. These two groups offarms comprise the set of farms for which CNMPcomponents for pastured livestock are applied.
CNMP needs and costs associated with conservationpractices for pastured livestock were derived using thesame approach as used for the manure and wastewa-ter storage and handling element. The methods used toestimate CNMP-related costs are presented in thefollowing sections for each component. All costs,except where noted otherwise, were based on theNatural Resources Conservation Service's Field OfficeTechnical Guide's average cost lists for individualcomponents or practices. All capital costs were amor-
tized over 10 years at 8 percent interest. Cost andneeds assumptions are summarized in appendix E,table E–1.
Fencing
To properly control the access of animals to water,feed, and loafing areas, a planned system of fencing isneeded that is consistent with each individual animalfeeding operation’s management strategy. Often theneed is primarily focused to exclude animals fromdirect access to a stream. However, with exclusionfrom the stream, alternative water sources need to beprovided, and generally, additional fencing is neededto control the movement of animals relative to the newwater sources. It was judged that about a third of thepastured livestock operations would need additionalfencing.
The amount of fencing needed is dependant on theparticular operation. For a typical 150-AU cattle opera-tion, it was assumed that about a mile of fence wouldbe needed to supplement existing fencing and replacefencing in disrepair, or 35.2 feet per AU. Based onNRCS Conservation Practice Standard Fence (Code382), the cost of fencing was $0.80 per foot of fence fora total cost of $28.16 per AU, or $4.20 annually per AU.
Water well
An alternative water source needs to be provided iflivestock are excluded from direct access to streamsand watercourses. Numerous methods are used toprovide this alternative water source, with no consis-tency of method demonstrated in any particular regionof the country. Methods include the installation ofwater wells dedicated to providing water for thepasture confinement area, utilizing instream pumps totransfer water from the immediate stream corridor,developing natural spring areas that are located awayfrom the stream corridor, and pumping and pipingwater from an existing water system. For this assess-ment, it was assumed that a new well would beinstalled. The use of a dedicated well is generally themethod of choice because of its reliability in providinga consistent quantity and quality of water (springs godry, stream flows and quality fluctuate). Costs werebased on criteria for well development in NRCS Con-servation Practice Standard Water Well (Code 642).The depth of the well was assumed to be 250 feet.(Actual depths vary from 100 feet to over 1,000 feetaround the country; however, most wells used for
87
Costs Associated with Development and Implementation of Comprehensive Nutrient Management Plans
Part I—Nutrient Management, Land Treatment, Manure and Wastewater Handling and Storage, and Recordkeeping
livestock watering are installed near riparian areaswhere the depth to a reliable, potable water table isrelatively shallow.) Using $22 per foot as the cost ofinstalling a well, the average cost of a well 250 feetdeep is $5,500, or $820 annually per farm. It wasjudged that representative farms #3 and #4 would notneed to construct a well, as an alternative watersource will most likely be readily available. For repre-sentative farms #1 and #2, it was judged that about 40percent of the operations would need to implementthis practice.
Watering facility
Along with the need to provide an additional source ofwater is the need to provide temporary water storageand a watering facility for the animals. The amount ofwater storage needed is dependant on the source andreliability of water and the size of the herd. Wateringfacility design is based on the criteria established inNRCS Conservation Practice Standard Watering
Facility (Code 614). In most situations the wateringfacility consists of a corrugated metal trough with aconcrete bottom and pad that stores the equivalent of1 day of water needs. Storage needs were based on 30gallons per animal unit. For this assessment, costs peranimal unit were based on storage requirements for a150-AU herd, which would be 4,500 gallons. The water-ing facility would consist of a circular corrugatedmetal tank 1.5 feet deep and 23 feet in diameter. Thecost is $0.75 per gallon for a total cost per AU of$22.50, or an annual cost of $3.35 per AU.
In the Northern Plains and Mountain States wherewinter confinement areas tend to be located a consid-erable distance from the operations’ headquarters andwhere winter temperatures can drop and remainbelow freezing, special "frost free" watering facilitiesare needed. This type of facility is an enclosed fiber-glass, insulated tank with a small drinking area forcow access. The need for more than 1 day of storagewould depend on how remote and accessible theconfinement site is. For the purposes of this assess-ment, 1 day of storage was used to calculate the cost.Based on a per-unit cost of $3 per gallon, the total costper AU is $90, or $13.41 per AU annually.
In some areas of the upper Midwest or New England,winter temperatures also drop to below freezing;however, because of the close proximity of the head-quarters area to the confinement areas, more cost-effective alternative methods are available to ensure
the water does not freeze (such as manual clearing ofice, electric heaters).
CNMP needs for watering facilities are the same asthose for water wells.
Heavy use area protection
The purpose of heavy use area protection is to stabi-lize areas of high traffic or use by equipment andanimals. Associated with a CNMP for pastured live-stock, this generally would address the area surround-ing the watering facility. The practice would not onlyprotect the integrity of the watering facility, but alsoprovide an area for easier recoverability of manure.For the purposes of this assessment, heavy use areaprotection will consist of a concrete pad surroundingthe watering facility. Costs per animal unit were basedon a 150-AU herd. The heavy use area would be asquare pad, 43 feet on a side or 1,815 square feet, 6inches thick. Subtracting out the area of the tank, therequired installation is 1,414 square feet, or 26.2 cubicyards of concrete. Based on an installation cost of$120 per cubic yard (which includes the minor gradingand shaping required, forming, cost of concrete, andlabor), the cost of the pad for the 150-AU herd wouldbe $3,141, or $3.12 per AU annually. Using the sameapproach, per-AU costs would be $6.35 for a 50-AUherd and $2.32 for a 250-AU herd. The following func-tion was derived for use in estimating the cost per AU:
x = herd sizea = annual cost per AU
If x < 50, then a=$6.35If x > 250, then a=$2.32
If 50 < x < 150, then a=6.35-x-50
150-506.35-3.12
( )( ) × ( )
If 150 < x < 250, then a=3.12-x-150
250-1503.12-2.32
( )( ) × ( )
Heavy use area protection is needed only for represen-tative farm #1. CNMP needs were judged to be 50percent for these operations.
Windbreak or shelterbelt establishment
One of the primary reasons that pastured livestockhave been wintered in riparian areas is to provideshelter from the wind and weather. In moving pastured
88
Costs Associated with Development and Implementation of Comprehensive Nutrient Management Plans
Part I—Nutrient Management, Land Treatment, Manure and Wastewater Handling and Storage, and Recordkeeping
livestock directly out of the immediate stream corri-dor, certain regions of the country will be moving theiranimals away from natural cover and protection fromthe elements. Replacement of the needed protection isessential in implementing a CNMP. The windbreaks orshelterbelts are installed along the edge of the confine-ment area on the side of the prevailing winds expectedin the winter. The windbreaks or shelterbelts generallyconsist of from three to seven parallel rows of trees ofvarying species. This is primarily a concern in theWest, Northern Plains, and Mountain States.
The criteria used to determine the size and type ofprotection needed were based on NRCS ConservationPractice Standard Windbreak/Shelterbelt Establish-
ment (Code 380). Cost estimates were estimated forthree herd size categories: 50, 150, and 250 AU. Forthese herd sizes, the length of the windbreak or shelterbreak would be 600, 1,200, and 1,800 feet, respectively.Installation cost is $4.20 per foot. Thus, the annualcost per AU is $7.51 per AU for a 50-AU herd, $5.01 perAU for a 150-AU herd, and $4.51 per AU for a 250-AUherd. The following function was derived for use inestimating the cost per AU:
x = herd sizea = annual cost per head
If x <= 50, then a=$7.51If x >=250, then a=$4.51
If 50 < x < 150, then a=7.51-x-50
150-507.51-5.01
( )( ) × ( )
If 150 < x < 250, then a=5.01-x-150
250-1505.01-4.51
( )( ) × ( )
Windbreak or shelter break establishment is onlyneeded for representative farm #2. CNMP needs werejudged to be 50 percent for these operations.
Solids storage
Most pasture operations would allow manure to accu-mulate through the period of temporary confinement,periodically removing the manure as it accumulates. Adesignated storage area is generally not needed tomanage the manure produced. However, in regionssuch as the Midwest, Lake States, and the Northeast,manure cannot be periodically spread because offrozen and snow covered ground. In these regionstemporary storage is needed for about 2 to 3 monthswhile the animals are temporarily confined. Becausethe period of storage is during the winter when theonly precipitation expected is in the form of snow, acover for the storage area is not considered essential.Therefore, a concrete slab 6 inches thick was used forestimation. For a 150-AU herd, the relative size of asolid storage pad would be 1,600 square feet. A 1,600square foot pad 6 inches thick would require 29.6cubic yards of concrete. Based on a per-unit cost of$120 per cubic yard (which includes the minor gradingand shaping required, forming, cost of concrete, andlabor), the total cost of the storage pad would be$3,556, which equates to about $1.85 per ton of recov-erable solids. CNMP needs were judged to be 50 per-cent for operations in the Midwest, Northeast, andLake States.
Filter strip
For pasture operations in the Midwest, Lake, andNortheast States, filter strips on the downslope edge ofthe temporary confinement area would be needed toprevent removal of solids and dissolved nutrients fromthe lot with the runoff from snowmelt and spring rains.Costs per AU were based on a 50-AU herd size. It wasassumed that the filter strip would need to be 30 feetwide by 400 feet long, resulting in a treatment area of12,000 square feet, or 0.28 acres. The average cost ofshaping and seeding is $1,500 per acre. Thus, the totalcost of the filter strip is $413, which is equivalent to anannual cost of $1.23 per AU. Because the typicallocation of these pasture operations is near streamcorridors, vegetated areas are often already in place,assuming the lot areas have been set back from thestream. CNMP needs were therefore judged to be only30 percent for representative farms #3 and #4.
89
Costs Associated with Development and Implementation of Comprehensive Nutrient Management Plans
Part I—Nutrient Management, Land Treatment, Manure and Wastewater Handling and Storage, and Recordkeeping
Summary of CNMP costs formanure and wastewaterhandling and storage
Estimates of CNMP costs for each model farm wereused to calculate estimates for each CNMP farm in theCensus of Agriculture in the same way as cost esti-mates were calculated for recoverable manure esti-mates in appendix B. For farms with more than onerepresentative farm assigned to it, the probabilitiesassociated with each representative farm were used asweights to obtain a weighted total. The probabilitiesassociated with each model farm are presented intables 2 through 5.
The average annual per-farm cost estimates for eachof the manure and wastewater handling and storagecomponents are presented in table 30 according tolivestock type. Manure storage components (solids,liquid, slurry, and runoff ponds) had the highest cost
per farm for all but pastured livestock and swinefarms. Liquid transfer costs were slightly higher thanstorage costs for swine farms. For dairies, liquidtransfer costs were nearly as high as storage costs.Collection costs were a significant portion of the totalcosts for fattened cattle and turkey farms, and mortal-ity management costs were a significant portion forswine, broiler, and turkey farms.
The annual average cost for the manure and wastewa-ter handling and storage element was estimated to be$2,509 per farm (table 31). Capital costs were nearly75 percent of the total cost, overall. The highest costwas for fattened cattle farms at $9,112 per farm andfor turkey farms at $7,940 per farm, reflecting thelarger number of animal units per farm for these twotypes of farms. Dairy farms had the highest cost peranimal unit at $22 per milk cow animal unit. Swinefarms had the next highest cost per animal unit at $18per swine animal unit.
Table 30 Annual cost per farm for each manure and wastewater handling and storage component
Costs Associated with Development and Implementation of Comprehensive Nutrient Management Plans
Part I—Nutrient Management, Land Treatment, Manure and Wastewater Handling and Storage, and Recordkeeping
Table 30 Annual cost per farm for each manure and wastewater handling and storage component—Continued
Dominant Solids Liquid Slurry Liquid transfer Runoff Settling Fence Heavy Well Watering Wind- Filterlivestock type storage storage storage storage basin use facility break strip
pond areacapital capital capital capital operating capital capital
Costs differed most by farm size (table 31). Largefarms (producing more than 10 tons of phosphorusannually) had an average annual cost of $15,167 perfarm, compared to an average annual cost of $3,397per farm for medium-size farms and $1,070 per farmfor small farms. The cost per animal unit on largefarms, however, was lower than for medium-size andsmall farms because of the economies of scale embod-ied in the assignment of per unit costs and the lowerCNMP needs expected for the largest farms.
Per-farm costs were highest in the Pacific, Mountain,and Southern Plains regions (table 32) and lowest inthe Lake States and the Corn Belt regions. Total costswere highest in the Corn Belt, the Lake States, and theNorthern Plains, which together represented about 45percent of the total costs for manure and wastewaterhandling and storage.
Costs Associated with Development and Implementation of Comprehensive Nutrient Management Plans
Part I—Nutrient Management, Land Treatment, Manure and Wastewater Handling and Storage, and Recordkeeping
Table 31 Annual manure and wastewater handling and storage cost per farm, by livestock type and farm size
Dominant livestock type Number AU for AU for Capital Operating Maintenance Total cost Cost per AUor farm size class of farms dominant other live- cost** cost** cost** of dominant
livestock type stock types* livestock type($) ($) ($) ($) ($)
NA Not available.* Includes pastured livestock types.** Costs for farms with pastured livestock types dominant were not broken down into capital and operating costs. Costs for these farms are
presented in the Total cost column.
Table 32 Annual manure and wastewater handling and storage cost per farm, by farm production region
Farm production region Number Capital cost Operating Maintenance Total costof farms cost cost