Page 1
The thermal expansion properties of halogen bond containing 1-4 dioxane halogen complexes.
W. G. Marshall,a‡ R. H. Jonesb* and K. S. Knightc,d
aISIS Facility, STFC Rutherford Appleton Lab, Harwell Oxford, Didcot OX11 0QX, Oxon, United
Kingdom.
bSchool of Chemical and Physical Sciences, Keele University, Keele, ST5 5BG, United Kingdom. Fax 44
1792 712378, Tel: 44 1782 733033,
cDepartment of Earth Sciences, University College London, Gower Street, London, WC1E 6BT, United
Kingdom.,
dDepartment of Earth Sciences, The Natural History Museum, Cromwell Road, London, SW7 5BD
United Kingdom.
‡ Deceased.
Correspondence e-mail [email protected]
Abstract
Neutron powder diffraction has been used to determine accurate molecular structures and thermal
expansion properties for the complexes formed between by iodine and bromine with 1,4 dioxane.
The marked anisotropy in the magnitudes of the principal axes of the thermal expansion tensor for
both compounds can be associated with the different intermolecular forces present, with the smallest
values being associated with the halogen bonds formed between oxygen and the diatomic halogen
molecules. The smallest thermal expansion coefficient of the 1,4 dioxane iodine complex is smaller
than the corresponding coefficient in the corresponding bromine complex reflecting the stronger
halogen bond formed between iodine and oxygen when compared to that formed between oxygen
and bromine.
Background
The study of halogen bonded complexes continues to be a growth area in chemistry, and an
operational definition has been assigned to the halogen bond by IUPAC namely “A halogen bond
occurs when there is evidence of a net attractive interaction between an electrophilic region
associated with a halogen atom in a molecular entity and a nucleophilic region in another, or the same,
Page 2
molecular entity1”. When halogen bonded interactions were extensively studied in solution during
the 1950s, the intermolecular bonding present in these interactions was believed to be based on the
donation of a pair of electrons from the donor molecule (lone pair or π orbital) into the σ* anti bonding
orbital of the acceptor molecule. This view was based on the then accepted view of bonding in charge
transfer complexes2. By contrast, the current view of bonding in halogen bonded complexes (which
is currently the most widely accepted) emphasizes an electrostatic interaction involving a region of
negative potential on the donor, and an area of positive potential on the halogen, the so-called σ-
hole3,4,5. This model with the inclusion of polarization and dispersion effects6,7, has become the
accepted model of bonding in most halogen bonded complexes8. The growth in interest in halogen
bonding is no doubt a consequence of their role over a wide variety of areas of chemistry. Some of
these are well known and long established, for example in supramolecular chemistry9,10,11, crystal
engineering3,12 liquid crystals13,14,15, and biological systems16, with the best-known example of the
latter being the long established role of iodine in thyroid hormones17. These, and other areas, have
been the subject of a recent major review18. One aspect which has received relatively less attention
is that of their thermal expansion properties. There are several reasons why the properties of halogen
bonds with temperature should be investigated. The first which we alluded to in the introduction in
that observing changes that occur in a halogen bond as a function of temperature will enable further
refinements /improvements to the theoretical description of halogen bonding. Initial studies on
systems containing Ar-I ···N, Ar-I ···O, and Ar-Br ···N moieties (Ar = perfluorinated unit) revealed that
there were significant changes in the donor (donor = N, O)··· halogen distances with temperature, with
the donor·· halogen distances decreasing with decreasing temperature19. Second, some examples on
the thermal expansion properties of systems containing halogen bonds show unusual results. For
example, colossal thermal expansion was recently observed in co-crystals formed from azo bipyridine
with 4,6 halogenated resorcinols20. Other studies on strong halogen bonds involving dihalogen
molecules as the acceptor have also revealed colossal thermal expansion21, together with the rarer
phenomena of negative area expansion22. Thirdly, halogen bonds come in different “varieties”,
compared to hydrogen bonds (more than one halogen) and as a consequence it is pertinent to ask if
their expansion properties differ, and how they compare with other intermolecular forces that are
present, and it is this last question that we shall address in the study by comparing the expansion
properties of the isostructural halogen bonded complexes formed between 1,4-dioxane and bromine
and iodine.
By their nature thermal expansion properties of solids can be measured directly by methods
such as dilatometry23, but are more often investigated by diffraction based techniques which measures
the changes in the size of the unit cell metric and hence probes directional expansion as the
Page 3
temperature is altered24. If these individual diffraction measurements are of sufficient quality to
permit structural refinement, it is possible to obtain accurate measurements of the interatomic
contacts and angles of the molecules, and how these also respond to the variation in temperature.
Whilst many of these measurements have made use of single crystal diffraction25, powder-based
methods offer certain well-known advantages. For example, powder diffractometers are not subject
to centring errors, and generally offer higher real-space resolution. The material is sampled in as the
bulk, whilst an individual crystal might be atypical. Powder diffraction eliminates the problems
associated with twinning, or even the crystal shattering, which may occur if the material undergoes a
first order phase transition for example as seen in pyrene26. In addition, it has been demonstrated that
the data collected using high resolution neutron diffraction can yield structural information which is
comparable to that collected with single crystal measurements, for example acetone27; pyridine28
metsitylene29,.Thus high resolution neutron powder diffraction offers a reliable way of extracting
structural information as the environment of the sample is changed.
Because of the relatively few studies that have been carried out to investigate the thermal
expansion properties of systems containing halogen bonds, we considered a systematic study of a
series of such systems would enable information on how changes within these structures caused by
the variation of temperature could affect the macroscopic expansion properties. Furthermore, there
have been very few studies on halogen bonded systems using neutron diffraction22,23,30, 31, Indeed,
none were referenced in the recent comprehensive review on halogen bonding 18. As mentioned
earlier, neutron powder diffraction has been successfully used to obtain high quality structures in the
which the accuracy of structural parameters is comparable to single crystal studies. An additional
advantage of using neutron diffraction is that accurate hydrogen (deuterium for powder diffraction
studies) positions can be obtained. This is because the diffracted intensities are not dominated by the
presence of heavy elements with large number of electrons as in the case of X-ray scattering, but since
the neutron scattering lengths are a nuclear property, all elements and their isotopes are found to
have approximately comparable magnitudes, and hence they contribute equally to the diffraction
pattern. For example, in the structure of (CH3)3N···ICl, we were able to show that significant changes
could be seen in the geometry involving the hydrogen atoms of the(CH3)3N moiety in the complex,
when compared to that of the free molecule. These changes, which occurred upon complexation,
could not be unambiguously observed when the crystal structure was determined by X-ray diffraction.
In addition to these changes, we could explicitly show the existence of weak C-H···Y hydrogen bonds31.
Furthermore, in the N···I-Cl moiety, the ability of the chlorine atom to act as the acceptor in a weak C-
H···Cl hydrogen bounds appeared to be enhanced upon complex formation, and that the hydrogen
Page 4
atom occupied a well-defined position at approximately 90° relative to the internuclear axis of the ICl
molecule.
We have chosen to study systems based on the complexes formed between diatomic halogen
molecules and 1-4, dioxane. These were some of the first halogen bonded complexes to have had their
crystal structures determined32,33. The molecular structures of the complexes utilising chlorine and
bromine were determined in the 1950s and the iodine analogue more recently, in 200034. These
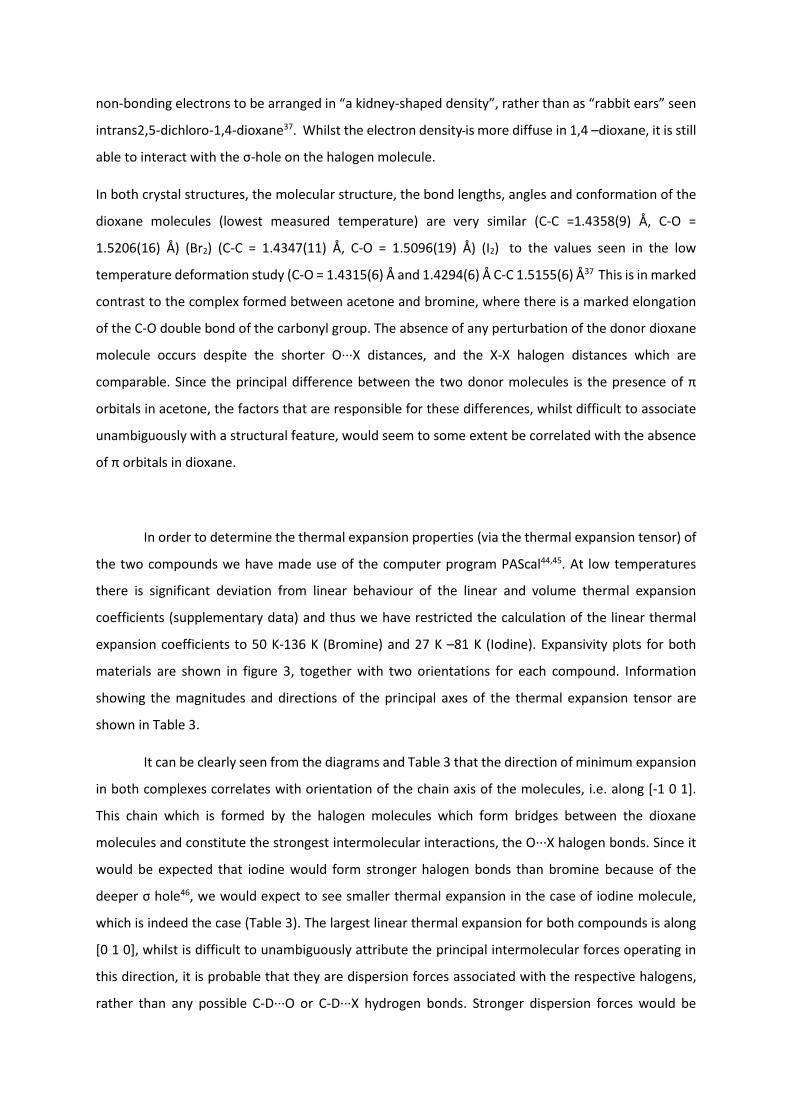
compounds are all isostructural and have a structure based on infinite chains involving O···X-X···O units
which are aligned along [-1 0 1] leading to an overall stoichiometry of (C4H4O2) ···X2.
Our aim was that by performing a high-resolution variable temperature neutron powder
diffraction study we would be able to obtain accurate metric parameters for these complexes in
addition to the lattice parameters. In particular, we were interested in potential variations in the inter
O···X and intra X-X bond distances and any potential correlation between these two bond lengths. By
also determining the thermal expansion properties of these compounds we would be able to ascertain
the influence of changes at the atomic level on the macroscopic properties of the solid. From the
accurate determination of hydrogen (deuterium) positions, the occurrence of any C-H···X hydrogen
bonds could be unequivocally established. Study of the expansion properties on these systems (X2 =
Br2, or I2) we believed would enable us to observe which of these systems responded most readily to
changes in temperature, and, coupled with the accurate structural information, would enable us to
extract the features responsible for causing this behaviour, and hence, indirectly probe the nature of
the O···X bond. Our overarching goal was by determining these components in the structure, would it
be possible to tailor the expansion properties of these materials by a judicious choice of component
molecules.
Experimental
Sample preparation and Data Collection
The preparation of these materials followed broadly the methods previously described in the
literature 32,34. Full details are given as electronic supplementary information.
For the neutron powder diffraction studies, the deuterated sample material was ground gently in an
agate pestle and mortar cooled by immersion in a dry ice bath. The sample was then transferred into
a thin-walled quartz-glass tube. Upon filling, the quartz-glass tube was placed in a thin-walled
vanadium sample can. The can was then attached to a sample centre stick and then cooled to 4.2K in
an AS “Orange” helium cryostat. High-resolution neutron powder diffraction patterns were then
collected from this sample using the HRPD time-of-flight diffractometer at the ISIS facility of the STFC
Rutherford Appleton Laboratory. For each of the samples, a series of short runs were collected as a
Page 5
function of temperature whose primary purpose was to obtain accurate lattice parameters. These
short runs were interspersed with longer runs to obtain accurate structural parameters in addition.
However, the high quality of the samples coupled with the crystallographically imposed symmetry of
the complex (point group 2/m, Z’ = 0.25) was such that it was possible to obtain accurate structural
parameters with a precision only marginally lower than the longer runs from the shorter data
collection times.
Structure determination and refinement
Either literature structures or previously obtained single crystal structures were used as the starting
models for the Rietveld profile refinement35,36 of the neutron powder diffraction patterns. Data were
used from the backscattering and 90ᶛ detector banks, which enabled data that covered the ranges
0.663 Å < d <. 3.846 Å (Br2 complex) and 0.663 Å < d <. 3.892 Å (I2 complex) to be used. It was
possible to use a fully anisotropic model for the refinements on the Br2 system, but in the case of the
I2 system, it was necessary to restrict anisotropic thermal parameters to the atoms of the dioxane
molecule alone. It also was necessary to add a second phase to the refinement to account for the
presence of weak Bragg peaks from the vanadium sample holder and cryostat windows and heat
shields. In addition, it was observed that a small amount of residual dioxane was present for the
sample containing Br2 and this was added to the refinement using the known structure of the low
temperature phase for 1,4 dioxane37. Rietveld plots showing observed calculated and difference
patterns for the lowest temperature sets for each complex are shown in Figures 1 and 2. A summary
of the refinements and selected crystallographic data are listed in Table 1 Crystallographic data have
been deposited at the CCDC with deposition numbers CCDC 1904199-1904209 for 1904211-1904219
for C4H8O2Br2 and C4H8O2I2 respectively.
Results and discussion
Selected metrical parameters consisting of O···X, X-X and O···X-X bond lengths and angles for the
bromine and iodine complexes are given in Table 2. Complete sets of bond lengths and angles are
tabulated in supplementary data S1. Structural and packing diagrams for the complex are illustrated
in Figures 3 - 6. The arrangements of the molecules within the unit cells is identical to that reported
in the earlier x-ray structural determinations32,34. In general, there is some correspondence between
the interatomic bond lengths and angles in the O···X-X fragments. For both compounds the O···X
distances are significantly shorter than the sum of the van der Waals radii38 and the X-X distances are
longer than that observed for the free halogens in the gaseous phase as determined by spectroscopy;
Br2 2.2811 Å, I2 2.6663 Å 39, and EXFAS I2 2.681(2) Å40. In this last study EXAFS experiments were also
performed in a series of solvents with the most pertinent I-I values being 2.694(3) Å in (C2H5)2O and
Page 6
2.701(3) Å in C2H5OH. The distances are somewhat closer to those observed at comparable
temperatures using neutron diffraction; Br2 2.286(3)41 Å, I2 2.718(3) 42. The elongation of the
intramolecular halogen bond usually indicates the occurrence of a strong intermolecular halogen
bond, with significant donor-acceptor interaction. Furthermore, for the case of the bromine
compound, the differences between the interatomic contacts seen in the neutron-derived structure
and the earlier x-ray structure are quite pronounced. For example at 136K the Br-Br and O-Br distances
are 2.328(3) Å and 2.668(2) Å compared to the X-ray structure (temperature not stated) 2.31 Å and
2.71 Å32. These differences may be the result of the lower accuracy of the X-ray photographic
investigation, or alternatively, the result of weakening of the halogen bond with increasing
temperature (see below), or possibly a combination of both. In the case of the iodine complex the
differences between our neutron I-I (2.7100(26) Å, I···O 2.7858(17) Å, and the previous x-ray study34
I-I (2.693(1) Å I···O 2.808(3) Å) are far less pronounced, with the most noticeable differences being
that in the X-ray study both the O···I distances and the I-I distances are shorter compared to our
neutron study, though these differences are small. For both complexes, it can also be seen that there
is a slight increase in O···I and O···Br distances with temperature, although these changes are small in
absolute terms, and possibly statistically insignificant. In addition, in our investigation we find very
little, if any, variation in the Br-Br and I-I distances with temperature. This is in marked contrast to
earlier studies of the elemental halogens where there was a significant increase in intermolecular
halogen contact distances with increasing temperature which is accompanied by a smaller decrease
in the intramolecular halogen bond length41,42. In the case of the bromine complex, the distances we
obtain at 4.2K are in good agreement with a theoretical study (MP2/6-311+G*) on this system43. Of
greater interest is comparison of these current results with the contacts seen in the complex formed
between acetone and bromine22,30. The Br-Br distances are found to be comparable; for the
temperature range 4.2K -110 K the values lie between 2.326(2) Å - 2.341(2) Å in this current work, and
are 2.321(3) Å and 2.328(3) Å in our earlier study22,30 However, there are significant differences in the
Br···O contacts which lie between 2.653(2) Å and 2.659(2) Å in this work and 2.734(2) Å and 2.737(2)
Å for the distances in the acetone bromine system 22,30. These longer O···Br distances are presumably
the consequence of the carbonyl forming 2 halogen bonds, as opposed to one halogen bond in the
dioxane complex.
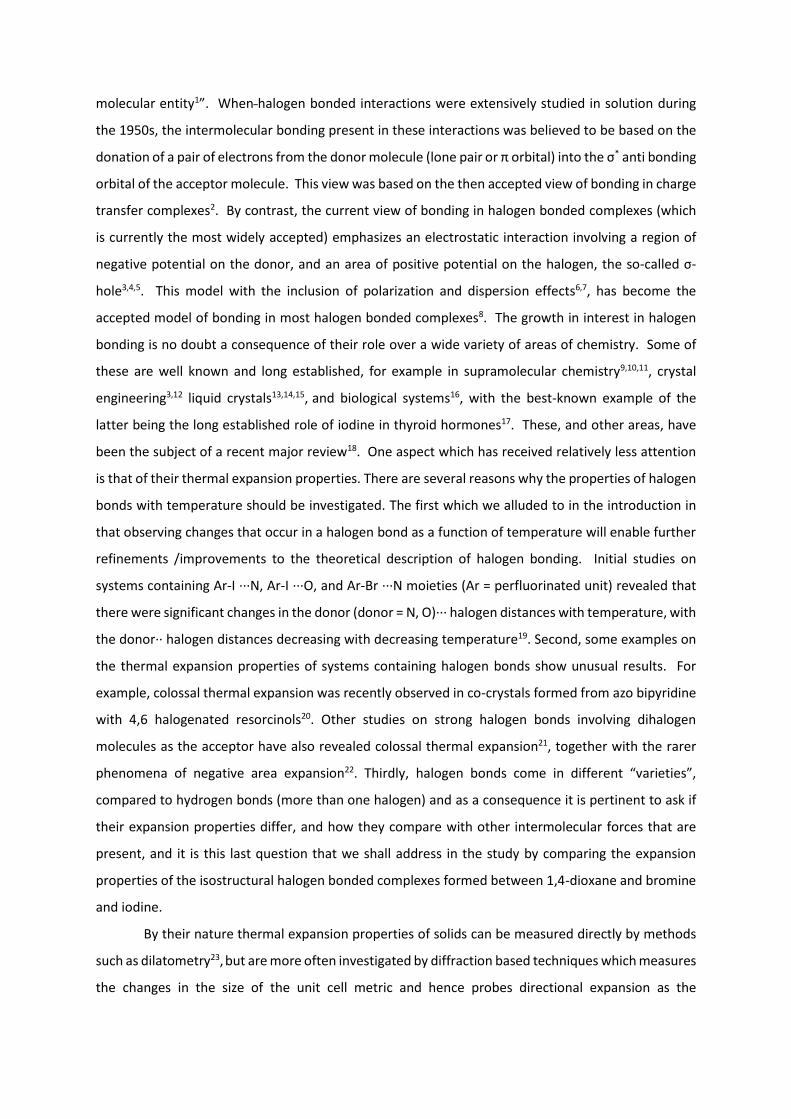
For neither structure is the halogen situated in either a fully equatorial or axial site with
respect to the ring (figure 3) but lies between these extremes. This can be observed in the torsion
angles X··· O-C-D listed in Table 4, the moduli of whose values differ equally from the idealised values
of mod 60. Fortuitously the electron density within 1,4 dioxane has been determined in a low
temperature deformation study which showed the electron density around the oxygen due to the
Page 7
non-bonding electrons to be arranged in “a kidney-shaped density”, rather than as “rabbit ears” seen
intrans2,5-dichloro-1,4-dioxane37. Whilst the electron density is more diffuse in 1,4 –dioxane, it is still
able to interact with the σ-hole on the halogen molecule.
In both crystal structures, the molecular structure, the bond lengths, angles and conformation of the
dioxane molecules (lowest measured temperature) are very similar (C-C =1.4358(9) Å, C-O =
1.5206(16) Å) (Br2) (C-C = 1.4347(11) Å, C-O = 1.5096(19) Å) (I2) to the values seen in the low
temperature deformation study (C-O = 1.4315(6) Å and 1.4294(6) Å C-C 1.5155(6) Å37 This is in marked
contrast to the complex formed between acetone and bromine, where there is a marked elongation
of the C-O double bond of the carbonyl group. The absence of any perturbation of the donor dioxane
molecule occurs despite the shorter O···X distances, and the X-X halogen distances which are
comparable. Since the principal difference between the two donor molecules is the presence of π
orbitals in acetone, the factors that are responsible for these differences, whilst difficult to associate
unambiguously with a structural feature, would seem to some extent be correlated with the absence
of π orbitals in dioxane.
In order to determine the thermal expansion properties (via the thermal expansion tensor) of
the two compounds we have made use of the computer program PAScal44,45. At low temperatures
there is significant deviation from linear behaviour of the linear and volume thermal expansion
coefficients (supplementary data) and thus we have restricted the calculation of the linear thermal
expansion coefficients to 50 K-136 K (Bromine) and 27 K –81 K (Iodine). Expansivity plots for both
materials are shown in figure 3, together with two orientations for each compound. Information
showing the magnitudes and directions of the principal axes of the thermal expansion tensor are
shown in Table 3.
It can be clearly seen from the diagrams and Table 3 that the direction of minimum expansion
in both complexes correlates with orientation of the chain axis of the molecules, i.e. along [-1 0 1].
This chain which is formed by the halogen molecules which form bridges between the dioxane
molecules and constitute the strongest intermolecular interactions, the O···X halogen bonds. Since it
would be expected that iodine would form stronger halogen bonds than bromine because of the
deeper σ hole46, we would expect to see smaller thermal expansion in the case of iodine molecule,
which is indeed the case (Table 3). The largest linear thermal expansion for both compounds is along
[0 1 0], whilst is difficult to unambiguously attribute the principal intermolecular forces operating in
this direction, it is probable that they are dispersion forces associated with the respective halogens,
rather than any possible C-D···O or C-D···X hydrogen bonds. Stronger dispersion forces would be
Page 8
expected in the case of iodine as opposed to bromine leading to the smaller expansion coefficient in
the case of iodine. Note that one principal axis is required to lie parallel to [010] for a monoclinic
crystal with unique b axis (Neumann’s law47). The expansion coefficient of intermediate magnitude is
oriented slightly off the c axis for example in the Br2 complex it lies approximately along [-1 0 5]. On
viewing a packing diagram viewed along b it can be seen that this would correspond to an approximate
rotation of the I2 and dioxane molecule about the 2-fold axes running through the centres of each
molecule. The principal intermolecular force opposing this rotation would be the halogen bond which
would be expected to be stronger in the case of the iodine complex leading to a smaller expansion
coefficient, which is observed experimentally.
In conclusion, our study shows that the distinct anisotropy of the thermal expansion of these
compounds is caused by a clear variation in the strength of the intermolecular forces present in the
complex. The greatest expansion is seen where the forces are most probably associated with
dispersion forces associated with the halogen, with the greatest expansion being seen for the bromine
complex. The other two forces involve interactions involving the sigma hole of the halogen. As a
consequence of the larger and more positive sigma holes present in iodine as opposed to bromine,
the attractive intermolecular forces will be greater in the former leading to a decrease in the the
thermal expansion. The ability to associate the expansivity and magnitude with the forces present
will in the long run enable the rational design of materials with tailored properties.
Conflicts of Interest
There are no conflicts of interest to declare”
Acknowledgments
We wish to thank STFC for provision of neutron beam time and consumables. We wish to acknowledge
the contribution of our friend and colleague the late Dr W. G. (Bill) Marshall for his involvement in this
work, and his significant contributions to the development of, and study of, molecular solids using
neutron powder diffraction, especially at high pressure.
References
1 G. R. Desiraju, P. S. Ho, L., Kloo, A. C. Legon, R. Marquardt, P. Metrangolo, P. Politzer, G. Resnati
and K. Rissanen, Pure Appl. Chem., 2013, 85, 1711-1713.
Page 9
2 R. S. Mulliken, J. Am. Chem. Soc., 1952, 74, 811-824.
3 T. Brinck, J. S. Murray and P. Politzer, Int. J. Quantum Chem., 1992, 44, S19, 57-64.
4 P. Politzer and J. S. Murray, ChemPhysChem., 2013, 14, 278-294.
5 T Clark, M. Hennemann, J. S. Murray and P. Politzer, J. Mol. Model, 2007, 13, 291-296.
6 P. Politzer, and J.S. Murray, Theo. Chem. Acc, 2012., 131, 1114.
7 P. Politzer, K. E. Riley, F. A. Bulat and J. S. Murray, Comp. & Theo. Chem., 2012, 198, 2-8.
8 P. Politzer, J. S. Murray and T. Clark Phys Chem, Chem, Phys. 2010, 12, 7748-7757.
9 P. Metrangolo, G. Resnati, T. Pilati and S. Biella, Structure and bonding, 2007, 126, 105,-136.
10 R Bertani, P. Sgarbossa, A. Venzo, F. Lelj, M. Armati, G. Resnati, P. Metrangolo and G. Terraneo,
Coord. Chem. Rev., 2010, 254, 677-695.
11 K. Rissanen, CrystEngComm., 2008, 10, 1107-1113.
12 P. Metrangolo and G. Resnati, Science, 2008, 321, 918-919.
13 H. L. Nguyen, P. N. Horton, M. B. Hursthouse, A. C. Legon and D. W. Bruce, J. Am. Chem. Soc., 2004,
126, 16-17.
14 C. M. Cho, X. Wang, J. J. Li, C. He, J. Xu, Liquid Crystals, 2013, 40, 185-196.
15 L. J. McAllister, C. Präsang, J. P-W Wong, R. J. Thatcher, A. C. Whitwood, B. Donnio, P. B. Karadakov
and D. W. Bruce, Chem. Comun., 2013, 3946-3948.
16 P. Auffinger, F. A., Hays, E. Westhof and P. S. Ho , Proc Nat Acad Sci, 2004, 101, 16789-16794.
17 V. Cody and P. Murray-Rust, J. Mol Struct., 1984, 112, 189-199.
18 G. Cavallo, P. Metrangolo, R. Milani, T. Pilati, A. Priimagi, G. Resnati and G. Terraneo, Chem. Rev.,
2016, 116, 2478-2601.
19 A Forni, P. Metrangolo, T. Pilati and G. Resnati, Crystal Growth and Design, 2004, 4, 291-295.
20 K. M. Hutchins, K. A., Kummer, R. H. Groeneman, E. W. Reinheimer, M. A. Sinnwellm, D. C. Swenson
and L. R. MacGillivray, Crystengcomm, 2016, 18, 8354-8357.
21 R. H. Jones, K. S. Knight, W.G. Marshall, J. Clews, R. J. Darton, D. Pyatt, S. J. Coles and P, N. Horton,
Crystengcomm, 2014, 16, 237 -243.
22 W. G. Marshall, R. H. Jones and K. S. Knight S CrystEngComm, 2018,20, 3246-3250.
23 J.S.O. Evans, J. Chem. Soc. Dalton Trans., 1999, 3317 -3326.
24 D. A. Woodcock, P. Lightfoot, L. A. Villaescusa, M. J. Diaz-Cabanas, M. A. Cambloor and D.
Engberg, Chemistry of Materials, 1999, 11, 2508-2514.
Page 10
25 B. K. Saha, J. Indian Inst Sci., 2017, 97, 177-191.
26 K. S. Knight K. Shankland, W.I.F. David, N Shankland, and S. W. Love, Chem, Phys, Lett, 1996, 258,
490-494.
27 S. Crawford, M. T. Kirchner, D. Blaser, R. Boese, W. I. F. David, A. Dawson, A. Gehrke, R. M. Ibberson,
W. G., Marshall S. Parsons and O. Yamamuro, Angew. Chem. Int. Ed., 2009, 48, 755- 757.
28 D. R. Allan, S. J. Clark, R. M. Ibberson, S. Parsons, C. R. Pulham, and L. Sawyer, Chem., Commun.,
1999, 751-752.
29 M. Prager, W. I. F. David and R. M. Ibberson, J. Chem. Phys., 1991, 95, 2473-2480.
30 R. H. Jones, K. S. Knight, W. G. Marshall, S. J., Coles, P. N. Horton and M. B. Pitak, Crystengcomm
2013, 15, 8572. -8677.
31 W. G. Marshall, R. H. Jones, K. S. Knight, J. Clews, R. J. Darton, W. Miller, S. J. Coles and P. N.
Horton, Cystengcomm. 2017, 19, 5194-5201.
32 O. Hassel and J. Hvoslef, Acta Chem Scand., 1954, 8, 873.
33 O. Hassel and K. O. Strømme, Acta Chem Scand ., 1959, 13, 1775-1780.
34 H Bock and S. Holl, Z. Naturforsch 2001, 56b, 111-121.
35 A. C. Larson and R. B. Von Dreele, "General Structure Analysis System (GSAS)", Los Alamos National
Laboratory Report LAUR 86-748 2000.
36 B. Toby, J. Appl. Cryst., 2001, 34, 210 -213.
37 T. Koritanszky, M. K. Strumpel, J. Buschmann, P. Luger, N. K. Hansen and V. Pichonpesme. J. Am.
Chem. Soc., 1991, 113, 9148-9154.
38 R. Rowland and R. Taylor, J. Phys. Chem., 1996, 100, 7384-7391.
39 D. A McQuarrie and J. D. Simon 1997 Physical Chemistry a Molecular approach 199 p 499 University
Science Books. Saulasito, California, USA.
40 U. Buontempo, A. Di Cicco, M. Nardone, P. Postorino, A. Filipponi and M. Nardone, J. Chem. Phys.,
1997, 107, 5720-5726.
41 B. M. Powell, K. M. Heal, and B.H. Torrie, Molecular Physics, 1984, 53, 929-939.
42 R. M. Ibberson, O Moze, and C Petrillo, Molecular Physics 1992, 76, 395-403
43 R. Lo, A. Ballabh, A. Singh, P. Dastidar and B. Ganguly, CrystEngComm, 2012, 14, 1833-1841.
44 M. J. Cliffe and A. L. Goodwin, J Appl Cryst., 2012, 45, 1321-1329.
Page 11
45 M. J. Cliffe and A. L. Goodwin, PASCal A web tool for Principal Axis Strain Calculations
http://pascal.chem.ox.ac.uk/.
46 M. H. Kolar, and P. Hobza, Chem Rev, 2016, 116, 5155-5187.
47 F. E. Neumann 1885 Vorlesungen über die Theorie der Elastizität der fester Körper und die
Lichtäthers. Edited O.E. Meyer, Teubner, Leipzig.
Page 12
Table 1a
Unit cell parameters for complex formed between 1,4 dioxane and bromine Space Group C2/m
T/K a/Å b/Å c/Å β/ᶛ V/Å3 Rp wRp Chi2 Np
4.2 9.55727(6) 8.92463(5) 4.1241(3) 90.372(1) 351.757(6) 0.0247 0.0251 5.100 94
50 9.56550(6) 8.93319(5) 4.1328(3) 90.479(1) 353.136(6) 0.0225 0.0223 4.054 92
59 9.56917(8) 8.93727(6) 4.1369(3) 90.521(1) 353.778(7) 0.0298 0.0281 1.884 92
68 9.57330(8) 8.94180(7) 4.1413(4) 90.565(1) 354.489(7) 0.0309 0.0294 2.050 92
78 9.57773(2) 8.94675(7) 4.1461(4) 90.610(1) 355.253(9) 0.0312 0.0290 2.004 92
88 9.58206(8) 8.95157(7) 4.1509(4) 90.658(1) 356.020(8) 0.0309 0.0284 1.929 92
102 9.58701(7) 8.95706(6) 4.1562(3) 90.708(1) 356.875(6) 0.0228 0.0223 4.226 92
110 9.59169(9) 8.96229(7) 4.1615(4) 90.757(1) 357.703(8) 0.0305 0.0279 1.869 92
118 9.59676(9) 8.96799(8) 4.1669(4) 90.806(1) 358.585(8) 0.0296 0.0272 1.774 92
126 9.60183(9) 8.97363(8) 4.1725(4) 90.858(1) 359.477(9) 0.0297 0.0272 1.772 92
136 9.60713(9) 8.979661(8) 4.17813(4) 90.912(1) 360.397(9) 0.0292 0.0264 1.659 92
Table 1b
Unit cell parameters for complex formed between 1,4 dioxane and iodine Space group C2/m
T/K a/Å b/Å c/Å β/ᶛ V/Å3 Rp wRp Chi2 Np
4.2 10.1215(1) 9.2329(1) 4.30912(6) 90.286(1) 402.685(15) 0.0266 0.0241 4.321 85
7 10.1217(1) 9.2331(1) 4.30928(6) 90.285(1) 402.719(14) 0.0425 0.0378 1.357 83
17 10.1222(1) 9.2336(1) 4.31009(6) 90.274(1) 402.836(14) 0.0427 0.0374 1.317 83
28 10.1236(2) 9.2355(1) 4.31216(6) 90.254(1) 403.169(15) 0.0426 0.0379 1.339 83
37 10.1256(2) 9.2381(1) 4.31498(6) 90.229(1) 403.626(15) 0.0426 0.0372 1.342 83
50 10.1290(1) 9.2423(1) 4.31921(4) 90.190(1) 404.343(10) 0.026 0.0237 4.181 83
59 10.1325(1) 9.2466(1) 4.32334(5) 90.154(1) 405.058(13) 0.0334 0.0295 1.915 83
70 10.1370(1) 9.2521(1) 4.32854(5) 90.108(1) 405.968(14) 0.0337 0.0295 1.914 83
81 10.1413(1) 9.2572(1) 4.33323(5) 90.066(1) 406.804(14) 0.0328 0.0289 1.85 83
Page 13
Table 2a
Selected interatomic contacts for complex formed between 1,4 dioxane and bromine
T/K Br-Br/Å O-Br/Å O-C/Å C-C/Å C-D1/Å C-D2/Å
4.2 2.326(2) 2.654(1) 1.4358(9) 1.5206(16) 1.0965(10) 1.0960(10)
50 2.325(2) 2.655(1) 1.4334(9) 1.5136(16) 1.0966(9) 1.0958(9)
59 2.328(2) 2.657(2) 1.4319(12) 1.5143(21) 1.0963(12) 1.0979(12)
68 2.337(2) 2.653(2) 1.4309(13) 1.5156(23) 1.0930(13) 1.0939(13)
78 2.334(2) 2.656(2) 1.4286(14) 1.5168(23) 1.0942(13) 1.0905(13)
88 2.341(2) 2.655(2) 1.4301(14) 1.5180(24) 1.0921(14) 1.0924(13)
102 2.338(2) 2.659(2) 1.4285(12) 1.5146(20) 1.0938(11 1.0946(11)
110 2.337(3) 2.659(2) 1.4287(15) 1.5134(27) 1.0921(14) 1.0916(14)
118 2.337(3) 2.659(2) 1.4278(15) 1.5127(27) 1.0917(15) 1.0912(14)
126 2.332(3) 2.666(2) 1.4251(16) 1.5141(29) 1.0914(15) 1.0905(15)
136 2.328(3) 2.668(2) 1.4262(16) 1.5089(30) 1.0908(16) 1.0921(15)
Table 2b
Selected interatomic contacts for complex formed between 1,4 dioxane and iodine
T/K I-I/Å I-O/Å O-C/Å C-C/Å C-D1/Å C-D2/Å
4.2 2.7100(26) 2.7858(17) 1.4347(11) 1.5096(19) 1.0992(12) 1.0971(13)
7 2.707(4) 2.7865(27) 1.4323(18) 1.5081(31) 1.0971(19) 1.0963(20)
17 2.710(4) 2.7878(27) 1.4315(18) 1.5114(31) 1.0971(19) 1.0946(20)
28 2.708(4) 2.7868(28) 1.4350(19) 1.5116(33) 1.0981(20) 1.0981(20)
37 2.708(4) 2.7961(29) 1.4324(19) 1.5101(35) 1.0953(20) 1.0956(22)
50 2.7052(28) 2.7930(19) 1.4338(13) 1.5064(23) 1.0995(14) 1.0944(14)
59 2.709(4) 2.7936(25) 1.4336(17) 1.5062(31) 1.0962(18) 1.0905(19)
70 2.710(4) 2.7985(27) 1.4315(18) 1.5030(32) 1.0945(19) 1.0921(20)
81 2.708(4) 2.7985(28) 1.4337(18) 1.4944(34) 1.0986(20) 1.0893(20)
Page 14
Table 3a
Magnitude and direction of thermal expansion coefficients for complex formed between 1,4 dioxane
and bromine for temperature range 50 -136K
Direction
Axes σ(MK-1) σα(MK-1) a b c
X1 29.6126 0.8811 0.6802 0 0.7330
X2 59.5267 1.6121 0 -1 0
X3 145.1079 6.1785 -0.1945 0 0.9809
Table 3b
Magnitude and direction of thermal expansion coefficients for complex formed between 1,4 dioxane
and iodine for temperature range 27K - 81K
Direction
Axes σ(MK-1) σα(MK-1) a b c
X1 19.9734 1.0863 -0.7138 0 0.7004
X2 44.9611 1.9250 0 -1 0
X3 106.8475 3.4640 0.1768 0 0.9843
Table 4
Selected torsion angles for both complexes (4.2K structures)
X X···O-C(1)-D(1) X···O-C(1)-D(2)
Br 72.2 47.0
I 47.8 71.4
Page 15
Figure1a Fitted neutron powder diffraction data from C4D8O2···Br2 complex at 4.2 K collected in HRPD
detector bank (<2θ> = 168.33ᶛ)
X = observed intensity, solid red calculated intensity, solid green background, solid blue difference,
vertical pink lines reflection markers, complex, vertical turquoise lines 1,4 dioxane (phase II), vertical
black lines vanadium.
Page 16
Figure1b Fitted neutron powder diffraction data from C4D8O2···Br2 complex at 4.2 K collected in HRPD
detector bank (<2θ> = 89.58ᶛ)
X = observed intensity, solid red calculated intensity, solid green background, solid blue difference,
vertical pink lines reflection markers complex, vertical turquoise lines 1,4 dioxane (phase II), vertical
black lines vanadium.
Page 17
Figure2a Fitted neutron powder diffraction data from C4D8O2···I2 complex at 4.2 K collected in HRPD
detector bank (<2θ> = 168.33ᶛ)
X = observed intensity, solid red calculated intensity, solid green background, solid blue difference,
vertical pink lines reflection markers, complex, vertical turquoise lines vanadium.
Page 18
Figure2b Fitted neutron powder diffraction data from C4D8O2···I2 complex at 4.2 K collected in HRPD
detector bank (<2θ> = 89.58ᶛ)
X = observed intensity, solid red calculated intensity, solid green background, solid blue difference,
vertical pink lines reflection markers complex, vertical turquoise lines vanadium.
Page 19
Figure 3a Structural diagram of the C4D8O2···Br2 complex (4.2K) Thermal ellispoids drawn at 50% probability.
Page 20
Figure 3b packing diagram of the C4D8O2···Br2 complex (4.2K)
Page 21
Figure 3c Structural diagram of the C4D8O2···I2 complex. Thermal ellispoids drawn at 50% probability.
Iodine atoms drawn at arbirary radius I
Page 22
Figure 3d packing diagram of the C4D8O2···I2 complex, Thermal ellispoids drawn at 50% probability.
Iodine atoms drawn at arbirary radius I
Page 23
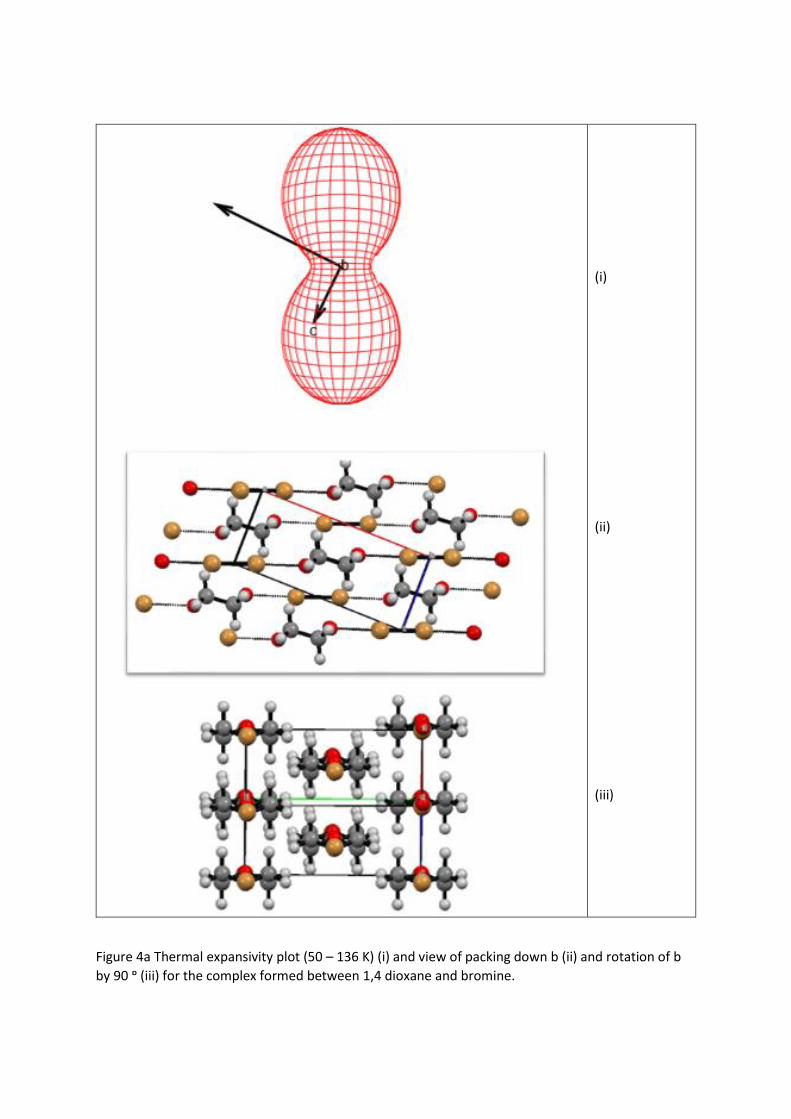
(i) (ii) (iii)
Figure 4a Thermal expansivity plot (50 – 136 K) (i) and view of packing down b (ii) and rotation of b
by 90 ᶛ (iii) for the complex formed between 1,4 dioxane and bromine.
Page 24
(i) (ii) (iii)
Figure 4a Thermal expansivity plot (27K 81K) (i) and view of packing down b (ii) and rotation of b by
90 ᶛ (iii) for the complex formed between 1,4 dioxane and iodine.