19
1 Deep dive into the Asian market Sylvie Cornot-Gandolphe Paris, 14 December 2016 THE THIRD IEA-IEF-OPEC SYMPOSIUM ON GAS AND COAL MARKET OUTLOOKS

1
Deep dive into the Asian market Sylvie Cornot-Gandolphe Paris, 14 December 2016
THE THIRD IEA-IEF-OPEC SYMPOSIUM ON
GAS AND COAL MARKET OUTLOOKS

2
Key Coal Market Trends in Asia
3
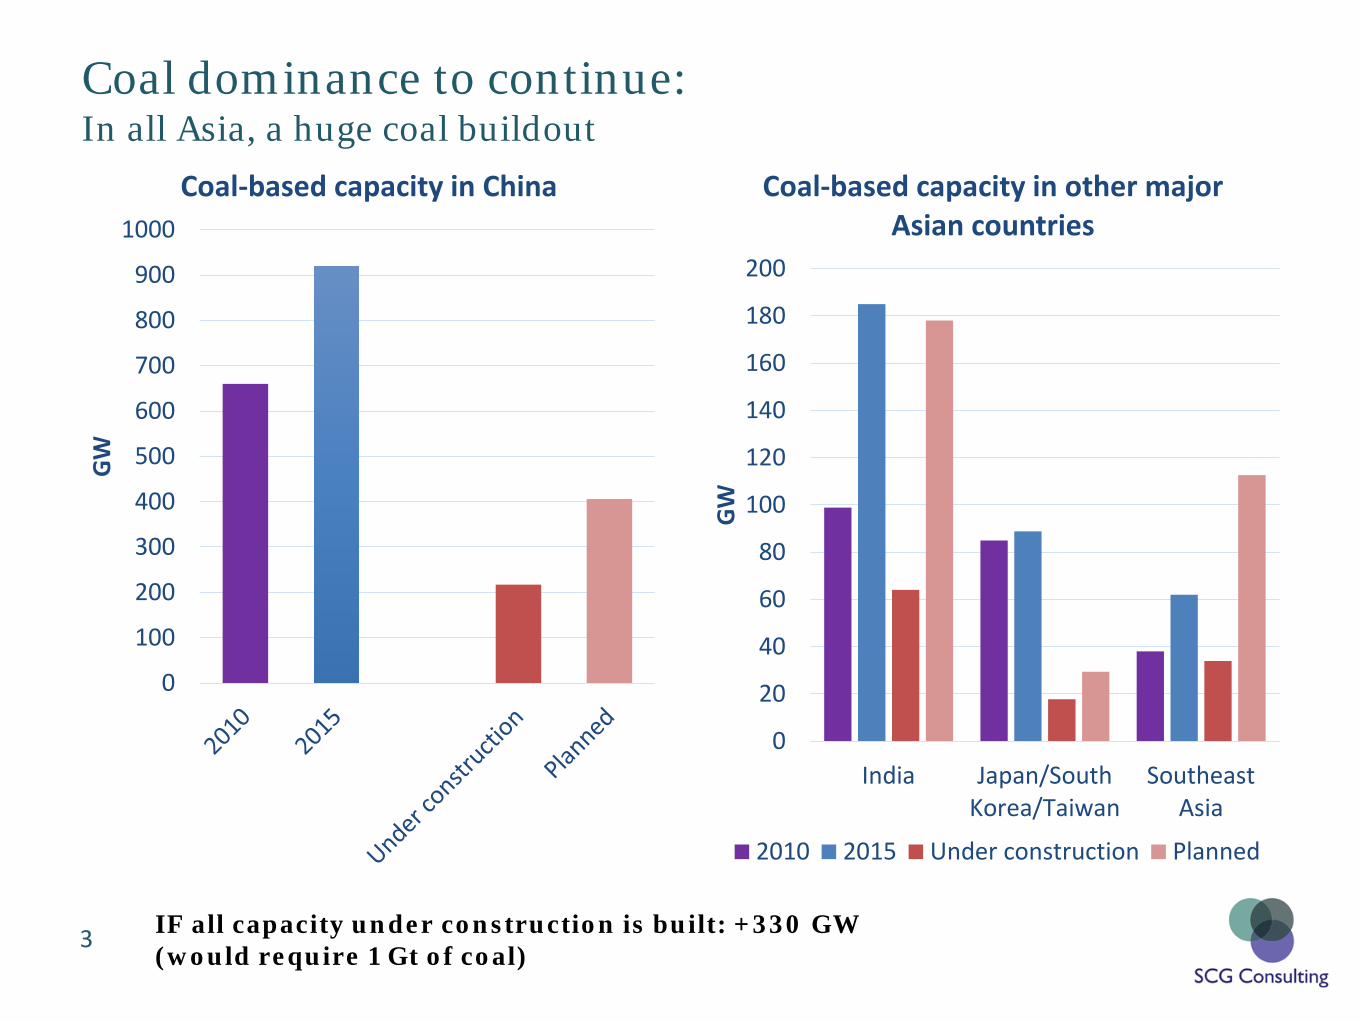
Coal dominance to continue: In all Asia, a huge coal buildout
0
100
200
300
400
500
600
700
800
900
1000
GW
Coal-based capacity in China
0
20
40
60
80
100
120
140
160
180
200
India Japan/SouthKorea/Taiwan
SoutheastAsia
GW
Coal-based capacity in other major Asian countries
2010 2015 Under construction Planned
IF all capacity under construction is built: +330 GW (would require 1 Gt of coal)

4
Coal Consumption and Production Trends in China
Beg of 2016: Coal supply reforms Moratorium on new coal mines Closing of small coal mines In April 2016, reduction of operating days in coal mines from 330 to 276 days
3.3
3.6
4.0 4.1 4.2 4.1 3.9
3.6
0.0
0.5
1.0
1.5
2.0
2.5
3.0
3.5
4.0
4.5
Gt
Coal consumption
The new “normal” Fight against air pollution Renewables/Hydro development
Apparent consumption
3.2 3.4
3.8 3.8 3.9 3.8 3.7
3.4
0
0.5
1
1.5
2
2.5
3
3.5
4
4.5
Gt
Coal production

5
China is the price setter for international steam coal
-500
50100150200250300350
Mt
ImportsExportsNet imports
Coal imports account for only 5% of Chinese supplies…but 16% to 20% of global steam coal imports Chinese imports are driven by price arbitrage Regulation on coal imports (2014/2015) The government wants ‘reasonable’ coal prices The increase in coal imports/coal prices may be short-lived But coal prices are not expected to return to the low levels of beg. 2016
40
50
60
70
80
90
100
110
120
130
140
$/t
Australia FOB price
Futures (as of 8 Dec. 2016)

6
China’s 13th Energy Plan (2016-2020)
• Energy demand is capped
• Share of coal: 58% by 2020 (reduction is steeper than previously planned)
• Energy intensity: -15%
• Carbon intensity: -18%
• Coal share in power capacity to decrease to 55% (making room for renewables)
• Coal-based additions: 180 GW over the planning period (compared to 300 GW in the 12th FYP)
• Current low utilization rates of coal-fired power plants (less than 50%)
• Rationalization of the power fleet (“new” coal to displace old inefficient coal early retirement) and delays/cancellations
• China has just cancelled 17 GW of under construction capacity
64
58
12 15
0
10
20
30
40
50
60
70
2015 2020
%
Coal in the energy mix
Share of coal Share of non-fossil fuels

7
Coal Consumption and Production trends in India
Coal production on the rise again (even if less than planned)
FY2016: Total coal demand much lower than planned (830 Mt vs. 910 Mt)
0
100
200
300
400
500
600
700
800
900
Mt
Hard coal production
CIL SCCL Others
0
100
200
300
400
500
600
700
800
900
Mt
Hard coal consumption
Power sector Steel Cement Others

8
The government intends to stop steam coal imports by end 2017
• Major reforms in the coal sector to boost efficiency of Coal India Ltd, and introduce competition and transparency in the sector
• New Mining Law opens the sector to private operators
• Government targets: Coal India Ltd to double its
production by 2020 to 1,000 Mt
(but was relaxed recently)
Private and other producers: 500 Mt by 2020
Domestic coal production to continue rising, certainly not as steeply as planned
494 536.5
599 661
774
908
0
100
200
300
400
500
600
700
800
900
1000
Mt
Coal India Ltd planned production

9
Indian coal imports
Imports projected to decrease to 160 Mt in FY2017…(unlikely)
• Domestic or imported coal? • Major efforts to increase domestic coal
production AND strong political willingness to be independent (for steam coal)
• But still many hurdles (land acquisition, transportation bottlenecks, green clearance, poor quality of coal)
• Coal power plants built to burn imported coal
• Environmental regulation (limit on transport of coal with high-ash content)
• Prices of domestic vs. International coal • There are still some room for regulation
to decrease steam coal imports… • And coal demand not expected to rise as
steeply as planned (‘over-building’ in the coal power sector and low utilization factor)
0%
5%
10%
15%
20%
25%
30%
0
50
100
150
200
250
Mt
Coal imports
Coking coal
Steam coal
Import dependence (RHS)

10
Other importing markets
0
50
100
150
200
250
300
350
Mt
Japan/South Korea/Taiwan - Steam coal imports
Japan South Korea Taiwan
0
20
40
60
80
100
120
140
160
2000
2005
2010
2011
2012
2013
2014
2015
2016
2020
Low
2020
Hig
h
Mt
Southeast Asia - Steam coal imports
Thailand Viet Nam Philippines
Malaysia Others
Increase in coal imports secured by the building of 25 GW of new coal capacity
Stable demand. Some new coal PP replacing aging capacity
Coal tax favors imports of higher calorific value coal

11
The key role of Indonesia on the supply side
• Indonesia still the top steam coal exporter (2015)
• A large part is low-ranked coal (future market?)
• Exports to China have declined sharply since 2014. Those to India also fell in 2015
• Consolidation of the coal mining sector and crack down on illegal mining and exports (production cap)
• Domestic sales are prioritized
• Fast Track Program to add 35 GW of capacity by 2019 (20 GW coal-based)
• Coal demand expected to double by 2019 less coal available for exports
0
50
100
150
200
250
300
350
400
450
Mt
Indonesian steam coal exports
China IndiaSouth Korea JapanTaiwan Other AsiaEurope Americas

12
Sustainability issues in Asia

13
Huge coal buildout but local pollution and CO2 emissions 1. Adopt Clean Coal Technologies
280
290
300
310
320
330
340
350
360
370
380
g/KW
h
Average coal consumption by coal power plants in China
70 Mtce/year saved between 2010 and 2015 CO2 emissions reduced by 170 Mt/year
• Meaning High-Efficiency/Low Emission Ultra-Supercritical plants
• To reduce local pollution and CO2 emissions per kWh
Ultra-low emission plants in China
• Ultra-low emission coal PP nearly equivalent to natural gas for non-carbon emissions
• CO2 emissions reduced…but still too high (CCSU?, but costs and huge investment required)
• Rationalization of the power fleet (“new” coal to displace old inefficient coal early retirement) and delays/cancellations
Typical emissions Regulation Dust 1 -10 mg/Nm3 ≤ 10 mg/Nm3 SO2 16-32 mg/Nm3 ≤ 35 mg/Nm3 NOx 21-50 mg/Nm3 ≤ 50 mg/Nm3
<310

14
2. Add renewables (and nuclear) to decrease the overall carbon footprint of the power sector
0
20
40
60
80
100
120
CoalCO2 emissions0.775 t/MWh
SolarCO2 emissions
0 t/MWh
CCGTCO2 emissions0.345 t/MWh
$/M
Wh
Generation costs (2015)
Capital and non-fuel costs Fuel costs
Total cost of 45% of coal and 55% of solar is cheaper than an equivalent 100% gas-based strategy, with the same amount of CO2 emissions
Strong RE push everywhere in Asia
• China (13th FYP): 210 GW of wind, 110 GW of solar by 2020
• India: 175 GW by 2022, mainly solar
• Southeast Asia: + 75 GW by 2025, mainly hydro and solar

15
But the current coal fleet is not flexible enough to accommodate (future) RE variability
Experience in Germany Solar + Coal in Luzon (Philippines)
Add flexible plants: hydro storage (when available) and Gas (LNG) peak units
Also retrofit coal-fired power plants to allow more flexibility (China)
Integrate the grid (ASEAN Power Grid)
Electricity generation in Germany Week 32 2016
Electricity generation in Germany Week 1 2016

16
Conclusion

17
Conclusion
More than ever, energy policy/regulation in China is dictating the price of coal
And therefore the price of electricity in coal importing countries: Southeast Asia, and Europe!
Rebalancing a huge market, such as the Chinese one, is not an easy task.
Volatility of coal prices to stay
Potentially exacerbated by 5 years of lack of investment in the mining sector
On the supply side, the role of Indonesia is key in the short/medium term

18
Conclusion In most Asian countries, the current least-cost strategy is towards ‘new coal’ and renewables + nuclear + some gas
The relatively low gas prices and high coal prices have not (yet?) been translated into gas-power investment
Two perceived issues: security of gas supply (despite ample availability) and lack of gas infrastructure (grid). LNG can help provided it remains affordable
Additions to the coal fleet in Asia are being reassessed (not only in China)
0
2
4
6
8
10
12
14
16
18
20
$/M
Btu
LNG prices vs coal prices: The coal window is closing?
Coal LNG Coal (efficiency-adjusted)
Coal window Coal window
Gas buildout

19
THE THIRD IEA-IEF-OPEC SYMPOSIUM ON GAS AND
COAL MARKET OUTLOOKS
Thank you for your attention


