63
The Three One Principles One Community One Identity One Vision Developed and shared by Kem Ley, Research Consultant 012 78 70 84 [email protected]
The Three One Principles
One Community
One Identity
One Vision
Developed and shared by Kem Ley, Research Consultant012 78 70 [email protected]
Developed and shared by Kem Ley, Research Consultant012 78 70 [email protected]
Global Architecture
ASEAN Overview
ASEAN Status
ASEAN Community
2015
ASEAN MUST TO DO
OUTLINES
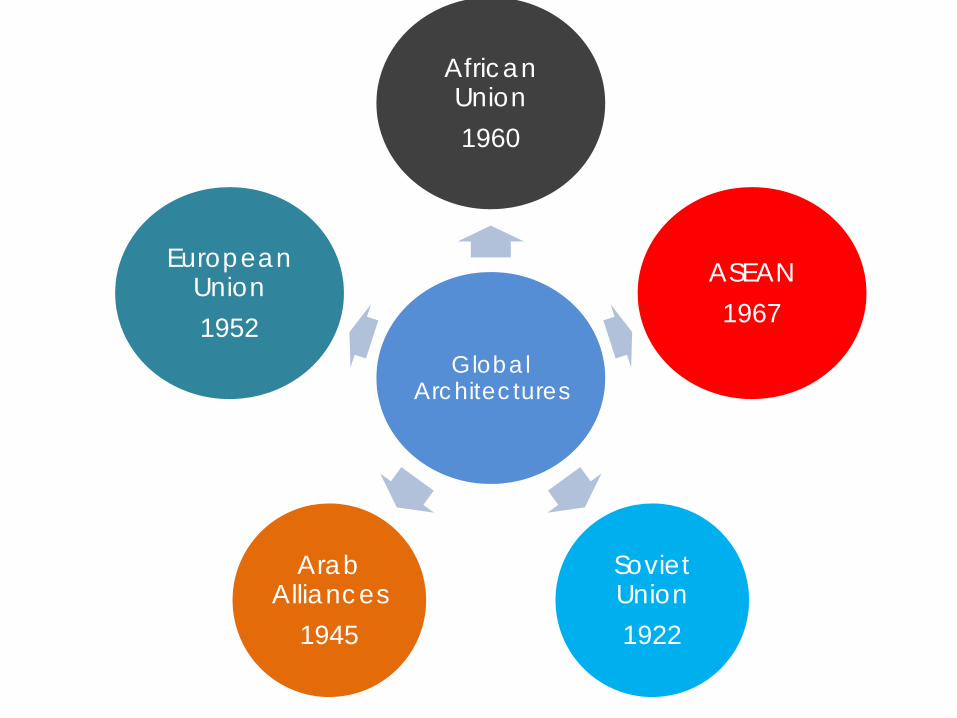
Global Architectures
African Union 1960
ASEAN 1967
Soviet Union1922
Arab Alliances
1945
European Union1952

Continent name Population (2011)Asia 4,140,336,501Africa 994,527,534Europe 738,523,843North America 528,720,588South America 385,742,554Oceania 36,102,071Antarctica 4,490
Population by continents
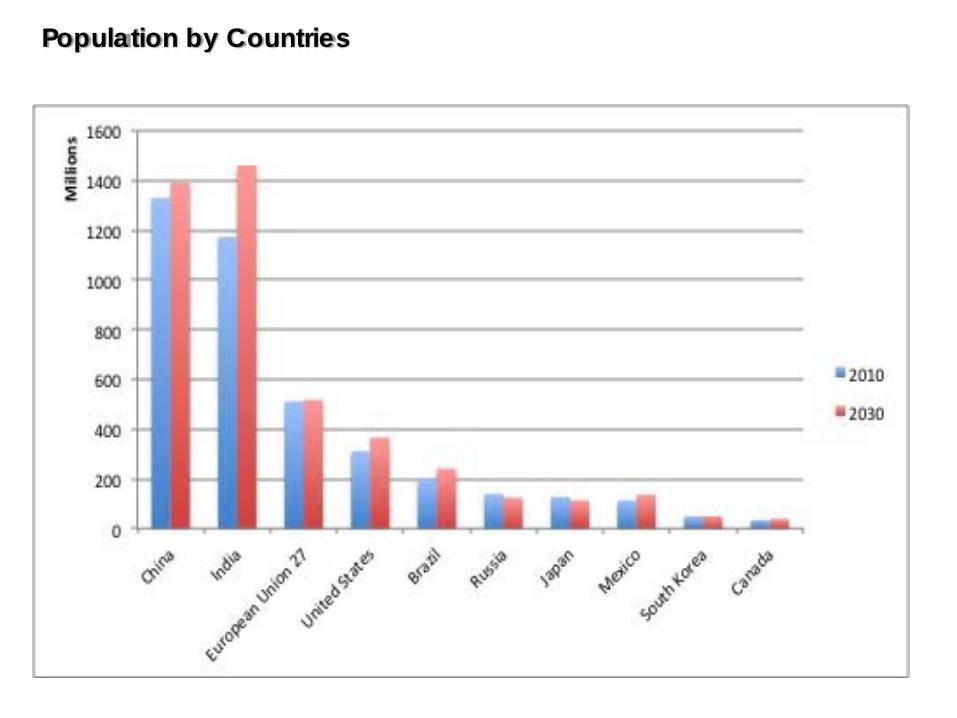
Population by Countries

0
2,000
4,000
6,000
8,000
10,000
12,000
14,000
16,000
18,000 16,543
14,800
5,365 5,273
1,719 1,367 1,193 991136
ASEAN estimated GDP 2010 compared other countries (US$ B)
Source: ASEAN Community in figures 2010
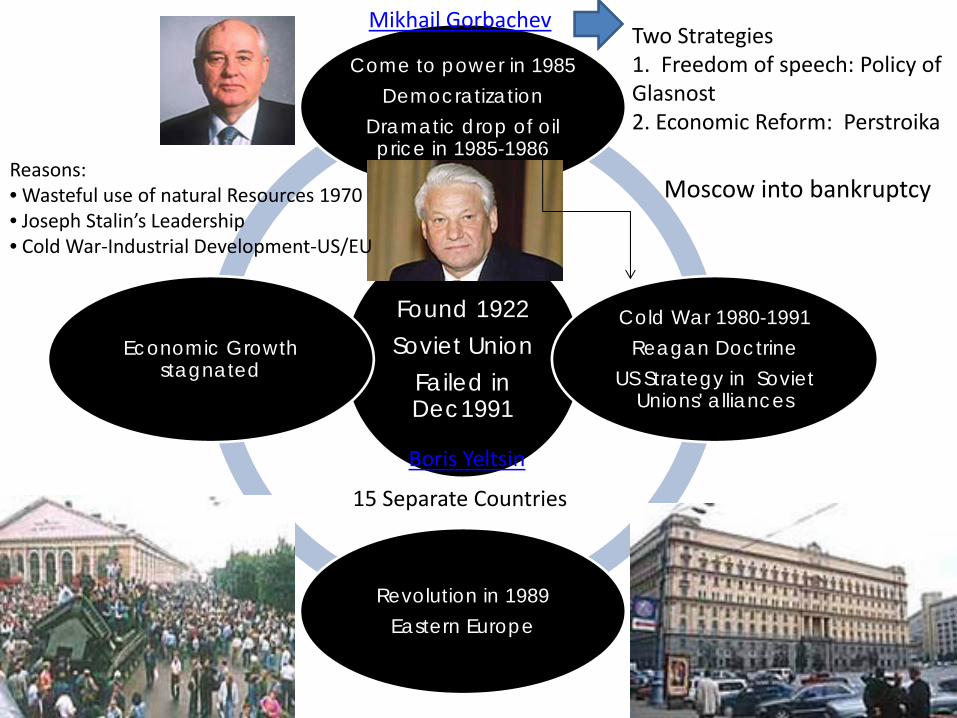
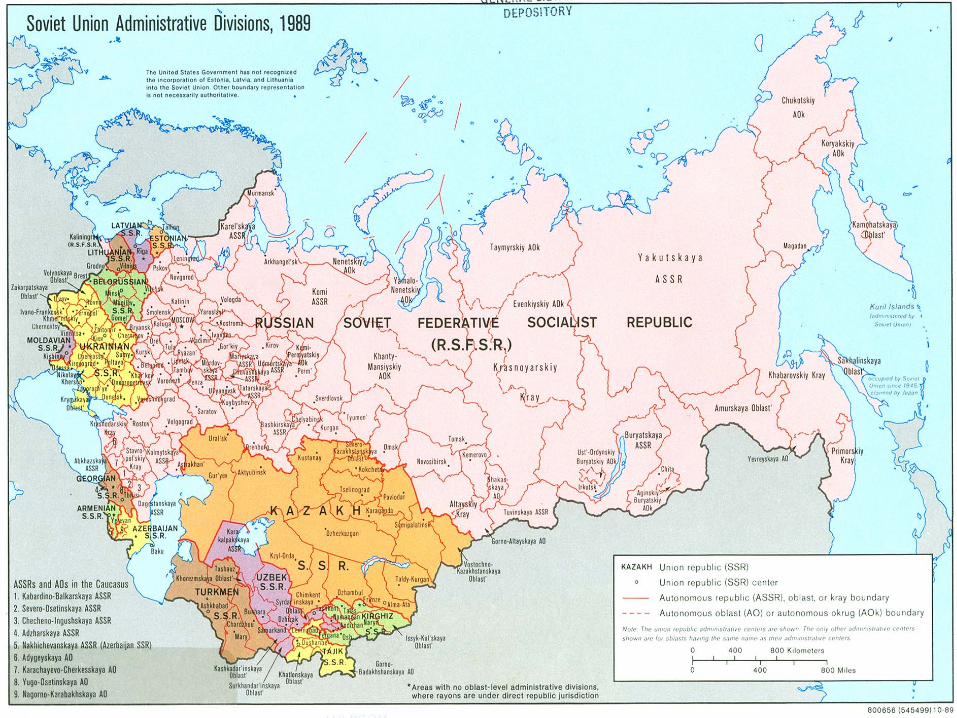
Found 1922Soviet Union
Failed in Dec1991
Come to power in 1985Democratization
Dramatic drop of oil price in 1985-1986
Cold War 1980-1991Reagan Doctrine
US Strategy in Soviet Unions' alliances
Revolution in 1989Eastern Europe
Economic Growth stagnated
Mikhail Gorbachev
Boris Yeltsin
Two Strategies1. Freedom of speech: Policy of Glasnost 2. Economic Reform: Perstroika
15 Separate Countries
Moscow into bankruptcyReasons: • Wasteful use of natural Resources 1970• Joseph Stalin’s Leadership• Cold War‐Industrial Development‐US/EU
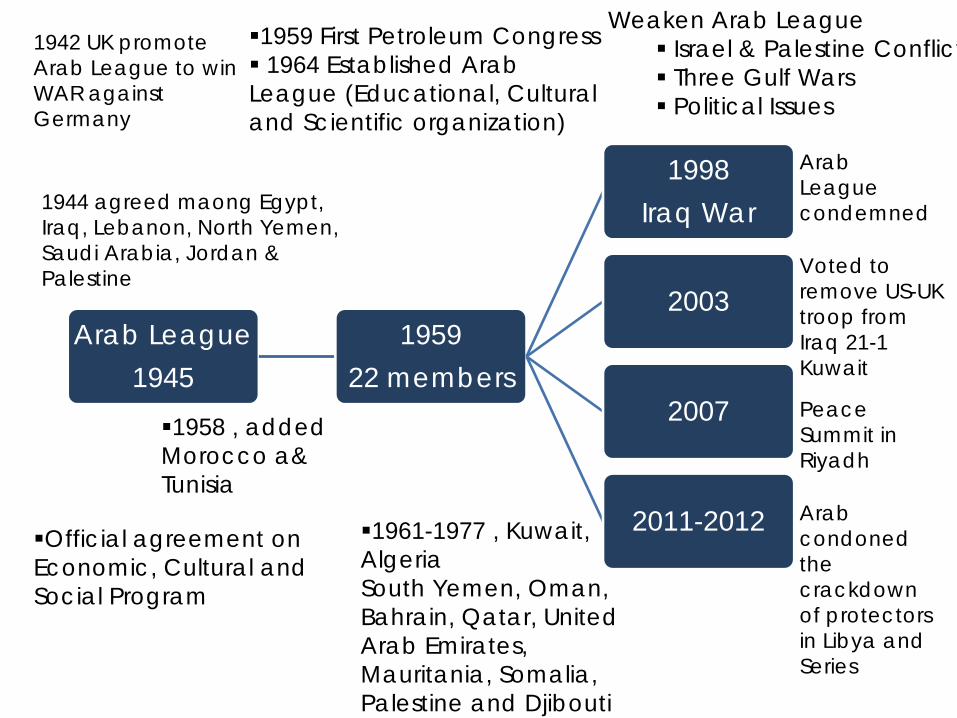
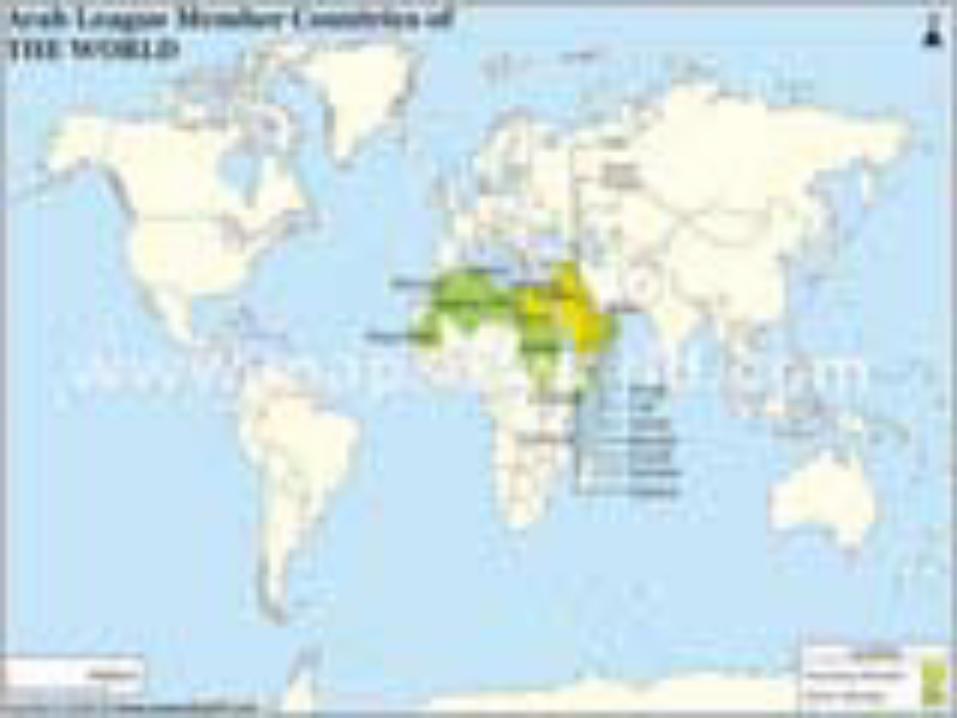
Arab League1945
195922 members
1998Iraq War
2003
2007
2011-2012Official agreement on Economic, Cultural and Social Program
1959 First Petroleum Congress1964 Established Arab
League (Educational, Cultural and Scientific organization)
1942 UK promote Arab League to win WAR against Germany
1944 agreed maong Egypt, Iraq, Lebanon, North Yemen, Saudi Arabia, Jordan & Palestine
1958 , added Morocco a& Tunisia
1961-1977 , Kuwait, AlgeriaSouth Yemen, Oman, Bahrain, Qatar, United Arab Emirates, Mauritania, Somalia, Palestine and Djibouti
Weaken Arab LeagueIsrael & Palestine ConflictThree Gulf WarsPolitical Issues
Arab League condemned
Voted to remove US-UK troop from Iraq 21-1 Kuwait
Peace Summit in Riyadh
Arab condoned the crackdown of protectors in Libya and Series
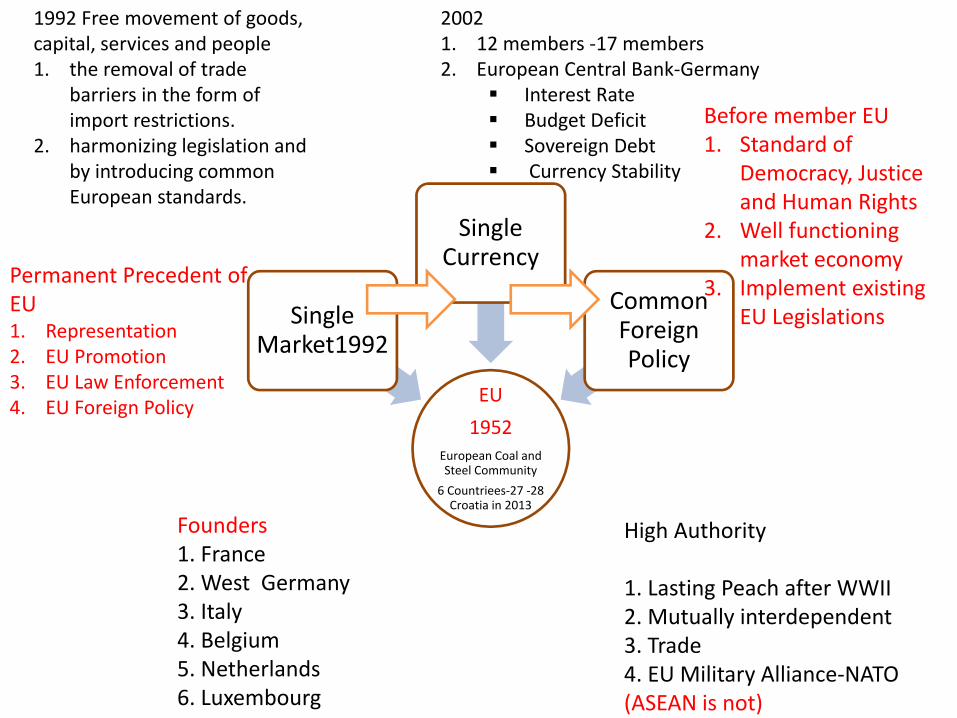
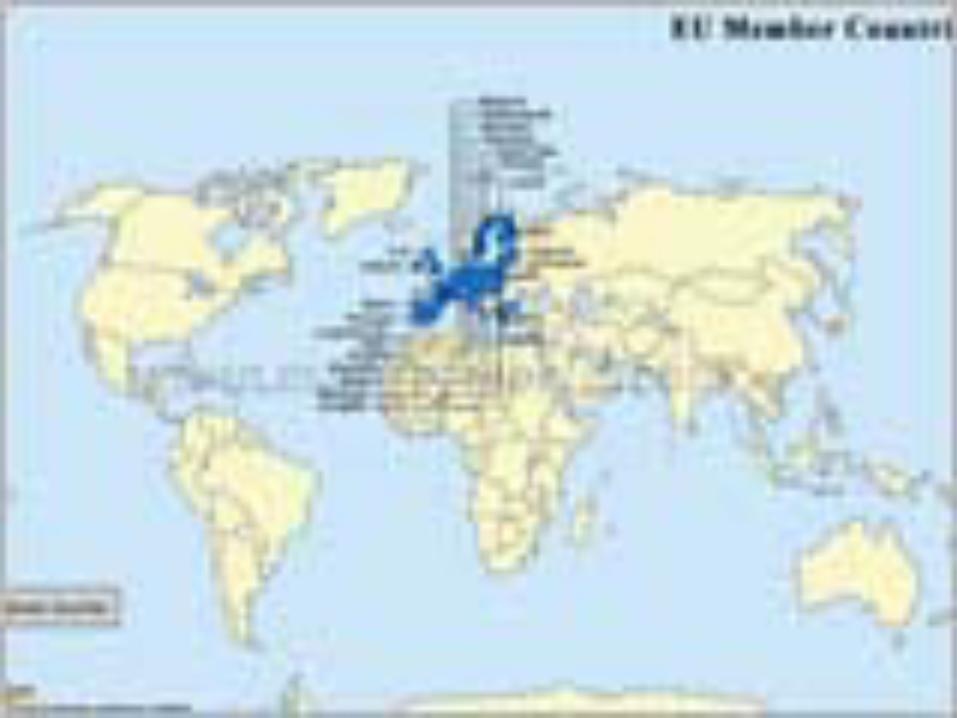
EU
1952European Coal and Steel Community
6 Countriees‐27 ‐28 Croatia in 2013
Single Market1992
Single Currency
Common Foreign Policy
Founders1. France2. West Germany3. Italy4. Belgium5. Netherlands6. Luxembourg
High Authority
1. Lasting Peach after WWII2. Mutually interdependent3. Trade4. EU Military Alliance‐NATO(ASEAN is not)
1992 Free movement of goods, capital, services and people1. the removal of trade
barriers in the form of import restrictions.
2. harmonizing legislation and by introducing common European standards.
20021. 12 members ‐17 members2. European Central Bank‐Germany
Interest RateBudget DeficitSovereign DebtCurrency Stability
Before member EU1. Standard of
Democracy, Justice and Human Rights
2. Well functioning market economy
3. Implement existing EU Legislations
Permanent Precedent of EU 1. Representation2. EU Promotion3. EU Law Enforcement4. EU Foreign Policy
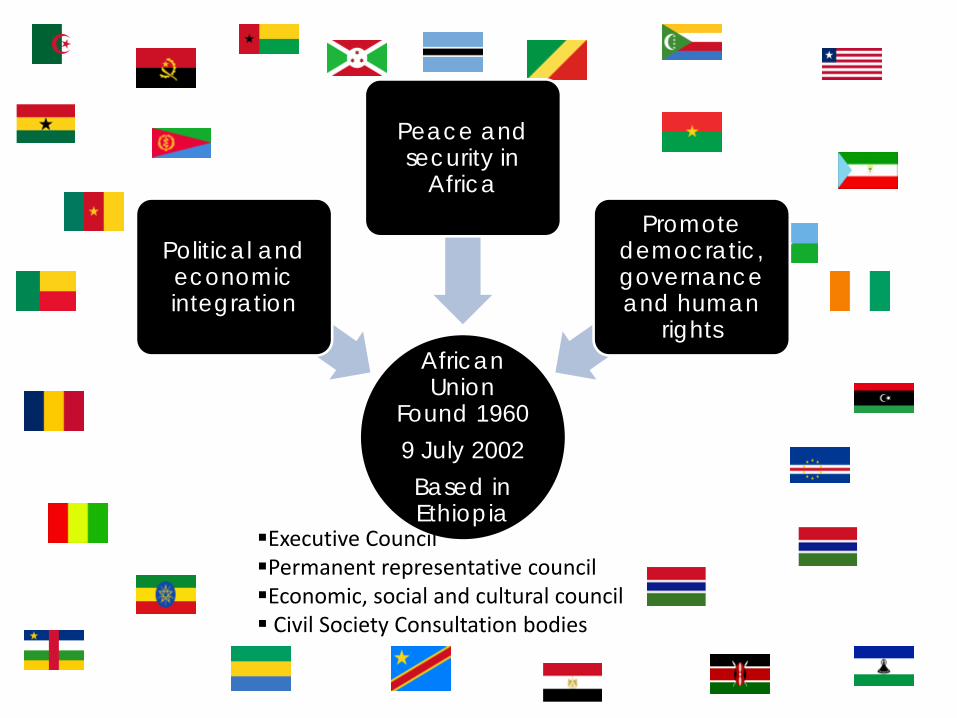
African Union
Found 19609 July 2002Based in Ethiopia
Political and economic integration
Peace and security in
AfricaPromote
democratic, governance and human
rights
Executive CouncilPermanent representative councilEconomic, social and cultural council Civil Society Consultation bodies

ASIA32 Countries
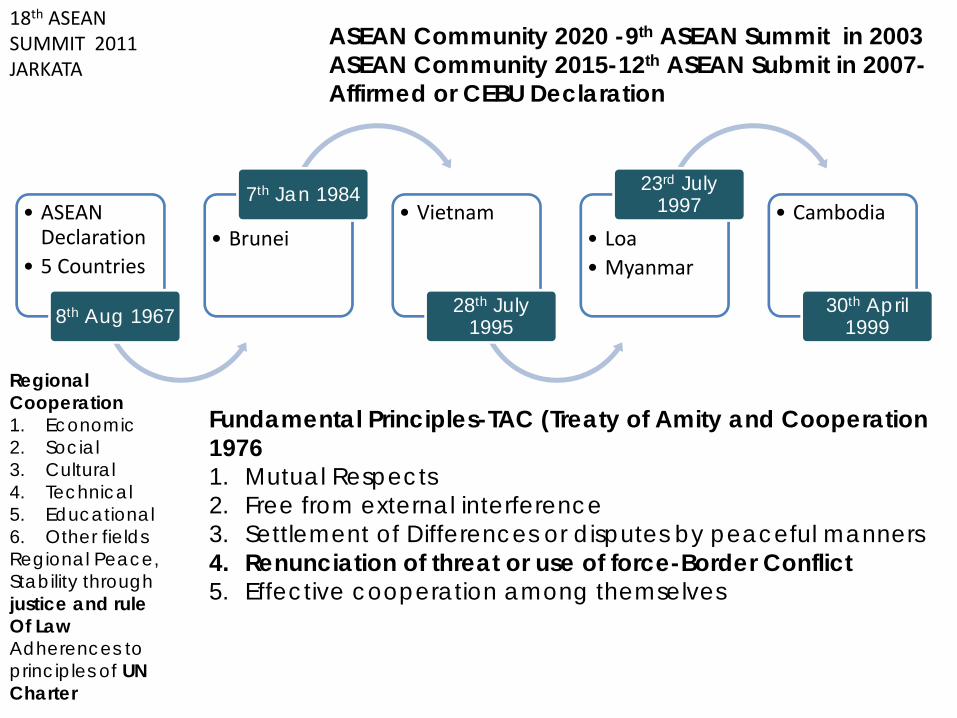
• ASEAN Declaration
• 5 Countries
8th Aug 1967
• Brunei
7th Jan 1984• Vietnam
28th July 1995
• Loa• Myanmar
23rd July 1997 • Cambodia
30th April 1999
Regional Cooperation1. Economic2. Social 3. Cultural 4. Technical 5. Educational 6. Other fieldsRegional Peace,Stability throughjustice and ruleOf LawAdherences toprinciples of UNCharter
Fundamental Principles-TAC (Treaty of Amity and Cooperation 19761. Mutual Respects2. Free from external interference 3. Settlement of Differences or disputes by peaceful manners4. Renunciation of threat or use of force-Border Conflict5. Effective cooperation among themselves
ASEAN Community 2020 -9th ASEAN Summit in 2003 ASEAN Community 2015-12th ASEAN Submit in 2007-Affirmed or CEBU Declaration
18th ASEAN SUMMIT 2011JARKATA
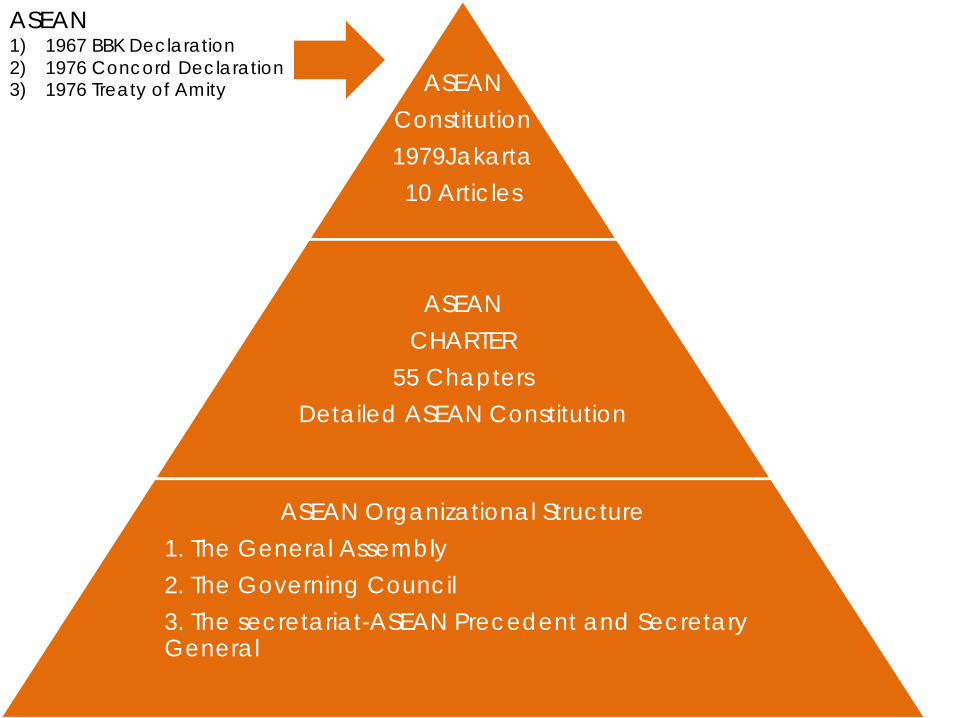
ASEAN Constitution1979Jakarta10 Articles
ASEAN CHARTER
55 ChaptersDetailed ASEAN Constitution
ASEAN Organizational Structure1. The General Assembly2. The Governing Council3. The secretariat-ASEAN Precedent and Secretary General
ASEAN1) 1967 BBK Declaration2) 1976 Concord Declaration3) 1976 Treaty of Amity

ASEAN Community 2009-2015
ASEAN CHARTER
ASEANCharter15 Dec 2008
Jakarta
Legal Status
Institutional Framework
Norms, Rule and Values
Clear Target
Accountability & Compliance
Agreed by 10 ASEAN members states

• ASEAN Declaration
• 5 Countries
8th Aug 1967
• Brunei
7th Jan 1984• Vietnam
28th July 1995
• Loa• Myanmar
23rd July 1997 • Cambodia
30th April 1999
•1st 1976, Indonesia •2nd 1977, Malaysia•3rd 1987, Philippines•4th 1992, Singapore •5th 1995, Thailand•6th 1998, Vietnam•7th 2001, Brunei
ASEAAN Summit
• 8th 2002, Cambodia •9th 2003, Indonesia •10th 2004, Laos •11th 2005, Malaysia•12th 2007, Philippines•13th 2007, Singapore• 14th 2009, Thailand
ASEAN Summit
•15th , 2009, Thailand•16th 2010, Vietnam•17th, 2010 Vietnam•18th ,2011 Indonesia•19th 2011 Indonesia•20th 2012 Cambodia
ASEAN Summit
14th Summit : Hua Hin Declaration on the Roadmap for an ASEAN Community

ASEAN SUMMIT
Political‐Security
Community
Economic Community
Social Cultural
Community
1) Ministerial MeetingsInformationCulture & ArtEducationDisaster MgtEnvironmentHealthLabor (Declaration on Promotion & Protection of all migrant workers/FamiliesRural Dev. & Poverty ReductionSocial WelfareYouthCivil Service Matters
2) ASEAN University Network
3) Centers Biodiversity CentreDisaster Management CentreEarth Quake Information CentreSpecialized Metrological Centre
1) Foreign Ministerial MeetingsDevelopment PlanningStanding Committee
2) Nuclear Free Zoon Commission3) Defense Ministers Meeting4) Law Ministers meeting5) Ministerial meeting on
transnational CrimeTran national CrimeDrug MattersImmigration departmentConsular Affairs
6) ASEAN Regional Forum
1) Economic Ministers Meeting-High Level Task Force on ASEAN Economic Integration
2) ASEAN Free Trade Area-AFTA Council3) ASEAN Investment Area Council-AIA4) ASEAN Finance Ministers Meeting
Central BankCustoms
5) ASEAN Ministers Meetings• On Agriculture & Forestry• Energy• Minerals• Technology• Transport• Tourism• Mekong Basin Devel.
6) Committee on Science and Technology
7) Telecommunication and Information8) Telecommunication Gegulators
Councils

92
8.8 ASEAN and World Popultaion
World
ASEAN
Population : 578,498,000 Population Density : 134.9Land Area (sqkm) : 4,345,670Live Expectancy (year) : 61.0‐80.7 Sex Ratio‐M/F : 99.5GDP per Capita : 3092.5 US$GDP Growth at constant Price : 7.4%Unemployment Rate : 1.0‐7.9%Infant Mortality Rate : 2.1‐71.0%Access to safe drinking water : 60‐100%Access to improved sanitation : 28‐100%NER‐Secondary School : 34.1‐89.1%Adult Literacy Rate : 77.6‐95.0%Youth aged 15‐29 : 159,613,000 or 28%
Source: ASEAN Statistic 2011
0
100,000
200,000
300,000
400,000
500,000
600,000546,865
264,323
193,108182,702161,358
96,317
24,973 10,759 10,359 5,579
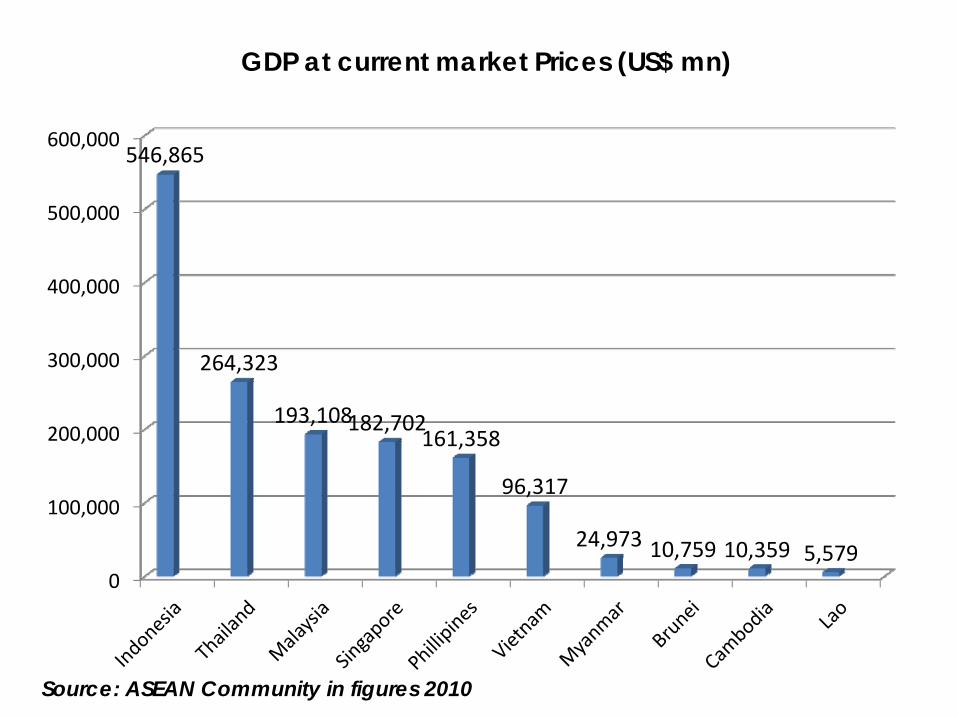
GDP at current market Prices (US$ mn)
Source: ASEAN Community in figures 2010
234,181,000
94,013,000
86,930,000
67,312,000
60,163,000
28,909,000
15,269,000 6,230,0005,077,000
415,000
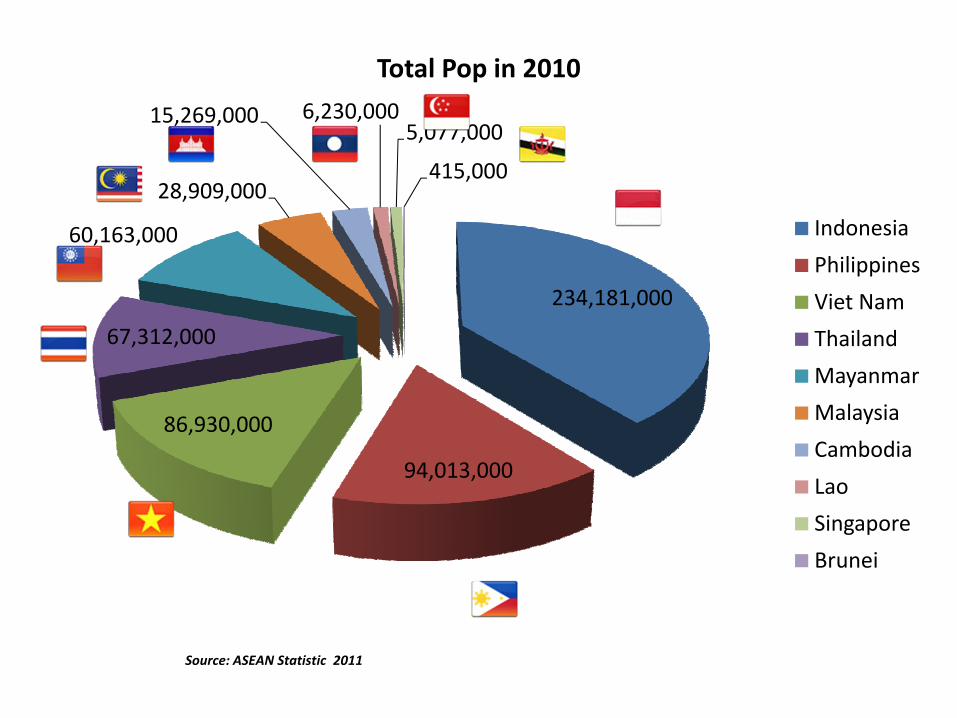
Total Pop in 2010
Indonesia
Philippines
Viet Nam
Thailand
Mayanmar
Malaysia
Cambodia
Lao
Singapore
Brunei
Source: ASEAN Statistic 2011

43,929
28,830
8,262
4,735
3,0232,0141,238
1,040
830
592
Singapore
Brunei
Malaysia
Thailand
Indonesia
Philippines
Viet Nam
Lao
Cambodia
Mayanmar
GDP Per Capita (US$)
Source: ASEAN Statistic 2011

95 95 94 94 93 92 92 91
78 73
0
10
20
30
40
50
60
70
80
90
100
Adult Literacy Rate
Source: ASEAN Statistic 2011

109 109 109 107101 99
9182 81
0
20
40
60
80
100
120
Girl‐Boy Ratio in Secondary School
Source: ASEAN Statistic 2011

89
7668
61
36 34
0
10
20
30
40
50
60
70
80
90
100
Brunei Thailand Indonesia Philippines Lao Cambodia
NER (secondary School)
Source: ASEAN Statistic 2011
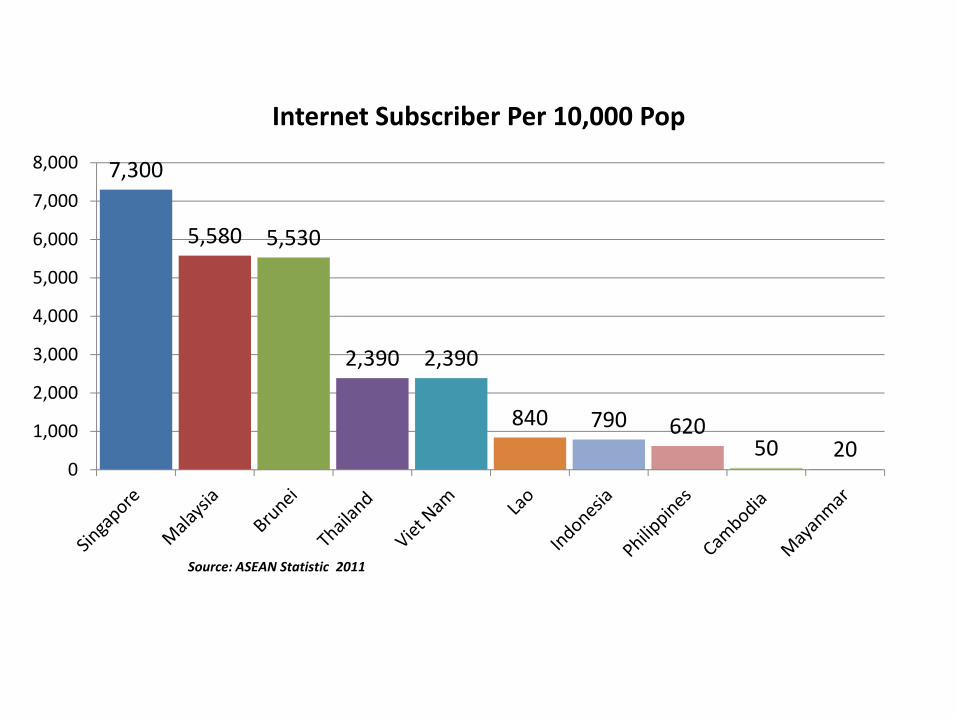
7,300
5,580 5,530
2,390 2,390
840 790 62050 20
0
1,000
2,000
3,000
4,000
5,000
6,000
7,000
8,000
Internet Subscriber Per 10,000 Pop
Source: ASEAN Statistic 2011

To…
0
10,000
20,000
30,00024,577
15,93610,511
7,0035,050
3,292 2,513 2,508792 112
Tourst Arrival (000) Annually
Source: ASEAN Statistic 2011
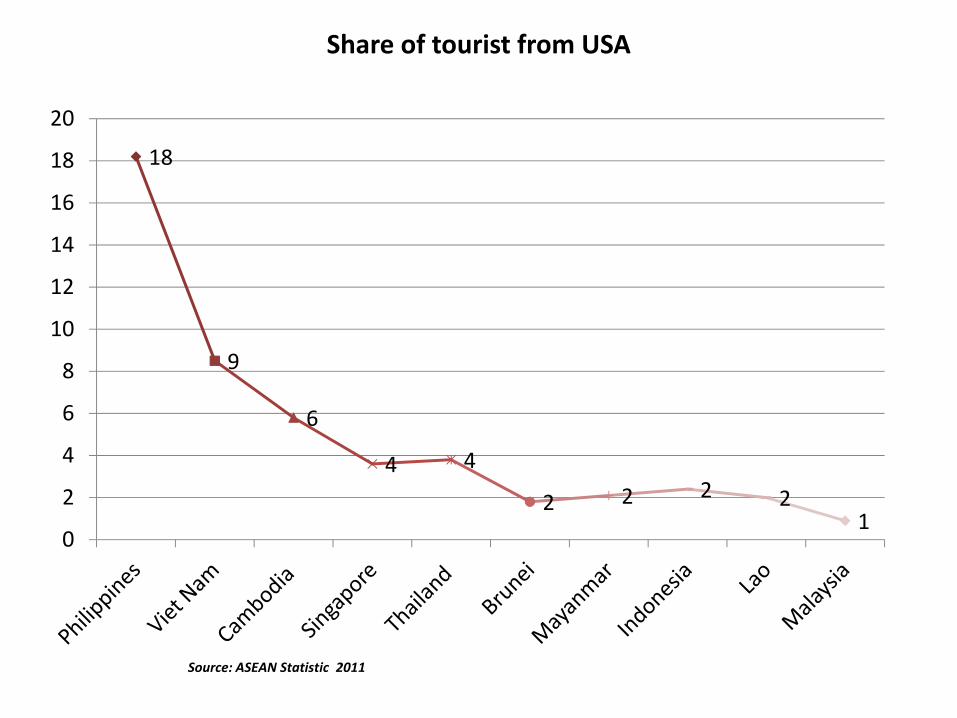
18
9
6
4 4
2 2 2 21
0
2
4
6
8
10
12
14
16
18
20
Share of tourist from USA
Source: ASEAN Statistic 2011
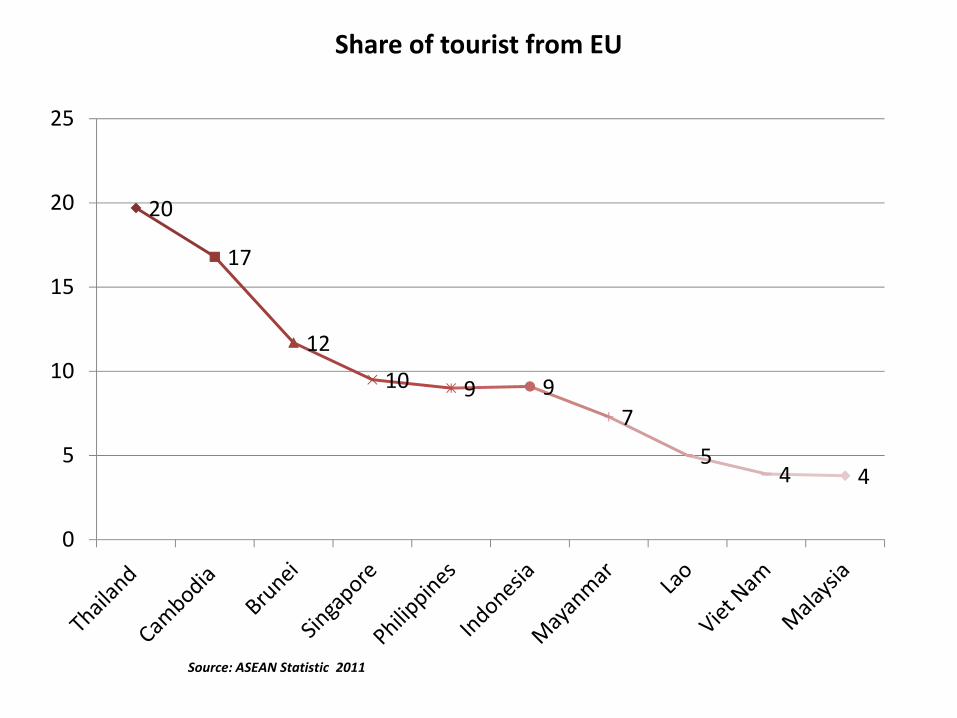
20
17
12
10 9 97
54 4
0
5
10
15
20
25
Share of tourist from EU
Source: ASEAN Statistic 2011
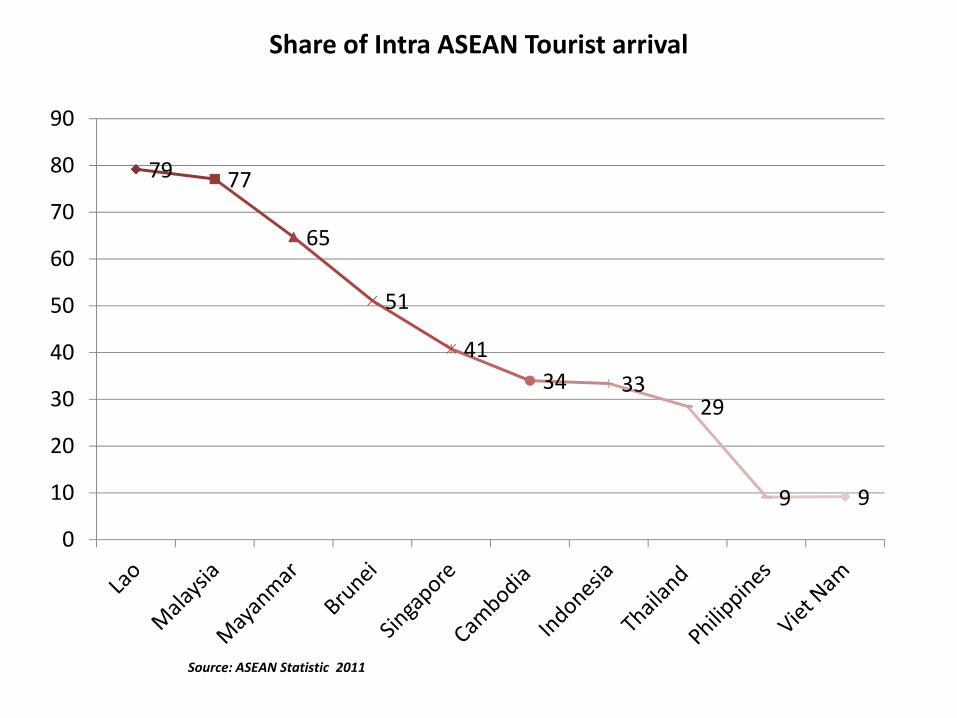
79 77
65
51
4134 33
29
9 9
0
10
20
30
40
50
60
70
80
90
Share of Intra ASEAN Tourist arrival
Source: ASEAN Statistic 2011
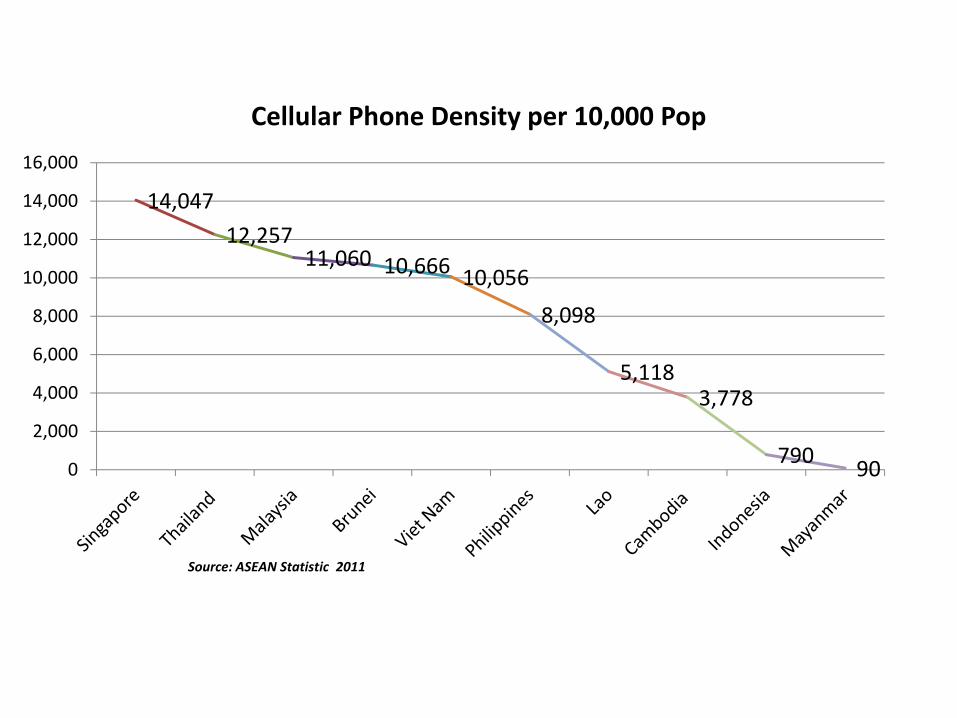
14,047
12,25711,060 10,666 10,056
8,098
5,1183,778
790 900
2,000
4,000
6,000
8,000
10,000
12,000
14,000
16,000
Cellular Phone Density per 10,000 Pop
Source: ASEAN Statistic 2011
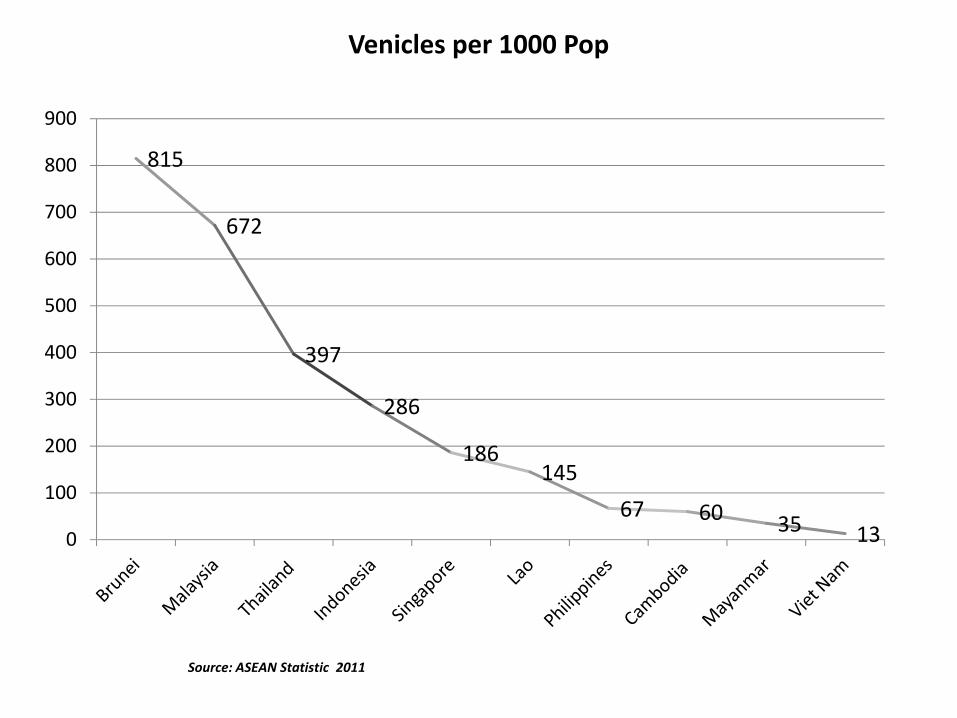
815
672
397
286
186145
67 60 35 130
100
200
300
400
500
600
700
800
900
Venicles per 1000 Pop
Source: ASEAN Statistic 2011
0
100,000
200,000
300,000
400,000
500,000
600,000
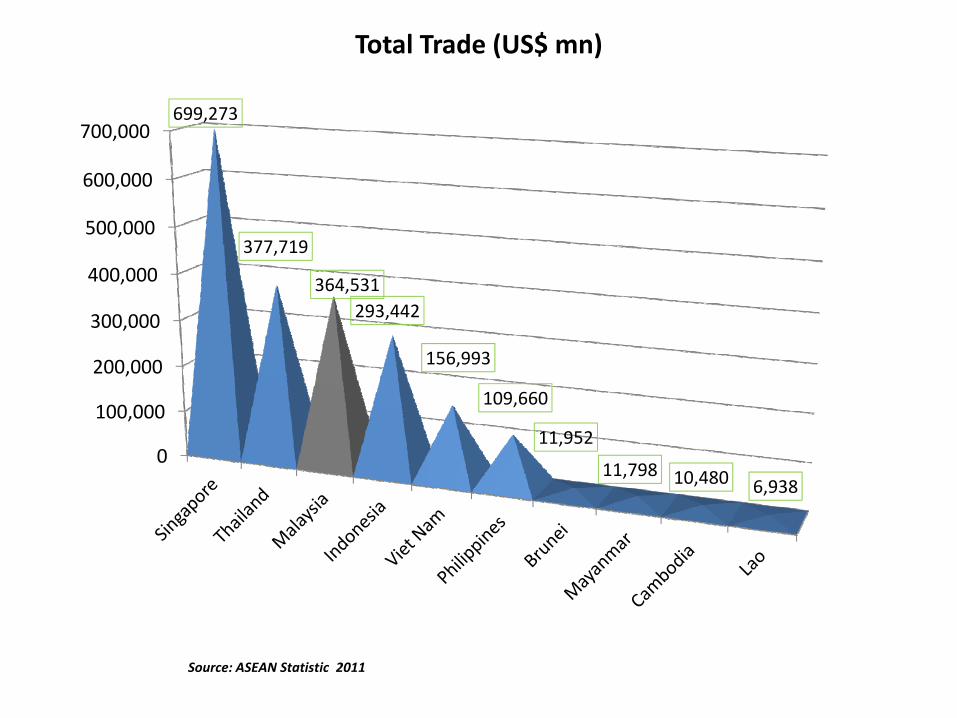
700,000699,273
377,719
364,531293,442
156,993
109,660
11,952
11,798 10,480 6,938
Total Trade (US$ mn)
Source: ASEAN Statistic 2011
0.00
5.00
10.00
15.00
20.00
25.00
30.00
35.00
40.00
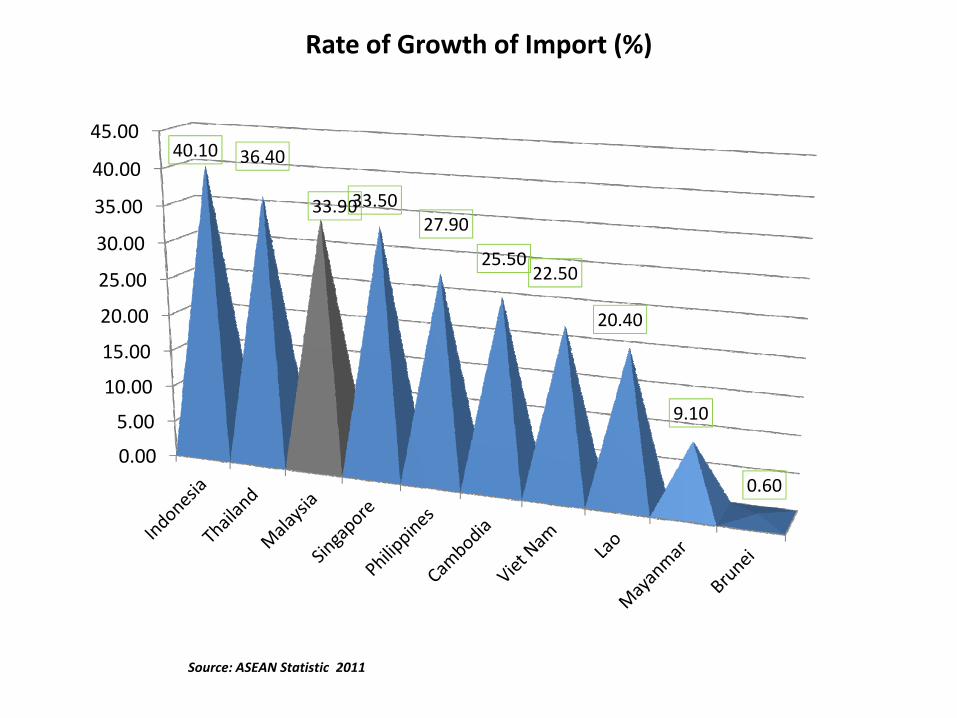
45.0040.10 36.40
33.9033.5027.90
25.5022.50
20.40
9.10
0.60
Rate of Growth of Import (%)
Source: ASEAN Statistic 2011

0.00
5.00
10.00
15.00
20.00
25.00
30.00
35.00
40.00 37.60 35.40
34.2032.70 29.3028.10 27.10
22.50
19.80
12.00
Rate of Growth of Export (%)
Source: ASEAN Statistic 2011
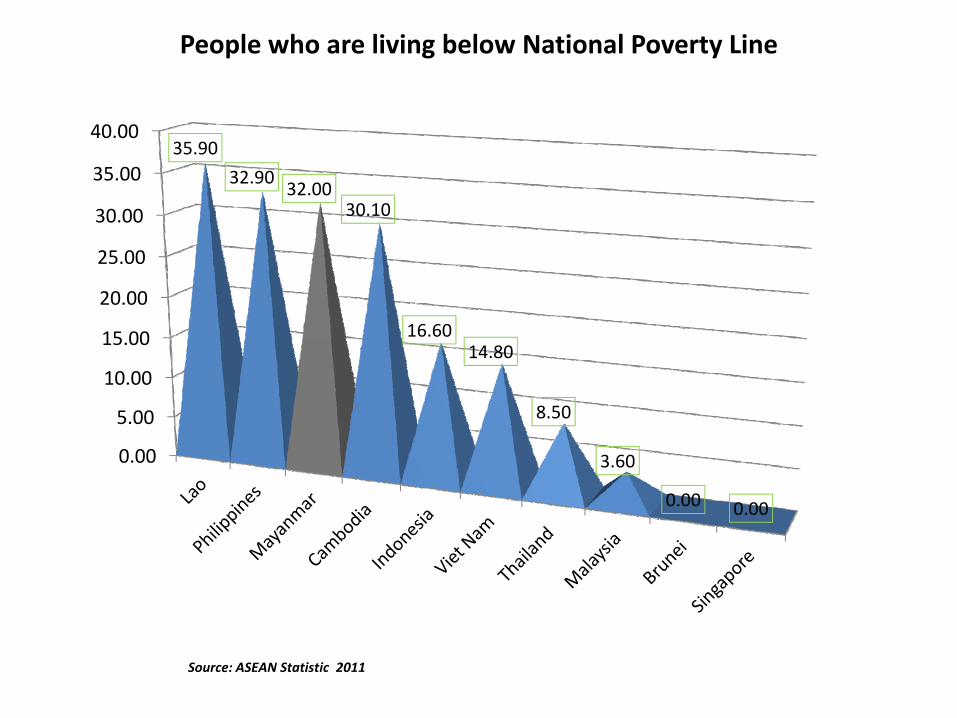
0.00
5.00
10.00
15.00
20.00
25.00
30.00
35.00
40.0035.90
32.9032.00
30.10
16.6014.80
8.50
3.60
0.00 0.00
People who are living below National Poverty Line
Source: ASEAN Statistic 2011

100 9994
9082 80 78
6560
28
0
20
40
60
80
100
120
Access To Safe Drinking Water (%)
Source: ASEAN Statistic 2011
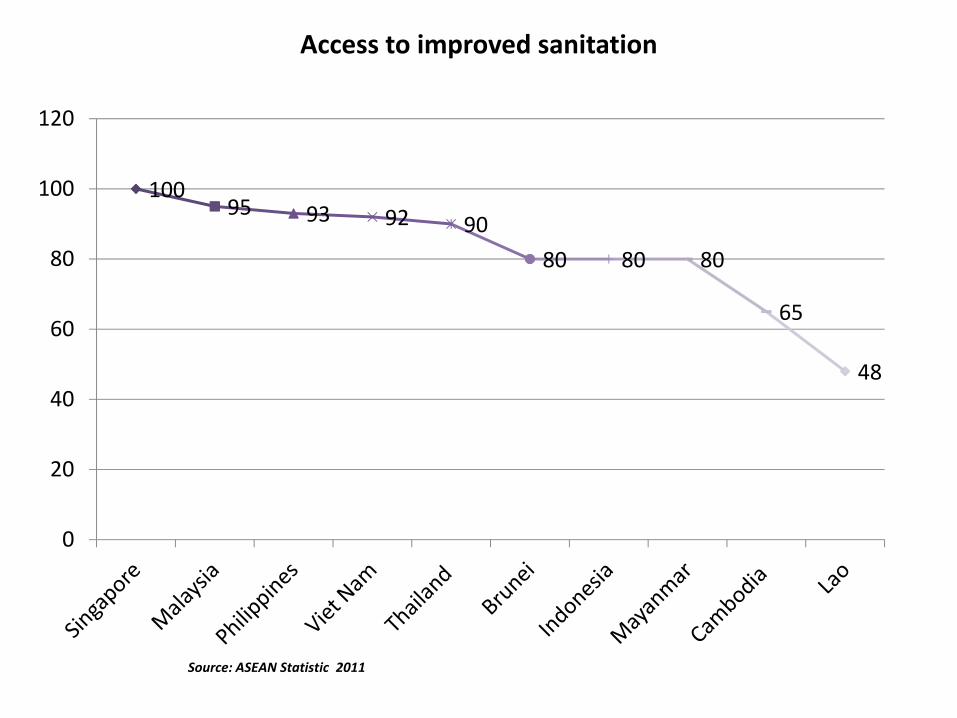
10095 93 92 90
80 80 80
65
48
0
20
40
60
80
100
120
Access to improved sanitation
Source: ASEAN Statistic 2011
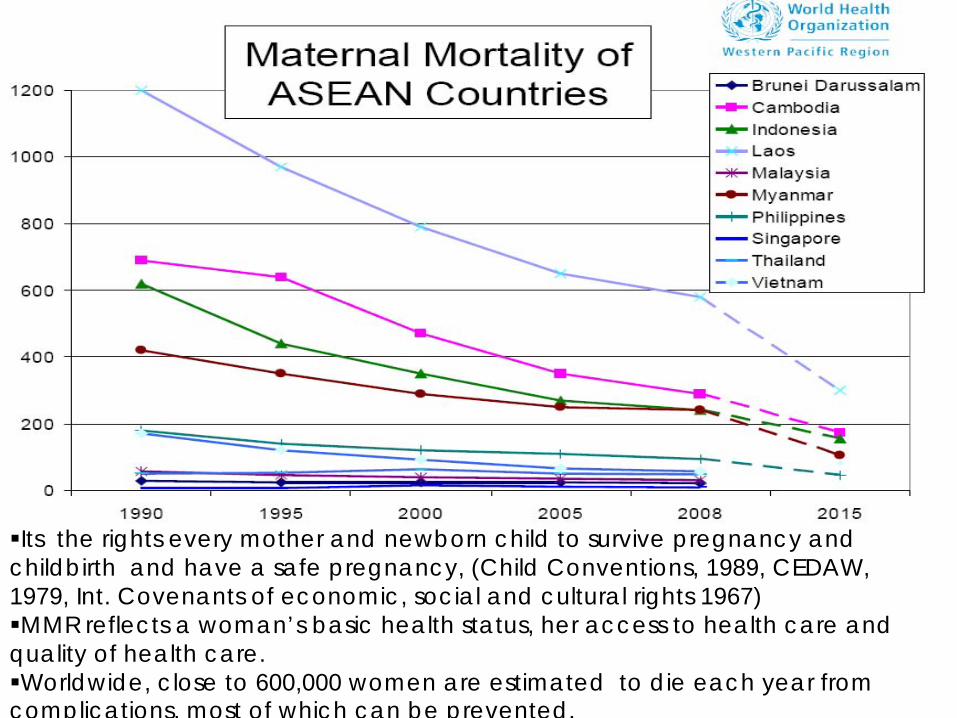
Its the rights every mother and newborn child to survive pregnancy and childbirth and have a safe pregnancy, (Child Conventions, 1989, CEDAW, 1979, Int. Covenants of economic, social and cultural rights 1967) MMR reflects a woman’s basic health status, her access to health care and
quality of health care.Worldwide, close to 600,000 women are estimated to die each year from
complications, most of which can be prevented.
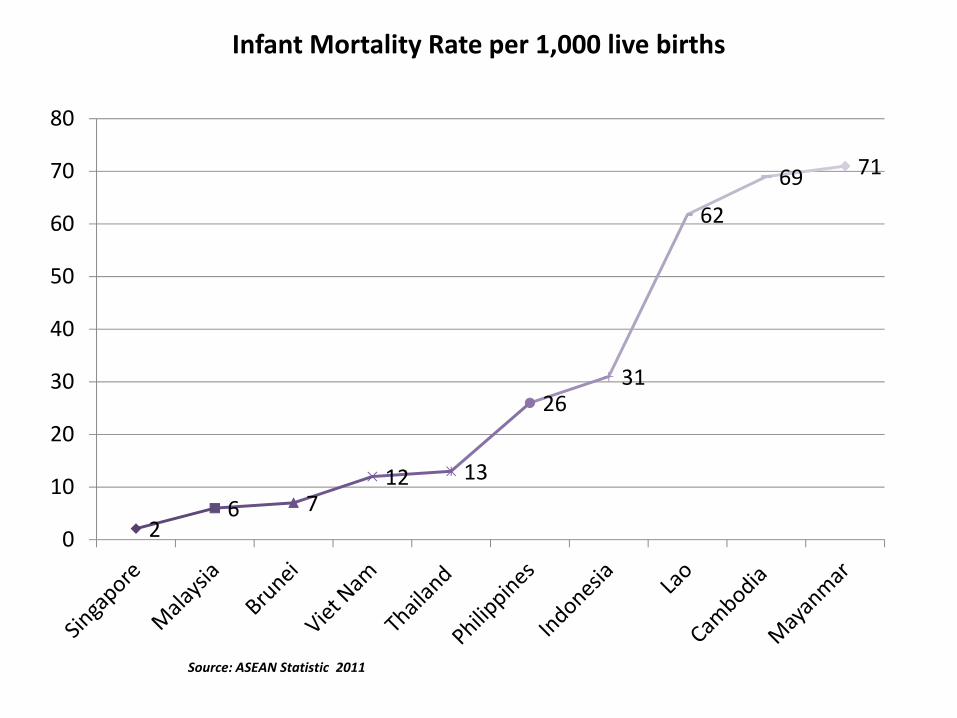
26 7
12 13
2631
62
69 71
0
10
20
30
40
50
60
70
80
Infant Mortality Rate per 1,000 live births
Source: ASEAN Statistic 2011


General Population Census
Core Indicators Findings 2008
Urban Population 19.5%Annual Population Growth 1.54%Total numbers of household 2,841,897Average household size 4.7Female headed household 25.6%Population density per km2 75Dependency Ratio 61.2Sex Ratio M/F 94.7Marital Status (=15 or over), Devoiced =2% 60.2%Adult Literacy rate 77.6

General Population Census
Core Indicators Findings 2008
Unemployment rate 1.68Primary (Agriculture) 72.3%Secondary (Industry) 8.5%
Tertiary (Service) 19.2%% of Migrants 26.5%% of households by main type used fuel for cooking 83.6%Fertility rate 3.1Enfant Mortality Rate per 1,000 live births 60/1,000Maternal Mortality Ratio per 100,000 live births 461Live Expectancy at births Male 60.5
Female 64.3% of household having electricity as main source of light 26.4%, 87-13
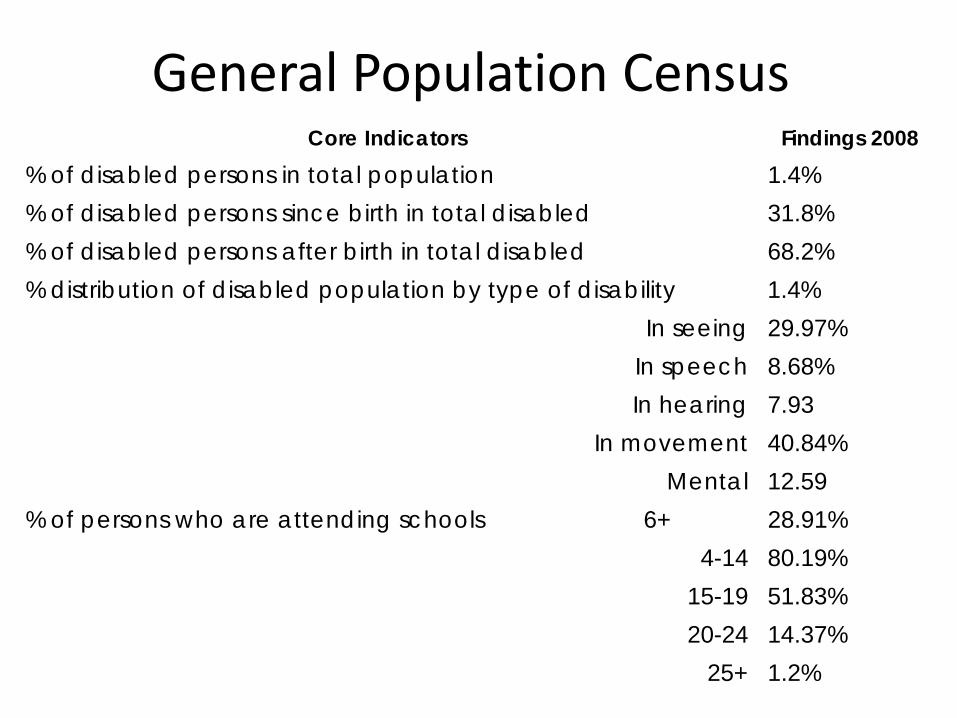
General Population Census Core Indicators Findings 2008
% of disabled persons in total population 1.4%% of disabled persons since birth in total disabled 31.8%% of disabled persons after birth in total disabled 68.2%% distribution of disabled population by type of disability 1.4%
In seeing 29.97%In speech 8.68%In hearing 7.93
In movement 40.84%Mental 12.59
% of persons who are attending schools 6+ 28.91%4-14 80.19%
15-19 51.83%20-24 14.37%
25+ 1.2%
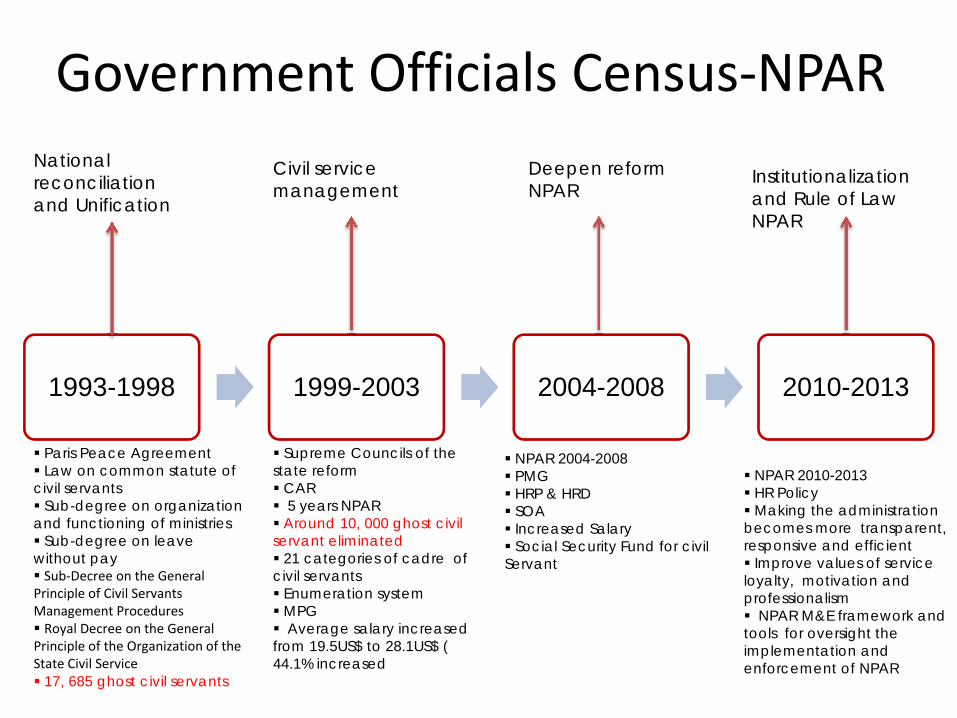
Government Officials Census‐NPAR
1993-1998 1999-2003 2004-2008 2010-2013
National reconciliation and Unification
Civil service management
Deepen reformNPAR
Institutionalization and Rule of LawNPAR
Paris Peace AgreementLaw on common statute of
civil servantsSub-degree on organization
and functioning of ministries Sub-degree on leave
without paySub‐Decree on the General
Principle of Civil Servants Management ProceduresRoyal Decree on the General
Principle of the Organization of the State Civil Service
17, 685 ghost civil servants
Supreme Councils of the state reform
CAR5 years NPAR
Around 10, 000 ghost civil servant eliminated
21 categories of cadre of civil servants
Enumeration systemMPGAverage salary increased
from 19.5US$ to 28.1US$ ( 44.1% increased
NPAR 2004-2008PMGHRP & HRD SOAIncreased Salary Social Security Fund for civil
Servant
NPAR 2010-2013HR PolicyMaking the administration
becomes more transparent, responsive and efficient
Improve values of service loyalty, motivation and professionalism
NPAR M&E framework and tools for oversight the implementation and enforcement of NPAR

Cambodia Economic Census‐Mar 2011Core Indicators Findings 2011
# of Establishments(182,439 New establishments), Street business: 43,653)
505,134
Cambodia Owners 98.9%1 person engaged (%) 44%
2 persons engaged (%) 34.9%5 persons engaged and over 39,53710 persons engaged and over 13,170
100 persons engaged and over 7871000 persons engaged and over 119
Total # of person engaged 1,676,263Male 650,179
Female (56.1%) 1,026,084Tenure of business plan (owned) 68.9%Tenure of business plan (Rented) 24%

Cambodia Economic Census‐Mar 2011Core Indicators Findings 2011
Annual sales (million US $) 120,196Annual sales per establishment (US$) 237,978
Annual sales per person engaged 72,141Annual expenses (million US$) 100,809
Annual expenses per establishment 199,593Annual expenses per person engaged 60,505
Annual profit and loss (million US$) 19,387Annual profit and loss per establishment(US$) 38,358
Annual profit and loss per person engaged 11,636New: Business just started from 1st Jan 2009Street business : Refers to a business such as a stall , a booth, etc. that keeping running at a fixed location on the sidewalk or the roadside

Cambodia Socio Economic Study‐CSES
Core Indicators Findings 2009
1. Improved drinking water sources (wet and dry seasons) 45% & 52%
2. Improved toilet facilities 35%
3. Cambodia Children aged 6-11 years were attending Primary School 81%
4. Labor Forces or working age population (15-64 years olds) 84% or 7.5M
5. Child involved in economic activities (5-14 years olds) 45%
6. Income (70% from self employment income, 27% from wage and salary and 2% from transfer received and less than 1 % from others
70% SEI
7. Expenditure (49% food, 19% Housing, Water, electricity, Fuel ), 10% health
10% Health
8. Victimization (2.6% exposed to thefts, burglary and Robbery ), 0.6% exposed to DV and 4.9 % exposed to accidents
4.9% Accidents
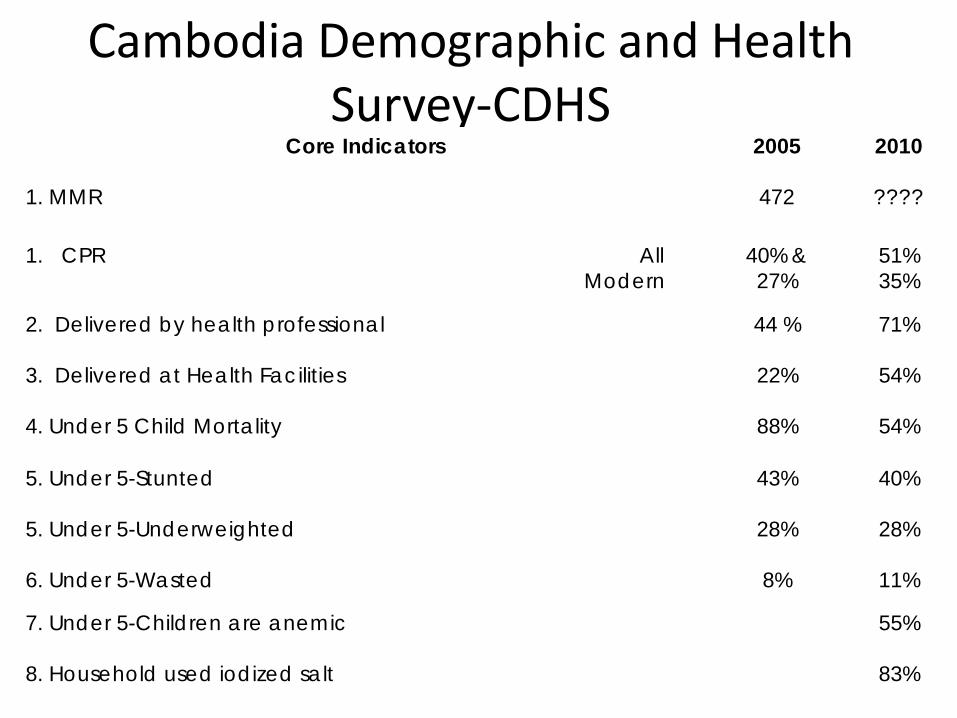
Cambodia Demographic and Health Survey‐CDHS
Core Indicators 2005 2010
1. MMR 472 ????
1. CPR AllModern
40% & 27%
51%35%
2. Delivered by health professional 44 % 71%
3. Delivered at Health Facilities 22% 54%
4. Under 5 Child Mortality 88% 54%
5. Under 5-Stunted 43% 40%
5. Under 5-Underweighted 28% 28%
6. Under 5-Wasted 8% 11%
7. Under 5-Children are anemic 55%
8. Household used iodized salt 83%
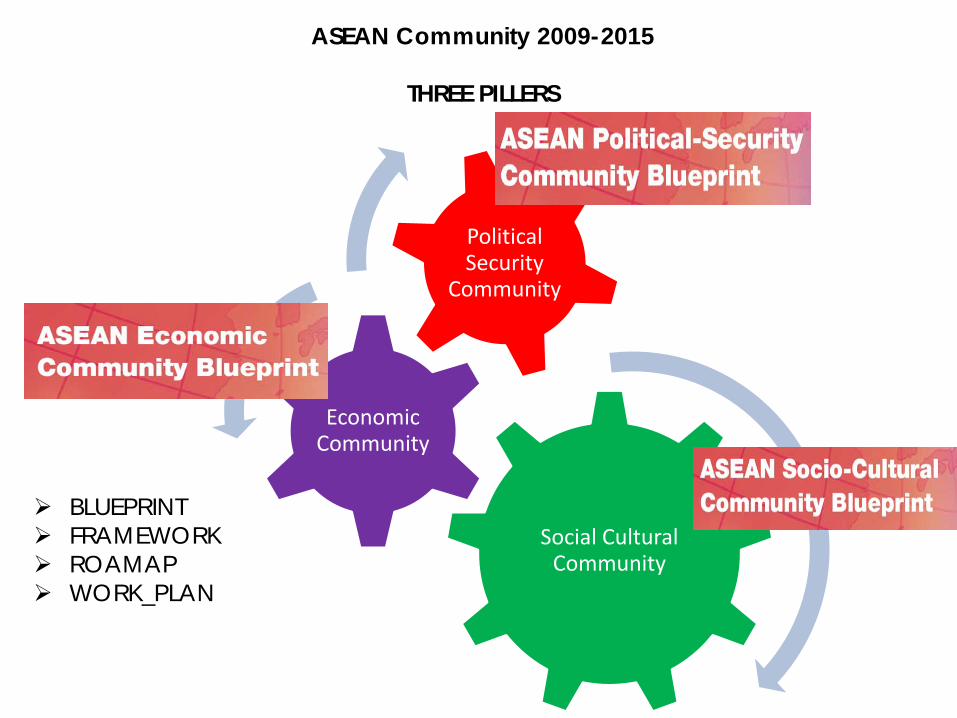
ASEAN Community 2009-2015
THREE PILLERS
Social Cultural Community
Economic Community
Political Security
Community
BLUEPRINTFRAMEWORKROAMAPWORK_PLAN
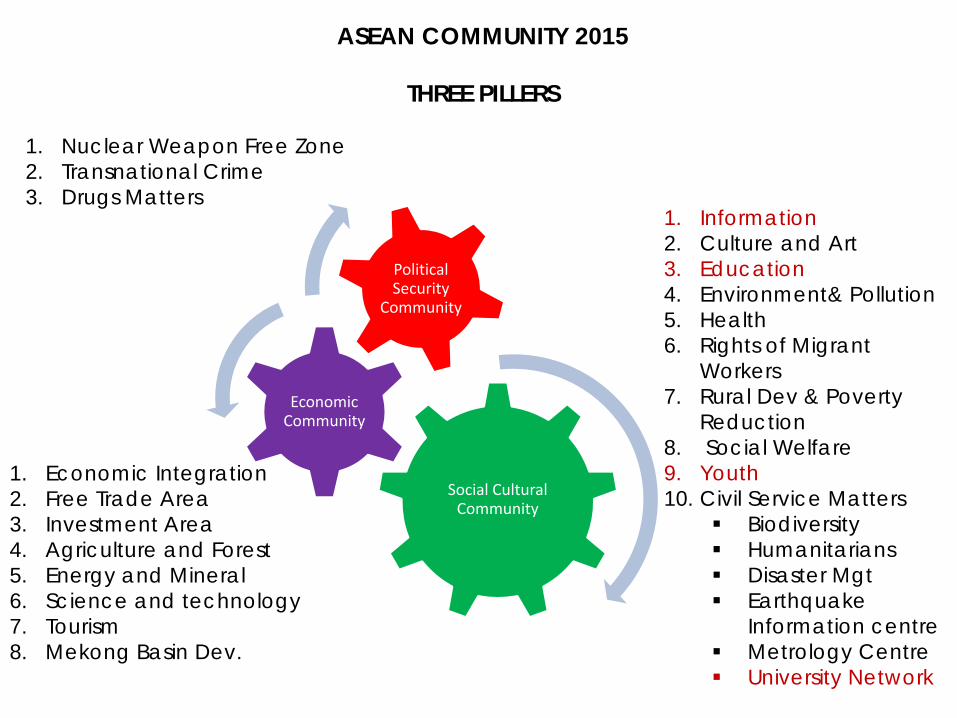
ASEAN COMMUNITY 2015
THREE PILLERS
1. Nuclear Weapon Free Zone2. Transnational Crime3. Drugs Matters
1. Economic Integration2. Free Trade Area3. Investment Area4. Agriculture and Forest5. Energy and Mineral6. Science and technology7. Tourism8. Mekong Basin Dev.
1. Information2. Culture and Art3. Education4. Environment& Pollution 5. Health6. Rights of Migrant
Workers7. Rural Dev & Poverty
Reduction8. Social Welfare9. Youth10. Civil Service Matters
BiodiversityHumanitariansDisaster MgtEarthquake Information centre Metrology Centre University Network
Social Cultural Community
Economic Community
Political Security
Community
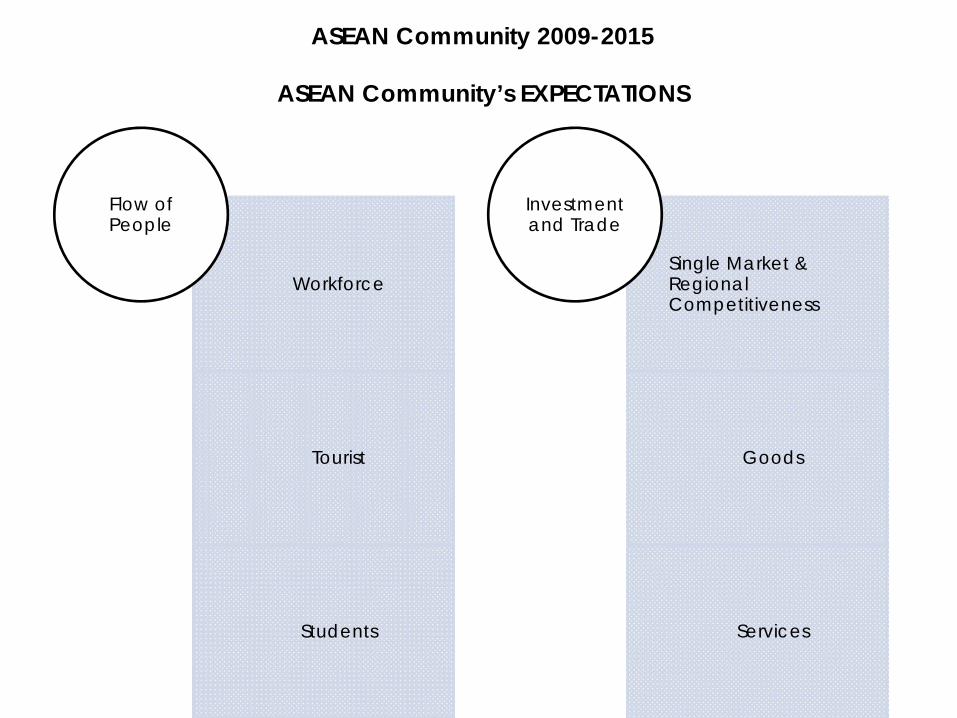
ASEAN Community 2009-2015
ASEAN Community’s EXPECTATIONS
Workforce
Tourist
Students
Flow of People
Single Market & Regional Competitiveness
Goods
Services
Investment and Trade

ASEAN Community 2015
EDUCATION-FUTURE EMPLOYMENT
Degree Program in the region
Graduate
Professional Skills
Inter Cultural Skills
English
ASEAN Community 2015
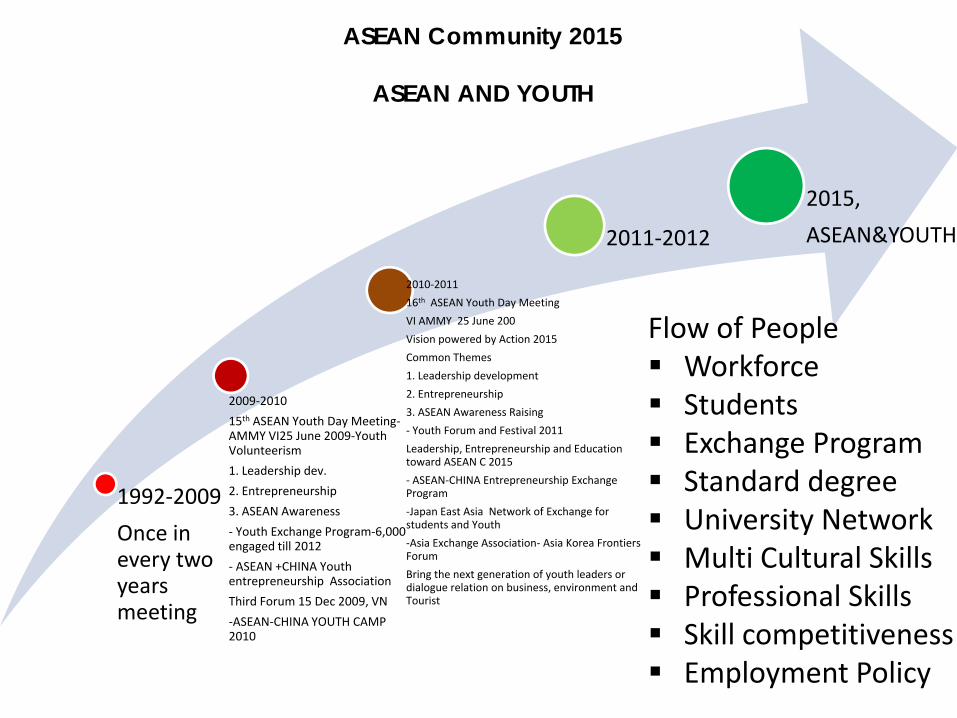
ASEAN AND YOUTH
1992‐2009
Once in every two years meeting
2009‐2010
15th ASEAN Youth Day Meeting‐AMMY VI25 June 2009‐Youth Volunteerism
1. Leadership dev.
2. Entrepreneurship
3. ASEAN Awareness
‐ Youth Exchange Program‐6,000 engaged till 2012
‐ ASEAN +CHINA Youth entrepreneurship Association
Third Forum 15 Dec 2009, VN
‐ASEAN‐CHINA YOUTH CAMP 2010
2010‐2011
16th ASEAN Youth Day Meeting
VI AMMY 25 June 200
Vision powered by Action 2015
Common Themes
1. Leadership development
2. Entrepreneurship
3. ASEAN Awareness Raising
‐ Youth Forum and Festival 2011
Leadership, Entrepreneurship and Education toward ASEAN C 2015
‐ ASEAN‐CHINA Entrepreneurship Exchange Program
‐Japan East Asia Network of Exchange for students and Youth
‐Asia Exchange Association‐ Asia Korea Frontiers Forum
Bring the next generation of youth leaders or dialogue relation on business, environment and Tourist
2011‐2012
2015,
ASEAN&YOUTH
Flow of PeopleWorkforceStudentsExchange ProgramStandard degreeUniversity NetworkMulti Cultural SkillsProfessional SkillsSkill competitivenessEmployment Policy

ASEAN Community 2015
ASEAN AND HUMAN DEVELOPMENT
EDUCATION
•Integration education priorities•Awareness of ASEAN to youth•University Network•ASEAN Language‐English Language •ASEAN Youth Program Fund
HR Development
•Qualified, competent and well prepared for ASEAN workforce•Center of Excellence•Address the needs of high value added industries that enhance ASEAN Global Competitiveness •ASEAN Standard Competitiveness •ASEAN Skill Competitiveness
Decent Work
•ASEAN Employment Policy•ASEAN Skill Recognition Framework•ASEAN network of experts•ASEAN Occupational Safety and Health s Framework
ICT
•ASEAN IT Initiatives • Positive use of ICT ( Information and Communication technology)• IT Expertise • Science and IT
Civil Service Capability
• High Quality of Public Services• Public Human Resources Competencies• ASEAN Resource Center

ASEAN Community 2015
ASEAN AND Economic Community
ASEAN Single Markey: Free movement of goods, services, investment, labor skills and free flow of capital (Integration Sectors, food, Agriculture,, Forestry)
ASEAN Single Window
ASEAN Free Trade Area Agreement
Common Effective Preferential Tariffs, SME Development, Integration to Global Economic Development
Elimination of non tariff barriers
Customs Integration
System of Standard
Competition Policy, Consumer protection Property Rights, Infrastructure Development, Taxation, E‐COMMERCE‐TELE Communication Competition Policy
No Restriction of ASEAN service Suppliers
Professional Qualification
Financial Services
Airport Services
AIA‐ASEAN INVESTMENT AREA, Flow of Labor‐WORKING VISA, STUDENT MOBILITY
Capital Market Development
RECOMMENDATIONS
Amend ASEAN Constitution and Charter toward High International Standard of Democracy and Human Rights-UN Human Rights Declaration
ASEAN Strategic Plan, Blueprint with core indicators and measurement in transparent and accountable ways ( Target for achievement in 2015-2020.
Fair and Transparent ASEAN Human Rights Body-ASEAN Declaration on Human Rights
ASEAN Civil Society BodyObligation in ratification on the promotion and protection of
all migrant workers and their familiesASEAN Common Policy and Guideline based on UN
Conventions-CEDAW, Child Rights, Migrant Workers…ASEAN Military Alliances as model of NATOASEAN Permanent Precedent
RepresentationPromotionLaw EnforcementForeign Policy
Bibliographies
ASEAN, 2011, ASEAN statistic Leaflet, selected core indicators, ASEAN Foreign Investment Statistic, Database as of 6 July 2011; Country Submission
Ministry of Planning and Ministry of Health , Royal Government of Cambodia, 2010, Cambodia Health Demographic Survey, www.moh.gov.kh
Ministry of Planning. Royal Government of Cambodia, 2009, Cambodia Socio Economic Survey, www.mop.gov.kh, www.nis.gov.kh , www.db.ncdd.gov.kh
Ministry of Planning, RGC, 2008, Cambodia Demographic Census 2008Ministry of Planning, RGC, 2011 Cambodia Economic Census , March 2011ASEAN 2010, ASEAN Community in figures 2010Google Analysis and Reports