Page 1
HAL Id: hal-00580103https://hal.archives-ouvertes.fr/hal-00580103
Submitted on 26 Mar 2011
HAL is a multi-disciplinary open accessarchive for the deposit and dissemination of sci-entific research documents, whether they are pub-lished or not. The documents may come fromteaching and research institutions in France orabroad, or from public or private research centers.
L’archive ouverte pluridisciplinaire HAL, estdestinée au dépôt et à la diffusion de documentsscientifiques de niveau recherche, publiés ou non,émanant des établissements d’enseignement et derecherche français ou étrangers, des laboratoirespublics ou privés.
The threshold value of group similarity in the formationof cellular manufacturing systems
Riccardo Manzini, Filippo Bindi, Arrigo Pareschi
To cite this version:Riccardo Manzini, Filippo Bindi, Arrigo Pareschi. The threshold value of group similarity in theformation of cellular manufacturing systems. International Journal of Production Research, Taylor &Francis, 2010, 48 (10), pp.3029-3060. �10.1080/00207540802644860�. �hal-00580103�
Page 2
For Peer Review O
nly
The threshold value of group similarity in the formation of
cellular manufacturing systems
Journal: International Journal of Production Research
Manuscript ID: TPRS-2008-IJPR-0738
Manuscript Type: Original Manuscript
Date Submitted by the Author:
17-Sep-2008
Complete List of Authors: Manzini, Riccardo; University of Bologna, Dipartimento DIEM (Sezioni Impianti) Bindi, Filippo; Bologna University, Dipartimento DIEM (Sezioni Impianti) Pareschi, Arrigo; Bologna University, Dipartimento DIEM (Sezioni Impianti)
Keywords: CELL FORMATION, CELLULAR MANUFACTURE, CLUSTERING, GROUP TECHNOLOGY
Keywords (user): SIMILARITY COEFFICIENT BASED METHOD (SCM)
http://mc.manuscriptcentral.com/tprs Email: [email protected]
International Journal of Production Research
Page 3
For Peer Review O
nly
The threshold value of group similarity in the formation of cellular manufacturing systems
Riccardo Manzini1, Filippo Bindi and Arrigo Pareschi
Dipartimento di Ingegneria delle Costruzioni Meccaniche, Nucleari, Aeronautiche e di Metallurgia
Bologna University
Viale Risorgimento 2, 40136 Bologna, Italy
1 Corresponding author: [email protected] , +390512093406, fax +390512093411
Page 1 of 36
http://mc.manuscriptcentral.com/tprs Email: [email protected]
International Journal of Production Research
123456789101112131415161718192021222324252627282930313233343536373839404142434445464748495051525354555657585960
Page 4
For Peer Review O
nly
Abstract
Cellular manufacturing is an effective alternative to batch-type production systems where different
products are intermittently produced in small lot sizes with frequent setups, large in-process storage
quantities, long production lead times, decreasing throughputs, and complex planning and control
functions.
An effective approach to forming manufacturing cells and introducing families of similar parts,
consequently increasing production volumes and machine utilization, is the use of similarity
coefficients in conjunction with clustering procedures.
In a similarity coefficients based approach, the results of the clustering analysis depend on the
minimum admissible level of similarity adopted for the generic group of clustered items. This is the
so-called threshold value of group similarity. The aim of this paper is to identify effective values of
the threshold value of group similarity to help practitioners and managers of manufacturing systems
form machine groups and related part families. The proposed threshold values for a given similarity
coefficient are based on calculation of the percentile of aggregations generated by the adopted
clustering algorithm.
The importance of the proposed measure of group similarity has been demonstrated by
experimental analysis conducted on a large set of significant instances of the cell formation problem
in the literature. This analysis can also support the best determination of this percentile-based cut
value especially when the number of manufacturing cells is not known in advance.
Keywords: cell formation (CF) problem; cellular manufacturing (CM); similarity coefficient;
similarity coefficient based method (SCM); clustering algorithm; group technology (GT).
1. Introduction and literature review
Cellular Manufacturing (CM) is an application of the well-known group technology (GT)
production philosophy where disjunctive groups of similar parts are produced in a multi-cellular
manufacturing system. These groups are called part families and the generic part family is
univocally assigned to a single group of machines (the machine cell). Since 1966 when the first
contribution on CM and its topics was published (Yin and Yasuda 2006, Chan et al. 2008), the large
number of advantages presented by CM compared to batch production (generally implemented in
functional layouts) have been widely discussed in the literature e.g. inventory level reduction,
production lead time reduction, reduced set-up times, etc.
In particular, Yin and Yasuda (2006) identify three major critical topics in CM:
Page 2 of 36
http://mc.manuscriptcentral.com/tprs Email: [email protected]
International Journal of Production Research
123456789101112131415161718192021222324252627282930313233343536373839404142434445464748495051525354555657585960
Page 5
For Peer Review O
nly
1. Applicability of CM, i.e. feasibility, which relates to plant layout configurations mainly
composed of product cell layouts, process cell layouts, hybrid layouts (combination of
functional and cellular layouts), and mixture layouts.
2. Implementation of CM. It mainly relates to human, environmental, and organizational
implications.
3. Justification of CM. This compares the system performance in cellular layouts and in
functional layouts.
4. System design in CM. This topic and area of research includes cell formation (CF), cell
layout, and production planning.
CF is the most extensively researched topic in the design of multi-cellular manufacturing systems
and a very large number of contributions in the literature propose models and methods to support
this crucial activity. Of these models, the so-called similarity coefficients based methods (SCM)
have been shown to be effective and also flexible in helping CM design and management activities.
Other CF methods discussed in the literature are: visual inspection, part coding and classification,
machine-part group analysis (also known as product flow analysis - PFA), mathematical
programming, fuzzy clustering, neural networks, metaheuristics, and heuristics in general.
The main aim of CM and GT is to effectively aggregate similar parts (i.e. components) into families
and dissimilar machines (i.e. resources) into cells in a multi-cellular manufacturing system. The
level of effectiveness is measured in terms of global production and logistic cost minimization. This
cost minimization deals with the number of machines (costs for purchasing machines),
manufacturing tools (tooling costs), human resources (labor costs), their level of utilization
(variable cost of using machines, tools, and manpower), their plant location (material handling -
MH costs), the assignment and scheduling of work orders, and other management decisions that are
strongly influenced by the configuration of both clusters of machines and families of parts and
components. Nevertheless, it is very difficult to quantify the performance of a multi cellular
manufacturing system in terms of all these implications, and also in general i.e. for the generic
production system in the generic operating sector. Sometimes the number of manufacturing cells is
not known in advanced, consequently the aim of CM and CF models and methods is the
determination of the number of cells and simultaneously the configuration of parts and machines
groups. The simultaneous parts and machines clustering processes is usually based on the
minimization of intercell movement of parts (Stawowy 2004) which specifically deals with the CF
problem and methods. In other words, the object is to minimize the interactions between
manufacturing cells, where an interaction occurs if a part requires machines belonging to two or
Page 3 of 36
http://mc.manuscriptcentral.com/tprs Email: [email protected]
International Journal of Production Research
123456789101112131415161718192021222324252627282930313233343536373839404142434445464748495051525354555657585960
Page 6
For Peer Review O
nly
more cells. The degree of interaction between manufacturing cells is measured by the number of the
“exceptional elements” as illustrated below in the discussion of the efficiency of the formation.
Several journals have recently published special issues on these topics, demonstrating their
importance in both academic and industrial research. Significant surveys and comprehensive
reviews of CM are presented by Shafer and Rogers (1993), Joines et al. (1996), Selim et al. (1998),
Islam and Sarker (2000), Yin and Yasuda (2005, 2006), and Fraser et al. (2007a, b). In particular,
Yin and Yasuda (2005, 2006) present a recent and comparative investigation into SCM applied to
CM.
Manzini et al. (2004) present, discuss, and apply an original conceptual framework for planning,
design, management, and control of a flexible cellular assembly system (FAS). Similarly, Manzini
et al. (2006) present a supporting decision framework for multi-cellular flexible manufacturing
systems (FMS) applied to the Italian automotive industry. Fraser et al. (2007a) introduced a useful
framework for the implementation of a CM system based on technical issues, human factors, and
organizational implications. Sobhanallahi et al. (2002) proposes a threshold value as a bound for the
number of cells.
Several studies in the literature discuss the CF problem and in particular the so-called Machine-Part
Matrix Clustering (MPMC) problem for identifying potential cells in the design of a CM system.
Most of these studies propose techniques and rules to optimize this design process. The
performances promised and obtained are generally compared with previous results presented in the
literature, but they are often difficult to understand and apply in real world case studies, especially
for practitioners and managers of different production systems in different industrial sectors.
The aim of this paper is to identify effective threshold values of group similarity in order to quickly
identify the best number and configuration of machines cells and part families through the
application of statistical clustering techniques. In particular, these similarity values can be useful to
professionals working in manufacturing systems whose decisions can be rapidly and effectively
supported by statistical tools for machines grouping and formation of part families without
accessing advanced and complicated algorithms proposed in the literature. In fact, statistical
clustering techniques based on similarity indices combined with clustering heuristic rules are very
user-friendly tools because they are supported by commercially available software and they do not
need very high knowledge and skill levels. To support the determination of effective solutions to
the CF problem an experimental analysis conducted on several literature instances is illustrated.
The proposed measure of group similarity can be used in combination with an ad-hoc what if
Page 4 of 36
http://mc.manuscriptcentral.com/tprs Email: [email protected]
International Journal of Production Research
123456789101112131415161718192021222324252627282930313233343536373839404142434445464748495051525354555657585960
Page 7
For Peer Review O
nly
analysis conducted on the CM problem instance that the analyst has to face and solve thanks to the
introduction of several key performance indices (KPI).
The remainder of this article is organized as follows: Section 2 presents the main decisional steps
for CF adopting statistical similarity indices and clustering rules i.e. SCMs. Section 3 presents the
criterion proposed for the selection of a percentile-based threshold similarity group value. Section 4
illustrates an example of the SCM approach and the percentile-based similarity cut value applied to
an instance in the literature in order to demonstrate the importance and the effectiveness of the
threshold similarity value in CF. Section 5 presents the results obtained from experimental analysis
conducted on literature instances to which different percentile-based threshold values of similarity
were applied. Finally, Section 6 discusses conclusions and further research.
2. Decision steps in a statistically-based hierarchical clustering process
This study refers to a clustering process based on the introduction of similarity indices and on the
application of heuristic clustering techniques. The adopted process involves the following main
decision steps for the design and configuration of a multi-cellular manufacturing system:
1. Manufacturing data collection. This deals with the analysis of products and resources of the
production system paying particular attention to the bill of materials (BOM) and work
cycles (i.e. cycle manufacturing routings) for each product in the product mix.
2. Similarity index evaluation. The generic similarity index refers to a generic pair of items in
the group to be partitioned. In other words, it is a measure of similarity between two generic
groups of machines, or possibly a group composed of only one machine (i.e. a group with
only one member). In particular, the similarity value between two items represents the
degree to which they need to belong to the same manufacturing cell.
3. Clustering analysis. This step is based on the application of an algorithm to group the
machines into different disjunctive clusters that represents a partition of the original group
of machines. The process of clustering items (e.g. machines) into homogeneous groups (e.g.
cells) not only depends on the rule adopted but also on the threshold group value of
similarity adopted, which represents the minimal admissible level of similarity within the
members of a generic cell, as discussed in the following sections.
In general, any threshold cut level of similarity identifies a cellular configuration of
machines i.e. a partition of machines into manufacturing cells and parts into different
families. This forms the aim of this study.
Page 5 of 36
http://mc.manuscriptcentral.com/tprs Email: [email protected]
International Journal of Production Research
123456789101112131415161718192021222324252627282930313233343536373839404142434445464748495051525354555657585960
Page 8
For Peer Review O
nly
4. Part family formation, i.e. assignment of parts to the previously identified cells.
5. Plant layout configuration. This step deals with the determination of the location of each
manufacturing resource (machines and human resources) in the production area.
These decision steps belong to a hierarchical process that involves several decisions and whose
results in terms of performance depend on the effectiveness of each step and also on how well
integrated the steps are, whereas the steps have traditionally been treated separately. In other words,
the result of each step depends on the quality of input data whose a fraction is generally produced in
the previous decision step.
For example, how effective the machines clustering task is depends on the quality and significance
of the similarity index adopted, whose values must be evaluated correctly, and which provides the
input data for the clustering algorithm. This algorithm also influences the partition of the machines.
The literature presents several performance indices with which to judge the effectiveness of a
clustering result i.e. a multi-cellular system configuration. The aim of this paper is to compare the
effectiveness of different threshold levels of similarity from the point of view of clustering i.e. after
the grouping of machines/resources and the grouping of parts/components. However, the very
crucial effect of the clustering process in terms of layout is not considered because it is very
difficult to find general results and a set of recommendations suitable for academic research and for
professionals to support their decisions in designing and managing manufacturing system.
Consequently, step 5 is not considered in this study and the problem of grouping parts into families
and machines into cells is studied from the point of view of maximizing the grouping efficacy.
The decision process based on SCM for CM represented in steps 1 to 4 was defined by McAuley in
1972. He illustrated the clustering analysis conducted on a part-machine incidence matrix using
Jaccard’s similarity index combined with the Single Linkage Cluster Method, with the results being
represented using dendograms (McAuley 1972, Daita et al. 1999). Finally, McAuley identified two
performance criteria to measure the effectiveness of the clustering analysis on CF.
Moreover, the idea of proposing an effective selection of the so-called similarity threshold value to
support the clustering analysis was introduced by Seifoddini and Wolfe (1987) with little success,
as demonstrated below. Seifoddini and Wolfe (1987) correctly suggest selecting a threshold value
that minimizes the sum of the intercellular and intracellular MH costs, but they also quantify this
cost and so solve the well known NP-hard plant layout problem i.e. simultaneously identify the best
arrangement of cells and machines. It is certainly the best and most effective suggestion from a
theoretical point of view, but a supporting decision model and method capable of fully satisfying
Page 6 of 36
http://mc.manuscriptcentral.com/tprs Email: [email protected]
International Journal of Production Research
123456789101112131415161718192021222324252627282930313233343536373839404142434445464748495051525354555657585960
Page 9
For Peer Review O
nly
this need is very difficult to identify, and especially so for professionals and managers of very
complicated production systems (based on large numbers of machines, parts, and components).
Moreover, Seifoddini and Wolfe (1987) propose the selection of the best value of similarity by
quantifying the global system travelling distance between cells i.e. for a given plant layout. In other
words, they bypass the plant layout problem by simply measuring a cost function similar to that
adopted by the well-known CRAFT (Computerized Relative Allocation of Facilities Technique)
facility layout solving rule (Armour and Buffa, 1963).
Consequently, while the approach proposed by Seifoddini and Wolfe (1987) is theoretically
effective but not practical, it would be better to adopt a percentile based threshold similarity
coefficient value separating the CF problem from the plant layout problem in agreement with recent
studies of CM in the literature.
The following subsections discuss and illustrate the previously cited decision steps paying
particular attention to the assumptions they are based on.
2.1 Manufacturing data collection
In adopting an SCM, the first result of collecting data from the manufacturing process is the
formation of the machine-part incidence matrix. This matrix indicates whether or not a part needs
or does not need a machine for production. The generic entry aik is defined as follows:
1
0
if part i visits machine k
otherwiseika
=
(1)
where
i=1,..,I part index;
k=1,..,K machine index.,
Several models and methods for CM are presented in the literature, but these need more
manufacturing data on the parts and components of the product mix than the proposed SCM based
approach presented in this paper e.g. production times, production sequences, machines/resources
alternatives, production volumes, etc. The proposed SCM based approach presented here simply
needs the construction of the matrix introduced by (1): this is certainly an important simplification
but is a significant advantage in the critical activity of data collection and computing which is
subject to the decision steps in the following paragraphs.
Page 7 of 36
http://mc.manuscriptcentral.com/tprs Email: [email protected]
International Journal of Production Research
123456789101112131415161718192021222324252627282930313233343536373839404142434445464748495051525354555657585960
Page 10
For Peer Review O
nly
2.2 Similarity index evaluation
A large number of similarity coefficients have been proposed in the literature (Yin and Yasuda
2006). In particular, Yin and Yasuda (2006) present a taxonomy for similarity indices and identify
two distinct main groups of coefficients (problem oriented and general purpose) and list the most
important contributions on CF in the literature since McAuley (1972) first defined the decision
process for CM based on SCM.
The problem oriented group of indices deals with specific coefficients defined for CM, while the
second group incorporates indices used in several disciplines e.g. biology, sociology, economics,
medical science, etc., and available in a large number of commercially available statistical software
packages.
Therefore, the general purpose indices are the subject of the CF problem as approached and
discussed in this paper. In particular, Table 1 lists the similarity indices adopted by the proposed
experimental analysis (Section 6) which supports the identification of effective threshold values of
group similarity within each cluster i.e. cells, obtained using the clustering analysis. The notation
adopted to define the generic index Sij is:
a number of parts visiting both machines;
b number of parts visiting machine i but not j;
c number of parts visiting machine j but not i;
d number of parts visiting neither machine.
This list of similarity indices of the existing coefficients is not exhaustive, but all the same it
represents a significant portion that can be used to evaluate the SCM performance with different
threshold values. The generic and adopted similarity index represents the first free parameter in the
experimental analysis, which is now illustrated.
[Insert about here Table 1]
2.3 Clustering analysis and cell formation
Page 8 of 36
http://mc.manuscriptcentral.com/tprs Email: [email protected]
International Journal of Production Research
123456789101112131415161718192021222324252627282930313233343536373839404142434445464748495051525354555657585960
Page 11
For Peer Review O
nly
The cluster analysis in CM identifies and classifies machines on the basis of the similarity of the
manufacturing characteristics they possess i.e. on the basis of a similarity coefficient (Section 2.2).
The aim of CM has already been briefly introduced in Section 1 and at the beginning of Section 2 in
which the contribution made by Seifoddini and Wolfe (1987) is discussed.
A realistic aim for CF is to minimize within-group (i.e. manufacturing cell) variance and maximize
between-cells variance. The result of a CF and part families assignment is a number of
heterogeneous groups of machines with homogeneous contents. The number of groups of machines
(i.e. cells) can be predefined in advanced or it is one of the output of the CF problem.
There are usually substantial differences between the machine groups, but the individuals within an
individual machine group are similar because they are similarly visited by different
parts/components. The clustering process in statistical based heuristic algorithms is supported by
the following well known hierarchical algorithms (Mosier 1989), which represent the second free
parameter adopted in the proposed experimental analysis (see Section 6): Complete Linkage
Method (CLINK), Single Linkage Method (SLINK), Unweighted Pair-Group Method using
Arithmetic Average (UPGMA), Weighted Pair-Group Method using Arithmetic Average (Average
Linkage), and Unweighted Pair-Group Method using Centroid (UPGMC).
The results of a clustering algorithm can be effectively illustrated by a type of a tree diagram called
a dendogram (Sokal and Sneath 1968, McAuley 1972). An example of a dendogram is reported in
Figure 1.
2.4 Formation of part families
Given a generic solution for cells, a part may have to visit more than one group of machines before
it is completed. Consequently, the generic part has to be assigned to the manufacturing cell with the
minimum number of inter-group journeys. Another way of reducing the number of inter-group
journeys is to duplicate machines, but it can be very expensive in terms of space and monetary
costs.
Part families can be formed concurrently with the cell/group machine formation (CF steps
illustrated above), or otherwise executed after the cells have been defined. In particular, the second
of these hypotheses is adopted in this paper, and in particular a heuristic rule is applied to assign
parts to manufacturing cells. The main steps in this heuristic rule are:
STEP 1. Given a configuration of the disjunctive groups of machines (i.e. manufacturing cells)
Page 9 of 36
http://mc.manuscriptcentral.com/tprs Email: [email protected]
International Journal of Production Research
123456789101112131415161718192021222324252627282930313233343536373839404142434445464748495051525354555657585960
Page 12
For Peer Review O
nly
name them as c=1,..,C. Then quantify the following measurements for each part i and each
manufacturing cell c in accordance with the working cycle of part i:
• number of intra-cell movements: ICMic;
• number of tasks executed in the cell: NTaskic;
• processing time of i in c: Timeic.
STEP 2. Assign part i to cell c* where:
{ }*
*1,..,
max icic c Cc c
ICM ICM=≠
> (2)
If c* does not exist than GO to STEP 3.
STEP 3. Assign part i to cell c’ where:
{ }'1,..,
'
maxic icc C
c c
NTask NTask=≠
> (3)
If c’ does not exist than GO to STEP 4.
STEP 4. Assign part i to cell c’’ where:
{ }''1,..,
''
maxic icc C
c c
Time Time=≠
> (4)
If c’’ does not exist than assign part i randomly to set c=1,..,C.
A result of the assignment of parts to the manufacturing cells is the so-called block-diagonal
incidence matrix shown in Figure 4.
2.5 Clustering performance evaluation
Sarker (2001) presents, discusses, and compares the most notable measurements of grouping
efficiency in CM. The measurements adopted in the following illustrated experimental analysis are
based on the following definitions:
• Block. This is a submatrix of the machine-part matrix composed of rows representing a part
family and columns representing the related machine cell.
• Void. This is a “zero” element appearing in a diagonal block (see Figure 4).
• Exceptional element. This is a “one” appearing in off-diagonal blocks (see Figure 4). The
exceptional element causes intercell movements.
Page 10 of 36
http://mc.manuscriptcentral.com/tprs Email: [email protected]
International Journal of Production Research
123456789101112131415161718192021222324252627282930313233343536373839404142434445464748495051525354555657585960
Page 13
For Peer Review O
nly
The CM measurements of performance quantified in the experimental analysis are now listed and
defined.
Problem Density – PD:
number of "ones" in the incidence matrix
number of elements in the incidence matrix=PD (5)
Global Inside cells density – IDG:
number of "ones" in diagonal blocks
number of elements in diagonal blocks=IDG (6)
Outside density – ODG:
number of "ones" outside the diagonal blocks
number of elements outside the diagonal blocks=ODG (7)
Exceptional elements - EE
EE = Number of exceptional elements within the diagonal-block incidence matrix (8)
Ratio of non-zero elements in cells – REC
total number of "ones"
number of elements in diagonal blocksREC = (9)
Ratio of exceptions – RE
number of "ones" outside diagonal block
total number of "ones" within the matrixRE = (10)
Group Efficacy – τ
0−=
+ v
e eτ
e e (11)
where:
e total number of “ones” in the matrix (i.e. the total number of operations);
e0=EE number of exceptional elements (number of “ones” in the off-diagonal
blocks);
Page 11 of 36
http://mc.manuscriptcentral.com/tprs Email: [email protected]
International Journal of Production Research
123456789101112131415161718192021222324252627282930313233343536373839404142434445464748495051525354555657585960
Page 14
For Peer Review O
nly
ev number of voids (number of “zeros” in the diagonal blocks).
3. Percentile based threshold group similarity value
This study introduces a percentile based similarity value to generate manufacturing cells (i.e.
disjunctive groups of machines) in a multi cellular production system. In particular, for a given
specific combination of a similarity coefficient and a clustering rule, this value does not cut the
dendogram according to a predefined value of similarity but according to a percentile of the number
of aggregations that are generated by the clustering analysis, which can be seen in the dendogram.
The application of this new and simple criterion does not depend on the selection of a similarity
coefficient and the adoption of the clustering rule, but on the number and nature of aggregations
during the clustering process, as represented in the dendogram. Nevertheless, the result of applying
this criterion depends on both the similarity coefficients and the clustering rules selected.
In other words, the combination of a similarity index and a clustering algorithm can produce
aggregations associated with very low values of similarity e.g. nearly zero, otherwise the
aggregations can be related to similarity values close to 1. Consequently, the choice of a threshold
group similarity measurement strongly influences the number and formation of manufacturing cells.
Applying different combinations of indices and algorithms to a given instance of a CF problem, a
common value of “cutting dendogram” (the so-called threshold value) can generate very different
results in terms of CM configuration, and in particular, results are not feasible because they are
based on too many or too few cells. In contrast, the introduction of a percentile-based threshold
value of group similarity bypasses these risks and results in the generation of the expected and
correct number of manufacturing cells as the result of a predefined number of aggregations between
couples of under-construction clusters. An under construction cluster is a group of items potentially
subject to new aggregations by the application of a clustering algorithm.
The basic idea of this criterion can be illustrated by an example. Figure 1 presents a dendogram
generated by the application of clustering analysis. m1,..,m24 are the identifications of machine
items. The number within the diagram (1,..,29) identify the aggregations (called nodes) ordered in
agreement with the similarity measurements. In particular, low numbers identify aggregations
between under construction clusters characterized by a high level of similarity (very similar
Page 12 of 36
http://mc.manuscriptcentral.com/tprs Email: [email protected]
International Journal of Production Research
123456789101112131415161718192021222324252627282930313233343536373839404142434445464748495051525354555657585960
Page 15
For Peer Review O
nly
clusters). Table 2 reports the list and configuration of nodes as generated by the application of the
clustering algorithm.
The percentile based threshold value proposed by the authors is a range of group similarity
measurements which cuts the dendogram at the percentile number of aggregations identified by the
clustering rule, as follows:
{ } { }%_ % , %p p nodes p nodesT value simil N simil N ∈ × ×
(12)
where:
%p percentile of aggregations, expressed as a percentage;
Nnodes number of nodes generated by the cluster algorithm;
{ }simil N similarity value which corresponds to the node N (e.g. see last
column in Table 2).
For example, for the dendogram in Figure 1 (related to Table 2) and a 75° percentile of aggregation
(i.e. %p=0.75), equation (12) is:
{ } { }{ } { } ] [
75_ 0.75 29 , 0.75 29
22 , 21 0.092, 0.098
° ∈ × × =
= =
T value simil simil
simil simil
Similarly, for a percentile value of 25° (i.e. %p=0.25):
{ } { }
{ } { } ] [25_ 0.25 29 , 0.25 29
8 , 7 0.333, 0.333 0.333
° ∈ × × =
= = =
T value simil simil
simil simil
[Insert about here Figure 1]
[Insert about here Table 2]
4. Numerical example
Page 13 of 36
http://mc.manuscriptcentral.com/tprs Email: [email protected]
International Journal of Production Research
123456789101112131415161718192021222324252627282930313233343536373839404142434445464748495051525354555657585960
Page 16
For Peer Review O
nly
This section presents and discusses a numerical example relating to an instance (i.e. occurrence) of
the CF problem introduced by Stanfel (1985). It is a 24x14 matrix (number of parts x number of
machines). In particular, two different parameterizations of the problem are illustrated:
• Parameterization A. This refers to the application of the “Simple Matching” similarity index
and the Centroid clustering rule.
• Parameterization B. This refers to the application of the “Sokal & Sneath 2” similarity index
and the Centroid clustering rule.
Part-machine incidence matrix
Table 3 is the binary part-machine incidence matrix proposed by Stanfel (1985) and forming the
subject of this illustrated example.
[Insert about here Table 3]
Similarity coefficient matrix
Tables 4 and 5 present the similarity coefficient matrices obtained by applying the “Simple
Matching” and “Sokal & Sneath 2” coefficients respectively (the similarity indices are defined in
Table 1).
[Insert about here Table 4]
[Insert about here Table 5]
Clustering rule application and construction of dendograms
The application of Centroid clustering rule to the “Simple Matching” similarity coefficient
generates the dendogram illustrated in Figure 2, while Figure 3 presents the result obtained from the
combination of the Centroid algorithm and the “Sokal & Sneath 2” similarity coefficient.
Page 14 of 36
http://mc.manuscriptcentral.com/tprs Email: [email protected]
International Journal of Production Research
123456789101112131415161718192021222324252627282930313233343536373839404142434445464748495051525354555657585960
Page 17
For Peer Review O
nly
[Insert about here Figure 2]
[Insert about here Figure 3]
Table 6 and 7 present the list of nodes generated by the clustering analysis relating respectively to
the dendograms in Figure 2 and Figure 3.
Threshold similarity value adoption and formation of cells
Assuming the dendograms obtained at the previous steps are cut and assuming a percentile-based
threshold value of 75°, the configuration of the manufacturing cells is as follows.
• System parameterization A - Simple Matching similarity index & Centroid rule:
Cell 1: m4-m5-m6-m7
Cell 2: m8-m9
Cell 3: m1-m2-m3-m10
Cell 4: m11-m12
Cell 5: m13-m14.
• System parameterization B - Sokal and Sneath 2 similarity index & Centroid rule:
Cell 1: m8-m9-m10
Cell 2: m11-m12
Cell 3: m4-m5-m6-m7
Cell 4: m1-m2-m3
Cell 5: m13-m14.
Parts assignment to manufacturing cells
Page 15 of 36
http://mc.manuscriptcentral.com/tprs Email: [email protected]
International Journal of Production Research
123456789101112131415161718192021222324252627282930313233343536373839404142434445464748495051525354555657585960
Page 18
For Peer Review O
nly
The introduction of a set of hypotheses on manufacturing routings (and in particular on sequence of
visited machines) and on processing times is necessary so that the previously introduced heuristic
parts assignment procedure can be applied. Consequently, the following hypotheses have been
introduced:
1. If aik=1: tik =1, i.e. aik=tik . The processing time defined for the generic part which visits
machine k is set to 1.
2. The routing sequence of machines visited by part i is the sequence of machines reported in
the binary incidence matrix, where aik=1.
The assignments of parts to the manufacturing cells obtained are:
• System parameterization A
Part family 1: p3-p4-p21-p24
Part family 2: p1-p2-p17-p19-p20-p23
Part family 3: p6-p7-p8-p18
Part family 4: p5-p9-p10-p11-p12- p14-p15-p16-p22
Part family 5: p13
• System parameterization B.
Part family 1: p1-p2-p17-p19-p20-p23
Part family 2: p5-p9-p10-p11-p12-p14-p15-p16-p22
Part family 3: p3-p4-p21-p24
Part family 4: p6-p7-p8-p18
Part family 5: p13.
In particular, Figure 4 presents the block-diagonal incidence matrix associated with the
“parameterization A” system/problem and to a threshold group similarity value of 75°, while Figure
5 refers to the “parameterization B”.
[Insert about here Figure 4]
Page 16 of 36
http://mc.manuscriptcentral.com/tprs Email: [email protected]
International Journal of Production Research
123456789101112131415161718192021222324252627282930313233343536373839404142434445464748495051525354555657585960
Page 19
For Peer Review O
nly
[Insert about here Figure 5]
Performance evaluation
The results obtained for the two system/problem parameterizations using the clustering analysis and
parts assignment, in accordance with the previously introduced performance measurements, are
reported in Table 8.
[Insert about here Table 8]
5. Experimental analysis
In order to identify values of similarity capable of effectively supporting the clustering activity in
CM when using the previously discussed and illustrated hierarchical decision process, an
experimental analysis needs to be carried out on different similarity indices (FACTOR 1, i.e. free
parameter/degree of freedom n°1) combined with different clustering rules (FACTOR 2, i.e. free
parameter n°2) and combined with different threshold levels of similarity (FACTOR 3, i.e. free
parameter n°3).
The experimental analysis has been conducted on 22 literature instances which have been selected
from several literature studies (see Table 9 for citations and references). Selected instances refer to
binary incidence matrices of different dimensions (i.e. number of elements), different numbers of
columns and rows, and different values of “problem density – PD”. In order to characterize each
matrix correctly, the set of instances has been classified as follows:
1. Incidence matrix dimension, i.e. the number of available cells (“Matrix dim.” in Table 9).
Four different levels have been introduced:
S, if Matrix dim.<100 ;
M, if 100 Matrix dim.<500≤
L, if 500 Matrix dim.<1000≤
XL, if 1000 Matrix dim.≤
2. PD value. Three different levels have been introduced:
Lo, if 0.2PD value<
Page 17 of 36
http://mc.manuscriptcentral.com/tprs Email: [email protected]
International Journal of Production Research
123456789101112131415161718192021222324252627282930313233343536373839404142434445464748495051525354555657585960
Page 20
For Peer Review O
nly
M, if 0.40.2 PD value<≤
H, if 0.4 PD value≤
[Insert about here Table 9]
Consequently, the following results refer to significant case studies i.e. examples previously
discussed in the literature, and are useful in comparing the performance of different clustering
problem parameterizations. They identify good levels of threshold group similarity (FACTOR 3)
that can be used to support a generic and reliable multi-cellular system configuration. Three
different percentile values were considered: 25° (i.e. 0.25), 40° (i.e. 0.4) and 75° (i.e. 0.75).
The rule adopted for part assignment is the heuristic illustrated in Section 2.4. This is only one of a
large number of rules for the part assignment available in the literature. Nevertheless, this study
deals with the determination of an effective threshold cut level of similarity for cell determination
(i.e. machines grouping): as a consequence the authors choose not to introduce another free
parameter (FACTOR) dealing with parts grouping into the decision problem.
The instances from the literature in Table 9 are binary incidence matrices that do not represent
production data related to machine sequences and processing times, which are very useful in
“product oriented” SCMs not studied in this paper. Consequently, the same hypotheses illustrated in
the previously discussed numerical example (Section 4) have been adopted and related
performances for each combination of system factors and for each instance have been evaluated.
The set of results evaluated and compared is composed of 3300 problem configurations (22
incidence matrices, 10 similarity indices, 5 clustering algorithms, and 3 percentile based threshold
group similarity values).
Tables 10 and 11 present the number of cells (CELLs) and the EE values obtained in the scenarios
simulated and grouped for different threshold values. In particular, the statistics collected and
compared are the mean values and the cumulated values (sum statistics) of the performance. In
agreement with the definition introduced in equation (10), the RE values are similar to the EE
values.
When all 3300 simulated scenarios are considered, the cumulative number of cells (CELLs) passes
from 16315 (%p = 0.25, i.e. the 25° percentile) to 13319 (%p = 0.40, i.e. the 40° percentile) and to
Page 18 of 36
http://mc.manuscriptcentral.com/tprs Email: [email protected]
International Journal of Production Research
123456789101112131415161718192021222324252627282930313233343536373839404142434445464748495051525354555657585960
Page 21
For Peer Review O
nly
6402 (%p = 0.75, i.e. the 75° percentile). The corresponding mean values are: 14.84, 12.11, and
5.82.
Similarly the cumulated number of EE passes from 62040 (%p = 0.25) to 53350 (%p = 0.40) to
33066 (%p = 0.75). Corresponding mean values are: 56.40, 48.50, and 30.06. Passing from
%p=0.25 to %p=0.75 means the number of exceptional elements is reduced by 46.7%.
Table 12 summarizes mean and cumulative values obtained for the performance evaluated by
assuming different values of percentile-based threshold cut values. In particular, the generic value is
compared with the performance obtained for %p=0.25 (see Table 12): in passing from %p=0.25 to
%p=0.75, two new performance measures, ODG and RE, need to be minimized and are subject to a
reduction of 45.4% and 50.8% respectively.
[Insert about here Table 10, Table 11 and 12]
Figures 6 to 10 present the main effects plots and the interaction plots for the previously cited and
defined performance (Section 2): EE, IDG, ODG, RE, and τ. The behavior of IDG differs from
ODG and EE, which are minimized by %p=0.75: IDG mean value is maximized for %p=0.40. EE
and RE performance perform better in short matrix (i.e. “S”) and “Lo” incidence matrix, ODG and
IDG in large (“XL”) and “H” instances. These figures demonstrate also that the main effects of the
clustering algorithm (ALGO) adopted and the similarity coefficient (COEFF) are not very
important. Figure 11 illustrates the trend of EE, RE, IDG, and ODG assuming different values of
the threshold percentile-based cut similarity value (Percentile [%]) combined with the 22 examples
from the literature subject to the analysis.
[Insert about here Figure 6, 7, 8, 9, 10 and 11]
Finally, Figures 12 and 13 present some illustrative results obtained using a 2k factorial analysis.
They demonstrate that the problem density (factor “E”, PD label), the part-machine incidence
matrix (i.e. the example) dimension (factor “D”, dim. Label) and the percentile-based threshold
value (factor “A”, %) are the most significant factors affecting the performance ODG, IDG (see the
Pareto chart of the standardized effects in Figure 12), and EE (see the Normal plot of the
Page 19 of 36
http://mc.manuscriptcentral.com/tprs Email: [email protected]
International Journal of Production Research
123456789101112131415161718192021222324252627282930313233343536373839404142434445464748495051525354555657585960
Page 22
For Peer Review O
nly
standardized effects in Figure 13). These results are also valid for different 2k factorial campaigns
of analysis and take all the performance evaluation introduced in Section 2 into consideration.
6. Conclusion and further research
As demonstrated by the large number of studies in the literature, the design and management of a
cellular manufacturing system is a very critical and time-consuming issue. In particular, several
industrial companies whose success is significantly based on flexibility are forced to confront the
cell formation problem and the optimization of their multi-cellular production systems.
Among the numerous supporting decisions models and methods, those based on similarity (in
particular “general purpose”) and clustering analysis are very popular thanks to the widespread
diffusion of commercially available statistical software and its flexibility and user friendliness to
manufacturing system professionals and managers.
This study demonstrates how important identifying an effective similarity value for the group of
machines is. This is named the threshold cut similarity level. So the authors have introduced a
percentile-based cut similarity measurement and illustrate the main results obtained using an
experimental statistical analysis conducted on a set of examples from the literature, such as part
machine binary incidence matrix. The significance of the proposed cut threshold measurement
clearly emerges.
The proposed method, the use of the percentile-based similarity threshold and the results obtained
by the experimental analysis can be applied both to instances and applications where the number of
cells is predefined in advanced and where this number is not known and is a free parameter of the
decision process.
By the result obtained with the experimental analysis the similarity value which corresponds to the
75° percentile of the number of aggregations identified by the clustering analysis is the best
performing value because it reduces the number of exceptional elements which are the main causes
of intercellular movements and duplication of manufacturing resources. Nevertheless this result is
not general but can represent an effective best practice in the design of a multi cellular
manufacturing system. In conclusion, the proposed approach based on the group similarity
evaluation and control is very effective and so useful to professionls in manufacturing and assembly
systems.
Page 20 of 36
http://mc.manuscriptcentral.com/tprs Email: [email protected]
International Journal of Production Research
123456789101112131415161718192021222324252627282930313233343536373839404142434445464748495051525354555657585960
Page 23
For Peer Review O
nly
Further research should focus on the analysis of problem oriented similarity and clustering analysis,
on the development of automated supporting tools for industrial applications, and on the analysis of
industrial case studies.
7. References
Armour, G.C., and Buffa, E.S., 1963, A heuristic algorithm and simulation approach to relative location of
facilities, Management Science, 9(1), 294-309.
Boctor, F.F, 1991, A linear formulation of the machine-part cell formation problems. International Journal of
Production Research, 29(2), 343–56.
Boe W.J. and Cheng C.H., 1991, A close neighbour algorithm for designing cellular manufacturing systems.
International Journal of Production Research, 29(10), 2097–116.
Carrie, A.S., 1973, Numerical taxonomy appliedto group technology and plant layout. International Journal
of Production Research, 11(4), 399–416.
Chan, F.T.S., Lau, K.W., Chan, L.Y. and Lo, V.H., 2008, Cell formation problem with consideration of both
intracellulart and intercellular movements. International Journal of Production Research, 46(10), 2589-2620.
Chandrasekharan, M.P and Rajagopalan R., 1986a, An ideal seed non-hieraechical clustering algorithm for
cellular manufacturing. International Journal of Production Research, 24(2):451-64.
Chandrasekharan, M.P and Rajagopalan R., 1986b, MODROC: An extension of rank order clustering for
group technology. International Journal of Production Research, 24(5), 1221–33.
Chandrasekharan, M.P, Rajagopalan, R., 1989, Groupability: an analysis of the properties of binary data for
group technology. International Journal of Production Research, 27(6), 1035–52.
Daita, S.T.S., Irani, S.A. and Kotamraju, S., 1999, Algorithms for production flow analysis. International
Journal of Production research, Vol.37, No.11, 2609-2638.
Fraser, K., Harris, H. and Luong, L., 2007a, Improving the implementation effectiveness of cellular
manufacturing: a comprehensive framework for practitioners. International Journal of Production research,
Vol. 45 (24), 5835-5856.
Fraser, K., Harris, H., Luong, L., 2007b, Team-based cellular manufacturing: A review and survey to
identify important social factors. Journal of Manufacturing Technology Management, V 18(6), 714-730.
Islam, K.S. and Sarker, B.R., 2000, A similarity coefficient measure and machine-parts grouping in cellular
manufacturing systems. International Journal of Production Research, Vol. 38 (3), 699-720.
Joines, J.A., King, R.E., Culbreth, C.T., 1996, A comprehensive review of production-oriented
manufacturing cell formation techniques. International Journal of Flexible Automation and Integrated
manufacturing. Vol. 3 (3&4), 161-200.
King J.R., 1980, Machine-component grouping in production flow analysis: an approach using a rank order
clustering algorithm. International Journal of Production Research, 18(2), 213–32.
King, J.R., Nakornchai V., 1982, Machine-component group formation in group technology: review and
extension. International Journal of Production Research, 20(2), 117-133.
Kusiak, A and Chow, W.S, 1987, Efficient solving of the group technology problem. Journal of
Manufacturing Systems, 6(2), 117–24.
Page 21 of 36
http://mc.manuscriptcentral.com/tprs Email: [email protected]
International Journal of Production Research
123456789101112131415161718192021222324252627282930313233343536373839404142434445464748495051525354555657585960
Page 24
For Peer Review O
nly
Kumar K.R., Kusiak A. and Vannelli A., 1986, Grouping of parts and components in flexible manufacturing
systems. European Journal of Operational Research, 24(3), 387–97.
Kumar R. and Vannelli A., 1987, Strategic subcontracting for efficient disaggregated manufacturing.
International Journal of Production Research, 25(12), 1715–28.
Lee M. K., Luong, H.S. and Abhary, K., 1997, Genetic algorithm based cell design considering alternative
routing. Computer Integrated Manufacturing Systems, v 10, n 2, May, 1997, p 93-107
Manzini, R., Gamberi, M., Regattieri, A., Persona, A., 2004, Framework for designing a flexible cellular
assembly system. International Journal of Production Research, Vol. 42(17), 3505-3528.
Manzini, R., Persona, A., Regattieri, A., 2006, Framework for designing and controlling a multicellular
flexible manufacturing system. International Journal of Services and Operations Management, Vol. 2 (1), 1-
21.
McAuley, J., 1972, Machine grouping for efficient production. The Production Engineer, Vol.51, 53-57.
Mosier, C. and Taube, L., 1985, The facets of group technology and their impacts on implementations—a
state-of-the-art survey. OMEGA: The International Journal of Management Science, 13(6), 381–91.
Mosier, C.T., 1989, An experiment investigating the application of clustering procedures and similarity
coefficients to the GT machine cell formation problem. International Journal of Production Research, Vol. 27
(10), 1811-1835.
Sarker, B.R., 2001, Measures of grouping efficiency in cellular manufacturing systems. European Journal of
Operational Research, Vol. 130, 588-611.
Selim, H.M., Askin, R.G., Vakharia A.J., 1998, Cell formation in group technology: review, evaluation and
direction for future research. Computers and Industrial Engineering. 34(1), 3-20.
Shafer, S.M., Rogers, D.F., 1993, Similarity and distance measures for cellular manufacturing. Part I. A
survey. International Journal of Production Research, Vol.31 (5), 1133-1142.
Seifoddini, H. and Wolfe P.M., 1987, Selection of a threshold value based on material handling cost in
machine-component grouping. IIE Transactions, Vol.19(3), 266-270.
Seifoddini, H., 1989, Single linkage versus average linkage clustering in machine cells formation
application. Computers and Industrial Engineering, 16(3), 419–26.
Seifoddini, H., Tjahjana B. ,1999, Part-family formation for cellular manufacturing: A case study at
Harnischfeger. International Journal of Production Research , 37(14):3263-3273.
Sobhanallahi, M.A., Jahanshahloo, G.R., Amin, G.R., Shayan, E., 2002, Threshold value for the number of
cells in group technology. Computers & Industrial Engineering, 42, 231-236.
Sokal, R.R. and Sneath, P.H.A., 1968, Principle of Numerical Taxonomy. W.H.Freeman. San Francisco, CA.
Srinivasan G., Narendran T., Mahadevan B., 1990, An assignment model for the part families problem in
group technology. International Journal of Production Research, 28(1), 145–52.
Stanfel, L.E., 1985, Machine clustering for economic production. Engineering Costs and Production
Economics, Vol. 9, 73-81.
Stawowy, A., 2004, Evolutionary strategy for manufacturing cell design. Omega. The International Journal
of Management Science, 34, 1-18.
Waghodekar, P.H and Sahu, S., 1984, Machine-component cell formation in group technology: MACE.
International Journal of Production Research, 22(6), 937–48.
Page 22 of 36
http://mc.manuscriptcentral.com/tprs Email: [email protected]
International Journal of Production Research
123456789101112131415161718192021222324252627282930313233343536373839404142434445464748495051525354555657585960
Page 25
For Peer Review O
nly
Yin, Y. and Yasuda, K., 2005, Similarity coefficient methods applied to the cell formation problem: a
comparative investigation. Computers and Industrial engineering, 48, 471-489.
Yin, Y. and Yasuda, K., 2006, Similarity coefficient methods applied to cell formation problem: A taxonomy
and review. International Journal of Production Economics, 101, 329-352.
Page 23 of 36
http://mc.manuscriptcentral.com/tprs Email: [email protected]
International Journal of Production Research
123456789101112131415161718192021222324252627282930313233343536373839404142434445464748495051525354555657585960
Page 26
For Peer Review O
nly
Figure 1. Clustering analysis. Dendogram and nodes (1,..,29)
Centroid & Simple Matching
Simple Matching Coefficient
m1
m2
m3
m10
m8
m9
m4
m5
m6
m7
m11
m12
m13
m14
-0,2 0 0,2 0,4 0,6 0,8 1
Figure 2. Dendogram of the Centroid rule and Simple Matching similarity coefficient
Page 24 of 36
http://mc.manuscriptcentral.com/tprs Email: [email protected]
International Journal of Production Research
123456789101112131415161718192021222324252627282930313233343536373839404142434445464748495051525354555657585960
Page 27
For Peer Review O
nly
Centroid
m1
m3
m2
m11
m12
m13
m14
m4
m5
m7
m6
m8
m9
m10
-0,5 -0,25 0 0,25 0,5 0,75 1
Figure 3. Dendogram of the Centroid rule and Sokal & Sneath 2 similarity coefficient
p3 p4 p21 p24 p1 p2 p17 p19 p20 p23 p6 p7 p8 p18 p5 p9 p10 p11 p12 p14 p15 p16 p22 p13
Cell 1
m4 1 1 1 0 0 0 0 0 0 0 0 0 0 0 0 0 0 0 0 0 0 0 0 0
m5 1 1 0 0 0 0 0 0 0 0 0 0 0 0 0 0 0 0 0 0 0 0 0 0
m6 1 0 1 1 0 0 0 0 0 0 0 0 0 0 0 0 0 0 0 0 0 0 0 0
m7 1 1 0 1 0 0 0 0 0 0 0 0 0 0 0 0 0 0 0 0 0 0 0 0
Cell 2
m8 0 0 0 0 1 1 1 1 1 1 0 0 0 0 0 0 0 0 0 0 0 0 0 0
m9 0 0 0 0 1 1 1 0 1 1 0 0 0 0 0 0 0 0 0 0 0 0 0 0
Cell 3
m1 0 0 0 0 0 0 0 0 0 0 1 1 0 0 0 0 0 0 0 0 0 0 0 0
m2 0 0 0 0 0 0 0 0 0 0 0 1 1 0 0 0 0 0 0 0 0 0 0 0
m3 0 0 0 0 0 0 0 0 0 1 0 1 1 1 0 0 0 0 0 0 0 0 0 0
m10 0 0 0 0 1 1 1 0 1 0 0 1 0 0 0 0 0 0 0 0 0 0 0 0
Cell 4
m11 0 0 0 0 0 0 0 0 0 0 0 0 0 0 0 1 1 1 1 1 1 1 1 0
m12 0 0 0 0 0 0 0 0 0 0 0 0 0 0 1 1 1 0 1 1 1 1 1 0
Cell 5
m13 0 0 0 0 0 0 0 0 0 0 1 0 0 0 1 1 0 0 1 0 1 0 0 1
m14 0 0 0 0 0 0 0 0 0 0 0 0 0 0 0 1 0 1 0 0 1 0 0 1
Figure 4. Block-diagonal matrix. System parameterization A and similarity threshold value 75°
p1 p2 p17 p19 p20 p23 p5 p9 p10 p11 p12 p14 p15 p16 p22 p3 p4 p21 p24 p6 p7 p8 p18 p13
Cell 1
m8 1 1 1 1 1 1 0 0 0 0 0 0 0 0 0 0 0 0 0 0 0 0 0 0
m9 1 1 1 0 1 1 0 0 0 0 0 0 0 0 0 0 0 0 0 0 0 0 0 0
m10 1 1 1 0 1 0 0 0 0 0 0 0 0 0 0 0 0 0 0 0 1 0 0 0
Cell 2
m11 0 0 0 0 0 0 0 1 1 1 1 1 1 1 1 0 0 0 0 0 0 0 0 0
m12 0 0 0 0 0 0 1 1 1 0 1 1 1 1 1 0 0 0 0 0 0 0 0 0
Cell 3
m4 0 0 0 0 0 0 0 0 0 0 0 0 0 0 0 1 1 1 0 0 0 0 0 0
m5 0 0 0 0 0 0 0 0 0 0 0 0 0 0 0 1 1 0 0 0 0 0 0 0
m6 0 0 0 0 0 0 0 0 0 0 0 0 0 0 0 1 0 1 1 0 0 0 0 0
m7 0 0 0 0 0 0 0 0 0 0 0 0 0 0 0 1 1 0 1 0 0 0 0 0
Cell 4
m1 0 0 0 0 0 0 0 0 0 0 0 0 0 0 0 0 0 0 0 1 1 0 0 0
m2 0 0 0 0 0 0 0 0 0 0 0 0 0 0 0 0 0 0 0 0 1 1 0 0
m3 0 0 0 0 0 1 0 0 0 0 0 0 0 0 0 0 0 0 0 0 1 1 1 0
Cell 5
m13 0 0 0 0 0 0 1 1 0 0 1 0 1 0 0 0 0 0 0 1 0 0 0 1
m14 0 0 0 0 0 0 0 1 0 1 0 0 1 0 0 0 0 0 0 0 0 0 0 1
Figure 5. Block-diagonal matrix. System parameterization B and similarity threshold value 75°
Page 25 of 36
http://mc.manuscriptcentral.com/tprs Email: [email protected]
International Journal of Production Research
123456789101112131415161718192021222324252627282930313233343536373839404142434445464748495051525354555657585960
Page 28
For Peer Review Only
Figure 6. Main effects plot and Interaction plots for EE.
Figure 7. Main effects plot and Interaction plots for IDG.
754025
60
40
20
WPG
MA
UPG
MA
SLINK
CLINK
CEN
SOSK
2SKSIRPOJHB
XLSML
60
40
20
MLoH
%
Me
an
ALGO COEFF
dim. Label PD label
Main Effects Plot for EEData Means
60
45
30
SO
SK2SKS IRPOJHB
WPG
MA
UPGM
A
SLI
NK
CLINK
CEN
60
45
30
754025
60
45
30
%
A LGO
COEFF
25
40
75
%
CEN
CLINK
SLINK
UPGMA
WPGMA
ALGO
SO
B
H
J
O
P
R
SI
SK
SK2
COEFF
Interaction Plot for EEData Means
754025
0,70
0,65
0,60
0,55
0,50
WPG
MA
UPG
MA
SLIN
K
CLI
NK
CEN
SOSK
2SKSIRPOJHB
XLSML
0,70
0,65
0,60
0,55
0,50
MLoH
%
Me
an
ALGO COEFF
dim. Label PD label
Main Effects Plot for IDGData Means
0,64
0,56
0,48
S OSK
2SKS
IRPOJHB
WPG
MA
UPGM
A
SLIN
K
C LINK
CEN
0,64
0,56
0,48
754025
0,64
0,56
0,48
%
A LGO
COEFF
25
40
75
%
CEN
CLINK
SLINK
UPGMA
WPGMA
ALGO
SO
B
H
J
O
P
R
SI
SK
SK2
COEFF
Interaction Plot for IDGData Means
Page 26 of 36
http://mc.manuscriptcentral.com/tprs Email: [email protected]
International Journal of Production Research
123456789101112131415161718192021222324252627282930313233343536373839404142434445464748495051525354555657585960
Page 29
For Peer Review Only
Figure 8. Main effects plot and Interaction plots for ODG.
Figure 9. Main effects plot and Interaction plots for RE.
754025
0,35
0,30
0,25
0,20
0,15
WPG
MA
UPG
MA
SLIN
K
CLI
NK
CEN
SOSK
2SKSIRPOJHB
XLSML
0,35
0,30
0,25
0,20
0,15
MLoH
%
Me
an
ALGO COEFF
dim. Label PD label
Main Effects Plot for ODGData Means
0,3
0,2
0,1
SOSK2
SKSIRPOJHB
WP G
MA
UPGM
A
SLIN
K
C LINK
C EN
0,3
0,2
0,1
754025
0,3
0,2
0,1
%
A LGO
COEFF
25
40
75
%
CEN
CLINK
SLINK
UPGMA
WPGMA
ALGO
SO
B
H
J
O
P
R
SI
SK
SK2
COEFF
Interaction Plot for ODGData Means
754025
0,6
0,5
0,4
0,3
WPG
MA
UPG
MA
SLIN
K
CLINK
CEN
SOSK
2SKS IRPOJHB
XLSML
0,6
0,5
0,4
0,3
MLoH
%
Me
an
ALGO COEFF
dim. Label PD label
Main Effects Plot for REData Means
0,6
0,4
0,2
SOSK2
SKSIRPOJHB
WP G
MA
UPGM
A
SLIN
K
C LINK
CEN
0,6
0,4
0,2
754025
0,6
0,4
0,2
%
A LGO
COEFF
25
40
75
%
CEN
CLINK
SLINK
UPGMA
WPGMA
ALGO
SO
B
H
J
O
P
R
SI
SK
SK2
COEFF
Interaction Plot for REData Means
Page 27 of 36
http://mc.manuscriptcentral.com/tprs Email: [email protected]
International Journal of Production Research
123456789101112131415161718192021222324252627282930313233343536373839404142434445464748495051525354555657585960
Page 30
For Peer Review Only
Figure 10. Main effects plot and Interaction plots for τ.
754025
0,90
0,85
0,80
0,75
WPG
MA
UPG
MA
SLIN
K
CLI
NK
CEN
SOSK
2SKSIRPOJHB
XLSML
0,90
0,85
0,80
0,75
MLoH
%
Me
an
ALGO COEFF
dim. Label PD label
Main Effects Plot for τData Means
0,88
0,84
0,80
S OSK
2SKS
IRPOJHB
WPG
MA
UPGM
A
SLIN
K
C LINK
C EN
0,88
0,84
0,80
754025
0,88
0,84
0,80
%
A LGO
COEFF
25
40
75
%
CEN
CLINK
SLINK
UPGMA
WPGMA
ALGO
SO
B
H
J
O
P
R
SI
SK
SK2
COEFF
Interaction Plot for τData Means
Page 28 of 36
http://mc.manuscriptcentral.com/tprs Email: [email protected]
International Journal of Production Research
123456789101112131415161718192021222324252627282930313233343536373839404142434445464748495051525354555657585960
Page 31
For Peer Review Only
Figure 11. Main effects plot and Interaction plots for ODG.
22212019181716151413121110987654321
100
75
50
25
0
754025
100
75
50
25
0
Percentile [%]
Literature Instance
25
40
75
%
10
11
12
13
14
15
16
17
18
19
1
20
21
22
23
4
5
6
7
8
9
N°
Interaction Plot for EEData Means
22212019181716151413121110987654321
0,8
0,6
0,4
0,2
0,0
754025
0,8
0,6
0,4
0,2
0,0
Percentile [%]
Literature Instance
25
40
75
%
10
11
12
13
14
15
16
17
18
19
1
2021
22
2
3
4
5
6
7
8
9
N°
Interaction Plot for REData Means
22212019181716151413121110987654321
1,0
0,8
0,6
0,4
0,2
754025
1,0
0,8
0,6
0,4
0,2
Percentile [%]
Literature Instance
25
40
75
%
10
11
12
13
14
15
16
17
18
19
1
20
21
22
23
4
5
6
7
8
9
N°
Interaction Plot for IDGData Means
22212019181716151413121110987654321
0,60
0,45
0,30
0,15
0,00
754025
0,60
0,45
0,30
0,15
0,00
Percentile [%]
Literature Instance
25
40
75
%
10
11
12
13
14
15
1617
18
19
1
20
21
22
2
3
4
5
6
7
8
9
N°
Interaction Plot for ODGData Means
Page 29 of 36
http://mc.manuscriptcentral.com/tprs Email: [email protected]
International Journal of Production Research
123456789101112131415161718192021222324252627282930313233343536373839404142434445464748495051525354555657585960
Page 32
For Peer Review Only
Figure 12. 2k factorial analysis, IDG and ODG - Pareto chart.
151050-5
99
95
90
80
70
60
50
40
30
20
10
5
1
Standardized Effect
Pe
rce
nt
A %
B A LGO
C C O EFF
D dim. Label
E PD label
F actor Name
Not Significant
Significant
Effect Type
AD
E
D
A
Normal Plot of the Standardized Effects(response is EE, Alpha = ,05)
Figure 13. 2k factorial analysis, EE normal plot.
ACC
ABCBCBE
ABEBCEACE
CEABCEBCD
ABCDACD
CDAE
EAB
BBD
ABDAD
DA
2,01,51,00,50,0
Te
rm
Standardized Effect
2,120
A %
B A LGO
C C O EFF
D dim. Label
E PD label
F actor Name
Pareto Chart of the Standardized Effects(response is IDG, Alpha = ,05)
ACAEBC
ABEC
ABCBE
BCEACE
ABCECE
ABCDBCDCD
ACDADAB
ABDBD
BDAE
43210
Te
rm
Standardized Effect
2,120
A %
B A LGO
C C O EFF
D dim. Label
E PD label
F actor Name
Pareto Chart of the Standardized Effects(response is ODG, Alpha = ,05)
Page 30 of 36
http://mc.manuscriptcentral.com/tprs Email: [email protected]
International Journal of Production Research
123456789101112131415161718192021222324252627282930313233343536373839404142434445464748495051525354555657585960
Page 33
For Peer Review O
nly
Code Coefficient Range Sij
J Jaccard 0–1 a/(a+b+c)
H Hamann -1 to 1 [(a+d)-(b+c)]/[(a+d)+(b+c)]
SI Simple matching 0–1 (a+d)/(a+b+c+d)
SO Sorenson 0–1 2a/(2a+b+c)
R Rogers and Tanimoto 0–1 (a+d)/[a+2(b+c)+d]
SK Sokal and Sneath 0–1 2(a+d)/[2(a+d)+b+c]
B Baroni-Urbani and Buser 0–1 [a+(ad)1/2]/[a+b+c+(ad)1/2]
O Ochiai 0–1 a/[(a+b)(a+c)1/2]
P PSC 0–1 a2/[(b+a)(c+a)]
SK2 Sokal and Sneath 2 0–1 a/[a+2(b+c)]
Table 1. Statistical-based similarity coefficient
Node Group 1 Group 2 Simil.Objects in
group
1 m26 m27 0,6 2
2 m19 m24 0,571 2
3 m25 Node 1 0,5 3
4 m5 m29 0,429 2
5 m16 m21 0,429 2
6 m7 m28 0,375 2
7 m9 m23 0,333 2
8 m13 m20 0,333 2
9 m4 m14 0,3 2
10 m8 m30 0,286 2
11 m2 m6 0,25 2
12 m17 m18 0,214 2
13 m1 Node 9 0,211 3
14 m3 m12 0,2 2
15 m11 Node 8 0,2 3
16 Node 12 m22 0,191 3
17 m10 Node 3 0,19 4
18 m15 Node 5 0,188 3
19 Node 10 Node 7 0,175 4
20 Node 11 Node 4 0,146 4
21 Node 16 Node 2 0,098 5
22 Node 13 Node 14 0,092 5
23 Node 19 Node 15 0,08 7
24 Node 22 Node 17 0,068 9
25 Node 24 Node 23 0,054 16
26 Node 20 Node 18 0,052 7
27 Node 6 Node 21 0,04 7
28 Node 25 Node 26 0,03 23
29 Node 28 Node 27 0,024 30
Table 2. List and configuration of nodes generated by the clustering analysis
Page 31 of 36
http://mc.manuscriptcentral.com/tprs Email: [email protected]
International Journal of Production Research
123456789101112131415161718192021222324252627282930313233343536373839404142434445464748495051525354555657585960
Page 34
For Peer Review O
nly
m1 m2 m3 m4 m5 m6 m7 m8 m9 m10 m11 m12 m13 m14
p1 0 0 0 0 0 0 0 1 1 1 0 0 0 0
p2 0 0 0 0 0 0 0 1 1 1 0 0 0 0
p3 0 0 0 1 1 1 1 0 0 0 0 0 0 0
p4 0 0 0 1 1 0 1 0 0 0 0 0 0 0
p5 0 0 0 0 0 0 0 0 0 0 0 1 1 0
p6 1 0 1 0 0 0 0 0 0 0 0 0 0 0
p7 1 1 1 0 0 0 0 0 0 1 0 0 0 0
p8 0 1 1 0 0 0 0 0 0 0 0 0 0 0
p9 0 0 0 0 0 0 0 0 0 0 1 1 1 1
p10 0 0 0 0 0 0 0 0 0 0 1 1 0 0
p11 0 0 0 0 0 0 0 0 0 0 1 0 0 1
p12 0 0 0 0 0 0 0 0 0 0 1 1 1 0
p13 0 0 0 0 0 0 0 0 0 0 0 0 1 1
p14 0 0 0 0 0 0 0 0 0 0 1 1 0 0
p15 0 0 0 0 0 0 0 0 0 0 1 1 1 1
p16 0 0 0 0 0 0 0 0 0 0 1 1 0 0
p17 0 0 0 0 0 0 0 1 1 1 0 0 0 0
p18 0 0 1 0 0 0 0 0 0 0 0 0 0 0
p19 0 0 0 0 0 0 0 1 0 0 0 0 0 0
p20 0 0 0 0 0 0 0 1 1 1 0 0 0 0
p21 0 0 0 0 1 0 1 0 0 0 0 0 0 0
p22 0 0 0 0 0 0 0 0 0 0 1 1 0 0
p23 0 0 1 0 0 0 0 1 1 0 0 0 0 0
p24 0 0 0 0 0 1 1 0 0 0 0 0 0 0
Table 3. 24x14 part-machine incidence matrix, Stanfel (1985)
Page 32 of 36
http://mc.manuscriptcentral.com/tprs Email: [email protected]
International Journal of Production Research
123456789101112131415161718192021222324252627282930313233343536373839404142434445464748495051525354555657585960
Page 35
For Peer Review O
nly
m1 m2 m3 m4 m5 m6 m7 m8 m9 m10 m11 m12 m13 m14
1
0.9167 1
0.875 0.875 1
0.8333 0.8333 0.7083 1
0.7917 0.7917 0.6667 0.9583 1
0.8333 0.8333 0.7083 0.9167 0.875 1
0.75 0.75 0.625 0.9167 0.9583 0.9167 1
0.6667 0.6667 0.625 0.6667 0.625 0.6667 0.5833 1
0.7083 0.7083 0.6667 0.7083 0.6667 0.7083 0.625 0.9583 1
0.7917 0.7917 0.6667 0.7083 0.6667 0.7083 0.625 0.875 0.9167 1
0.5833 0.5833 0.4583 0.5833 0.5417 0.5833 0.5 0.4167 0.4583 0.4583 1
0.5833 0.5833 0.4583 0.5833 0.5417 0.5833 0.5 0.4167 0.4583 0.4583 0.9167 1
0.7083 0.7083 0.5833 0.7083 0.6667 0.7083 0.625 0.5417 0.5833 0.5833 0.7083 0.7917 1
0.75 0.75 0.625 0.75 0.7083 0.75 0.6667 0.5833 0.625 0.625 0.75 0.6667 0.875 1
Table 4. “Simple Matching” similarity matrix, Stanfel (1985) instance
m1 m2 m3 m4 m5 m6 m7 m8 m9 m10 m11 m12 m13 m14
1
0.2 1
0.25 0.25 1
0 0 0 1
0 0 0 0.5 1
0 0 0 0.2 0.1429 1
0 0 0 0.3333 0.6 0.3333 1
0 0 0.0526 0 0 0 0 1
0 0 0.0588 0 0 0 0 0.7143 1
0.0909 0.0909 0.0588 0 0 0 0 0.4 0.5 1
0 0 0 0 0 0 0 0 0 0 1
0 0 0 0 0 0 0 0 0 0 0.6364 1
0 0 0 0 0 0 0 0 0 0 0.1765 0.2857 1
0 0 0 0 0 0 0 0 0 0 0.2 0.1111 0.3333 1
Table 5. “Sokal & Sneath 2” similarity matrix of Stanfel (1985) example
Page 33 of 36
http://mc.manuscriptcentral.com/tprs Email: [email protected]
International Journal of Production Research
123456789101112131415161718192021222324252627282930313233343536373839404142434445464748495051525354555657585960
Page 36
For Peer Review Only
Node Group 1 Group 2 Simil. Objects in group
1 m8 m9 0.714 2
2 m11 m12 0.636 2
3 m5 m7 0.6 2
4 m13 m14 0.333 2
5 Node 1 m10 0.272 3
6 m4 Node 3 0.267 3
7 m1 m3 0.25 2
8 Node 7 m2 0.163 3
9 Node 6 m6 0.066 4
10 Node 2 Node 4 -0.049 4
11 Node 8 Node 10 -0.187 7
12 Node 11 Node 9 -0.182 11
13 Node 12 Node 5 -0.206 14
Node Group 1 Group 2 Simil. Objects in group
1 m4 m5 0.958 2
2 m8 m9 0.958 2
3 m1 m2 0.917 2
4 m6 m7 0.917 2
5 m11 m12 0.917 2
6 m13 m14 0.875 2
7 m3 m10 0.667 2
8 Node 1 Node 4 0.448 4
9 Node 3 Node 7 0.438 4
10 Node 5 Node 6 0.281 4
11 Node 9 Node 2 0.182 6
12 Node 11 Node 8 0.04 10
13 Node 12 Node 10 -0.048 14
Table 7. Stanfel (1985) instance. Clustering nodes obtained by
applying Centroid & “Sokal & Sneath 2”
Table 6. Stanfel (1985) instance. Clustering nodes
obtained by applying Centroid & "Simple Matching"
Page 34 of 36
http://mc.manuscriptcentral.com/tprs Email: [email protected]
International Journal of Production Research
123456789101112131415161718192021222324252627282930313233343536373839404142434445464748495051525354555657585960
Page 37
For Peer Review O
nly
CENTROID rule &
Simple Matching
CENTROID rule &
“Sokal e Sneath 2”
Percentile [%] 75 75
Number of Cells - C 5 5
Problem Density - PD 0.181 0.181
Inside density - IDG 0.75 0.773
Exceptional Elements - EE 13 10
Outside density - ODG 0.123 0.057
REC 0.953 0.924
RE 0.213 0.163
Group efficacy - τ 0.918 0.929
Table 8. Performance evaluation of numerical example
Id. Reference K x I Matrix dimen. PD value PD labelnum
machines
num
parts
matrix's
dim
dim.
Label
1 King and Nakornchai (1982) 5x7 35 0,4 H 5 7 35 S
2 Waghodekar and Sahu (1984) 5x7 35 0,571 H 5 7 35 S
3 Seifoddini (1989) 5x18 90 0,511 H 5 18 90 S
4 Kusiak and Chow (1987) 7x11 77 0,298 M 7 11 77 S
5 Boctor (1991) 7x11 77 0,272 M 7 11 77 S
6 Chandrasekharan and Rajagopalan (1986a) 8x20 160 0,55 H 8 20 160 M
7 Chandrasekharan and Rajagopalan (1986b) 8x20 160 0,38 M 8 20 160 M
8 Mosier and Taube (1985) 10x10 100 0,26 M 10 10 100 M
9 Stanfel (1985) 14x24 336 0,181 Lo 14 24 336 M
10 Srinivasan et al. (1990) 16x30 480 0,241 M 16 30 480 M
11 King (1980) 16x43 688 0,183 Lo 16 43 688 L
12 Kumar et al. (1986) 23x20 460 0,245 M 23 20 460 M
13 Carrie (1973) 20x35 700 0,194 Lo 20 35 700 L
14 Boe and Cheng (1991) 20x35 700 0,218 M 20 35 700 L
15 Chandrasekharan and Rajagopalan (1989) 24x40 (1) 960 0,136 Lo 24 40 960 L
16 Chandrasekharan and Rajagopalan (1989) 24x40 (2) 960 0,135 Lo 24 40 960 L
17 Chandrasekharan and Rajagopalan (1989) 24x40 (3) 960 0,134 Lo 24 40 960 L
18 Lee et al. (1997) 30x40 1200 0,12 Lo 30 40 1200 XL
19 Kumar and Vannelli (1987) 30x41 1230 0,104 Lo 30 41 1230 XL
20 Stanfel (1985) 30x50 1500 0,111 Lo 30 50 1500 XL
21 Seifoddini and Tjahjana (1999) 50x22 1100 0,07 Lo 50 22 1100 XL
22 Seifoddini and Tjahjana (1999) 68x21 1428 0,07 Lo 68 21 1428 XL
Table 9. Experimental analysis, examples in the literature
Page 35 of 36
http://mc.manuscriptcentral.com/tprs Email: [email protected]
International Journal of Production Research
123456789101112131415161718192021222324252627282930313233343536373839404142434445464748495051525354555657585960
Page 38
For Peer Review OnlyCells EE IDG ODG REC RE τ
Mean Sum Δ% Mean Sum Δ% Mean Sum Δ% Mean Sum Δ% Mean Sum Δ% Mean Sum Δ% Mean Sum Δ%
25 14,835 16319 0,00% 56,400 62040 0,00% 0,537 590,78 0,00% 0,259 284,9 0,00% 2,931 3224,1 0,00% 0,605 665,47 0,00% 0,806 886,07 0,00%
40 12,108 13319 -18,38% 48,500 53350 -14,01% 0,599 658,4 11,45% 0,220 241,59 -15,20% 1,998 2197,6 -31,84% 0,506 556,79 -16,33% 0,832 915,45 3,32%
75 5,820 6402 -60,77% 30,060 33066 -46,70% 0,580 637,83 7,96% 0,142 155,69 -45,35% 0,890 979,09 -69,63% 0,298 327,31 -50,82% 0,835 918,32 3,64%
COEFF Data
B H J O P R SI SK SK2 SO Mean CELLs totaleSum CELLs totale
% ALGOMean
CELLs
Sum
CELLs
Mean
CELLs
Sum
CELLs
Mean
CELLs
Sum
CELLs
Mean
CELLs
Sum
CELLs
Mean
CELLs
Sum
CELLs
Mean
CELLs
Sum
CELLs
Mean
CELLs
Sum
CELLs
Mean
CELLs
Sum
CELLs
Mean
CELLs
Sum
CELLs
Mean
CELLs
Sum
CELLs
25 CEN 14.91 328 14.91 328 14.91 328 14.91 328 14.86 327 14.91 328 14.91 328 14.91 328 14.86 327 14.86 327 14.90 3277
CLINK 14.91 328 14.91 328 14.91 328 14.91 328 14.86 327 14.91 328 14.91 328 14.91 328 14.86 327 14.86 327 14.90 3277
SLINK 14.91 328 14.91 328 14.91 328 14.91 328 14.86 327 14.91 328 14.91 328 14.91 328 14.86 327 14.86 327 14.90 3277
UPGMA 14.91 328 14.91 328 12.45 274 14.91 328 14.86 327 14.91 328 14.91 328 14.91 328 14.86 327 14.86 327 14.65 3223
WPGMA 14.91 328 14.91 328 14.91 328 14.36 316 14.86 327 14.91 328 14.91 328 14.91 328 14.86 327 14.86 327 14.84 3265
25 Total 14.91 1640 14.91 1640 14.42 1586 14.80 1628 14.86 1635 14.91 1640 14.91 1640 14.91 1640 14.86 1635 14.86 1635 14.84 16319
40 CEN 12.18 268 12.18 268 12.23 269 12.18 268 12.18 268 12.18 268 12.14 267 12.14 267 12.18 268 12.18 268 12.18 2679
CLINK 11.68 257 12.23 269 12.18 268 12.18 268 11.64 256 12.23 269 12.23 269 12.23 269 11.64 256 11.64 256 11.99 2637
SLINK 11.68 257 12.23 269 12.18 268 12.18 268 11.64 256 12.27 270 12.18 268 12.18 268 11.64 256 11.64 256 11.98 2636
UPGMA 12.18 268 12.23 269 12.18 268 12.18 268 12.14 267 12.27 270 12.23 269 12.23 269 12.14 267 12.14 267 12.19 2682
WPGMA 12.18 268 12.23 269 12.18 268 12.32 271 12.14 267 12.27 270 12.23 269 12.23 269 12.14 267 12.14 267 12.20 2685
40 Total 11.98 1318 12.22 1344 12.19 1341 12.21 1343 11.95 1314 12.25 1347 12.20 1342 12.20 1342 11.95 1314 11.95 1314 12.11 13319
75 CEN 5.82 128 5.82 128 5.86 129 5.86 129 5.82 128 5.82 128 5.86 129 5.86 129 5.82 128 5.77 127 5.83 1283
CLINK 5.82 128 5.82 128 5.91 130 5.86 129 5.64 124 5.82 128 5.82 128 5.82 128 5.68 125 5.64 124 5.78 1272
SLINK 5.59 123 5.91 130 5.86 129 5.82 128 5.64 124 5.91 130 5.95 131 5.95 131 5.64 124 5.64 124 5.79 1274
UPGMA 5.86 129 5.82 128 5.86 129 5.91 130 5.86 129 5.82 128 5.82 128 5.82 128 5.86 129 5.86 129 5.85 1287
WPGMA 5.86 129 5.82 128 5.82 128 5.91 130 5.86 129 5.82 128 5.82 128 5.82 128 5.86 129 5.86 129 5.85 1286
75 Total 5.79 637 5.84 642 5.86 645 5.87 646 5.76 634 5.84 642 5.85 644 5.85 644 5.77 635 5.75 633 5.82 6402
TOTAL 10.89 3595 10.99 3626 10.82 3572 10.96 3617 10.86 3583 11.00 3629 10.99 3626 10.99 3626 10.86 3584 10.85 3582 10.92 36040
Table 10. Experimental analysis, number of cells (mean and cumulative values)
COEFF Data
B H J O P R SI SK SK2 SO Mean EE totale Sum EE totale
% ALGOMean
EE
Sum
EE
Mean
EE
Sum
EE
Mean
EE
Sum
EE
Mean
EE
Sum
EE
Mean
EE
Sum
EE
Mean
EE
Sum
EE
Mean
EE
Sum
EE
Mean
EE
Sum
EE
Mean
EE
Sum
EE
Mean
EE
Sum
EE
25 CEN 56.36 1240 59.45 1308 57.27 1260 57.45 1264 55.50 1221 58.95 1297 56.41 1241 56.41 1241 55.50 1221 55.50 1221 56.88 12514
CLINK 55.55 1222 58.77 1293 55.32 1217 55.73 1226 55.55 1222 58.73 1292 59.36 1306 59.36 1306 52.55 1156 55.55 1222 56.65 12462
SLINK 54.73 1204 58.50 1287 54.36 1196 54.41 1197 52.36 1152 58.27 1282 58.09 1278 58.09 1278 52.45 1154 52.36 1152 55.36 12180
UPGMA 54.77 1205 58.73 1292 55.32 1217 55.32 1217 55.18 1214 58.50 1287 58.68 1291 58.68 1291 55.18 1214 55.18 1214 56.55 12442
WPGMA 54.77 1205 58.73 1292 55.32 1217 55.32 1217 55.18 1214 58.50 1287 58.68 1291 58.68 1291 55.18 1214 55.18 1214 56.55 12442
25 Total 55.24 6076 58.84 6472 55.52 6107 55.65 6121 54.75 6023 58.59 6445 58.25 6407 58.25 6407 54.17 5959 54.75 6023 56.40 62040
40 CEN 50.50 1111 52.23 1149 49.41 1087 49.68 1093 46.41 1021 52.14 1147 49.73 1094 49.73 1094 46.41 1021 46.41 1021 49.26 10838
CLINK 49.27 1084 51.95 1143 45.36 998 46.73 1028 46.23 1017 52.73 1160 52.09 1146 52.09 1146 42.05 925 46.32 1019 48.48 10666
SLINK 45.05 991 51.09 1124 49.55 1090 49.77 1095 43.82 964 50.45 1110 50.64 1114 50.64 1114 43.50 957 43.95 967 47.85 10526
UPGMA 46.59 1025 51.32 1129 46.23 1017 46.45 1022 46.77 1029 51.36 1130 51.14 1125 51.14 1125 46.77 1029 46.77 1029 48.45 10660
WPGMA 46.59 1025 51.32 1129 46.23 1017 46.45 1022 46.77 1029 51.36 1130 51.14 1125 51.14 1125 46.77 1029 46.77 1029 48.45 10660
40 Total 47.60 5236 51.58 5674 47.35 5209 47.82 5260 46.00 5060 51.61 5677 50.95 5604 50.95 5604 45.10 4961 46.05 5065 48.50 53350
75 CEN 31.23 687 32.82 722 31.23 687 31.68 697 24.14 531 32.00 704 29.50 649 29.68 653 24.14 531 24.09 530 29.05 6391
CLINK 29.14 641 35.55 782 29.55 650 29.45 648 27.68 609 35.55 782 35.73 786 35.68 785 23.41 515 27.77 611 30.95 6809
SLINK 26.36 580 34.86 767 26.45 582 26.68 587 22.14 487 34.77 765 33.64 740 33.59 739 22.77 501 22.14 487 28.34 6235
UPGMA 28.18 620 33.82 744 29.50 649 29.55 650 29.05 639 33.41 735 33.68 741 33.68 741 29.05 639 29.05 639 30.90 6797
WPGMA 28.23 621 33.91 746 29.50 649 29.55 650 29.73 654 33.50 737 33.77 743 33.68 741 29.73 654 29.05 639 31.06 6834
75 Total 28.63 3149 34.19 3761 29.25 3217 29.38 3232 26.55 2920 33.85 3723 33.26 3659 33.26 3659 25.82 2840 26.42 2906 30.06 33066
TOTAL 43.82 14461 48.20 15907 44.04 14533 44.28 14613 42.43 14003 48.02 15845 47.48 15670 47.48 15670 41.70 13760 42.41 13994 44.99 148456
Table 11. Experimental analysis, exceptional elements (mean and cumulative values)
Table 12. Experimental analysis, mean and sum values. Percentage comparison with %p=0.25.
Page 36 of 36
http://mc.manuscriptcentral.com/tprs Email: [email protected]
International Journal of Production Research
123456789101112131415161718192021222324252627282930313233343536373839404142434445464748495051525354555657585960


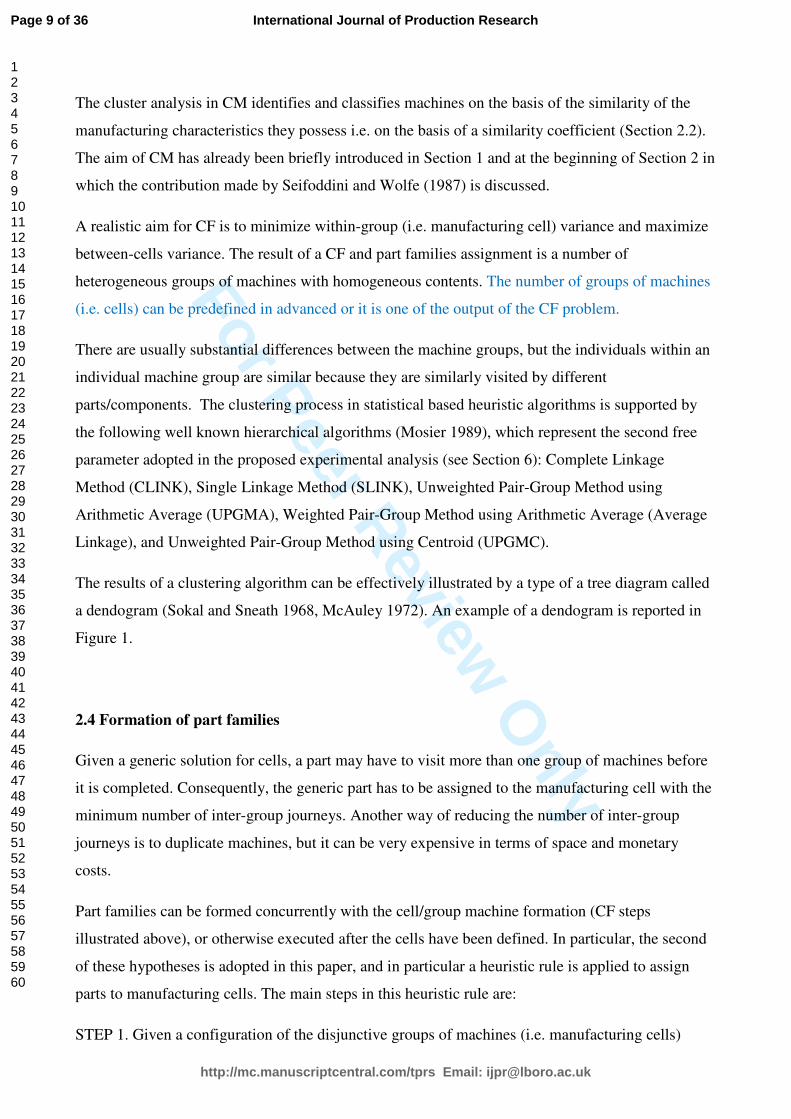


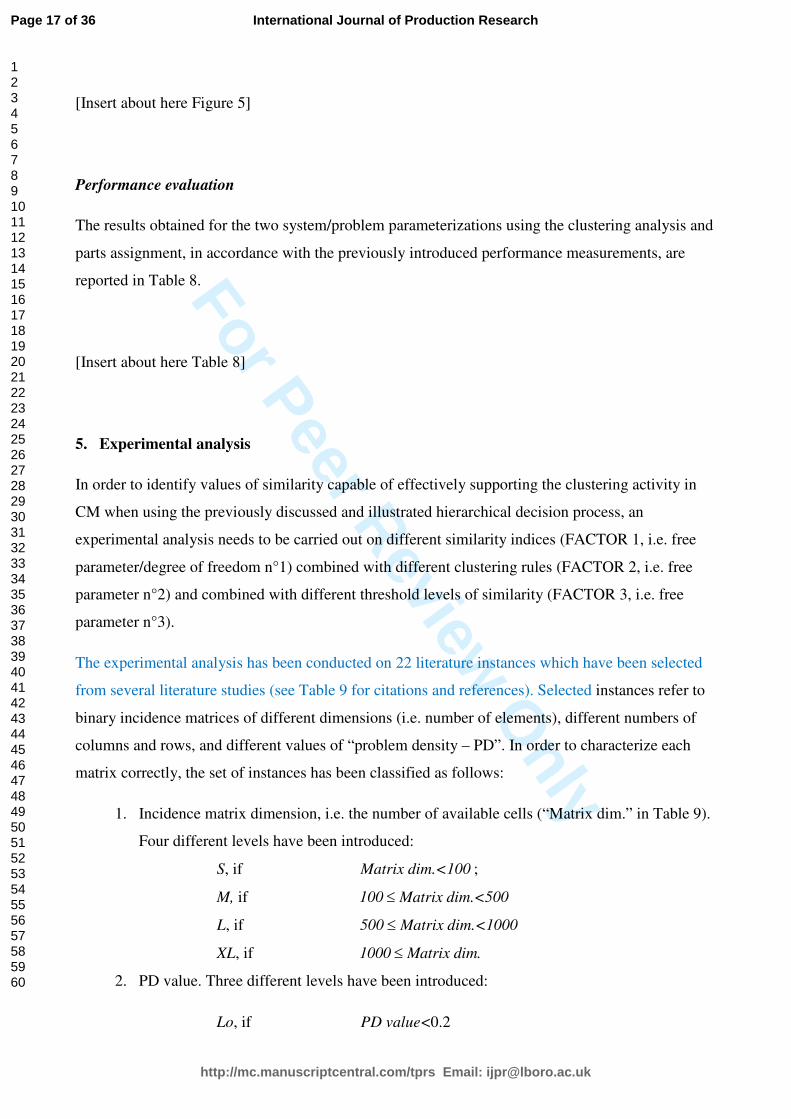


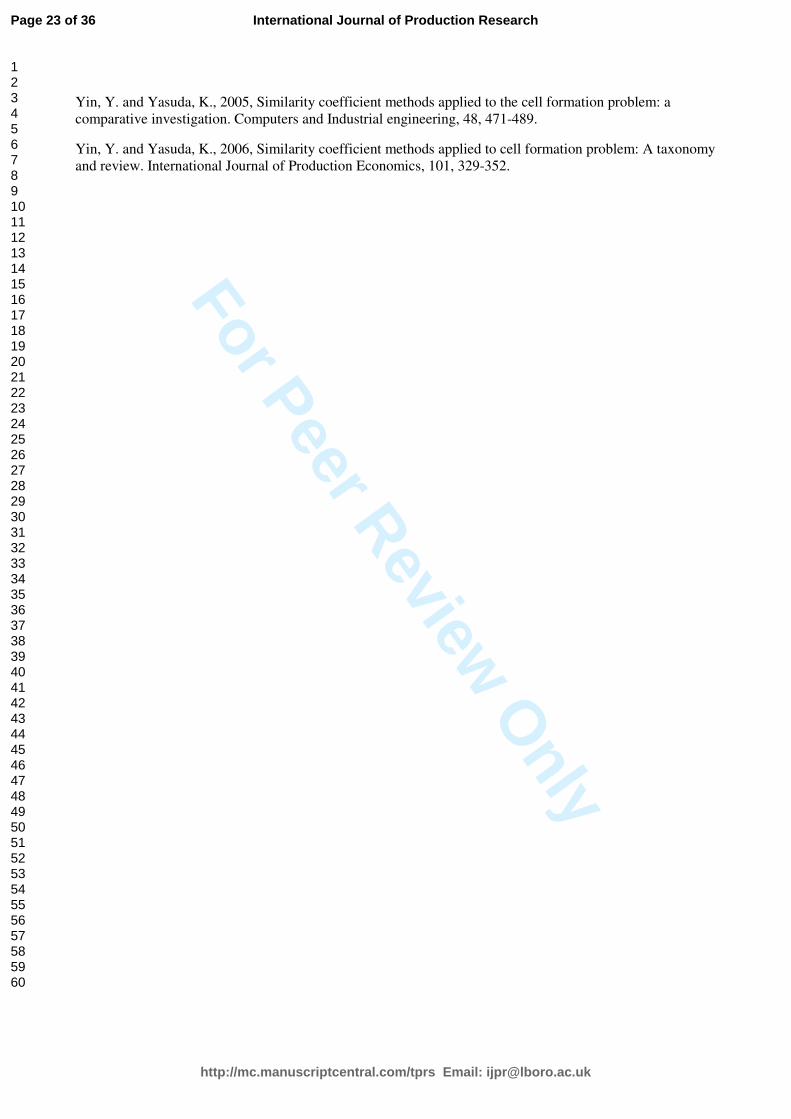
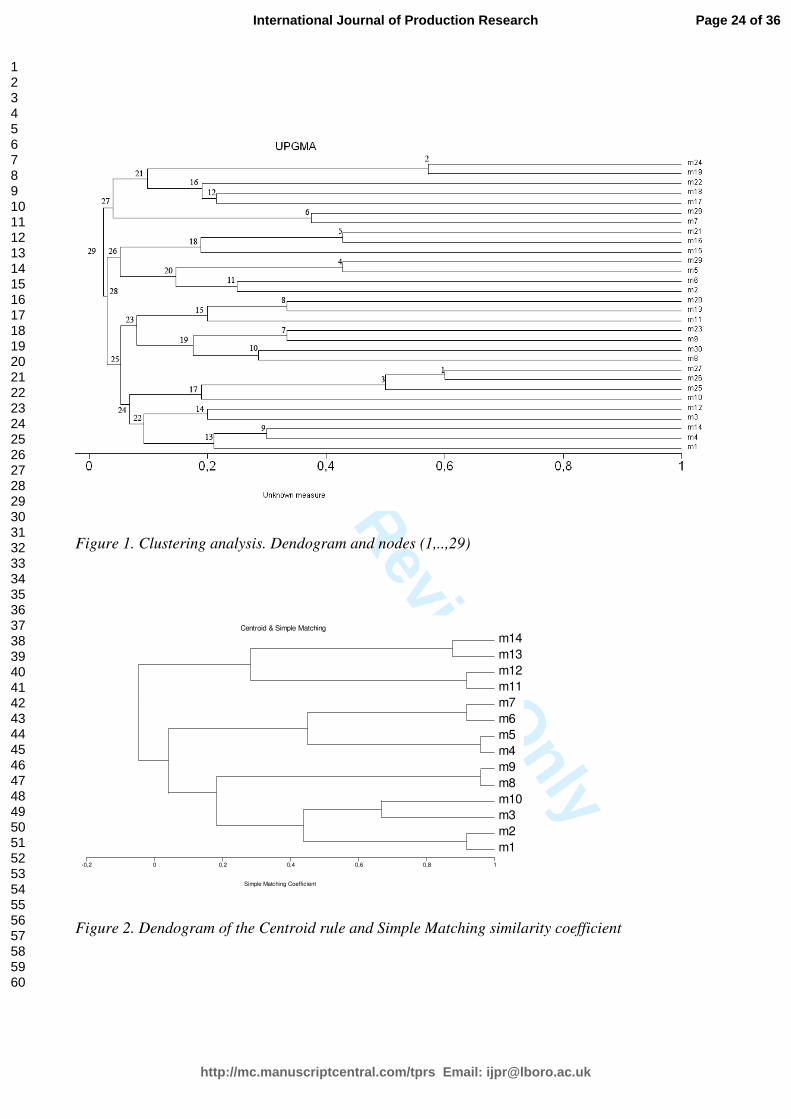
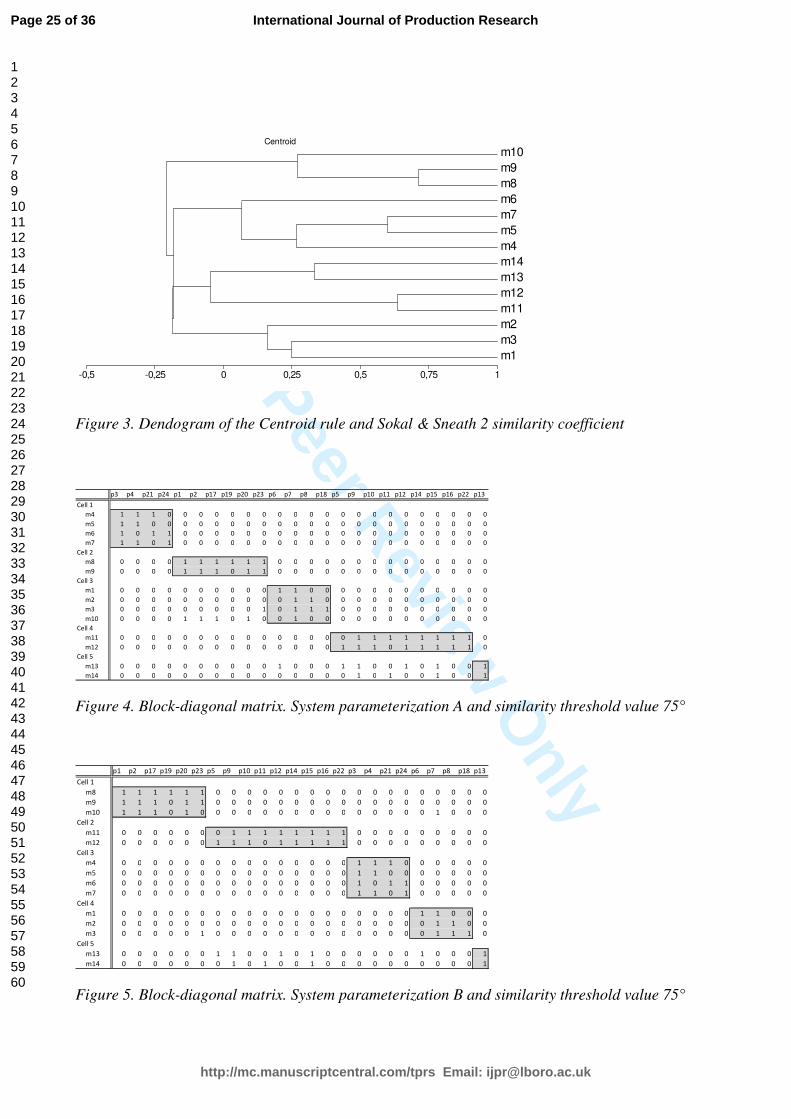

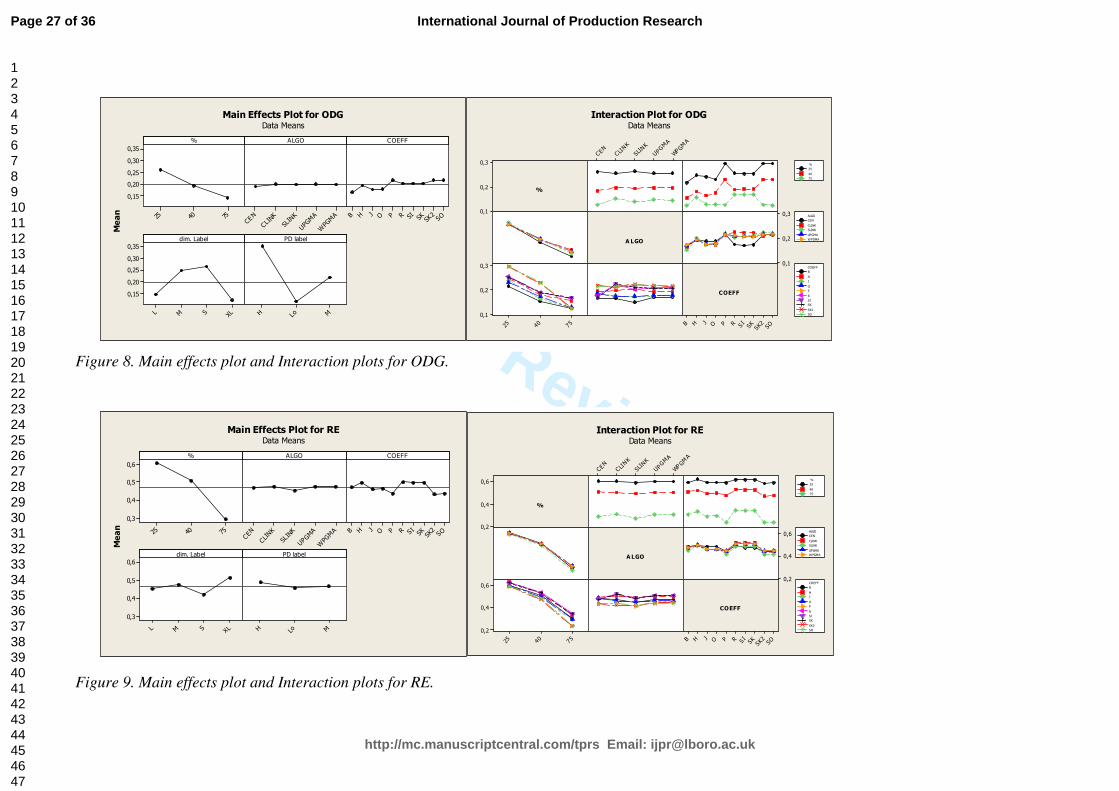

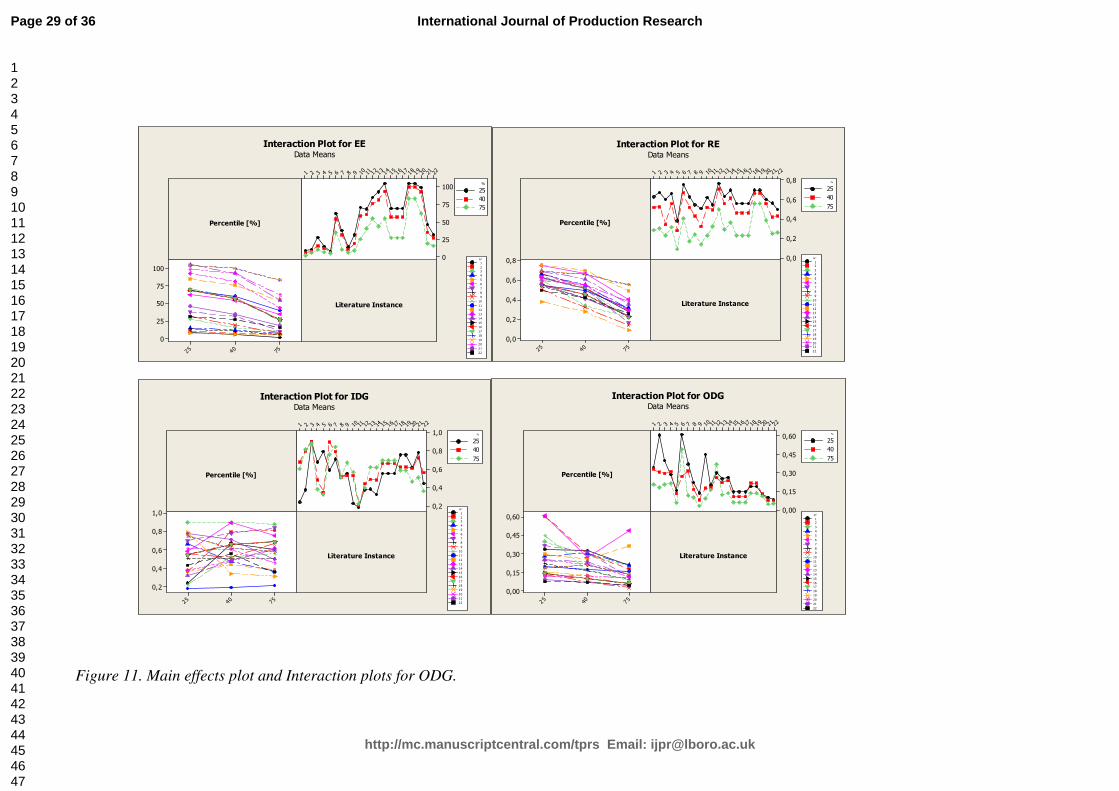


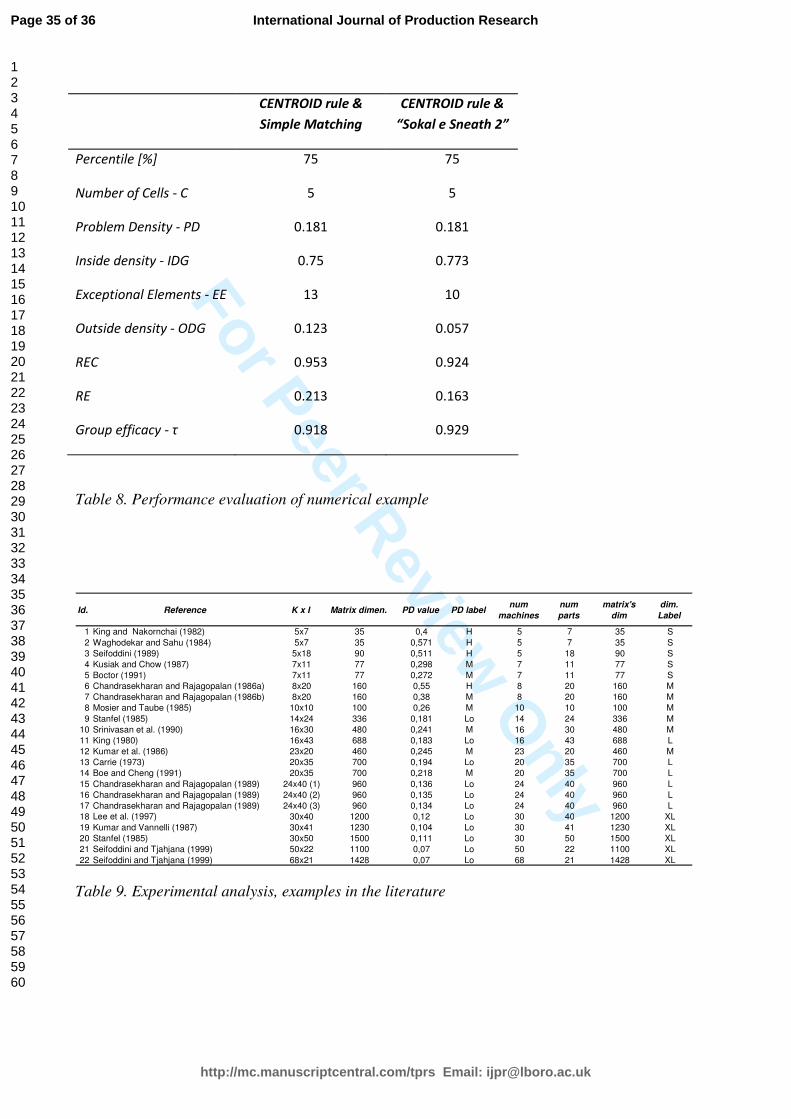


![All New Chemistry — Yours to Explore...2D fingerprint similarity search towards Timbal DB [2] with Tanimoto 85 % threshold. Using Binding DB and Pubmed DB, a reference set of small](https://static.documents.pub/doc/80x56/5f7aaf8553c6c24a346254f8/all-new-chemistry-a-yours-to-explore-2d-fingerprint-similarity-search-towards.jpg)
