The Tiffany Unit N 2 – ECBM Pilot: A Reservoir Modeling Study Topical Report January 1, 2000 – March 31, 2004 Scott Reeves and Anne Oudinot Advanced Resources International 9801 Westheimer, Suite 805 Houston, TX 77042 U.S. Department of Energy DE-FC26-0NT40924 June, 2004 Advanced Resources International . Advanced Resources International . This watermark does not appear in the registered version - http://www.clicktoconvert.com
Transcript
The Tiffany Unit N2 – ECBM Pilot:
A Reservoir Modeling Study
Topical Report
January 1, 2000 – March 31, 2004
Scott Reeves and Anne Oudinot Advanced Resources International9801 Westheimer, Suite 805Houston, TX 77042
This report was prepared as an account of work sponsored by an agency of the United States
Government. Neither the United Sates Government nor any agency thereof, nor any of their employees, makes any warranty, express or implied, or assumes any legal liability or
responsibility for the accuracy, completeness, or usefulness of any information, apparatus, product, or process disclosed, or represents that its use would not infringe privately owned rights.Reference herein to any specific commercial product, process, or service by trade name,
trademark, manufacturer, or otherwise does not necessarily constitute or imply its endorsement,recommendation, or favoring by the United States Government or any agency thereof. The
views and opinions of authors expressed herein do not necessarily state or reflect those of the United Sates Government or any agency thereof.
Advanced Resources International
The material in this Report is intended for general information only. Any use of this material in
relation to any specific application should be based on independent examination and verification of its unrestricted applicability for such use and on a determination of suitability for the application by professionally qualified personnel. No license under any Advanced Resources
International, Inc., patents or other proprietary interest is implied by the publication of this Report. Those making use of or relying upon the material assume all risks and liability arising
from such use or reliance.
This watermark does not appear in the registered version - http://www.clicktoconvert.com
In October, 2000, the U.S. Department of Energy, through contractor Advanced Resources
International, launched a multi-year government- industry R&D collaboration called the Coal-Seqproject. The Coal-Seq project is investigating the feasibility of CO2 sequestration in deep, unmineable coalseams, by performing detailed reservoir studies of two enhanced coalbed
methane recovery (ECBM) field projects in the San Juan basin. The two sites are the Allison Unit, operated by Burlington Resources, and into which CO2 is being injected, and the Tiffany
Unit, operating by BP America, into which N2 is being injected (the interest in understanding the N2-ECBM process has important implications for CO2 sequestration via flue-gas injection). The purposes of the field studies are to understand the reservoir mechanisms of CO2 and N2 injection
into coalseams, demonstrate the practical effectiveness of the ECBM and sequestration processes, demonstrate an engineering capability to model them, and to evaluate sequestration
economics. In support of these efforts, laboratory and theoretical studies are also being performed to understand and model multi-component isotherm behavior, and coal permeability changes due to swelling with CO2 injection. This report describes the results of an important
component of the overall project, the Tiffany Unit reservoir modeling study.
The Tiffany Unit is located in the northern portion of the prolific San Juan basin (in Southern Colorado). The study area consists of 34 methane production wells and 12 nitrogen injection wells. The field originally began production in 1983, and N2 injection operations for ECBM
purposes commenced in 1998. Nitrogen injection was suspended in 2002, to evaluate the results of the pilot. In this study, a detailed reservoir characterization of the field was developed, the
field history was matched using the COMET3 reservoir simulator, and future field performance was forecast under various operating conditions.
This watermark does not appear in the registered version - http://www.clicktoconvert.com
Based on the results of the study, the following major conclusions have been drawn:
· The injection of N2 at the Tiffany Unit has resulted in incremental methane recovery over
estimated primary recovery, in approximate proportion of one volume of methane for every 0.4 volumes of injected nitrogen on a net basis. In the swept areas, an incremental methane recovery of approximately 20% of original-gas-in-place resulted from N2-
ECBM operations.
· At the prevailing gas prices at the time the project was implemented (~2.20/Mcf), and not considering any tax credit benefits, the pilot itself was uneconomic. However, with
today’s gas prices of ~$4.00/Mcf, N2-ECBM appears economically attractive.
· Performance predictions of future injection suggests CO2 sequestration can be accomplished at a slight profit. Economic performance is enhanced by adding some N2
to the injectant.
This watermark does not appear in the registered version - http://www.clicktoconvert.com
Disclaimers ........................................................................................................................................................................................ i
Executive Summary ........................................................................................................................................................................ ii
Table of Contents............................................................................................................................................................................iv
List of Tables....................................................................................................................................................................................v
List of Figures .................................................................................................................................................................................vi
2.0 N2-ECBM Process ........................................................................................................................................................... 2
3.0 Site Description................................................................................................................................................................ 4
5.0 Model Construction....................................................................................................................................................... 12
7.0 History Matching ........................................................................................................................................................... 23
Table 1: Tiffany Unit Basic Coal Reservoir Data ...................................................................................................................... 7
Table 2: Reservoir Parameters used in Model.......................................................................................................................... 14
Table 3: Incremental Recoveries by Well, Case 2 versus Case 1.......................................................................................... 29
Table 4: Summary of Model Forecast Results.......................................................................................................................... 41
Figure 1: Sample Sorption Isotherms for CO2, CH4 and N2 on San Juan Basin Coal ......................................................... 2Figure 2: Location of the Tiffany Unit, San Juan Basin ........................................................................................................... 4Figure 3: Producer/Injector Well Pattern, Tiffany Unit ............................................................................................................ 4
Figure 4: Producing History, Tiffany Unit Study Area............................................................................................................. 6Figure 5: Producing History, Individual Tiffany Unit Well..................................................................................................... 6Figure 6 : Structure Map, B Coal (units in feet above sea level)............................................................................................. 8
Figure 7: Total Net Coal Isopach, Tiffany Unit Study Area (units in feet)........................................................................... 8Figure 8: Carbon Dioxide, Methane and Nitrogen Isotherms for Wet Tiffany Coal ........................................................... 9Figure 9: Relative Permeability Curves, Tiffany Unit ............................................................................................................ 10
Figure 10: Permeability Changes with Pressure and Concentration..................................................................................... 11Figure 11: Map View of the Top Layer Simulation Model.................................................................................................... 12Figure 12: Cross Section of the Reservoir Model, Northwest - Southeast .......................................................................... 13
Figure 13: Cross Section of the Reservoir Model, Southwest - Northeast .......................................................................... 13Figure 14: Actual versus Simulated Field Gas Rate, Tiffany................................................................................................. 15Figure 15: Locations of Wells Used for Comparison.............................................................................................................. 16
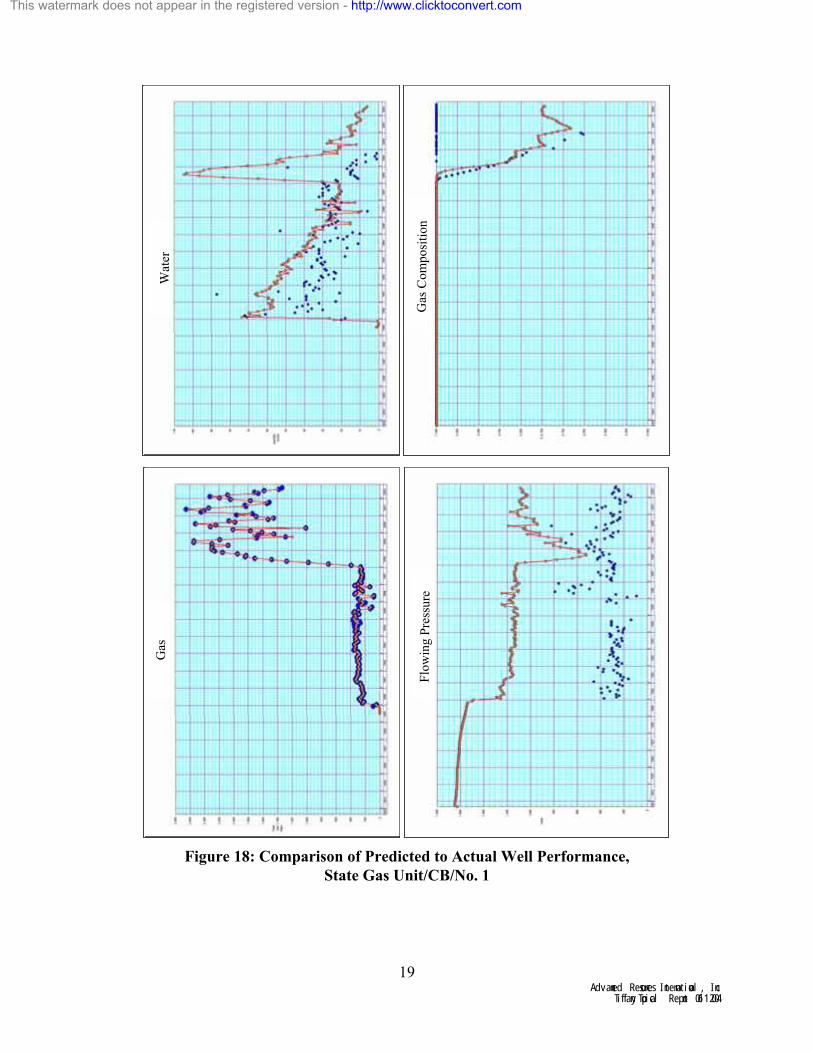
Figure 16: Comparison of Predicted to Actual Well Performance, Anderson Gas Unit 28-03 No. 1............................. 17Figure 17: Comparison of Predicted to Actual Well Performance, Robertson Gas Unit 19-01 No. 1............................ 18Figure 18: Comparison of Predicted to Actual Well Performance, State Gas Unit/CB/No. 1......................................... 19
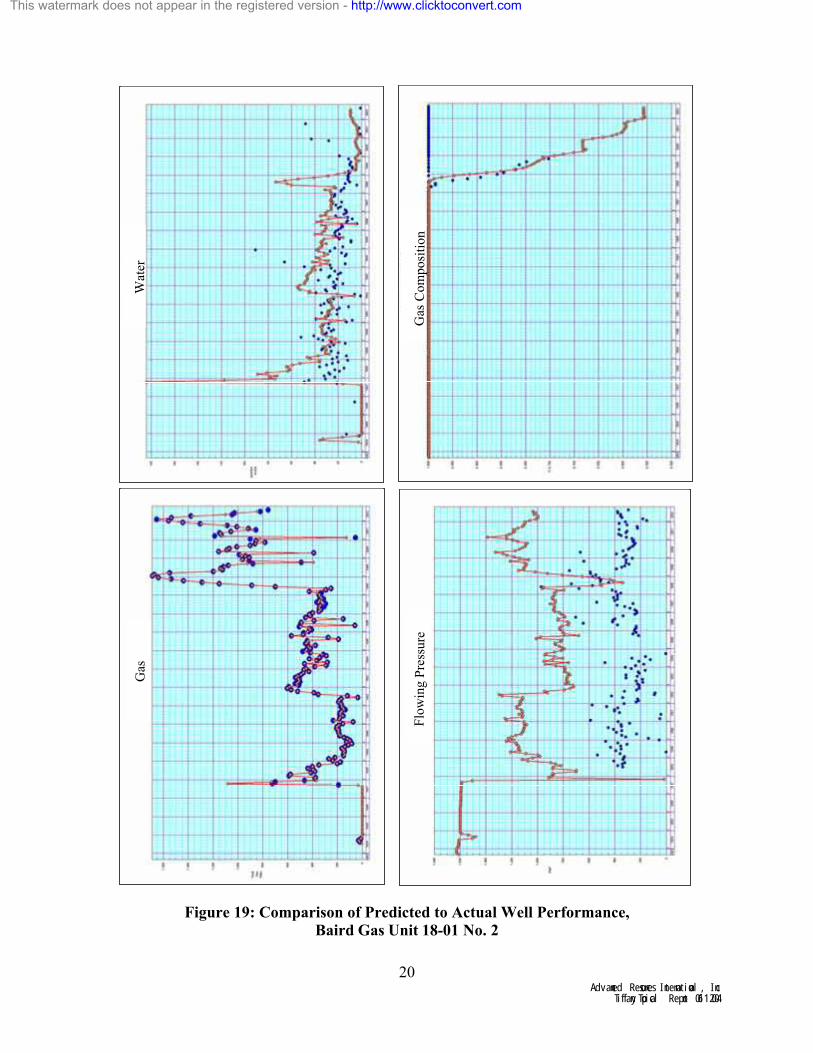
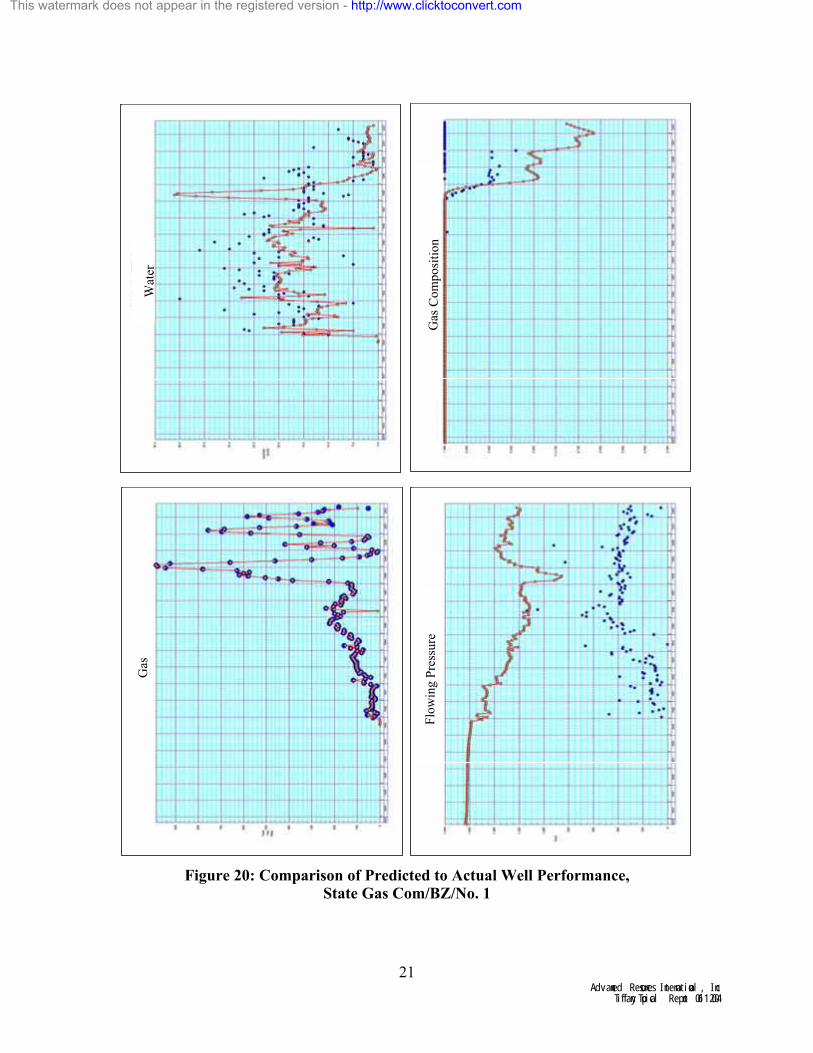
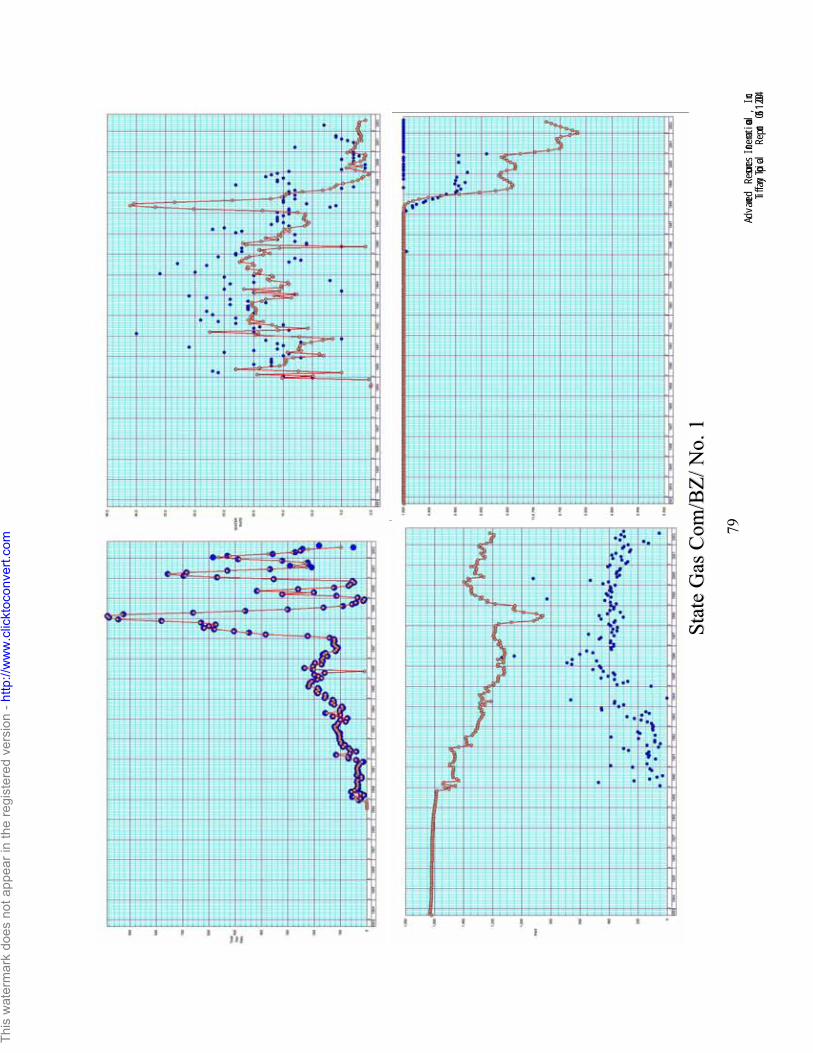
Figure 19: Comparison of Predicted to Actual Well Performance, Baird Gas Unit 18-01 No. 2.................................... 20Figure 20: Comparison of Predicted to Actual Well Performance, State Gas Com/BZ/No. 1......................................... 21Figure 21: Comparison of Predicted to Actual Bottomhole Reservoir and Injection Pressures, Injection Well #2..... 22
Figure 22: Comparison of Predicted to Actual Bottomhole Reservoir and Injection Pressures, Injection Well #8..... 22Figure 23: Residual Methane Content (Layer 1) at End of History Match Period............................................................. 24Figure 24: Methane Production and Nitrogen Content, Cases 1 and 2................................................................................. 26
Figure 25: Incremental Methane Production, Case 2 versus Case 1..................................................................................... 26Figure 26: Residual Methane Content (Layer 1) at End of Case 2 ....................................................................................... 27Figure 27: N2/CH4 Ratio with Time ........................................................................................................................................... 28
Figure 28: Map of Incremental Gas Recovery due to N2-ECBM.......................................................................................... 30Figure 29: Methane Rates and Nitrogen Content, Cases 2 and 3.......................................................................................... 31Figure 30: Incremental Methane Rate, Case 3 versus Case 2 ................................................................................................ 31
Figure 31: Residual Methane Content (Layer 1) and End of Case 3 .................................................................................... 32Figure 32: Methane Rates and Nitrogen Content, Cases 2 and 4.......................................................................................... 33Figure 33: Incremental Methane Rate, Case 4 versus Case 2 ................................................................................................ 33
Figure 34: Residual Methane Content (Layer 1) at End of Case 4 ....................................................................................... 34Figure 35: Methane Rates and CO2 Content, Cases 2 and 5 .................................................................................................. 35Figure 36: Incremental Methane Rate, Case 5 versus Case 2 ................................................................................................ 35
Figure 37: Residual Methane Content (Layer 1) at End of Case 5 ....................................................................................... 36Figure 38: CO2 Injection Rate versus Time, Case 5 ................................................................................................................ 37Figure 39: Incremental Methane Rate, Case 6 versus Case 2 ................................................................................................ 38
Figure 40: Methane Rates and CO2/N2 Content, Cases 2 and 6 ............................................................................................ 38Figure 41: Residual Methane Content (Layer 1) at End of Case 6 ....................................................................................... 39Figure 42: CO2 and N2 Injection Rates versus Time, Case 6................................................................................................. 40
Figure 43: Economic Analysis Results, Case 2 versus Case 1 .............................................................................................. 43
This watermark does not appear in the registered version - http://www.clicktoconvert.com
In October, 2000, the U.S. Department of Energy (DOE), through contractor Advanced
Resources International (ARI), launched a multi-year government- industry R&D collaboration called the Coal-Seq project1. The Coal-Seq project is investigating the feasibility of CO2
sequestration in deep, unmineable coalseams, by performing detailed reservoir studies of two
enhanced coalbed methane recovery (ECBM) field projects in the San Juan basin. The two sites are the Allison Unit, operated by Burlington Resources, and into which CO2 is being injected,
and the Tiffany Unit, operated by BP America (BP), into which N2 is being injected (the interest in understanding the N2-ECBM process has important implications for CO2 sequestration via flue-gas injection). The purposes of the field studies are to understand the reservoir mechanisms
of CO2 and N2 injection into coalseams, demonstrate the practical effectiveness of the ECBM and sequestration processes, demonstrate an engineering capability to model them, and to evaluate
sequestration economics. In support of these efforts, laboratory and theoretical studies are also being performed to understand and model multi-component isotherm behavior, and coal permeability changes due to swelling with CO2 injection. This report describes the results of an
important component of the overall project, the Tiffany Unit reservoir modeling study.
This watermark does not appear in the registered version - http://www.clicktoconvert.com
Before describing the field study and its’ results, a brief description of the N2-ECBM is presented to assist those readers not familiar with this technology. It does, however, assume that the reader
does have a basic understanding of the reservoir mechanics associated with coalbed methane (CBM) reservoirs.
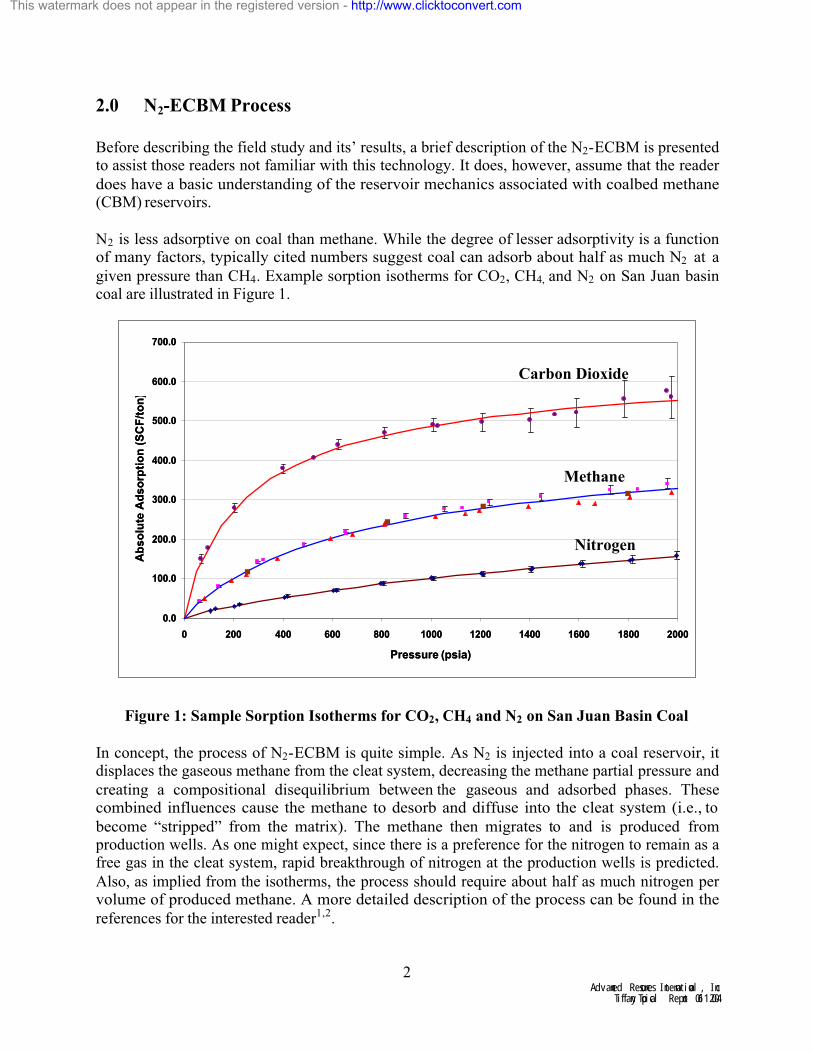
N2 is less adsorptive on coal than methane. While the degree of lesser adsorptivity is a function of many factors, typically cited numbers suggest coal can adsorb about half as much N2 at a
given pressure than CH4. Example sorption isotherms for CO2, CH4, and N2 on San Juan basin coal are illustrated in Figure 1.
Figure 1: Sample Sorption Isotherms for CO2, CH4 and N2 on San Juan Basin Coal
In concept, the process of N2-ECBM is quite simple. As N2 is injected into a coal reservoir, it displaces the gaseous methane from the cleat system, decreasing the methane partial pressure and
creating a compositional disequilibrium between the gaseous and adsorbed phases. These combined influences cause the methane to desorb and diffuse into the cleat system (i.e., to
become “stripped” from the matrix). The methane then migrates to and is produced from production wells. As one might expect, since there is a preference for the nitrogen to remain as a free gas in the cleat system, rapid breakthrough of nitrogen at the production wells is predicted.
Also, as implied from the isotherms, the process should require about half as much nitrogen per volume of produced methane. A more detailed description of the process can be found in the
references for the interested reader1,2.
This watermark does not appear in the registered version - http://www.clicktoconvert.com
Due to the infancy of the technology, very little field data exists to validate our knowledge of the process, and its economic potential. The Tiffany Unit is the largest and longest running N2-
ECBM field pilot in the world today, and hence represents a unique opportunity to study and understand the reservoir mechanisms at play, and hence how they might be managed from a
carbon sequestration perspective.
This watermark does not appear in the registered version - http://www.clicktoconvert.com
The Tiffany Unit CBM project is located in La Plata County, Colorado, in close proximity to the border with New Mexico (Figure 2). While the Unit consists of many wells, the pilot area for N2
injection, and hence the study area for the Coal-Seq project, consists of 34 CBM producer wells and 12 N2 injectors. The study area well pattern is illustrated in Figure 3. Note that the
northwestern part of the study area was previously characterized and modeled by ARI as part of a Gas Research Institute effort to understand reservoir behavior in San Juan Basin coals3.
Figure 2: Location of the Tiffany Unit, San Juan Basin
Figure 3: Producer/Injector Well Pattern, Tiffany Unit
This watermark does not appear in the registered version - http://www.clicktoconvert.com
It is also worth noting that ten of the twelve injection wells were directionally drilled from existing producer well pads. This was done to minimize both the environmental footprint
associated with nitrogen injection, as well as road and location construction costs. The two remaining injection wells were formerly producing wells that were converted to injection
service. The production wells are on nominal 320 acre spacing. With the injectors, the nominal well spacing is reduced to 160 acres per well.
In general, the production wells were drilled through the entire coal interval to total depth and 5-1/2 inch casing cemented into place. The coals were then perforated and fracture-stimulated, and
configured for production with rod pump for dewatering and gas flow up the casing. Later, when water rates declined, the wells were converted to natural flow, with both gas and water production commingled up a tubing string.
In the case of the N2 injection wells, the wells were directionally drilled from existing production
wells pads to total depth, and 4-1/2 inch casing run and cemented into place. Note that the coal intervals were penetrated by the wellbore in a near-vertical orientation. The coal intervals were then perforated, and perforation breakdown treatments performed. The coal intervals in the
injection wells did not receive stimulation treatments to prevent possible communication pathways being created into bounding non-coal layers. The downhole configuration for injection
wells consists of a tubing and packer arrangement. Further information on the operational aspects of the Tiffany pilot can be found in the references4.
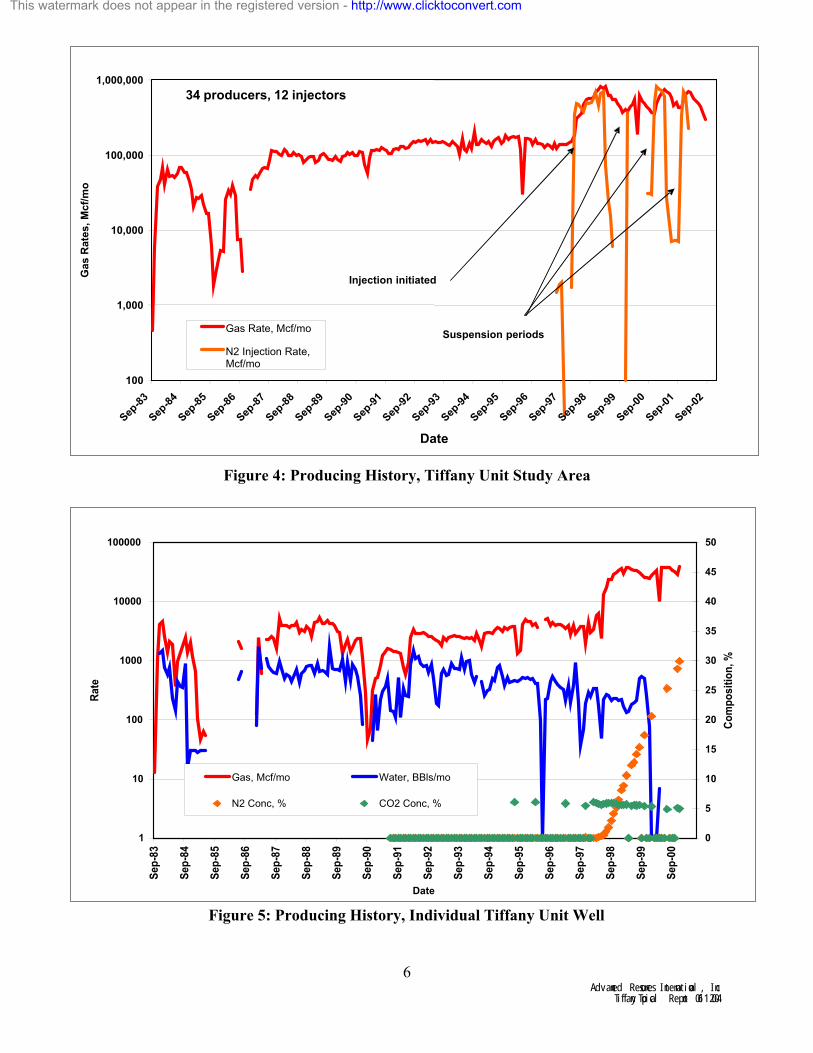
The producing history for the study area is shown in Figure 4. The field originally began production in 1983, with N2 injection beginning in January, 1998. Production just prior to
nitrogen injection was about 5 MMcfd, or about 150 Mcfd per well. Injection was suspended in January 2002, after four years of intermittent N2 injection, to evaluate the results. Several features are worth pointing out regarding the producing history:
o Nitrogen injection only occurred during the winter months, and was suspended during the
summer months. The reason is that the nitrogen was sourced from a cryogenic air separation plant located at the Florida River gas processing facility, and the unit ran less efficiently at temperatures above 65 degrees Fahrenheit. Therefore nitrogen injection was only performed
during the cooler winter months.
o The methane production response to N2 injection was rapid and dramatic. During the initial injection period, total methane rate jumped from about 5 MMcfd to about 27 MMcfd, over a factor of 5.
o As expected, nitrogen breakthrough at some of the producer wells occurred fairly quickly.
An example production history for one well is shown in Figure 5.
This watermark does not appear in the registered version - http://www.clicktoconvert.com
The Tiffany Unit wells produce from four Upper Cretaceous Fruitland Formation coal seams, named the B, C, D and E (from shallowest to deepest) using BP’s terminology. A summary of
basic coal depth, thickness, pressure and temperature information is provided in Table 1.
Table 1: Tiffany Unit Basic Coal Reservoir Data
Property ValueAverage Depth to Top Coal (B) 3040 feet
No. Coal Intervals 7 total (A, A2, B, C, D, E, F)
4 main (B, C, D, E)
Average Total Net Thickness 47 feet
B – 13 ft
C – 11 ft
D – 9 ft
E – 14 ft
Coal Rank Medium Volatile Bituminous
Initial Pressure 1600 psi
Temperature 120°F
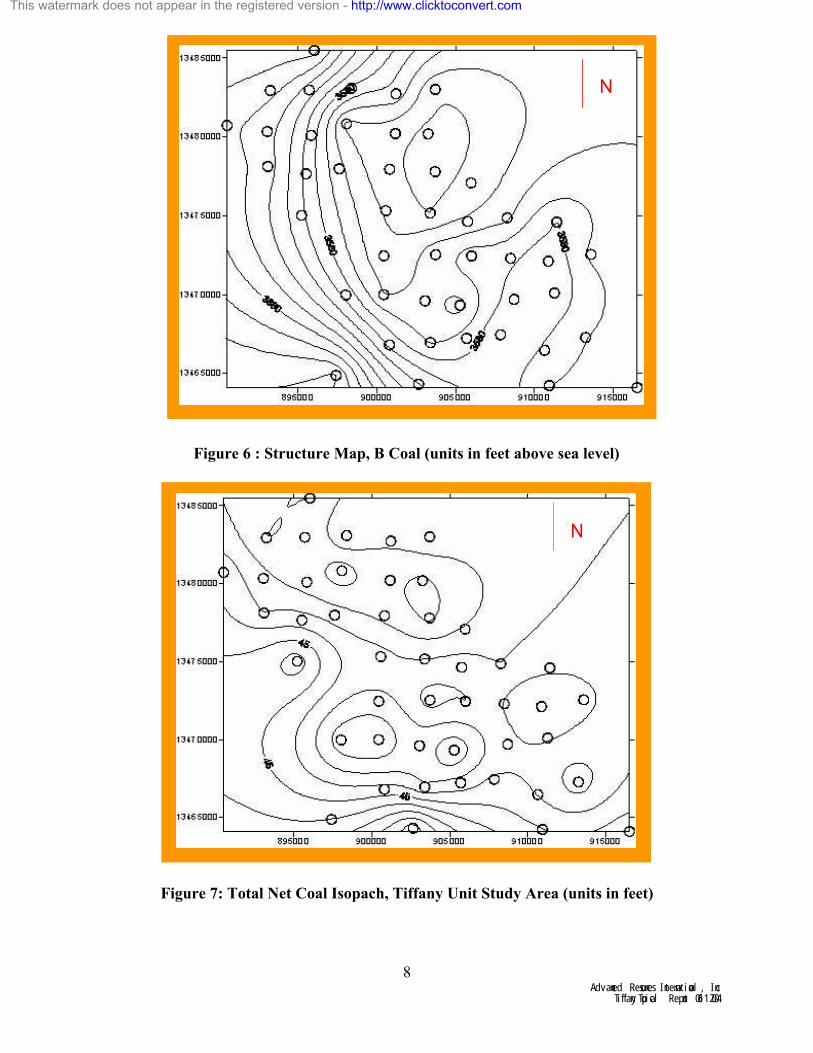
Structure contour and isopach maps of each coal and interburden horizon were constructed based on lithologic picks made by BP. A sample structure map for the B coal is presented in Figure 6,
and the total net coal isopach is presented in Figure 7. A gentle dip in the area exists towards the north-northeast, where the coals also thicken slightly.
This watermark does not appear in the registered version - http://www.clicktoconvert.com
Pure Gas Absolute Adsorption on Tiffany coals at 130°F (wet coal)
0.0
100.0
200.0
300.0
400.0
500.0
600.0
700.0
0 200 400 600 800 1000 1200 1400 1600 1800 2000
Pressure (psia)
Ab
so
lute
Ad
so
rpti
on
(S
CF
/to
n)
N2 on Mixed Coal
CH4 on Well #1
CH4 on Well #10
CH4 on Mixed Coal
CO2 on Mixed Coal
VL = 257 scf/ton
PL = 1429 psi
VL = 601 scf/ton
PL = 227 psi
VL = 421 scf/ton
PL = 606 psi
Pure Gas Absolute Adsorption on Tiffany coals at 130°F (wet coal)
Sorption isotherms for CH4, N2 and CO2 were measured for coal samples taken earlier (and preserved) from injection wells #1 and #10 (in the northwest and southeast portions of the field
respectively). After careful quality control checking, the samples were mixed and single, binary and ternary isotherms measured5. The results for the pure component isotherms are shown in
Figure 8, on an as-received basis.
Figure 8: Carbon Dioxide, Methane and Nitrogen Isotherms for Wet Tiffany Coal
In the previous reservoir study of the area3, a coal permeability anisotropy of about 2.4 was determined to exist, with the maximum permeability in the northwest-southeast orientation. This
coincides with the measured face-cleat orientation. The geometric average permeability from that study was determined to be 1.6 md, and the average porosity 0.8%. These initial values were examined and in some cases adjusted for this study, as follows:
o There was clear evidence from a nitrogen breakthrough map that a permeability
anisotropy existed in the orientation concluded from the prior study. Therefore both the magnitude and orientation of the permeability anisotropy from that work were retained for this study.
o In the prior study, skin factors for almost all of the production wells were set to a value
of –2. Later, Amoco (the operator at the time) stated that the skin factors were probably much greater (more positive), and hence the implied coal permeability would be much higher. Therefore, as a starting point, a geometric average permeability of 8.0 was used
(a factor of five higher than the previous study). However, the skin factors for all production wells were retained at a value of –2 because, since that prior study was
performed in the early 1990’s, all wells in the field had been restimulated to (presumably) a negative skin condition (in the mid-1990’s).
This watermark does not appear in the registered version - http://www.clicktoconvert.com
o To independently estimate porosity, decline-curve analysis was performed on the water production from each well. The main assumption with this technique is that all water
production is coming from the coal (and specifically from the coal cleat system), and that ultimate water recovery is a reasonable (lower-bound) estimate for cleat porosity.
Based on this approach, an average porosity of 0.2% was determined. This was therefore the value adopted for use in this study.
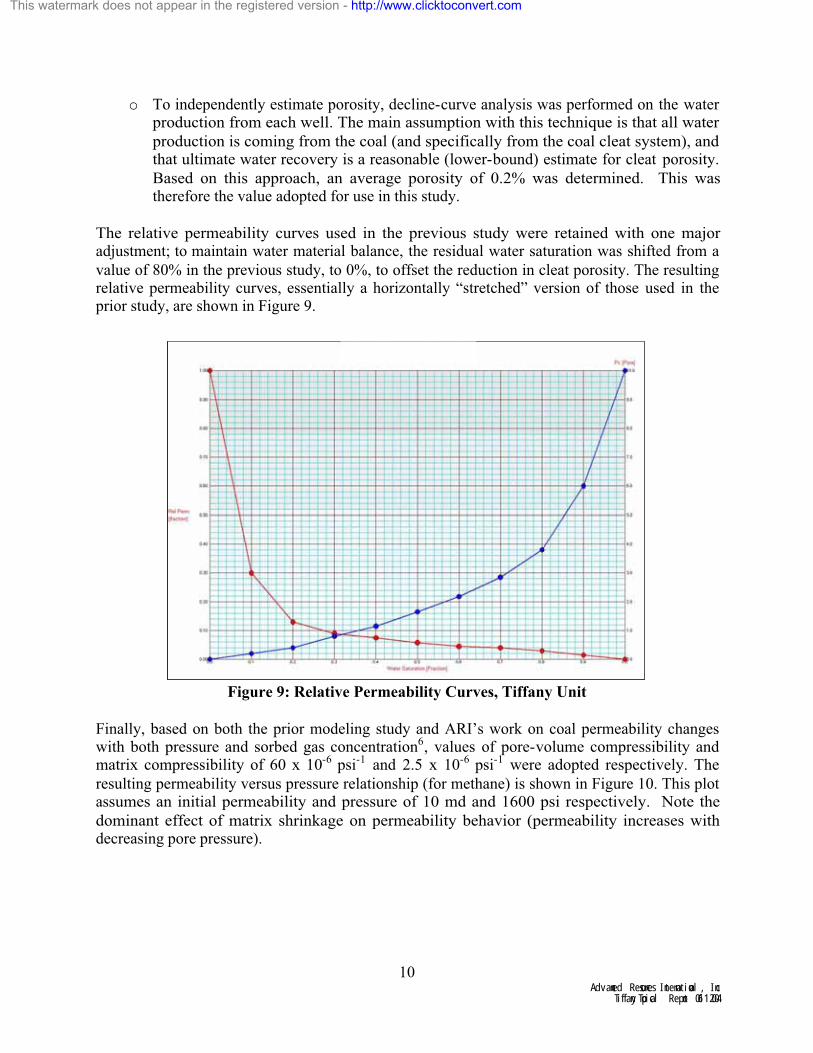
The relative permeability curves used in the previous study were retained with one major adjustment; to maintain water material balance, the residual water saturation was shifted from a
value of 80% in the previous study, to 0%, to offset the reduction in cleat porosity. The resulting relative permeability curves, essentially a horizontally “stretched” version of those used in the prior study, are shown in Figure 9.
Figure 9: Relative Permeability Curves, Tiffany Unit
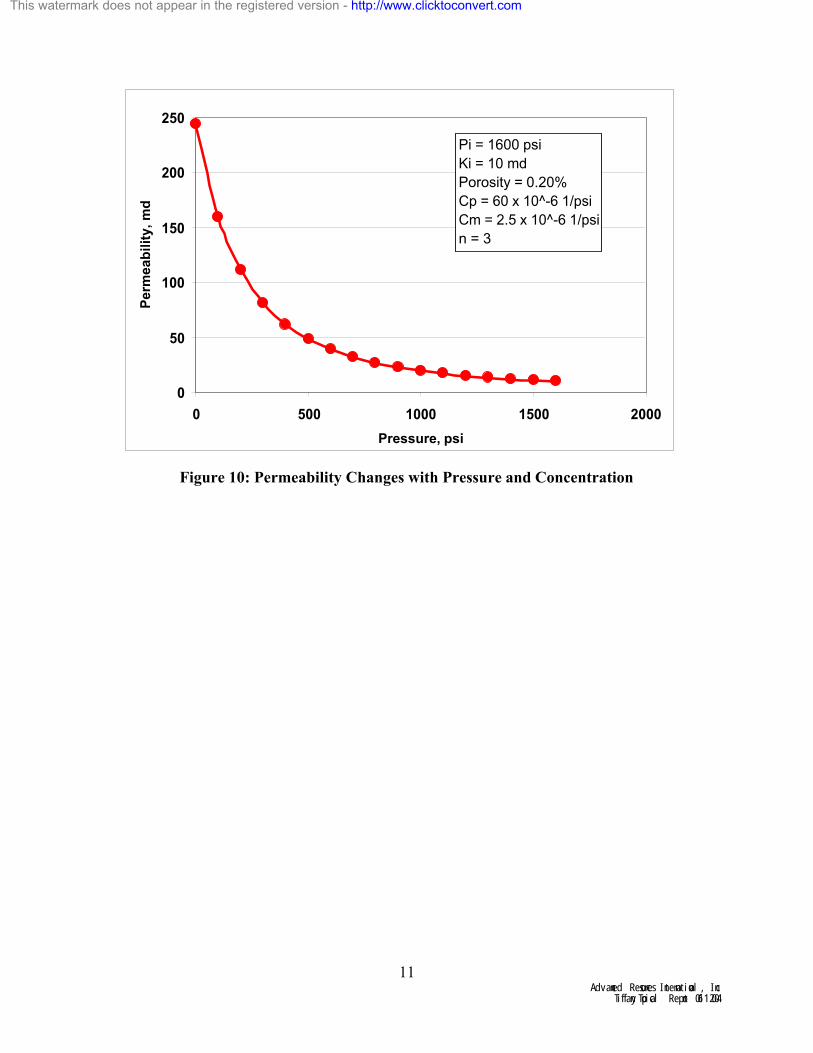
Finally, based on both the prior modeling study and ARI’s work on coal permeability changes with both pressure and sorbed gas concentration6, values of pore-volume compressibility and matrix compressibility of 60 x 10-6 psi-1 and 2.5 x 10⁻⁶ psi-1 were adopted respectively. The
resulting permeability versus pressure relationship (for methane) is shown in Figure 10. This plot assumes an initial permeability and pressure of 10 md and 1600 psi respectively. Note the
dominant effect of matrix shrinkage on permeability behavior (permeability increases with decreasing pore pressure).
This watermark does not appear in the registered version - http://www.clicktoconvert.com
The reservoir simulator used for the study is ARI’s COMET3 (ternary isotherm – CH4, N2 andCO2) model. Details on the model theory are provided in the references2,7.
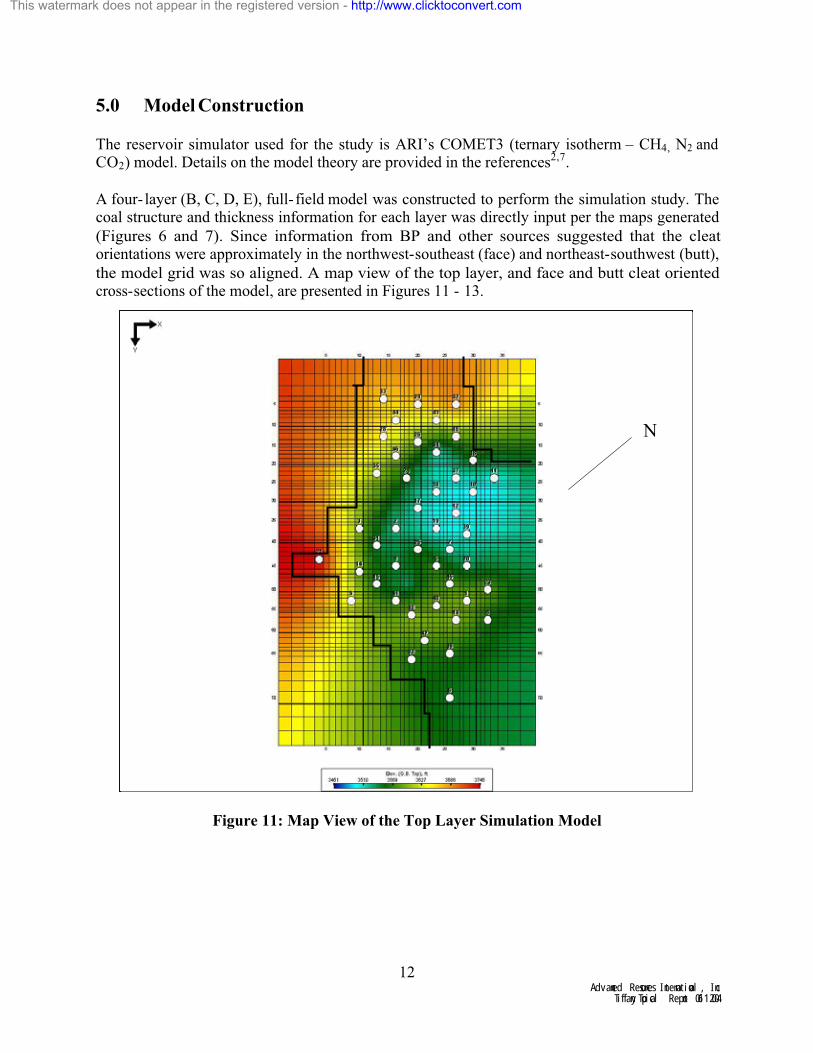
A four- layer (B, C, D, E), full- field model was constructed to perform the simulation study. The coal structure and thickness information for each layer was directly input per the maps generated
(Figures 6 and 7). Since information from BP and other sources suggested that the cleat orientations were approximately in the northwest-southeast (face) and northeast-southwest (butt),
the model grid was so aligned. A map view of the top layer, and face and butt cleat oriented cross-sections of the model, are presented in Figures 11 - 13.
Figure 11: Map View of the Top Layer Simulation Model
NN
This watermark does not appear in the registered version - http://www.clicktoconvert.com
The model gridblock dimensions were 73 x 37 x 4 (approximately 10,800 total gridblocks, 7,752 of which were active), and covered an active area of about 16,400 acres. On average, the
gridblock dimensions were 690 ft ´ 525 feet ´ 12 feet. The corners of the model were isolated using no-flow barriers to account for producing wells immediately adjacent to these portions of
the study area.
The Langmuir volume and pressure values were constant throughout the model based on the isotherms presented in Figure 8, both horizontally and vertically. The porosity and permeability values were also constant throughout the model area, at the values stated earlier. Note that BP
had run production logs on the injection wells and determined that nearly uniform injection was occurring in all performed intervals8. This lent some credibility to the assumption that vertical
permeability did not vary substantially by layer. Other relevant reservoir parameters are presented in Table 2.
Table 2: Reservoir Parameters used in Model
Parameter Value Source Remarks
Initial Pressure
Reservoir TemperatureInitial Water SaturationInitial Gas Content
Sorption TimeFracture Spacing
Gas Composition
Relative Permeability
Perm Function Parameters
1600 psi
120 deg F95%
Per Isotherm
10 days0.25 inch
99.9% CH4,0.1% N2
Figure 9
See text
BP
BPAssumedAssumed
Prior StudyPrior Study
Gas CompositionMeasurement
Independent Analysis
Assumed
~0.53 psi/ft
Equilibrium value
Same for CH4 & N2
Additionally, well completion and operating parameters were examined for input into the model.
As described earlier, since the production wells had been restimulated in the mid-1990’s, skin factors for these wells was set at –2. Since the N2 injection wells were not stimulated, those skin
factors were set at a value of 0.
This watermark does not appear in the registered version - http://www.clicktoconvert.com
The independent parameter used for the reservoir model was gas production (and injection) rate to maintain material balance, and the dependent (history match) parameters were water
production rate, flowing pressures (producing and injecting), and gas composition. Note that only some of these data were available for some periods for some wells; whatever was available was used. In addition, reservoir pressure data was available for the new injector wells at the time
they were drilled (June, 1997), which was also used as a history-match data point.
A comparison of the actual versus model field gas rate is presented in Figure 14. Note that on this and all subsequent graphs, the orange curves represent the model results and the blue data points represent actual data. The only conclusion that can be derived from this result, since the
model was “driven” on gas rate, is that model (as constructed) was capable of delivering the gas volumes required.
Figure 14: Actual versus Simulated Field Gas Rate, Tiffany
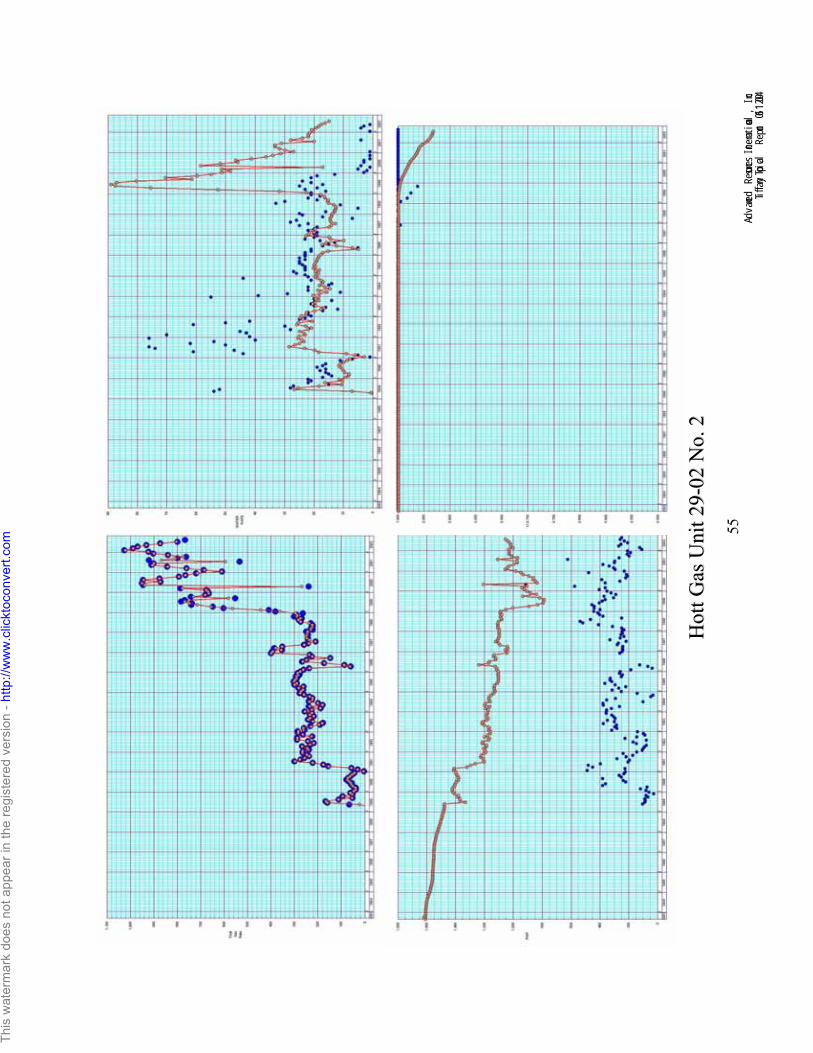
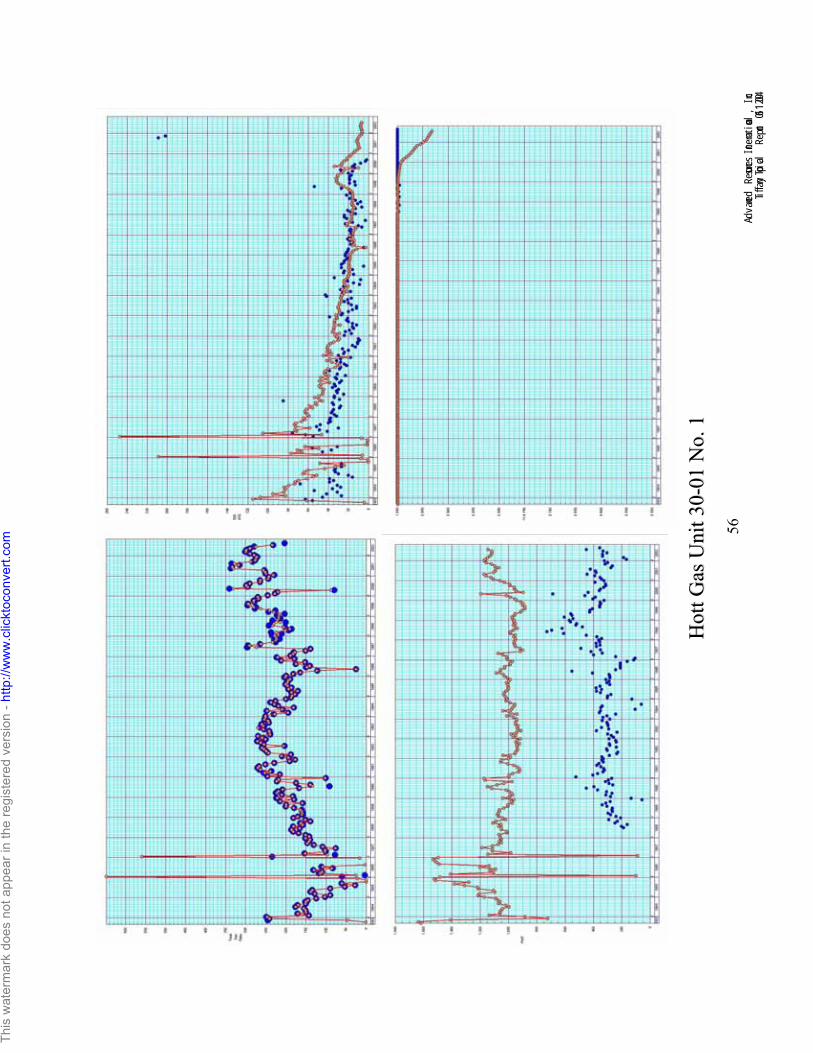
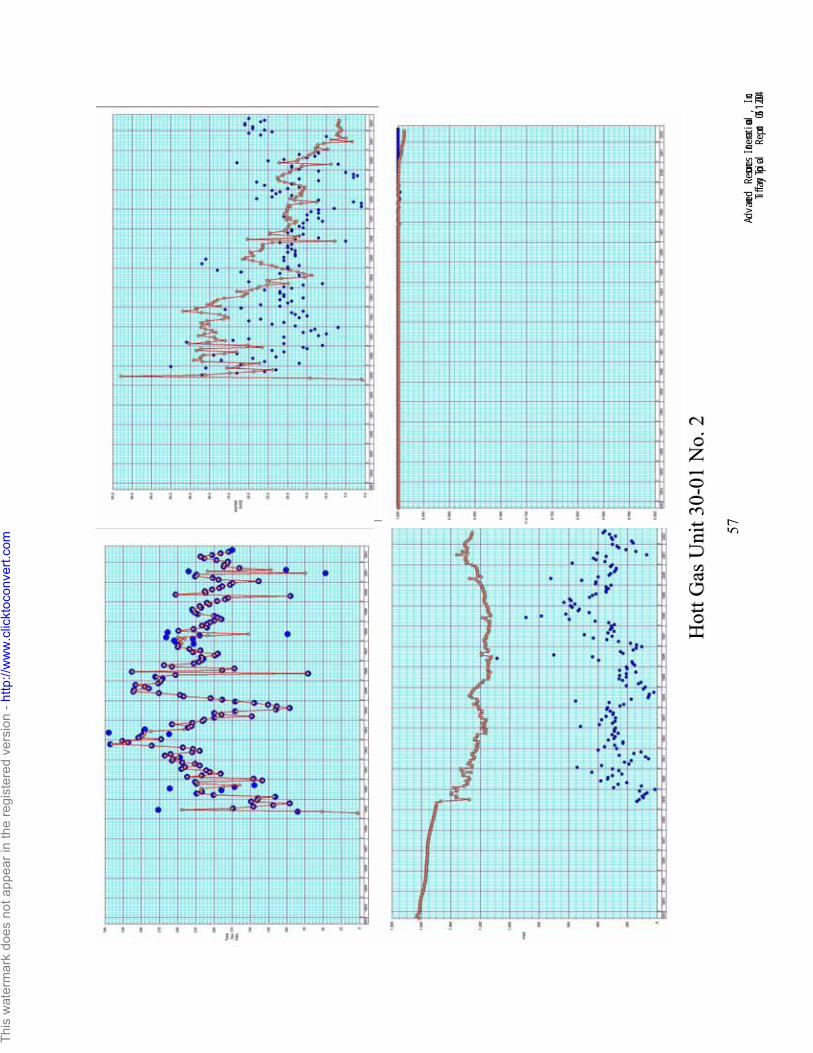
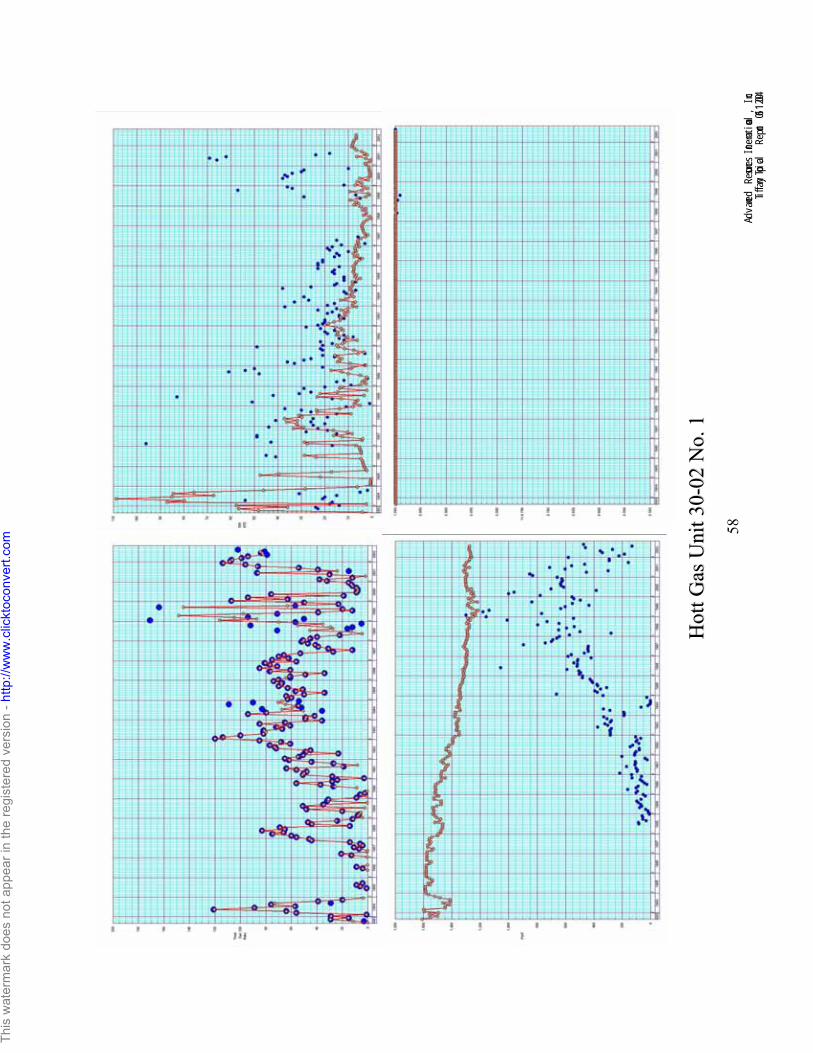
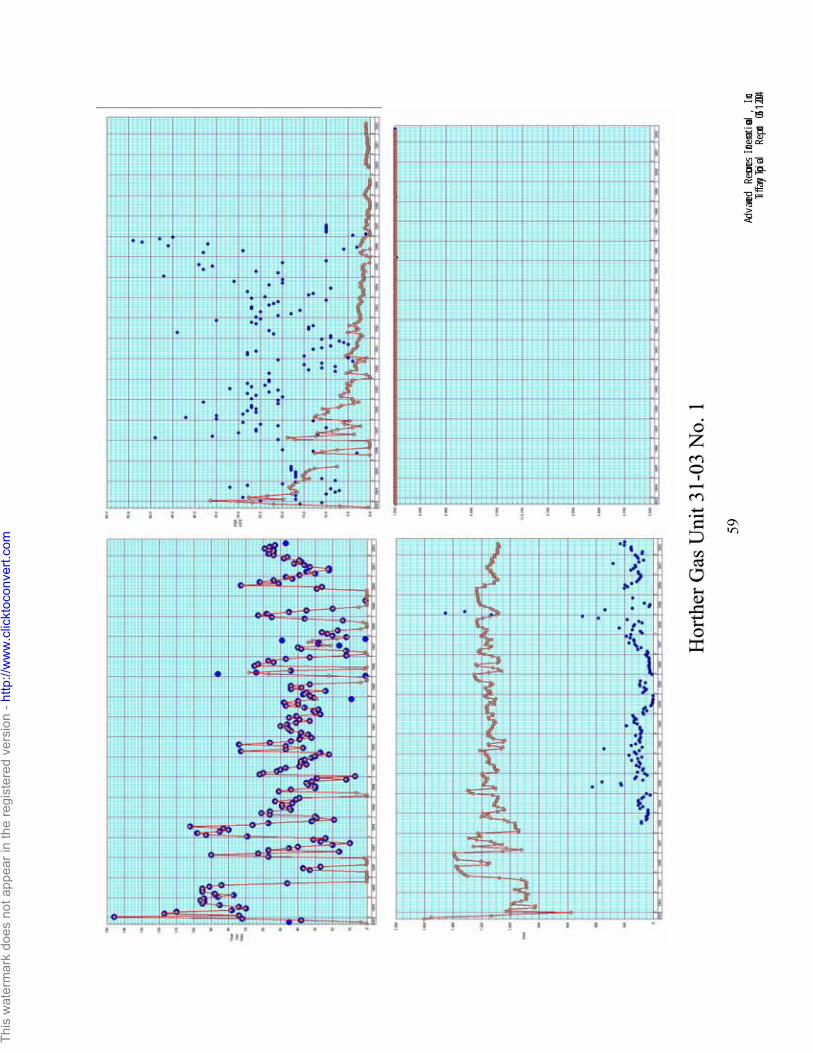
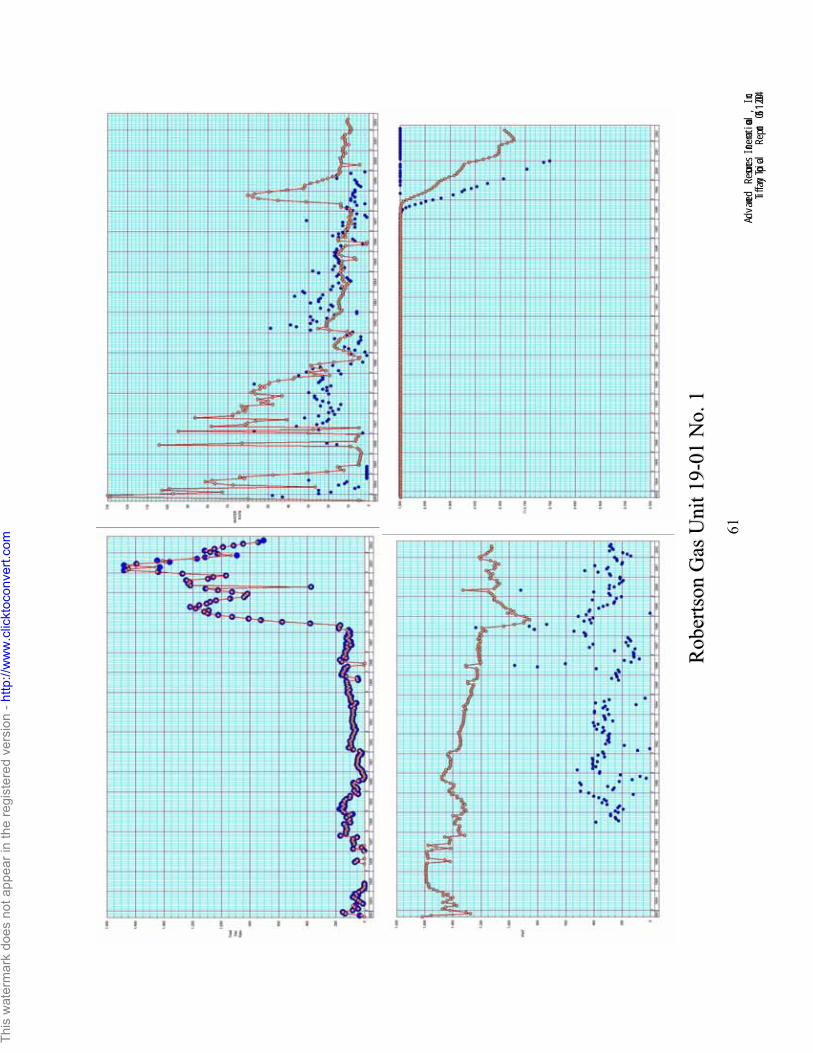
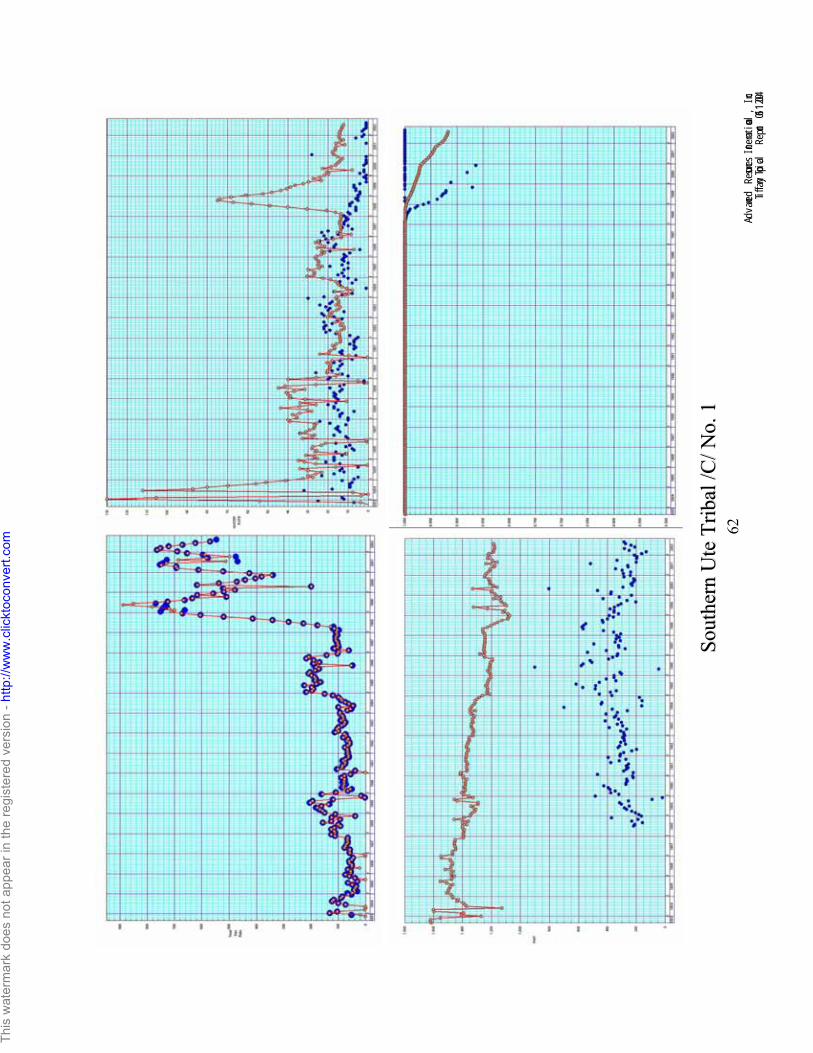
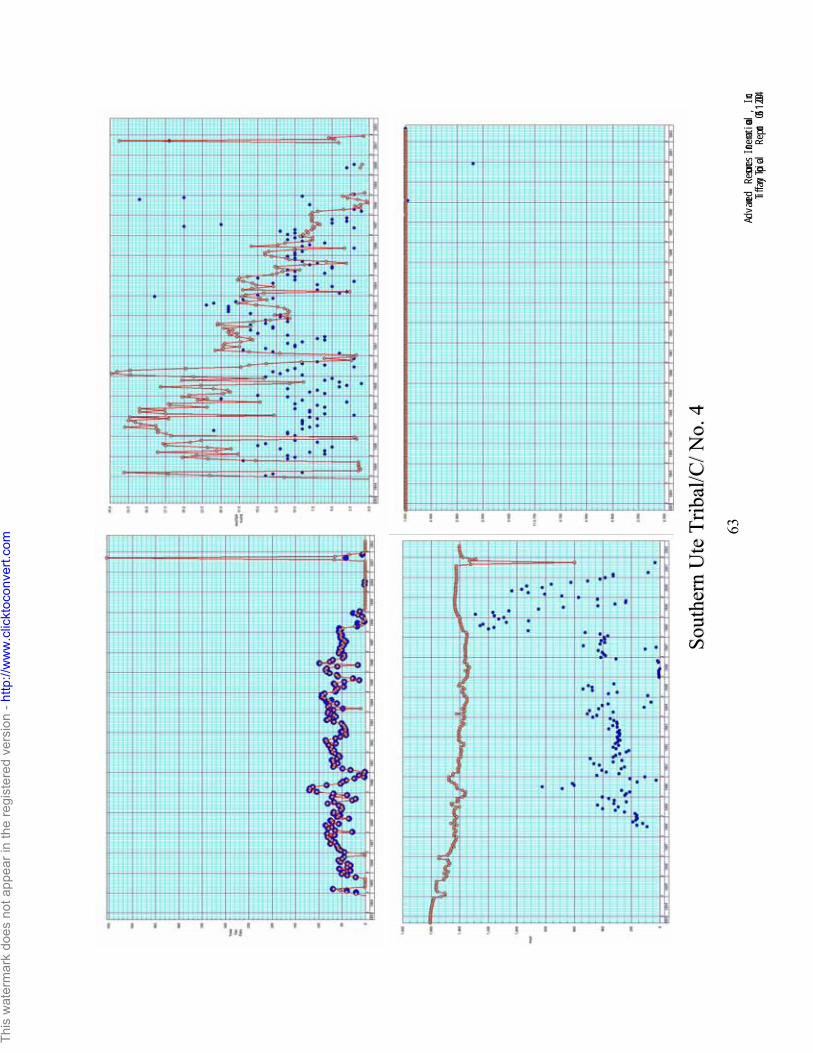
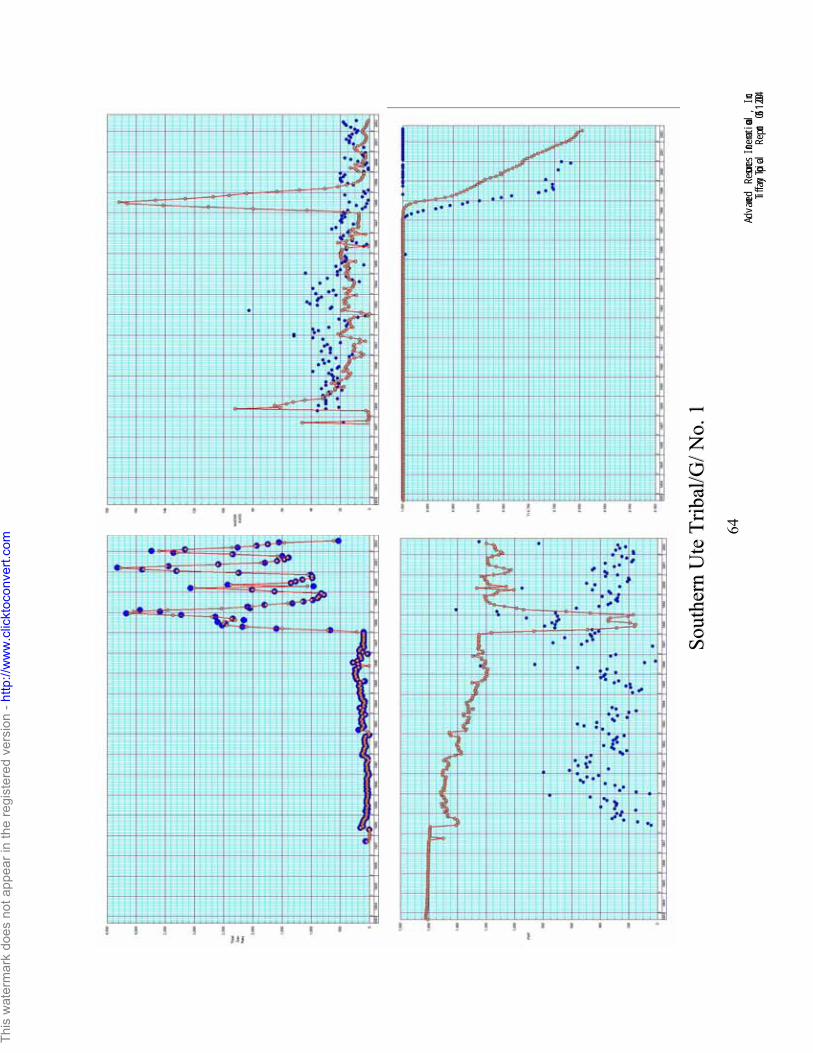
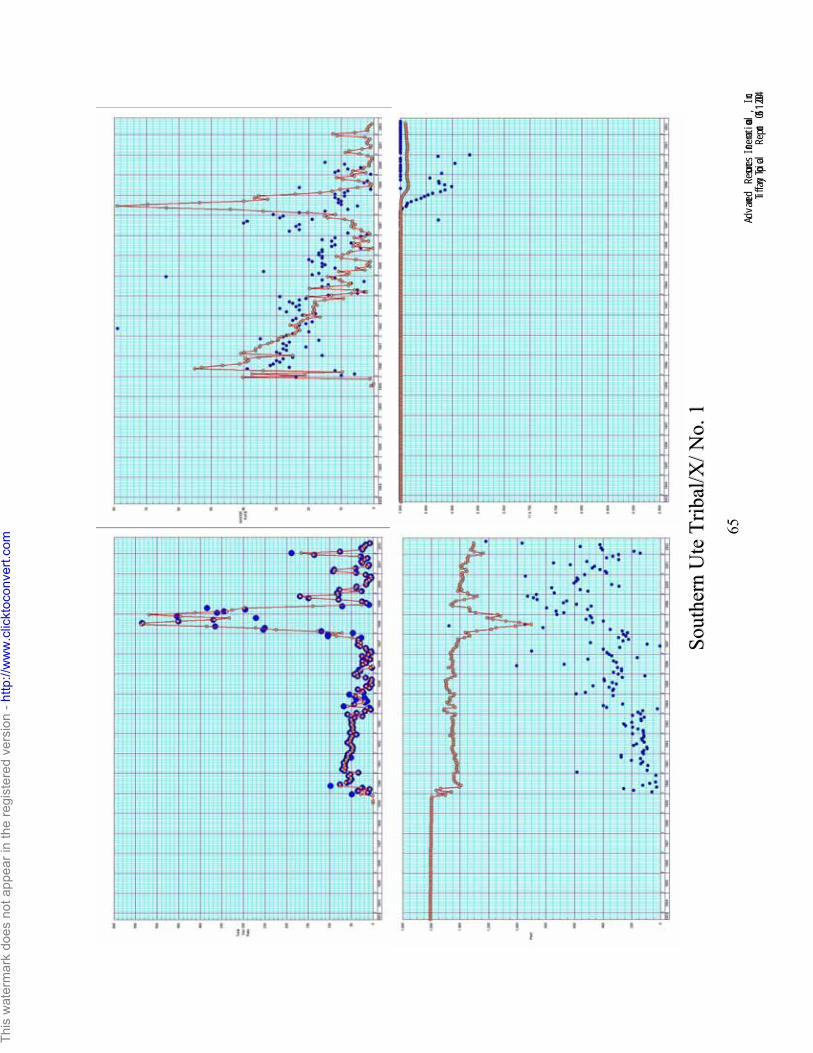
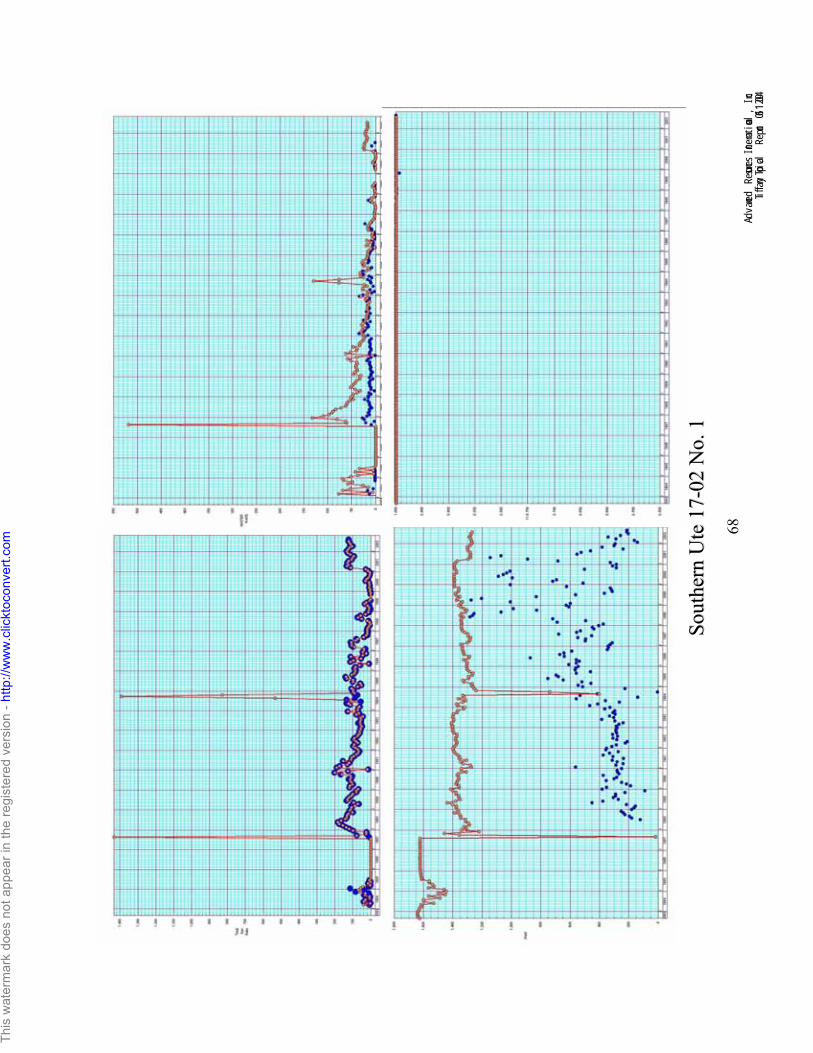
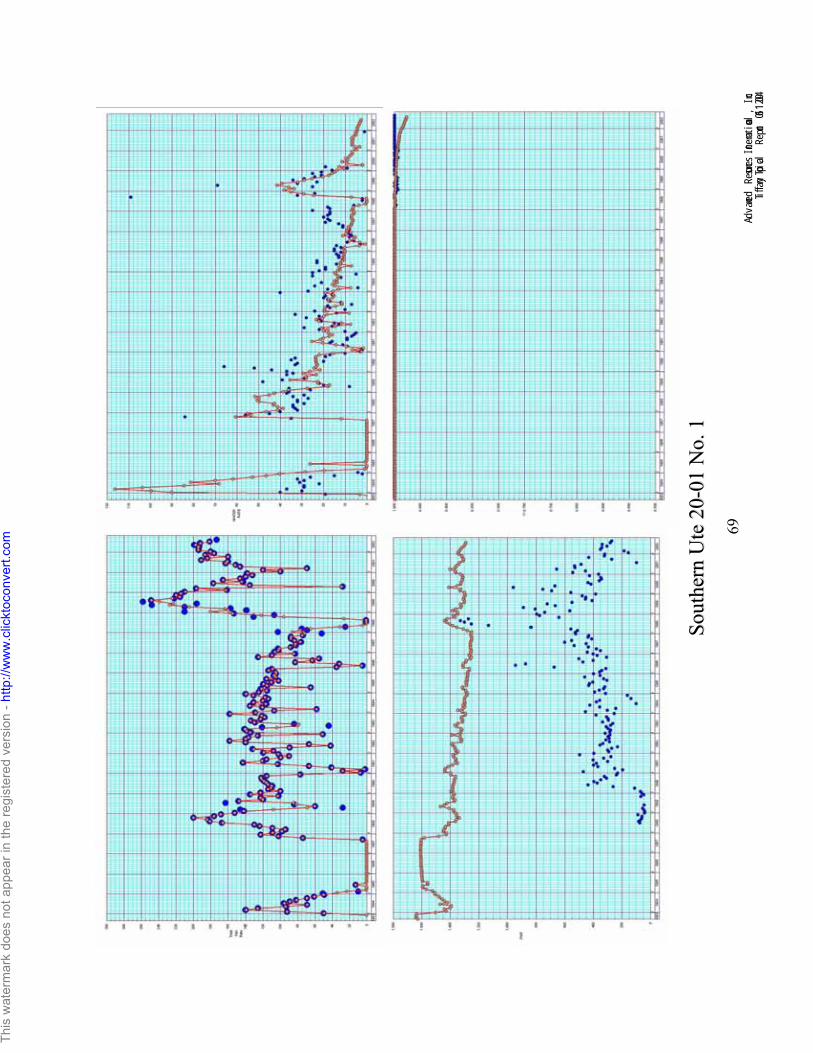
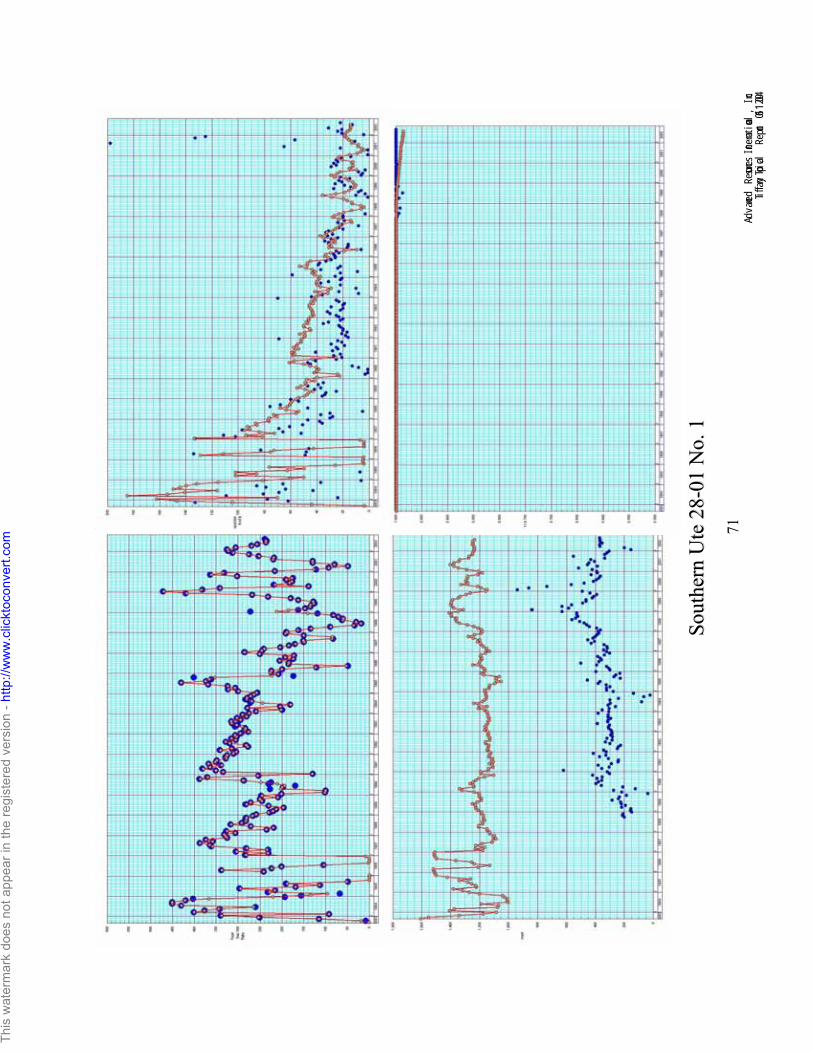
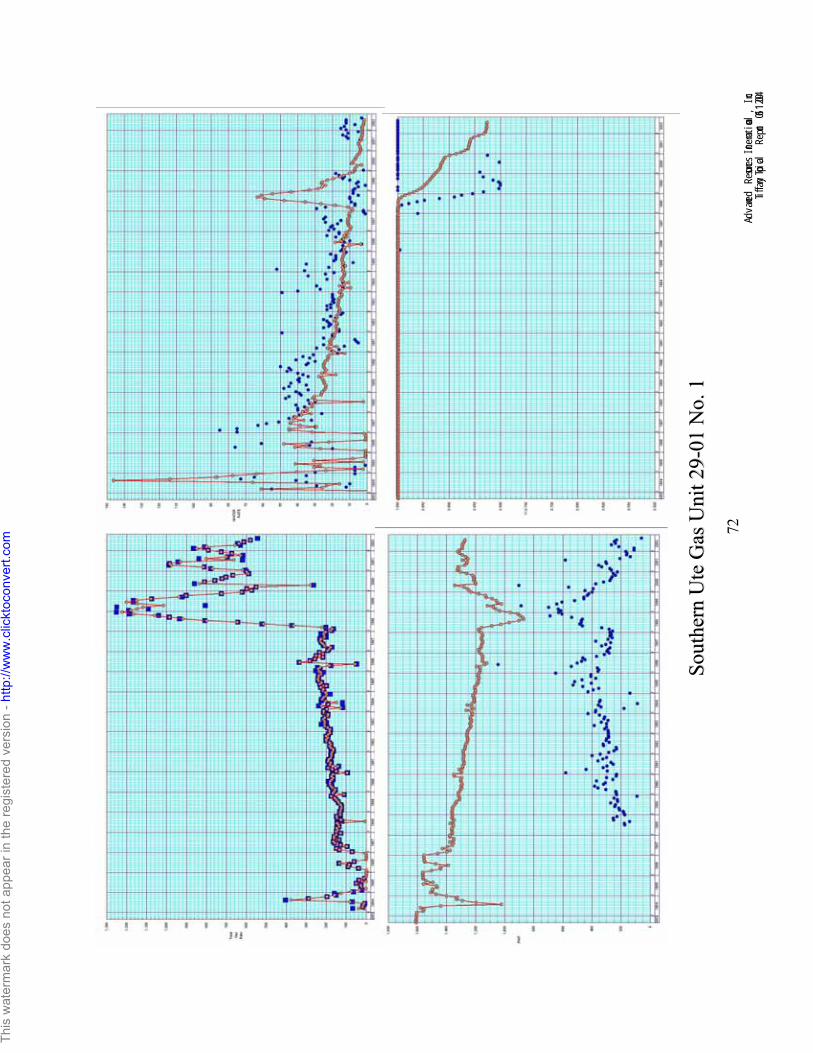
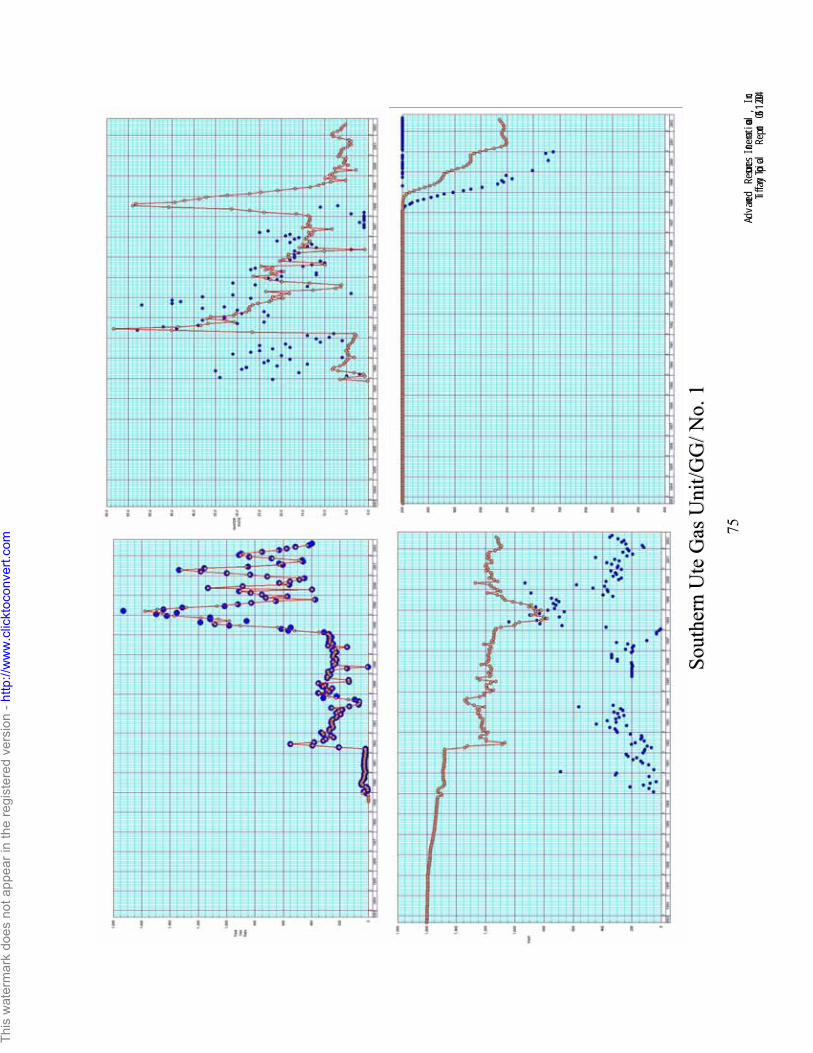
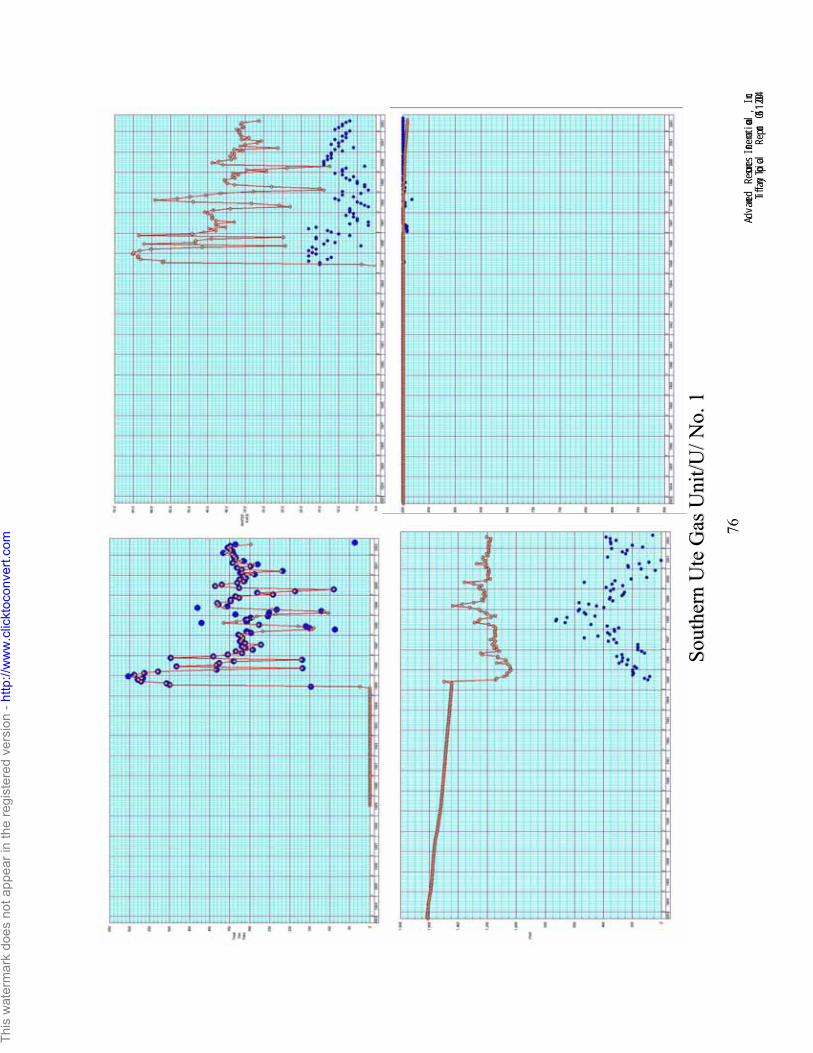
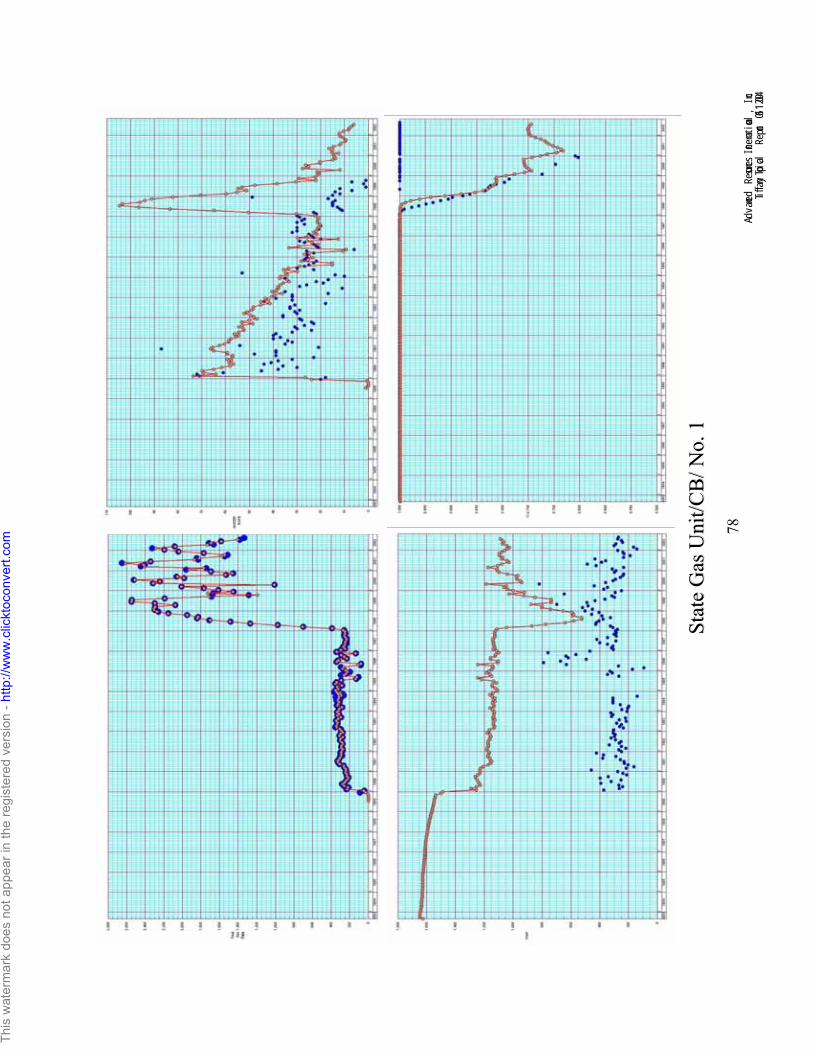
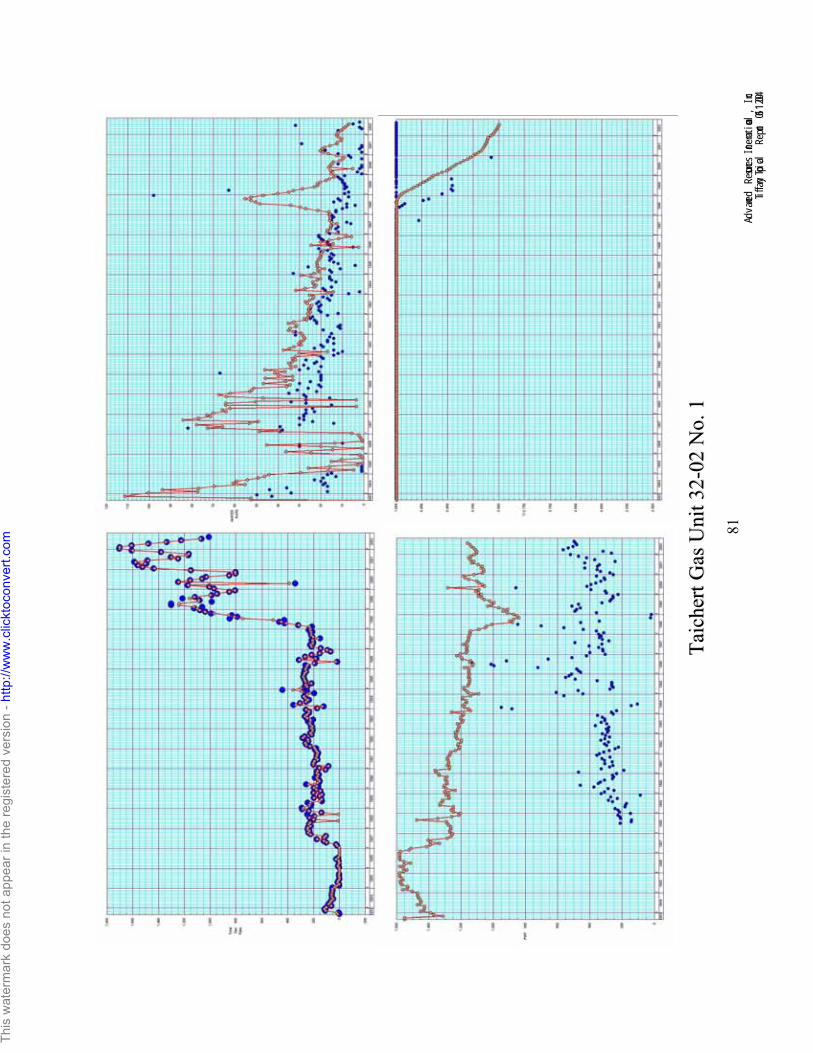
Comparison plots of gas rate, water rate, flowing pressure, and produced gas composition, for
five production wells, are presented in Figures 16 – 20. A map showing these specific well locations is provided in Figure 15. Note that these wells were randomly selected for illustration;a full set of comparison plots for all wells is provided in Appendix A.
Several general comments can be made regarding the results:
o The predicted water production rates are generally close to the actual rates, particularly in later times. BP notes that earlier water production data is suspect, whereas the latter data
is more reliable. Further, there is a noticeable increase in predicted water rates when gas rates increase due to N2 injection. This is because the model was driven on gas rate, and
This watermark does not appear in the registered version - http://www.clicktoconvert.com
water rates are tied to gas rates via the relative permeability relationship. However, no such trend is observed in the actual water rate data.
o The predicted to actual comparisons of produced gas composition matches are of variable
quality. In some cases, the predicted onset of gas breakthrough is earlier or later than actual, and increases either too quickly or slowly than actually observed in the field. There could be many reasons for this discrepancy. In other cases however they are quite
good.
o The predicted producing pressures are consistently and significantly higher than the actual values. This phenomenon was also observed in a separate, independent study of the field8. In addition, when N2 is injected and gas rates increase sharply, predicted
producing pressures decrease to achieve the increased gas rate. However, no such trend is observed in the field data. This suggests that the root causes of such a rapid and
significant increase in methane production are not being adequately represented in the model.
Figure 15: Locations of Wells Used for Comparison
This watermark does not appear in the registered version - http://www.clicktoconvert.com
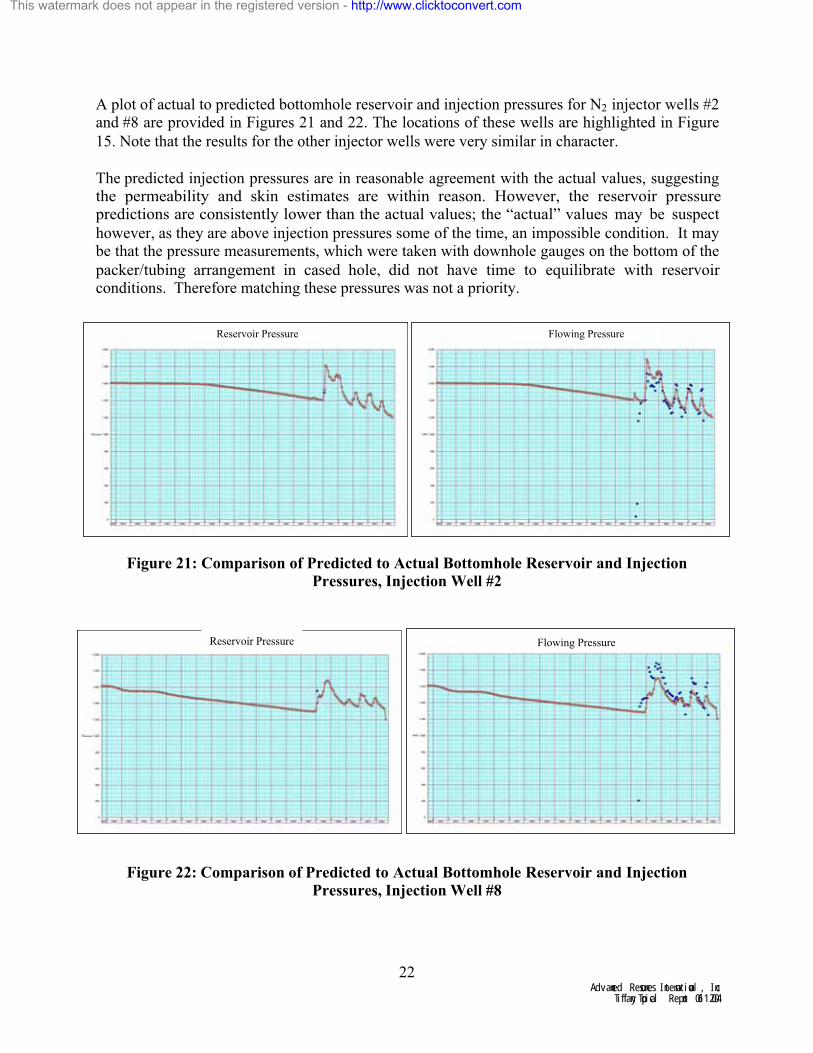
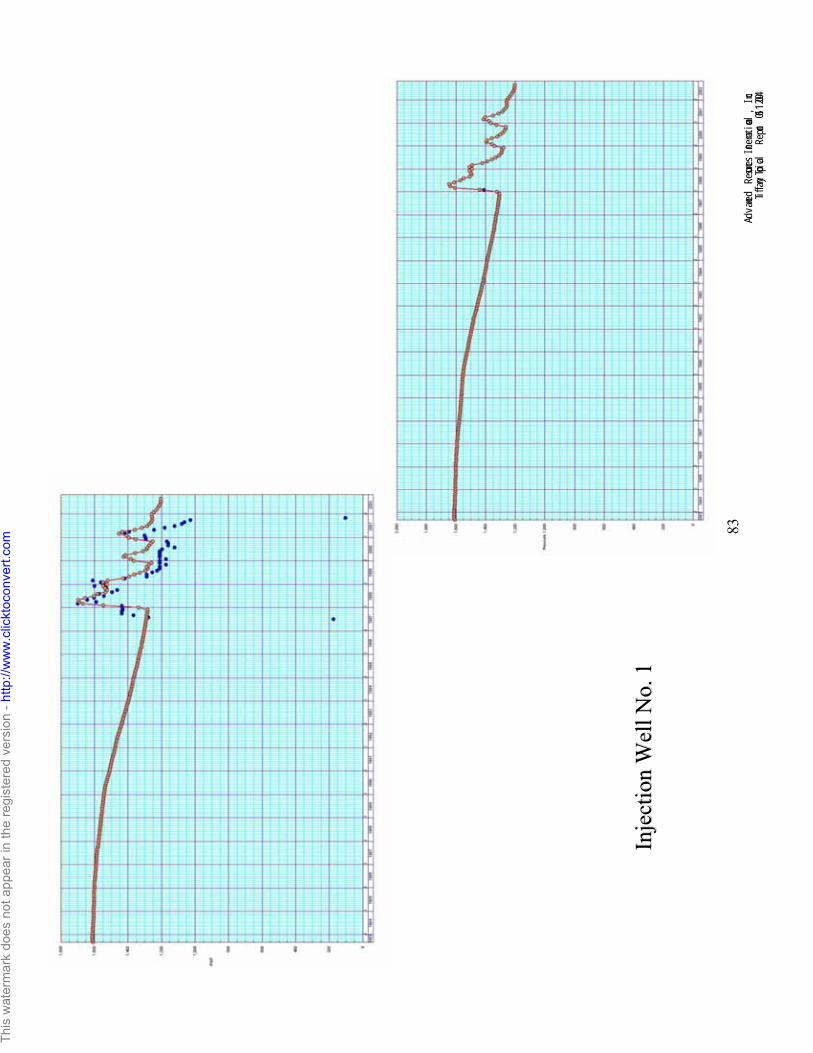
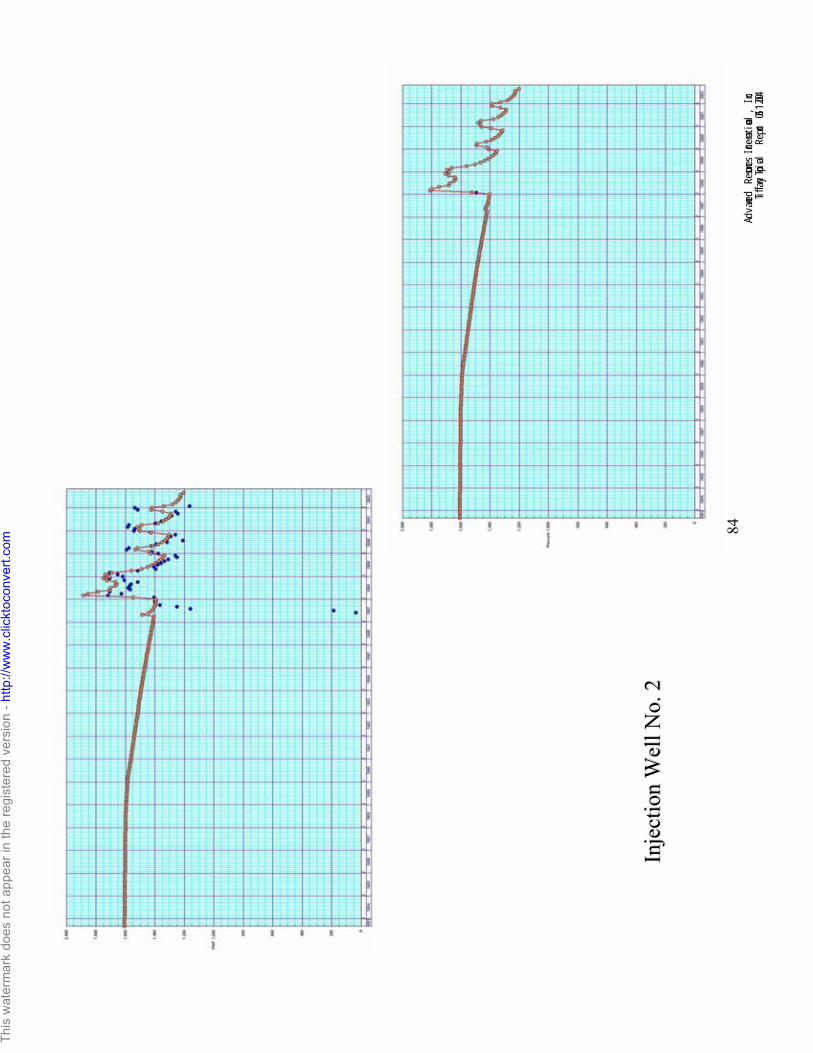
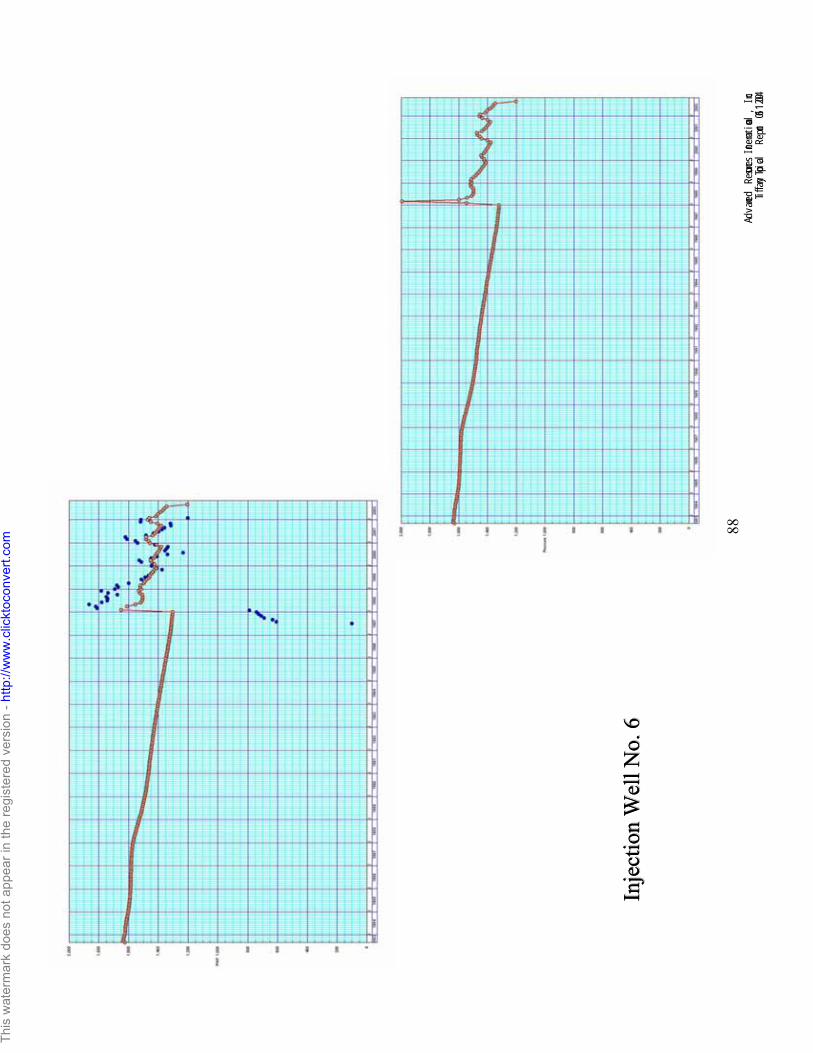
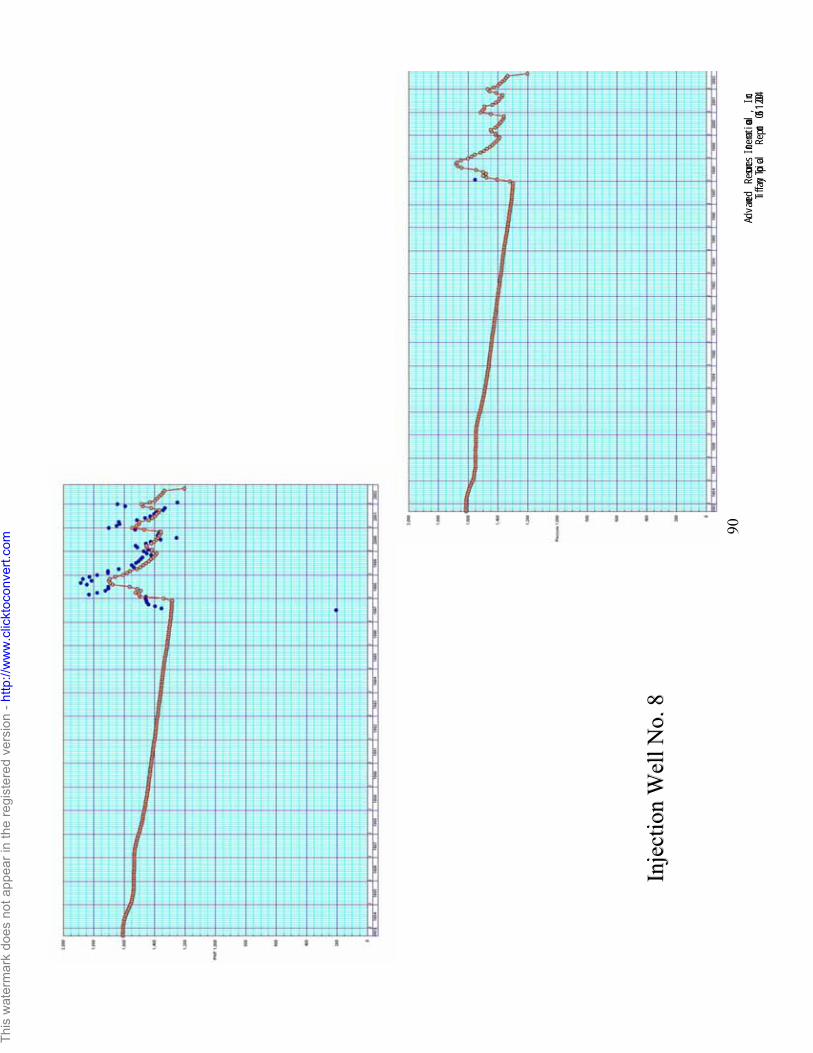
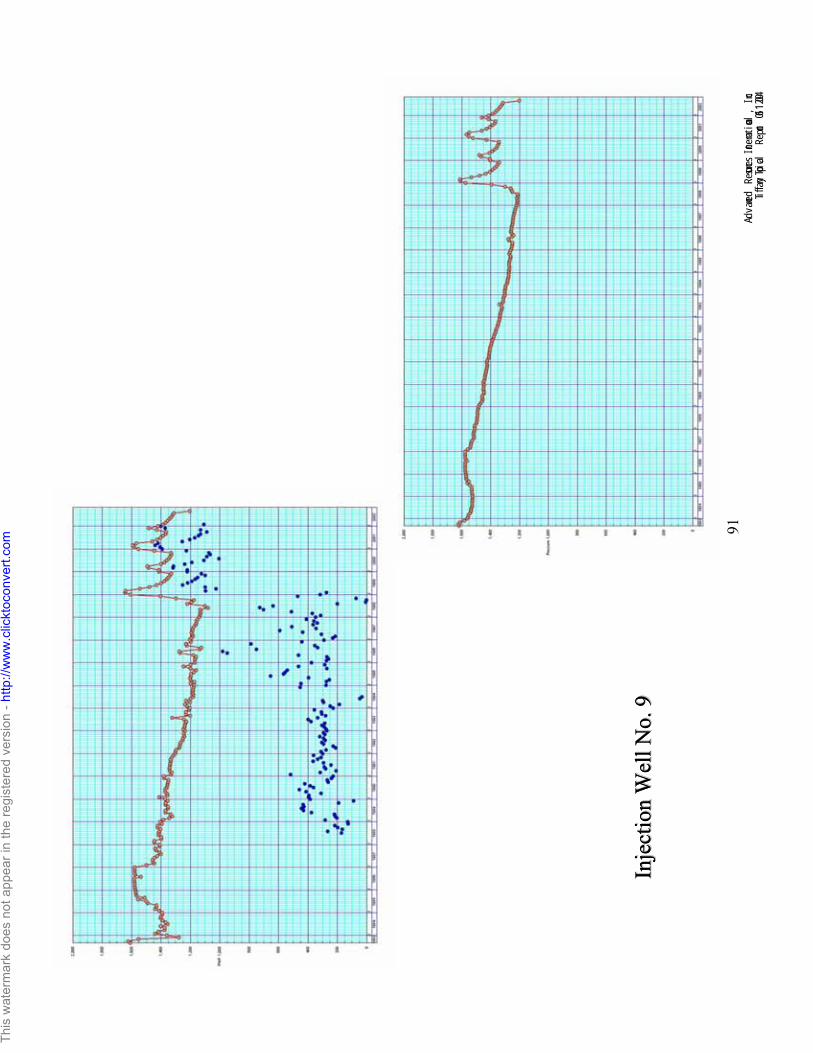
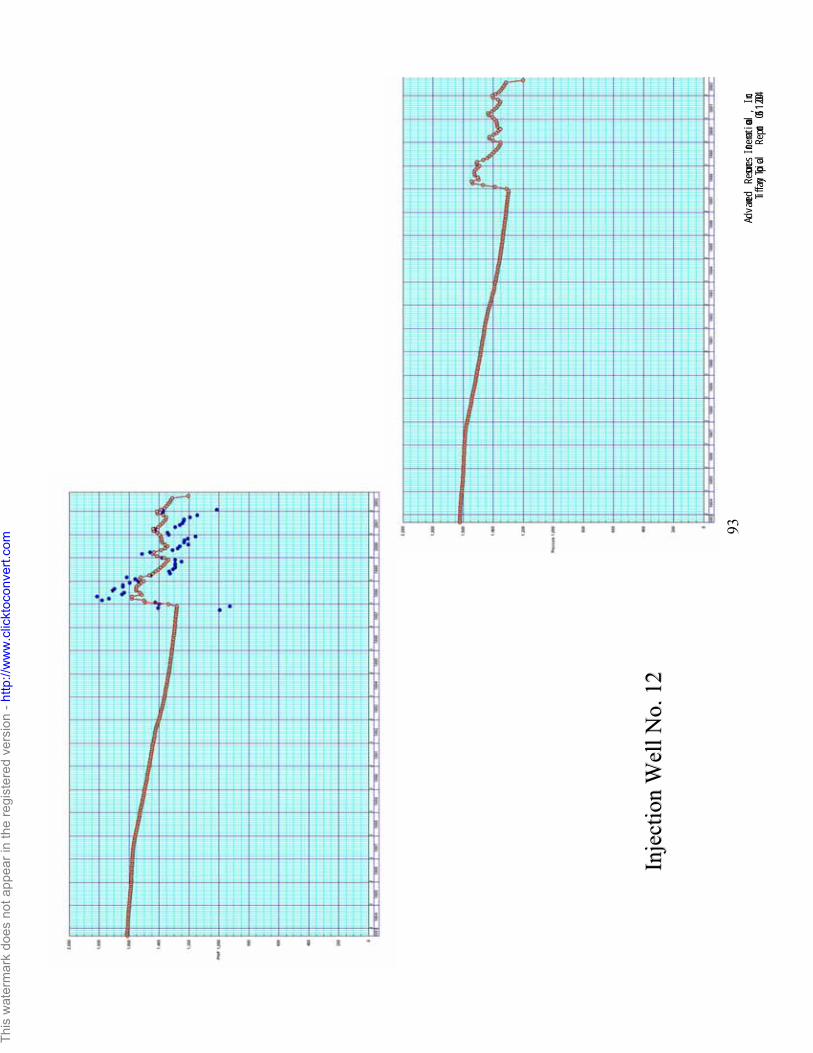
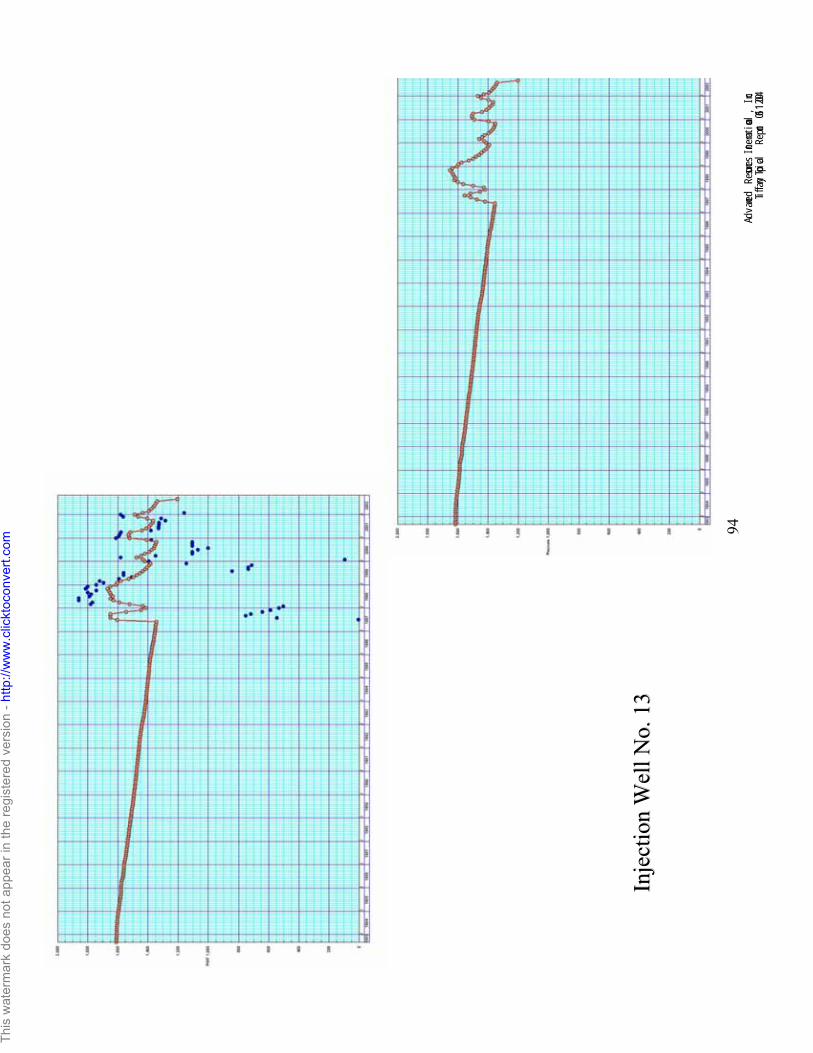
A plot of actual to predicted bottomhole reservoir and injection pressures for N2 injector wells #2 and #8 are provided in Figures 21 and 22. The locations of these wells are highlighted in Figure
15. Note that the results for the other injector wells were very similar in character.
The predicted injection pressures are in reasonable agreement with the actual values, suggesting the permeability and skin estimates are within reason. However, the reservoir pressure predictions are consistently lower than the actual values; the “actual” values may be suspect
however, as they are above injection pressures some of the time, an impossible condition. It may be that the pressure measurements, which were taken with downhole gauges on the bottom of the
packer/tubing arrangement in cased hole, did not have time to equilibrate with reservoir conditions. Therefore matching these pressures was not a priority.
Figure 21: Comparison of Predicted to Actual Bottomhole Reservoir and Injection
Pressures, Injection Well #2
Figure 22: Comparison of Predicted to Actual Bottomhole Reservoir and Injection
Pressures, Injection Well #8
This watermark does not appear in the registered version - http://www.clicktoconvert.com
Since the greatest discrepancy between the actual and simulated data was for the bottomhole producing pressures, this is where the history matching effort was focused. In parallel, attempts
were made to improve the quality of the N2 breakthrough and gas composition matches. The tactics used to accomplish these objectives were:
· Reduce permeability
· Evaluate effects of changes in permeability functions (i.e., Cm, Cp, n)
· Evaluate effects of vertical permeability variability and other degrees (higher and lower) of horizontal permeability anisotropy
· Evaluate effects of changes in relative permeability
· Increase skin factors in production wells
· Evaluate effects of changes in Langmuir constants
It should be noted that since the primary objective of the study was to understand the reservoir mechanisms at work in the N2-ECBM process, the focus was on making “global” parameter
changes and how they impacted overall model results vis-à-vis actual field performance. Regional variations in reservoir characterization were not attempted purely for the purpose of
achieving a match, absent independent data to justify such changes (however, all known reservoir data had already been incorporated into the model). While this approach may compromise the overall quality of the final match, it is more consistent with the objectives of the
study. In this case however, given the consistent discrepancy between actual and predicted flowing pressures, this approach was justified.
Unfortunately, none of the adjustments listed above materially improved the quality of the initial match. Notably, reductions in permeability and increases in skin factors provided only minor
decreases in flowing pressures at the producing wells, but not nearly to the degree required,suggesting this was not the root problem. Changes to horizontal and vertical permeability
heterogeneity tended to worsen the matches of nitrogen breakthrough time and N2 composition atthe production wells.
Further, to benchmark the COMET3 results, the same input data was used in the Computer Modeling Group’s GEM coalbed methane simulator, with essentially the same outcome. This
provided assurance that the modeling results were independent of simulator used, and implies that some reservoir phenomena may exist with ECBM operations that the existing CBM simulators currently do not adequately replicate.
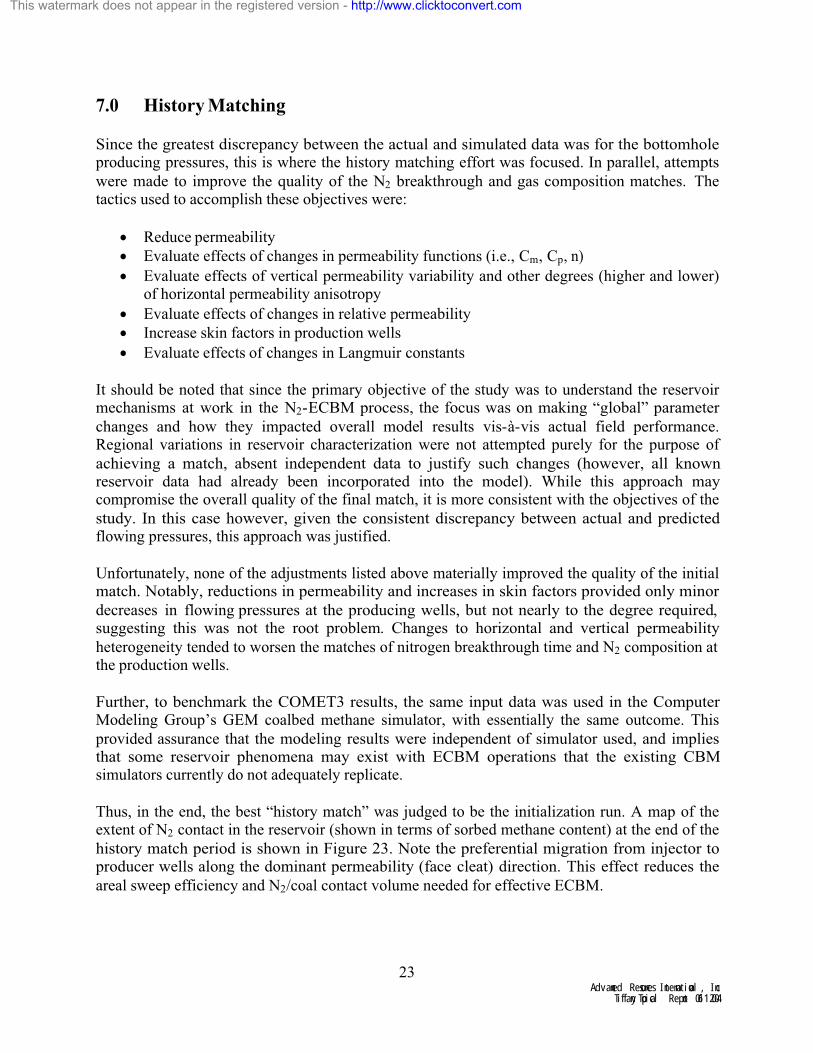
Thus, in the end, the best “history match” was judged to be the initialization run. A map of the extent of N2 contact in the reservoir (shown in terms of sorbed methane content) at the end of the
history match period is shown in Figure 23. Note the preferential migration from injector to producer wells along the dominant permeability (face cleat) direction. This effect reduces the
areal sweep efficiency and N2/coal contact volume needed for effective ECBM.
This watermark does not appear in the registered version - http://www.clicktoconvert.com
In order to evaluate the long-term performance of the ECBM pilot, under status quo conditions (i.e., no further N2 injection) as well as under other “what if” future injection scenarios,
performance prediction cases were simulated using the initialization run as the starting point. The specific cases evaluated included:
1. No N2 injection (i.e., primary production only).2. Current conditions (i.e., intermittent N2 injection until January 2002, and not resuming).
3. Intermittent future N2 injection, beginning in October, 2004.4. Continuous future N2 injection, beginning in July, 2004.
5. Continuous future CO2 injection, beginning in July, 2004.6. Continuous future CO2 injection beginning in July, 2004 together with intermittent N2
injection, beginning in October, 2004.
For each forecast case, the model assumed flowing bottomhole pressures approximately equal to
the last reported values for each well to achieve a smooth transition from history match to forecast periods. In addition, an economic limit of 50 Mcfd of methane and 50% N2 content per well was imposed; reaching those thresholds prompted the well in question to be shut- in in the
model. It is important to note that since the predicted production pressures in the model are too high, the ultimate recoveries for all cases are understated. However, the incremental recoveries,
which are of interest here, should be reasonably representative. A description of the results for each case is provided below.
Case #1: No N2 Injection
The baseline case assumed no N2 injection ever occurred, and that the field was produced solely
by primary pressure depletion though August of 2012 (10 years after the end of the history match period). Total methane recovery for this case was 29.5 Bcf, out of an original in-place value of
439 Bcf (active model area), for a recovery factor of 6.7% of the original gas in place (OGIP). Note that < 0.1 Bcf of in-situ N2 was also produced in this case. The final average reservoir pressure for this case was 1240 psi.
Case #2: Current Conditions
This case assumes the actual field conditions to date, specifically intermittent N2 injection from May 1997 until January 2002, according to actual volumes and rates, but with no further
injection through the forecast end date of August 2012.
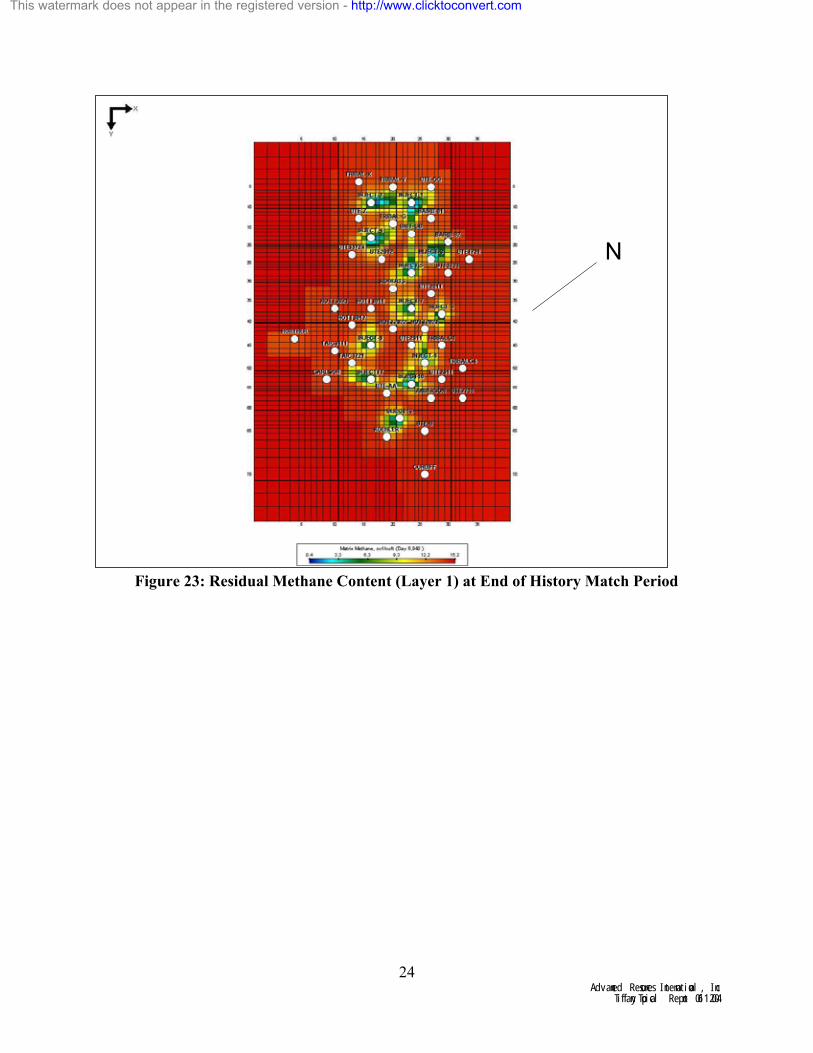
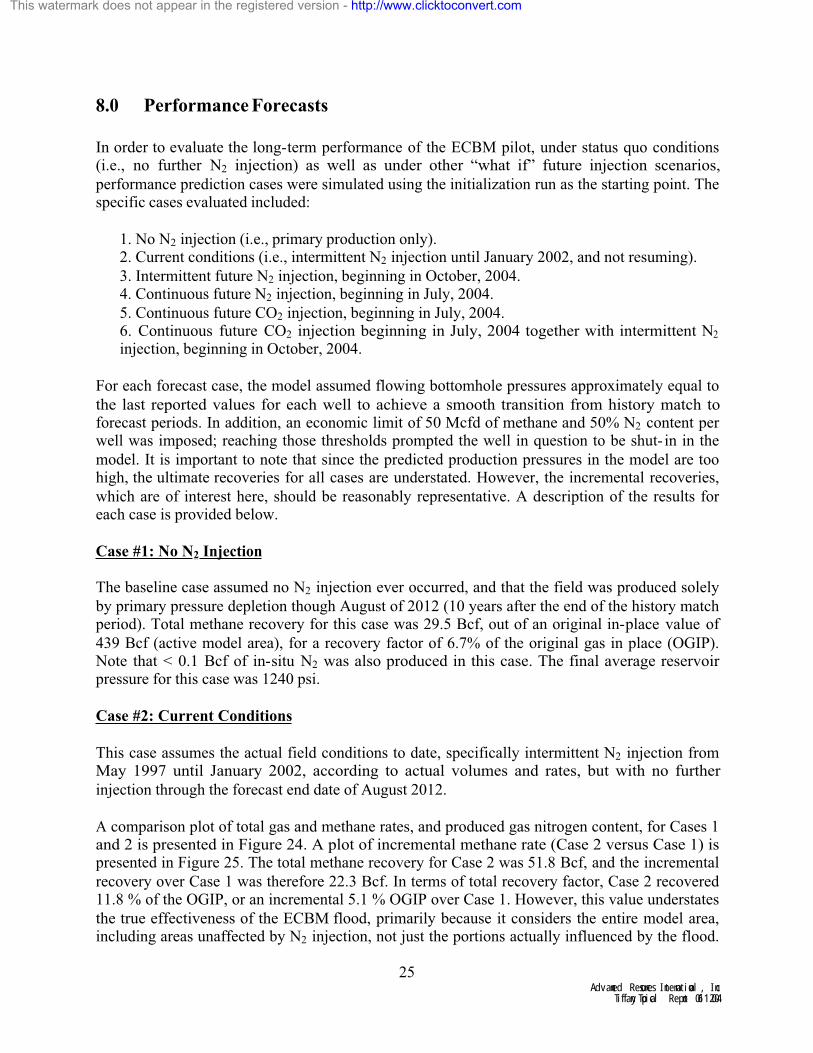
A comparison plot of total gas and methane rates, and produced gas nitrogen content, for Cases 1 and 2 is presented in Figure 24. A plot of incremental methane rate (Case 2 versus Case 1) is presented in Figure 25. The total methane recovery for Case 2 was 51.8 Bcf, and the incremental
recovery over Case 1 was therefore 22.3 Bcf. In terms of total recovery factor, Case 2 recovered 11.8 % of the OGIP, or an incremental 5.1 % OGIP over Case 1. However, this value understates
the true effectiveness of the ECBM flood, primarily because it considers the entire model area, including areas unaffected by N2 injection, not just the portions actually influenced by the flood.
This watermark does not appear in the registered version - http://www.clicktoconvert.com
Figure 26 illustrates the residual methane content in layer 1 at the end of this forecast. Note that large peripheral areas of the model are unswept by nitrogen. The final average reservoir pressure
for this case was 1168 psi.
0
5,000
10,000
15,000
20,000
25,000
30,000
0 2000 4000 6000 8000 10000
Time (Days)
Gas R
ate
, M
scfd
0
10
20
30
40
50
60
70
80
90
100
Nit
rog
en
Co
nte
nt,
%
Total CH4 Produced-Case 2 Total CH4 Produced-Case 1
Produced Gas Nitrogen Content-Case 2
Figure 24: Methane Production and Nitrogen Content, Cases 1 and 2
Figure 25: Incremental Methane Production, Case 2 versus Case 1
0
5,000
10,000
15,000
20,000
25,000
0 50 100 150 200
Months after initial injection
Ga
s R
ate
, M
sc
fd
This watermark does not appear in the registered version - http://www.clicktoconvert.com
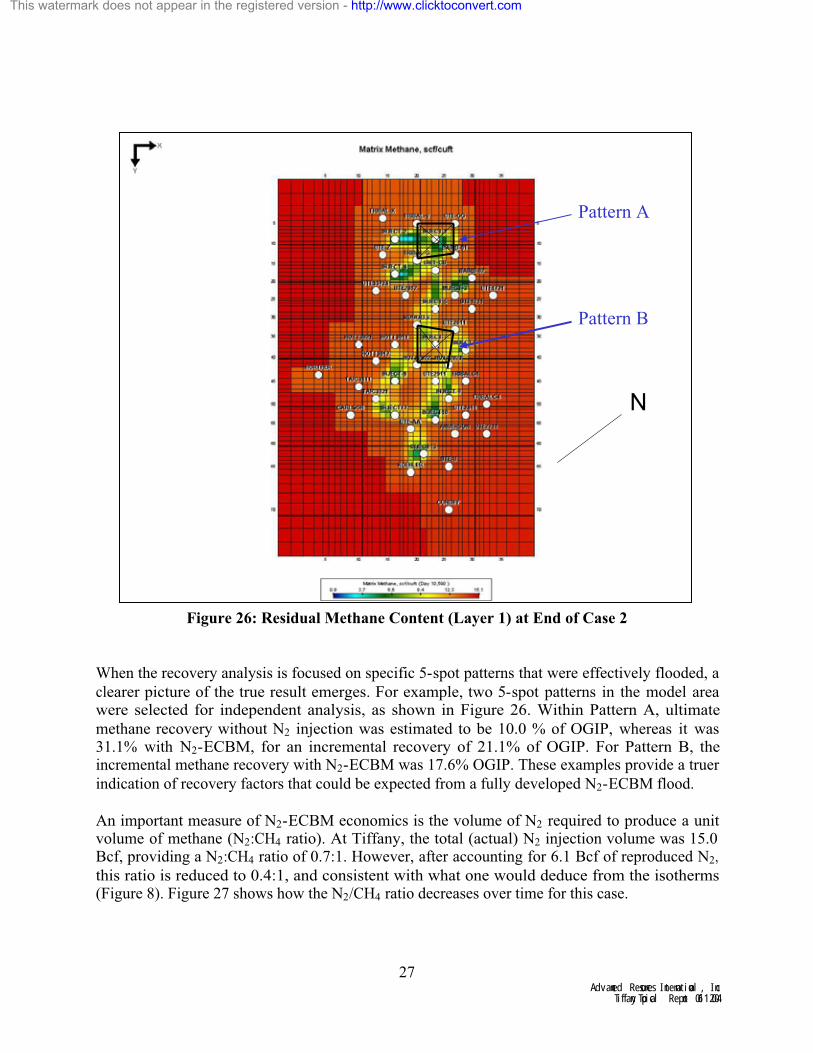
Figure 26: Residual Methane Content (Layer 1) at End of Case 2
When the recovery analysis is focused on specific 5-spot patterns that were effectively flooded, a
clearer picture of the true result emerges. For example, two 5-spot patterns in the model area were selected for independent analysis, as shown in Figure 26. Within Pattern A, ultimate
methane recovery without N2 injection was estimated to be 10.0 % of OGIP, whereas it was 31.1% with N2-ECBM, for an incremental recovery of 21.1% of OGIP. For Pattern B, the incremental methane recovery with N2-ECBM was 17.6% OGIP. These examples provide a truer
indication of recovery factors that could be expected from a fully developed N2-ECBM flood.
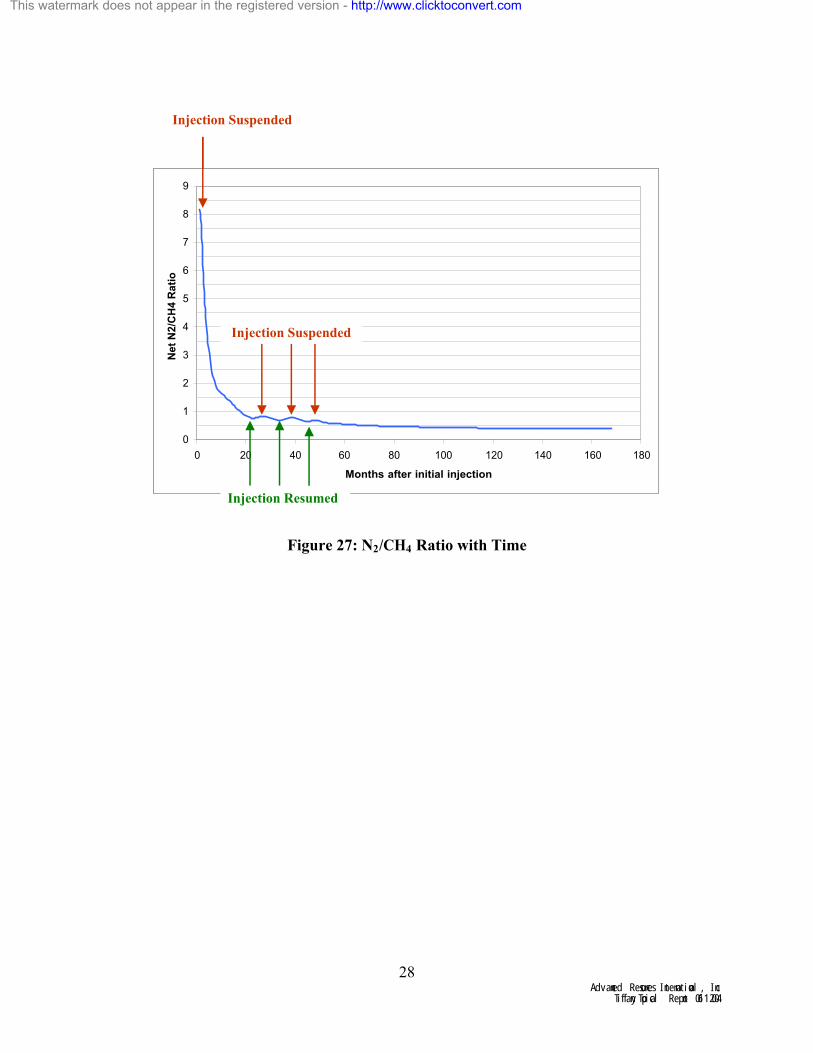
An important measure of N2-ECBM economics is the volume of N2 required to produce a unit volume of methane (N2:CH4 ratio). At Tiffany, the total (actual) N2 injection volume was 15.0Bcf, providing a N2:CH4 ratio of 0.7:1. However, after accounting for 6.1 Bcf of reproduced N2,
this ratio is reduced to 0.4:1, and consistent with what one would deduce from the isotherms (Figure 8). Figure 27 shows how the N2/CH4 ratio decreases over time for this case.
This watermark does not appear in the registered version - http://www.clicktoconvert.com
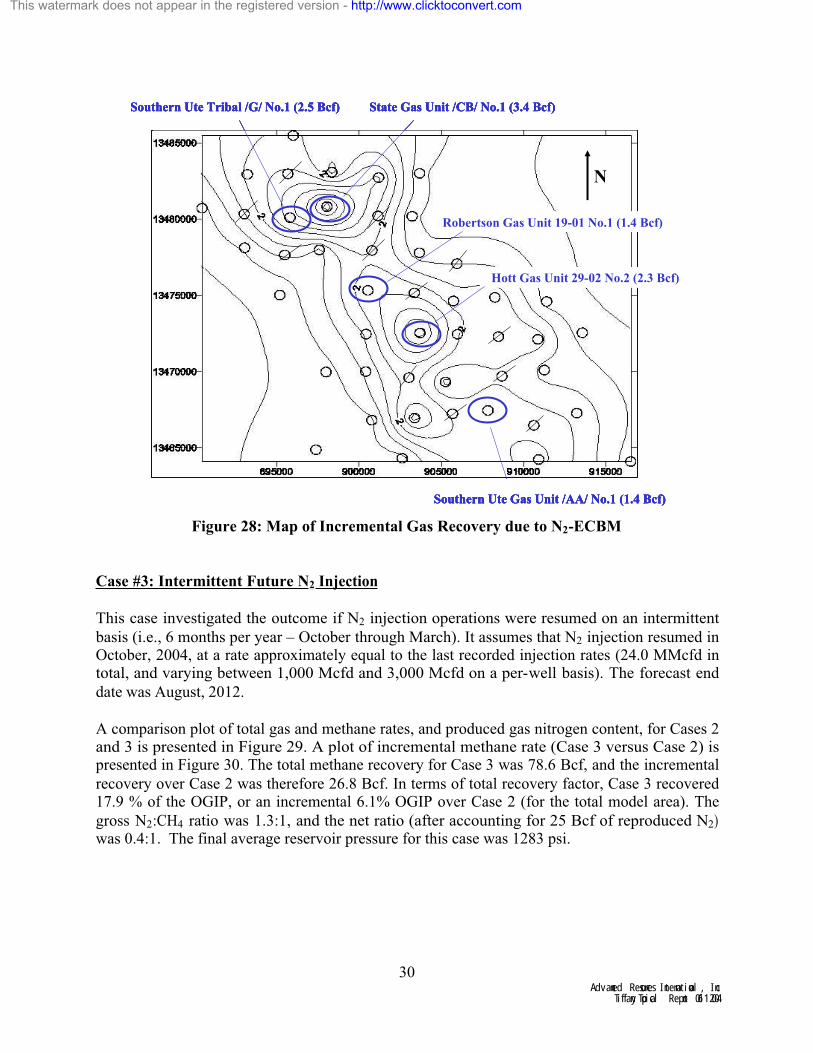
Finally, Table 3 provides the incremental methane recoveries on an individual well basis for this case. A map of incremental methane recovery due to N2-ECBM is provided in Figure 28, which
also highlights the five wells with the greatest incremental recovery. Note the trend of high recovery along the center of the pattern and trending in the face cleat (dominant permeability)
direction.
Table 3: Incremental Recoveries by Well, Case 2 versus Case 1
Cum CH4 Produced Cum CH4 Produced Incremental CH4
w/o Injection (Bcf) w/ Injection (Bcf) (Bcf)
Unit CB 1.93 5.34 3.41
Tribal G 0.71 3.25 2.54
Hott 2922 2.01 4.31 2.30
Ute AA 0.37 1.81 1.44
Robertson 1.02 2.45 1.43
Taic 3221 1.84 3.22 1.38
Tribal Y 0.81 2.11 1.30
Koehler 0.94 2.19 1.25
Ute 2911 0.92 2.02 1.10
Baird 02 2.03 3.11 1.08
Hott 2021 0.69 1.73 1.04
Ute GG 1.42 2.12 0.70
Ute 2912 0.21 0.85 0.64
Tribal C1 1.29 1.86 0.57
Com BZ 1 0.42 0.85 0.43
Ute 2011 0.45 0.69 0.24
Tribal X 0.13 0.34 0.21
Hott 3012 0.87 1.07 0.20
Ute Z 0.39 0.57 0.18
Anderson 0.62 0.78 0.16
Ute2811 1.67 1.81 0.14
Hott 3011 1.41 1.55 0.14
Ute U 1.25 1.39 0.14
Ute 1711 0.48 0.61 0.13
Hott 3021 0.27 0.33 0.06
Baird 01 1.28 1.33 0.05
Ute 1721 0.62 0.63 0.01
Ute 33724 0.24 0.25 0.01
Ute 2711 0.28 0.29 0.01
Cundiff 0.24 0.24 0.00
Carlson 0.31 0.31 0.00
Taic 3111 0.37 0.37 0.00
Horther 0.45 0.45 0.00
Tribal C4 0.30 0.30 0.00
Total 28.24 50.53 22.29
Avg/Well 0.83 1.49 0.66
Well
This watermark does not appear in the registered version - http://www.clicktoconvert.com
Southern Ute Tribal /G/ No.1 (2.5 Bcf) State Gas Unit /CB/ No.1 (3.4 Bcf)
Robertson Gas Unit 19-01 No.1 (1.4 Bcf)
Hott Gas Unit 29-02 No.2 (2.3 Bcf)
Southern Ute Gas Unit /AA/ No.1 (1.4 Bcf)
N
Southern Ute Tribal /G/ No.1 (2.5 Bcf) State Gas Unit /CB/ No.1 (3.4 Bcf)
Robertson Gas Unit 19-01 No.1 (1.4 Bcf)
Hott Gas Unit 29-02 No.2 (2.3 Bcf)
Southern Ute Gas Unit /AA/ No.1 (1.4 Bcf)
N
Southern Ute Tribal /G/ No.1 (2.5 Bcf) State Gas Unit /CB/ No.1 (3.4 Bcf)
Robertson Gas Unit 19-01 No.1 (1.4 Bcf)
Hott Gas Unit 29-02 No.2 (2.3 Bcf)
Southern Ute Gas Unit /AA/ No.1 (1.4 Bcf)
N
Southern Ute Tribal /G/ No.1 (2.5 Bcf) State Gas Unit /CB/ No.1 (3.4 Bcf)
Robertson Gas Unit 19-01 No.1 (1.4 Bcf)
Hott Gas Unit 29-02 No.2 (2.3 Bcf)
Southern Ute Gas Unit /AA/ No.1 (1.4 Bcf)
N
Figure 28: Map of Incremental Gas Recovery due to N2-ECBM
Case #3: Intermittent Future N2 Injection
This case investigated the outcome if N2 injection operations were resumed on an intermittent
basis (i.e., 6 months per year – October through March). It assumes that N2 injection resumed in October, 2004, at a rate approximately equal to the last recorded injection rates (24.0 MMcfd in total, and varying between 1,000 Mcfd and 3,000 Mcfd on a per-well basis). The forecast end
date was August, 2012.
A comparison plot of total gas and methane rates, and produced gas nitrogen content, for Cases 2 and 3 is presented in Figure 29. A plot of incremental methane rate (Case 3 versus Case 2) is presented in Figure 30. The total methane recovery for Case 3 was 78.6 Bcf, and the incremental
recovery over Case 2 was therefore 26.8 Bcf. In terms of total recovery factor, Case 3 recovered 17.9 % of the OGIP, or an incremental 6.1% OGIP over Case 2 (for the total model area). The
gross N2:CH4 ratio was 1.3:1, and the net ratio (after accounting for 25 Bcf of reproduced N2)was 0.4:1. The final average reservoir pressure for this case was 1283 psi.
This watermark does not appear in the registered version - http://www.clicktoconvert.com
Figure 29: Methane Rates and Nitrogen Content, Cases 2 and 3
Figure 30: Incremental Methane Rate, Case 3 versus Case 2
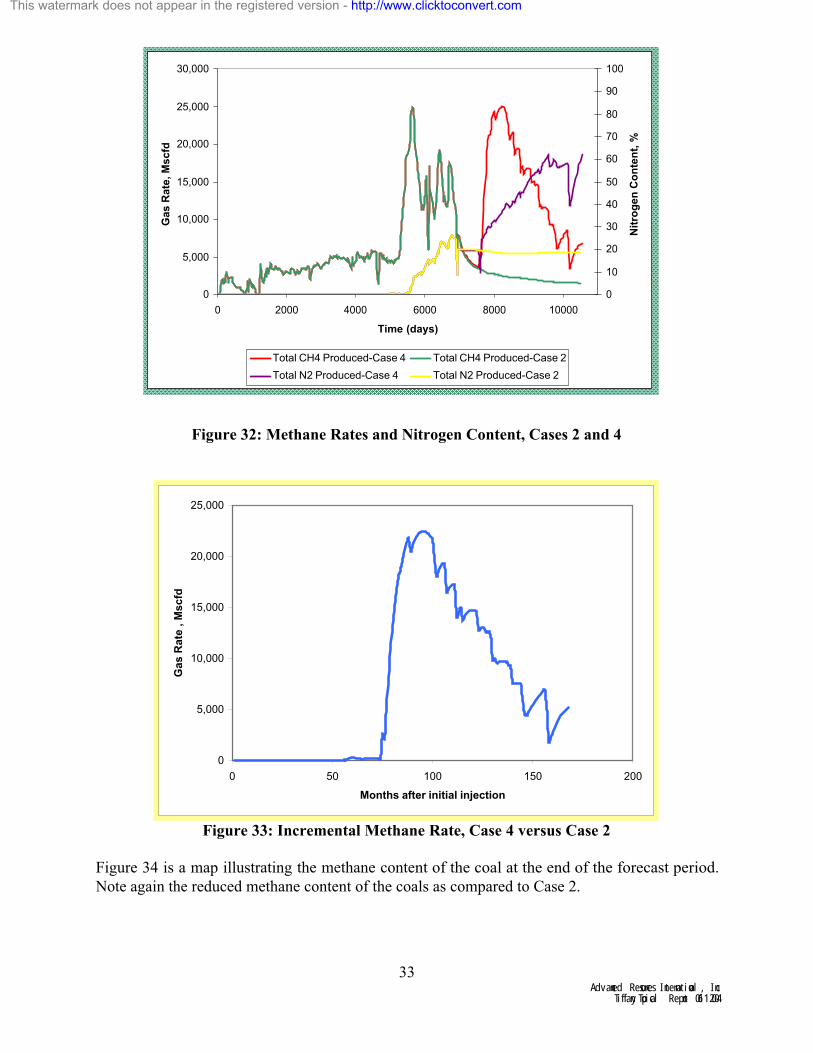
Figure 31 is a map illustrating the coal methane content at the end of the forecast period. Note the reduced methane content of the coals as compared to Case 2.
0
5,000
10,000
15,000
20,000
25,000
30,000
0 2000 4000 6000 8000 10000
Time (days)
Ga
s R
ate
, M
sc
fd
0
10
20
30
40
50
60
70
80
90
100
Nit
rog
en
Co
nte
nt,
%
Total CH4 Produced-Case 3 Total CH4 Produced-Case 2
Nitrogen Content-Case 2 Nitrogen Content-Case 3
This watermark does not appear in the registered version - http://www.clicktoconvert.com
Figure 31: Residual Methane Content (Layer 1) and End of Case 3
Case #4: Continuous Future N2 Injection
This case investigated the outcome if N2 injection operations were resumed on a continuous base.
It assumes that N2 injection resumed in July, 2004, at a continuous and constant rate approximately equal to the last recorded injection rates (24.0 MMcfd in total, and varying
between 1,000 Mcfd and 3,000 Mcfd on a per-well basis). The forecast end date was August, 2012.
A comparison plot of total gas and methane rates, and produced gas nitrogen content, for Cases 2 and 4 is presented in Figure 32. A plot of incremental methane rate (Case 4 versus Case 2) is
presented in Figure 33. The total methane recovery for Case 4 was 87.9 Bcf, and the incremental recovery over Case 2 was therefore 36.1 Bcf. In terms of total recovery factor, Case 4 recovered 20.0 % of the OGIP, or an incremental 8.2 % OGIP over Case 2 (for the total model area). The
gross N2:CH4 ratio was 1.9:1, and the net ratio (after accounting for 40.0 Bcf of reproduced N2)was 0.9:1. The final average reservoir pressure for this case was 1775 psi.
This watermark does not appear in the registered version - http://www.clicktoconvert.com
Figure 34: Residual Methane Content (Layer 1) at End of Case 4
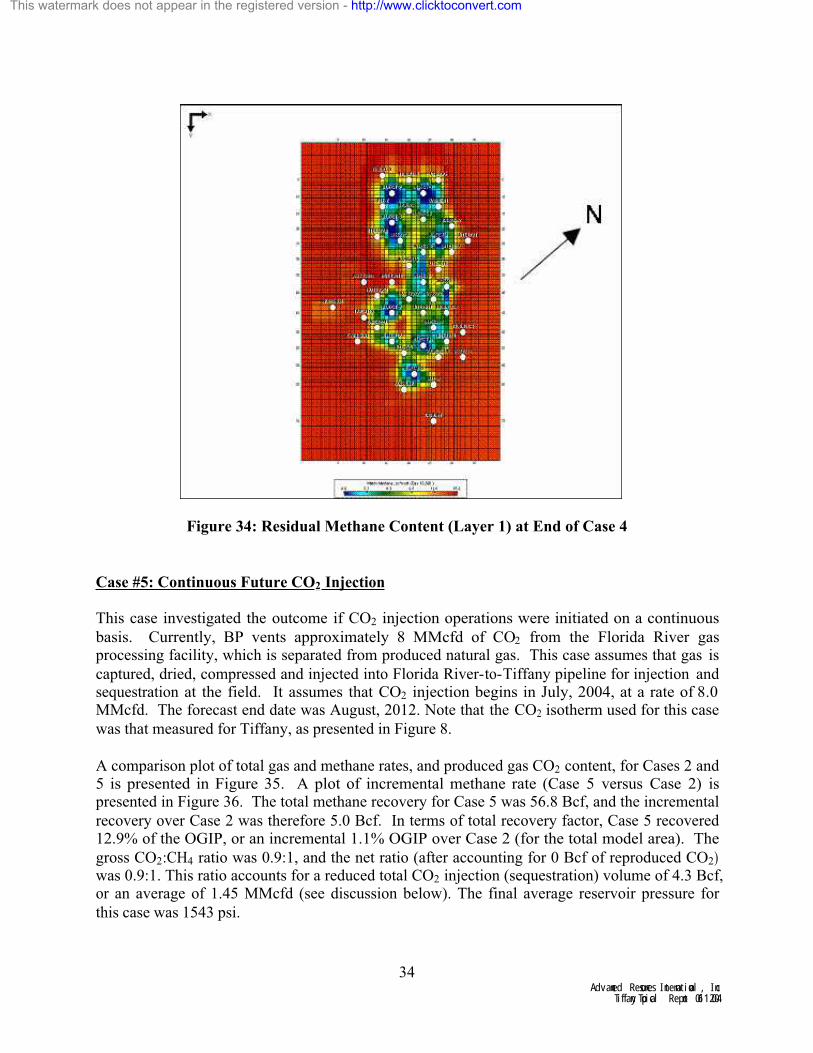
Case #5: Continuous Future CO2 Injection
This case investigated the outcome if CO2 injection operations were initiated on a continuous
basis. Currently, BP vents approximately 8 MMcfd of CO2 from the Florida River gas processing facility, which is separated from produced natural gas. This case assumes that gas is
captured, dried, compressed and injected into Florida River-to-Tiffany pipeline for injection and sequestration at the field. It assumes that CO2 injection begins in July, 2004, at a rate of 8.0MMcfd. The forecast end date was August, 2012. Note that the CO2 isotherm used for this case
was that measured for Tiffany, as presented in Figure 8.
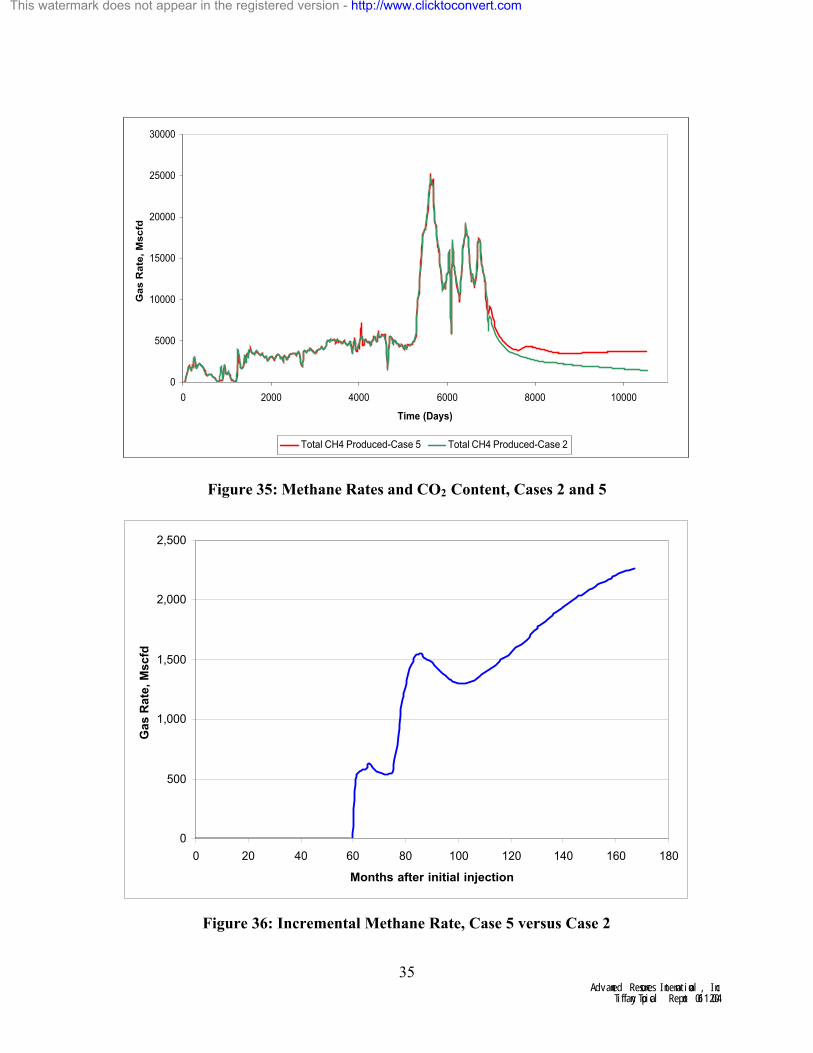
A comparison plot of total gas and methane rates, and produced gas CO2 content, for Cases 2 and 5 is presented in Figure 35. A plot of incremental methane rate (Case 5 versus Case 2) is presented in Figure 36. The total methane recovery for Case 5 was 56.8 Bcf, and the incremental
recovery over Case 2 was therefore 5.0 Bcf. In terms of total recovery factor, Case 5 recovered 12.9% of the OGIP, or an incremental 1.1% OGIP over Case 2 (for the total model area). The
gross CO2:CH4 ratio was 0.9:1, and the net ratio (after accounting for 0 Bcf of reproduced CO2)was 0.9:1. This ratio accounts for a reduced total CO2 injection (sequestration) volume of 4.3 Bcf, or an average of 1.45 MMcfd (see discussion below). The final average reservoir pressure for
this case was 1543 psi.
This watermark does not appear in the registered version - http://www.clicktoconvert.com
Figure 37 is a map illustrating the coal methane content at the end of the forecast period. Note that there is little difference in residual methane content of the coals as compared to Case 2.
There are (at least) a couple of possible explanations for the low recovery incremental:
§ Methane response with CO2 injection takes considerably longer than with N2. Given the already depleted nature of the coal methane content in the swept (injection) areas, perhaps a much longer frame than that
investigated is required to observe the benefits - an economically unfavorable condition.
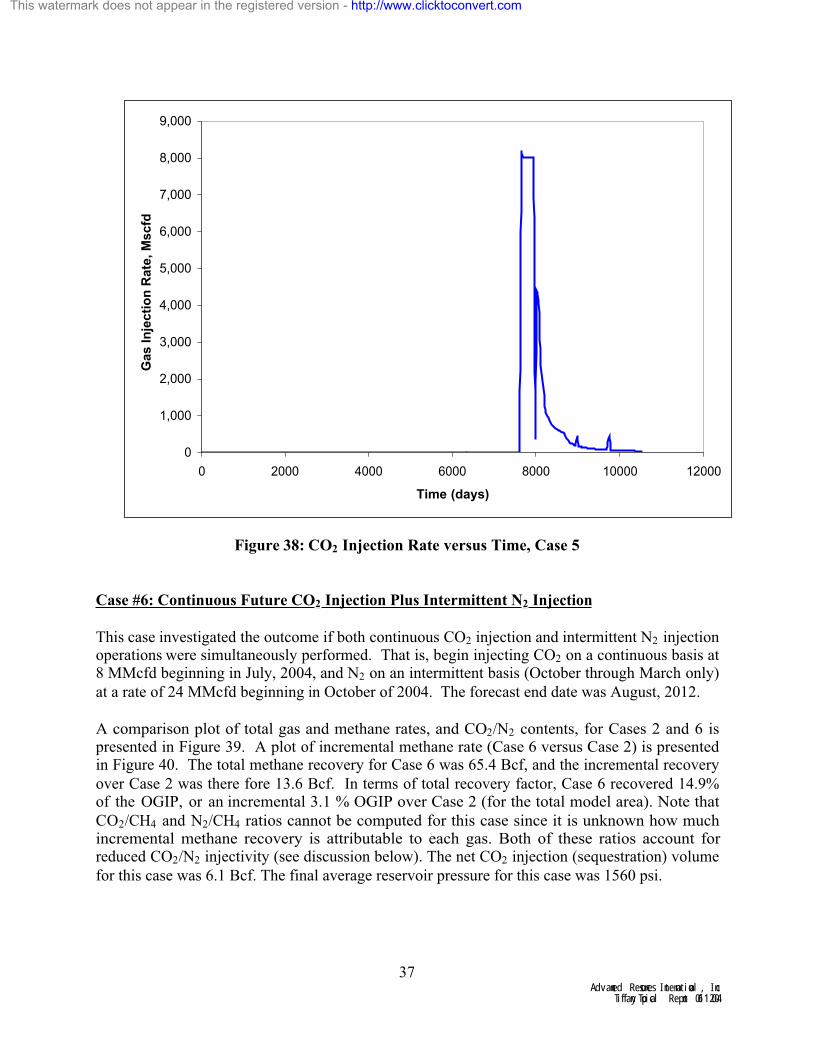
§ Further, the actual CO2 injection rates were considerably less than the 8 MMcfd planned. Due to coal matrix swelling with CO2 injection, and an
already “tight” coal of less than 10 md, the actual CO2 injection rates were only 1.45 MMcfd on average, after imposing a maximum bottomhole
pressure constraint of 2000 psi (based on prior injection history). This, of course, limited incremental methane rates. A plot of actual CO2 injection rate is presented in Figure 38.
Figure 37: Residual Methane Content (Layer 1) at End of Case 5
This watermark does not appear in the registered version - http://www.clicktoconvert.com
Case #6: Continuous Future CO2 Injection Plus Intermittent N2 Injection
This case investigated the outcome if both continuous CO2 injection and intermittent N2 injection operations were simultaneously performed. That is, begin injecting CO2 on a continuous basis at 8 MMcfd beginning in July, 2004, and N2 on an intermittent basis (October through March only)
at a rate of 24 MMcfd beginning in October of 2004. The forecast end date was August, 2012.
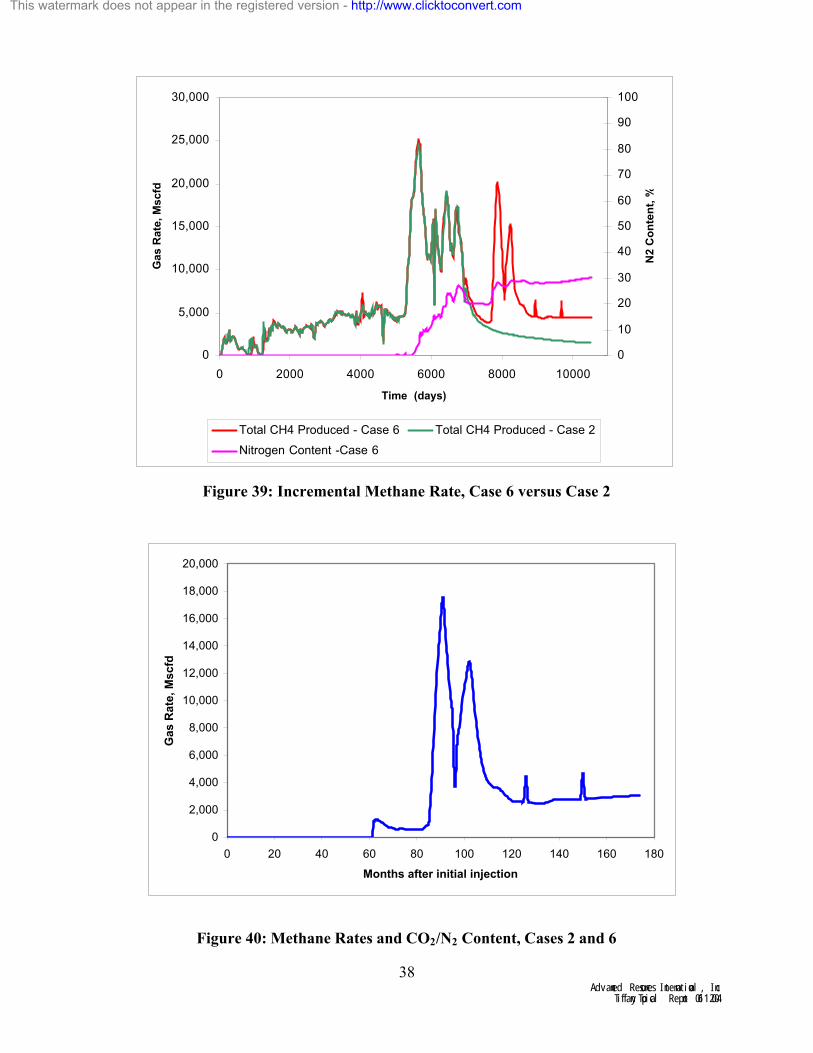
A comparison plot of total gas and methane rates, and CO2/N2 contents, for Cases 2 and 6 is presented in Figure 39. A plot of incremental methane rate (Case 6 versus Case 2) is presented in Figure 40. The total methane recovery for Case 6 was 65.4 Bcf, and the incremental recovery
over Case 2 was there fore 13.6 Bcf. In terms of total recovery factor, Case 6 recovered 14.9% of the OGIP, or an incremental 3.1 % OGIP over Case 2 (for the total model area). Note that
CO2/CH4 and N2/CH4 ratios cannot be computed for this case since it is unknown how much incremental methane recovery is attributable to each gas. Both of these ratios account for reduced CO2/N2 injectivity (see discussion below). The net CO2 injection (sequestration) volume
for this case was 6.1 Bcf. The final average reservoir pressure for this case was 1560 psi.
0
1,000
2,000
3,000
4,000
5,000
6,000
7,000
8,000
9,000
0 2000 4000 6000 8000 10000 12000
Time (days)
Gas In
jecti
on
Rate
, M
scfd
This watermark does not appear in the registered version - http://www.clicktoconvert.com
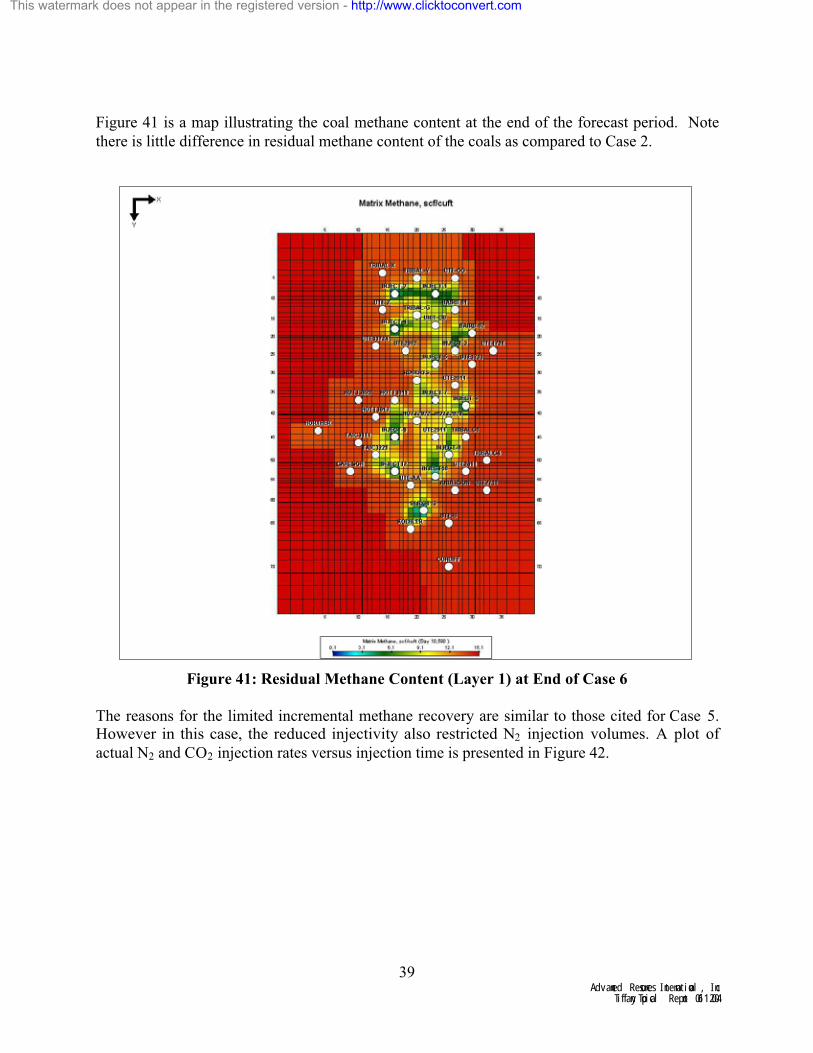
Figure 41 is a map illustrating the coal methane content at the end of the forecast period. Note
there is little difference in residual methane content of the coals as compared to Case 2.
Figure 41: Residual Methane Content (Layer 1) at End of Case 6
The reasons for the limited incremental methane recovery are similar to those cited for Case 5. However in this case, the reduced injectivity also restricted N2 injection volumes. A plot of
actual N2 and CO2 injection rates versus injection time is presented in Figure 42.
This watermark does not appear in the registered version - http://www.clicktoconvert.com
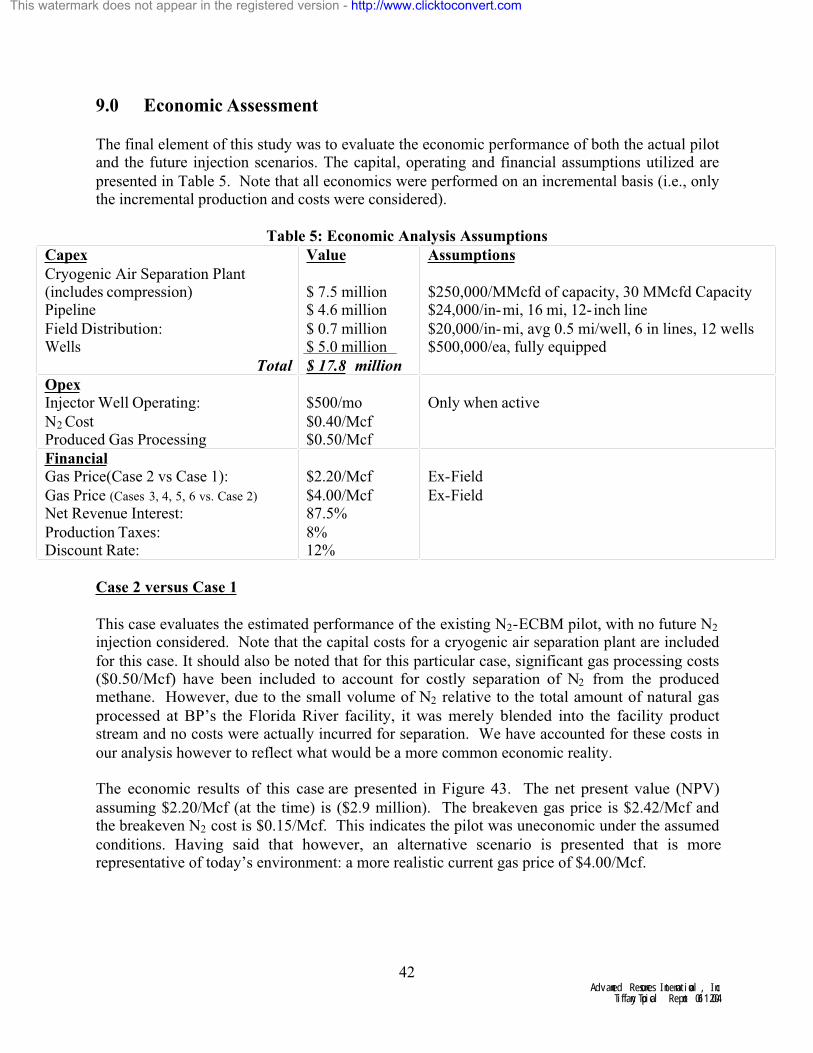
The final element of this study was to evaluate the economic performance of both the actual pilot and the future injection scenarios. The capital, operating and financial assumptions utilized are
presented in Table 5. Note that all economics were performed on an incremental basis (i.e., only the incremental production and costs were considered).
Table 5: Economic Analysis Assumptions
Capex
Cryogenic Air Separation Plant (includes compression)Pipeline
Field Distribution:Wells
Total
Value
$ 7.5 million $ 4.6 million
$ 0.7 million $ 5.0 million
$ 17.8 million
Assumptions
$250,000/MMcfd of capacity, 30 MMcfd Capacity$24,000/in-mi, 16 mi, 12- inch line
This case evaluates the estimated performance of the existing N2-ECBM pilot, with no future N2
injection considered. Note that the capital costs for a cryogenic air separation plant are included
for this case. It should also be noted that for this particular case, significant gas processing costs ($0.50/Mcf) have been included to account for costly separation of N2 from the produced methane. However, due to the small volume of N2 relative to the total amount of natural gas
processed at BP’s the Florida River facility, it was merely blended into the facility product stream and no costs were actually incurred for separation. We have accounted for these costs in
our analysis however to reflect what would be a more common economic reality.
The economic results of this case are presented in Figure 43. The net present value (NPV)
assuming $2.20/Mcf (at the time) is ($2.9 million). The breakeven gas price is $2.42/Mcf and the breakeven N2 cost is $0.15/Mcf. This indicates the pilot was uneconomic under the assumed
conditions. Having said that however, an alternative scenario is presented that is more representative of today’s environment: a more realistic current gas price of $4.00/Mcf.
This watermark does not appear in the registered version - http://www.clicktoconvert.com
The results of that case is also presented in Figure 43. These results indicate that in today’s gas price environment, N2-ECBM can be highly attractive economically.
Figure 43: Economic Analysis Results, Case 2 versus Case 1
NPV vs Time, Case 2 vs Case 1
$(20,000,000)
$(15,000,000)
$(10,000,000)
$(5,000,000)
$-
$5,000,000
$10,000,000
$15,000,000
$20,000,000
$25,000,000
Jan-9
8
Jul-9
8
Jan-9
9
Jul-9
9
Jan-0
0
Jul-0
0
Jan-0
1
Jul-0
1
Jan-0
2
Jul-0
2
Jan-0
3
Jul-0
3
Jan-0
4
Jul-0
4
Jan-0
5
Jul-0
5
Jan-0
6
Jul-0
6
Jan-0
7
Jul-0
7
Jan-0
8
Jul-0
8
Jan-0
9
Jul-0
9
Jan-1
0
Jul-1
0
Jan-1
1
Jul-1
1
Jan-1
2
Date
Ne
t P
res
en
t V
alu
e $2.20/Mcf
$4.00/Mcf
Breakeven Gas Price:
$2.42/Mcf
$
This watermark does not appear in the registered version - http://www.clicktoconvert.com
In these cases, no capital costs are considered; they are considered sunk for the purpose of this analysis. Further, a gas price of $4.00/Mcf is used for all cases to reflect current economic
conditions. The results of these cases are presented in Table 6. All cases are highly attractive economically. This is largely a result of a favorable gas price environment.
Table 6: Summary of Economic Results, Cases 3 and 4
(Incremental vs. Case 2)
Case 3 Case 4
Assumed Gas Price ($/Mcf) $4.00 $4.00
Net Present Value ($ millions) $32.0 $42.2
Breakeven Gas Price ($/Mcf) $1.49 $1.59
Breakeven Injectant Cost ($/Mcf) $2.12 $1.89
Cases 5 and 6 versus Case 2
Similar to cases 3 and 4, all capital costs for N2 and transportation are considered sunk and a $4.00/Mcf gas price environment is assumed. However, an all- in Capex/Opex cost of $0.50/Mcfof CO2 is added for its capture, dehydration and compression at the Florida River Facility. The
results are presented in Table 7. They indicate that CO2 sequestration at the site can be performed economically. The econimics of sequestration can be improved by adding N2 to the injectant stream.
Table 7: Summary of Economic Results, Cases 5 and 6
(Incremental vs. Case 2)
Case 5 Case 6
Assumed Gas Price ($/Mcf) $4.00 $4.00
Net Present Value ( $ millions) $5.9 $18.8
CO2 Sequestration Cost (Profit)($/ton) ($0.09) ($0.19)
This watermark does not appear in the registered version - http://www.clicktoconvert.com
Based on the results from this study, the following major conclusions have been drawn:
· The injection of N2 at the Tiffany Unit has resulted in incremental methane recovery over estimated primary recovery, in approximate proportion of one volume of methane for
every 0.4 volumes of injected nitrogen on a net basis. In the swept areas, an incremental methane recovery of approximately 20% of original-gas-in-place resulted from N2-ECBM operations.
· At the prevailing gas prices at the time the project was implemented (~2.20/Mcf), and not
considering any tax credit benefits, the pilot itself was uneconomic. However, with
today’s gas prices of ~$4.00/Mcf, N2-ECBM appears economically attractive.
· Performance predictions of future injection suggests CO2 sequestration can be
accomplished at a slight profit. Economic performance is enhanced by adding some N2
to the injectant.
This watermark does not appear in the registered version - http://www.clicktoconvert.com
This work was funded by the U.S. Department of Energy, National Energy Technology Laboratory, under award number DE-FC26-00NT40924. The DOE Project Manager is Charlie
Byrer. The authors also wish to acknowledge the valuable contribution of BP America, which provided all the data for the study, invaluable insights, and permission for the results to be published.
This watermark does not appear in the registered version - http://www.clicktoconvert.com
1) Reeves, S. R.: “Geologic Sequestration of CO2 in Deep, Unmineable Coalbeds: An Integrated Research and Commercial-Scale Field Demonstration Project”, SPE 71749,
presented at the SPE Annual Technical Conference and Exhibition, New Orleans, September 30-October 3, 2001.
2) Reeves, S. and Pekot, L.: “Advanced Reservoir Modeling in Desorption-ControlledReservoirs,” SPE 71090, presented at the SPE Rocky Mountain Petroleum Technology
Conference, Keystone, May 21-23, 2001.
3) Paul, G.W. and Young, G.B.C.: “Characterization of Fruitland Coal through Reservoir
4) Reeves, S.R., Clarkson, C., and Erickson, D.: “Selected Field Practices for ECBM Recovery and CO2 Sequestration in Coals based on Experience Gained at the Allison and Tiffany Units, San Juan Basin”, DOE Topical Report, December, 2002.
5) Gasem, K.A.M., Robinson, R.L., and Reeves, S.R.: “Adsorption of Pure Methane, Nitrogen,
and Carbon Dioxide and Their Mixtures on San Juan Basin Coal”, DOE Topical Report, May, 2002.
6) Pekot, L. and Reeves, S.: “Modeling Coal Matrix Shrinkage and Differential Swelling with CO2 Injection for Enhanced Coalbed Methane and Carbon Sequestration Applications,” DOE
Topical Report, November, 2002.
7) Sawyer, W.K., Paul, G.W., Schraufnagel, R.A.: “Development and Application of a 3D
Coalbed Simulator,” CIM/SPE 90-119, presented at the CIM/SPE International Technical Conference, Calgary, June 10-13, 1990.
8) Liang, J., Raterman, K. T., and Robertson, E. P.: “A Mechanistic Model for CO2
Sequestration in Tiffany Coal Bed Methane Field”, 2003 International Coalbed Methane
Symposium, Tuscaloosa, AL, May 7-8, 2003.
This watermark does not appear in the registered version - http://www.clicktoconvert.com