10
The Top 6 Canadian Banks: Selected Indicators of Q1 2015 Results March 2015 December 2014
| Date post: | 18-Jul-2015 |
| Category: |
Business |
| Upload: | deepak-pershad |
| View: | 149 times |
| Download: | 2 times |

The Top 6 Canadian Banks:
Selected Indicators of Q1 2015 Results
March 2015
December 2014
Contents
Overview 3.
Key Performance Indicators 4.
Total Revenue 5.
Net Income 6.
Return on Equity 7.
Earnings Per Share 8.
Summation 9.
2

Canada's Top 6 Banks – A Challenging Environment Out of the Gate for 2015
• Net income for the top 6 Canadian banks for Q1 2015 grew just over 1% overall, perhaps reflecting the impact of low interest rates, oil prices, and a high level of consumer debt
• The stellar exception was RBC, which grew Q1 2015 net income by over 17% vs. Q1 2014
• Despite a notable drop vs. Q1 2014, CIBC still led by far in Earnings per Share among the top six banks
3

Key Performance Indicators
Among the key performance indicators for the top 6 banks are:
• Total Revenue
• Net Income
• ROE (Return on Equity)
• EPS (Earnings per Share)
The following charts show how each bank performed in a universe of top 6 bank results.(Sources: Reported Top 6 Banks’ Q1 2015 results)
4

Top 6 Banks – Q1 2015 % Share of Top 6 Revenue
• RBC continued unsurprisingly, to lead in total revenue for Q1 2015, followed by TD and Scotiabank
5
Total Revenue $MM - Q1 2015 $MM - Q1 2014 % Change VYA Total Revenue % Share of Top 6
RBC 9,644.0 8,460.0 14.0 RBC 29%
TD 7,614.0 7,565.0 0.6 TD 23%
Scotia 5,863.0 5,645.0 3.9 Scotia 18%
BMO 5,055.0 4,479.0 12.9 BMO 15%
CIBC 3,459.0 3,631.0 -4.7 CIBC 10%
National Bank 1,410.0 1,364.0 3.4 National Bank 4%
33,045.0 31,144.0 6.1 100.0%
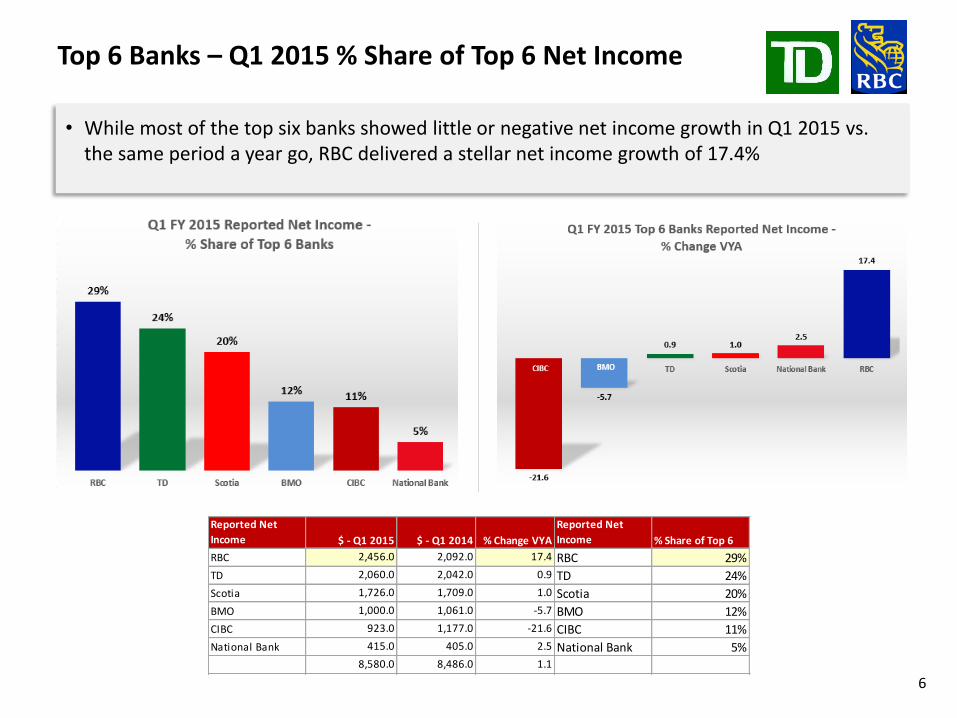
Top 6 Banks – Q1 2015 % Share of Top 6 Net Income
6
• While most of the top six banks showed little or negative net income growth in Q1 2015 vs. the same period a year go, RBC delivered a stellar net income growth of 17.4%
Reported Net
Income $ - Q1 2015 $ - Q1 2014 % Change VYA
Reported Net
Income % Share of Top 6
RBC 2,456.0 2,092.0 17.4 RBC 29%
TD 2,060.0 2,042.0 0.9 TD 24%
Scotia 1,726.0 1,709.0 1.0 Scotia 20%
BMO 1,000.0 1,061.0 -5.7 BMO 12%
CIBC 923.0 1,177.0 -21.6 CIBC 11%
National Bank 415.0 405.0 2.5 National Bank 5%8,580.0 8,486.0 1.1
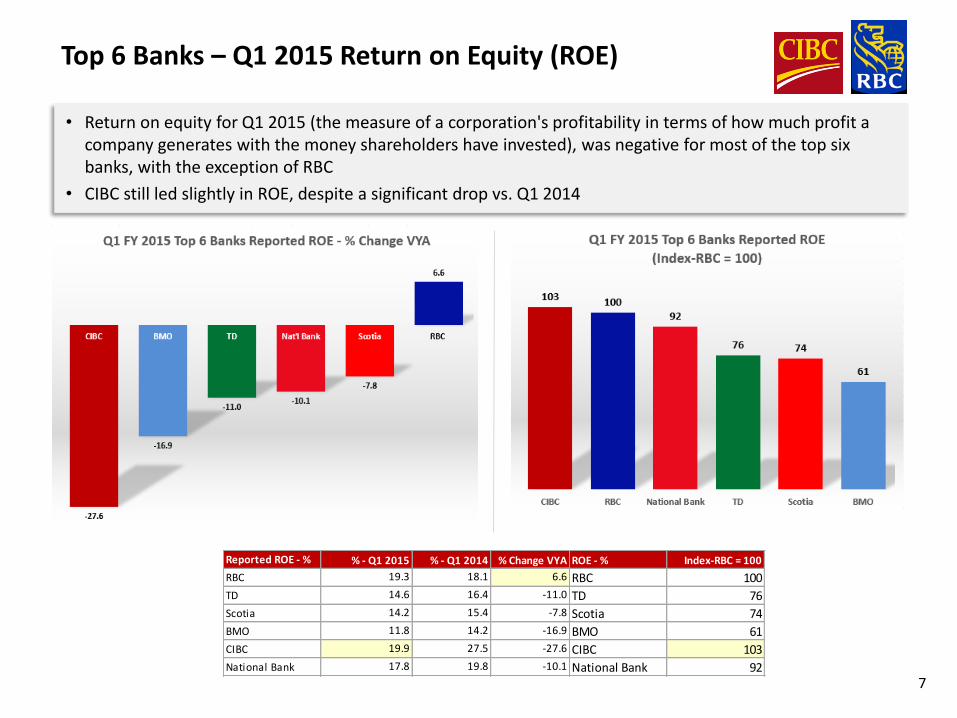
Top 6 Banks – Q1 2015 Return on Equity (ROE)
7
• Return on equity for Q1 2015 (the measure of a corporation's profitability in terms of how much profit a company generates with the money shareholders have invested), was negative for most of the top six banks, with the exception of RBC
• CIBC still led slightly in ROE, despite a significant drop vs. Q1 2014
Reported ROE - % % - Q1 2015 % - Q1 2014 % Change VYA ROE - % Index-RBC = 100
RBC 19.3 18.1 6.6 RBC 100
TD 14.6 16.4 -11.0 TD 76
Scotia 14.2 15.4 -7.8 Scotia 74
BMO 11.8 14.2 -16.9 BMO 61
CIBC 19.9 27.5 -27.6 CIBC 103
National Bank 17.8 19.8 -10.1 National Bank 92

Top 6 Banks Q1 2015 Earnings Per Share (EPS)
8
• While CIBC continued to lead in terms of EPS in Q1 2015 VYA, RBC showed the greatest improvement, at +19.6% vs. Q1 2014
Reported EPS
(diluted) $ - Q1 2015 $ - Q1 2014 % Change VYA EPS Index-RBC = 100
RBC 1.65 1.38 19.6 RBC 100
TD 1.09 1.07 1.9 TD 66
Scotia 1.35 1.32 2.3 Scotia 82
BMO 1.46 1.58 -7.6 BMO 88
CIBC 2.28 2.88 -20.8 CIBC 138
National Bank 1.16 1.15 0.9 National Bank 70


Deepak Pershad, Principal
www.insightsbydesign.ca
416.925.6536


