A Forrester Total Economic Impact™ Study Commissioned By Microsoft August 2019 The Total Economic Impact ™ Of Microsoft Azure IaaS Cost Savings And Business Benefits Enabled By Azure Infrastructure-As-A- Service (IaaS)
Transcript
A Forrester Total Economic Impact™
Study Commissioned By Microsoft
August 2019
The Total Economic Impact™ Of Microsoft Azure IaaS
Cost Savings And Business Benefits Enabled By Azure Infrastructure-As-A-Service (IaaS)
Table Of Contents Executive Summary 1
Key Findings 1
TEI Framework And Methodology 4
The Azure IaaS Customer Journey 5
Interviewed Organizations 5
Key Challenges 5
Solution Requirements 6
Key Results 6
Composite Organization 8
Analysis Of Benefits 9
Avoided On-Premises Infrastructure Costs 9
Avoided On-Premises FTE Costs 10
Income From New And Larger Online B2C Sales 11
Income From New Online Enterprise Sales 12
Unquantified Benefits 13
Flexibility 14
Analysis Of Costs 16
Costs Of Azure Implementation And Initial Workload Migration 16
Ongoing Azure Costs And Additional Workload Migration 17
Financial Summary 19
Microsoft Azure IaaS: Overview 20
Appendix A: Total Economic Impact 21
Appendix B: Endnotes 22
Project Team:
Mary Anne North
Richard Cavallaro
Dean Davison
ABOUT FORRESTER CONSULTING
Forrester Consulting provides independent and objective research-based
consulting to help leaders succeed in their organizations. Ranging in scope from a
short strategy session to custom projects, Forrester’s Consulting services connect
you directly with research analysts who apply expert insight to your specific
business challenges. For more information, visit forrester.com/consulting.
is strictly prohibited. Information is based on best available resources.
Opinions reflect judgment at the time and are subject to change. Forrester®,
Technographics®, Forrester Wave, RoleView, TechRadar, and Total Economic
Impact are trademarks of Forrester Research, Inc. All other trademarks are the
property of their respective companies. For additional information, go to
forrester.com.
1 | The Total Economic Impact™ Of Microsoft Azure IaaS
Executive Summary
Microsoft Azure provides the infrastructure-as-a-service (IaaS) platform as
a suite of computing, storage and networking resources, which customers
can provision and manage over the internet. IaaS quickly scales up and
down with demand, letting customers pay only for the resources that they
use, including the ability to turn services on and off rapidly so that a
process incurs charges only when it is actively operating.
Microsoft commissioned Forrester Consulting to conduct a Total Economic
Impact™ (TEI) study to examine the ROI enterprises may realize by
shifting from on-premises operations to Azure’s IaaS offering. The purpose
of this study is to give readers a framework to evaluate the potential
financial impact, or ROI, of leveraging Azure IaaS for their organizations.
Forrester interviewed nine customers with years of experience with Azure.
The ease of development and management meant that many workloads,
including some lighter SAP applications as well as disaster recovery, were
a simple rehost (i.e., lift and shift) to Azure.
Forrester interviewed the VP of product development at an IT services
company who summarized, “I could never build a services infrastructure
on site as fast as I can built it on Azure.” The company leverages Azure
services such as Compute, Storage, Networking, Management, Security,
StorSimple, and Azure Active Directory. Other organizations have
implemented Azure Hybrid solutions by migrating workloads to Azure that
are securely connected to on-premises applications and data.
Customers found that reducing their data center footprint freed up IT staff
for higher level business initiatives. Another customer, the senior manager
of advanced technology services for a construction company further
explained: “In the past, business units did not consider IT people as
anything other than a cost. Today, we’re bringing business value by taking
advantage of the resources and skills we have to become a revenue
contributor for the company with what we’re doing on the internet-of-things
(IoT) front, the analytics front, and the opportunities those are bringing to
the table. That’s a game changer. And if we hadn’t really moved to the
cloud, adopted Azure, and embraced what it’s allowed us to do, we
wouldn’t be able to deliver like we do.”
Key Findings
Quantified benefits. The following risk-adjusted present value (PV)
quantified benefits are measured over a three-year investment period and
representative of those experienced by the companies interviewed:
› Avoided on-premises infrastructure costs of 90%, which are valued
at savings of $7.3 million. Servers were previously deployed on site or
hosted with a partner. Migrating these workloads to Azure reduced the
cost for servers, databases, operating systems, and data center space.
› Avoided on-premises FTE costs of $3.0 million. Migrating to Azure
IaaS enabled significant reallocation of FTEs who had supported data
center infrastructure. None of the interviewed companies eliminated the
headcount, but rather they refocused employees onto higher-value
tasks. For example, interviewee explained how a previous data center
manager turned out to be a superb business analyst at their company.
Benefits
Increased online B2C orders:
By 83% to 167%
Net profit from incremental online sales:
$2.8 million
Reduced infrastructure on-premises in data center:
90% by Year 3
Avoided infrastructure and FTE costs:
$10.3 million
2 | The Total Economic Impact™ Of Microsoft Azure IaaS
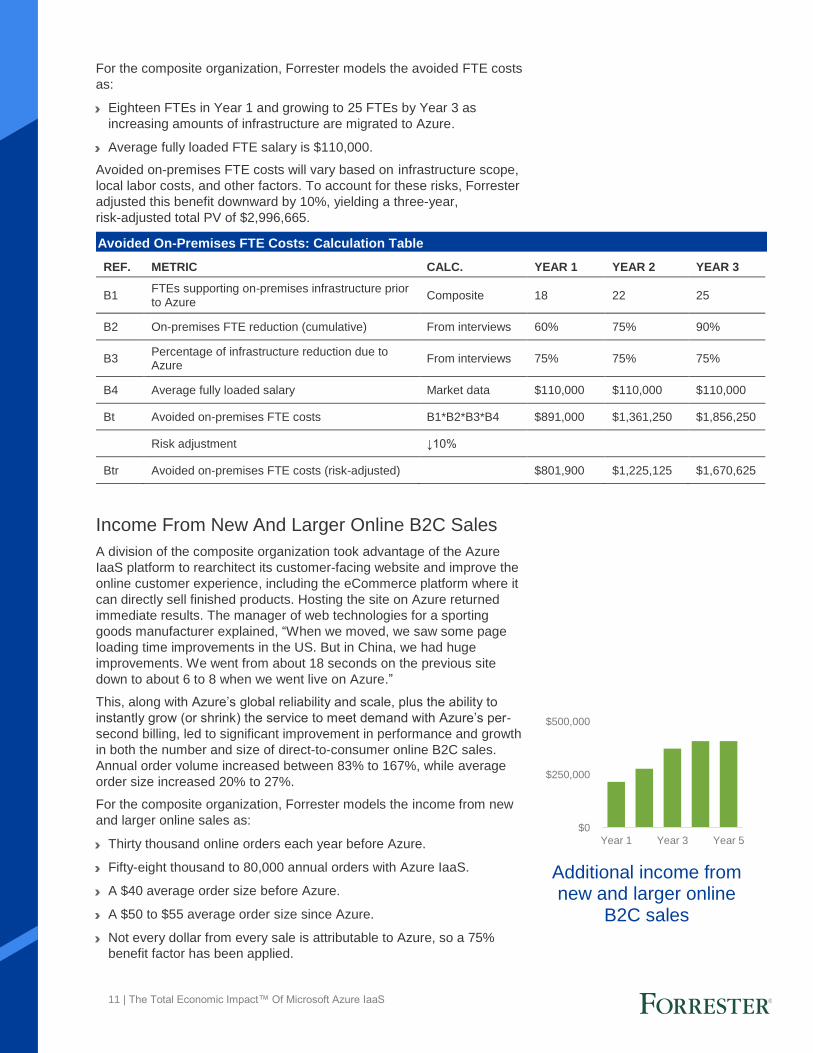
› Income from new and larger online B2C sales, increasing annual
order volume between 83% and 167%, and increasing order size
between 20% and 27%. Improvements in global scale (such as faster
page load times in China), the ability to stand up services in new
countries more rapidly, and improved site performance all combined to
produce increased volume of purchases and higher average sales
prices that generated an additional $1.9 million of income.
› Income from new online enterprise sales generated $927,081 in
additional income from improved processes, global reach, and
better customer service. In addition to online sales, some interviewed
companies also measured an increase through traditional sales
channels. One new enterprise offering, built on Azure, improved time-to-
market and predictability of product delivery, which resulted in an
improvement in the customer experience and a boost in sales from
existing customers.
Unquantified benefits. The interviewed organizations experienced the
following benefits, which are not quantified for this study:
› Flexibility of the migration path provided by Azure’s Hybrid
capabilities. For the companies interviewed, migration took place over
several years and became a journey more so than a single event. Azure
enables customers to move from on-premises to the cloud in a timeline
that meets business needs.
› Value of Azure tools in improving business operations. New data
tools such as the Data Lake Analytics , event services, and other Azure
tools help organizations enhance their business performance.
› Easier access to new technologies. IT managers can test out and pilot
new technologies such as Hadoop or high-performance computing
(HPC) more quickly with virtualized environments on Azure, significantly
shortening the time to evaluate and deploy at a lower cost.
› Developer and tester process improvements. Developers and testers
saw improvements in tasks such as setting up a new server environment
(or turning it off when done); simulating real-time scale scenarios; and
standardizing test, development, and production environments.
› Streamlines the organization’s journey toward Azure platform-as-a-
service (PaaS). Future plans include rearchitecting some applications or
interfaces for Azure PaaS that are expected to create new benefit
opportunities and save time and costs.
Costs. The interviewed organizations experienced the following risk-
adjusted PV costs:
› Costs for Azure implementation and initial workload migration of
$239,800. Many workload migrations were lift-and-shift migrations,
meaning that the initial implementation was relatively quick and simple.
› Ongoing Azure costs and additional workload migration costs of
$2.0 million. Azure license costs are estimated for a composite
organization to start at $290,950 in the first year and grow to $454,609
by Year 3. As more workloads are migrated in later years, additional
costs are included for additional migration effort as well as expected new
hires.
ROI 478%
Benefits PV $13.1 million
NPV $10.8 million
Payback <3 months
3 | The Total Economic Impact™ Of Microsoft Azure IaaS
Forrester’s interviews with nine existing customers and subsequent
financial analysis found that an organization based on these interviewed
organizations experienced benefits of $13.1 million over three years
versus costs of $2.3 million, adding up to a net present value (NPV) of
$10.8 million and an ROI of 478%.
Total benefits PV, $13.1M
Total costs PV, $2.3M
Initial Year 1 Year 2 Year 3
Financial Summary
Payback:<3 months
$7.3M
$3.0M
$1.9M
$927.1K
Avoided on-premisesinfrastructure costs
Avoided on-premisesFTE costs
Income from new andlarger online B2C sales
Income from newenterprise sales
Benefits (Three-Year)
4 | The Total Economic Impact™ Of Microsoft Azure IaaS
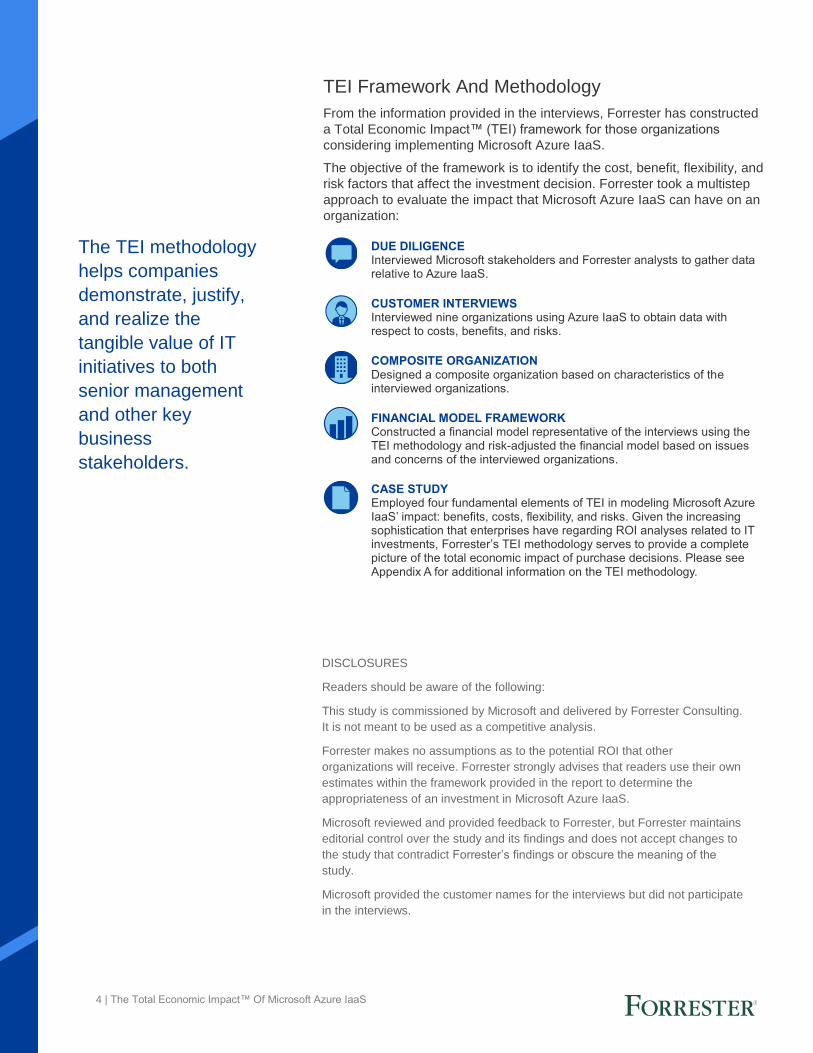
TEI Framework And Methodology
From the information provided in the interviews, Forrester has constructed
a Total Economic Impact™ (TEI) framework for those organizations
considering implementing Microsoft Azure IaaS.
The objective of the framework is to identify the cost, benefit, flexibility, and
risk factors that affect the investment decision. Forrester took a multistep
approach to evaluate the impact that Microsoft Azure IaaS can have on an
organization:
DUE DILIGENCE Interviewed Microsoft stakeholders and Forrester analysts to gather data relative to Azure IaaS.
CUSTOMER INTERVIEWS Interviewed nine organizations using Azure IaaS to obtain data with respect to costs, benefits, and risks.
COMPOSITE ORGANIZATION Designed a composite organization based on characteristics of the interviewed organizations.
FINANCIAL MODEL FRAMEWORK Constructed a financial model representative of the interviews using the TEI methodology and risk-adjusted the financial model based on issues and concerns of the interviewed organizations.
CASE STUDY Employed four fundamental elements of TEI in modeling Microsoft Azure IaaS’ impact: benefits, costs, flexibility, and risks. Given the increasing sophistication that enterprises have regarding ROI analyses related to IT investments, Forrester’s TEI methodology serves to provide a complete picture of the total economic impact of purchase decisions. Please see Appendix A for additional information on the TEI methodology.
The TEI methodology
helps companies
demonstrate, justify,
and realize the
tangible value of IT
initiatives to both
senior management
and other key
business
stakeholders.
DISCLOSURES
Readers should be aware of the following:
This study is commissioned by Microsoft and delivered by Forrester Consulting.
It is not meant to be used as a competitive analysis.
Forrester makes no assumptions as to the potential ROI that other
organizations will receive. Forrester strongly advises that readers use their own
estimates within the framework provided in the report to determine the
appropriateness of an investment in Microsoft Azure IaaS.
Microsoft reviewed and provided feedback to Forrester, but Forrester maintains
editorial control over the study and its findings and does not accept changes to
the study that contradict Forrester’s findings or obscure the meaning of the
study.
Microsoft provided the customer names for the interviews but did not participate
in the interviews.
5 | The Total Economic Impact™ Of Microsoft Azure IaaS
The Azure IaaS Customer Journey
BEFORE AND AFTER THE AZURE IAAS INVESTMENT
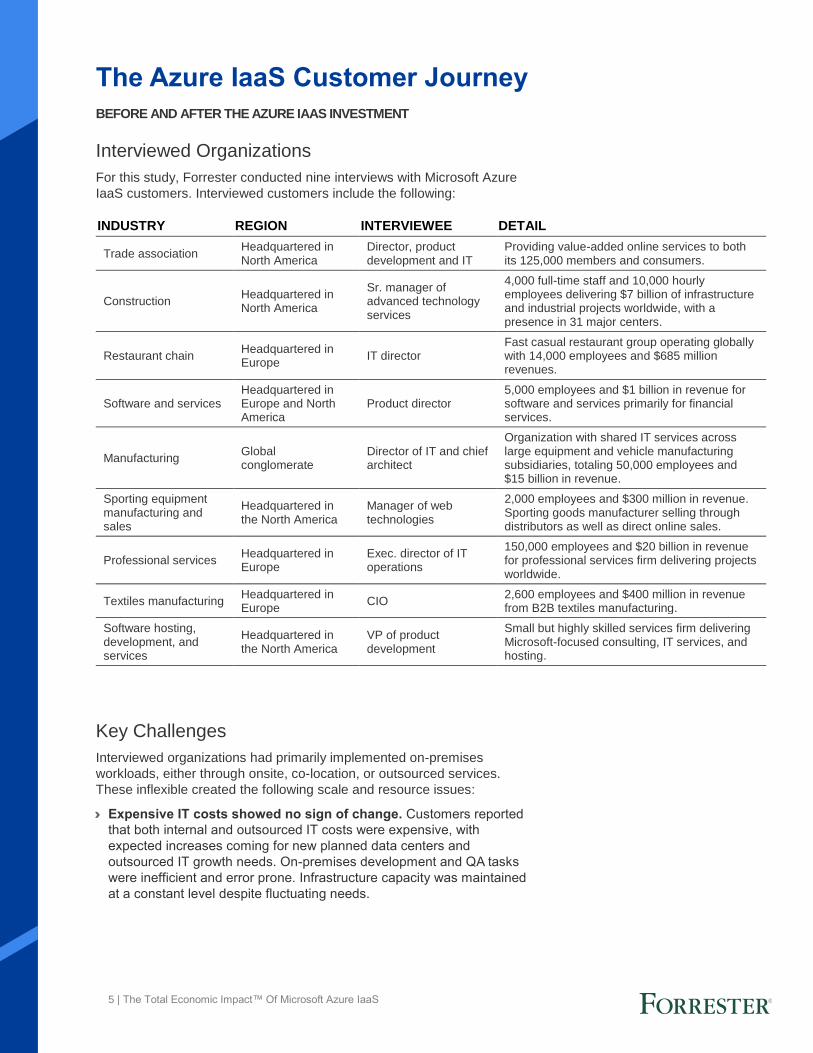
Interviewed Organizations
For this study, Forrester conducted nine interviews with Microsoft Azure
IaaS customers. Interviewed customers include the following:
Key Challenges
Interviewed organizations had primarily implemented on-premises
workloads, either through onsite, co-location, or outsourced services.
These inflexible created the following scale and resource issues:
› Expensive IT costs showed no sign of change. Customers reported
that both internal and outsourced IT costs were expensive, with
expected increases coming for new planned data centers and
outsourced IT growth needs. On-premises development and QA tasks
were inefficient and error prone. Infrastructure capacity was maintained
at a constant level despite fluctuating needs.
INDUSTRY REGION INTERVIEWEE DETAIL
Trade association Headquartered in North America
Director, product development and IT
Providing value-added online services to both its 125,000 members and consumers.
Construction Headquartered in North America
Sr. manager of advanced technology services
4,000 full-time staff and 10,000 hourly employees delivering $7 billion of infrastructure and industrial projects worldwide, with a presence in 31 major centers.
Restaurant chain Headquartered in Europe
IT director Fast casual restaurant group operating globally with 14,000 employees and $685 million revenues.
Software and services Headquartered in Europe and North America
Product director 5,000 employees and $1 billion in revenue for software and services primarily for financial services.
Manufacturing Global conglomerate
Director of IT and chief architect
Organization with shared IT services across large equipment and vehicle manufacturing subsidiaries, totaling 50,000 employees and $15 billion in revenue.
Sporting equipment manufacturing and sales
Headquartered in the North America
Manager of web technologies
2,000 employees and $300 million in revenue. Sporting goods manufacturer selling through distributors as well as direct online sales.
Professional services Headquartered in Europe
Exec. director of IT operations
150,000 employees and $20 billion in revenue for professional services firm delivering projects worldwide.
Textiles manufacturing Headquartered in Europe
CIO 2,600 employees and $400 million in revenue from B2B textiles manufacturing.
Software hosting, development, and services
Headquartered in the North America
VP of product development
Small but highly skilled services firm delivering Microsoft-focused consulting, IT services, and hosting.
6 | The Total Economic Impact™ Of Microsoft Azure IaaS
› International expansion was difficult. Opening operations in a new
country often required new or expanded data center footprints that
were expensive and complicated. Data center investments are
governed by data privacy requirements, and take longer to plan,
deploy, and implement.
› Business growth was delayed due to the inability to rapidly scale
infrastructure. The speed of business unit growth strained the ability
of the online infrastructure to scale. Merely provisioning and deploying
new hardware often required weeks, if not months.
› Lacking time to focus on higher-value initiatives. Organizations felt
that the effort needed to maintain data centers prevented IT staff from
addressing more strategic needs. As one director noted: “Prior to our
journey to the cloud, we had to maintain, update, and patch all those
servers. We wanted to focus on providing value-added services to our
members and consumers, not on running the infrastructure.”
Solution Requirements
The interviewed organizations searched for a solution that could:
› Enable a smooth and phased transition to the cloud by delivering a
consistent experience across varied environments (e.g., on-premises,
cloud, or edge).
› Support global reach to meet country-specific data privacy and
management regulations and support last-mile performance.
› Scale both up and down to meet current and future needs for internal
and online applications.
› Remain flexible to support several scenarios with one solution tool
set, such as internal application development, enterprise collaboration,
web hosting, and integration with current applications and systems.
› Provide opportunities for piloting and experimenting with new
solutions without major planning, deployment time, or data center
costs.
Key Results
The interviews revealed that key results from the Azure IaaS investment
include:
› Reduced data center infrastructure and IT labor costs. With Azure
IaaS, organizations were able to reduce onsite or co-location data
center costs by lifting and shifting many workloads to Azure, and also
by refactoring applications. As a result, their data center infrastructure
and IT labor costs dropped by as much as 90% over three years. The
senior manager of advanced technology services for a construction
company noted: “We still have a data center, but the footprint is a lot
smaller. It kind of sits there and manages itself.”
› Increased business-critical workload migrations. Many business-
critical workloads can benefit from Azure IaaS’ ability to reduce costs
and improve scale, performance, and mobility. These are planned for
later years, since more time and resource involvement is required, but
they are expected to provide significant benefits. “Not every workload
is suited for cloud deployment today, based on network utilization or
other issues,” said the director of IT at a global conglomerate, but they
highlighted that many are planned for later migration.
“I wanted to change the focus
of the team to revenue and
customer experience
initiatives. The on-premises
stuff was giving us too many
headaches, from both a
support and security point of
view. We saw an opportunity
to get rid of time-consuming
tasks, while putting data
somewhere safe and secure
where we know it will be well
looked after.”
IT director, restaurant chain
“We were regularly running out
of capacity, and when we ran
out of capacity it affected our
ability to deliver.”
Senior manager of advanced
technology services, construction
company
7 | The Total Economic Impact™ Of Microsoft Azure IaaS
› Scaled infrastructure up or down as needed. The IT director for a
restaurant chain described the ability to triple the compute power for an
application during a marketing promotion, then turn off that increased
capacity when it is not needed.
› Freed up time of IT staff for higher-value efforts instead of
managing infrastructure. Interviewed organizations described how IT
staff who no longer needed to support data center infrastructure could
instead contribute to strategic corporate initiatives such as big data,
IoT, automation, and improving business unit operational systems. The
senior manager of advanced technology services for a construction
company indicated: “We’ve been able to refocus IT staff on other areas
that provide more business value than infrastructure maintenance. We
were able to start focusing on the future, on emerging areas like IoT,
› Enabled greater agility and faster time-to-market. The ease and
flexibility of spinning up new IT efforts with Azure improves overall
organizational agility and accelerates time-to-market. The director of
product development and IT for a trade association noted: “Our time-
to-market has improved drastically. A lot of this comes with the
flexibility provided by Azure IaaS. Innovating, or failing fast and moving
on, is so much easier now.”
› Increased profit through higher enterprise and B2C sales. With
applications and websites deployed to Azure IaaS, organizations can
leverage Azure’s scale and reach to better meet global needs and
seasonal business bursts. The manager of web technologies at a
sporting goods manufacturer highlights the issues their organization
has now resolved, using Azure: “As our site grew and our traffic grew,
we ran into a lot of problems. We’re in a market where we have busy
seasons, and we had issues with scale.”
› Improved development and test productivity. IT and development
managers can speed up processes such as quickly setting up and
turning off new server environments (that exactly match production).
They can easily pilot a new Azure service, such as Hadoop or HPC,
that before would have required significant investment, planning, and
data center buildout to even try out. The IT director for a restaurant
chain indicated: “Azure has made our development cycles a lot more
effective because we’re able to stand up test environments on almost
an ad hoc basis. So, it allows me to have multiple projects running at
the same time. In my old world, I would have needed more of a
sequential approach.”
› Azure also reduced the cost and effort of disaster recovery
capabilities. The director of product development and IT for a trade
association explained: “Building a full disaster recovery capability with
the old approach would have required us to double the investment and
the IT resources by building a second data center, replicating all the
services, and making sure that was always up to date and ready to
use. In the Azure cloud, that secondary site is active, not passive. It’s
serving traffic to users yet giving us the assurance that we are
compliant with business continuity requirements.”
“The real win for us was to
deliver projects and services
faster. Our average
turnaround time on projects
that had server-based
resources had been four to
eight weeks. Today we can
build a server to our specs in
15 minutes.”
Senior manager of advanced
technology services, construction
company
8 | The Total Economic Impact™ Of Microsoft Azure IaaS
› Flexibility of the migration path provided by Azure’s Hybrid
capabilities. Azure IaaS Hybrid capabilities enabled the interviewed
organizations to progress from on-premises to the cloud on whatever
path and timeline that best suits their needs. Some organizations
transitioned entirely over several years, while others moved most
workloads to the cloud while maintaining select business processes
on-premises. According to the director of product development and IT
for a trade association: “Our main reason to use a Hybrid approach
was the risk factor. We were exploring a completely new environment
and wanted to minimize the risk by deploying to the cloud gradually. With a Hybrid approach we could migrate in phases, keeping the
original infrastructure and data center until we were comfortable with
the new quality of service.”
Composite Organization
Based on the interviews, Forrester constructed a TEI framework, a
composite company, and an associated ROI analysis that illustrates the
areas financially affected. The composite organization is representative
of the nine companies that Forrester interviewed and is used to present
the aggregate financial analysis in the next section. The composite
organization has the following characteristics:
› Organization profile. A global, multibillion-dollar conglomerate with
manufacturing and services business units, the composite
organization has a strong brand, 20,000 employees, and around $4
billion in annual revenue. It leverages Azure IaaS in varied ways,
such as improving development and test for software development,
internal application operations, management and flexibility, and
customer-facing website management and scale during busier or
slower times.
› Deployment characteristics. The composite organization has
primarily implemented Azure IaaS compute and storage workloads,
including virtual machines and enterprise integration services. It also
uses Azure’s hybrid cloud capabilities to leverage some elements of
IaaS while maintaining critical components of on-premises
operations.
› Technical specifications. The organization purchased and
implemented:
• Sixty core virtual machines, primarily general purpose D-series
Azure virtual machines.
• Block blob storage of 100 terabytes (TBs).
• Professional Direct support.
Key assumptions:
• 20,000 employees
• $4 billion annual revenue
• Multinational conglomerate
• Many workloads available for lift-and-shift migration
• Other workloads require more development or rearchitecting for migration planned in later years.
9 | The Total Economic Impact™ Of Microsoft Azure IaaS
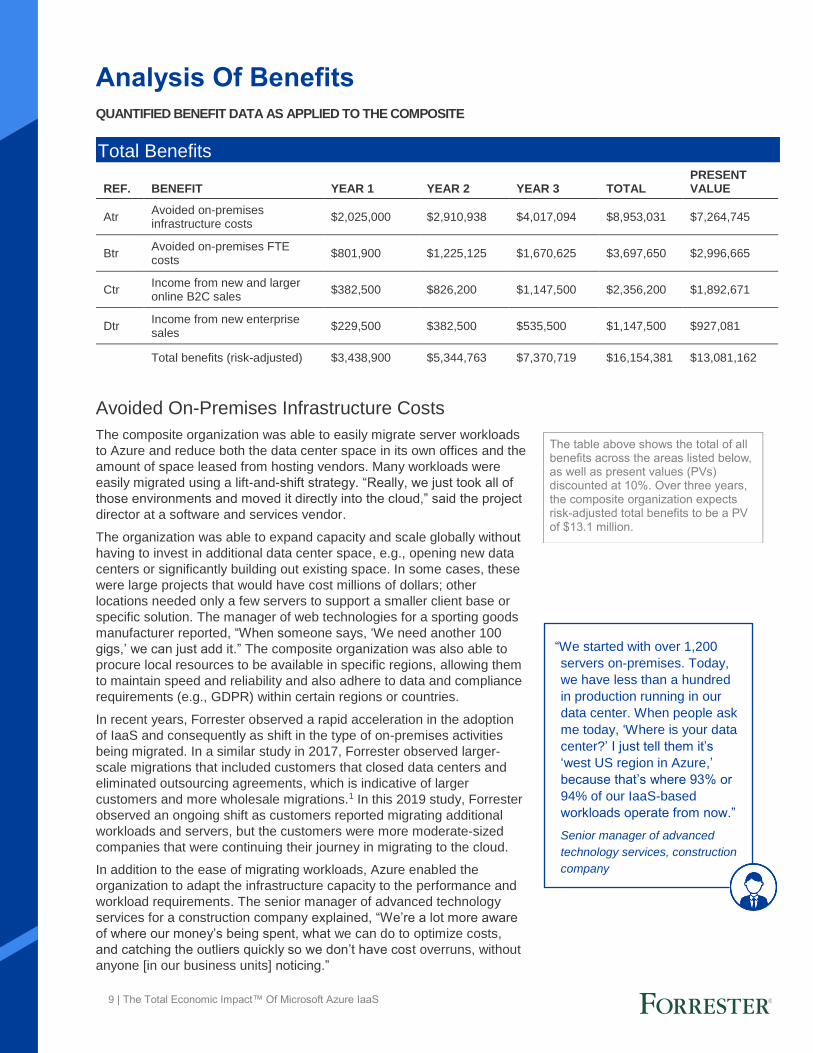
The table above shows the total of all benefits across the areas listed below, as well as present values (PVs) discounted at 10%. Over three years, the composite organization expects risk-adjusted total benefits to be a PV of $13.1 million.
Analysis Of Benefits
QUANTIFIED BENEFIT DATA AS APPLIED TO THE COMPOSITE
Avoided On-Premises Infrastructure Costs
The composite organization was able to easily migrate server workloads
to Azure and reduce both the data center space in its own offices and the
amount of space leased from hosting vendors. Many workloads were
easily migrated using a lift-and-shift strategy. “Really, we just took all of
those environments and moved it directly into the cloud,” said the project
director at a software and services vendor.
The organization was able to expand capacity and scale globally without
having to invest in additional data center space, e.g., opening new data
centers or significantly building out existing space. In some cases, these
were large projects that would have cost millions of dollars; other
locations needed only a few servers to support a smaller client base or
specific solution. The manager of web technologies for a sporting goods
manufacturer reported, “When someone says, ‘We need another 100
gigs,’ we can just add it.” The composite organization was also able to
procure local resources to be available in specific regions, allowing them
to maintain speed and reliability and also adhere to data and compliance
requirements (e.g., GDPR) within certain regions or countries.
In recent years, Forrester observed a rapid acceleration in the adoption
of IaaS and consequently as shift in the type of on-premises activities
being migrated. In a similar study in 2017, Forrester observed larger-
scale migrations that included customers that closed data centers and
eliminated outsourcing agreements, which is indicative of larger
customers and more wholesale migrations.1 In this 2019 study, Forrester
observed an ongoing shift as customers reported migrating additional
workloads and servers, but the customers were more moderate-sized
companies that were continuing their journey in migrating to the cloud.
In addition to the ease of migrating workloads, Azure enabled the
organization to adapt the infrastructure capacity to the performance and
workload requirements. The senior manager of advanced technology
services for a construction company explained, “We’re a lot more aware
of where our money’s being spent, what we can do to optimize costs,
and catching the outliers quickly so we don’t have cost overruns, without
anyone [in our business units] noticing.”
Total Benefits
REF. BENEFIT YEAR 1 YEAR 2 YEAR 3 TOTAL PRESENT VALUE
Total benefits (risk-adjusted) $3,438,900 $5,344,763 $7,370,719 $16,154,381 $13,081,162
“We started with over 1,200
servers on-premises. Today,
we have less than a hundred
in production running in our
data center. When people ask
me today, ‘Where is your data
center?’ I just tell them it’s
‘west US region in Azure,’
because that’s where 93% or
94% of our IaaS-based
workloads operate from now.”
Senior manager of advanced
technology services, construction
company
10 | The Total Economic Impact™ Of Microsoft Azure IaaS
Impact risk is the risk that the business or technology needs of the organization may not be met by the investment, resulting in lower overall total benefits. The greater the uncertainty, the wider the potential range of outcomes for benefit estimates.
The chief architect at a global manufacturer further highlighted the
scalability and pay-as-you-go ability of Azure: “Not only could we quickly
turn on a workload, but on the flipside, we are able to spin down a
workload when we’re through with it. As opposed to a traditional on-
premises, where you’re stuck with an asset, we can simply turn it off
when we’re finished.”
For the financial model, Forrester assumes that the composite
organization spent an average of $5 million in the first year, through a
combination of leased equipment, depreciation on capex assets, and
maintenance costs. Additional costs included operating systems (usually
a form of Linux), databases, security tools, and backup/disaster recover
platforms. Forrester also assumed that additional factors, such as server
consolidation and other best practices, also helped reduce data center
space and support requirements. To be conservative, only 75% of the
avoided costs are attributed to Azure IaaS.
Avoided on-premises infrastructure costs will vary based on costs in a
particular region, computing power required, employees or clients
nearby, and other factors. To account for these risks, Forrester adjusted
this benefit downward by 10%, yielding a three-year, risk-adjusted total
PV of $7,264,745.
Avoided On-Premises FTE Costs
With less on-premises infrastructure to support, organizations could
reallocate IT staff who previously managed and maintained that
infrastructure. Interviewed organizations typically redeployed that
staff to higher-value activities supporting strategic business
initiatives, as detailed below in the Unquantified Benefits section.
The senior manager of advanced technology services for a
construction company explained: “The number of people working on
traditional IT workloads, which is what IaaS typically supports,
dropped from around 24 to three or four. It’s like getting new staff
without having to add headcount. Our ability to deliver more projects
more rapidly, yet with the same number of people, was huge.”
12 | The Total Economic Impact™ Of Microsoft Azure IaaS
Since it is difficult to predict how customers will react to increased global
scale and speed, Forrester adjusted this benefit downward by 15%,
yielding a three-year, risk-adjusted total PV of $1,892,671.
Income From New Online Enterprise Sales
Due to better prototyping and faster time-to-market for textiles
manufacturing, as well as improved scale, availability, and reliability
across manufacturing, product development, or sales divisions, the
composite organization has seen increased sales from its enterprise
customers. The executive director explained, “We have a solution that
we developed that is a good example of one new offering we deliver on
Azure.”
Forrester models the benefits for the composite organization’s
manufacturing department as:
› Three to seven new orders each year are enabled by greater global
reach and reliability from workloads hosted on Azure IaaS.
› Each new order brings in an average of $100,000 in revenue.
› Not every dollar from every sale is attributable to Azure, so a 75%
benefit factor has been applied.
Since it is difficult to predict new sales related to increased global scale
and speed, Forrester adjusted this benefit downward by 15%, yielding a
three-year, risk-adjusted total PV of $927,081.
Income From New And Larger Online B2C Sales: Calculation Table
REF. METRIC CALC. YEAR 1 YEAR 2 YEAR 3
C1 Online B2C orders each month before Azure
From interviews 30,000 30,000 30,000
C2 Average order size before Azure From interviews $40 $40 $40
C3 Online B2C orders each month since Azure
From interviews 55,000 75,000 80,000
C4 Average order size since Azure From interviews $50 $52 $55
C5 Percentage of new and larger online B2C orders attributed to Azure
75% 75% 75%
C6 Income margin for online B2C sales 20% 20% 20%
Ct Income from new and larger online B2C sales
((C3-C1)*(C4-C2))*C5*C6*12
$450,000 $972,000 $1,350,000
Risk adjustment ↓15%
Ctr Income from new and larger online B2C sales (risk-adjusted)
$382,500 $826,200 $1,147,500
Additional income from new online enterprise
sales
$0
$250,000
$500,000
$750,000
Year 1 Year 3 Year 5
13 | The Total Economic Impact™ Of Microsoft Azure IaaS
Implementation risk is the risk that a proposed investment may deviate from the original or expected requirements, resulting in higher costs than anticipated. The greater the uncertainty, the wider the potential range of outcomes for cost estimates.
Unquantified Benefits
Some benefits are not able to be quantified financially, either because
they are not directly related to financial results or they’re areas that the
interviewed organizations have not yet measured. For the composite
organization, the following unquantified benefits should be considered to
add additional weight to the ROI analysis focus of this study:
› Value of Azure tools in improving business operations. The IT
director for a restaurant chain cited several ways in which Azure
capabilities helped enhance the business: “We’ve used the Azure
environment, including some of the new data tools such as the data
lake and event services, to help us with our single customer view. As
soon as a customer downloads a marketing promotion from the
website, we see they’ve done it and start communicating with them.
And by using some of the Azure tools, at no additional cost, we’ve
started to build some applications to influence our operations.”
› Easier access to new technologies. The organization is now able to
more flexibly and easily pilot new technologies with little or no upfront
investment. For example, one division wanted to try out Hadoop, so it
turned on that Azure service and started using it almost immediately.
The senior network engineer at a global professional services firm
explained, “One that would have been hard to stand up on site would
be Hadoop clusters, to try out some new potential business endeavors
around big data.” The director of IT at a global conglomerate said, “To
try out something on-premises would have been too cost prohibitive to
go down that path.”
› Development and testing process improvements. Some developer
and QA improvements are included above, in the cost savings enabled
by migrating on-premises and outsourced servers to Azure IaaS. Much
of that was for developer and QA workloads. But developer and QA
benefits go beyond simple server changes:
• Developers and testers can set up environments much more
quickly. They can create an environment that exactly matches
production in just a few clicks.
Income From New Enterprise Client Sales: Calculation Table
REF.
METRIC CALC. YEAR 1 YEAR 2 YEAR 3
D1 New enterprise client orders each month 3 5 7
D2 Value of each order (average) $100,000 $100,000 $100,000
D3 Income margin for enterprise sales 10% 10% 10%
D4 Percentage of new enterprise client orders enabled by Azure
75% 75% 75%
Dt Income from new enterprise sales D1*D2*D3*D4*12 $270,000 $450,000 $630,000
Risk adjustment ↓15%
Dtr Income from new enterprise client sales (risk-adjusted)
$229,500 $382,500 $535,500
“Instead of the staff focusing on
just keeping the lights on, they
are into more forward-looking
strategic activities. Now we’re
all about added value, rather
than managing backups.”
IT director, restaurant chain
14 | The Total Economic Impact™ Of Microsoft Azure IaaS
Flexibility, as defined by TEI, represents an investment in additional capacity or capability that could be turned into business benefit for a future additional investment. This provides an organization with the “right” or the ability to engage in future initiatives but not the obligation to do so.
• Developers can take advantage of Azure integrations more
easily. In order to complete tasks more quickly, developers can
avoid issues that come up when production and development
environments are not identical. “Now we can easily spin up a
number of different environments,” said the project director at a
software and services vendor.
• Developers can self-provision assets. For example, they
can turn on a specific testing environment, meaning less time
waiting for servers to install or for requests to be completed,
or even for physical servers to be ordered and set up.
• Applications and modules can be completed more
quickly and more accurately. This means that time-to-
market can be reduced for client projects, and employees can
take advantage of improvements sooner for internal projects.
› Workload and service rightsizing. Some services can be turned
off during quiet hours, such as the dev/test environment. “From
about 10 p.m. until 6 a.m., we shut the environment down,” said
the manager of web technologies for a sporting goods
manufacturer, highlighting the benefits enabled by services such
as Azure virtual machines and dev/test labs. Some of these costs
are incorporated in the cost savings highlighted above, as well as
the cost of ongoing Azure subscriptions, but additional
opportunities to rightsize services and turn them off when not in
use are expected.
› Streamlines the organization’s journey toward Azure PaaS.
The lift-and-shift migration of many server workloads to Azure IaaS
has created new opportunities and significantly saved on IT costs.
Like the improvement of its website, the composite organization
will start to consider what services and applications can be moved
to Azure PaaS, as an opportunity to take advantage of additional
Microsoft services, to simplify IT, and to provide employees,
partners, and customers with additional opportunities to access
and share information and services. Potential benefits are detailed
in the Total Economic Impact Of Microsoft Azure PaaS.2
Flexibility
The value of flexibility is clearly unique to each customer, and the
measure of its value varies from organization to organization. There are
multiple scenarios in which a customer might choose to implement Azure
and later realize additional uses and business opportunities, including:
› The organization can continue to expand its use of Azure’s
functionality. For instance, the IT director for a restaurant chain
described: “We’re starting to play around with the internet of things, for
which there’s a whole Azure environment. It’s something we’re going to
look at. In our world, being able to connect our fridges and our ovens
and our air conditioning units and understand what they’re doing and
how much energy they’re consuming, is a big thing. And then how we
can use that data for proactive maintenance, or to help us reduce
energy costs, or even to remove tasks such as taking temperatures of
fridges.”
Additional benefits:
• Ability to easily pilot new technologies, without making large upfront investments
• Developer and test productivity
• Service rightsizing and turning off when not in use
15 | The Total Economic Impact™ Of Microsoft Azure IaaS
› As the organization moves more workloads to Azure, it can take
advantage of the accounting and financial opportunities of moving
even more capital expenditures to operational costs.
› The organization can also tune and optimize infrastructure more
effectively. For example, one interviewed organization has enabled
and tested multiple Azure configurations. (For example, does it really
need eight cores per instance? Or do four-core or two-core instances
meet its needs?) This organization has tested its Azure infrastructure
configuration to find the best combinations of server numbers, size,
and other operational characteristics, with the goal of delivering the
best performance at a reasonable cost.
Flexibility would also be quantified when evaluated as part of a specific
project (described in more detail in Appendix A).
16 | The Total Economic Impact™ Of Microsoft Azure IaaS
The table above shows the total of all costs across the areas listed below, as well as present values (PVs) discounted at 10%. Over three years, the composite organization expects risk-adjusted total costs to be a PV of $2.3 million.
Analysis Of Costs
QUANTIFIED COST DATA AS APPLIED TO THE COMPOSITE
Costs Of Azure Implementation And Initial Workload
Migration
For the composite organization, the first deployed workloads were
primarily lift and shift (with the customer-facing website exception already
discussed). The organization estimates that it required three FTEs over
20 weeks for the initial migration, for tasks including:
› Planning, particularly around any impact that migrating a workload may
have on IT resources, applications, or business processes.
› Training for IT resources to learn how to manage Azure as well as the
workloads running on it.
› Data migration and preparation for workloads and/or data sources
being migrated or connected to an Azure service.
› Implementation effort to finally migrate each workload.
Some added costs were incurred for some additional consulting
assistance.
For most organizations, migration into Azure is not a one-time event, but
often lasts several years as the company migrates hundreds of
applications and changes business processes. While the training and
planning time is no longer needed, migration best practices can help
save time, and some resource time is required to move and monitor
those workloads on Azure IaaS. These costs are included in the Ongoing
Azure Costs And Additional Workload Migration section below.
The implementation costs add up to $218,000. Implementation costs will
vary based on the number and nature of workloads deployed and the IT
labor compensation rates. To account for these risks, Forrester adjusted
this cost upward by 10%, yielding a three-year, risk-adjusted total PV of
$239,800.
Total Costs
REF. COST INITIAL YEAR 1 YEAR 2 YEAR 3 TOTAL PRESENT VALUE
Etr Costs of Azure implementation and initial workload migration
$239,800 $0 $0 $0 $239,800 $239,800
Ftr Ongoing Azure costs and additional workload migration
F4 Average fully loaded salary $110,000 $110,000 $110,000
Ft Ongoing Azure costs and additional workload migration
F1+F2+(F3*F4) $0 $585,950 $743,688 $919,609
Risk adjustment ↑10%
Ftr Ongoing Azure costs and additional workload migration (risk-adjusted)
$0 $644,545 $818,056 $1,011,570
19 | The Total Economic Impact™ Of Microsoft Azure IaaS
The financial results calculated in the Benefits and Costs sections can be used to determine the ROI, NPV, and payback period for the composite organization's investment. Forrester assumes a yearly discount rate of 10% for this analysis.
Financial Summary
CONSOLIDATED THREE-YEAR RISK-ADJUSTED METRICS
Cash Flow Chart (Risk-Adjusted)
-$2.0 M
$2.0 M
$4.0 M
$6.0 M
$8.0 M
$10.0 M
$12.0 M
$14.0 M
$16.0 M
Initial Year 1 Year 2 Year 3
Cashflows
Total costs
Total benefits
Cumulative net benefits
These risk-adjusted ROI,
NPV, and payback period
values are determined by
applying risk-adjustment
factors to the unadjusted
results in each Benefit and
Cost section.
Cash Flow Table (Risk-Adjusted)
INITIAL YEAR 1 YEAR 2 YEAR 3 TOTAL PRESENT VALUE
Total costs ($239,800) ($644,545) ($818,056) ($1,011,570) ($2,713,972) ($2,261,837)
Total benefits $0 $3,438,900 $5,344,763 $7,370,719 $16,154,381 $13,081,162
Net benefits ($239,800) $2,794,355 $4,526,706 $6,359,148 $13,440,410 $10,819,325
ROI 478%
Payback period <3 months
20 | The Total Economic Impact™ Of Microsoft Azure IaaS
Microsoft Azure IaaS: Overview
The following information is provided by Microsoft. Forrester has not validated any claims and does not endorse
Microsoft or its offerings.
Microsoft Azure is a global, trusted, and Hybrid cloud platform that enables organizations to quickly build, deploy,
and manage applications across a large network of Microsoft-managed data centers, supporting migration and
deployment of applications in close proximity to customers and supporting geo-redundancy. In addition to having
the largest global scale, Azure is a trusted cloud with the largest compliance portfolio with certifications and
security attestations. Azure is the only cloud provider that provides a comprehensive and consistent Hybrid
platform with capabilities like Azure Stack, Azure Stack HCI and Azure Active Directory.
Microsoft Azure enables organizations to build and run applications without focusing on the infrastructure. It
provides automatic operating system and service patching, built-in network load balancing, and resiliency against
hardware failures. It supports a deployment model that enables customers to upgrade applications without
downtime.
Microsoft Azure IaaS comprises core services such as compute, storage, networking, security, and related
management capabilities. It facilitates large scaling of applications with features like scale sets and managed
disks. It is an automated self-service platform with services like Azure Resource Manager that allow for fast and
templatized resource provisioning. It supports a flexible billing model where customers are charged for the
virtualized machines used by the second.
Microsoft Azure provides open source, flexible, and cross-platform support across a broad selection of
programming languages, frameworks, tools, databases, and architectures, such as .NET, Node.js, Java, PHP,
and Python. It allows organizations to reliably host and scale out application code, storing data using relational
SQL databases and NoSQL data stores, as well as advanced data analytics services, to extract value from all
21 | The Total Economic Impact™ Of Microsoft Azure IaaS
Appendix A: Total Economic Impact
Total Economic Impact is a methodology developed by Forrester
Research that enhances a company’s technology decision-making
processes and assists vendors in communicating the value proposition
of their products and services to clients. The TEI methodology helps
companies demonstrate, justify, and realize the tangible value of IT
initiatives to both senior management and other key business
stakeholders.
Total Economic Impact Approach
Benefits represent the value delivered to the business by the
product. The TEI methodology places equal weight on the
measure of benefits and the measure of costs, allowing for a
full examination of the effect of the technology on the entire
organization.
Costs consider all expenses necessary to deliver the
proposed value, or benefits, of the product. The cost category
within TEI captures incremental costs over the existing
environment for ongoing costs associated with the solution.
Flexibility represents the strategic value that can be
obtained for some future additional investment building on
top of the initial investment already made. Having the ability
to capture that benefit has a PV that can be estimated.
Risks measure the uncertainty of benefit and cost estimates
given: 1) the likelihood that estimates will meet original
projections and 2) the likelihood that estimates will be
tracked over time. TEI risk factors are based on “triangular
distribution.”
The initial investment column contains costs incurred at “time 0” or at the
beginning of Year 1 that are not discounted. All other cash flows are discounted
using the discount rate at the end of the year. PV calculations are calculated for
each total cost and benefit estimate. NPV calculations in the summary tables are
the sum of the initial investment and the discounted cash flows in each year.
Sums and present value calculations of the Total Benefits, Total Costs, and
Cash Flow tables may not exactly add up, as some rounding may occur.
Present value (PV)
The present or current value of (discounted) cost and benefit estimates given at an interest rate (the discount rate). The PV of costs and benefits feed into the total NPV of cash flows.
Net present value (NPV)
The present or current value of (discounted) future net cash flows given an interest rate (the discount rate). A positive project NPV normally indicates that the investment should be made, unless other projects have higher NPVs.
Return on investment (ROI)
A project’s expected return in percentage terms. ROI is calculated by dividing net benefits (benefits less costs) by costs.
Discount rate
The interest rate used in cash flow analysis to take into account the time value of money. Organizations typically use discount rates between 8% and 16%.
Payback period
The breakeven point for an investment. This is the point in time at which net benefits (benefits minus costs) equal initial investment or cost.
22 | The Total Economic Impact™ Of Microsoft Azure IaaS
Appendix B: Endnotes
1 Source: “The Total Economic Impact™ Of Microsoft Azure IaaS,” Forrester Consulting report prepared for Microsoft, July 2017. 2 Source: “The Total Economic Impact™ Of Microsoft Azure PaaS,” Forrester Consulting report prepared for Microsoft, June 2016.


![[PPT]SQL Workloads on Azurevideo.ch9.ms/sessions/azure/IaaS-for-IT-Pros/Day4-Mod3... · Web viewVMs hosted on Microsoft Azure Infrastructure (“IaaS”) From Microsoft images or](https://static.documents.pub/doc/80x56/5b09f0a97f8b9a45518b72e0/pptsql-workloads-on-viewvms-hosted-on-microsoft-azure-infrastructure-iaas.jpg)