37
the total feed business ForFarmers N.V. Roadshow presentation 1H 2017
| Date post: | 26-Jul-2018 |
| Category: |
Documents |
| Upload: | trinhtuyen |
| View: | 214 times |
| Download: | 0 times |
the total feed business
ForFarmers N.V. Roadshow presentation 1H 2017
NOTIFICATIONS AND DISCLAIMER
REPORTING STANDARDS PUBLICATION 2017 HALF-YEAR REPORT The 2017 half-year report (incl. condensed consolidated interim financial statements) will be available from 17 August 2017 on the ForFarmers website (www.forfarmersgroup.eu). REPORTING STANDARDS The results in this presentation are derived from the ForFarmers 2017 half-year financial statements, which have not been audited by the external auditor, and have been drawn up in accordance with the International Financial Reporting Standards as adopted by the EU (IFRS). General remark: percentages are presented based on the rounded amounts in million euro SUPERVISION In view of the fact that shares are freely tradable on EURONEXT Amsterdam, ForFarmers operates under the supervision of the Financial Markets Authority (AFM) and the company acts in accordance with the prevailing regulations for share-issuing companies. IMPORTANT DATES 09-11-2017 Publication Q3 2017 Trading Update 13-03-2018 Publication 2017 annual results 26-04-2018 Annual General Meeting 03-05-2018 Publication Q1 2018 Trading Update 16-08-2018 Publication first half-year 2018 results FORWARD-LOOKING STATEMENTS This presentation contains forward-looking statements, including those relating to ForFarmers legal obligations in terms of capital and liquidity positions in certain specified scenarios. In addition, forward-looking statements, without limitation, may include such phrases as “intends to”, "expects“, “takes into account”, "is aimed at“, ''plans to”, "estimated" and words with a similar meaning. These statements pertain to or may affect matters in the future, such as ForFarmers future financial results, business plans and current strategies. Forward-looking statements are subject to a number of risks and uncertainties, which may mean that there could be material differences between actual results and performance and expected future results or performances that are implicitly or explicitly included in the forward-looking statements. Factors that may result in variations on the current expectations or may contribute to the same include but are not limited to: developments in legislation, technology, jurisprudence and regulations, share price fluctuations, legal procedures, investigations by regulatory bodies, the competitive landscape and general economic conditions. These and other factors, risks and uncertainties that may affect any forward-looking statements or the actual results of ForFarmers, are discussed in the last published annual report. The forward-looking statements in this presentation are only statements as of the date of this document and ForFarmers accepts no obligation or responsibility with respect to any changes made to the forward-looking statements contained in this document, regardless of whether these pertain to new information, future events or otherwise, unless ForFarmers is legally obliged to do so.
2
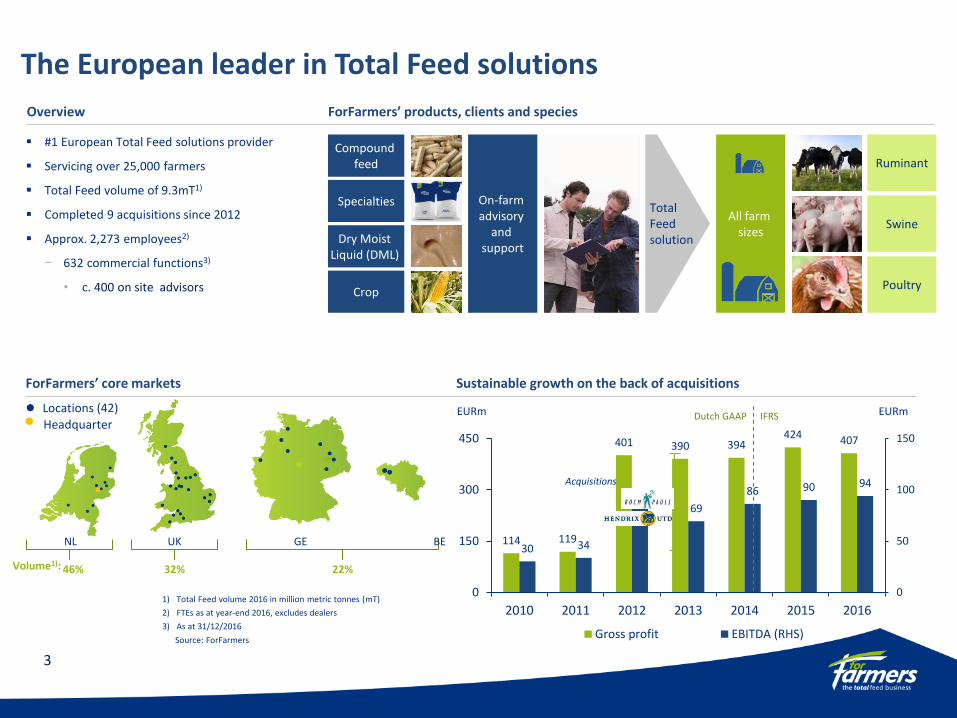
The European leader in Total Feed solutions
#1 European Total Feed solutions provider
Servicing over 25,000 farmers
Total Feed volume of 9.3mT1)
Completed 9 acquisitions since 2012
Approx. 2,273 employees2)
− 632 commercial functions3)
• c. 400 on site advisors
ForFarmers’ products, clients and species Overview
Sustainable growth on the back of acquisitions
46% 32% 22%
ForFarmers’ core markets
Headquarter Locations (42)
114 119
401 390 394 424 407
30 34
81 69
86 90 94
0
50
100
150
0
150
300
450
2010 2011 2012 2013 2014 2015 2016
Gross profit EBITDA (RHS)
Volume1):
EURm
Acquisitions
All farm sizes
Ruminant
Swine
Poultry
EURm IFRS Dutch GAAP
1) Total Feed volume 2016 in million metric tonnes (mT)
2) FTEs as at year-end 2016, excludes dealers
3) As at 31/12/2016
Source: ForFarmers
Total Feed solution
Compound feed
Specialties
Dry Moist Liquid (DML)
Crop
On-farm advisory
and support
NL UK GE BE
3
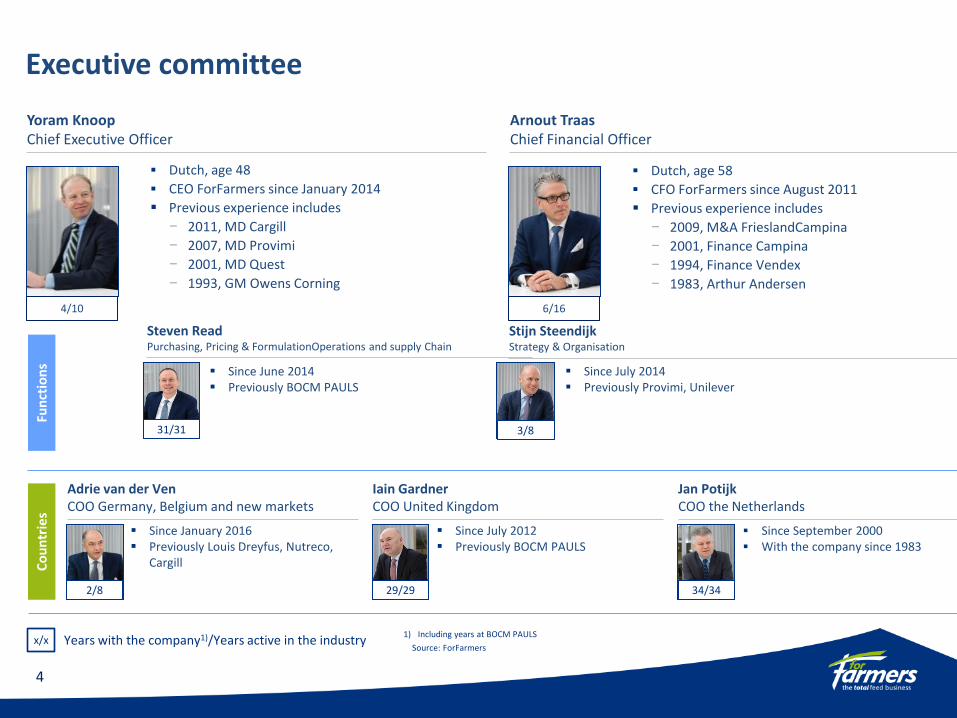
Executive committee
Yoram Knoop Chief Executive Officer
Dutch, age 48
CEO ForFarmers since January 2014
Previous experience includes
− 2011, MD Cargill
− 2007, MD Provimi
− 2001, MD Quest
− 1993, GM Owens Corning
Arnout Traas Chief Financial Officer
Dutch, age 58
CFO ForFarmers since August 2011
Previous experience includes
− 2009, M&A FrieslandCampina
− 2001, Finance Campina
− 1994, Finance Vendex
− 1983, Arthur Andersen
1) Including years at BOCM PAULS
Source: ForFarmers
Since September 2000 With the company since 1983
Since June 2014 Previously BOCM PAULS
Since January 2016 Previously Louis Dreyfus, Nutreco,
Cargill Co
un
trie
s
Since July 2012 Previously BOCM PAULS
Since July 2014 Previously Provimi, Unilever
Fun
ctio
ns
Jan Potijk COO the Netherlands
Steven Read Purchasing, Pricing & FormulationOperations and supply Chain
Stijn Steendijk Strategy & Organisation
Adrie van der Ven COO Germany, Belgium and new markets
Iain Gardner COO United Kingdom
x/x Years with the company1)/Years active in the industry
31/31
2/8 29/29 34/34
3/8
4
4/10 6/16
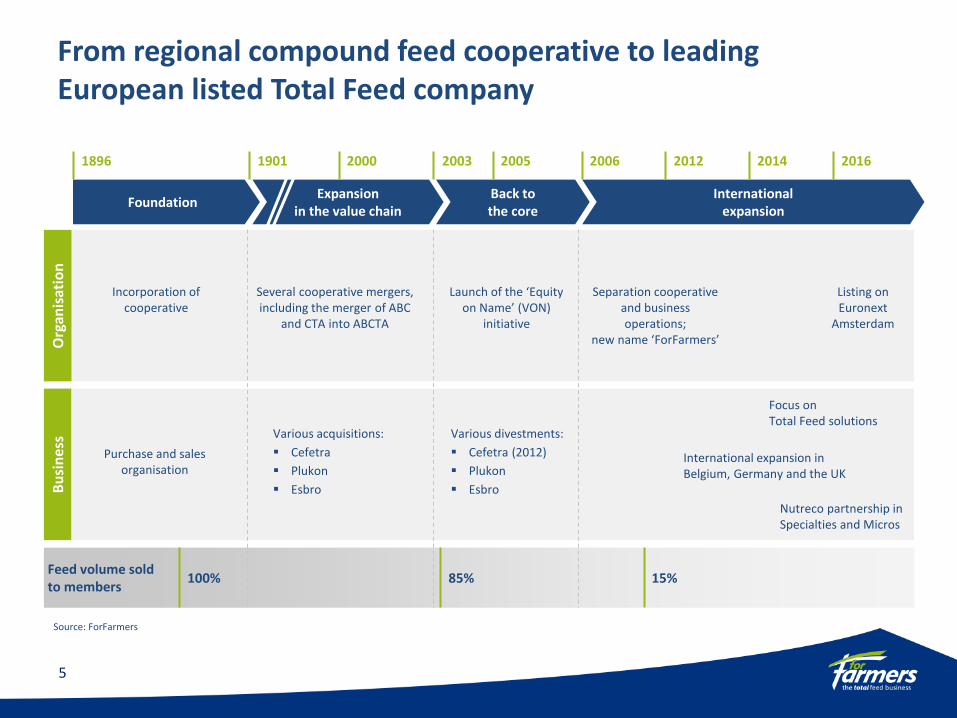
From regional compound feed cooperative to leading European listed Total Feed company
Bu
sin
ess
2006 2016 1896 1901
Expansion in the value chain
Foundation
Feed volume sold to members
Listing on Euronext
Amsterdam
Separation cooperative and business operations;
new name ‘ForFarmers’
Nutreco partnership in Specialties and Micros
Org
anis
atio
n
Incorporation of cooperative
Several cooperative mergers, including the merger of ABC
and CTA into ABCTA
International expansion
85% 15% 100%
Back to the core
2003 2000
Purchase and sales organisation
2005
Launch of the ‘Equity on Name’ (VON)
initiative
2014
Focus on Total Feed solutions
2012
International expansion in Belgium, Germany and the UK
Various acquisitions:
Cefetra
Plukon
Esbro
Various divestments:
Cefetra (2012)
Plukon
Esbro
Source: ForFarmers
5
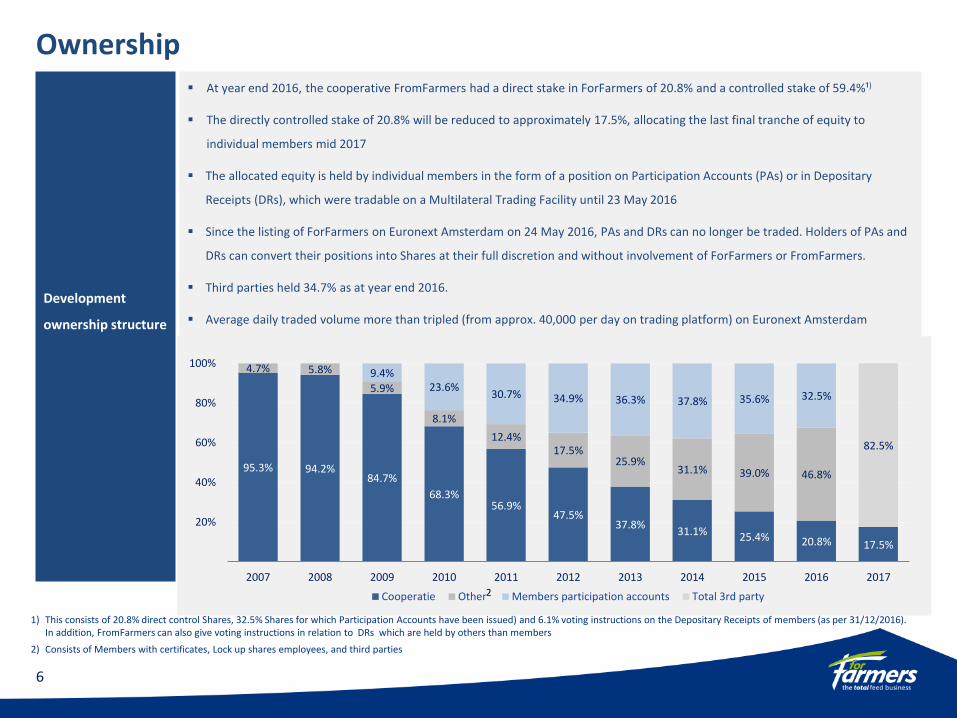
Development
ownership structure
At year end 2016, the cooperative FromFarmers had a direct stake in ForFarmers of 20.8% and a controlled stake of 59.4%¹)
The directly controlled stake of 20.8% will be reduced to approximately 17.5%, allocating the last final tranche of equity to
individual members mid 2017
The allocated equity is held by individual members in the form of a position on Participation Accounts (PAs) or in Depositary
Receipts (DRs), which were tradable on a Multilateral Trading Facility until 23 May 2016
Since the listing of ForFarmers on Euronext Amsterdam on 24 May 2016, PAs and DRs can no longer be traded. Holders of PAs and
DRs can convert their positions into Shares at their full discretion and without involvement of ForFarmers or FromFarmers.
Third parties held 34.7% as at year end 2016.
Average daily traded volume more than tripled (from approx. 40,000 per day on trading platform) on Euronext Amsterdam
(**??on the basis of double counting??)
1) This consists of 20.8% direct control Shares, 32.5% Shares for which Participation Accounts have been issued) and 6.1% voting instructions on the Depositary Receipts of members (as per 31/12/2016). In addition, FromFarmers can also give voting instructions in relation to DRs which are held by others than members
2) Consists of Members with certificates, Lock up shares employees, and third parties
Ownership
95.3% 94.2% 84.7%
68.3% 56.9%
47.5% 37.8%
31.1% 25.4% 20.8% 17.5%
4.7% 5.8%
5.9%
8.1%
12.4% 17.5%
25.9% 31.1% 39.0% 46.8%
9.4% 23.6%
30.7% 34.9% 36.3% 37.8% 35.6% 32.5%
82.5%
20%
40%
60%
80%
100%
2007 2008 2009 2010 2011 2012 2013 2014 2015 2016 2017
Cooperatie Other Members participation accounts Total 3rd party2
6
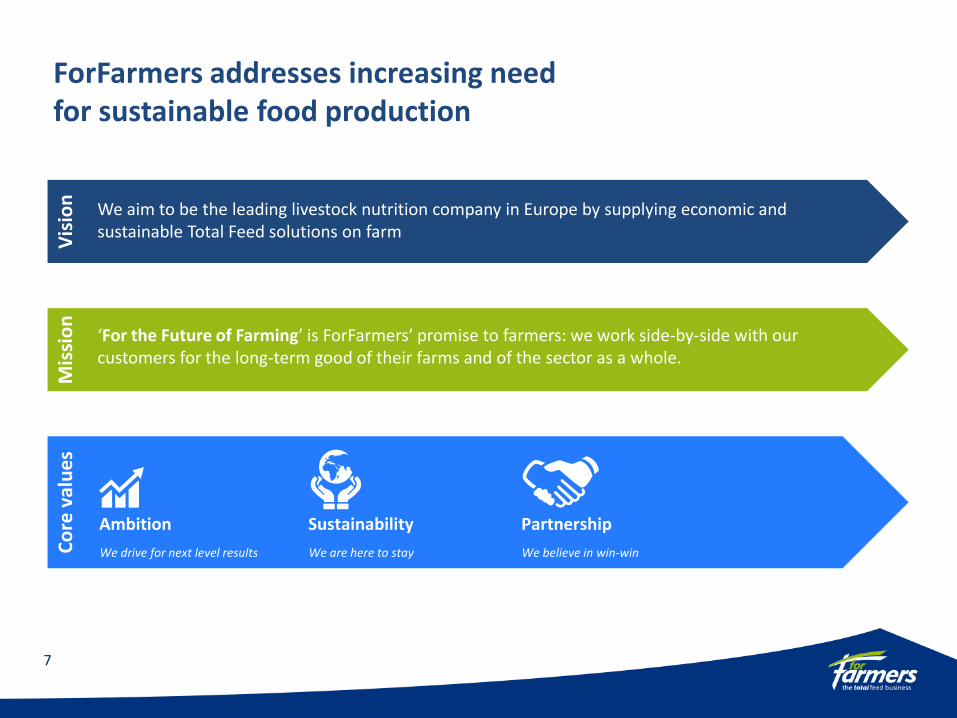
ForFarmers addresses increasing need for sustainable food production
Co
re v
alu
es
Vis
ion
M
issi
on
Ambition
We drive for next level results
Sustainability
We are here to stay
Partnership
We believe in win-win
We aim to be the leading livestock nutrition company in Europe by supplying economic and sustainable Total Feed solutions on farm
‘For the Future of Farming’ is ForFarmers’ promise to farmers: we work side-by-side with our customers for the long-term good of their farms and of the sector as a whole.
7
8
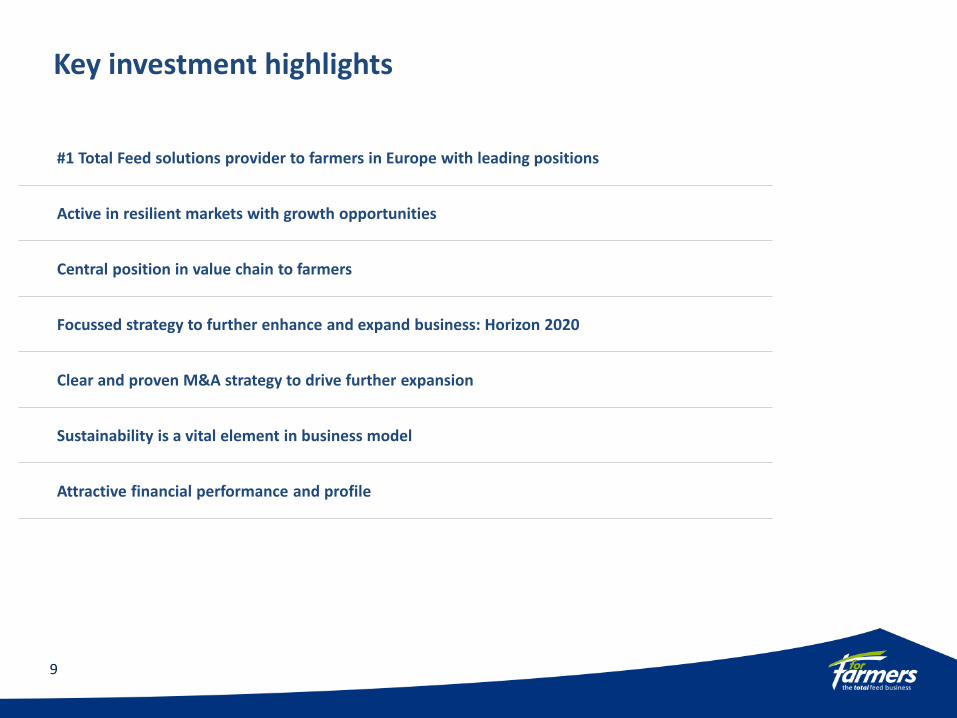
Key investment highlights
#1 Total Feed solutions provider to farmers in Europe with leading positions
Active in resilient markets with growth opportunities
Central position in value chain to farmers
Focussed strategy to further enhance and expand business: Horizon 2020
Clear and proven M&A strategy to drive further expansion
Sustainability is a vital element in business model
Attractive financial performance and profile
9
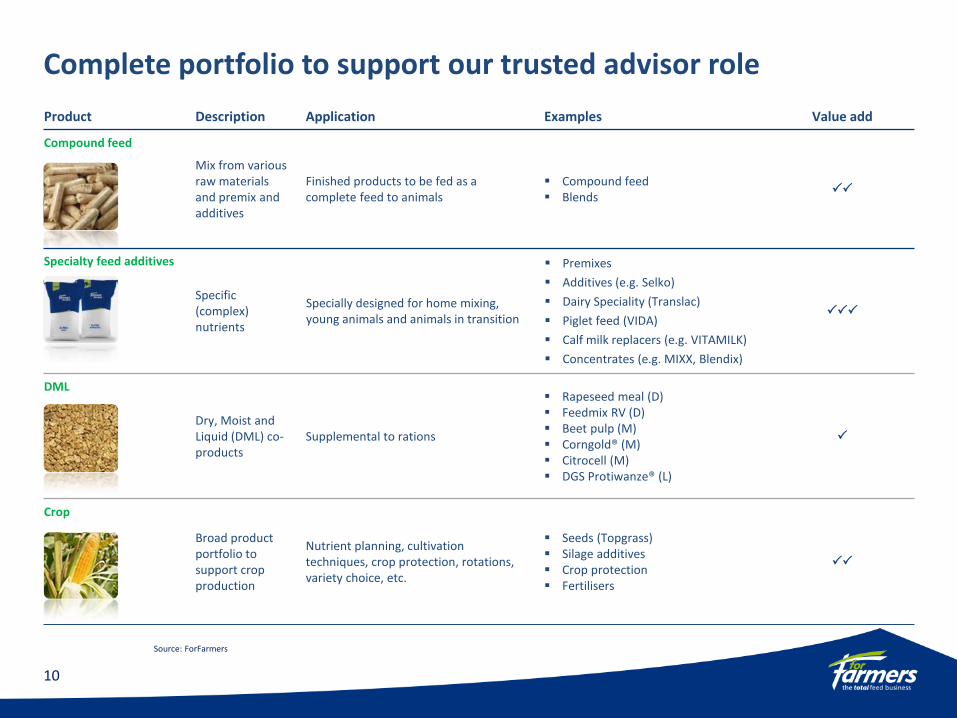
Complete portfolio to support our trusted advisor role
Product Description Application Examples Value add
Compound feed
Mix from various raw materials and premix and additives
Finished products to be fed as a complete feed to animals
Compound feed Blends
Specialty feed additives
Specific (complex) nutrients
Specially designed for home mixing, young animals and animals in transition
Premixes
Additives (e.g. Selko)
Dairy Speciality (Translac)
Piglet feed (VIDA)
Calf milk replacers (e.g. VITAMILK)
Concentrates (e.g. MIXX, Blendix)
DML
Dry, Moist and Liquid (DML) co-products
Supplemental to rations
Rapeseed meal (D) Feedmix RV (D) Beet pulp (M) Corngold® (M) Citrocell (M) DGS Protiwanze® (L)
Crop
Broad product portfolio to support crop production
Nutrient planning, cultivation techniques, crop protection, rotations, variety choice, etc.
Seeds (Topgrass) Silage additives Crop protection Fertilisers
Source: ForFarmers
10
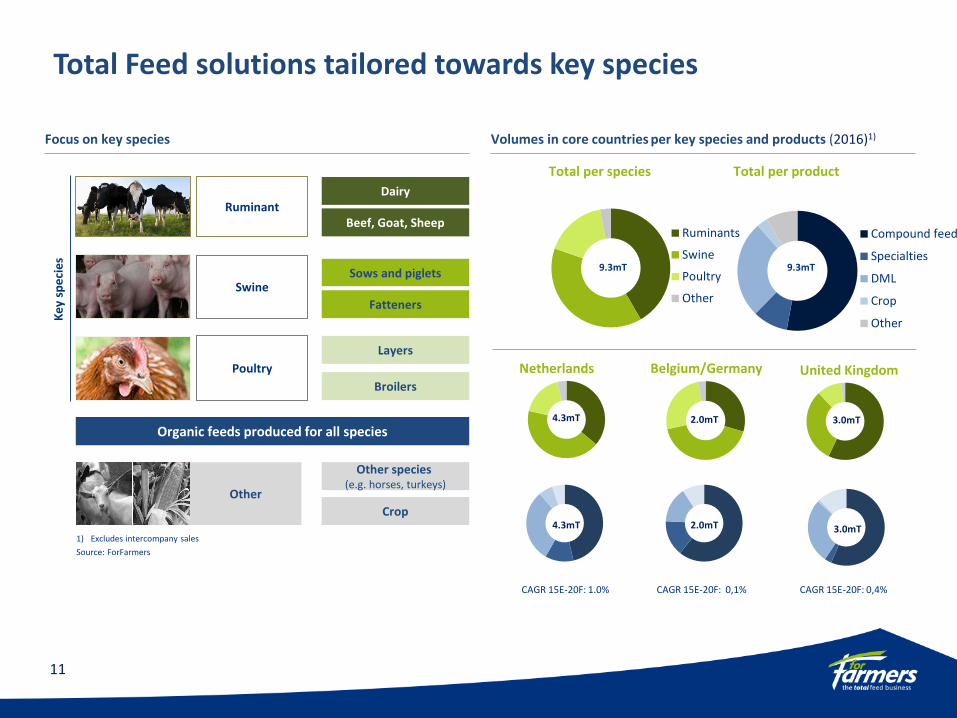
Total Feed solutions tailored towards key species
Volumes in core countries per key species and products (2016)1) Focus on key species
Poultry
Layers
Broilers
Ke
y sp
eci
es
Ruminant Dairy
Beef, Goat, Sheep
Swine
Fatteners
United Kingdom
Other
Belgium/Germany
Other species (e.g. horses, turkeys)
Crop
Sows and piglets
Netherlands
4.3mT 2.0mT 3.0mT Organic feeds produced for all species
4.3mT 2.0mT 3.0mT
9.3mT 9.3mT
Total per species Total per product
1) Excludes intercompany sales
Source: ForFarmers
CAGR 15E-20F: 1.0% CAGR 15E-20F: 0,1% CAGR 15E-20F: 0,4%
Compound feed
Specialties
DML
Crop
Other
Ruminants
Swine
Poultry
Other
11
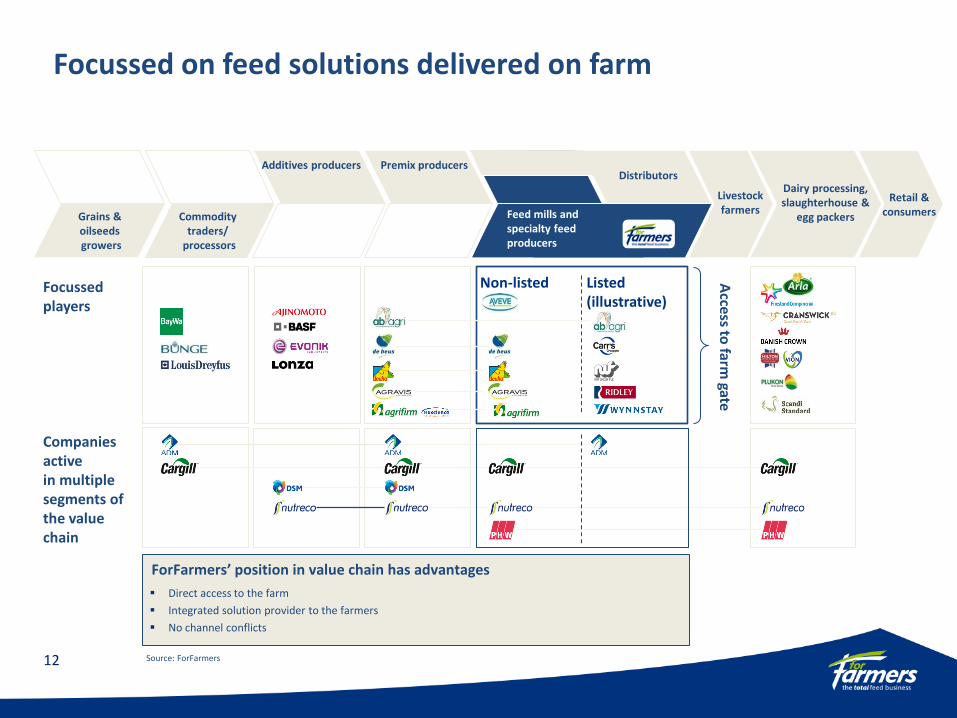
Focussed on feed solutions delivered on farm
Distributors
Feed mills and specialty feed producers
Livestock farmers
Dairy processing, slaughterhouse &
egg packers
Direct access to the farm
Integrated solution provider to the farmers
No channel conflicts
ForFarmers’ position in value chain has advantages
Listed (illustrative)
Non-listed
Grains & oilseeds growers
Commodity traders/
processors
Additives producers Premix producers
Companies active in multiple segments of the value chain
Retail & consumers
Access to
farm gate
Focussed players
Source: ForFarmers 12
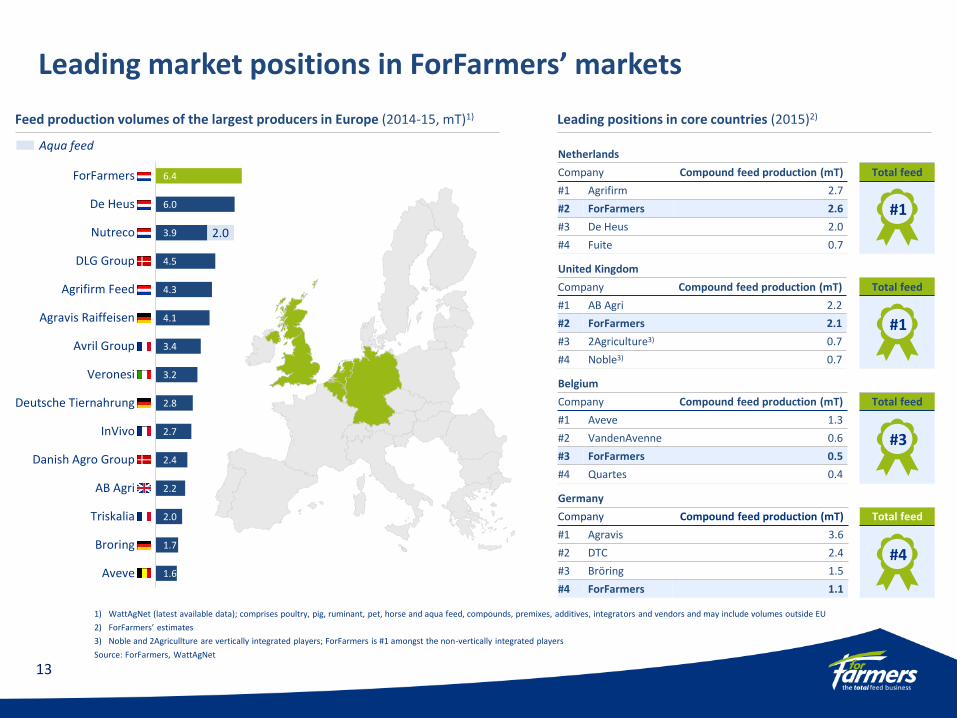
Leading market positions in ForFarmers’ markets
6.4
6.0
3.9
4.5
4.3
4.1
3.4
3.2
2.8
2.7
2.4
2.2
2.0
1.7
1.6
2.0
ForFarmers
De Heus
Nutreco
DLG Group
Agrifirm Feed
Agravis Raiffeisen
Avril Group
Veronesi
Deutsche Tiernahrung
InVivo
Danish Agro Group
AB Agri
Triskalia
Broring
Aveve
1) WattAgNet (latest available data); comprises poultry, pig, ruminant, pet, horse and aqua feed, compounds, premixes, additives, integrators and vendors and may include volumes outside EU
2) ForFarmers’ estimates
3) Noble and 2Agricullture are vertically integrated players; ForFarmers is #1 amongst the non-vertically integrated players
Source: ForFarmers, WattAgNet
Feed production volumes of the largest producers in Europe (2014-15, mT)1)
Netherlands
Company Compound feed production (mT) Total feed
#1 Agrifirm 2.7
#2 ForFarmers 2.6
#3 De Heus 2.0
#4 Fuite 0.7
Leading positions in core countries (2015)2)
#1
Aqua feed
United Kingdom
Company Compound feed production (mT) Total feed
#1 AB Agri 2.2
#2 ForFarmers 2.1
#3 2Agriculture3) 0.7
#4 Noble3) 0.7
Belgium
Company Compound feed production (mT) Total feed
#1 Aveve 1.3
#2 VandenAvenne 0.6
#3 ForFarmers 0.5
#4 Quartes 0.4
Germany
Company Compound feed production (mT) Total feed
#1 Agravis 3.6
#2 DTC 2.4
#3 Bröring 1.5
#4 ForFarmers 1.1
#1
#3
#4
13
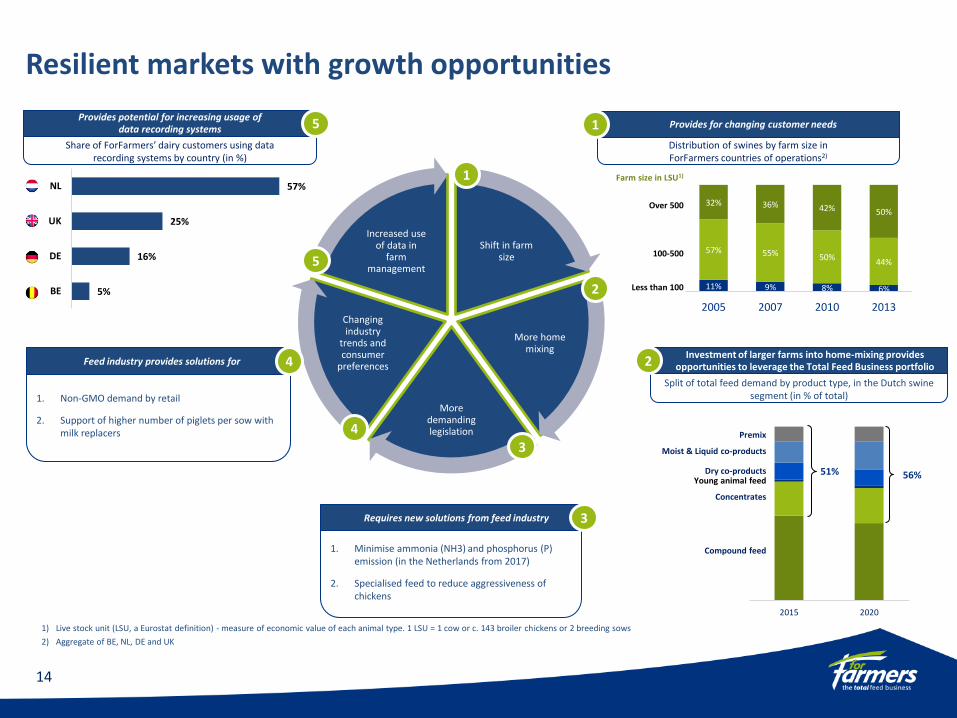
Resilient markets with growth opportunities
Split of total feed demand by product type, in the Dutch swine segment (in % of total)
Distribution of swines by farm size in ForFarmers countries of operations2)
11% 9% 8% 6%
57% 55% 50% 44%
32% 36% 42% 50%
2005 2007 2010 2013
Share of ForFarmers’ dairy customers using data recording systems by country (in %)
1) Live stock unit (LSU, a Eurostat definition) - measure of economic value of each animal type. 1 LSU = 1 cow or c. 143 broiler chickens or 2 breeding sows
2) Aggregate of BE, NL, DE and UK
Shift in farm size
More home mixing
More demanding legislation
Changing industry
trends and consumer
preferences
Increased use of data in
farm management
1
2
3
4
5
1. Minimise ammonia (NH3) and phosphorus (P) emission (in the Netherlands from 2017)
2. Specialised feed to reduce aggressiveness of chickens
1. Non-GMO demand by retail
2. Support of higher number of piglets per sow with milk replacers
Less than 100
100-500
Over 500
Provides for changing customer needs
Farm size in LSU1)
2015 2020
Compound feed
Concentrates
Premix
Young animal feed Dry co-products
Moist & Liquid co-products
51% 56%
Investment of larger farms into home-mixing provides opportunities to leverage the Total Feed Business portfolio
5%
16%
25%
57%
BE
DE
UK
NL
Provides potential for increasing usage of data recording systems 1
2
5
Feed industry provides solutions for 4
Requires new solutions from feed industry 3
14
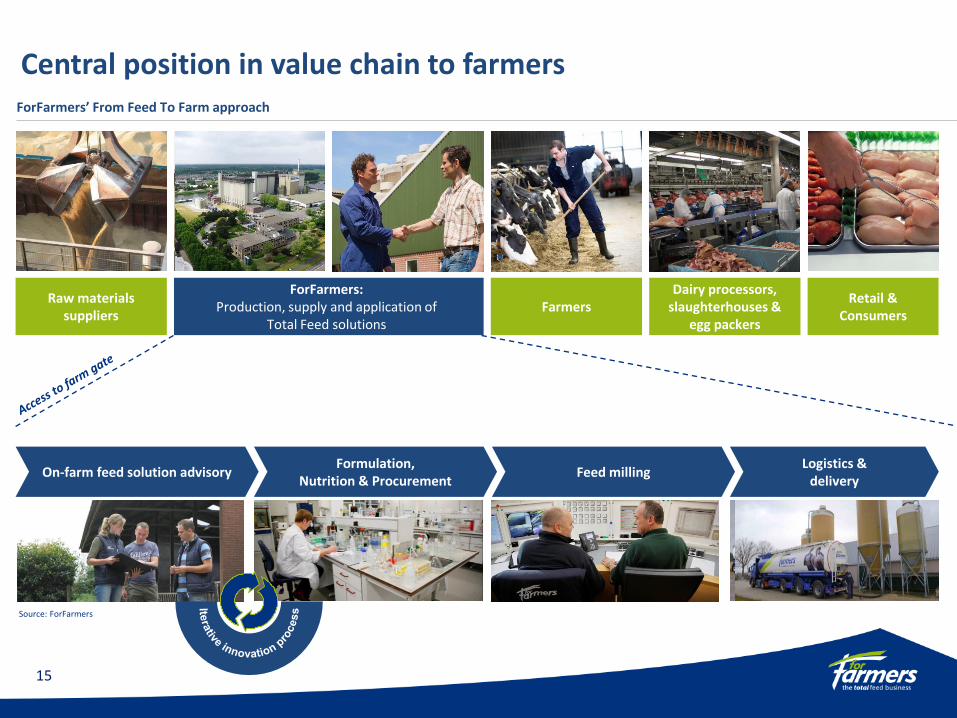
Central position in value chain to farmers ForFarmers’ From Feed To Farm approach
Feed milling Logistics &
delivery Formulation,
Nutrition & Procurement
Raw materials suppliers
ForFarmers: Production, supply and application of
Total Feed solutions Farmers
Dairy processors, slaughterhouses &
egg packers
Retail & Consumers
Source: ForFarmers
On-farm feed solution advisory
15
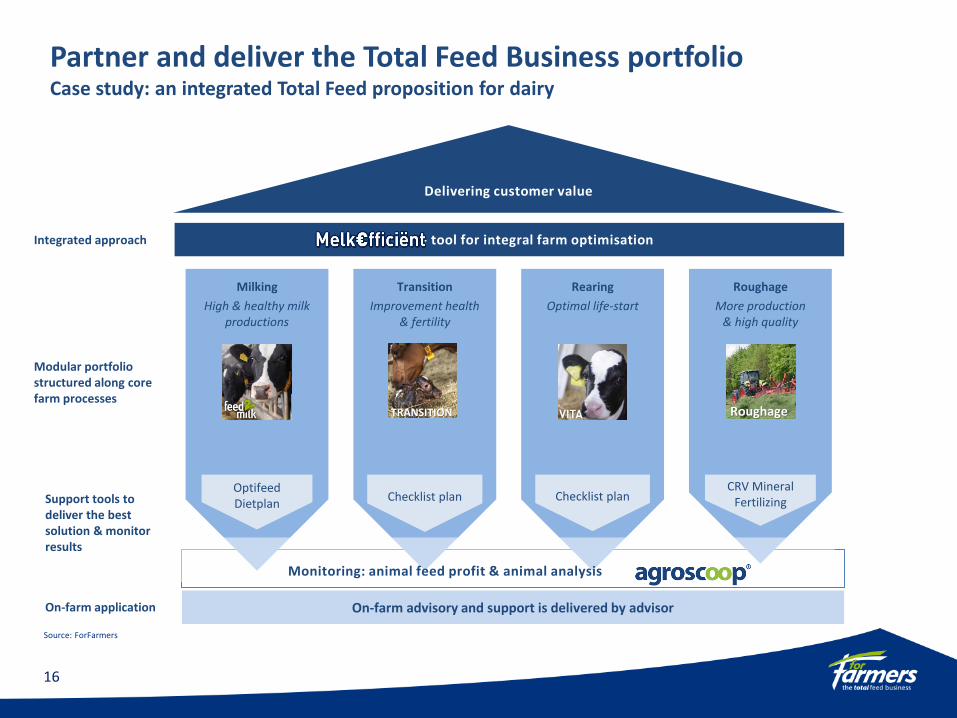
Milking
High & healthy milk productions
Transition
Improvement health & fertility
Rearing
Optimal life-start
Roughage
More production & high quality
Delivering customer value
Modular portfolio structured along core farm processes
Support tools to deliver the best solution & monitor results
- tool for integral farm optimisation
Optifeed Dietplan
Checklist plan Checklist plan CRV Mineral
Fertilizing
Monitoring: animal feed profit & animal analysis
On-farm application On-farm advisory and support is delivered by advisor
Integrated approach
Partner and deliver the Total Feed Business portfolio Case study: an integrated Total Feed proposition for dairy
TRANSITION Roughage
Source: ForFarmers
16
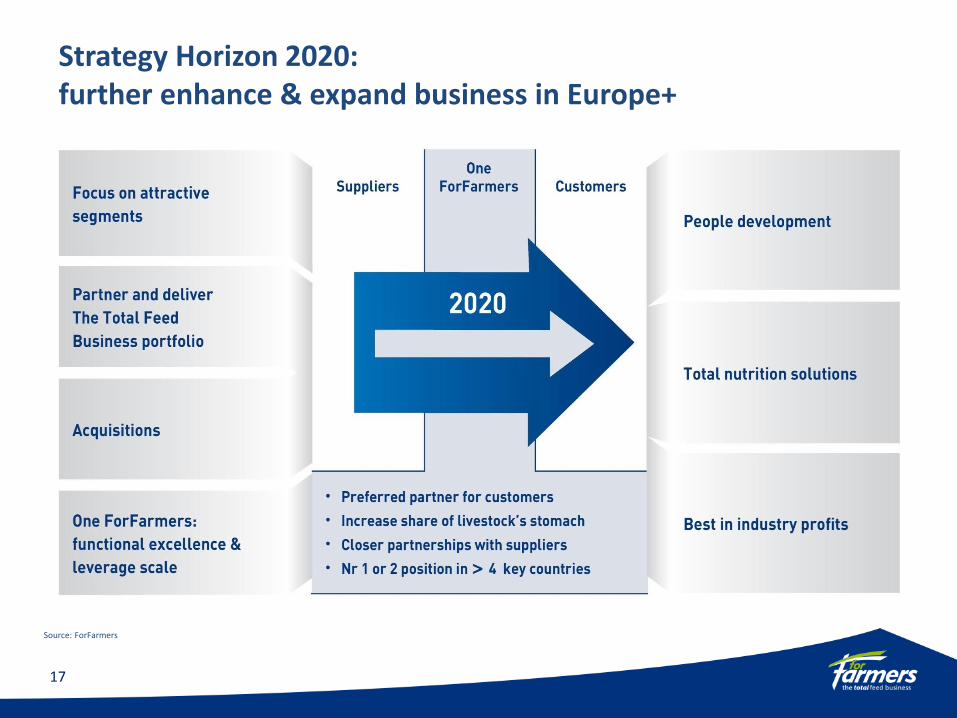
Strategy Horizon 2020: further enhance & expand business in Europe+
Source: ForFarmers
17
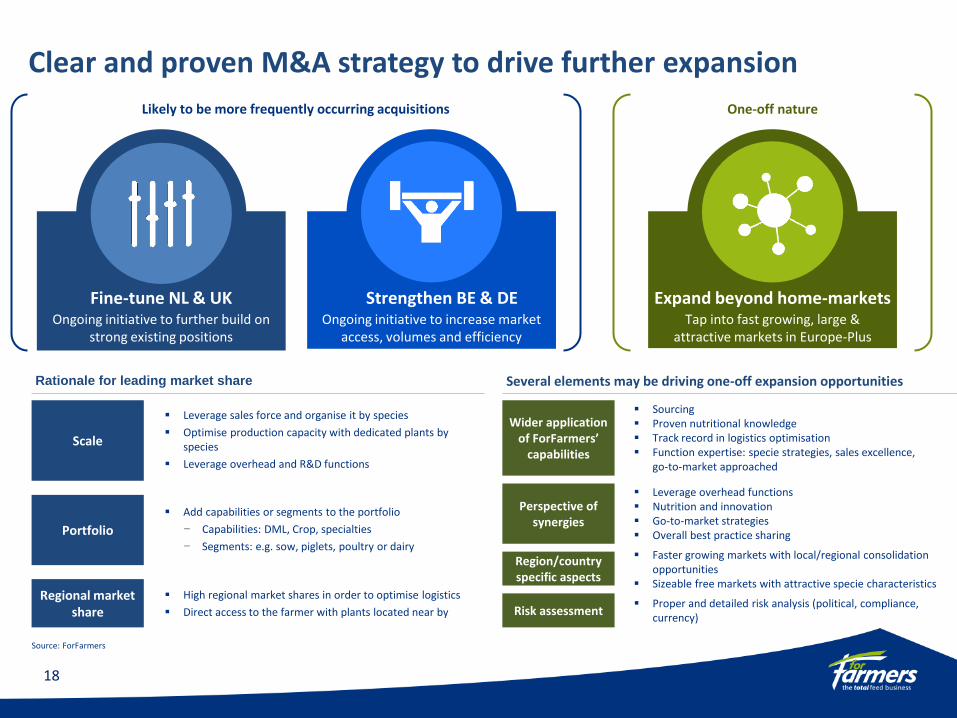
Clear and proven M&A strategy to drive further expansion
Source: ForFarmers
Likely to be more frequently occurring acquisitions One-off nature
Ongoing initiative to further build on strong existing positions
Ongoing initiative to increase market access, volumes and efficiency
Tap into fast growing, large & attractive markets in Europe-Plus
Expand beyond home-markets Fine-tune NL & UK Strengthen BE & DE
Regional market share
Scale
Portfolio
Rationale for leading market share
Leverage sales force and organise it by species
Optimise production capacity with dedicated plants by species
Leverage overhead and R&D functions
High regional market shares in order to optimise logistics
Direct access to the farmer with plants located near by
Add capabilities or segments to the portfolio
− Capabilities: DML, Crop, specialties
− Segments: e.g. sow, piglets, poultry or dairy
Several elements may be driving one-off expansion opportunities
Wider application of ForFarmers’
capabilities
Sourcing Proven nutritional knowledge Track record in logistics optimisation Function expertise: specie strategies, sales excellence,
go-to-market approached
Risk assessment Proper and detailed risk analysis (political, compliance,
currency)
Region/country specific aspects
Faster growing markets with local/regional consolidation opportunities
Sizeable free markets with attractive specie characteristics
Perspective of synergies
Leverage overhead functions Nutrition and innovation Go-to-market strategies Overall best practice sharing
18
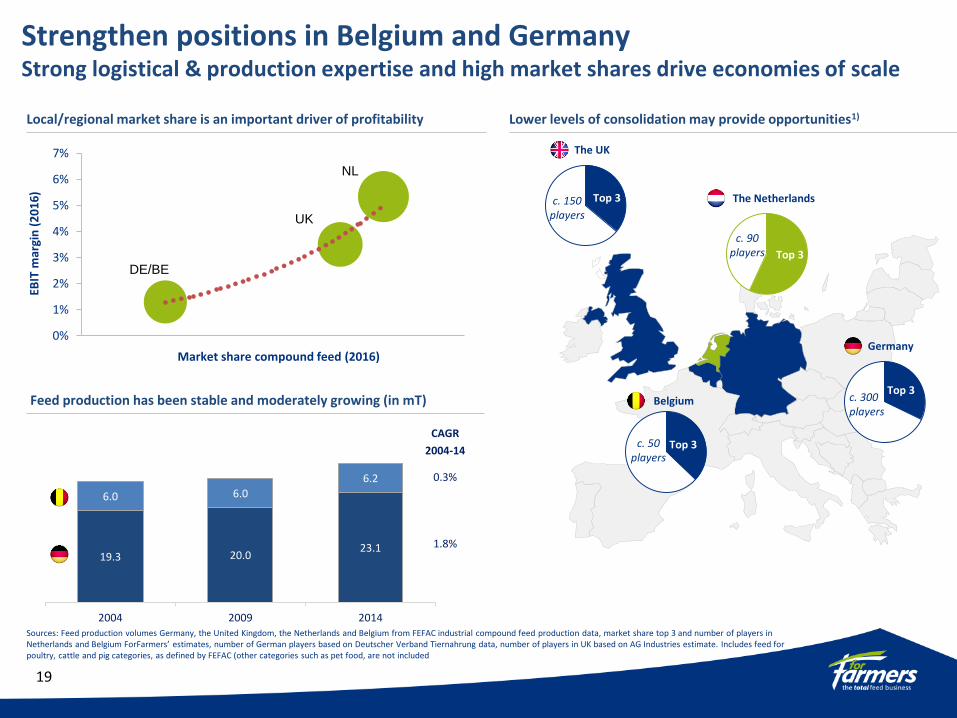
Strengthen positions in Belgium and Germany Strong logistical & production expertise and high market shares drive economies of scale
0%
1%
2%
3%
4%
5%
6%
7%
0% 5% 10% 15%
EBIT
mar
gin
(2
01
6)
Market share compound feed (2016)
Top 3
Sources: Feed production volumes Germany, the United Kingdom, the Netherlands and Belgium from FEFAC industrial compound feed production data, market share top 3 and number of players in Netherlands and Belgium ForFarmers’ estimates, number of German players based on Deutscher Verband Tiernahrung data, number of players in UK based on AG Industries estimate. Includes feed for poultry, cattle and pig categories, as defined by FEFAC (other categories such as pet food, are not included
Top 3
Top 3
Top 3
Feed production has been stable and moderately growing (in mT)
NL
UK
DE/BE
Top 3 c. 150 players
Local/regional market share is an important driver of profitability Lower levels of consolidation may provide opportunities1)
Germany
Belgium
The Netherlands
The UK
c. 50 players
c. 300 players
c. 90 players
19.3 20.0 23.1
6.0 6.0
6.2
2004 2009 2014
1.8%
0.3%
CAGR
2004-14
19
Source: ForFarmers
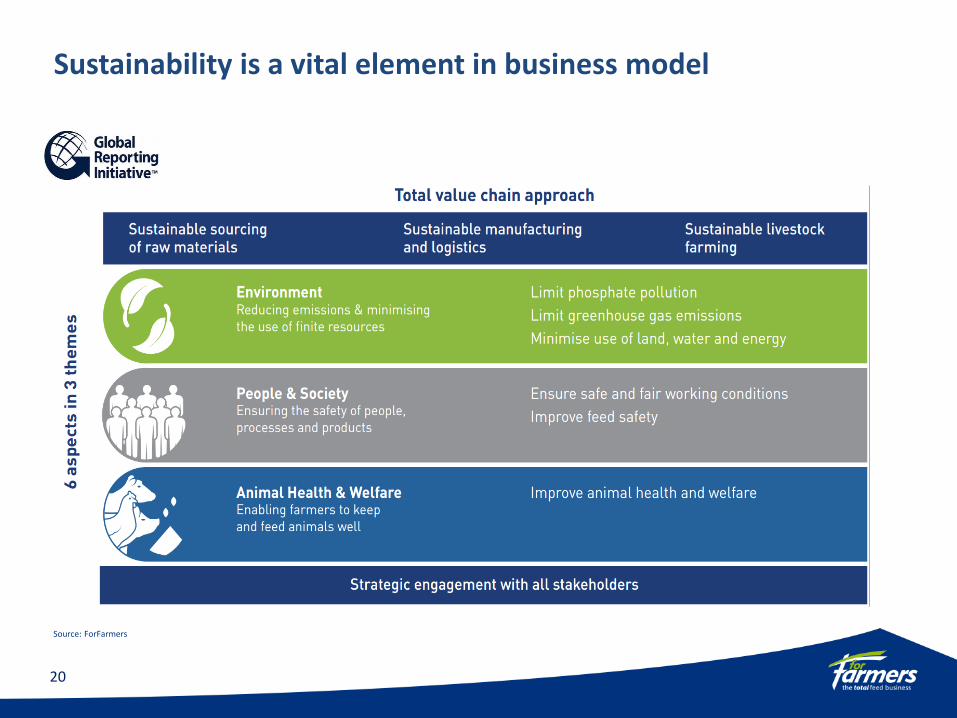
Sustainability is a vital element in business model
20
Source: ForFarmers
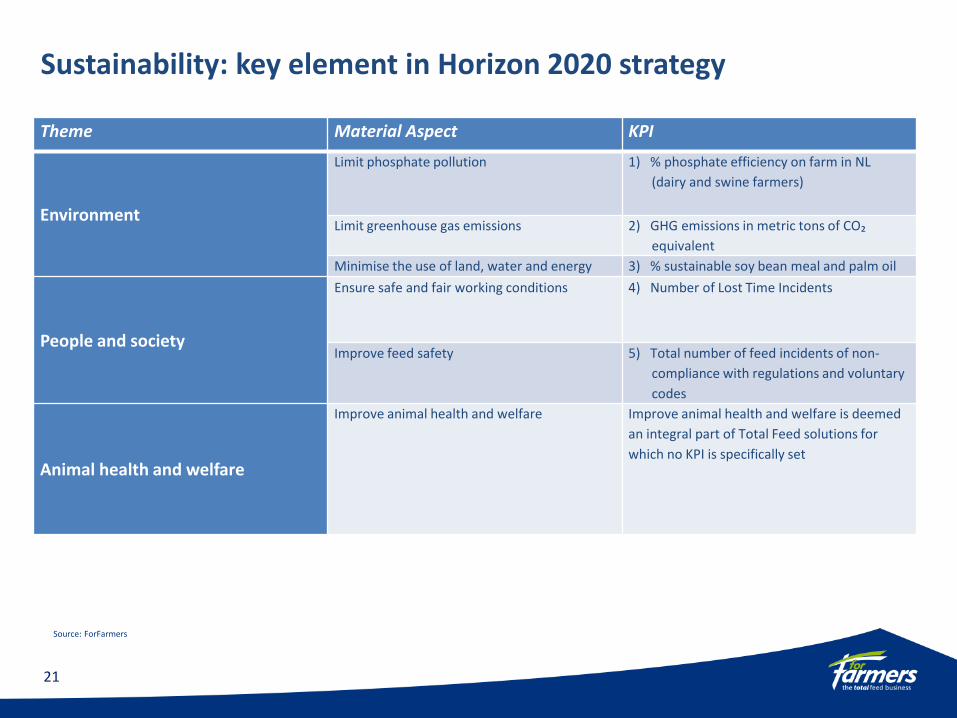
Sustainability: key element in Horizon 2020 strategy
Theme Material Aspect KPI
Environment
Limit phosphate pollution 1) % phosphate efficiency on farm in NL
(dairy and swine farmers)
Limit greenhouse gas emissions 2) GHG emissions in metric tons of CO₂
equivalent
Minimise the use of land, water and energy 3) % sustainable soy bean meal and palm oil
People and society
Ensure safe and fair working conditions 4) Number of Lost Time Incidents
Improve feed safety 5) Total number of feed incidents of non-
compliance with regulations and voluntary
codes
Animal health and welfare
Improve animal health and welfare Improve animal health and welfare is deemed
an integral part of Total Feed solutions for
which no KPI is specifically set
21
FINANCIALS H1 2017
22
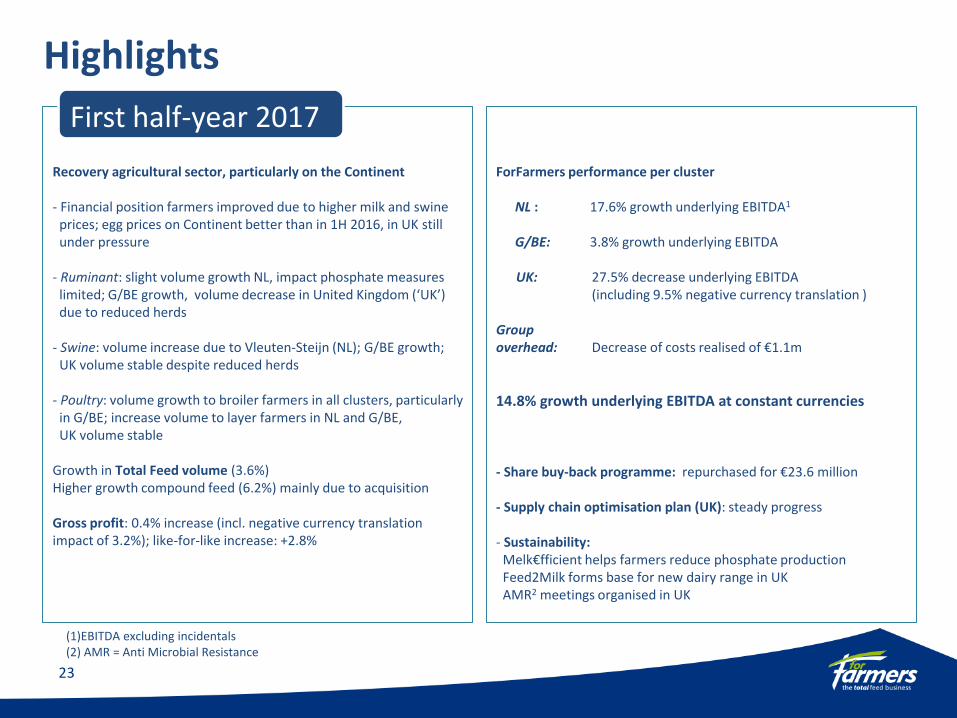
Highlights
Recovery agricultural sector, particularly on the Continent - Financial position farmers improved due to higher milk and swine prices; egg prices on Continent better than in 1H 2016, in UK still under pressure - Ruminant: slight volume growth NL, impact phosphate measures limited; G/BE growth, volume decrease in United Kingdom (‘UK’) due to reduced herds - Swine: volume increase due to Vleuten-Steijn (NL); G/BE growth; UK volume stable despite reduced herds - Poultry: volume growth to broiler farmers in all clusters, particularly in G/BE; increase volume to layer farmers in NL and G/BE, UK volume stable Growth in Total Feed volume (3.6%) Higher growth compound feed (6.2%) mainly due to acquisition Gross profit: 0.4% increase (incl. negative currency translation impact of 3.2%); like-for-like increase: +2.8%
First half-year 2017
(1)EBITDA excluding incidentals (2) AMR = Anti Microbial Resistance
ForFarmers performance per cluster
NL : 17.6% growth underlying EBITDA1
G/BE: 3.8% growth underlying EBITDA
UK: 27.5% decrease underlying EBITDA (including 9.5% negative currency translation ) Group overhead: Decrease of costs realised of €1.1m
14.8% growth underlying EBITDA at constant currencies - Share buy-back programme: repurchased for €23.6 million - Supply chain optimisation plan (UK): steady progress - Sustainability: Melk€fficient helps farmers reduce phosphate production Feed2Milk forms base for new dairy range in UK AMR2 meetings organised in UK
23
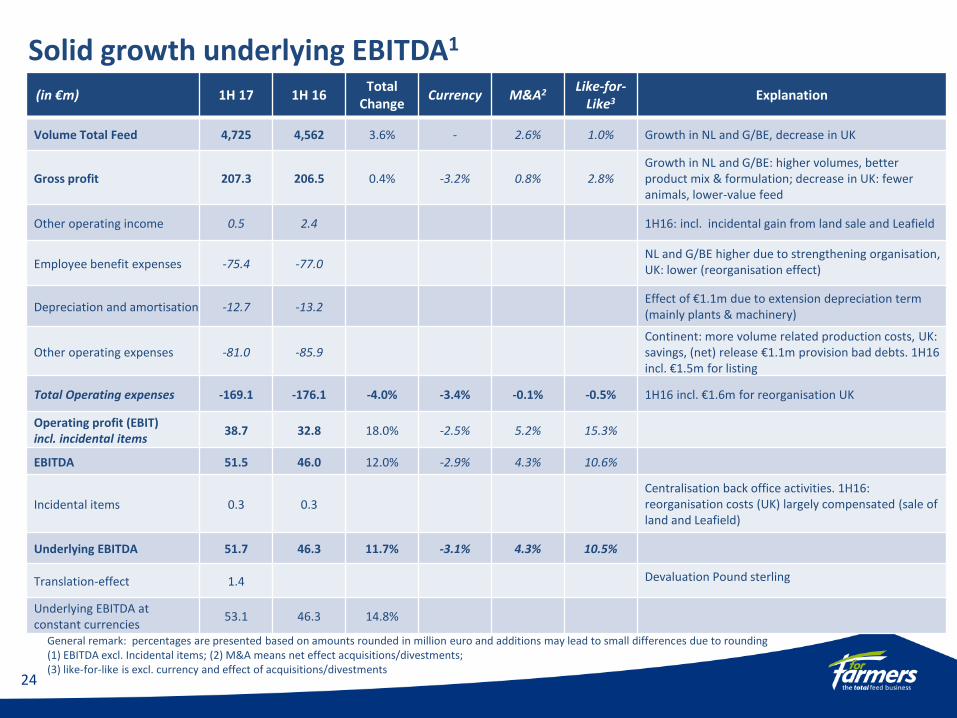
Solid growth underlying EBITDA1 (in €m) 1H 17 1H 16
Total Change
Currency M&A2 Like-for-
Like3 Explanation
Volume Total Feed 4,725 4,562 3.6% - 2.6% 1.0% Growth in NL and G/BE, decrease in UK
Gross profit 207.3 206.5 0.4% -3.2% 0.8% 2.8% Growth in NL and G/BE: higher volumes, better product mix & formulation; decrease in UK: fewer animals, lower-value feed
Other operating income 0.5 2.4 1H16: incl. incidental gain from land sale and Leafield
Employee benefit expenses -75.4 -77.0 NL and G/BE higher due to strengthening organisation, UK: lower (reorganisation effect)
Depreciation and amortisation -12.7 -13.2 Effect of €1.1m due to extension depreciation term (mainly plants & machinery)
Other operating expenses -81.0 -85.9 Continent: more volume related production costs, UK: savings, (net) release €1.1m provision bad debts. 1H16 incl. €1.5m for listing
Total Operating expenses -169.1 -176.1 -4.0% -3.4% -0.1% -0.5% 1H16 incl. €1.6m for reorganisation UK
Operating profit (EBIT) incl. incidental items
38.7 32.8 18.0% -2.5% 5.2% 15.3%
EBITDA 51.5 46.0 12.0% -2.9% 4.3% 10.6%
Incidental items 0.3 0.3 Centralisation back office activities. 1H16: reorganisation costs (UK) largely compensated (sale of land and Leafield)
Underlying EBITDA 51.7 46.3 11.7% -3.1% 4.3% 10.5%
Translation-effect 1.4 Devaluation Pound sterling
Underlying EBITDA at constant currencies
53.1 46.3 14.8%
General remark: percentages are presented based on amounts rounded in million euro and additions may lead to small differences due to rounding (1) EBITDA excl. Incidental items; (2) M&A means net effect acquisitions/divestments; (3) like-for-like is excl. currency and effect of acquisitions/divestments
24
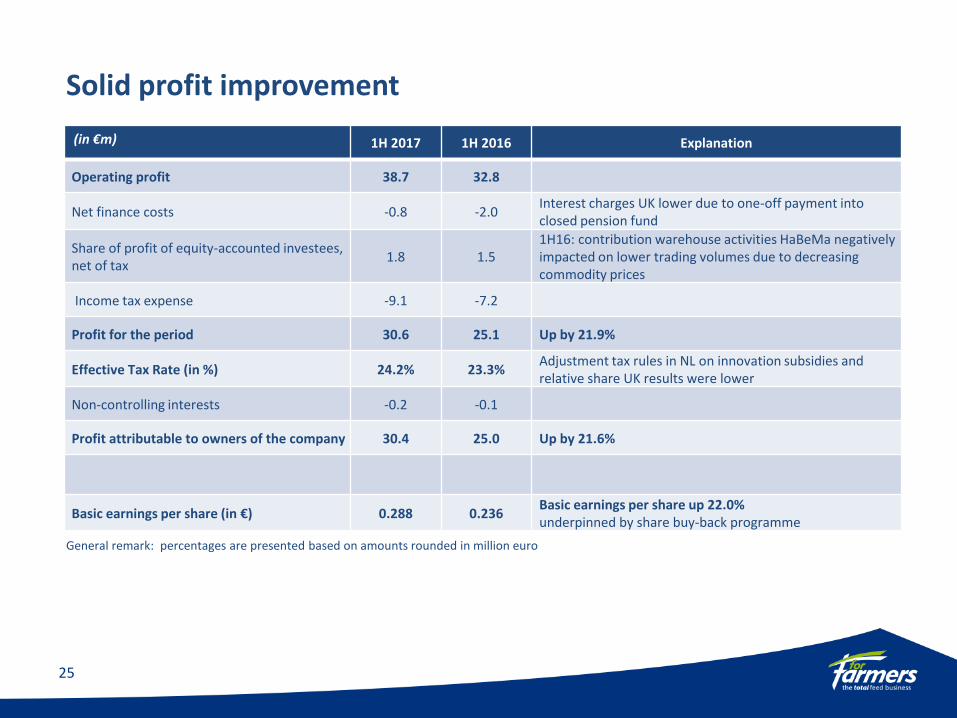
Solid profit improvement
(in €m) 1H 2017 1H 2016 Explanation
Operating profit 38.7 32.8
Net finance costs -0.8 -2.0 Interest charges UK lower due to one-off payment into closed pension fund
Share of profit of equity-accounted investees, net of tax
1.8 1.5 1H16: contribution warehouse activities HaBeMa negatively impacted on lower trading volumes due to decreasing commodity prices
Income tax expense -9.1 -7.2
Profit for the period 30.6 25.1 Up by 21.9%
Effective Tax Rate (in %) 24.2% 23.3% Adjustment tax rules in NL on innovation subsidies and relative share UK results were lower
Non-controlling interests -0.2 -0.1
Profit attributable to owners of the company 30.4 25.0 Up by 21.6%
Basic earnings per share (in €) 0.288 0.236 Basic earnings per share up 22.0% underpinned by share buy-back programme
25
General remark: percentages are presented based on amounts rounded in million euro
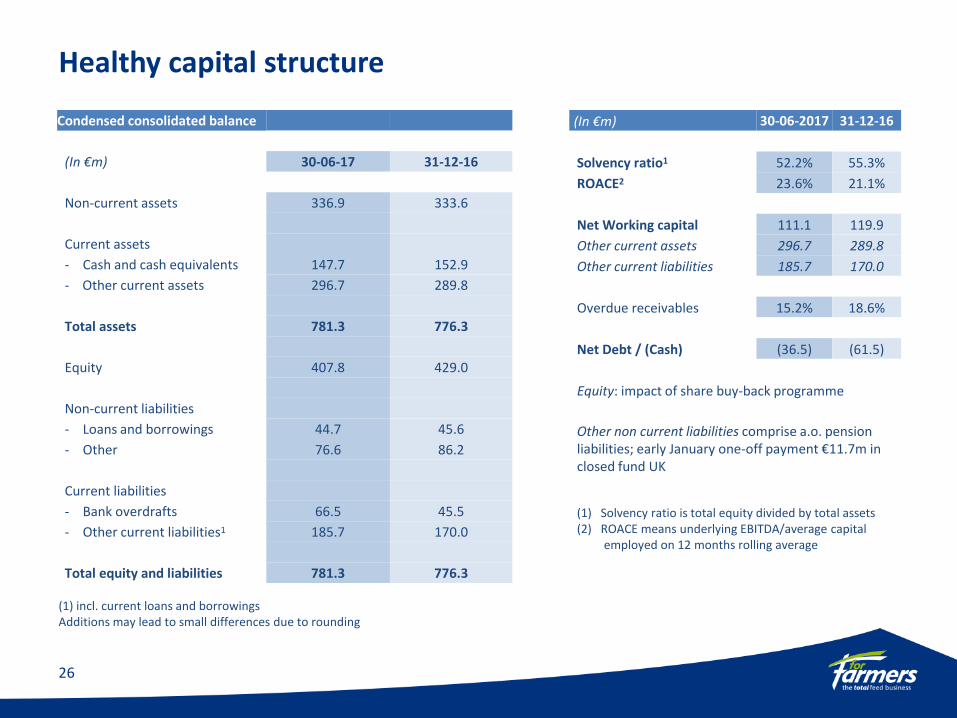
Healthy capital structure
Condensed consolidated balance
(In €m) 30-06-17 31-12-16
Non-current assets 336.9 333.6
Current assets
- Cash and cash equivalents 147.7 152.9
- Other current assets 296.7 289.8
Total assets 781.3 776.3
Equity 407.8 429.0
Non-current liabilities
- Loans and borrowings 44.7 45.6
- Other 76.6 86.2
Current liabilities
- Bank overdrafts 66.5 45.5
- Other current liabilities1 185.7 170.0
Total equity and liabilities 781.3 776.3
(In €m) 30-06-2017 31-12-16
Solvency ratio1 52.2% 55.3%
ROACE2 23.6% 21.1%
Net Working capital 111.1 119.9
Other current assets 296.7 289.8
Other current liabilities 185.7 170.0
Overdue receivables 15.2% 18.6%
Net Debt / (Cash) (36.5) (61.5)
Equity: impact of share buy-back programme
Other non current liabilities comprise a.o. pension liabilities; early January one-off payment €11.7m in closed fund UK
(1) Solvency ratio is total equity divided by total assets (2) ROACE means underlying EBITDA/average capital employed on 12 months rolling average
26
(1) incl. current loans and borrowings Additions may lead to small differences due to rounding
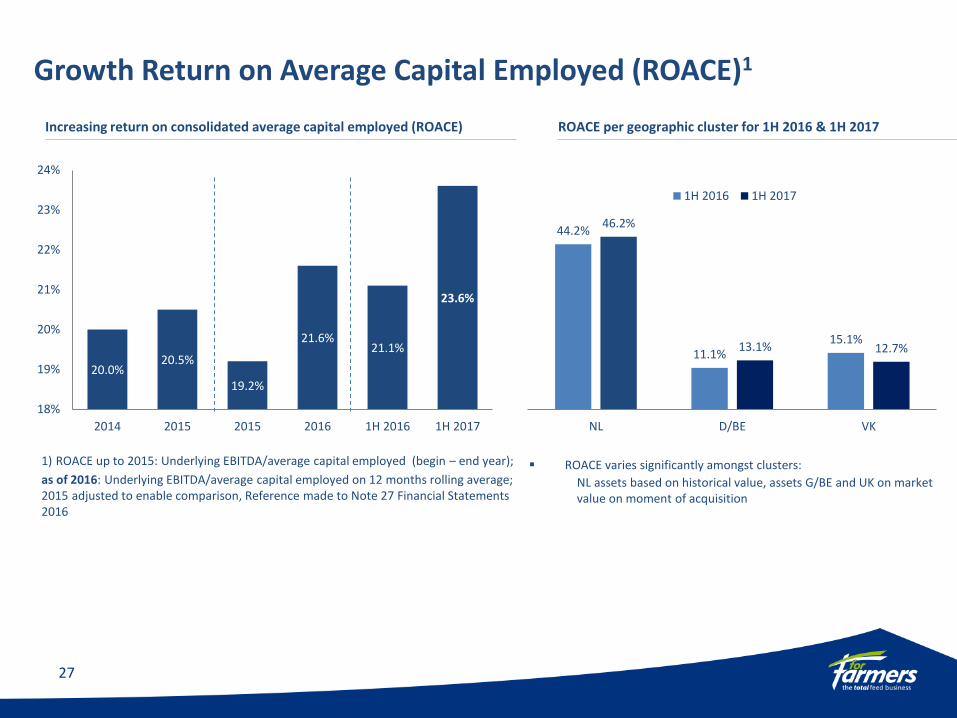
Growth Return on Average Capital Employed (ROACE)1
27
Increasing return on consolidated average capital employed (ROACE)
ROACE varies significantly amongst clusters:
NL assets based on historical value, assets G/BE and UK on market value on moment of acquisition
ROACE per geographic cluster for 1H 2016 & 1H 2017
1) ROACE up to 2015: Underlying EBITDA/average capital employed (begin – end year);
as of 2016: Underlying EBITDA/average capital employed on 12 months rolling average; 2015 adjusted to enable comparison, Reference made to Note 27 Financial Statements 2016
20.0% 20.5%
19.2%
21.6% 21.1%
23.6%
18%
19%
20%
21%
22%
23%
24%
2014 2015 2015 2016 1H 2016 1H 2017
44.2%
11.1% 15.1%
46.2%
13.1% 12.7%
NL D/BE VK
1H 2016 1H 2017
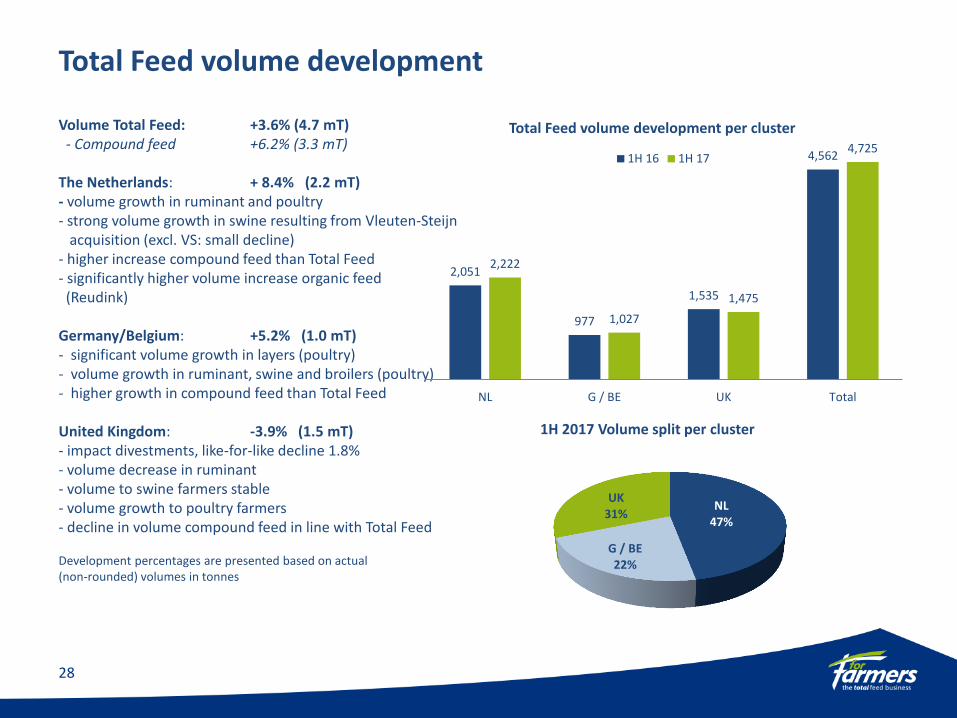
Total Feed volume development
Volume Total Feed: +3.6% (4.7 mT) - Compound feed +6.2% (3.3 mT) The Netherlands: + 8.4% (2.2 mT) - volume growth in ruminant and poultry - strong volume growth in swine resulting from Vleuten-Steijn acquisition (excl. VS: small decline) - higher increase compound feed than Total Feed - significantly higher volume increase organic feed (Reudink) Germany/Belgium: +5.2% (1.0 mT) - significant volume growth in layers (poultry) - volume growth in ruminant, swine and broilers (poultry) - higher growth in compound feed than Total Feed United Kingdom: -3.9% (1.5 mT) - impact divestments, like-for-like decline 1.8% - volume decrease in ruminant - volume to swine farmers stable - volume growth to poultry farmers - decline in volume compound feed in line with Total Feed
28
2,051
977
1,535
4,562
2,222
1,027
1,475
4,725
NL G / BE UK Total
Total Feed volume development per cluster
1H 16 1H 17
NL 47%
G / BE 22%
UK 31%
1H 2017 Volume split per cluster
Development percentages are presented based on actual (non-rounded) volumes in tonnes
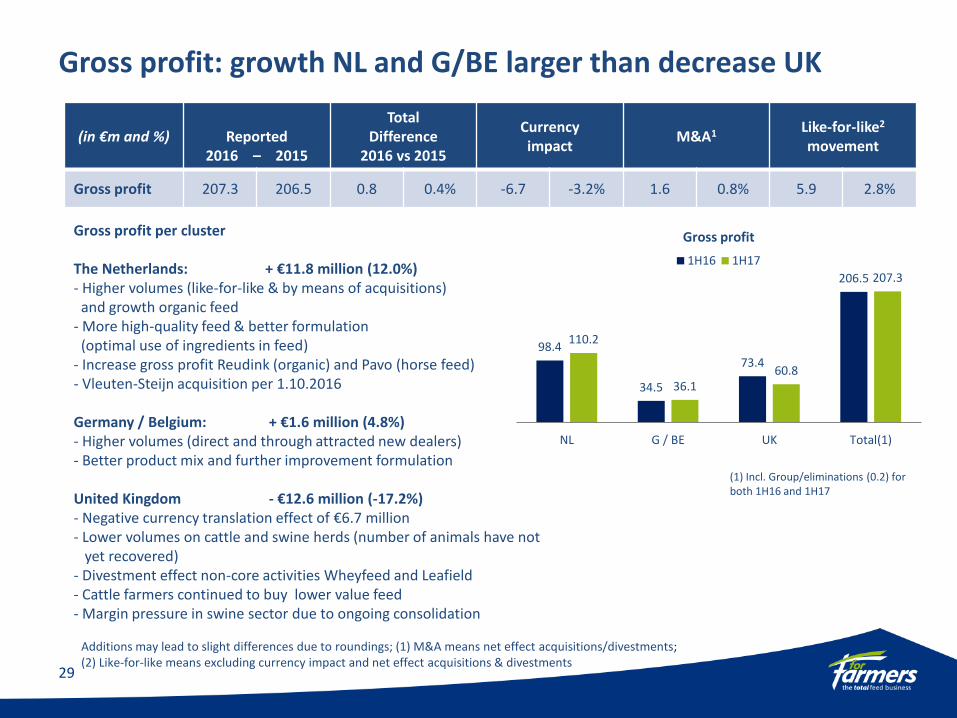
Gross profit: growth NL and G/BE larger than decrease UK
(in €m and %)
Reported 2016 – 2015
Total Difference
2016 vs 2015
Currency impact
M&A1 Like-for-like2 movement
Gross profit 207.3 206.5 0.8 0.4% -6.7 -3.2% 1.6 0.8% 5.9 2.8%
Gross profit per cluster The Netherlands: + €11.8 million (12.0%) - Higher volumes (like-for-like & by means of acquisitions) and growth organic feed - More high-quality feed & better formulation (optimal use of ingredients in feed) - Increase gross profit Reudink (organic) and Pavo (horse feed) - Vleuten-Steijn acquisition per 1.10.2016 Germany / Belgium: + €1.6 million (4.8%) - Higher volumes (direct and through attracted new dealers) - Better product mix and further improvement formulation United Kingdom - €12.6 million (-17.2%) - Negative currency translation effect of €6.7 million - Lower volumes on cattle and swine herds (number of animals have not yet recovered) - Divestment effect non-core activities Wheyfeed and Leafield - Cattle farmers continued to buy lower value feed - Margin pressure in swine sector due to ongoing consolidation
29
Additions may lead to slight differences due to roundings; (1) M&A means net effect acquisitions/divestments; (2) Like-for-like means excluding currency impact and net effect acquisitions & divestments
98.4
34.5
73.4
206.5
110.2
36.1 60.8
207.3
NL G / BE UK Total(1)
Gross profit
1H16 1H17
(1) Incl. Group/eliminations (0.2) for both 1H16 and 1H17
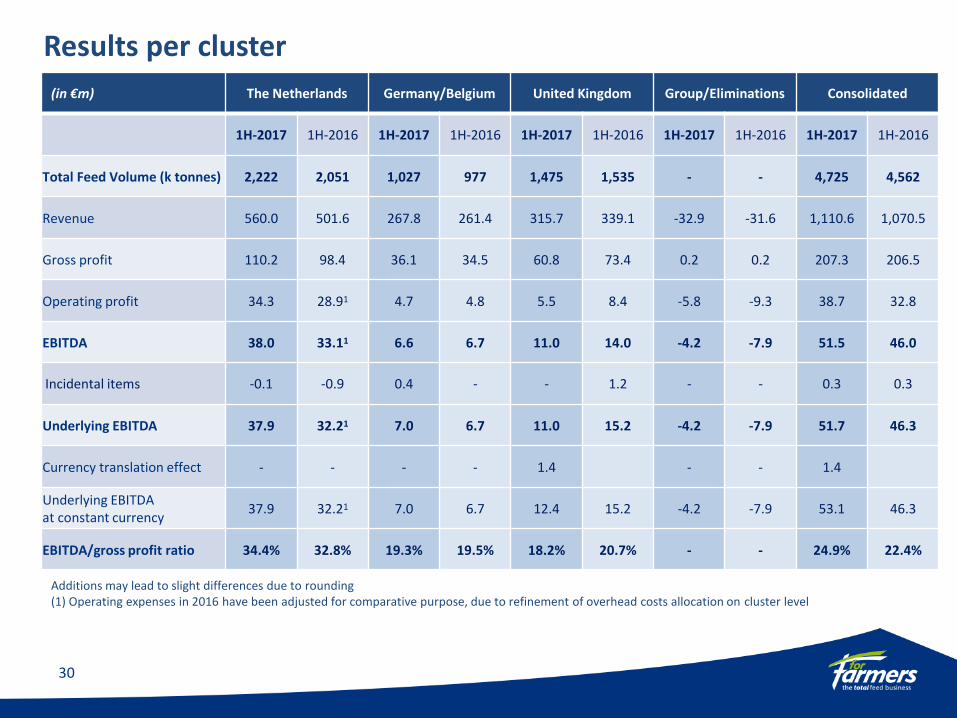
Results per cluster
30
(in €m) The Netherlands Germany/Belgium United Kingdom Group/Eliminations Consolidated
1H-2017 1H-2016 1H-2017 1H-2016 1H-2017 1H-2016 1H-2017 1H-2016 1H-2017 1H-2016
Total Feed Volume (k tonnes) 2,222 2,051 1,027 977 1,475 1,535 - - 4,725 4,562
Revenue 560.0 501.6 267.8 261.4 315.7 339.1 -32.9 -31.6 1,110.6 1,070.5
Gross profit 110.2 98.4 36.1 34.5 60.8 73.4 0.2 0.2 207.3 206.5
Operating profit 34.3 28.91 4.7 4.8 5.5 8.4 -5.8 -9.3 38.7 32.8
EBITDA 38.0 33.11 6.6 6.7 11.0 14.0 -4.2 -7.9 51.5 46.0
Incidental items -0.1 -0.9 0.4 - - 1.2 - - 0.3 0.3
Underlying EBITDA 37.9 32.21 7.0 6.7 11.0 15.2 -4.2 -7.9 51.7 46.3
Currency translation effect - - - - 1.4 - - 1.4
Underlying EBITDA at constant currency
37.9 32.21 7.0 6.7 12.4 15.2 -4.2 -7.9 53.1 46.3
EBITDA/gross profit ratio 34.4% 32.8% 19.3% 19.5% 18.2% 20.7% - - 24.9% 22.4%
Additions may lead to slight differences due to rounding (1) Operating expenses in 2016 have been adjusted for comparative purpose, due to refinement of overhead costs allocation on cluster level
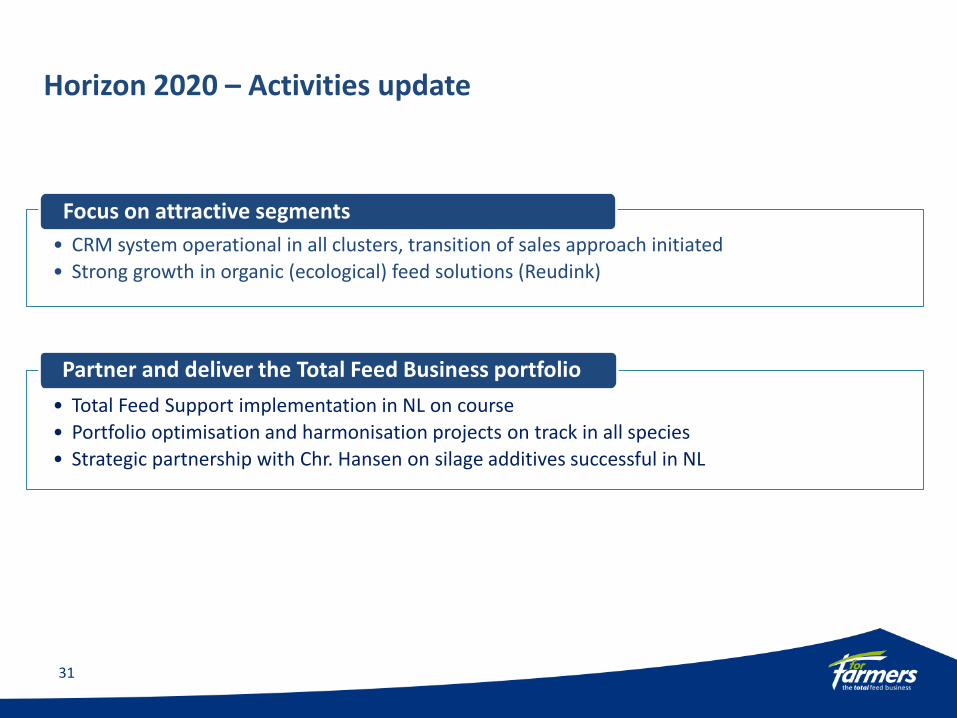
• Total Feed Support implementation in NL on course
• Portfolio optimisation and harmonisation projects on track in all species
• Strategic partnership with Chr. Hansen on silage additives successful in NL
Horizon 2020 – Activities update
• CRM system operational in all clusters, transition of sales approach initiated
• Strong growth in organic (ecological) feed solutions (Reudink)
Focus on attractive segments
Partner and deliver the Total Feed Business portfolio
31
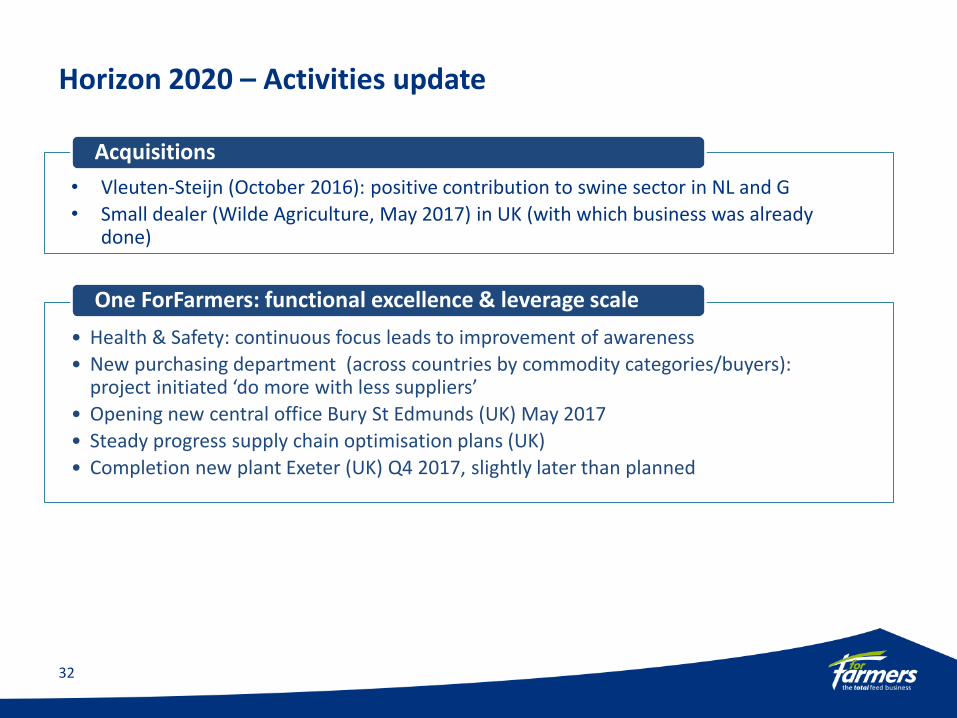
Horizon 2020 – Activities update
• Health & Safety: continuous focus leads to improvement of awareness
• New purchasing department (across countries by commodity categories/buyers): project initiated ‘do more with less suppliers’
• Opening new central office Bury St Edmunds (UK) May 2017
• Steady progress supply chain optimisation plans (UK)
• Completion new plant Exeter (UK) Q4 2017, slightly later than planned
One ForFarmers: functional excellence & leverage scale
32
• Vleuten-Steijn (October 2016): positive contribution to swine sector in NL and G
• Small dealer (Wilde Agriculture, May 2017) in UK (with which business was already done)
Acquisitions
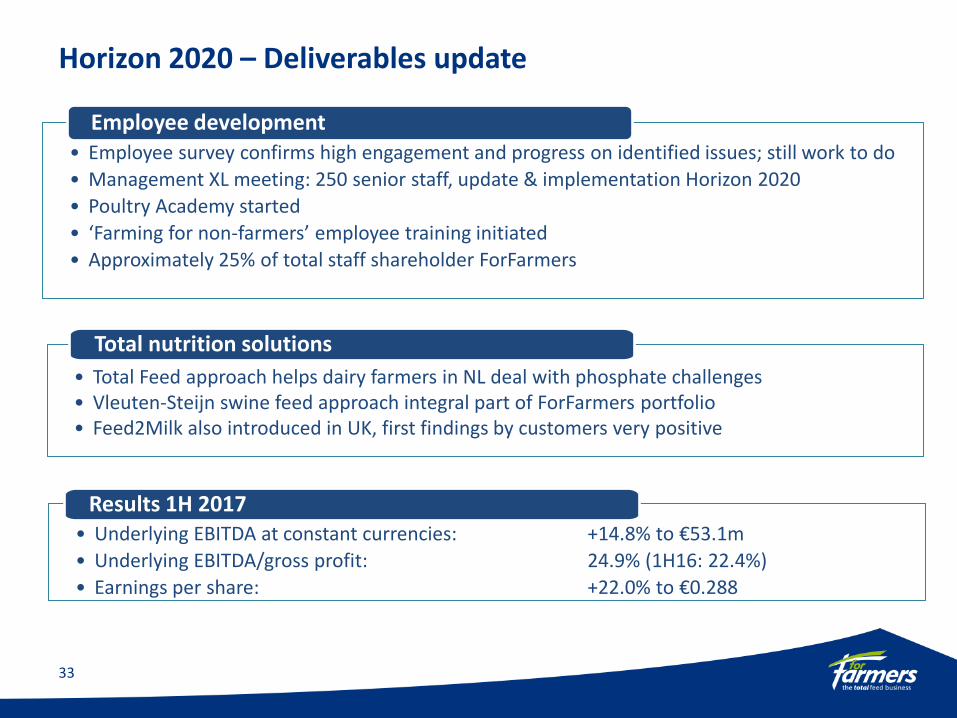
Horizon 2020 – Deliverables update
• Total Feed approach helps dairy farmers in NL deal with phosphate challenges • Vleuten-Steijn swine feed approach integral part of ForFarmers portfolio • Feed2Milk also introduced in UK, first findings by customers very positive
Total nutrition solutions
33
• Underlying EBITDA at constant currencies: +14.8% to €53.1m
• Underlying EBITDA/gross profit: 24.9% (1H16: 22.4%)
• Earnings per share: +22.0% to €0.288
Results 1H 2017
• Employee survey confirms high engagement and progress on identified issues; still work to do
• Management XL meeting: 250 senior staff, update & implementation Horizon 2020
• Poultry Academy started
• ‘Farming for non-farmers’ employee training initiated
• Approximately 25% of total staff shareholder ForFarmers
Employee development
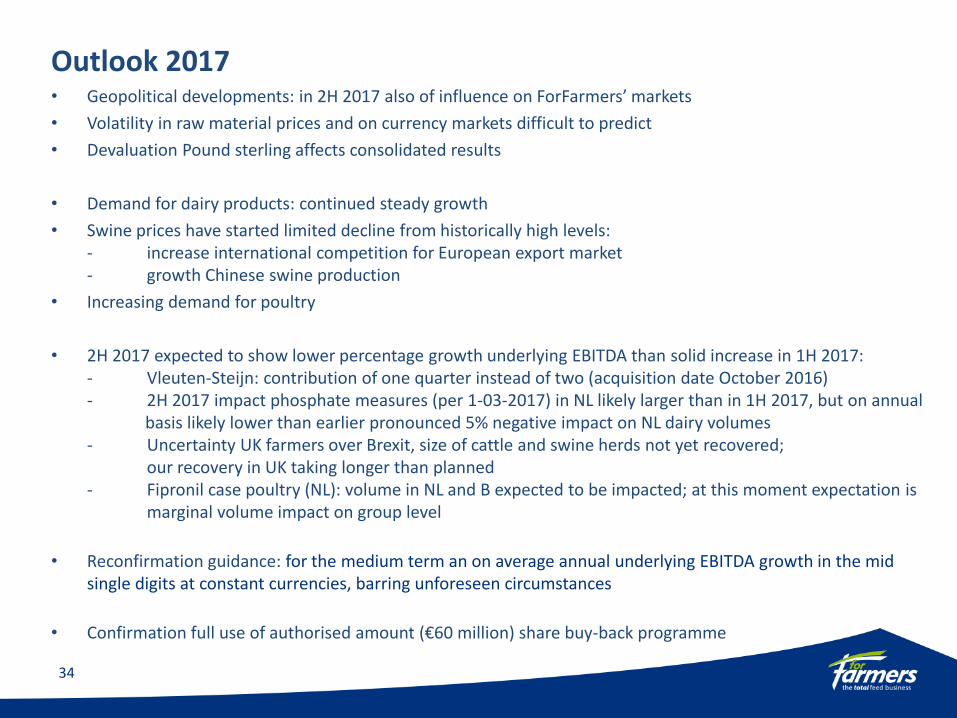
Outlook 2017 • Geopolitical developments: in 2H 2017 also of influence on ForFarmers’ markets
• Volatility in raw material prices and on currency markets difficult to predict
• Devaluation Pound sterling affects consolidated results
• Demand for dairy products: continued steady growth
• Swine prices have started limited decline from historically high levels: - increase international competition for European export market - growth Chinese swine production
• Increasing demand for poultry
• 2H 2017 expected to show lower percentage growth underlying EBITDA than solid increase in 1H 2017: - Vleuten-Steijn: contribution of one quarter instead of two (acquisition date October 2016) - 2H 2017 impact phosphate measures (per 1-03-2017) in NL likely larger than in 1H 2017, but on annual basis likely lower than earlier pronounced 5% negative impact on NL dairy volumes - Uncertainty UK farmers over Brexit, size of cattle and swine herds not yet recovered; our recovery in UK taking longer than planned - Fipronil case poultry (NL): volume in NL and B expected to be impacted; at this moment expectation is marginal volume impact on group level
• Reconfirmation guidance: for the medium term an on average annual underlying EBITDA growth in the mid single digits at constant currencies, barring unforeseen circumstances
• Confirmation full use of authorised amount (€60 million) share buy-back programme
34
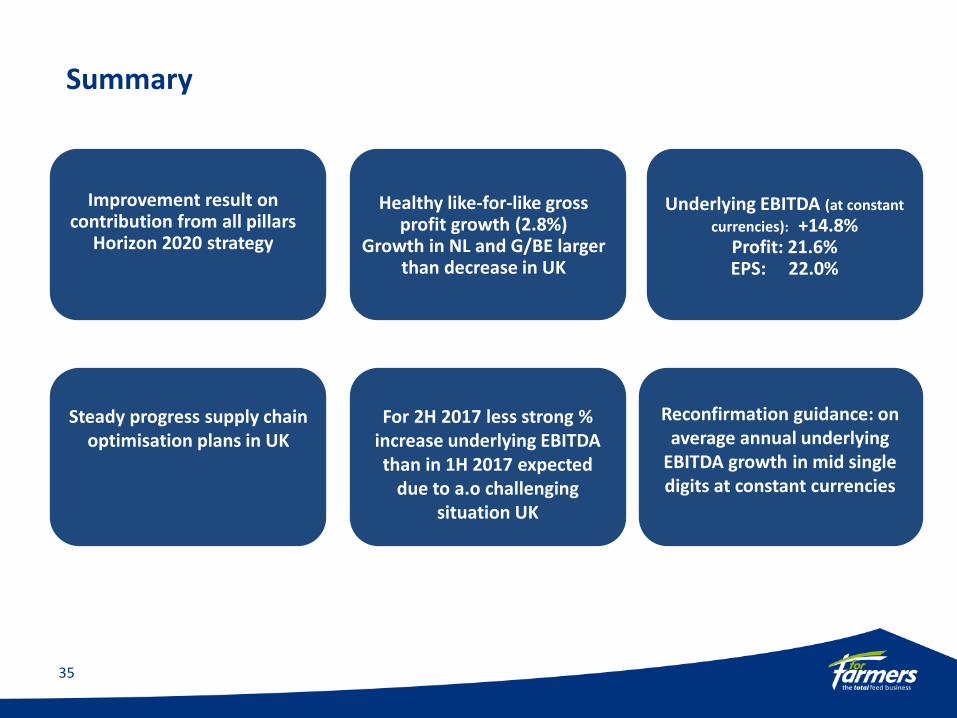
Summary
Underlying EBITDA (at constant
currencies): +14.8% Profit: 21.6% EPS: 22.0%
Improvement result on contribution from all pillars
Horizon 2020 strategy
Steady progress supply chain
optimisation plans in UK
Reconfirmation guidance: on average annual underlying
EBITDA growth in mid single digits at constant currencies
For 2H 2017 less strong %
increase underlying EBITDA than in 1H 2017 expected
due to a.o challenging situation UK
35
Healthy like-for-like gross
profit growth (2.8%) Growth in NL and G/BE larger
than decrease in UK
Contact
Caroline Vogelzang
Director Investor Relations & Communications
Mobile: +31 6 10 949 161
Landline: +31 573 288 194
ForFarmers N.V.
Kwinkweerd 12
7241CW Lochem
The Netherlands
36
37


