Abstract The current article examines the trade balance of Greece in the Euro era, in general, and in particular within the Member States of the Euro Zone (EZ). It was found that in the Euro-era, the Greek trade balance has deteriorated in general and particularly within the Member States of the EZ, while losses in competitiveness of the Greek economy have been observed. The structure of production and foreign trade affect the trade deficit and competitiveness of the Greek economy. Moreover, the more rapid rates of inflation in Greece, compared with its trading partners, led to a revaluation of the real exchange rate in the country, affecting its export performance. JEL Classification: F14 Keywords: Trade Balance, Greece, Euro Zone South-Eastern Europe Journal of Economics 2 (2013) 187-216 *Corresponding Author: George Magoulios, Agia Triada, P.O. Box 6510, 570 19 Thessaloniki, Greece e-mail: [email protected]THE TRADE BALANCE OF GREECE IN THE EURO ERA GEORGE MAGOULIOS * , STERGIOS ATHIANOS Technological Education Institute (TEI) of Central Macedonia, Greece
Transcript
Abstract The current article examines the trade balance of Greece in the Euro era, in general, and in particular within the Member States of the Euro Zone (EZ). It was found that in the Euro-era, the Greek trade balance has deteriorated in general and particularly within the Member States of the EZ, while losses in competitiveness of the Greek economy have been observed. The structure of production and foreign trade affect the trade deficit and competitiveness of the Greek economy. Moreover, the more rapid rates of inflation in Greece, compared with its trading partners, led to a revaluation of the real exchange rate in the country, affecting its export performance.
JEL Classification: F14Keywords: Trade Balance, Greece, Euro Zone
South-Eastern Europe Journal of Economics 2 (2013) 187-216
GEORGE MAGOULIOS*, STERGIOS ATHIANOSTechnological Education Institute (TEI) of Central Macedonia, Greece
G. MAGOULIOS, S. ATHIANOS, South-Eastern Europe Journal of Economics 2 (2013) 187-216188
1. Introduction
According to the European Commission, although the degree of openness has been rising over the past 15 years, Greece remains a relatively closed economy. Based on the sum of exports and imports as a percentage of GDP, trade openness has increased significantly from around 43% of GDP in 1995 to almost 60% in 2008; however it still remains relatively low compared with the average of the Euro area as a whole (approximately 88% of GDP in 2008). This increase reflects an uneven development in exports and imports. It is linked to a strong and stable domestic demand and a steady decline in competitiveness (import penetration increased by 10 percentage points, from about 26% of GDP in 1995 to nearly 36% in 2008, while the share of total exports in GDP increased by approximately 7 percentage points from 17% to 24% over the same period). The growth of trade is not driven by increased integration of Greece into the Euro Zone. Although the Euro area remains the largest trading partner of the country, its share in total trade has declined. Trade in goods and services in the Euro area accounted for less than half of total trade in 2008, compared with nearly 58% in 1995. The real growth in exports of goods and services exceeded 10% on average over the period 1995-2000, it became temporarily negative in 2001 and 2002 (-40% on average) before retrieving a positive real growth of over 6 %, on average, between 2003 and 2008. Export growth was consistently lower than that of imports, mainly from the late 1990's onwards. The market share in exports showed a downward trend, falling from 0.22% in 1995 to 0.16% in 2002 and then stagnated at around 0.17% (European Commission, 2010, p. 68-73, 143). The course of Greece's exports of goods as a percentage of GDP presents the following trend: in 1961, exports of goods were 8%, which is about as much as in 2004. In 1971, exports fell to 5.7%, in 1981 increased to 19%, whilst they declined to 11% in 1991 and 7.8% in 2004. The period of intensive growth in exports was that of 1973-1981, when the exports of goods increased almost ten-fold, showing an average annual growth of 34% in current prices. Until 2004, and while exports of goods show a small annual increase, they show a steady decline as a percentage of GDP. This downturn was reversed after 2004 showing a strong recovery in 2005, while it is estimated that as a percentage of GDP they amounted to 8.8% in 2006, contributing 1.04% to the growth of the economy in 2006 (Eurobank, 2008). In 2008 exports accounted for 7.2% of GDP, a figure which ranks Greece second lowest (26th) in the EU, followed by Cyprus (6.3%) (SEVE, 2009, p. 7, 18). The trade balance of Greece in the Euro era, is the subject (focus) of this article. This article examines the exports, imports and the trade balance of Greece (2000-2008) in total, with the EU (27) and with third countries, particularly the Member States of the Euro Zone (EZ). Quantitative secondary data related to the specific time period are registered and analyzed. This period is selected for the reason that Greece joined the European Economic Monetary Union (EMU) on 1 January 2001
G. MAGOULIOS, S. ATHIANOS, South-Eastern Europe Journal of Economics 2 (2013) 187-216 189
and since 1 January 2002 it has adopted the Euro as its official currency and because the consequences of the economic crisis for the Greek economy had not erupted at that time. This article investigates the effects of foreign trade within the Member States of the Euro Zone, the shares of the Member States in exports, imports and trade balance, as well as the deficit, the sectoral composition of foreign trade and some of the fac-tors affecting the trade balance deficit and the competitiveness of the Greek economy. The basic research questions are the following: Has the export performance of the country improved since the accession of Greece to the EZ, or not? Has the Greek trade balance worsened or not in general and in particular, within the Member States of the EZ? Were there any gains or losses in competitiveness for the Greek economy? In which degree, does the structure of production and foreign trade, such as inflation differentials, have an impact on the deficit in the trade balance and competitiveness of the Greek economy?
2. Literature Review
An examination of the effects of factor productivity on trade indicates that the argument of an open economy that promotes trade, which in turn helps to extend the boundaries of productivity, is highly correlated with the leader export economies. It is found that export labour-intensive industries are competitive, therefore the labour-intensive developing economies should move up the technological ladder, otherwise the increased competition could undermine their exports. In developing economies, the productivity of labour-intensive industries should be improved as exports are rising. The opening up of the economy through trade is a prerequisite in order to improve productivity, which is a necessary and sufficient condition for development. Otherwise, the competitive and comparative advantage of a labour-intensive export economy could be eroded. In industrialized economies, which have achieved a high technological level, national policies should focus on improved productivity and technology (Kui-Wai Li, Siegfried Bender, 2007, p. 141-143). Although as far as this process is concerned, progress has been made in the developed countries, of Northern Europe, it is proceeding slowly in the countries of the South and especially in Greece. One of the factors that influence the extent of competition in a market is the relative openness of an economy. The extent of this factor influences the strengthening of competition and good practice dissemination, while it facilitates technology transfer and the access to knowledge. What’s more, market openness facilitates the identification and the opening of new markets, as well as the increase of prof-its and the creation of new products. International practice has shown that small economies are often strongly linked with the international economic environment which is, however, not observed in the case of Greece. Thus, the Greek economy
G. MAGOULIOS, S. ATHIANOS, South-Eastern Europe Journal of Economics 2 (2013) 187-216190
could be described as relatively closed in terms of trade. Furthermore, by observing the historical development of specific indicators, a clear upward trend is reported, which is particularly strong in the case of imports. The difference between these two rates indicates the trade deficit of Greece, which is continuing and expanding (Anastasopoulos G., 2004, p. 57, 59). An investigation of the case and whether liberal trade policies promote trade openness, has revealed that the link between different types of trade restrictions and openness to trade is weak, not always statistically significant and there is no clear evidence that the removal of trade barriers always leads to the improvement of trade liberalization. The data reveal a variety of experiences. Openness in trade is not uniform, universal or clearly linked to trade liberalization. This means that if countries liberalized trade prematurely, it could lead to a lower level of exposure and probably to economic disaster. This is why the political liberalization should be implemented gradually. Under certain circumstances, trade liberalization can indeed lead to the expansion of trade. Moreover, it is noted that liberalization is not the only policy option for countries that wish to expand trade. Most countries have developed their competitiveness behind protective measures, and then either propelled exports or allowed free trade. This means that there is no single trade policy that will benefit all countries operating under different conditions (Turan Subasat, 2008, p. 58-59). In another paper, the importance of the variety and quality in intra-European trade was investigated along with the role of technological innovation and international technological diffusion, excluding the documented role of income and the size of the country, whereas the role of geographic distance was examined. It was found that the characteristics of the country are important in explaining the pattern of the variety and quality in intra-trade flows. The largest EU countries sell a higher number of varieties and value in comparison to smaller EU countries, but they sell at a lower price. Richer countries, which are mostly capital intensive, export higher quality products in all areas. Data on the distance between countries, which are mainly reflected in transport and in the unified European market context, show that distance reduces the number of varieties traded within sectors and the overall value of commercial varieties, but increases the average quality of varieties that are tradable. The research and development costs tend to increase the variety of intra-trade. Finally, it appeared that technological spillovers are increasing both the variety of intra-Community trade and the quality of traded goods. Technological innovation and international technological spillovers are important sources of competitiveness of nations (Jan Van Hove, 2010, p. 56-57). The investigation of the structures of demand and vertical intra-industry trade with special reference to North-South trade showed that a more unequal (equal) income distribution in the South (North) increased the share of vertical intra-industry trade, while this result depends on the distribution of income between countries. The
G. MAGOULIOS, S. ATHIANOS, South-Eastern Europe Journal of Economics 2 (2013) 187-216 191
positive effect after changing the method of allocation of income of the share of vertical intra-industry trade weakens, when the demand for varieties produced by the partner is lacking due to large differences in the average per capita income (Joakim Gullstrand, 2006, p. 446-447). A study on the role of Foreign Direct Investment (FDI) on economic growth and trade balances of the ten emerging European economies prior to EU membership, noted the importance of structural reforms in emerging economies. It was concluded that countries with high growth rates could attract inflows of FDI in their economies, while another impact of FDI inflows is that they have a negative impact on the country's trade balance, and they play a significant role in changing the composition of trade in most emerging European countries (Hossein Varamini, Svetlana Kalash, 2010, p. 18-19). Fidrmuc’s (2005, p. 232-233) study on the structure of trade during the acces-sion and the eastward enlargement of the EU, examined the factors of trade between industrial sectors in the EU15 countries in the OECD. It was found that differences in per capita income, which are used as a substitute for financing by the countries, determine the structure of trade. The total EU-15 has no significant effect on intra-industry trade in the EU-15. Thus, the country's size and distance from markets are the most important factors determining the intra-industry trade (Jarko Fidrmuc, 2005, p. 232-233). From an analysis of the spatial externality effects on regional development, based on theories of economic geography and endogenous growth (increasing returns to scale), in the case of a group of integrated area (the Euro) and the Mediterranean countries for the period 1995-2004, it was pointed out that due to the significant presence of spatial dependence, increasing labour productivity in one country could contribute to its neighbours through spatial externalities. Also, the educational level facilitates the absorption capacity of foreign technology and thus, it leads to productivity increase. The rate of technological gap is negative and shows that there are some countries that cannot reach the leader country (Germany), in terms of labour productivity. The external effects (financial and technological externality) are increasing returns to scale, implying that the increase in inputs leads to a more proportionate increase in production. Also, externalities are voided geographically and thus encourage inequality of regional development. The diffusion of technol-ogy from north to south is a source of reducing these inequalities and requires the investment of productive resources in the South (Amina Naceur Sboui, 2010, p. 45). The pressure for the internationalization of capital in conjunction with the specific mode of building the EU, create a dissymmetry between negative (removal of all measures taken by the Member States restricted the free movement of persons, goods, services and capital) and positive integration, which has become structural in the last 40 years. The main institutions of the EU, such as the European Commission and
G. MAGOULIOS, S. ATHIANOS, South-Eastern Europe Journal of Economics 2 (2013) 187-216192
the Court, do work by further promoting negative integration. They prohibit state interference and impose penalties for anything that can be interpreted as opposed to a negative conclusion. The logic of European integration is such that market liberalization has precedence over state intervention. Thus, the negative integration is incorporated by conditions on the daily functioning of the EU, the positive integration – adoption of measures and creation of institutions of Europe-wide regulation -depends on the formation of consensus among multiple stakeholders who are in-volved in European decision-making. In fact, the negative integration removes power from nation states to restore the damage caused by the operation of the market, while this loss for the national state is not addressed at the supranational level (Horafas Vangelis, 2009). An investigation into the whether national regulations are widespread in intra-community trade indicates that they are behind the border measures that reduce the volume of trade between EU Member States or restrict it completely. These arrangements increase the cost of exports and create strategic advantage to domestic producers, disrupt the internal market and, in short, preclude the existence of a genuine single market. The benefits of such a single market are not fully recoverable and the EU's external competitiveness is compromised. Liberalization of the EU market creates benefits but also entails costs. Member States, using national regulations, try to adjust these costs by protecting their producers and defending their national interests as a way to restore the loss of economic sovereignty (Maria Helena Guimaraes, 2010, 48-49). The internal market in Europe has worked in favour of the interaction between development, trade and national economies. The contribution of the single market is equal to about 10% of the annual potential growth of EU. Nevertheless, the positive influence is weakened together with efforts made, aiming at completing the internal market for goods and setting up the internal market for services. In intra-Europe-an trade, in both processed products and services sectors, there has been a gradual reduction from 2001 and beyond. Another indication of inadequate integration of the single market is severe price fluctuations within the EU, which as far as price convergence is concerned, is far from the levels achieved in the U.S.A. However, there is a number of obstacles to free movement of goods, still hampered by a patchwork of national regulations, which are often applied arbitrarily and in clear violation of the principle of mutual recognition, which is the cornerstone of the internal market. The cost of not applying the principle of mutual recognition is estimated at about 150 billion (European Commission, 2004, p. 36-37, 41). From the investigation of specialization in the foreign trade and international competitiveness of Greece, Portugal, Spain, Turkey and the EU-12, it is revealed that the first three countries have tried to exploit the economic benefits from their participation in the EU and to eliminate the short-term economic drawbacks of their
G. MAGOULIOS, S. ATHIANOS, South-Eastern Europe Journal of Economics 2 (2013) 187-216 193
participation in the Common Market, through the Structural Funds. Turkey, on the other hand, had to face on its own the negative economic impact because of the fact that the country was not allowed the free export of agricultural products in the EU, in which it has a comparative advantage. The Greek economy was not fully able to exploit the economic benefits as a member of the single market. Since 1981, Greece has failed to alter the structure of exports of labour-intensive sectors to more up-to-date products. On the other hand, mainly Portugal and Spain have significantly improved their economic performance since 1986. The results show that the Turk-ish economy indicates remarkable performance in the export of commodities, it is challenging the economies of Greece and Portugal and it is trying to reach Spain in the coming decades (Bahri Yilmaz, 2008, p. 18). A study on the foreign trade of Greece, after joining the EU and particularly the commercial developments that occurred during the 1990's, found that Greece had suffered significant loss of competitiveness in those sectors in which it had traditionally a comparative advantage, a fact that is reflected in the trade deficit. Two explanations can be given for this development: The first is related to the fact that the demand for Greek exports in export markets has high income elasticity, making Greek exports vulnerable to cyclical fluctuations. Especially in the 1990's, two periods of economic slowdown were observed in Europe. This could partially explain the perceived stagnation of Greek exports during this period, in conjunction with the opening of transition economies to foreign trade, namely countries producing highly competitive products to the Greek ones (for example textiles and agricultural products), and the conflicts that took place in the Balkans, which disrupted land transport. The second explanation is related to the fact that Greek exports are particularly sensitive to fluctuations in the real exchange rate. In the 1990's, Greece aimed at reducing inflation through an ever closer relationship to the German Mark. To the extent that changes in the nominal exchange rate did not fully compensate for a declining but still positive inflation differential against the EU average, this policy was bound to lead to a real appreciation of the Greek drachma. In fact, the high sensitivity of Greek exports to changes in real exchange rates is itself a reflection of the fact that Greek production is still concentrated in low-tech, highly competitive areas where increases in relative prices or the emergence of cheaper close substitutes (such as those produced by the transition economies) lead to significant losses in market share (Michael G. Arghyrou, Evelyn Bazina, 2002, p. 17-18). An analysis of Greek exports and an estimation of the impact on export performance of the country, caused by EU accession, concluded that joining the EU not only failed to improve the export performance of the country, but also had a slight negative effect on Greek exports. As a small open economy with production concentrated on low–technology and high-competition areas, the country faces a price elastic demand for exports in the long term. The supply of exports is also price elastic and is mainly
G. MAGOULIOS, S. ATHIANOS, South-Eastern Europe Journal of Economics 2 (2013) 187-216194
determined by changes in the capacity of the Greek economy and export subsidies. The elimination of export subsidies had little effect on export prices. According to the relevant literature, one of the main reasons for the deterioration of Greek export performance after joining the EU, is that export subsidies during the period covered were not used for growth and diversification of products or new skills in production. These could help the country to create new comparative advantages in its products and gain market power in international trade. Instead, export subsidies alone were used to increase the income of exporters. These developments may explain the problems facing the Greek economy, particularly after the mid-1980s, despite the large amount of net funds received by the country from the EU budget (Koukouritakis Minoas, 2006, p. 165).
3. The external trade of Greece 2000-2008
3.1 Exports and imports of Greece 2000-2008
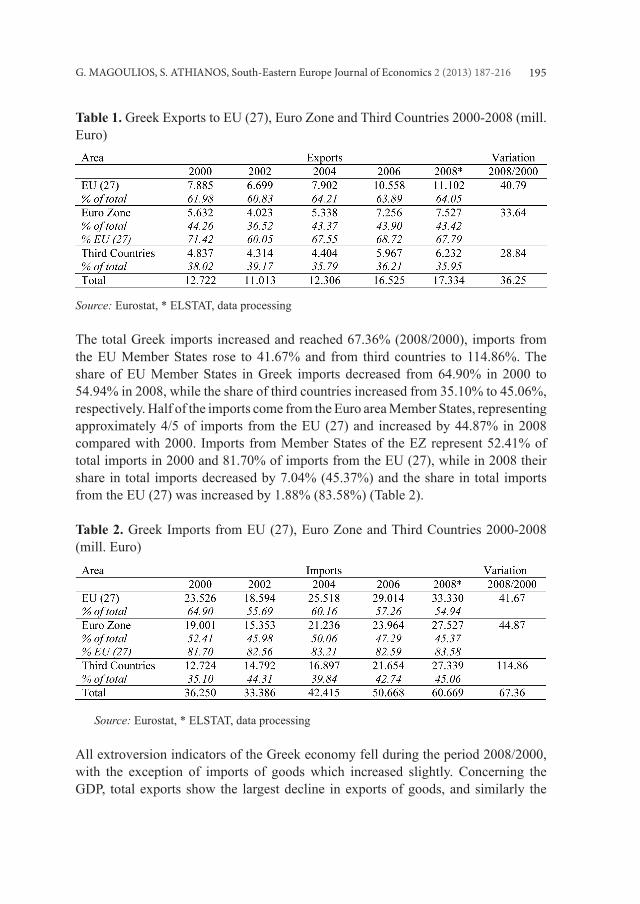
During the period 2000-2008, there was an increase in total Greek exports of 36.25%, while exports to the EU (27) increased by 40.79% and to third countries by 28.84%. More than 2/3 of exports to the EU were bound for the Euro Zone countries, in which exports increased by 1/3. The EU share of Greek exports rose by 61.98% in 2000 to 64.05% in 2008, while the share of third countries declined from 38.02% to 35.95%, respectively. In 2000, Greek exports to Member States EZ accounted for 44.26% of total exports and 71.42% of exports to the EU (27), while in 2008 their share in total exports decreased by 0.84% (43.42%) and 3.63% (67.79%) in exports to the EU (27) (Table1). In 2009, Greece's position in the EU-27 exports remained in the 21st place and the classification of the EZ remains 14th overall in 16 countries. The same year, Greece and Cyprus display the lowest degrees of openness in the EU-27. In par-ticular, the contribution of Greek exports to Gross Domestic Product (GDP) of the country is only 6.1% of GDP, while in 2006 the index shows a progressive decline. In contrast, in European economies such as Belgium, Holland, Hungary, Czech Re-public, Slovakia, Slovenia and Ireland, exports contribute over 50% of the GDP. The European average openness indicator for 2009 is 29.8%, so it can be inferred that the Greek economy has a long way to go to become internationally competitive and outward looking, at least in the EU-27 (Eurostat, 2009). In 2000, among the 20 major export markets of Greece, there were six Euro Zone countries in the following order and based on the value of exports: Germany first followed by Italy, France 8th, Spain 11th and Holland and Belgium being in the 12th and15th place respectively. Similarly, in 2008, there were eight countries in the EZ with the following ranking: Italy first, Germany second, Cyprus fourth, eighth France, Spain 10th, 13th Netherlands, Slovenia and Belgium 17th, 18th (ELSTAT).
G. MAGOULIOS, S. ATHIANOS, South-Eastern Europe Journal of Economics 2 (2013) 187-216 195
Table 1. Greek Exports to EU (27), Euro Zone and Third Countries 2000-2008 (mill. Euro)
Source: Eurostat, * ELSTAT, data processing
The total Greek imports increased and reached 67.36% (2008/2000), imports from the EU Member States rose to 41.67% and from third countries to 114.86%. The share of EU Member States in Greek imports decreased from 64.90% in 2000 to 54.94% in 2008, while the share of third countries increased from 35.10% to 45.06%, respectively. Half of the imports come from the Euro area Member States, representing approximately 4/5 of imports from the EU (27) and increased by 44.87% in 2008 compared with 2000. Imports from Member States of the EZ represent 52.41% of total imports in 2000 and 81.70% of imports from the EU (27), while in 2008 their share in total imports decreased by 7.04% (45.37%) and the share in total imports from the EU (27) was increased by 1.88% (83.58%) (Table 2).
Table 2. Greek Imports from EU (27), Euro Zone and Third Countries 2000-2008 (mill. Euro)
Source: Eurostat, * ELSTAT, data processing
All extroversion indicators of the Greek economy fell during the period 2008/2000, with the exception of imports of goods which increased slightly. Concerning the GDP, total exports show the largest decline in exports of goods, and similarly the
G. MAGOULIOS, S. ATHIANOS, South-Eastern Europe Journal of Economics 2 (2013) 187-216196
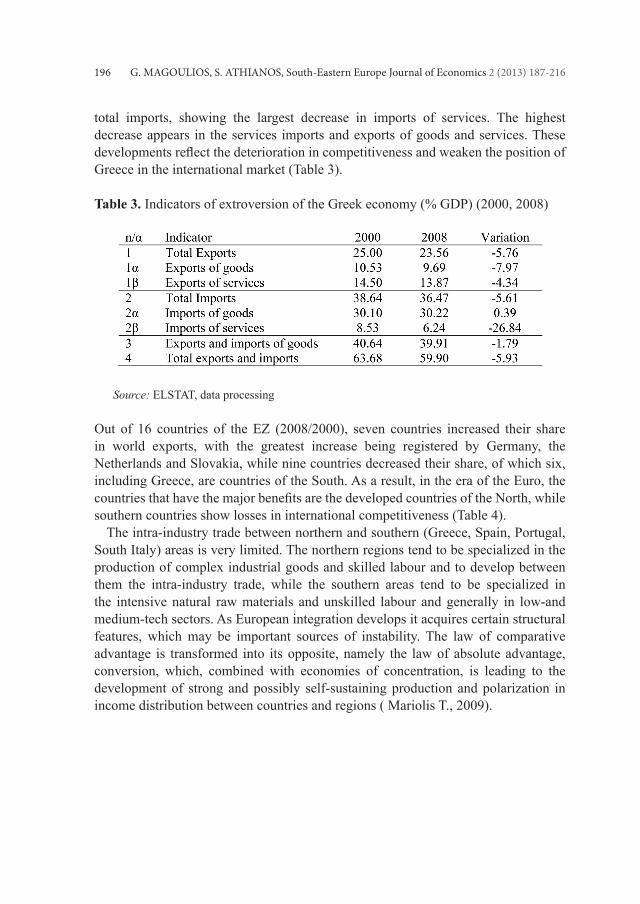
total imports, showing the largest decrease in imports of services. The highest decrease appears in the services imports and exports of goods and services. These developments reflect the deterioration in competitiveness and weaken the position of Greece in the international market (Table 3).
Table 3. Indicators of extroversion of the Greek economy (% GDP) (2000, 2008)
Source: ELSTAT, data processing
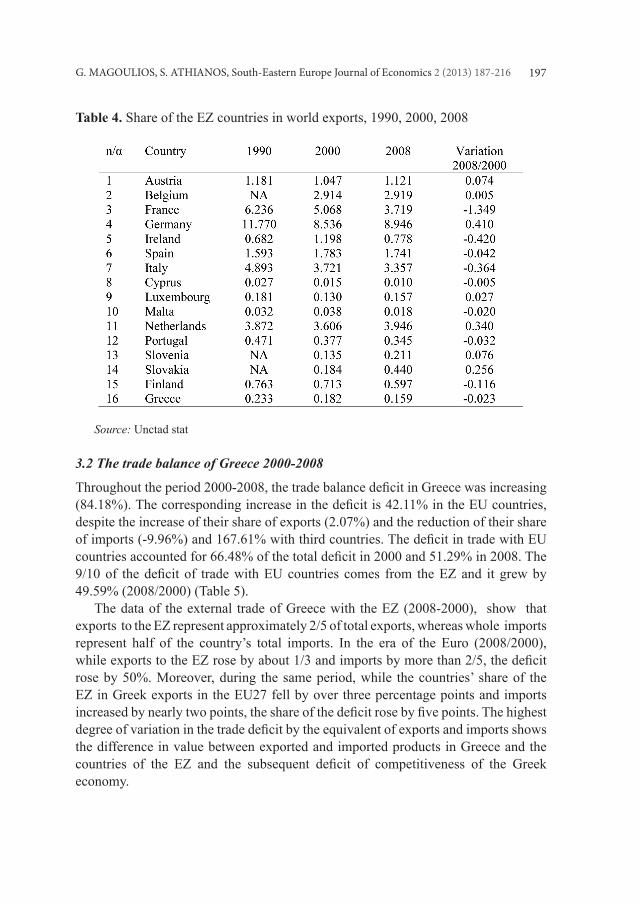
Out of 16 countries of the EZ (2008/2000), seven countries increased their share in world exports, with the greatest increase being registered by Germany, the Netherlands and Slovakia, while nine countries decreased their share, of which six, including Greece, are countries of the South. As a result, in the era of the Euro, the countries that have the major benefits are the developed countries of the North, while southern countries show losses in international competitiveness (Table 4). The intra-industry trade between northern and southern (Greece, Spain, Portugal, South Italy) areas is very limited. The northern regions tend to be specialized in the production of complex industrial goods and skilled labour and to develop between them the intra-industry trade, while the southern areas tend to be specialized in the intensive natural raw materials and unskilled labour and generally in low-and medium-tech sectors. As European integration develops it acquires certain structural features, which may be important sources of instability. The law of comparative advantage is transformed into its opposite, namely the law of absolute advantage, conversion, which, combined with economies of concentration, is leading to the development of strong and possibly self-sustaining production and polarization in income distribution between countries and regions ( Mariolis T., 2009).
G. MAGOULIOS, S. ATHIANOS, South-Eastern Europe Journal of Economics 2 (2013) 187-216 197
Table 4. Share of the EZ countries in world exports, 1990, 2000, 2008
Source: Unctad stat
3.2 The trade balance of Greece 2000-2008
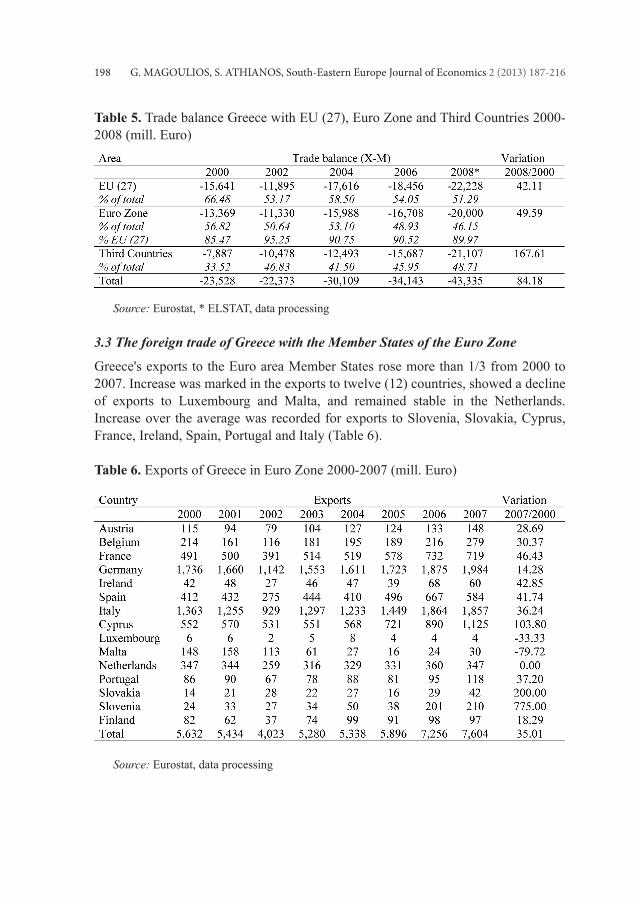
Throughout the period 2000-2008, the trade balance deficit in Greece was increasing (84.18%). The corresponding increase in the deficit is 42.11% in the EU countries, despite the increase of their share of exports (2.07%) and the reduction of their share of imports (-9.96%) and 167.61% with third countries. The deficit in trade with EU countries accounted for 66.48% of the total deficit in 2000 and 51.29% in 2008. The 9/10 of the deficit of trade with EU countries comes from the EZ and it grew by 49.59% (2008/2000) (Table 5). The data of the external trade of Greece with the EZ (2008-2000), show that exports to the EZ represent approximately 2/5 of total exports, whereas whole imports represent half of the country’s total imports. In the era of the Euro (2008/2000), while exports to the EZ rose by about 1/3 and imports by more than 2/5, the deficit rose by 50%. Moreover, during the same period, while the countries’ share of the EZ in Greek exports in the EU27 fell by over three percentage points and imports increased by nearly two points, the share of the deficit rose by five points. The highest degree of variation in the trade deficit by the equivalent of exports and imports shows the difference in value between exported and imported products in Greece and the countries of the EZ and the subsequent deficit of competitiveness of the Greek economy.
G. MAGOULIOS, S. ATHIANOS, South-Eastern Europe Journal of Economics 2 (2013) 187-216198
Table 5. Trade balance Greece with EU (27), Euro Zone and Third Countries 2000-2008 (mill. Euro)
Source: Eurostat, * ELSTAT, data processing
3.3 The foreign trade of Greece with the Member States of the Euro Zone
Greece's exports to the Euro area Member States rose more than 1/3 from 2000 to 2007. Increase was marked in the exports to twelve (12) countries, showed a decline of exports to Luxembourg and Malta, and remained stable in the Netherlands. Increase over the average was recorded for exports to Slovenia, Slovakia, Cyprus, France, Ireland, Spain, Portugal and Italy (Table 6).
Table 6. Exports of Greece in Euro Zone 2000-2007 (mill. Euro)
Source: Eurostat, data processing
G. MAGOULIOS, S. ATHIANOS, South-Eastern Europe Journal of Economics 2 (2013) 187-216 199
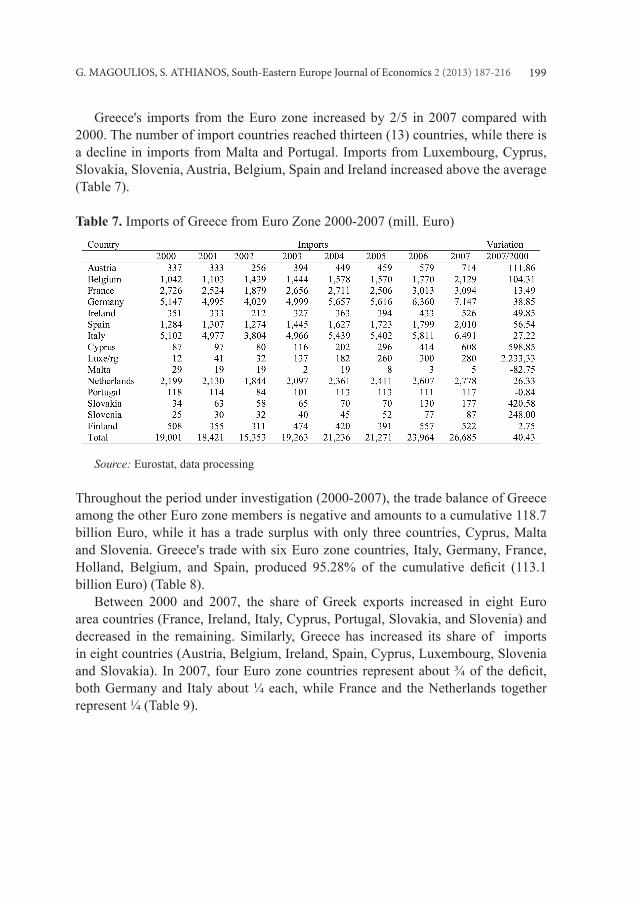
Greece's imports from the Euro zone increased by 2/5 in 2007 compared with 2000. The number of import countries reached thirteen (13) countries, while there is a decline in imports from Malta and Portugal. Imports from Luxembourg, Cyprus, Slovakia, Slovenia, Austria, Belgium, Spain and Ireland increased above the average (Table 7).
Table 7. Imports of Greece from Euro Zone 2000-2007 (mill. Euro)
Source: Eurostat, data processing
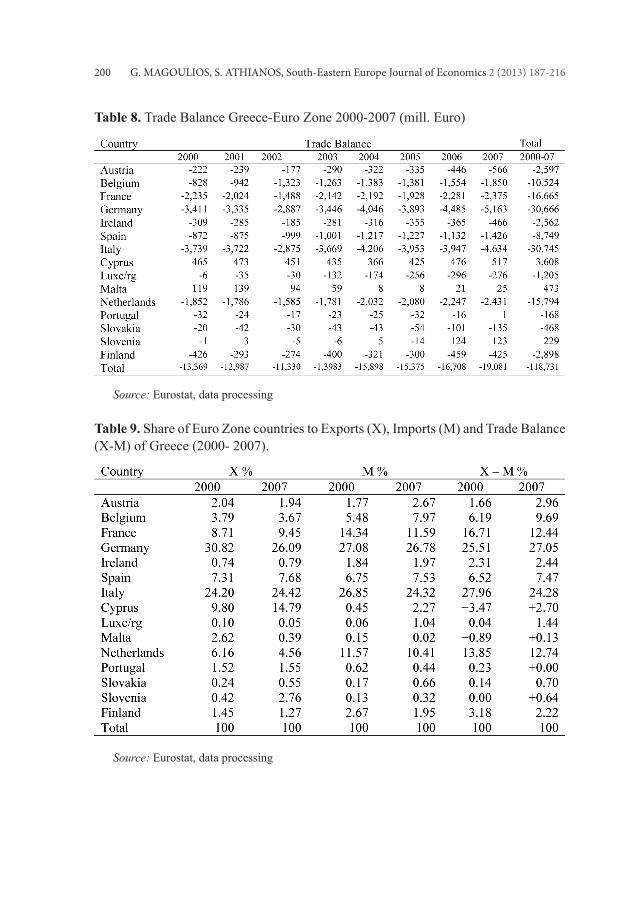
Throughout the period under investigation (2000-2007), the trade balance of Greece among the other Euro zone members is negative and amounts to a cumulative 118.7 billion Euro, while it has a trade surplus with only three countries, Cyprus, Malta and Slovenia. Greece's trade with six Euro zone countries, Italy, Germany, France, Holland, Belgium, and Spain, produced 95.28% of the cumulative deficit (113.1 billion Euro) (Table 8). Between 2000 and 2007, the share of Greek exports increased in eight Euro area countries (France, Ireland, Italy, Cyprus, Portugal, Slovakia, and Slovenia) and decreased in the remaining. Similarly, Greece has increased its share of imports in eight countries (Austria, Belgium, Ireland, Spain, Cyprus, Luxembourg, Slovenia and Slovakia). In 2007, four Euro zone countries represent about ¾ of the deficit, both Germany and Italy about ¼ each, while France and the Netherlands together represent ¼ (Table 9).
G. MAGOULIOS, S. ATHIANOS, South-Eastern Europe Journal of Economics 2 (2013) 187-216200
Table 8. Trade Balance Greece-Euro Zone 2000-2007 (mill. Euro)
Source: Eurostat, data processing
Table 9. Share of Euro Zone countries to Exports (X), Imports (M) and Trade Balance (X-M) of Greece (2000- 2007).
Source: Eurostat, data processing
G. MAGOULIOS, S. ATHIANOS, South-Eastern Europe Journal of Economics 2 (2013) 187-216 201
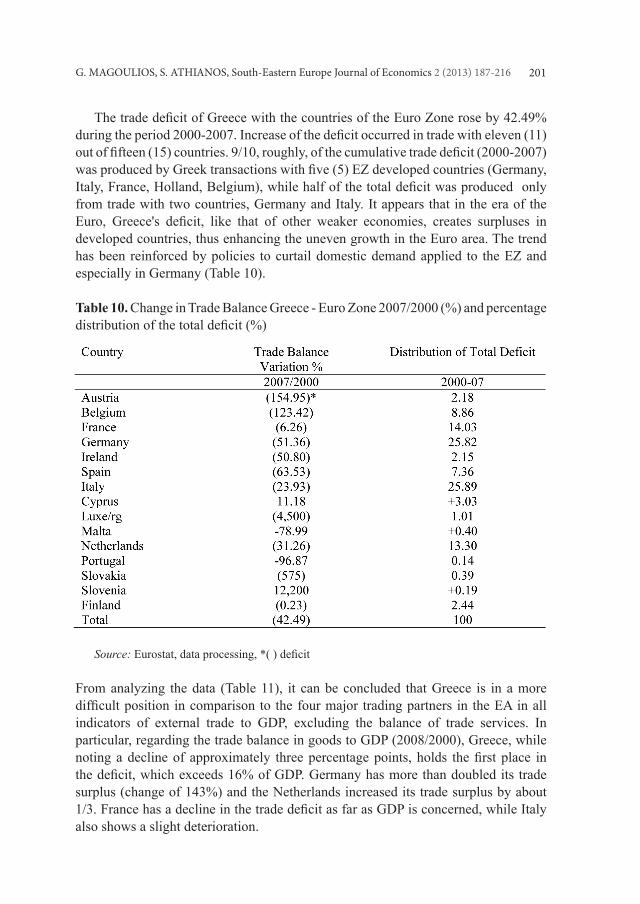
The trade deficit of Greece with the countries of the Euro Zone rose by 42.49% during the period 2000-2007. Increase of the deficit occurred in trade with eleven (11) out of fifteen (15) countries. 9/10, roughly, of the cumulative trade deficit (2000-2007) was produced by Greek transactions with five (5) EZ developed countries (Germany, Italy, France, Holland, Belgium), while half of the total deficit was produced only from trade with two countries, Germany and Italy. It appears that in the era of the Euro, Greece's deficit, like that of other weaker economies, creates surpluses in developed countries, thus enhancing the uneven growth in the Euro area. The trend has been reinforced by policies to curtail domestic demand applied to the EZ and especially in Germany (Table 10).
Table 10. Change in Trade Balance Greece - Euro Zone 2007/2000 (%) and percentage distribution of the total deficit (%)
Source: Eurostat, data processing, *( ) deficit
From analyzing the data (Table 11), it can be concluded that Greece is in a more difficult position in comparison to the four major trading partners in the EA in all indicators of external trade to GDP, excluding the balance of trade services. In particular, regarding the trade balance in goods to GDP (2008/2000), Greece, while noting a decline of approximately three percentage points, holds the first place in the deficit, which exceeds 16% of GDP. Germany has more than doubled its trade surplus (change of 143%) and the Netherlands increased its trade surplus by about 1/3. France has a decline in the trade deficit as far as GDP is concerned, while Italy also shows a slight deterioration.
G. MAGOULIOS, S. ATHIANOS, South-Eastern Europe Journal of Economics 2 (2013) 187-216202
Table 11. Indicators of Foreign Trade of Greece and the four largest trade partners in the Euro Area, (% GDP), (2000, 2008)
Source: European Commission, 2010
3.4 Factors influencing the trade balance deficit in the Euro era
3.4.1 The sectoral composition of foreign trade
Looking at the sectoral composition of Greek Foreign Trade (2008) in relation to four (4) countries of the EZ, with the largest amount of trade transactions (Germany, Italy, France, Netherlands) and after examining 99 branches with a two-digit code, it could be concluded that: In Greek external trade with Germany, out of the 89 branches, 73 (82%) are in deficit and 16 (18%) are surplus. In the case of Italy out of the 86 branches, 72 (84%) are in deficit and the 14 (16%) are surplus while in France out of the 75 branches, 61 (81%) are in deficit and 14 (19%) surplus. Finally, in the case of the Netherlands out of the 74 branches, 66 (89%) are overdrawn and 8 (11%) surplus. Of the twenty six (26) sectors that have a surplus in at least one of the four countries, three branches are in surplus with all four (4) countries, six are in surplus with the three countries, five are in surplus with two, whereas twelve sectors are in surplus with one country and approximately half of the branches (46) are in deficit with the four countries (Table 12). We investigated the Revealed Comparative Advantage Index (RCA) of the 14 sectors in surplus with at least 2 out of the 4 countries of EA (Germany, France, Italy and the Netherlands).
RCA = Xi / SXi: Mi / SMi
Where: Xi = exports of goods (with s / n 1-14 in Table 13) in 4 markets Mi = imports of the same sectors in their respective markets, SXi = total exports of each sector in all EU countries and SMi = total imports of the same goods from all EU countries
G. MAGOULIOS, S. ATHIANOS, South-Eastern Europe Journal of Economics 2 (2013) 187-216 203
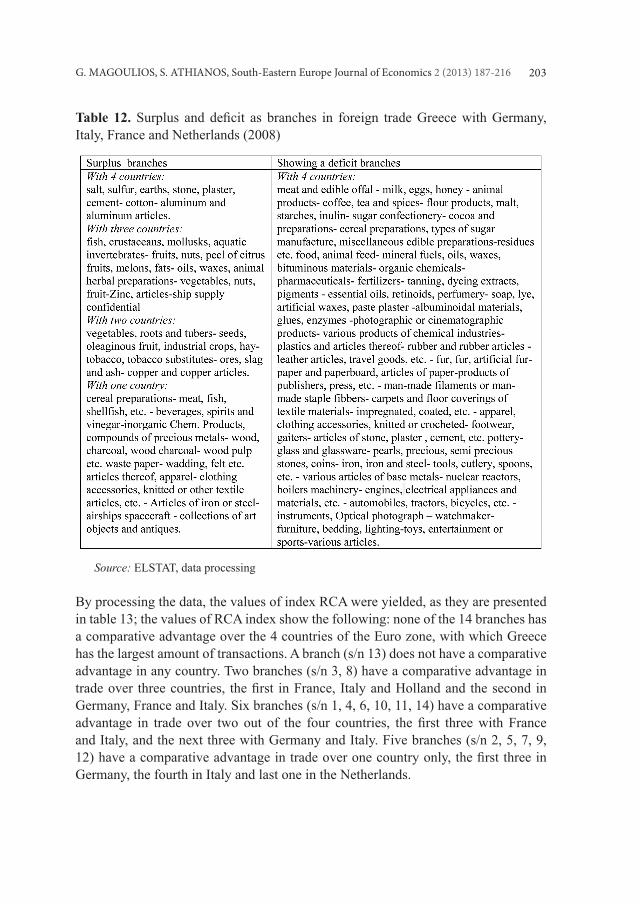
Table 12. Surplus and deficit as branches in foreign trade Greece with Germany, Italy, France and Netherlands (2008)
Source: ELSTAT, data processing
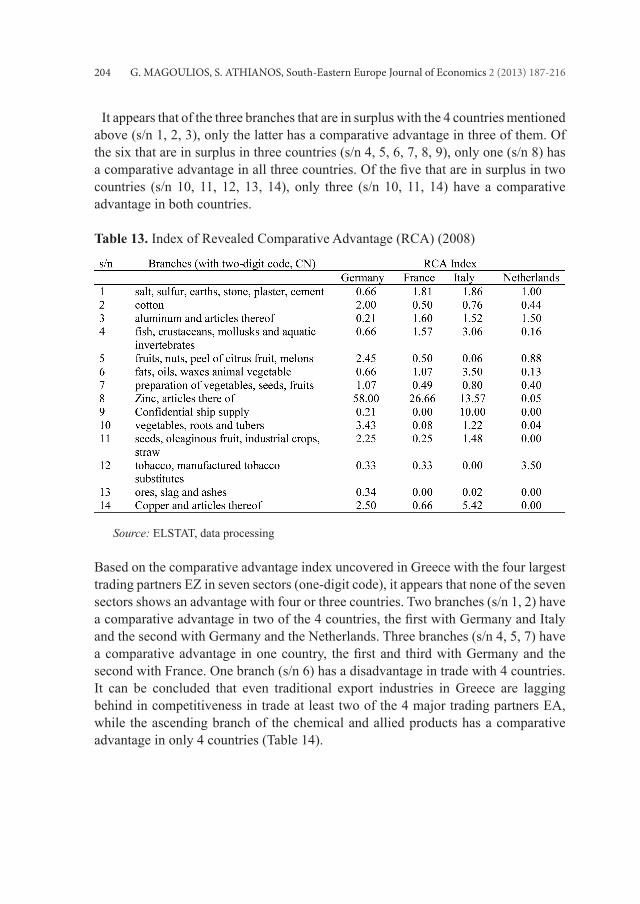
By processing the data, the values of index RCA were yielded, as they are presented in table 13; the values of RCA index show the following: none of the 14 branches has a comparative advantage over the 4 countries of the Euro zone, with which Greece has the largest amount of transactions. A branch (s/n 13) does not have a comparative advantage in any country. Two branches (s/n 3, 8) have a comparative advantage in trade over three countries, the first in France, Italy and Holland and the second in Germany, France and Italy. Six branches (s/n 1, 4, 6, 10, 11, 14) have a comparative advantage in trade over two out of the four countries, the first three with France and Italy, and the next three with Germany and Italy. Five branches (s/n 2, 5, 7, 9, 12) have a comparative advantage in trade over one country only, the first three in Germany, the fourth in Italy and last one in the Netherlands.
G. MAGOULIOS, S. ATHIANOS, South-Eastern Europe Journal of Economics 2 (2013) 187-216204
It appears that of the three branches that are in surplus with the 4 countries mentioned above (s/n 1, 2, 3), only the latter has a comparative advantage in three of them. Of the six that are in surplus in three countries (s/n 4, 5, 6, 7, 8, 9), only one (s/n 8) has a comparative advantage in all three countries. Of the five that are in surplus in two countries (s/n 10, 11, 12, 13, 14), only three (s/n 10, 11, 14) have a comparative advantage in both countries.
Table 13. Index of Revealed Comparative Advantage (RCA) (2008)
Source: ELSTAT, data processing
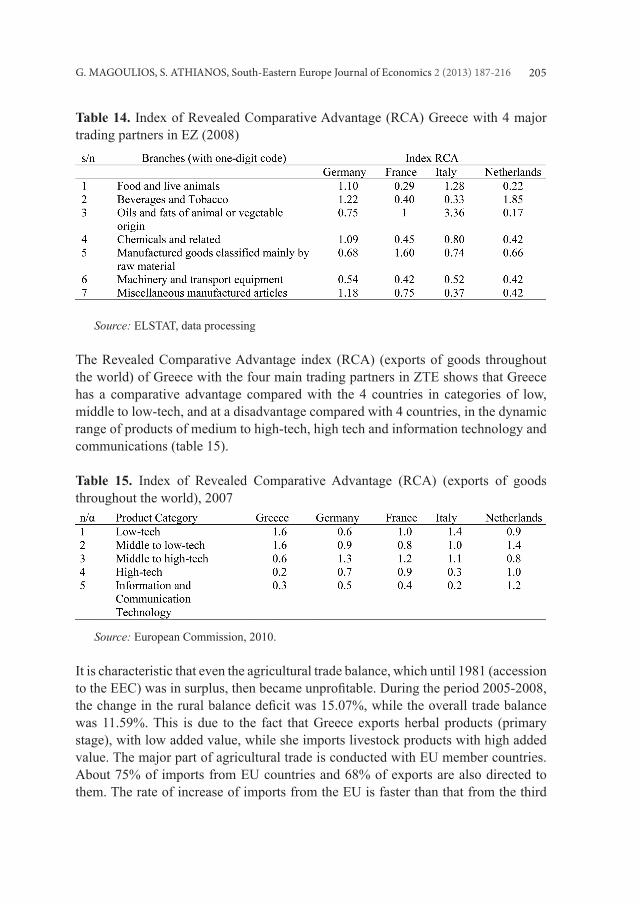
Based on the comparative advantage index uncovered in Greece with the four largest trading partners EZ in seven sectors (one-digit code), it appears that none of the seven sectors shows an advantage with four or three countries. Two branches (s/n 1, 2) have a comparative advantage in two of the 4 countries, the first with Germany and Italy and the second with Germany and the Netherlands. Three branches (s/n 4, 5, 7) have a comparative advantage in one country, the first and third with Germany and the second with France. One branch (s/n 6) has a disadvantage in trade with 4 countries. It can be concluded that even traditional export industries in Greece are lagging behind in competitiveness in trade at least two of the 4 major trading partners EA, while the ascending branch of the chemical and allied products has a comparative advantage in only 4 countries (Table 14).
G. MAGOULIOS, S. ATHIANOS, South-Eastern Europe Journal of Economics 2 (2013) 187-216 205
Table 14. Index of Revealed Comparative Advantage (RCA) Greece with 4 major trading partners in EZ (2008)
Source: ELSTAT, data processing
The Revealed Comparative Advantage index (RCA) (exports of goods throughout the world) of Greece with the four main trading partners in ZTE shows that Greece has a comparative advantage compared with the 4 countries in categories of low, middle to low-tech, and at a disadvantage compared with 4 countries, in the dynamic range of products of medium to high-tech, high tech and information technology and communications (table 15).
Table 15. Index of Revealed Comparative Advantage (RCA) (exports of goods throughout the world), 2007
Source: European Commission, 2010.
It is characteristic that even the agricultural trade balance, which until 1981 (accession to the EEC) was in surplus, then became unprofitable. During the period 2005-2008, the change in the rural balance deficit was 15.07%, while the overall trade balance was 11.59%. This is due to the fact that Greece exports herbal products (primary stage), with low added value, while she imports livestock products with high added value. The major part of agricultural trade is conducted with EU member countries. About 75% of imports from EU countries and 68% of exports are also directed to them. The rate of increase of imports from the EU is faster than that from the third
G. MAGOULIOS, S. ATHIANOS, South-Eastern Europe Journal of Economics 2 (2013) 187-216206
countries, a development that leads to continuous increase in the share of imports from the EU and to an increasing rural deficit (Chymis A., Reziti J., 2010, p. 41, 42). On the sectoral composition of foreign trade of Greece, it has been noted that in the era of the Euro, the country's comparative advantages are still mostly concentrated in labour intensive industries, low and intermediate technology, while the country still lags behind in dynamic high-tech industries. Even in traditional sectors where the country has experience and expertise, it seems to have lost its comparative advantage. This development, in the intensely competitive environment of the EA, highlights the weaknesses and structural problems of the country's productive base, low productivity of fixed capital and hindrances to research and technology. Greek production, despite the country's participation in the group of the most developed economies in the EU and despite the use of almost four Community Support Frameworks, continues to show characteristics similar to emerging economies.These economies have stronger comparative advantages, as they have not acquired yet the characteristics of developed countries in terms of production structure and foreign trade. This gap and the incomplete identity of a developed country, exacerbate the conditions of foreign trade, resulting in trade deficit. The combination of high economic growth, the persistent fiscal imbalances and the deterioration of the competitiveness over the past decade have worsened the external balance of the Greek economy, with the current account deficit peaking at 14.75% of GDP in 2007, before declining to 13.75% of GDP in 2008 from a position close to balance in the mid 1990's. The widening of the external imbalances happened mainly due to a growing deficit of trade, which reached approximately 17% of GDP in 2008 (almost 6 percentage points more than that of 1995). In particular, the performance of merchandise exports has been disappointing over the last decade, while imports have grown significantly, driven by high domestic demand. Regarding the specificity of the product, the share of low technology and labour-intensive products remains important, though declining. The share of exports with high added value (high technology) has been slightly higher in the last few years, though it still remains much lower than in the Euro area (European Commission, 2010, p. 68-73). In its report, the IMF analyzes the constant market shares (CMS) of Greek exports during the period 1992-2005, recognizing the profound transformations that have occurred over the last twenty years in Greek exports, both in terms of (geographical) markets, and in terms of products. This analysis seeks to allocate the trade flows between the three different outcomes: a) results of world trade (world trade effects), ie changes due to the overall growth of international trade, b) allocation of markets (market distribution effects), ie. effects due to geographic specializa-tion of a country in specific markets and c) results of the composition of exports (commodity composition effects), namely the effects due to the specialization of a country in specific sectors / categories. The difference between these results and the
G. MAGOULIOS, S. ATHIANOS, South-Eastern Europe Journal of Economics 2 (2013) 187-216 207
overall change in exports is attributed to the changes in export competitiveness of the country, either positive (when the balance is positive) or negative. For the period 2000-2005, the IMF analysis found that 80-90% of export growth in the country is due to the effects of world trade, namely that the observed increase in Greek exports is mainly due to the total increase of the volume of international trade. The geograph-ical location of Greece and its access to the rapidly growing markets of the Balkans, also leads to a positive result because of the geographical distribution of markets, which represents 35-40%, approximately, of the export growth. On the negative side, however, the specificity of the products had a negative impact on the country's ex-ports, leading to a drop of 15%. The remaining (negative) percentage is attributed to a loss of competitiveness. In this way the IMF report confirms that the export performance of the country mainly depends on demand, coupled with the recovery of the global economy rather than improving the competitiveness of the Greek economy (IMF, 2007).
3.4.2 Differences in Inflation between Greece and Euro Zone
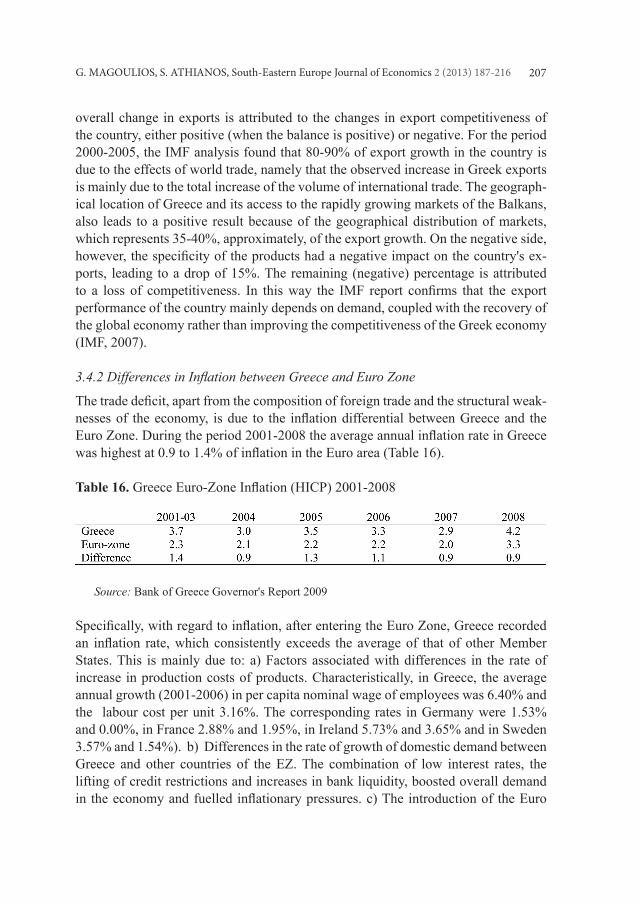
The trade deficit, apart from the composition of foreign trade and the structural weak-nesses of the economy, is due to the inflation differential between Greece and the Euro Zone. During the period 2001-2008 the average annual inflation rate in Greece was highest at 0.9 to 1.4% of inflation in the Euro area (Table 16).
Specifically, with regard to inflation, after entering the Euro Zone, Greece recorded an inflation rate, which consistently exceeds the average of that of other Member States. This is mainly due to: a) Factors associated with differences in the rate of increase in production costs of products. Characteristically, in Greece, the average annual growth (2001-2006) in per capita nominal wage of employees was 6.40% and the labour cost per unit 3.16%. The corresponding rates in Germany were 1.53% and 0.00%, in France 2.88% and 1.95%, in Ireland 5.73% and 3.65% and in Sweden 3.57% and 1.54%). b) Differences in the rate of growth of domestic demand between Greece and other countries of the EZ. The combination of low interest rates, the lifting of credit restrictions and increases in bank liquidity, boosted overall demand in the economy and fuelled inflationary pressures. c) The introduction of the Euro
G. MAGOULIOS, S. ATHIANOS, South-Eastern Europe Journal of Economics 2 (2013) 187-216208
(2002), is estimated to have contributed to an increase in inflation of 0.5%. d) The distortion of competition in Greece, the existence of monopolistic and oligopolistic markets, enabling companies to increase product prices (Anastasatos T., 2008, p. 26, Alpha Bank, 2007, p. 40-41, 47).
3.4.3. The real exchange rate in Greece in the Euro era
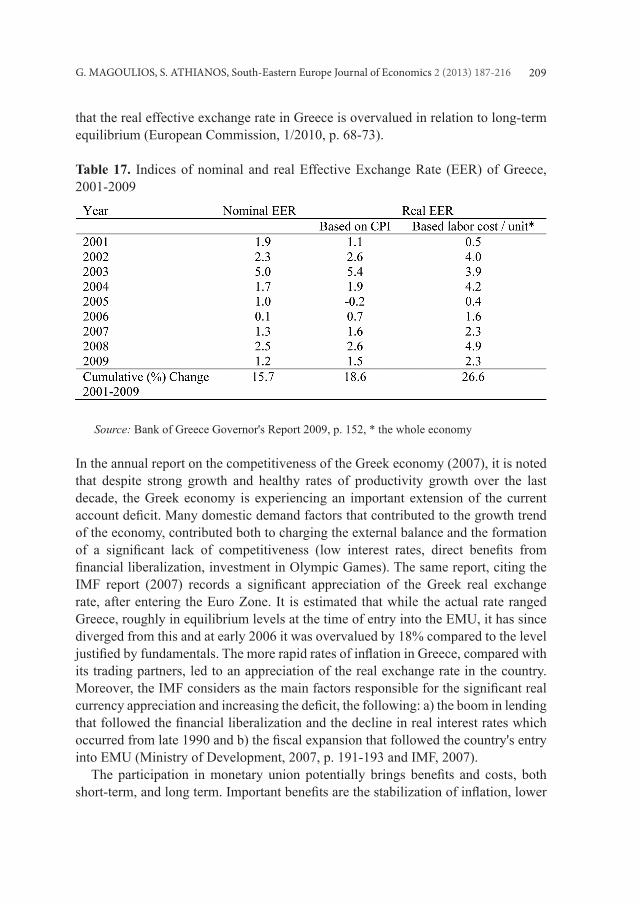
As shown in Table 17, Greece has had a large loss of competitiveness, which cumulatively for the period 2001-2009, amounted to 18.6% based on the CPI and to 26.6% on labour costs per unit of product of the total economy. The growth rates of prices and wages in Greece remained consistently higher than the corresponding Euro area, resulting in substantial appreciation of the real effective exchange rate (based on external trade of Greece with 28 major trading partners). This development has exacerbated the level of competitiveness of Greek manufacturing and its ability to respond to changes in domestic and external demand (Bank of Greece, 2009, p. 143, 157). But the claim that the Greek economy has deteriorated because of wage increases is questionable. It is argued that the requirements for employees in Greece have been increased by approximately the same rate as the average of competitor countries and that the Euro is solely responsible for the deterioration of price competitiveness. It is reported that the productivity of labour in Greece (1995-2009) had converged to the average EU-15 more closely than the purchasing power of the average wage had converged. While the convergence of productivity had risen to about 18 percentage points, the real average earnings per worker had risen to about 14 percentage points. Moreover, it is noted that the unit labour costs in manufacturing industry (involved with a large weight to foreign trade) declined (by 100 in 1999) to 94.5 in 2009 versus the Euro and 94.4 to the European Union of 27 (INE, 2010, p. 172, 177). According to the European Commission, all the four indicators of the real effective exchange rate (based on: the GDP deflator, private consumption, export price and unit costs throughout the economy) had an appreciating trend against the corresponding indices for 35 industrial Members since 2000. Between 2000 and 2008, the appreciation is around 16% on the price deflator for exports and 13% based on the GDP deflator. The persistently high inflation seems to be mainly the result of non-competitive behaviour and rigidities in product and labour markets. The appreciation of the cost per unit is based on the real effective exchange rate for the whole economy (over 14% in 2008 to 2000, compared to 35 industrial countries), resulting in much higher wage increases than in the Euro and the 35 industrialized countries, despite rapidly rising productivity, which exceeded that of the Euro area. The persistently higher inflation and the loss of competitiveness may also be related to imperfections in the functioning of product markets, as evidenced by the rapidly developing increases. In sum, most estimates of equilibrium exchange rates suggest
G. MAGOULIOS, S. ATHIANOS, South-Eastern Europe Journal of Economics 2 (2013) 187-216 209
that the real effective exchange rate in Greece is overvalued in relation to long-term equilibrium (European Commission, 1/2010, p. 68-73).
Table 17. Indices of nominal and real Effective Exchange Rate (EER) of Greece, 2001-2009
Source: Bank of Greece Governor's Report 2009, p. 152, * the whole economy
In the annual report on the competitiveness of the Greek economy (2007), it is noted that despite strong growth and healthy rates of productivity growth over the last decade, the Greek economy is experiencing an important extension of the current account deficit. Many domestic demand factors that contributed to the growth trend of the economy, contributed both to charging the external balance and the formation of a significant lack of competitiveness (low interest rates, direct benefits from financial liberalization, investment in Olympic Games). The same report, citing the IMF report (2007) records a significant appreciation of the Greek real exchange rate, after entering the Euro Zone. It is estimated that while the actual rate ranged Greece, roughly in equilibrium levels at the time of entry into the EMU, it has since diverged from this and at early 2006 it was overvalued by 18% compared to the level justified by fundamentals. The more rapid rates of inflation in Greece, compared with its trading partners, led to an appreciation of the real exchange rate in the country. Moreover, the IMF considers as the main factors responsible for the significant real currency appreciation and increasing the deficit, the following: a) the boom in lending that followed the financial liberalization and the decline in real interest rates which occurred from late 1990 and b) the fiscal expansion that followed the country's entry into EMU (Ministry of Development, 2007, p. 191-193 and IMF, 2007). The participation in monetary union potentially brings benefits and costs, both short-term, and long term. Important benefits are the stabilization of inflation, lower
G. MAGOULIOS, S. ATHIANOS, South-Eastern Europe Journal of Economics 2 (2013) 187-216210
interest rates, easier financing of public and external debt, the elimination of exchange risk on trade with other member states of the Euro Zone, and the consequent boost in intra-European trade; and as a result the stabilization of the expectations about the course of the exchange rate against other currencies. The price of this stability is the denial of policy tools that could be used to offset macroeconomic shocks. Monetary and exchange rate policy is now designed not on the basis of national circumstances, but according to pan-European needs. Thus, as depreciation against the other part-ners is not feasible, inflation differentials are accumulated and translated into real currency revaluation, thereby affecting the competitiveness of the economy (Tasos Anastasatos, 2008, p. 1-3, 26-27). Moreover, the lack of the EMU completion - monetary union without a common economic policy, non-optimal currency area-, the restrictive policies which apply to domestic demand in most developed countries of EA and particularly in Germany and the differences in tax rates affect negatively foreign trade in the Euro Zone, operate against the weaker economies in the South and in favour of the developed economies of the North. The result of this is that trade deficits accumulate in the southern countries like Greece, which are surplus to the powerful and dynamic economies of the North. Therefore, the functioning of EMU as an incomplete monetary integration, has contributed so far in bringing the economies of member countries up, but it works, through its foreign trade as a mechanism to transfer wealth from poorer to richer leader countries and reinforces the uneven growth of powerful economies in favour of the strong and against the weak. Without mechanisms for redressing these imbalances, government deficits and trade deficits increase, resulting in the so-called twin deficits to inflate the debts of poorer nations.
4. Regression model to measure the degree of influence of the variables on the trade balance
4.1 Data and Methodology
Part of the data used in this analysis, constitute the body of the development of the model. In particular, the data refers to the trade balance, exports, imports, and the share of Euro Zone countries in exports and imports, inflation as well as the estimated Re-vealed Comparative Advantage index (RCA). The examined period spans from 2000 to 2007. Therefore the methodology used the above variables which identify the trade balance, incorporating any effects on formation of the balance. This methodology includes information and determinants which are depicted in the model as follows:
Where ΤΒt the trade balance of Greece, IMPit the imports, ΕΧΡit the exports, Χit the share of Euro Zone countries to exports, Μit the share of Euro Zone countries to imports, Ιit the inflation and RCAit the Revealed Comparative Advantage index (of 14
G. MAGOULIOS, S. ATHIANOS, South-Eastern Europe Journal of Economics 2 (2013) 187-216 211
sectors with overcapacity at least by 2 of the 4 countries of ZTE - Germany, France, Italy and the Netherlands), under the formation of dichotomous dummy variable. Finally, where εit is the white noise error. When using the deterministic variables in the above model, logarithmic values were used to avoid any econometric problems (heteroscedasticity), although using prices rather logarithms gives us a more economically rational response (Kothari and Zimmerman, 1995: 157). Regarding the dichotomous dummy variable (slope dummy) of the model, it takes the value 0 when Greece has a comparative advantage over another country of the Euro zone, and 1 otherwise. However, the existence of SOMETHING MISSING HERE, slope dummy differentiates the determination of variables in the model, transforming the model as follows:
The implementation of the model was based on panel data analysis, considering it as the most appropriate for cross-sections controls. In addition, we tested the variables of the model on two levels. At the first level of analysis, we tested the degree of impact on the trade balance, by using only the variables of exports, imports, inflation and comparative advantage. In contrast, in the second level we did not count imports and exports, but the share of Euro zone countries in exports and imports. Finally, the model was examined in both variable and fixed periods and cross-section controls, giving differing results, especially for inflation.
4.2 Results Analysis of the Model
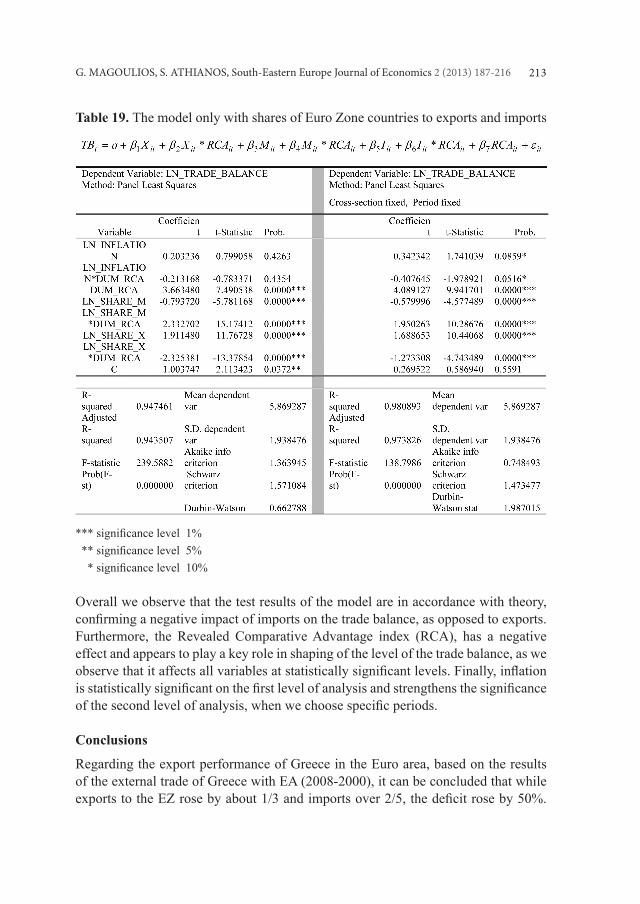
The test results of the model are described in the following tables. In particular, we note that in the case of vagueness of the period and cross-section control the results appear to be in line with the theory, as well as the results of the first level of analysis of the present paper (section 3.4) while all variables are statistically significant (ΙΜΡ, ΕΧΡ p<1%, RCA p<10%) except the inflation (table 18). Moreover, the explanatory power of the model equals to AdjR2= 95.21% as well as AC (Akaike Criterion) = 1.1976. Finally, we observe a negative impact of imports and a positive impact of exports on the trade balance. In contrast, while selecting fixed periods we observe that inflation is statistically significant at the level of p<10%, with AdjR2= 97.42% and AC (Akaike Criterion) = 0.7315 (table 18). Regarding the second level of control (using of shares of imports and exports rather than imports and exports), we find similar results to those of the first level of analysis. In particular, during the vagueness (of the dummy variable) all variables, except inflation, are statistically significant (ΙΜΡ, ΕΧΡ, RCA p<1%), while the explanatory power of the model equals to AdjR2= 94,35% and AC (Akaike Criterion) equals to 1.3639. At the same level we observe the results while selecting certain
G. MAGOULIOS, S. ATHIANOS, South-Eastern Europe Journal of Economics 2 (2013) 187-216212
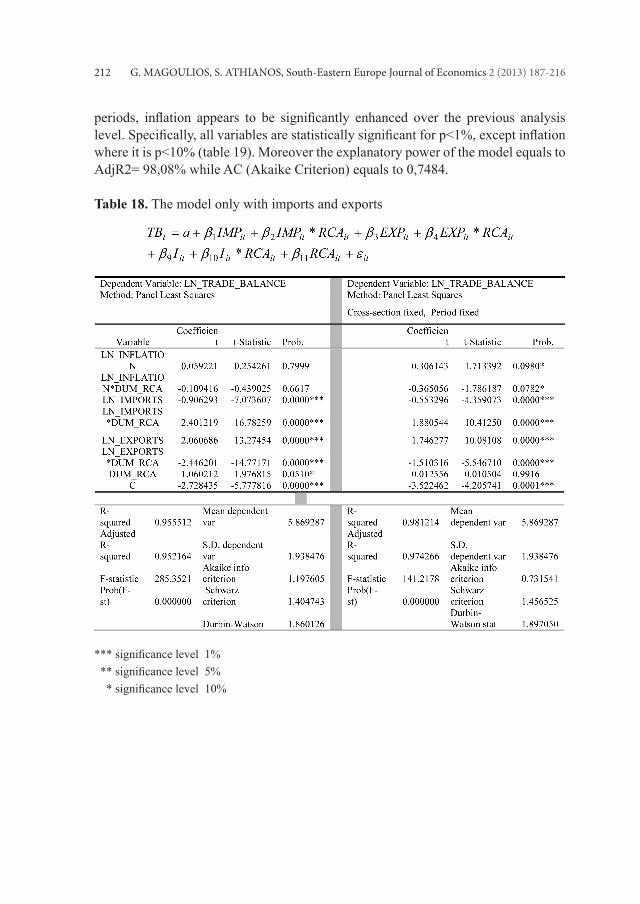
periods, inflation appears to be significantly enhanced over the previous analysis level. Specifically, all variables are statistically significant for p<1%, except inflation where it is p<10% (table 19). Moreover the explanatory power of the model equals to AdjR2= 98,08% while AC (Akaike Criterion) equals to 0,7484.
Overall we observe that the test results of the model are in accordance with theory, confirming a negative impact of imports on the trade balance, as opposed to exports. Furthermore, the Revealed Comparative Advantage index (RCA), has a negative effect and appears to play a key role in shaping of the level of the trade balance, as we observe that it affects all variables at statistically significant levels. Finally, inflation is statistically significant on the first level of analysis and strengthens the significance of the second level of analysis, when we choose specific periods.
Conclusions
Regarding the export performance of Greece in the Euro area, based on the results of the external trade of Greece with EA (2008-2000), it can be concluded that while exports to the EZ rose by about 1/3 and imports over 2/5, the deficit rose by 50%.
G. MAGOULIOS, S. ATHIANOS, South-Eastern Europe Journal of Economics 2 (2013) 187-216214
Throughout the period under investigation, the trade balance of Greece compared to the other Euro Zone members was negative and increasing. Greece's trade transactions with five countries in the Euro Zone, namely Italy, Germany, France, Holland and Belgium, produced about 9/10 of the cumulative deficit. In the Euro era, the Greek economy has reported losses, since the outward indicators of the Greek economy fell during the period 2008/2000 with the exception of imports of goods which increased slightly. As for GDP, total exports fell and the highest decrease was noted in export goods. These developments reflect the deterioration of competitiveness and weaken the position of Greece in the international market. Moreover, out of 16 EZ countries (2008/2000), only the developed northern countries increased their share in world exports, while the southern ones, including Greece, decreased their share especially in southern countries. Subsequently, in the era of the Euro and at a global level, mainly the developed countries of the north have a benefit, while the southern countries have losses in international competitiveness. The structure of production and foreign trade affect the trade balance deficit and competitiveness of the Greek economy. As shown by the Index of Revealed Comparative Advantage (RCA) (exports of goods throughout the world) of Greece and the four main trading partners in the EZ, Greece has a comparative advantage in the categories of low, middle to low range technology, while it has a disadvantage in the dynamic range of products of medium to high-tech, high tech and information technology and communications. This development, in the intensely competitive environment of the EZ, high-lights the weaknesses and structural problems of the country's productive base, low productivity of fixed capital and the lag in research and technology. Greek production, despite the country's participation in the group of most developed economies in the EU and despite the use of almost four Community Support Frameworks, continues to show features of an emerging economy, where they have stronger comparative advantages, while it does not have features of a developed country in terms of production structure and ?? foreign trade. This gap and the incomplete identity of a developed country, exacerbate the conditions of foreign trade, thus producing the trade deficit. The lack of competitiveness, apart from the structural weaknesses of the sectoral composition of foreign trade, is due to the inflation differential between Greece and the EZ. The faster rates of inflation in Greece, compared with its trading partners, led to a revaluation of the real exchange rate in the country. Given that the monetary and exchange rate policy is not any longer designed according to the needs of the Euro and depreciation against other partners is not feasible, the inflation differentials accumulate and translate into real currency revaluation, thereby affecting the competitiveness of the economy.
G. MAGOULIOS, S. ATHIANOS, South-Eastern Europe Journal of Economics 2 (2013) 187-216 215
Therefore, the functioning of EMU, as an incomplete monetary integration, has contributed so far to bringing the economies of member countries up, but it also operates, through its foreign trade, as a mechanism of wealth transfer from poorer to richer leader countries and reinforces the uneven growth in favour of the powerful economies against the weaker ones. Without mechanisms to restore these imbalances, government deficits are added to trade deficits, resulting in the so-called twin deficits that inflate the debts of poorer nations.
References Alpha Bank, 2007, “Competition and Inflation: A disastrous relationship”, Economic Bulletin, Issue
101, p. 40-41, 47.Amina Naceur Sboui, 2010, “Regional Growth in the Euro Mediterranean Countries: Effects of
Increasing Retunes and Spatial Externalities”, International Journal of Economics and Finance, vol. 2, No 1, p. 45.
Anastasatos Tasos, 2008, “Greek Monetary Policy and the Lessons for the New Europe”, Eurobank, p. 1-3, 26-27.
Anastasopoulos G., 2004, “The Greek economy, Strategic Approach”, Ministry of Development, General Secretariat of Industry, p. 57, 59.
Bahri Yilmaz, 2008, “Foreign Trade Specialization and International Competitiveness of Greece, Portugal, Spain, Turkey and the EU 12”, Center for European Studies Working Paper Series 166, p. 18.
Bank of Greece Governor’s Report 2009, p. 143, 152, 157.Chymis Athanasios, Reziti Joanna, 2010, “Foreign trade of agricultural products and foodstuffs”,
KEPE Economic Developments 2010/12, p. 41, 42. ELSTAT.European Commission, 2004, “Meeting the Challenge, The Lisbon Strategy for Growth and
Employment”, Report of the High Level Group chaired by Wim Kok, p. 36, 37, 41. European Commission, 1/2010, “Surveillance of Intra-Euro-Area Competitiveness and Imbalances”,
European Economy, p. 68-73, 143.Eurostat.Horafas Vangelis, 2009, “EMU and the global financial crisis», Monthly Review, No. 53. Hossein Varamini, Svetlana Kalash, 2010, “Foreign Direct Investment Inflows, Economic Growth,
and Trade Balances: The Experience of the New Members of the European Union”, Journal of East-West Business, 16, p. 18-19.
INE GSEE-ADEDY, 2010, “Greek Economy and Employment”, Annual Report, p. 172, 177.International Monetary Fund, 2007, “Greece: Selected Issues”, IMF Country Report 07/27.Jan Van Hove, 2010, “Variety and quality in intra-European manufacturing trade: the impact of
innovation and technological spillovers”, Journal of Economic Policy Reform Vol. 13, No. 1, p. 56-57.
Jarko Fidrmuc, 2005, “Trade Structure during Accession to the EU”, Post-Communist Economies, Vol. 17, No. 2, p. 232-233.
Joakim Gullstrand, 2006, “Demand patterns and vertical intra industry trade with special reference to North–South trade”, The Journal of International Trade & Economic Development, 11, p. 446-447.
Kothari, S. P., Zimmerman. J. L., (1995), “Price and return models”, Journal of Accounting and Economics, Vol. 20, No. 2, pp. 155–192.
G. MAGOULIOS, S. ATHIANOS, South-Eastern Europe Journal of Economics 2 (2013) 187-216216
Koukouritakis Minoas, 2006, “EU accession effects on export performance: The case of Greece”, South-Eastern Europe Journal of Economics, p. 165.
Kui-Wai Li, Siegfried Bender, 2007, “Productivity and manufacture export causality among world regions: 1989-1999”, The International Trade Journal, volume xxi, No 2, p. 141-143.
Maria Helena Guimaraes, 2010, “How pervasive are national regulations in intra-EE trade?”, The International Trade Journal, volume 24, No 1, p. 48-49.
Mariolis Theodore, 2009, “The Euro and the international financial crisis”, Monthly Review, No. 53.Michael G. Arghyrou, Evelyn Bazina, 2002, “Competitiveness and the External Trade Performance of
Greece in the 1990s: A cross-sect oral investigation», Economics and Finance Section”, School of Social Sciences, Brunel University, Economics and Finance Discussion Papers, Ν 02-06, p. 17-18.
Ministry of Development, 2007, Special Secretariat for Competitiveness, National Competitiveness and Development Council, Annual Competitiveness Report, p. 191-193, and IMF, 2007, Greece: Selected Issues. IMF Country Report 07/27. International Monetary Fund: Washington, D.C.
SEVE 2009, “Annual Report on the progress of foreign trade-Euro zone EU-Greece 2004-2008”, p. 7 and 18.
Turan Subasat, 2008, “Do liberal trade policies promote trade openness?”, International Review of Applied Economics, Vol. 22, No. 1, p. 58-59.


![Donohue - AP Euro La Belle Epoque [1871-1914]: “The Beautiful Era”](https://static.documents.pub/doc/80x56/5a4d1b117f8b9ab05998fd4f/donohue-ap-euro-la-belle-epoque-1871-1914-the-beautiful-era.jpg)


