The Trading Floor July 2017 Table of Contents TECHNICAL ANALYSIS Dominance of FAAMG .................................................................................................................................. 2 A VIEW FROM THE TRADE DESK Finding Liquidity for ETFs ............................................................................................................................. 5 TRADING STRATEGIES Anatomy of a Trade – JPM ........................................................................................................................... 7 SPECIAL FEATURE How Financial Advisors Use and Think About Exchange-listed Options .................................................... 10 KEY INDICATORS The Retail Sector – Broken or a Bargain? .................................................................................................. 14 EDUCATION & EVENTS Upcoming Webcast Series and Live Events............................................................................................... 17 BIOS Meet the Contributing Writers ..................................................................................................................... 20
Transcript
The Trading FloorJuly 2017
Table of Contents
TECHNICAL ANALYSIS
Dominance of FAAMG .................................................................................................................................. 2
A VIEW FROM THE TRADE DESK
Finding Liquidity for ETFs ............................................................................................................................. 5
TRADING STRATEGIES
Anatomy of a Trade – JPM ........................................................................................................................... 7
SPECIAL FEATURE
How Financial Advisors Use and Think About Exchange-listed Options .................................................... 10
KEY INDICATORS
The Retail Sector – Broken or a Bargain? .................................................................................................. 14
EDUCATION & EVENTS
Upcoming Webcast Series and Live Events ............................................................................................... 17
BIOS
Meet the Contributing Writers ..................................................................................................................... 20
The Trading Floor | TD Ameritrade Institutional 2
You’ve probably heard some talking head reference the “FAANG” stocks, in trying to discuss the largest tech stocks in the market. Netflix is the 23rd largest company in the NASDAQ 100 Index (NDX) and is therefore an interesting choice to put in the top five discussion, but oohh Fangs!! Microsoft is the company that belongs there at number three, but I know, FAAMG doesn’t quite have the same ring to it. Anyway, today we’re going to talk about what matters, not just what sounds good.
First, let’s take a look at the year to date (YTD) performance as well as the percentage weighting of the NDX to the five largest companies as of July 10, 2017. For reference, the NDX is up 15.8% YTD as of this writing.
This means that these five companies represent 42% of the NDX market cap, and are responsible for 60% of the gains in the NDX so far this year. The weighted average of these 5 companies is up a whopping 22.5%. Let’s put that into perspective with the other major indexes in the market and their YTD performance.
SPX +7.6%, $DJI +7.8%, RUT +3.6%, NDX +15.8%
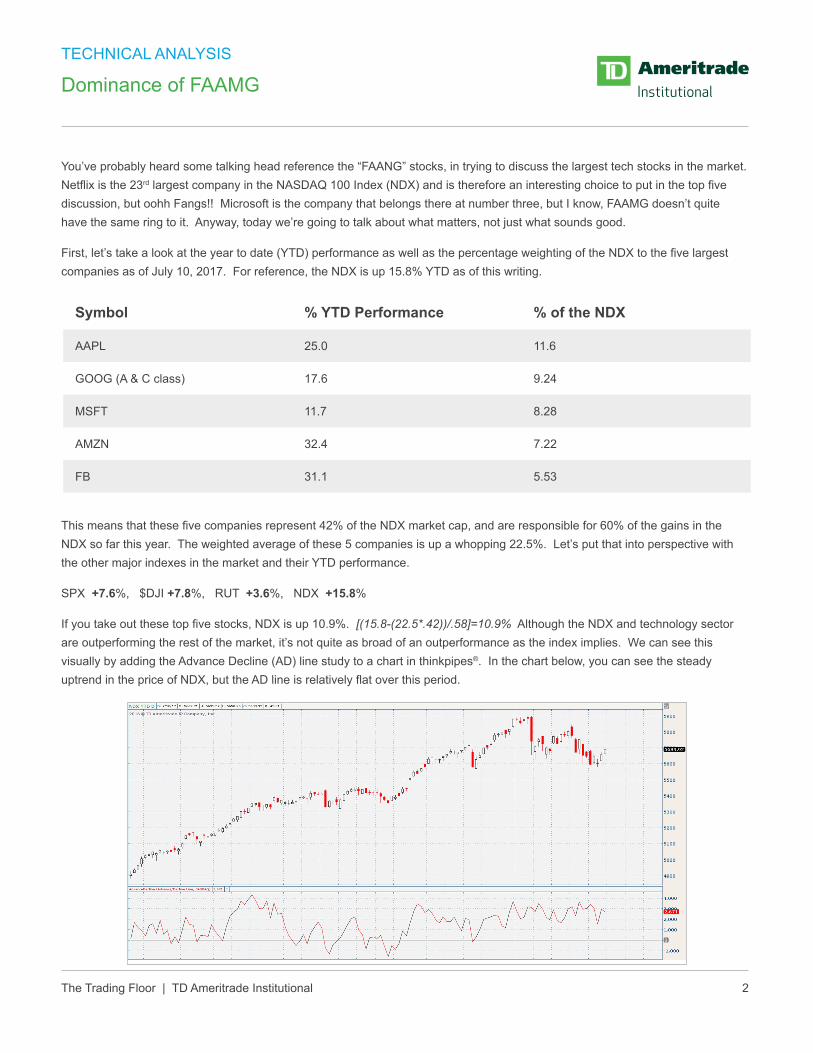
If you take out these top five stocks, NDX is up 10.9%. [(15.8-(22.5*.42))/.58]=10.9% Although the NDX and technology sector are outperforming the rest of the market, it’s not quite as broad of an outperformance as the index implies. We can see this visually by adding the Advance Decline (AD) line study to a chart in thinkpipes®. In the chart below, you can see the steady uptrend in the price of NDX, but the AD line is relatively flat over this period.
TECHNICAL ANALYSIS
Dominance of FAAMG
Symbol % YTD Performance % of the NDX
AAPL 25.0 11.6
GOOG (A & C class) 17.6 9.24
MSFT 11.7 8.28
AMZN 32.4 7.22
FB 31.1 5.53
The Trading Floor | TD Ameritrade Institutional 3
TECHNICAL ANALYSIS: Dominance of FAAMG
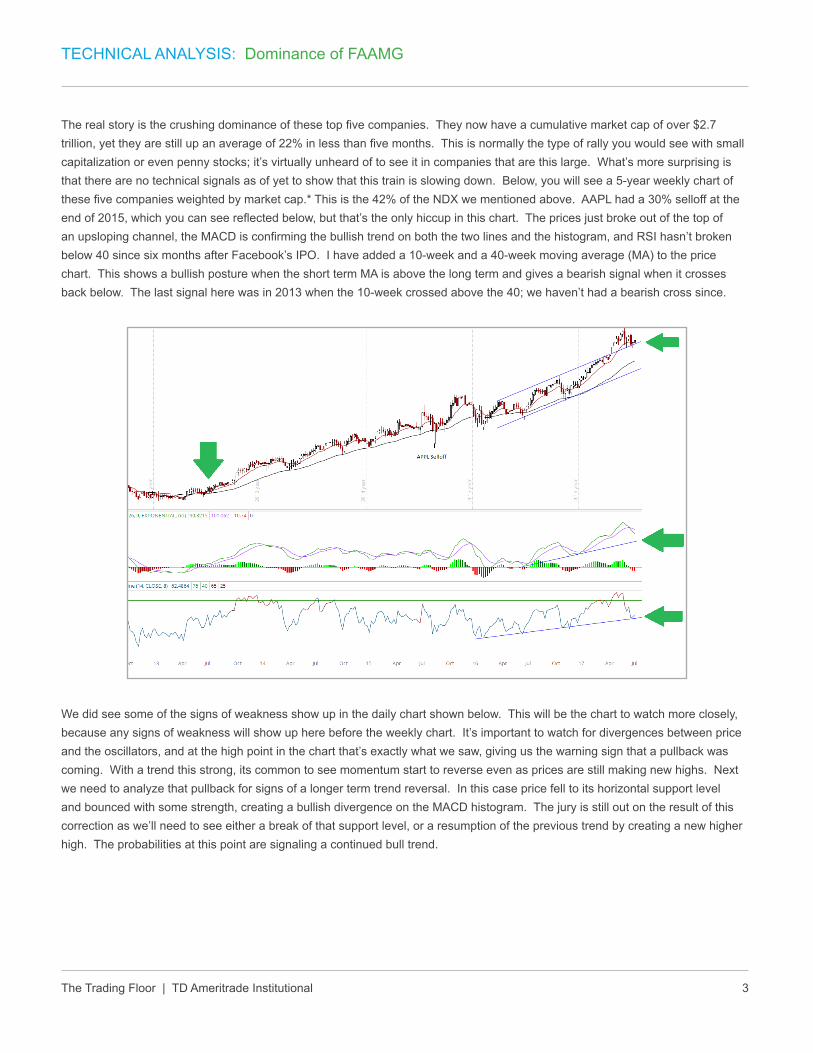
The real story is the crushing dominance of these top five companies. They now have a cumulative market cap of over $2.7 trillion, yet they are still up an average of 22% in less than five months. This is normally the type of rally you would see with small capitalization or even penny stocks; it’s virtually unheard of to see it in companies that are this large. What’s more surprising is that there are no technical signals as of yet to show that this train is slowing down. Below, you will see a 5-year weekly chart of these five companies weighted by market cap.* This is the 42% of the NDX we mentioned above. AAPL had a 30% selloff at the end of 2015, which you can see reflected below, but that’s the only hiccup in this chart. The prices just broke out of the top of an upsloping channel, the MACD is confirming the bullish trend on both the two lines and the histogram, and RSI hasn’t broken below 40 since six months after Facebook’s IPO. I have added a 10-week and a 40-week moving average (MA) to the price chart. This shows a bullish posture when the short term MA is above the long term and gives a bearish signal when it crosses back below. The last signal here was in 2013 when the 10-week crossed above the 40; we haven’t had a bearish cross since.
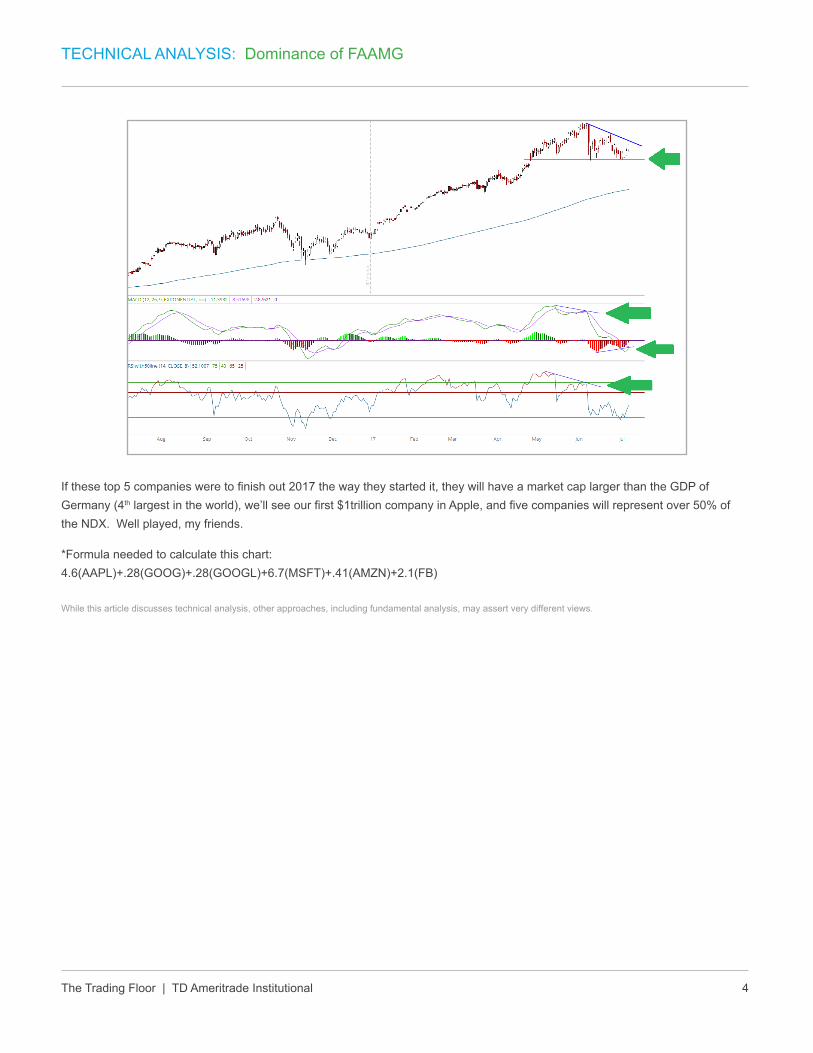
We did see some of the signs of weakness show up in the daily chart shown below. This will be the chart to watch more closely, because any signs of weakness will show up here before the weekly chart. It’s important to watch for divergences between price and the oscillators, and at the high point in the chart that’s exactly what we saw, giving us the warning sign that a pullback was coming. With a trend this strong, its common to see momentum start to reverse even as prices are still making new highs. Next we need to analyze that pullback for signs of a longer term trend reversal. In this case price fell to its horizontal support level and bounced with some strength, creating a bullish divergence on the MACD histogram. The jury is still out on the result of this correction as we’ll need to see either a break of that support level, or a resumption of the previous trend by creating a new higher high. The probabilities at this point are signaling a continued bull trend.
The Trading Floor | TD Ameritrade Institutional 4
TECHNICAL ANALYSIS: Dominance of FAAMG
If these top 5 companies were to finish out 2017 the way they started it, they will have a market cap larger than the GDP of Germany (4th largest in the world), we’ll see our first $1trillion company in Apple, and five companies will represent over 50% of the NDX. Well played, my friends.
*Formula needed to calculate this chart:4.6(AAPL)+.28(GOOG)+.28(GOOGL)+6.7(MSFT)+.41(AMZN)+2.1(FB)
While this article discusses technical analysis, other approaches, including fundamental analysis, may assert very different views.
The Trading Floor | TD Ameritrade Institutional 5
A VIEW FROM THE TRADE DESK
Finding Liquidity for ETFs
by Mike Gallagher, Senior Manager, Institutional Trading and Block Desk
Many agency trade desks call themselves Liquidity Providers (LPs). On the TD Ameritrade Block Desk, we don’t take credit for providing liquidity. Instead, we take pride in finding liquidity.
While credit should be given to those destinations committing capital and taking on additional risk in a market maker role, should your due diligence end there? The capital commitment involved in market making, although essential to a liquid and efficient market place, does not necessarily provide for best pricing. A willingness to risk capital on the other side of your trade does not mean the price they offer or bid is the best available. We certainly appreciate market makers, but when our TD Ameritrade Block Desk sources liquidity for our clients, we elect to dig deeper. We use all the tools at our disposal in order to find the best price. This is paramount in our process and is why we are referred to as Liquidity Finders (LFs).
How do we find Liquidity?
We follow a process that measures the liquidity, risk, and execution performance of LPs that are competing for your orders every day. For those of you who have traded through our Block Desk, you know this as our Competitive Risk Quote™ (CRQ) process. One of the metrics we measure is Competition Created Savings (CCS). This metric measures the amount of money saved through our CRQ process.
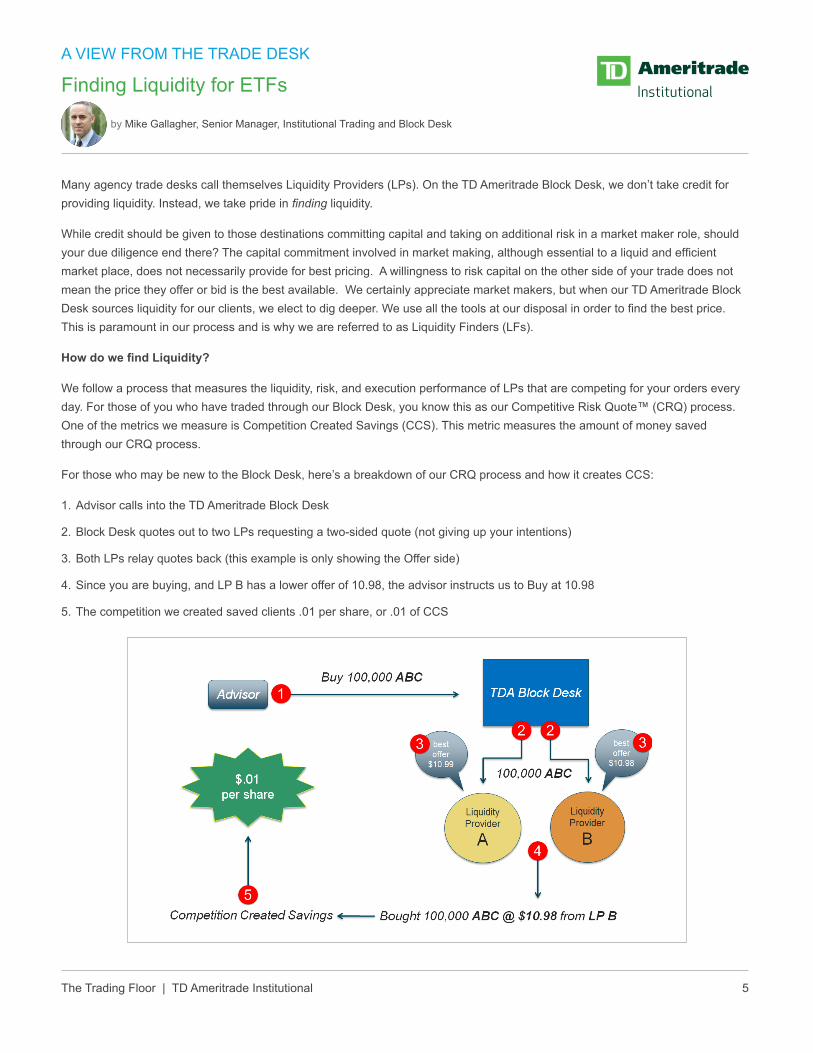
For those who may be new to the Block Desk, here’s a breakdown of our CRQ process and how it creates CCS:
1. Advisor calls into the TD Ameritrade Block Desk
2. Block Desk quotes out to two LPs requesting a two-sided quote (not giving up your intentions)
3. Both LPs relay quotes back (this example is only showing the Offer side)
4. Since you are buying, and LP B has a lower offer of 10.98, the advisor instructs us to Buy at 10.98
5. The competition we created saved clients .01 per share, or .01 of CCS
The Trading Floor | TD Ameritrade Institutional 6
A VIEW FROM THE TRADE DESK: Finding Liquidity for ETFs
Summary
How do we dig deeper? How do we shine a bright light on all our options? How do we find the best place to trade? The answer is in the data provided by our CRQ process. The competition above is an example of one CRQ trade and one of five metrics used to measure LP performance. Our metrics create a ranking system showing us where LPs are strongest in one of eight different asset classes. The data creates a quick and efficient pre-trade of where to find liquidity. Stay tuned for more articles on the Liquidity Finders or feel free to reach out to us by phone at 1-800-766-9922 or by email at [email protected].
Carefully consider the investment objectives, risks, charges and expenses before investing in an ETF (Exchange Traded Fund). A prospectus, obtained by calling 800-400-6288, option 1, contains this and other important information about an investment company. Read carefully before investing.
Trading options, like any other derivative product, can be complex. The purpose of this exercise is to simplify the process, creating a methodology for choosing and implementing a strategy.
To get started, consider this set of criteria to apply to a stock or ETF to determine if it might be a good candidate for an options strategy. The following example will explore each factor in more detail:
1. Liquidity – Perhaps the most important factor when trading options. Liquidity is the ability to get in and out of a position easily, at or near the current price. In the options market, liquidity is most easily judged by looking at the bid/ask spreads – tighter is better.
2. Directional Bias – Do you have an opinion on the stock’s future path? Is the stock currently trending up, down, or sideways? Where is the stock trading in its recent range? Where are the key support and resistance levels? These are some of the questions you’ll want to answer.
3. Implied Volatility – Options prices are affected by supply and demand, just like anything else. Options can be expensive or cheap, which can affect strategy selection. Where is current implied volatility (IV) relative to its recent range?
4. Time Frame – What time frame do you need to consider to meet the trade’s objectives?
5. Risk/Reward – Options strategies vary in terms of risk and capital requirements. What are you willing to risk on a given position? Is the potential reward worth the risk? Do you already own shares? Are you willing to buy or sell shares?
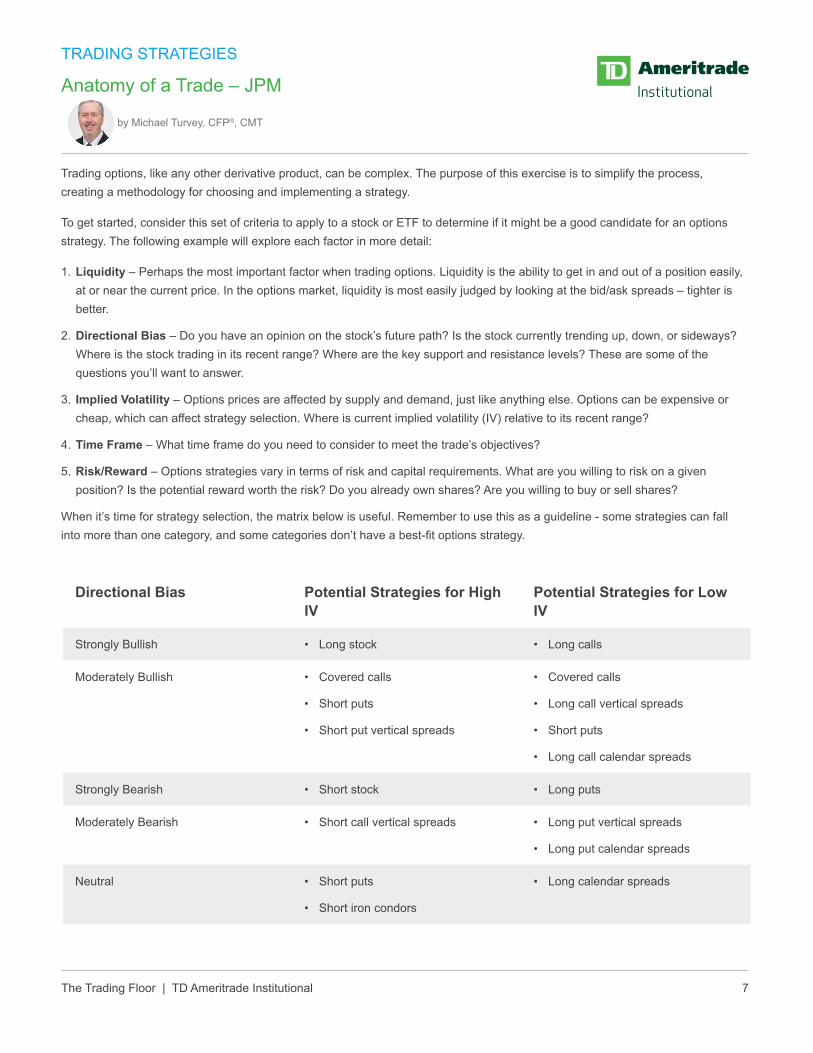
When it’s time for strategy selection, the matrix below is useful. Remember to use this as a guideline - some strategies can fall into more than one category, and some categories don’t have a best-fit options strategy.
Directional Bias Potential Strategies for High IV
Potential Strategies for Low IV
Strongly Bullish • Long stock • Long calls
Moderately Bullish • Covered calls
• Short puts
• Short put vertical spreads
• Covered calls
• Long call vertical spreads
• Short puts
• Long call calendar spreads
Strongly Bearish • Short stock • Long puts
Moderately Bearish • Short call vertical spreads • Long put vertical spreads
• Long put calendar spreads
Neutral • Short puts
• Short iron condors
• Long calendar spreads
The Trading Floor | TD Ameritrade Institutional 8
TRADING STRATEGIES: Anatomy of a Trade – JPM
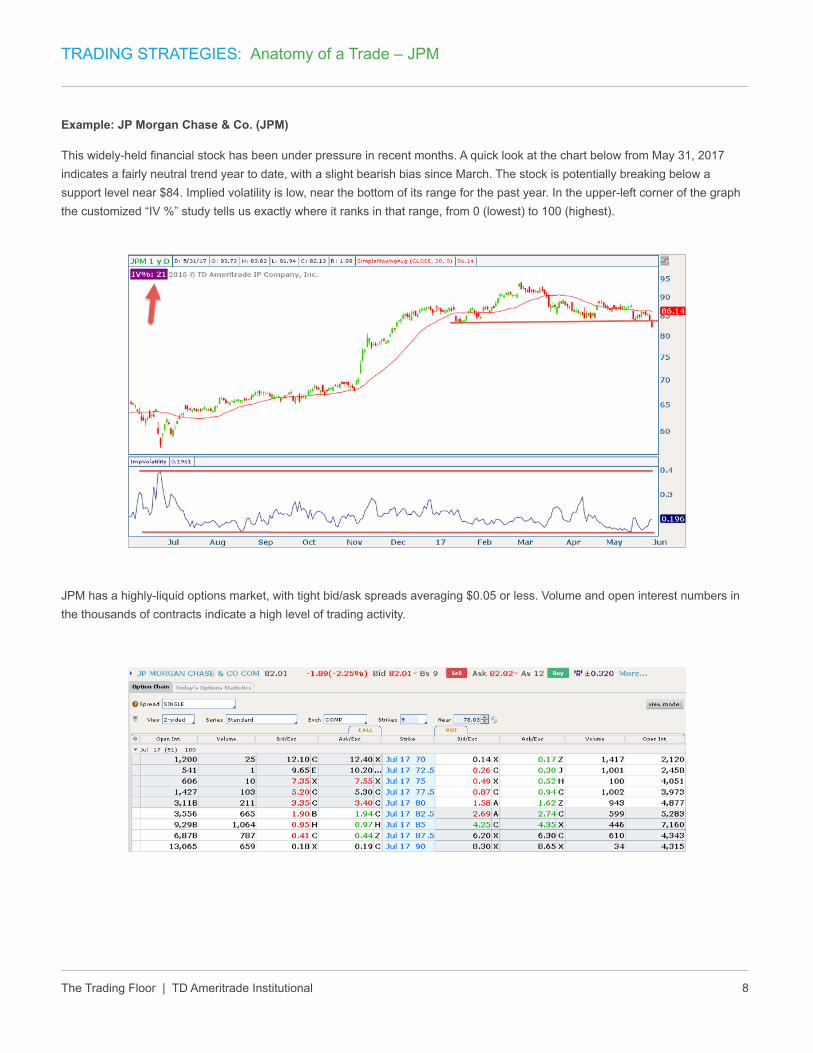
Example: JP Morgan Chase & Co. (JPM)
This widely-held financial stock has been under pressure in recent months. A quick look at the chart below from May 31, 2017 indicates a fairly neutral trend year to date, with a slight bearish bias since March. The stock is potentially breaking below a support level near $84. Implied volatility is low, near the bottom of its range for the past year. In the upper-left corner of the graph the customized “IV %” study tells us exactly where it ranks in that range, from 0 (lowest) to 100 (highest).
JPM has a highly-liquid options market, with tight bid/ask spreads averaging $0.05 or less. Volume and open interest numbers in the thousands of contracts indicate a high level of trading activity.
The Trading Floor | TD Ameritrade Institutional 9
TRADING STRATEGIES: Anatomy of a Trade – JPM
Application
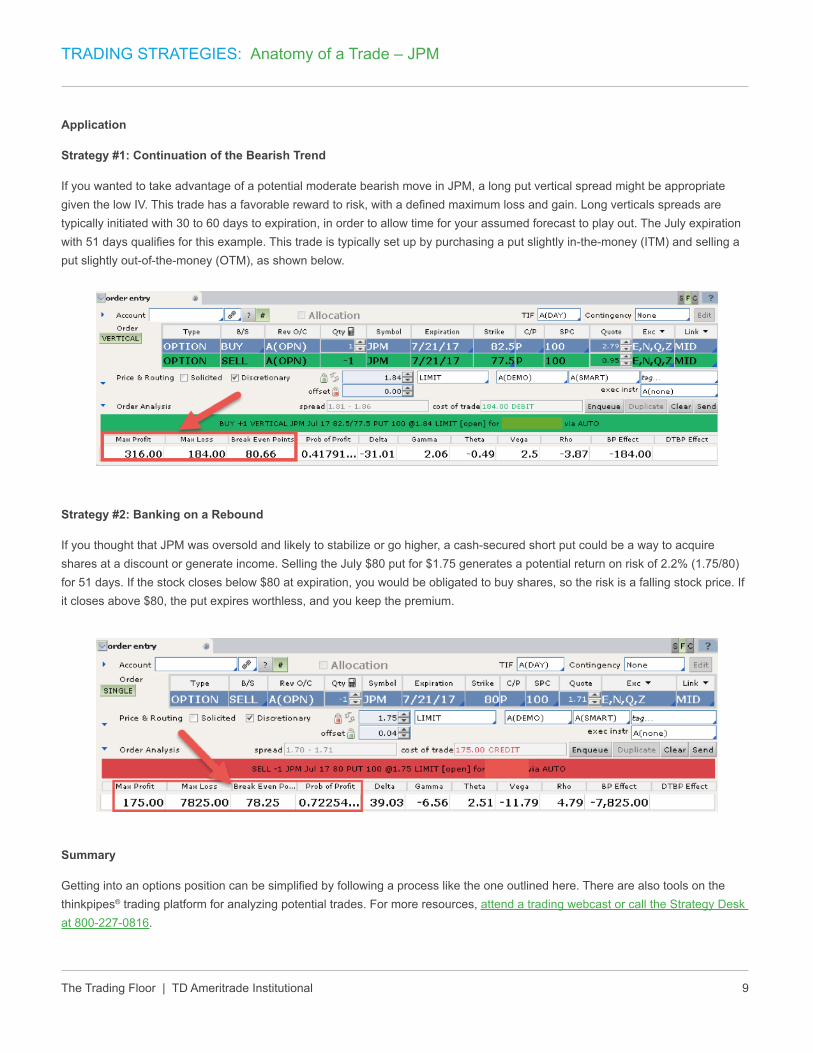
Strategy #1: Continuation of the Bearish Trend
If you wanted to take advantage of a potential moderate bearish move in JPM, a long put vertical spread might be appropriate given the low IV. This trade has a favorable reward to risk, with a defined maximum loss and gain. Long verticals spreads are typically initiated with 30 to 60 days to expiration, in order to allow time for your assumed forecast to play out. The July expiration with 51 days qualifies for this example. This trade is typically set up by purchasing a put slightly in-the-money (ITM) and selling a put slightly out-of-the-money (OTM), as shown below.
Strategy #2: Banking on a Rebound
If you thought that JPM was oversold and likely to stabilize or go higher, a cash-secured short put could be a way to acquire shares at a discount or generate income. Selling the July $80 put for $1.75 generates a potential return on risk of 2.2% (1.75/80) for 51 days. If the stock closes below $80 at expiration, you would be obligated to buy shares, so the risk is a falling stock price. If it closes above $80, the put expires worthless, and you keep the premium.
Summary
Getting into an options position can be simplified by following a process like the one outlined here. There are also tools on the thinkpipes® trading platform for analyzing potential trades. For more resources, attend a trading webcast or call the Strategy Desk at 800-227-0816.
The Trading Floor | TD Ameritrade Institutional 10
SPECIAL FEATURE
How Financial Advisors Use and Think About Exchange-listed Options
by Eric Cott, Director of Financial Advisor Education, The Options Industry Council
Everyday biases shape how we see the world. Many financial advisors have a subconscious response when they hear the words exchange-listed options. Although our biases may be helpful to make quick, efficient judgments, they can also blind us to new information.
A study conducted by Cerulli Associates, a research, analytics and consulting firm, which was released on May 10, sheds light on what financial advisors think about exchange-listed options and how they use them to help meet their clients’ financial goals. Cerulli Associates surveyed more than 600 financial advisors from five different advisory channels. The study was sponsored by The Options Industry Council (OIC) to identify target audiences and educational strategies that may lead to increased adoption of exchange-listed options strategies among financial advisors.
This article summarizes key findings from the 2017 Cerulli study: How Financial Advisors Use and Think About Exchange-listed Options.
1. Financial Advisors Use Options on ETFs
Stock indices and ETFs are a distant second and third to stocks, but a significant percentage of advisors report at least sometimes using these two instruments. Though only 19 percent of advisors frequently use ETFs as the underlying instrument, an additional 40 percent sometimes use them. Approximately one-quarter each of independent RIAs and national and regional B/D advisors frequently use options on ETFs.
2. Financial Advisors Expect to Increase Their Use of Exchange-listed Options
On average, advisors use options in 21 percent of their clients’ accounts, and they expect to increase use by 30% in three years. At present, independent RIAs use options across 28 percent of client accounts, the broadest use across channels. In addition, independent RIAs and hybrid RIAs expect the greatest increases in options usage rates across client accounts in the next three years, from 28 percent- and 22 percent to 39 percent and 33 percent, respectively. By contrast, wirehouse advisors incorporate options in only 15% of client accounts. While wirehouse advisors report the greatest occurrence of options use (46% currently use options), these advisors incorporate them in only a small percentage of client accounts (15 percent).
3. Financial Advisors Agree on the Potential Benefits of Options
The types of clients for which advisors use options may indicate their perception of options’ inherent risk. One-third of advisors report never using options with conservative clients, and one-third report always using options for highly-aggressive clients. This behavior may indicate preconceived ideas about the “riskiness” of adding options to client portfolios. Whether these ideas are driven by the client or the advisor, OIC may have success increasing advisors’ understanding of exchange-listed options by encouraging advisors to evaluate how incorporating options impacts the risk characteristics of the entire portfolio, rather than focusing on the isolated or perceived riskiness of options as an investment vehicle.
The Trading Floor | TD Ameritrade Institutional 11
SPECIAL FEATURE: How Financial Advisors Use and Think About Exchange-listed Options
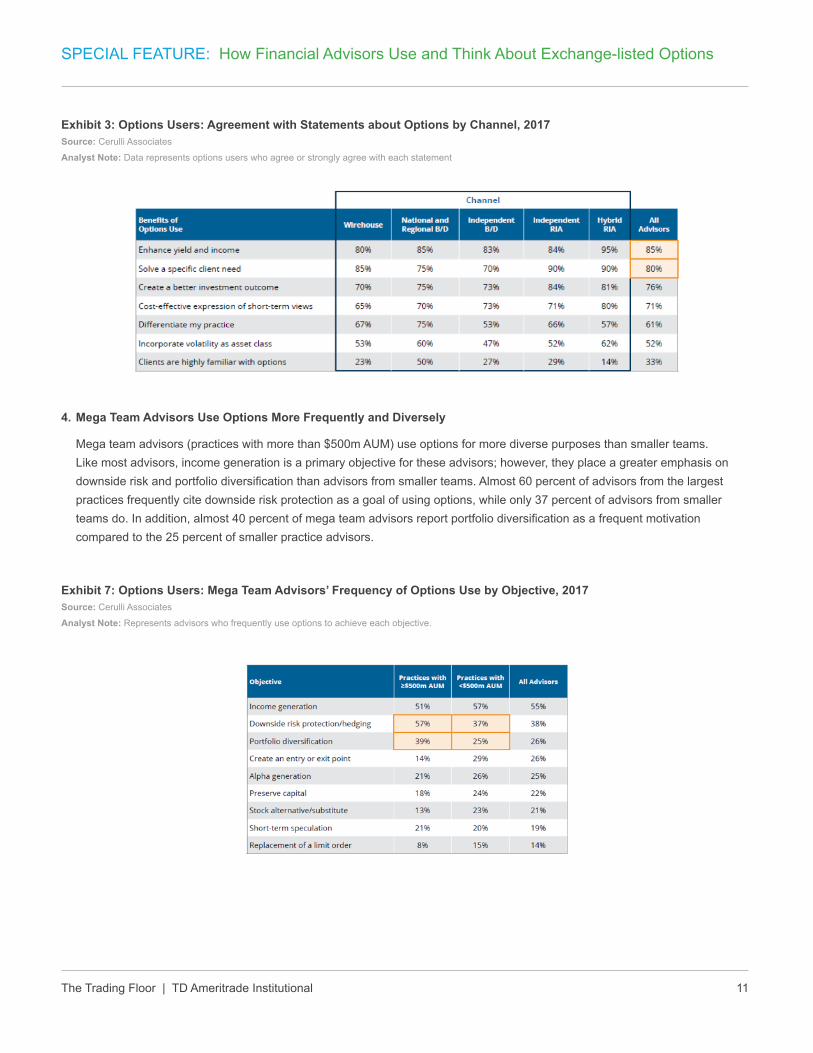
Exhibit 3: Options Users: Agreement with Statements about Options by Channel, 2017Source: Cerulli Associates
Analyst Note: Data represents options users who agree or strongly agree with each statement
4. Mega Team Advisors Use Options More Frequently and Diversely
Mega team advisors (practices with more than $500m AUM) use options for more diverse purposes than smaller teams. Like most advisors, income generation is a primary objective for these advisors; however, they place a greater emphasis on downside risk and portfolio diversification than advisors from smaller teams. Almost 60 percent of advisors from the largest practices frequently cite downside risk protection as a goal of using options, while only 37 percent of advisors from smaller teams do. In addition, almost 40 percent of mega team advisors report portfolio diversification as a frequent motivation compared to the 25 percent of smaller practice advisors.
Exhibit 7: Options Users: Mega Team Advisors’ Frequency of Options Use by Objective, 2017Source: Cerulli Associates
Analyst Note: Represents advisors who frequently use options to achieve each objective.
The Trading Floor | TD Ameritrade Institutional 12
SPECIAL FEATURE: How Financial Advisors Use and Think About Exchange-listed Options
PRINT VERSION: Financial Advisors may receive a free copy of the 15-page Cerulli Associates study by visiting www.optionseducation.org/advisor.
FOR ONLINE VERSON: Financial Advisors may receive a free copy of the 15-page Cerulli Associates by registering here.
The Options Industry Council (OIC), celebrating its 25th anniversary in 2017, is an educational organization funded by OCC, the world’s largest equity derivatives clearing organization, and the U.S. options exchanges. The mission of OIC is to increase awareness, understanding and responsible use of exchange-listed options among a global audience of investors, including individuals, financial advisors and institutional managers, by providing independent and unbiased education combined with practical expertise. Learn more about OIC at www.optionseducation.org/advisor.
The Trading Floor | TD Ameritrade Institutional 13
KEY INDICATORS
The Retail Sector – Broken or a Bargain?
by Michael Turvey, CFP®, CMT
Everyone loves a good sale, but sometimes it’s just really difficult to find value. This has been especially true for investors recently. Despite having a number of potential roadblocks thrown up, the economy and the U.S. stock market have remained resilient in 2017. The massive shift towards indexing has left some investors waiting for the 5%-plus broad market pullbacks that are common in most years in order to deploy funds. Typically we see these every 2 ½ to 3 ½ months, but we’ve now gone 8 months without one. We hear so much about the market being overvalued, but is there any value under the hood?
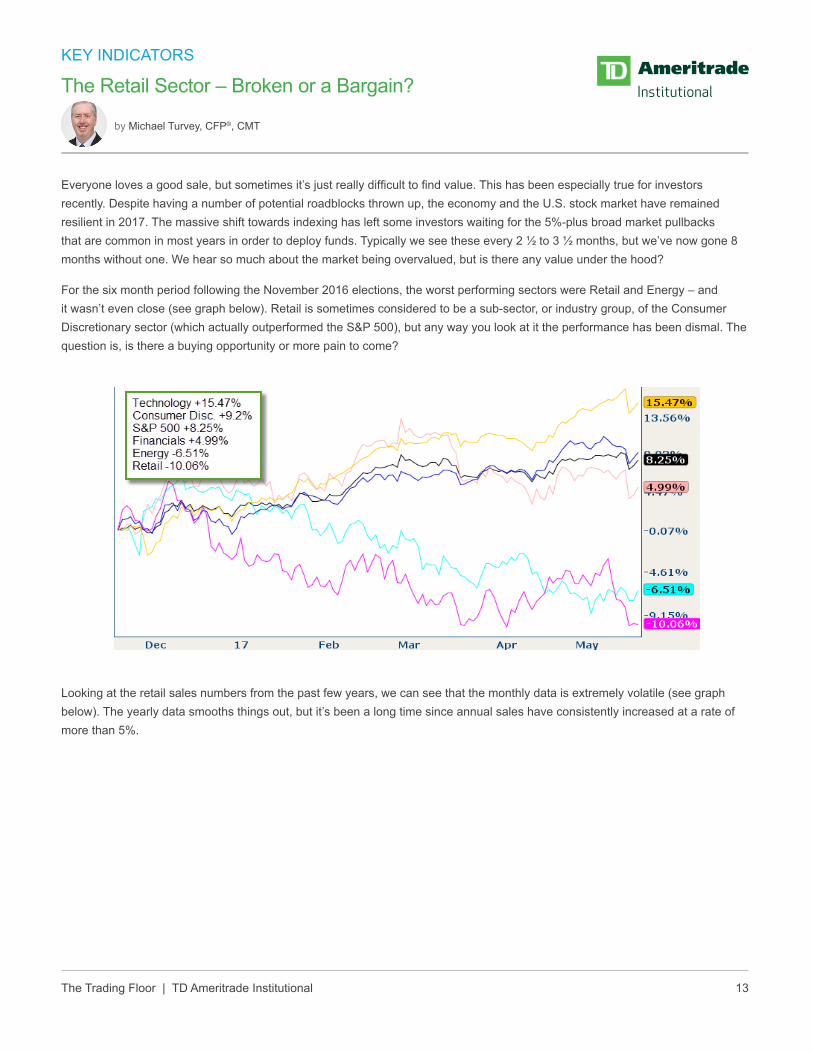
For the six month period following the November 2016 elections, the worst performing sectors were Retail and Energy – and it wasn’t even close (see graph below). Retail is sometimes considered to be a sub-sector, or industry group, of the Consumer Discretionary sector (which actually outperformed the S&P 500), but any way you look at it the performance has been dismal. The question is, is there a buying opportunity or more pain to come?
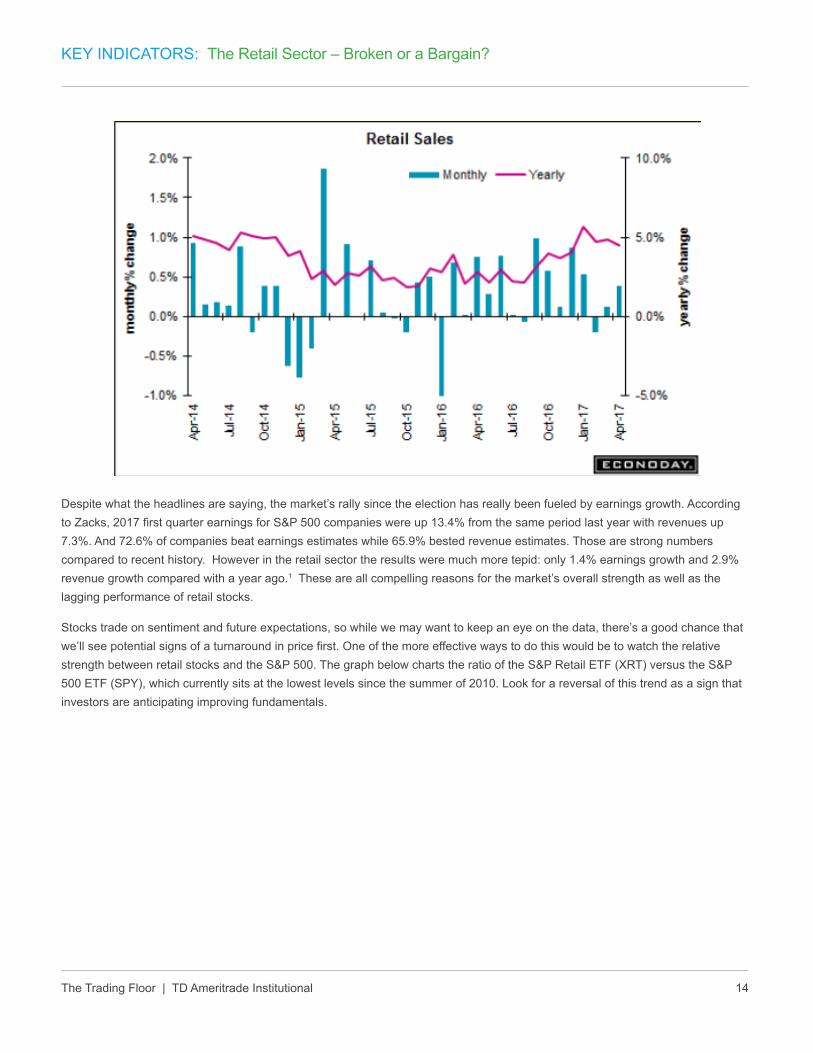
Looking at the retail sales numbers from the past few years, we can see that the monthly data is extremely volatile (see graph below). The yearly data smooths things out, but it’s been a long time since annual sales have consistently increased at a rate of more than 5%.
The Trading Floor | TD Ameritrade Institutional 14
KEY INDICATORS: The Retail Sector – Broken or a Bargain?
Despite what the headlines are saying, the market’s rally since the election has really been fueled by earnings growth. According to Zacks, 2017 first quarter earnings for S&P 500 companies were up 13.4% from the same period last year with revenues up 7.3%. And 72.6% of companies beat earnings estimates while 65.9% bested revenue estimates. Those are strong numbers compared to recent history. However in the retail sector the results were much more tepid: only 1.4% earnings growth and 2.9% revenue growth compared with a year ago.1 These are all compelling reasons for the market’s overall strength as well as the lagging performance of retail stocks.
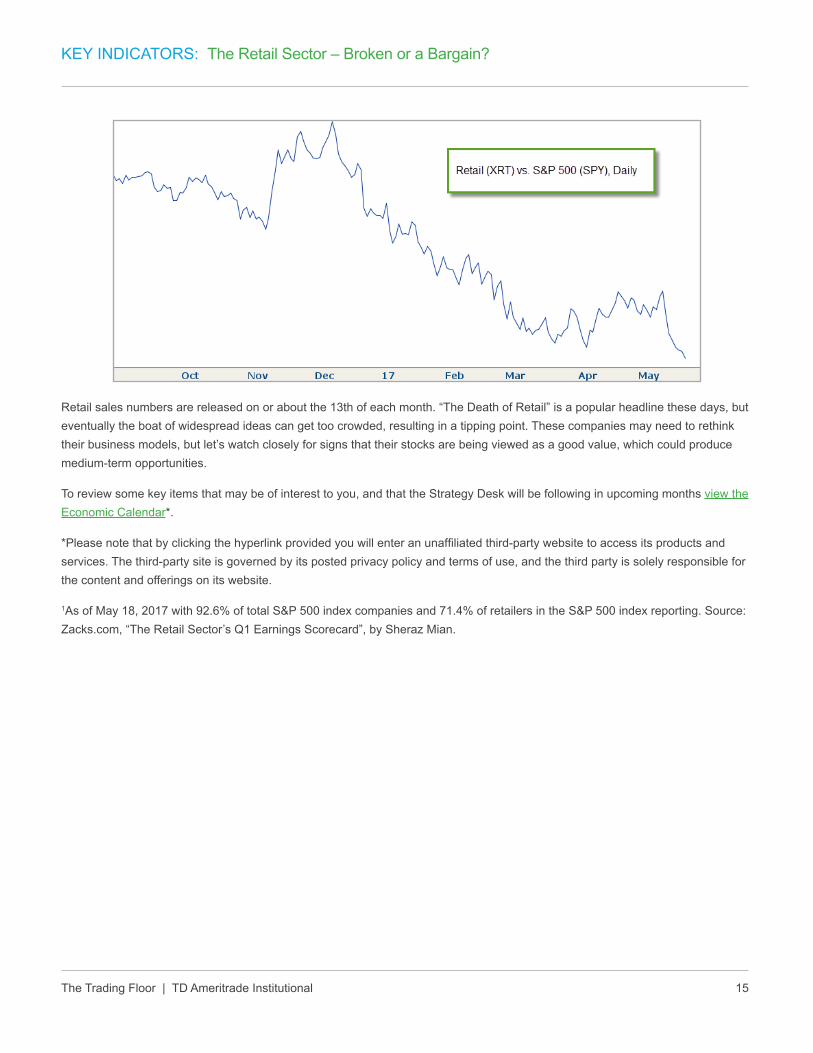
Stocks trade on sentiment and future expectations, so while we may want to keep an eye on the data, there’s a good chance that we’ll see potential signs of a turnaround in price first. One of the more effective ways to do this would be to watch the relative strength between retail stocks and the S&P 500. The graph below charts the ratio of the S&P Retail ETF (XRT) versus the S&P 500 ETF (SPY), which currently sits at the lowest levels since the summer of 2010. Look for a reversal of this trend as a sign that investors are anticipating improving fundamentals.
The Trading Floor | TD Ameritrade Institutional 15
KEY INDICATORS: The Retail Sector – Broken or a Bargain?
Retail sales numbers are released on or about the 13th of each month. “The Death of Retail” is a popular headline these days, but eventually the boat of widespread ideas can get too crowded, resulting in a tipping point. These companies may need to rethink their business models, but let’s watch closely for signs that their stocks are being viewed as a good value, which could produce medium-term opportunities.
To review some key items that may be of interest to you, and that the Strategy Desk will be following in upcoming months view the Economic Calendar*.
*Please note that by clicking the hyperlink provided you will enter an unaffiliated third-party website to access its products and services. The third-party site is governed by its posted privacy policy and terms of use, and the third party is solely responsible for the content and offerings on its website.
1As of May 18, 2017 with 92.6% of total S&P 500 index companies and 71.4% of retailers in the S&P 500 index reporting. Source: Zacks.com, “The Retail Sector’s Q1 Earnings Scorecard”, by Sheraz Mian.
The Trading Floor | TD Ameritrade Institutional 16
EDUCATION AND EVENTS
Upcoming Webcast Series and Live Events
August – October 2017
Trading Services Workshops
Join us for an in-depth discussion about options, equity, and ETF strategies. Complement your trading IQ with the practical application of the latest trading and rebalancing tools, and best practices on how to leverage the knowledge of the TD Ameritrade Institutional trading desks.
Register Now
July 25
Stock Replacement at Reduced Risk
Join us for a discussion on an options strategy with similar characteristics to a covered call but without the high capital requirements. This informative webcast can help you:
• Utilize long-term call options as a stock replacement strategy
• Reduce the effective cost of these positons by selling near-term call options
• Understand how to manage and roll these positions through multiple expiration cycles
Note: CE credits are not available when accessing the webcast through the replay link. You must attend the live webcast to be eligible for the CE credits.
Register Now
A covered call strategy can limit the upside potential of the underlying stock position, as the stock would likely be called away in the event of substantial stock price
increase. Additionally, any downside protection provided to the related stock position is limited to the premium received. (Short options can be assigned at any time up
to expiration regardless of the in-the-money amount.)
August 1
Technical Analysis: Spotting Trend Reversals
Join us for a discussion about identifying potential weakness in an established trend (bullish or bearish) and the subsequent signals to help determine when that trend may be reversing direction. This informative webcast can help you:
• Explain how divergences may signal weakness in a current trend
• Utilize moving averages and oscillators for potential trend reversal signals
• Recognize confirmations in price patterns to increase confidence in trend reversals
Note: CE credits are not available when accessing the webcast through the replay link. You must attend the live webcast to be eligible for the CE credits.
Register Now
While this webcast discusses technical analysis, other approaches, including fundamental analysis, may assert very different views.
August 8
Pairs Trading: A Market Neutral Strategy
Pairs trading involves opposing positions in two assets that are usually highly correlated, but have diverged in price. Strategy selection and probability analysis may help with risk management when using this approach. This informative webcast can help you:
• Explain how pairs trading may reduce a portfolio’s systematic risk
• Identify suitable candidates and indicators for pairs trading
• Apply higher probability, defined risk options strategies to pairs trading
Note: CE credits are not available when accessing the webcast through the replay link. You must attend the live webcast to be eligible for the CE credits.
Register Now
August 15
How Financial Advisors Use and Think About Exchange-listed Options
The Options Industry Council (OIC) recently sponsored a new research study, conducted by Cerulli Associates (CA), to understand the behavior of advisors who use exchange-listed options strategies with clients and those who do not. Join Eric Cott, Director of Education at OIC, and Emily Sweet, Senior Analyst at CA, as they discuss the implications of this study. This informative webcast can help you:
• Identify why use of exchange-listed options is expected to increase over the coming years
• Understand how advisors are using options to enhance yield and income, solve a specific client need, and create a better investment outcome
• Learn about techniques and resources for implementing options strategies and communicating benefits and risks to clients
Note: CE credits are not available when accessing the webcast through the replay link. You must attend the live webcast to be eligible for the CE credits.
Register Now
TD Ameritrade, Inc. and all third parties mentioned above are separate unaffiliated companies and are not responsible for each other’s services or policies.
August 22
thinkpipes® Live Demonstration
Join us for a live demonstration of the thinkpipes trading platform. This informative webcast can help you:
• Evaluate the platform’s trading, research, and analysis capabilities
• Customize the platform to best meet your specific needs
• Highlight recent platform enhancements and new features
Register Now
August 29
Technical Analysis: Market Cycles
Join us for a discussion about how cycles influence market biases based on the time of year and position within different cycles. This informative webcast can help you:
• Understand seasonal patterns in price performance
• Identify how the ‘presidential’ or four-year cycle appears in stock prices
• Discuss long-term cycles such as the 34-year historical cycle and Kondratieff Waves
• Apply cycle analysis to current market conditions
Note: CE credits are not available when accessing the webcast through the replay link. You must attend the live webcast to be eligible for the CE credits.
Register Now
While this webcast discusses technical analysis, other approaches, including fundamental analysis, may assert very different views.
EDUCATION AND EVENTS: Upcoming Webcast Series and Live Events
The Trading Floor | TD Ameritrade Institutional 19
Clint Cowles, CMT
With his technical analysis expertise, Clint Cowles focuses on helping advisors successfully incorporate sophisticated trading strategies and advanced allocation models into their practices. Whether facilitating webcasts, hosting workshops, or providing individual support, Clint provides the insight and expertise advisors need to improve their trading efficiency using thinkpipes—TD Ameritrade’s advanced trading platform that provides streaming market data, real-time analytics and robust charting features. Clint joined TD Ameritrade in 2011 and holds a Bachelor’s degree in Mathematics, the Chartered Market Technician (CMT) designation, and FINRA Series 3, 7, 63, 34 and 24 licenses.
Michael Turvey, CFP®, CMT
Leveraging his experiences as a former options broker and market maker, Michael Turvey focuses on helping emerging and established advisors to more efficiently manage their time—and their books. Through one-on-one support, weekly webcasts, and regional workshops, he gives advisors the insight and confidence they need to select, implement, and manage options strategies across multiple accounts. Michael joined TD Ameritrade in 2003. Additionally, he is a contributor to TD Ameritrade Institutional’s quarterly trading e-newsletter, and has written articles published on Forbes.com and in TD Ameritrade’s thinkmoney and Ticker Tape magazines. He has a Bachelor’s degree, is a Certified Financial Planner™ (CFP®) certificant and Chartered Market Technician (CMT) and holds FINRA Series 7 and 63 licenses.
MEET THE CONTRIBUTING WRITERS
Bios
Eric Cott, Director of Financial Advisor Education, The Options Industry Council
As a representative for The Options Industry Council (OIC) and serving as Director, Financial Advisor and Institutional education, Eric Cott endeavors to help advisors and their firms to use options more effectively. Mr. Cott is responsible for expanding OIC’s outreach to financial advisors. Additionally, he participates in conference panel discussions, presents advisor-oriented educational seminars, and guides the development of options curriculum and content for advisors on the OIC website.
Over the last 22 years, Mr. Cott has supported, served as and directed financial advisors through different roles. Prior to OIC, he was a Regional Vice President and Retirement Income Consultant at Sunlife Financial Distributors Inc. where he identified and cultivated new business, increasing assets and revenue share. Prior to that, Mr. Cott spent the majority of his investment career as a Producing Manager and Assistant Vice President at Merrill Lynch Pierce, Fenner & Smith, Inc. There he built and maintained a successful wealth management practice.
Eric holds a BA from University of Wisconsin Madison and the CRPC designation from the College of Financial Planning.
The Trading Floor | TD Ameritrade Institutional 20
MEET THE CONTRIBUTING WRITERS: Bios
Mike Gallagher, Senior Manager, Institutional Trading and Block Desk
Mike started his career in financial services in 2000 with TD Waterhouse in New York City. Since that time, he has built a reputation of providing outstanding client service while trading and managing trade desks in various segments of the industry such as Retail, Brokerage Operations, and Institutional. In 2010, Mike’s passion for trading led him to the develop TD Ameritrade’s first Block Trade Desk which then spun off to create a specialized service for Registered Investment Advisors (RIAs). Mike and his team specialize in finding institutional liquidity for RIAs who want guidance and support with large block or illiquid ETF and equity trades. He holds the 7, 63, 55 and 24 industry licenses.
The Trading Floor | TD Ameritrade Institutional 21
Options are not suitable for all investors as the special risks inherent to options trading may expose investors to potentially rapid and substantial losses. Options trading subject to TD Ameritrade review and approval. Please read Characteristics and Risks of Standardized Options before investing in options. Spreads, straddles, and other multiple-leg option strategies can entail substantial transaction costs, including multiple commissions, which may impact any potential return. These are advanced option strategies and often involve greater risk, and more complex risk, than basic options trades. Investors should also consider contacting a tax advisor regarding the tax treatment applicable to multiple-leg transactions.
The short put strategy risks purchasing the corresponding stock at the strike price when the market price of the stock will likely be lower. Naked option strategies involve the highest amount of risk and are only appropriate for traders with the highest risk tolerance.
The preceding information is not a recommendation or endorsement of any particular investment or investment strategy. Returns will vary and all investments involve risk, including loss of principal.
Transaction costs (commissions, contract, exercise/assignment fees and other fees) are important factors and should be considered when evaluating any options trade.
Examples presented are provided for illustrative and educational use only and are not a recommendation or solicitation to purchase or sell any specific security or to use a specific strategy.
Supporting documentation for any claims, comparison, statistics, or other technical data in options communication will be supplied upon request.