39
www.ptvag.com Computer based Transport Planning Thomas Haupt, PTV AG

www.ptvag.com
Computer based Transport Planning
Thomas Haupt, PTV AG

© PTV AG 2012 Computer Aided Transport Planning 2 2
The challenge
Urbanisation
> Growing motorization
> Growing (working) population
> Growing demand for transport
Need
> Provide mobility, not standstill
> Accessibility to activities &
business
> Minimise negative impacts of
transport on
> Social exclusion
> Exhaustion of natural resources
> Man-made environment
© GTZ / Gerhard Menckhoff.

© PTV AG 2012 Computer Aided Transport Planning
Steps of a Transport Master Plan process
Step 1: Current Situation > Collect data
> Where do people live? Where do they work? Where do they shop, spend their free time …? > How does today’s transport infrastructure look like? Road network, public transport network etc. > Today’s mobility patterns: What trips do they do? How many trips? For which purpose etc.?
> Represent this in a transport model (base year model) > Use state of the art software > Calibrate and validate the model
Step 2: Visions and goals for future development > Visions for development of population, economy, infrastructure, quality of life
> External influences, global trends
> Definition of scenarios
Step 3: Forecast > Development of mobility patterns, future transport demand, future transport volumes
> Requirements for future infrastructure in each development scenario
Step 4: Impact Analysis, Recommendations > Environmental impacts, requirements for future networks
> What scenarios are acceptable and are selected?
> What development of infrastructure, mobility systems and transport management are needed?
3

© PTV AG 2012 Computer Aided Transport Planning
Systematic approach: development of a new transport
system in alliance with massive new urban developments
4
The Environment
Transport
System
Land Use
Population & Activity
Needs
Economic
Development
© PTV AG 2012 Computer Aided Transport Planning 5
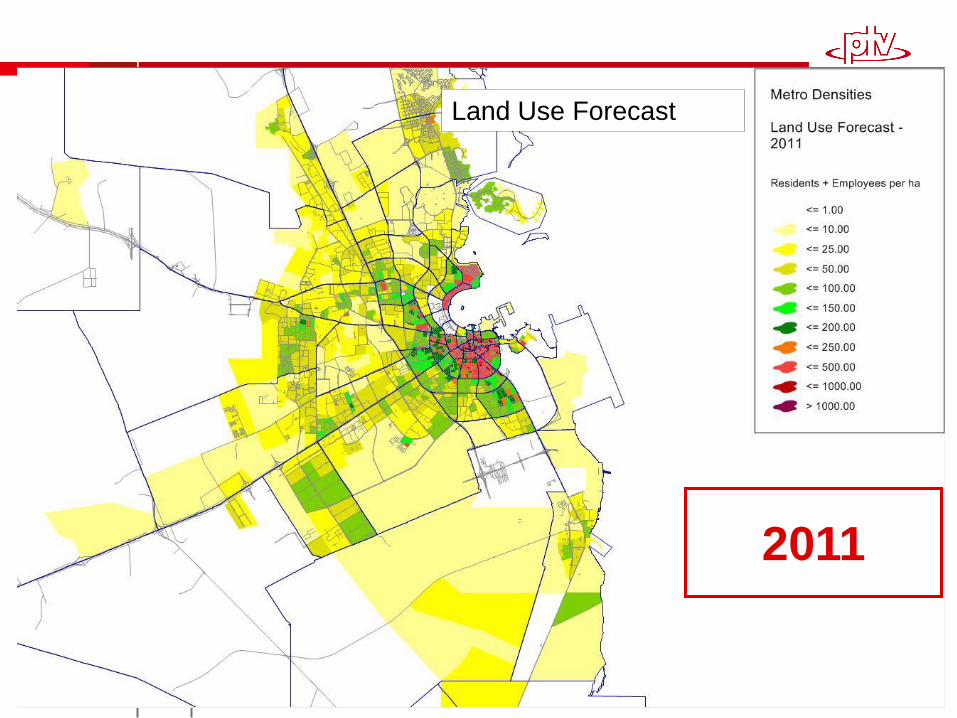
2011
Land Use Forecast

© PTV AG 2012 Computer Aided Transport Planning 6
2016

© PTV AG 2012 Computer Aided Transport Planning 7
2021

© PTV AG 2012 Computer Aided Transport Planning 8
2026

© PTV AG 2012 Computer Aided Transport Planning
Transport Supply: Functions of Roads
Connecting function:
> Linkage of central places and transport of persons and goods between
places
Feeder function:
> Connector between specific locations for activities (living, working,
shopping, etc.) and the primary road network.
Discretionary function:
> Children playing, window shopping, sitting in street cafes, sightseeing.
Core issue of transportation network planning is to ensure that
connecting, feeder and discretionary functions of roads do not
overlap!

© PTV AG 2012 Computer Aided Transport Planning
Transport Supply: Road Classification
> Highway/Freeway (long distance travel,
high speed and volume, Function:
connection)
> Major Arterial (through traffic, no plot
access, major bus routes, Function:
connection)
> Minor Arterial (through and local traffic
with limited plot access, major bus
routes, Function: connection)
> Collector / Distributor (access to
buildings/plots, carries main bus routes,
Function: connection, feeder)
> Access Road (access to buildings/plots,
no motorized through traffic, low speed
traffic,Function: discretionary)

© PTV AG 2012 Computer Aided Transport Planning 11
2026 Do Minimum Master Plan Proposal
Free Flow Dense/ UnstableFlow Congestion

© PTV AG 2012 Computer Aided Transport Planning
Project examples: Bus Masterplan Dubai
12
Transport demand:
desire lines

© PTV AG 2012 Computer Aided Transport Planning
Computer aided network development
13
Simulate demand & supply Avoid parallel services of busses (green) and
metro (red)
number of passengers
(assignment weekday 2009)

© PTV AG 2012 Computer Aided Transport Planning
Computer simulated network loading
The
resulting
network:
> Metro
> Main bus
lines
> Feeder
bus lines
14

© PTV AG 2012 Computer Aided Transport Planning
Modelled supply: The digital road network
15

© PTV AG 2012 Computer Aided Transport Planning
Zone 1
Zone 2
Zone 3 1 2 3
1
2 80
3
Demand matrix
20
20
100
Transport Demand
> Travel demand occurs when two activities (trip purpose) are specially
separated. Trip Purpose
> Home -> Work
> Work -> Shopping
> Work -> Home
> Shopping -> Home
(Home)
(Work)
(Shopping)
Urban Block
S
S
S

© PTV AG 2012 Computer Aided Transport Planning
Projekt Example: Rio Laguna: Demand 3.30pm-4.30pm
17

© PTV AG 2012 Computer Aided Transport Planning 18
Modelled intersections: Layout and signal plans
© PTV AG 2012 Computer Aided Transport Planning 19
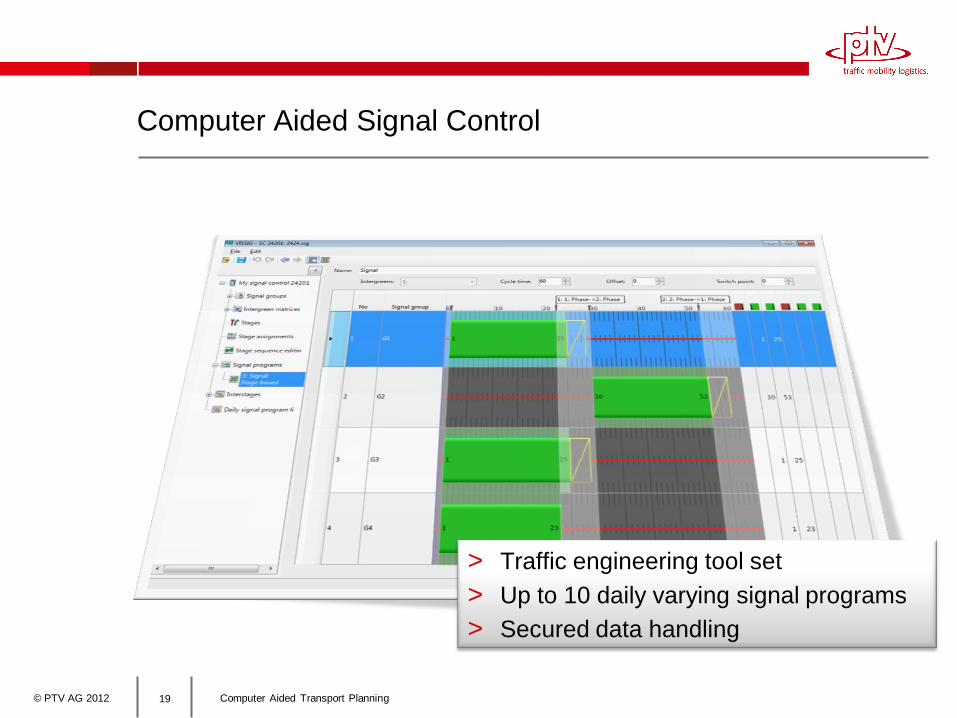
Computer Aided Signal Control
> Traffic engineering tool set
> Up to 10 daily varying signal programs
> Secured data handling

© PTV AG 2012 Computer Aided Transport Planning
Demand + Flow + Level of service at intersections
20

© PTV AG 2012 Computer Aided Transport Planning
Consistent & complete flow data from a Travel Demand Model
21

© PTV AG 2012 Computer Aided Transport Planning
Signal Optimization (1)
Green time split
(based on volume/capacity)

© PTV AG 2012 Computer Aided Transport Planning 23
Signal Optimization (2)
Cycle time (minimize mean delay time)
Cycle time [s]
Mean delay
time [s]
60s 120s 90s
Considering predefined cycle
times for signal coordination

© PTV AG 2012 Computer Aided Transport Planning 24
Signal Optimization (3)
Optimal Offset Network (assignment required)

© PTV AG 2012 Computer Aided Transport Planning
Integrated optimization
Split time
optimi-
zation
Single junction
Offset
optimi-
zation
Network
Cycle time
optimi-
zation
User
Equilibrium
Assignment
with new
signal pro-
grams & flows
Optimized
Signal
program
Signal Optimization + Network Loading (Assignment)
25
Iteration +1
Stable
Results ?
N
Y
Current
signal
program &
flows
Assignment
with
Junction
model
© PTV AG 2012 Computer Aided Transport Planning 26
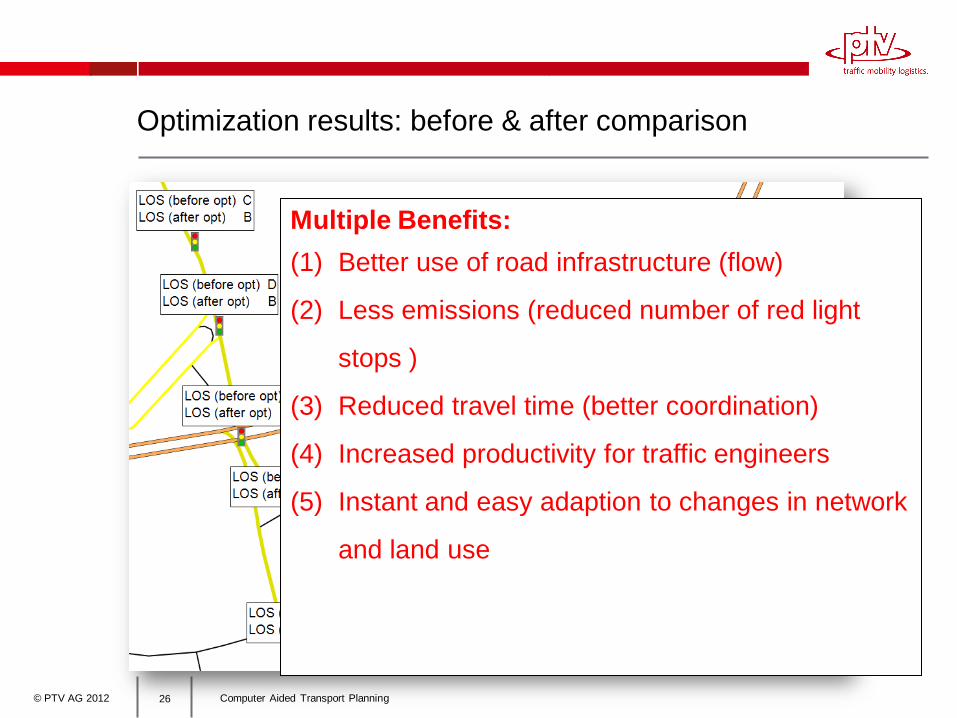
Optimization results: before & after comparison
Multiple Benefits:
(1) Better use of road infrastructure (flow)
(2) Less emissions (reduced number of red light
stops )
(3) Reduced travel time (better coordination)
(4) Increased productivity for traffic engineers
(5) Instant and easy adaption to changes in network
and land use

© PTV AG 2012 Computer Aided Transport Planning
Model Example Stuttgart: Bike included
27

© PTV AG 2012 Computer Aided Transport Planning
Land Use – Demand Relationship (General Concept)
Traffic –
Land Use
Interaction
(Traffic Spiral)
Car traffic
Land use for
roads
Emissions, noise,
accidents
Traffic increase
Reduced attraction of
pedestrian and bicycle
traffic and reduced
access to public
transport
Shift from pedestrian
to car traffic
More car traffic
Increased distances
- Within residential area
- To workplaces
- To leisure areas
= Need for more transportation

© PTV AG 2012 Computer Aided Transport Planning
Transport Model
• Who travels at what time to which destination?
• Using which mode of transport?
• Along which route?
Land Use Plan
• Residents
• Working places
• Shopping centres
• Schools, etc.
Development Characteristics
• Regional accessibility
• Land use density
• Land use mix and distribution
Transport Supply
• Road function and classification
• Public transport network
• Modes of travel
Transport Demand
• Trip generation = f (land use density)
• Trip distribution = f (land use mix)
• Mode split (PrivateT., Public Transp)
Land Use - Transport Modelling Framework
Impact on Congestion and Accessibility
• Traffic flows, Volume-to-capacity,
• Travel times, Wait times
• Level of service, ...
Input
Output
Land Use
Assessment
Transport
Model

© PTV AG 2012 Computer Aided Transport Planning
Transport Supply: Public Transport Network
> Link network
> PuT stops
> Transfer Points
> PuT line routes
> Timetable/Headway

© PTV AG 2012 Computer Aided Transport Planning
Key Site Plan Concept for Public Transport
400m
(5mins walk)
High density employment with some mixed use
Mixed use with some residential
Residential with some offices and shops
Bus stop
Public transport hub
High frequency bus corridor
Rail

© PTV AG 2012 Computer Aided Transport Planning
Land Use
Data
Traffic Assignment
Model Output
(measures of effectiveness)
Network or
Operational Deficiencies?
Roadway Network Plan
No
Yes Yes
Trip
Generation
Mode
Choice
Road
Network
Trip
Distribution
Transit
Network
Transport Model Development

© PTV AG 2012 Computer Aided Transport Planning
Transport Model Bogota

© PTV AG 2012 Computer Aided Transport Planning
Transport Model Sao Paulo

© PTV AG 2012 Computer Aided Transport Planning 35
Mitigation
Plan
Analyze
Traffic
Conditions
Planning and Traffic Micro-simulation
> The main purpose of development traffic analysis is to recommend
mitigation plan that would ensure safe and efficient operations of all
transportation facilities after the proposed development is fully operational.

© PTV AG 2012 Computer Aided Transport Planning
Traffic Simulation
36

© PTV AG 2012 Computer Aided Transport Planning
Continuous planning task
After master plan is before master plan
> Dynamics in development imply derivations from assumptions
(accelerations or delays)
> Framework conditions are continuously changing
> Decisions might have be taken in a different way (derivation from plan)
Monitoring and Regular update of planning base
> Regular update of base data (land use and networks)
> Update of the transport models and transport forecasts
> Check of implementation of measures and investment plans
> Update of plans and priorities
> Re-assessment of impacts
37

© PTV AG 2012 Computer Aided Transport Planning
The four key statements
1. Computer based transport models enable planners to
perform multi modal planning for individual and public
transport
2. Building and maintaining a transport model is an effort
which pays off when used widely, continuousely and for
several purposes
3. Solution testing and optimization: First in the computer
then in reality
4. Achieved detail levels of traffic models can be used for
operational schemes: Time tables, tariffs, signal plans
38

© PTV AG 2012 Computer Aided Transport Planning 39
www.ptvag.com
PTV. Planning Transportation Visions.


