Page 1
International Journal of Contemporary Applied Sciences Vol. 1 No. 1 September 2014
(ISSN: 2308-1365) www.ijcas.net
17
The Trends of Teachers’ International Migration from a Developing Country
Vivien Catherine L. Coa,b and Emily B. Tana
University of Santo Tomas, Graduate School, España, Manila, Philippinesa 1008 ICCT Colleges, V.V. Soliven Ave.II, Cainta, Rizal, Philippinesb 1900
Emily B. Tan in-charge of all correspondences regarding this paper Email Address : [email protected] Tel # : (632) 984-2435 Occupation : Professor of the UST Graduate School Vivien Catherine L. Co Email Address : [email protected] Tel # : (632) 211-3151 Occupation : UST Graduate School Candidate for Ph.D. in Development Studies President of ICCT Colleges
Abstract.
International migration of teachers has intensified as a global phenomenon.
This study explored and projected the trend of teachers‟ international migration
from a developing country by examining the overall size of migration flows by
year, region of origin, foreign country of destination, gender, civil status, age,
educational level of teaching in the receiving country, and educational level
taught. It utilized quantitative method to analyze data and generate explanation
on the “what is” aspect of the subject. Data covers 1992 to 2011 where the
overall size of teacher migrants was 12,113. The study projected as a trend that
at least in the next 5 years, the United States of America will be the leading
receiving country; female migrants will continue to be dominant in number
over male migrants; and civil status is insignificant but younger ones (22-41
years old) tend to migrate and teach the secondary, tertiary, and special
education students.
Keywords: Trends, International Migration Trends, Trends of Teachers‟
Migration
Page 2
International Journal of Contemporary Applied Sciences Vol. 1 No. 1 September 2014
(ISSN: 2308-1365) www.ijcas.net
18
1. INTRODUCTION
Since the growth of national economies and movement towards liberalization and
globalization, international migration has become a development phenomenon. International
migration is defined as the movement of persons across national borders with the intention to
settle in another country for a period of at least a year (Koser, 2008; Muus, 2001). It involves
a sending country and a group of countries called a core receiving region that are linked to one
another by unusually large flows of immigrants (Fawcett, 1989; Zlotnik, 1992). Generally, the
sending country is the migrants‟ country of birth; the receiving country is the migrants‟
country of foreign sojourn (Asis, 2006) and the trend of this movement may be from a poor,
less developed, or low-income country to a richer, more developed, or high-income one
(Liebert, 2010; Miller, Ochs, and Mulvaney, 2008; and Hatton and Williamson, 2005).
Some group of countries that were strategically related formed themselves into
organizations and became core receiving regions. These include the Organization of Economic
Co-operation Development (OECD) composed of the United States, Canada, Australia, United
Kingdom, Germany, and France; the European Union (EU) or Europe; the Russian Federation;
Asia; North America; Latin America; Africa; Germany, Ukraine; and the India group (The
European Commission, 2007 as cited by Nimwegen and Van der Erf, 2010).
In Southeast Asia, an integral part of its post-colonial new geographies of migration
is labor migration which developed in the 1960s and expanded in the 1970s and 1980s (Kaur,
2010). It has adopted a migration system framework composed of two groups of states
formed on the basis of their migratory characteristics. One group was identified as mainly
emigration and to this group belong the Philippines, Cambodia, Burma, Lao PDR, Viet Nam,
and Indonesia. For this group, Malaysia, Singapore, and Brunei are the major destination
countries, importing workers largely from Indonesia and the Philippines; and another group
was identified as mainly immigration and to this group belonged Malaysia, Singapore, Brunei,
and Thailand (Kaur, 2010).
Statistics on international migration by the United Nations Population Fund (UN, 2006
as cited by Miller, Ochs, and Mulvaney, 2008) show that the number of migrants has more
than doubled during the past fifty years, increasing from 75 million in 1960 to 191 million in
2005. Fifty nine percent (59%) of this total number are said to have migrated to high-income
countries. A big percentage of migrants, like some thirty-three percent (33%) of the European
Union (EU) population settled outside their country of origin.
Page 3
International Journal of Contemporary Applied Sciences Vol. 1 No. 1 September 2014
(ISSN: 2308-1365) www.ijcas.net
19
This numerical account of international migration trend was reinforced by Koser
(2010), who shared that about 25 million were added in the first five years of the 21st century.
Specific numerical accounts of increase had been reported as follows:
1. In the developing world, the increase between 1990 and 2000 was from fifty
two (52) million to sixty five (65) million, a numerical increase of thirteen (13)
million while in the developed world, the increase was from forty eight (48)
million to one hundred ten (110) million, an increase of sixty two (62) million.
2. Then in Europe in 2000, there were about sixty (60) million migrants; in Asia,
forty four (44) million; in North America, forty one (41) million; in Latin
America, six (6) million; in Africa, sixteen (16) million; and in Australia, six
(6) million.
3. In the USA, the migrants were about thirty-five (35) million, a number
considered as almost twenty 20 percent of the world‟s migrants in 2000; while
the Russian Federation had a share of about thirteen million migrants, a share
of almost eight percent (8%) of the total global migration; and Germany,
Ukraine, and India had between six (6) to seven (7) million each.
However, as to which countries are sending the migrants to these receiving countries,
no reliable data are available. The reasons are either the sending countries do not keep count
of how many of their citizens have migrated to foreign countries or the data collection about it
and the forms of measurement used in gathering these data differ (Abel, 2009).
For an estimate though, Koser (2010) reports that at least thirty five (35) million
Chinese, twenty (20) million Indians, and eight (8) million Filipinos live as migrants outside
their country. A total of 3,042 Filipino settlers who arrived in Australia from 1988 to 1989
were recorded (Bureau of Immigration Research, 1990 as cited by Forrest, Poulsen, and
Johnston, 2003).
The trend of movement from the sending country to the receiving country or core
group of countries began and continued with varied patterns caused by several factors. Under
the theories that have been formulated initiating and perpetuating causes of international
migration, migration generally begins with a personal, family, or regional interest to migrate
as push or pull economic or non-economic factors and continues depending on the satisfaction
gained by the migrants or on the conditions allowed by the receiving countries for them to
continue their stay.
Page 4
International Journal of Contemporary Applied Sciences Vol. 1 No. 1 September 2014
(ISSN: 2308-1365) www.ijcas.net
20
Driven by this interest, the person, family, or region looks for the connection that can
make him or her migrate. The recourse is the institutionalized migration system of government
or the network connection, which would provide assistance. Through the institutionalized
system, the interested person, family, or region passes through screening and compliance and
submission of requirements of the government agencies in-charge of migration or of their
accredited private recruitment agencies.
However, the international migration may start not from the migrants‟ own initiative
but rather from the recruitment agencies or their network connections who have found
economic or non-economic opportunities for them before they take interest in looking for
them (de Haas, 2010; Kazlauskiene & Rinkevicius, 2006).
From its initiating causes, international migration flows on varied patterns caused by
demographic factors such as the gender and age of the migrants; and human capital factors
such as the skill, occupation, or specialization of the migrants; and the economic and social
structures of either the sending country or the receiving country. In terms of gender, the
international migration for a time was among male workers in some countries like Pakistan,
Romania, and the Philippines. This was caused by the fact that the available jobs then were
basically for the male. However, in the course of time, international migration has been
feminized and this development increased the number of women migrants in both the
developed and the developing world (Hofmann & Bukley, 2013).
As reported by the international migration statistics (United Nations, 2005), there were
more female than male migrants in Europe, Latin America, North America, Asia, the USSR,
the Caribbean, and Oceania.
The feminization was caused by the demand of more developed countries for services,
healthcare, and entertainment jobs that are basically best performed by women; the
opportunity given by more foreign countries to women on their right to be united with their
husbands who are on a long contract settlement in the foreign country; and the growth of the
maid trade of women whose main purpose for their migration is to work as domestic helper.
Women comprise a growing number of immigrants worldwide and are the majority in many
cross-boarder flows (Massey, Fischer, & Capoferro, 2006).
In terms of age, the report of past studies was that in Romania, the male migrants who
were more than the female before were of ages twenty six (26) to forty (40) years and in the
migrant receiving OECD countries skilled migrants were of ages twenty five (25) and above
(Defoort, 2008). Williamson (1988) mentions that it is widely accepted in the international
Page 5
International Journal of Contemporary Applied Sciences Vol. 1 No. 1 September 2014
(ISSN: 2308-1365) www.ijcas.net
21
migration literature that migration is characterized by “young adult selectivity bias‟. Brown
and Bean (2006) posit that individuals of ages 20-29 years old have historically accounted for
the higher proportion of international migrants.
In terms of skills in Pakistan, from the 1950‟s to 2005, international migration had
created a trend of movement of forty (40) kinds of occupations categorized as follows: (a)
professional, (b) skilled, (c) semi-skilled, and (d) un-skilled (Lakha and Aziz, 2011).
Based on this occupation categorization of migrants from 1971 to 2004, according to
Lakha and Aziz (2011), the Bureau of Emigration and Overseas Employment of Pakistan
reported that the flow of manpower migration had been highest with the skilled workers
numbering 1,630,725; followed by the un-skilled numbering 1,524,859; then by the highly
skilled numbering 239,019; semi-skilled numbering 93,444; and the least, the highly qualified
numbering 57,184.
The Philippines ranked sixth (6th
) among the top 25 countries of immigration having a
share of 3.2% of the total immigrants in the world, and recorded 1,750 emigrants per million
of population. It has 161,000 recorded immigrants in 2009 constituting 3.2% of all
immigration with 1% change from 2007 to 2009 (OECD, 2013). The immigrants are
professional, semi-skilled, and skilled, and unskilled workers.
The International Organization for Migration‟s World Migration Report (2008) claims
that the definition of a skilled migrant is unclear, however typically, occupational or
educational status is used as cited in the paper of Parkins (2011).
The professional group includes those persons who are degree holders and with
impressive competence commercially in a particular field. They are the engineers, doctors,
nurses, managers, and teachers. The skilled group includes those persons who have special
knowledge or skill in their work and possess certificate, diploma, or degree which they may
have acquired from attending an institute, college, or university. This is the group of
electricians, carpenters, plumbers, drivers, surveyors, draftsmen, designers, machine operators,
accountants, and computer programmers.
The semi-skilled group includes those persons who have undergone training for a short
period of time and have learned a limited part of any trade on the job. They may have also
attended an institute or college and have earned a certificate, diploma, or degree. This is the
group of chauffeurs, room service waiters, painters, pipe fitters, tailors, masons, clerical and
administrative staff.
Page 6
International Journal of Contemporary Applied Sciences Vol. 1 No. 1 September 2014
(ISSN: 2308-1365) www.ijcas.net
22
The unskilled group includes those persons without any knowledge or any specialized
skill and whose work may be performed by any other worker. They may have attended school
but generally only up to primary or middle level school only.
In the light of the above stated body of literature, migration trends may be indicated by
the following factors: the type and history of migration, country of origin, size of the
migration flows, and immigrant populations (Miller, Ochs, and Mulvaney, 2008);
occupational skills of the migrants (Lakha and Aziz, 2011); country of origin, country of
destination, gender, and age of the migrants (Mariana, Dorin, and Ion-Daniel, 2010; Barber,
2008).
Hence, due to the constraint of available trend setting factors, this study posits the
following questions:
1. In the next 5 years, what are the trends of international migration by teachers from
any part of the developing country under study to other countries of the world in
terms of the size of migration flow by: year; region of origin; foreign country of
destination; gender; civil status and age; educational level taught in the country of
destination; and educational level taught and gender?
2. Is there a significant increase in the number of migrants from the developing
country during 1992-2011?
3. Is there a significant difference in the distribution of migrants under study among
the regions of the developing country during the period covered?
4. Is there a significant difference in the distribution of the migrants under study in the
countries of destination during the period covered?
5. Is there a significant difference in the number of migrants from the developing
country during the period covered based on gender; age and civil status;
educational level taught in the country of destination; and educational level taught
and gender?
2. THEORETICAL FRAMEWORK
The dynamics of international migration was contextualized under some theories
which describe economic and social factors as the underlying reasons motivating the
movement of people. The Push-Pull Theory by Lee (1966) and Ravenstein (1989) as cited by
Zientara, 2011 explains migration as motivated by “adverse conditions in one place push
people out, whereas favorable circumstances in a different place pull them out”. The
Page 7
International Journal of Contemporary Applied Sciences Vol. 1 No. 1 September 2014
(ISSN: 2308-1365) www.ijcas.net
23
theoretical explanation also established under the studies conducted by Lakha and Aziz (2011)
and Parkins (2010) further explain that people migrate as a result of dissatisfaction with their
current location and (mis) perceptions of golden opportunities and a better life elsewhere.
Widgren and Martin (2002) supported and provided enhancement on the above-
mentioned theory by putting on three categories to explain the factors influencing migration,
namely: demand-pull, supply-push, and network. Under the “demand pull” category, the
movement of people is motivated by economic or non-economic reason. As such, the
individual may be offered a job by somebody, or may want to join a relative or friend who is
already in the prospective place of destination. Under the “push-supply” category, an
individual who moves for an economic reason has either no job or a low paying job in the
place of origin and is, therefore, „pushed‟ to migrate where an available job or a better paying
job is available at the place of destination. In some cases and for non-economic reasons, an
individual may move away in order to run away from an impending danger or persecution
from the place of origin. For the “network” category, movement of people may be enhanced
and motivated by the flow of information. Hence, an individual may migrate for an economic
reason upon learning about the kind of job and the wage level offers from the flow of
information from different sources. For non-economic reasons, an individual may move away
from a place of origin to a place of destination where a desired new experience or adventure is
available as provided by the flow of information.
In essence, the Push-Pull Theory puts forward the explanation that migration is
primarily motivated by the intent to improve individual welfare that can be achieved
considering the economic conditions in the country of origin and destination.
The Human Capital Theory (Olaniyan and Okemakinde, 2008) explains that people are
an asset and a capital investment to enhance individual economic productivity and yield
income and other useful tangible and intangible gainful outputs to improve one‟s welfare
(Becker, 2008).
On the one hand, Massey, Arango, Hugo, Kauaouci, Pelligrino and Taylor (1993)
explain under the Neo-Classical Micro-Economic Theory a scheme of individual choice of
migration, whereby international migration is conceptualized as an investment in human
capital. People choose to move to where they can be most productive using their skills, and to
attain this, they must invest on both material and non-material costs of international migration.
On a macro-economic level, the same authors put forward the Neo-Classical Macro-Economic
Theory which explains international migration as an attribute of the geographic supply and
Page 8
International Journal of Contemporary Applied Sciences Vol. 1 No. 1 September 2014
(ISSN: 2308-1365) www.ijcas.net
24
demand for labor. Countries with large endowment of labor relative to capital have a low
equilibrium market wage, while countries with a limited endowment of labor relative to
capital are characterized by a high market wage. This economic condition triggers the flow of
migrant workers from the labor-abundant to labor-scarce countries which describes the flow of
human capital investment from capital-rich to capital-poor countries.
The Push-Pull Theory (Figure 1) contextualizes the theoretical explanations put
forward to describe the dynamics affecting the trend of population migration. Of particular
significance to note are the determinants consisting of economic and other non-economic
factors that can critically affect the trend of population migration. On a development
perspective, these determinants should be mutually responsive to the economic and non-
economic needs, demands and requirements of both the countries of origin (push) and
destination (pull). This will facilitate a migration trend consistent with the respective policies
and produce beneficial results for the welfare of migrants on an individual and family bases.
Place of DestinationPlace of Origin
Push Factors(Determinants)
- + -- - -+ + +
Pull Factors(Determinants)
- + -+ + ++ + -
CONSEQUENCES
...................
On the Families of the Migrant TeachersOn Individual Migrant Teachers
Trends
Policies on Migration
3. RESEARCH METHOD
3.1 Design
This paper is presented as a quantitative research that takes up the trends of teachers‟
international migration from a developing country with the use of descriptive design which is
basically concerned with describing “what is”. Data collected for the research were assessed
Figure 1. Trend of Population Migration : Push-Pull Theory (with adoption from Lee, 1966 and Ravenstein, 1989)
Page 9
International Journal of Contemporary Applied Sciences Vol. 1 No. 1 September 2014
(ISSN: 2308-1365) www.ijcas.net
25
using statistical tools to generate a description and projection on the trends of the teachers‟
international migration in the developing country under study.
3.2 Study Subjects and Site
The main subjects of this study are the 12,113 teachers of the developing country
under study who had migrated to some 85 foreign countries of the world in order to teach as
per record of the Office for Overseas Employment Administration, the government agency
officially in-charge of deployment of workers, including teachers from the said country.
3.3 Data Gathering Procedure
The main instrument used for the study is the set of documents obtained from the
government agency concerned consisting of records of deployment of teachers to different
foreign countries of destination from 1992 to 2011. The records accounted for deployment of
teachers by several categories which, among others, included total size of migration flow
during the period, foreign country of destination, and size of migration flow by gender, civil
status, age, and year level of teaching in the receiving country. Data recorded on international
migration are often times incomplete and they are rarely kept in a systematic way (Skeldon,
2005).
Initially, a proper coordination with the government agency concerned has been done
to determine the availability and accessibility of the data needed. A letter of request to this
office has been formally conveyed for the data needed and subsequently, in some instances, a
follow up of the request through telephone calls were done until permission was granted and
the data provided.
3.4 Data Analysis
The data gathered were organized, processed, summarized, analyzed, and interpreted to
bring out the trends in terms of the size of migration flows by year; region of origin, foreign
country of destination, gender, civil status, age, educational level taught in the receiving
country, and educational level taught and gender of the teachers whose deployment to their
respective teaching work was on record at the government agency concerned. The analysis
focuses on projecting the trends of the teachers‟ migration to other countries in the next five
years. Different statistical tools such as time path analysis, ARIMA, regression analysis, and
descriptive trend analysis through SPSS were utilized in the study.
Page 10
International Journal of Contemporary Applied Sciences Vol. 1 No. 1 September 2014
(ISSN: 2308-1365) www.ijcas.net
26
3.5 Ethical Consideration
The data used in this study were all solicited from the Office for Overseas
Employment Administration of the developing country through a letter of request of the
researcher. The letter emphasized that the data shall be used only for the study and a copy of
the results will be provided to the said office. For purposes of publication, the offices involved
in the country under study will not be identified as belonging to it.
4. RESULTS AND DISCUSSIONS
4.1.Migration flows by year
The variations in the migration are reflected in the time path of the annual
migration flow from 1992 to 2011. During the twenty (20) year period, the total number of
teachers recorded to have migrated to different destinations was 12,113. The biggest volume
of migration flow was noted during the year 2007 while the smallest in 1992. From 1992 to
1999 or during the span of the first eight (8) year period, the average number of teachers who
have migrated was on a steady rate of 132 teachers per year. However, from year 2000 until
2002, migration started to show an increase at an annual average of 446. It dropped during the
year 2003 but again it followed an increasing trend until the year 2007. From year 2000 until
2007 or during the next eight (8) years, an annual average of 727 was noted which is 82%
more than the data recorded during the first eight (8) years span period. Migration has the
highest number recorded at 1,699 and 1,691 for years 2007 and 2008, respectively. During the
years 2008 until 2010 or the next three (3) years, the trend began to decrease but increased
again in 2011. The annual average of migrations during the last four (4) years is 1,312 which
is 66% more than the average value recorded during the previous three (3) year period, 2000-
2002 when the migration trend was initially observed to increase.
ARIMA test shows that the percentage change over the 20 year period is not
significant. Thus, it may be concluded that the trend will only be positive for the next years
due to strong economic reasons.
Page 11
International Journal of Contemporary Applied Sciences Vol. 1 No. 1 September 2014
(ISSN: 2308-1365) www.ijcas.net
27
Figure 2. International Migration Population Flow by Year
Data source: Office for the Overseas Employment Administration
However, regression analysis reveals that the increase over the 20 year period is
significant (Fig.3). This indicates that the increase or decrease in the number of migrants
provides a significant trend, that is, we can expect that trend will be positive for the next five
years due to economic reasons. This projection of trend is the same as the results in the report
of the Organization for Economic Cooperation and Development (2013) where the % change
in 2009/2007 of the migrants from the country under study was recorded at 1%. This result is
further validated through the time path analysis.
Figure 3. Line Fit Plot of International Migration Population Flow by Year
Data source: Office for the Overseas Employment Administration
Time path analysis shows that an increasing population of teachers migrating annually
will be the trend that is projected to be sustained over the years or at least in the next five (5)
112167
108 133
305
623543
929
1699 1691
1200
984
1373
40-146
770
-491
389
-1000
-500
0
500
1000
1500
2000
Annual Migration (no.)
Annual Increase (no.)
y = 80.11x - 15975R² = 0.767
-500
0
500
1000
1500
2000
1990 1995 2000 2005 2010 2015
dat
a
year
Year Line Fit Plot
data
Page 12
International Journal of Contemporary Applied Sciences Vol. 1 No. 1 September 2014
(ISSN: 2308-1365) www.ijcas.net
28
years. The projection is based on the increase for the two 8-year periods (years 1992-1999 and
2000-2007) migration average computed at 82% or at 10% annual average which is highly
significant and probable to occur. Annual migration from 1992 to 1999 (8 years) is low but
steady and evenly distibuted over the years without significant increase. However, the
significant increase from the year 2000 and thereafter in the next 11 years tend to be the trend
for the subsequent years.
The results consistently agree with the trend of migration that was discussed under the
United Nations Population Fund (UN, 2006 as cited by Miller, Ochs, and Mulvaney, 2008;
UN, 2013) as presented in the previous section, which describes a trend of international
migration that significantly doubled during the 1960 to 2005 under the economic backdrop of
a growing demand for labor and employment.
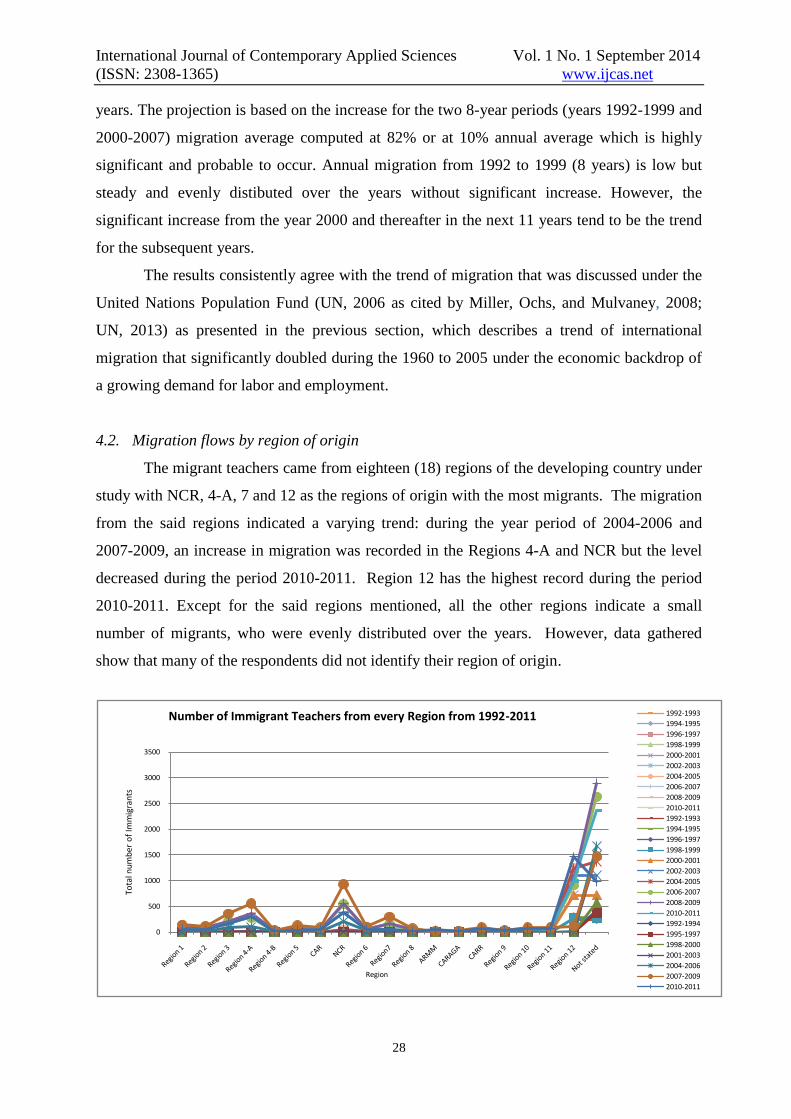
4.2. Migration flows by region of origin
The migrant teachers came from eighteen (18) regions of the developing country under
study with NCR, 4-A, 7 and 12 as the regions of origin with the most migrants. The migration
from the said regions indicated a varying trend: during the year period of 2004-2006 and
2007-2009, an increase in migration was recorded in the Regions 4-A and NCR but the level
decreased during the period 2010-2011. Region 12 has the highest record during the period
2010-2011. Except for the said regions mentioned, all the other regions indicate a small
number of migrants, who were evenly distributed over the years. However, data gathered
show that many of the respondents did not identify their region of origin.
0
500
1000
1500
2000
2500
3000
3500
Tota
l nu
mb
er o
f Im
mig
ran
ts
Region
Number of Immigrant Teachers from every Region from 1992-2011 1992-1993
1994-1995
1996-1997
1998-1999
2000-2001
2002-2003
2004-2005
2006-2007
2008-2009
2010-2011
1992-1993
1994-1995
1996-1997
1998-1999
2000-2001
2002-2003
2004-2005
2006-2007
2008-2009
2010-2011
1992-1994
1995-1997
1998-2000
2001-2003
2004-2006
2007-2009
2010-2011
Page 13
International Journal of Contemporary Applied Sciences Vol. 1 No. 1 September 2014
(ISSN: 2308-1365) www.ijcas.net
29
Fig. 4. Size of International Migration by Region of Origin from 1992-2011
Data Source: Office for Overseas Employment Administration, 2012
The result indicates the migration pattern that is not evenly distributed among the
eighteen (18) regions: mainly dominated by four (4) different regions (3, NCR, 4-A, and 7),
followed by the group of 7 regions ( 6, CAR, 5, 2, 1, 11, and 12), and the group of 6 regions
(4B, 8, ARMM, CARAGA, 9 and 10). Time path analysis shows that the level of the disparity
of the distribution of migration among the regional origins is significant and is projected to be
the migration pattern and trend for the next five (5) years or further. More migrant workers
will qualify from more progressive regions in the country under study because they tend to
acquire the necessary ability to meet the requirements of the labor markets that they wish to
participate in since selective immigration policies in host countries ensure a better and faster
integration of immigrants to their system (KÜL , 2011).
4.3. Migration flows by foreign destination
A total of 12,113 migrant teachers had been deployed by the government agency
concerned to some eighty five (85) foreign countries of destination. The biggest migration
from 1992 to 2010 flowed to the Asia Pacific Region with the highest number to the United
States of America having received 4,741 (39%). The other countries to have received the
larger proportion of the migrants were Saudi Arabia (1,326), China (529), Bahrain (484),
United Arab Emirates (463), Qatar (318) and Brunei (315).
The smallest migration flowed to twenty two (22) countries with one (1) teacher migrating
in different years from 1992 to 2010. These twenty-two countries are Holland (1993); New
Hampshire, 1994; Switzerland, (2001); Mozambique, (1992); West Africa, (1992); Upper
Volta, (2003); Finland, (2004); Sweden, (2004); Angola, (2006); Malta, (2006); Brazil,
(2006); Chile, (2005); Fiji, (2007); Solomon Islands, (2007); South Africa, (2007); Yemen
South, (2007); Argentina, (2008); Colombia, (2008); Virgin Islands, (2009); Colombia,
(2009); Guinea, (2009); and Jordan, (2009).
Page 14
International Journal of Contemporary Applied Sciences Vol. 1 No. 1 September 2014
(ISSN: 2308-1365) www.ijcas.net
30
Fig. 5 Size of International Migration by Country of Destination from 1992-2011
Data Source: Office for Overseas Employment Administration, 2012
The results indicate a trend that the Asia Pacific Region with particular reference to the
United States of America will be the main destination of the teacher migrants over the next
five years. The results are evident in the report submitted by the American Federation of
Teachers stating that in 2005, Baltimore hired 108 Filipino teachers, and just four years later,
more than 600 Filipino teachers were working in Baltimore, constituting 10% of the city‟s
teaching force (American Federation of Teachers, 2011). This analysis draws mainly on the
statistical figure of 39% of the total migration population identifying the countries of
destination during the nine (9) year period. It indicates a trend characterized by a wider
disparity and uneven distribution of migration in terms of country of destination. OECD
(2011) reports that the US is the top destination for immigrants. Nwosu, Batalova, and Auclair
(2014) report that 20% of all international migrants reside in the United States. Better
standards of living and quality of life, higher salaries, access to advanced technology and more
stable political conditions in the developed countries attract people from less developed areas
(Dodani & LaPorte, 2005). The majority of migration is from developing to developed
countries.
4.4. Migration flows by gender
From 1992 to 2010, the record shows that the population of migration annually is
consistently dominated in number by female (n=7,266) over male (n=2,603) teachers with an
average of 260 male teachers and 727 female teachers for the last ten years. The annual
migration for both gender categories, however, follows an increasing trend from 1992 to 2009.
0
1000
2000
3000
4000
5000
6000
7000
African Group
Asia-Pacific Group
Eastern European Group
Latin American and Caribbean Group
Western European and Others Group
others
Page 15
International Journal of Contemporary Applied Sciences Vol. 1 No. 1 September 2014
(ISSN: 2308-1365) www.ijcas.net
31
This trend however, was not sustained until 2010 when the trend dropped for both the gender
categories.
Fig. 6 Size of International Migration by Gender from 1992-2011
Data Source: Overseas Employment Administration, 2012
The level of the difference of gender in favor of the female workers is not statistically
significant (p<0.06). Data, however, descriptively shows a migration pattern or trend where
female teachers tend to be dominant in number over male workers and is projected in the next
5 years to most likely characterize the migration system for the developing country. This
result supports the global feminization idea of migration as discussed in the study of Hofmann
and Buckley (2013). They state that local and global structural factors influence the
emergence of female labor migration. This is supported further by the UN report in 2013,
when women constituted more than half of all migrants in 101 countries. In 11 countries in
Asia, women accounted for less than one in three international migrants (UN, 2013). Women,
increasingly migrate on their own and are now accounting for almost half of all international
migrants (International Labor Organization, 2010).
4.5. Migration flows by civil status and age
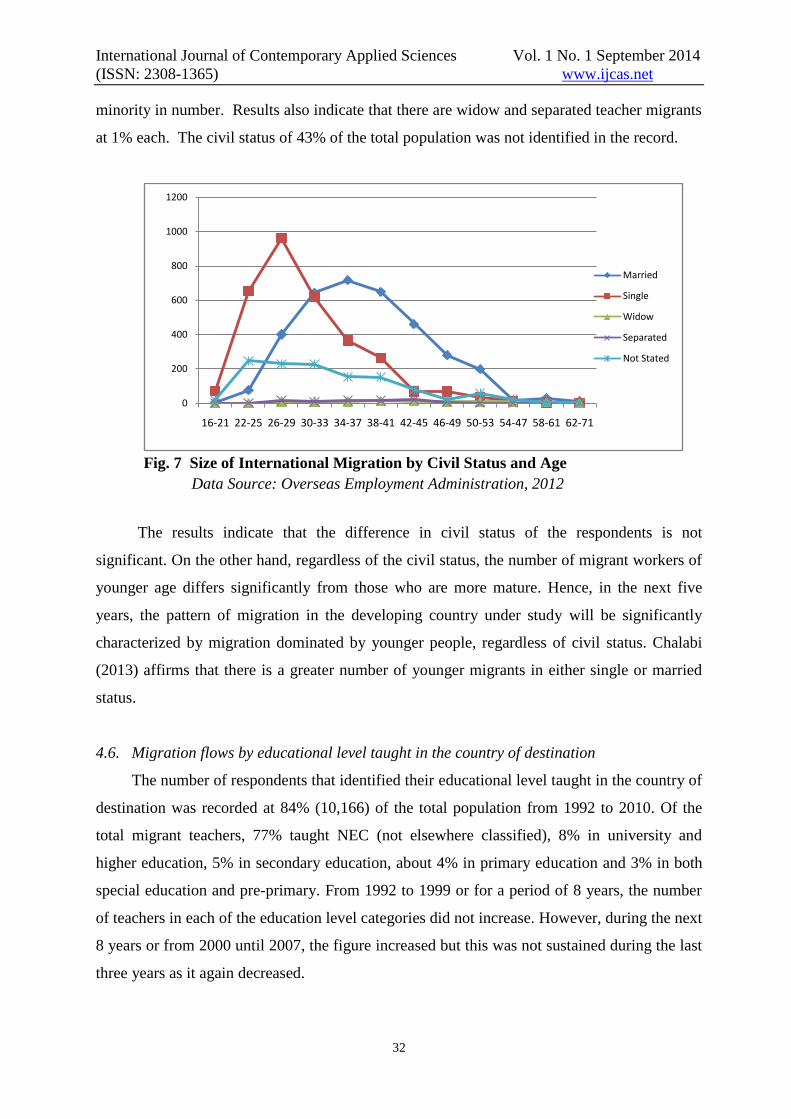
Most of the teachers who migrated from 1992 to 2011, regardless of gender were
married which represents 29% of the total population. Married migrant teachers comprise the
middle age group with the most belonging to the 30-41 years old and some more mature group
having 42-53 years of age. On the other hand, the single civil status category accounts for 26%
of the total population comprising mostly by migrants who are younger or are of ages of 22-33
years old. Under this group, migrants who are older or at the age range of 34-53 years are the
Page 16
International Journal of Contemporary Applied Sciences Vol. 1 No. 1 September 2014
(ISSN: 2308-1365) www.ijcas.net
32
minority in number. Results also indicate that there are widow and separated teacher migrants
at 1% each. The civil status of 43% of the total population was not identified in the record.
Fig. 7 Size of International Migration by Civil Status and Age
Data Source: Overseas Employment Administration, 2012
The results indicate that the difference in civil status of the respondents is not
significant. On the other hand, regardless of the civil status, the number of migrant workers of
younger age differs significantly from those who are more mature. Hence, in the next five
years, the pattern of migration in the developing country under study will be significantly
characterized by migration dominated by younger people, regardless of civil status. Chalabi
(2013) affirms that there is a greater number of younger migrants in either single or married
status.
4.6. Migration flows by educational level taught in the country of destination
The number of respondents that identified their educational level taught in the country of
destination was recorded at 84% (10,166) of the total population from 1992 to 2010. Of the
total migrant teachers, 77% taught NEC (not elsewhere classified), 8% in university and
higher education, 5% in secondary education, about 4% in primary education and 3% in both
special education and pre-primary. From 1992 to 1999 or for a period of 8 years, the number
of teachers in each of the education level categories did not increase. However, during the next
8 years or from 2000 until 2007, the figure increased but this was not sustained during the last
three years as it again decreased.
0
200
400
600
800
1000
1200
16-21 22-25 26-29 30-33 34-37 38-41 42-45 46-49 50-53 54-47 58-61 62-71
Married
Single
Widow
Separated
Not Stated
Page 17
International Journal of Contemporary Applied Sciences Vol. 1 No. 1 September 2014
(ISSN: 2308-1365) www.ijcas.net
33
Fig. 8 Size of International Migration by Educational Level Taught
Data Source: Office for Overseas Employment Administration, 2012
Time series analysis shows that excluding the NEC, the number of teachers under the
University and Higher Education level dominates and shall continue to lead the level of
education category affiliated by the migrant educators who will teach in the different foreign
countries. The level of difference of the categories in terms of population is wide and very
significant. With the NEC category excluded, all the other categories do not have significant
difference in terms of population. Throughout the twenty (20) years period, all of the
categories followed an increasing trend in terms of population, with the University and Higher
Education category consistently remaining on the lead. This migration pattern in terms of
educational level taught is projected to characterize the trend in the developing country under
study for the next five (5) years or further.
4.7 Migration flows by educational level taught and gender
A total of 9,869 teachers were recorded with their educational level of teaching in the
foreign country of destination and their gender. Out of this total population, the female
comprises the majority at 7,266 or 74%.
0
200
400
600
800
1000
1200
1400
1600
Teachers (NEC)
Teachers in Pre-Primary Education
Teachers in Primary Education
Teachers in Secondary Education
Teachers in Special Education
Teachers in University & Higher Education
Page 18
International Journal of Contemporary Applied Sciences Vol. 1 No. 1 September 2014
(ISSN: 2308-1365) www.ijcas.net
34
Fig. 9 Size of International Migration by Educational Level Taught and Gender
Data Source: Office for Overseas Employment Administration, 2012
Results show that the greater proportion of the total population at 7,347 (74%) with
combined male (27%) and female (73%) teachers are under the category of NEC in the
educational level taught. The teacher population under the categories of Secondary Education
and University and Higher Education were almost the same at 813 (8%) and 706 (7%), with
female at 78% and 59%, respectively. Consistently, for all categories of education level
taught, the female population comprises the majority in number over the male. However,
results show that female migrants do not significantly dominate in number in the flow of
migrants.
5. CONCLUSION AND RECOMMENDATIONS
This study described the trends of teachers‟ international migration from a developing
country during a 20 year period (1992-2011) and projected the trends in the next 5 years, in
terms of the size of migration flow by: year; region of origin; foreign country of destination;
gender; civil status and age; educational level taught in the country of destination; and
educational level taught and gender.
The trend of international migration by teachers from the developing country covered
in this study shall be characterized by the following in the years to come or at least, in the next
five (5) years:
a. Migration shall continually increase and will mainly provide the employment
opportunities for the labor population seeking better economic benefits to improve
personal and family welfare.
1951
52 62 179 72 287
5396
176378
634263
419
0
1000
2000
3000
4000
5000
6000
Teachers (NEC) Teachers in Pre-Primary Education
Teachers in Primary Education
Teachers in Secondary Education
Teachers in Special Education
Teachers in University & Higher Education
Male Female
Page 19
International Journal of Contemporary Applied Sciences Vol. 1 No. 1 September 2014
(ISSN: 2308-1365) www.ijcas.net
35
b. Most of the migrating teachers shall come from selected regions indicating that
regional location is an advantage for foreign employment opportunities.
c. Countries from the Asia Pacific particularly the United States shall be the main
foreign country of destination for most of the migrating teachers. This indicates
that the prevailing migration system with the country is mutually favorable and
effective for both countries as a source and destination of labor, compared with the
other countries of destinations.
d. Civil status alone will not be a considerable preference for employment and factor
for decision to seek foreign employment by the migrating workers. However, being
younger in age will continue to be the profile of the migrants as this will be an
advantage for foreign employment regardless of civil status.
e. The educational teaching level in foreign countries for migrants of the country
under study shall be in the order of priority as follows: college and university,
secondary, primary, special education, and pre-primary.
f. No gender preference shall describe the trend for flow of the teaching population in
all the educational levels taught by teachers in foreign countries of employment.
The study tends to draw the following as an implied interpretation and observation
with the corresponding recommendations:
a. Migration for employment as a consistently growing trend in the developing
country will be a main support to the economy and source for the needs of people
on a personal and household level. As such, the development of migration policies
geared towards the enhancement of opportunities for foreign employment should
be promoted.
On the other hand, the trend may indicate that on the long run, the labor market of
the country will lead to a state of „dependency‟ that unilaterally favors foreign
economy. Hence, policies should also continuously pursue improvement and
strengthen local employment to open a wider opportunity for the labor market
leading towards a sustainable and resilient economy.
b. The above trend on the regional origins of migrants may have underlying reasons
that include the following:
b.1. Some regions may be more progressive and may have more access to
information and services of the offices facilitating foreign employment.
Page 20
International Journal of Contemporary Applied Sciences Vol. 1 No. 1 September 2014
(ISSN: 2308-1365) www.ijcas.net
36
b.2. The management and administration system may have to be decentralized to
allow equitable access to information and services among prospective migrant
workers from different regions.
c. The migration policies in the leading receiving countries should be studied through
research to determine the facilitating factors on migration and explore the
possibility of replicating these policies to enhance employment migration to the
other countries of destination.
d. The migration priority consideration of family should be accounted. The social
cost of migration should always be considered. Policies should be in place to
support the need to sustain strong bond of families for migrant workers.
e. The essential elements of the NEC educational level category in the country under
study should be determined and studied to sustain its potentials as the leading
source for employment of migrant teachers.
Results of the study contribute to the role of many countries and regions in the global
migration order that may fundamentally change over the coming decades, potentially
transforming major destination countries (de Haas, 2010). There is substantial evidence that
the developing country under study will be integrated into the global capitalist economy as it
tend to go through migration transition (Zelinsky, 1971; Skeldon, 1997; de Haas, 2010).
This paper may provide the collective perspective of the significant aspects of labor
migration particularly those in the educational sector. Migration for employment provides a
greater contribution to national growth and to improve the social and economic welfare of
people. Hence, it should not be the least understood in the pursuit of development but
government policies should be geared towards its continuous enhancement.
6. REFERENCES
American Federation of Teachers (2011). The Learning in context. Retrieved from
http://www.pbs.org/pov/learning/photo_gallery_background.php?photo=2#.VAruK6P
8uKU
Page 21
International Journal of Contemporary Applied Sciences Vol. 1 No. 1 September 2014
(ISSN: 2308-1365) www.ijcas.net
37
Asis, M.B. (2006). How international migration can support development: A challenge for the
Philippines. Migración y Desarrollo, 7, 96-122.
Abel, G. (2009). Estimation of international migration flow tables in Europe. Journal of the
Royal Statistical Society, 173(4), 797-825.
Barber, P. (2008). The ideal immigrant? Gendered class subjects in Philippine-Canada
migration. Third World Quarterly, 29(7), 1265-1285.
Becker, G.S. (2008). Investments in human capital: A theoretical analysis. Journal of
Political Economy, 70, 9-49.
Chalabi, M. (2013). DataBlog. Retrieved on July, 2013 from
http://www.theguardian.com/profile/mona-chalabi
De Haas, H. (2010). The internal dynamics of migration processes: a theoretical inquiry.
Journal of Ethnic and Migration Studies, 36(10), 1587-1617.
Defoort, C. (2008). Long-term trends in international migration : an analysis of the six main
receiving countries. Population, 63(2), 285-318.
Dodani, S. & Laporte, R. (2005). Brain drain from developing countries: how can brain drain
be converted into wisdom gain? Journal of the Royal Society of Medicine, 98(11):
487–491.
Fawcett, J. (1989). Networks, linkages, and migration systems. International Migration
Review. 23(3), 671-680.
Forrest, J., Poulsen, M. & Johnston, R.J. (2003). Everywhere different? Globalization and the
impact of international migration on Sydney and Melbourne. Geoforum, 34(2003),
499-510.
Hatton, T.J. and Williamson, J.G. (2005). Global Migration and the worldwide economy: Two
centuries of policies and performance. Journal of Economics, 90(3), 318 – 321.
Hofmann, E.T. & Buckley, C.J. (2013). Global Changes and Gendered Responses:
The Feminization of Migration From Georgia. International Migration Journal, 47(3),
508-538.
International Labor Organization (2010). International Labor Migration: A Rights-Based
Approach. Geneva, Switzerland: International Labor Office.
International Organization for Migration (2008). World Migration Report. Retrieved on July
2014 from http://www.iom.int/cms/en/sites/iom/home/what-we-do/migration-policy-
Page 22
International Journal of Contemporary Applied Sciences Vol. 1 No. 1 September 2014
(ISSN: 2308-1365) www.ijcas.net
38
and-research/migration-research-1/world-migration-report/world-migration-report-
2008.html
Kaur, A. (2010). Labour migration trends and policy challenges in Southeast Asia. Public
and Society, 29, 385-397.
Kazlauskiene, A. & Rinkevicius, L. (2006). Lithuania “brain drain” causes: push and pull
factors. Engineering Economics, 46 (1), 27-37.
Koser, K. (2008). Introduction: International migration and global governance. Global
governance, 16, 301-315.
KÜL , Y. (2011). Opportunuties And Challenges Of International Migration For Sending And
Receiving Countries. Retrieved on July, 2013 from
http://www.mfa.gov.tr/opportunuties-and-challenges-of-international-migration-for-
sending-and-receiving-countries.tr.mfa
Lakha, I. & Aziz, F., (2011). Trends of manpower migration from Pakistan. Interdisciplinary.
Journal of Contemporary Research in Business, 3(4), 489-500.
Lee, E. (1966). A Theory of Migration. Demography, 3(1), 47- 57.
Liebert, S. (2010). The role of informal institutions in U.S. immigration policy: the case of
illegal labor migration from Kyrgyzstan. Public Administration Review, 390-400.
Mariana, P., Dorin, B. & Ion-Daniel, Z. (2010). Descriptive analysis of the international
migration phenomenon in Romania between 1991-2008. The Bucharest Academy of
Economics, 288-294.
Massey, D., Arango, J., Hugo, G., Kouaouci, A., Pelligrino, A. & Taylor, E. (1993). Theories
of international migration: a review and appraisal. Population and Development
Review, 19(3), 431-466.
Massey, D., Fisher, M. & Capoferro, C. (2006). International migration and gender in Latin
America: a Comparative Analysis. International Migration, 44(5), 63-91.
Miller, P.W., Ochs, K., & Mulvaney, G. (2008). International teacher migration and the
commonwealth teacher recruitment protocol. European Education, 40(3), 89-101.
Muus, P. (2001). International migration and the europian union, trends, and consequences.
European Journal on Criminal Policy and Research, 9(1), 31-39.
Nimwegen,N., Van der Erf, R. & Heering, E. (2010). Demographic Trends, Socio-Economic
Impacts and Policy Implications in the European Union. Demography Monitor, 25-69.
Retrieved on July, 2013 from http: www.nidi.knaw.nl/en/staff/overview/heering
Page 23
International Journal of Contemporary Applied Sciences Vol. 1 No. 1 September 2014
(ISSN: 2308-1365) www.ijcas.net
39
Nwosu,C., Batalova,J., & Auclair, G. (2014). Frequently Requested Statistics on Immigrants
and Immigration in the United States. Journal of the Migration Policy Institute.
Retrieved on April, 2014 from http://
http://www.migrationpolicy.org/article/frequently-requested-statistics-immigrants-and-
immigration-united-states.
OECD (2011). International migration: where do people go and where from? Retrieved on
June 2014 from http://www.theguardian.com/news/datablog/immigration-destination-
countries-list-migration-statistics
_____ (2013). Database on Immigrants in OECD and non-OECD Countries. Retrieved on
July, 2013 from http://www.oecd.org/els/mig/dioc.htm
Olaniyan, D. and Okemakinde. T. (2008). Human Capital Theory: Implications for
educational development. Pakistan Journal of Social Studies, 5(5), 479-483.
Parkins, N. (2010). Push and Pull Factors of Migration. American Review of Political
Economy, 8(2), 6-24.
Raveinstein, E.G. (1889). The laws of migration. Journal of the Royal Statistical Society, 52,
241-301.
Skeldon, R. (1997). Migration and development. A global interpretation. London: Longman.
_________ (2005). “Globalization, Skilled Migration and Poverty Alleviation: Brain Drains in
Context”. Development Research Center on Migration, Globalisation and Poverty.
Retrieved on July, 2014 from http://www.migrationdrc.org/publications/
working_papers/WP-T15.pdf
United Nations (2006). Population Division International Migration, 1-2. Retrieved on July,
2014 from http://www.un.org/esa/population/publications/2006migration-
chart/migration2006.pdf.
_____________(2013). International Migration Report on Trends in International Migrant
Stock. Retrieved on July, 2014 from
http://www.un.org/en/development/desa/population/publications/migration/migration-
report-2013.shtml
Widgren, J. and Martin, P. (2002). Managing migration: the role of economic instruments.
International Migration Review, 19(3), 20-30.
Williamson, J. G. (1988). Migrant selectivity, urbanization, and industrial revolutions.
Population and Development Review, 14(2), 287-314
Zelinsky, W. (1971). The hypothesis of the mobility transition. Geographical review, 61(2),
219-49.
Zientara, P. (2011). : A case against building ever-higher fences International migration.
Oxford: Blackwell Publishing, 67-72.
Page 24
International Journal of Contemporary Applied Sciences Vol. 1 No. 1 September 2014
(ISSN: 2308-1365) www.ijcas.net
40
Zlotnik, H. (1992). International migration systems: a global approach. International studies
in Demography, 12, 354.