56
The U. S. Dollar – Quo Vadis? Dr. Robert T. LeClair John Cabot University Rome, Italy
| Date post: | 15-Dec-2015 |
| Category: |
Documents |
| Upload: | nicolette-johnston |
| View: | 216 times |
| Download: | 0 times |
The U. S. Dollar – Quo Vadis?
Dr. Robert T. LeClair
John Cabot University
Rome, Italy

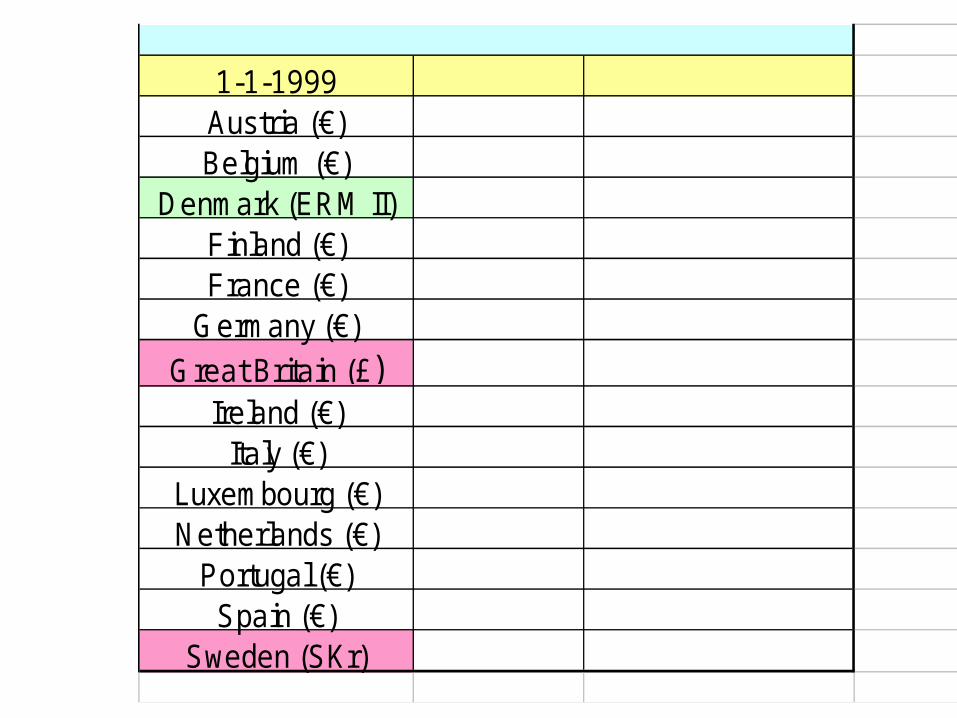
1-1-1999Austria (€)Belgium (€)
Denmark (ERM II)Finland (€)France (€)
Germany (€)Great Britain (£)
Ireland (€)Italy (€)
Luxembourg (€)Netherlands (€)
Portugal (€)Spain (€)
Sweden (SKr)

1-1-1999 1-1-2001Austria (€) Greece (€)Belgium (€)
Denmark (ERM II)Finland (€)France (€)
Germany (€)Great Britain (£)
Ireland (€)Italy (€)
Luxembourg (€)Netherlands (€)
Portugal (€)Spain (€)
Sweden (SKr)

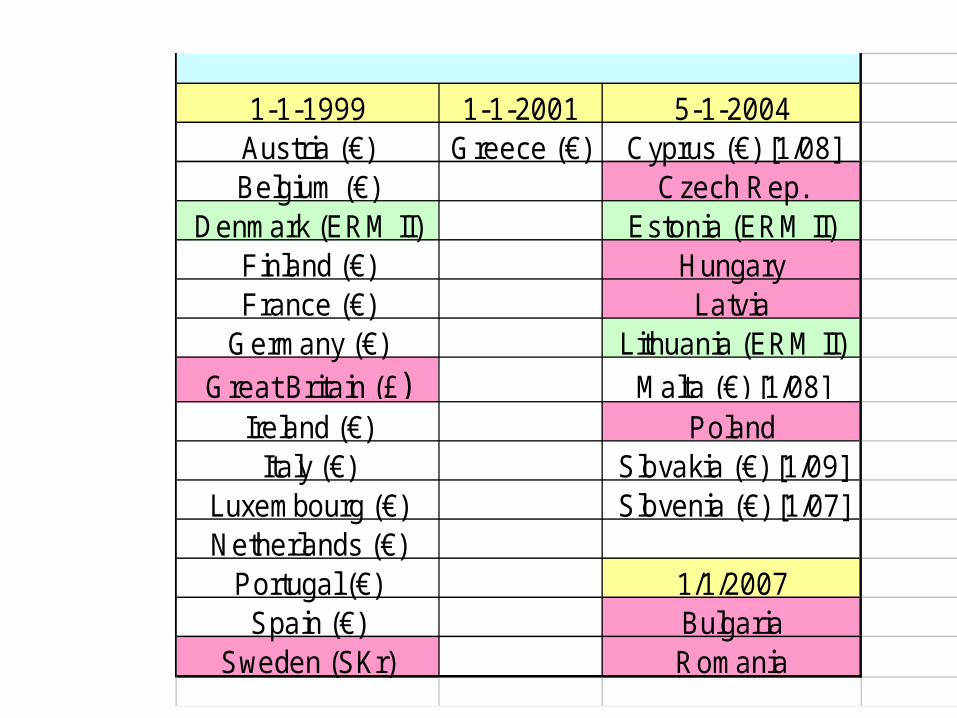
1-1-1999 1-1-2001 5-1-2004Austria (€) Greece (€) Cyprus (€) [1/08]Belgium (€) Czech Rep.
Denmark (ERM II) Estonia (ERM II)Finland (€) HungaryFrance (€) Latvia
Germany (€) Lithuania (ERM II)Great Britain (£) Malta (€) [1/08]
Ireland (€) PolandItaly (€) Slovakia (€) [1/09]
Luxembourg (€) Slovenia (€) [1/07]Netherlands (€)
Portugal (€)Spain (€)
Sweden (SKr)
1-1-1999 1-1-2001 5-1-2004Austria (€) Greece (€) Cyprus (€) [1/08]Belgium (€) Czech Rep.
Denmark (ERM II) Estonia (ERM II)Finland (€) HungaryFrance (€) Latvia
Germany (€) Lithuania (ERM II)Great Britain (£) Malta (€) [1/08]
Ireland (€) PolandItaly (€) Slovakia (€) [1/09]
Luxembourg (€) Slovenia (€) [1/07]Netherlands (€)
Portugal (€) 1/1/2007Spain (€) Bulgaria
Sweden (SKr) Romania

Headlines
• “Dollar faltering after seven years as leading currency” -USA Today
May 30, 2002
• “Dollar’s Drop Shows Loss of Faith in U. S. Economy”
-Wall Street Journal (Europe)June 3, 2002
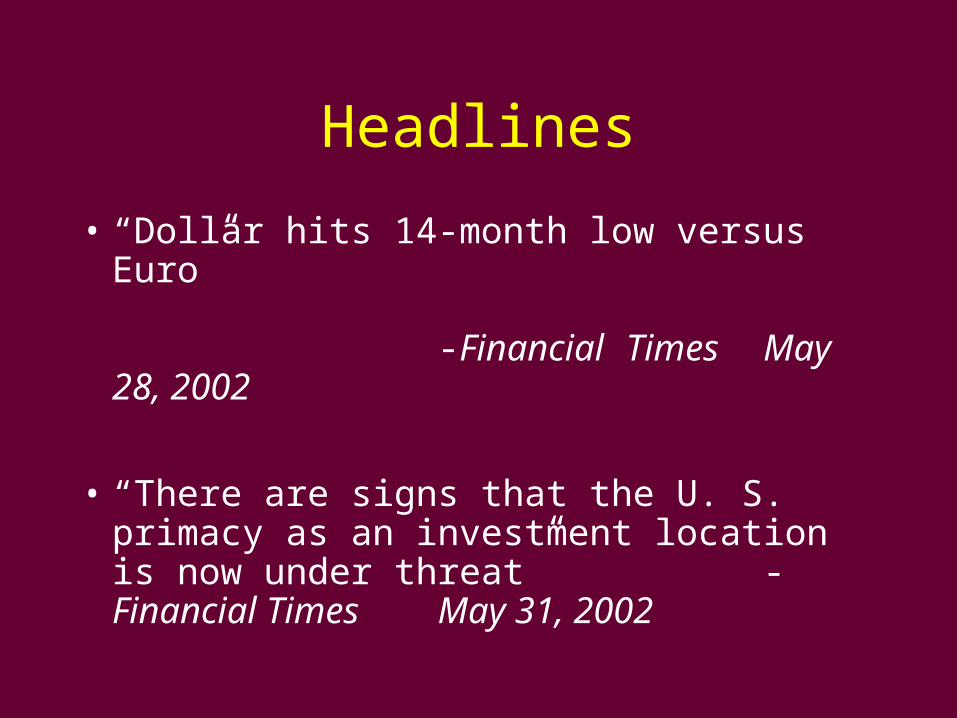
Headlines
• “Dollar hits 14-month low versus Euro” -Financial Times
May 28, 2002
• “There are signs that the U. S. primacy as an investment location is now under threat” -Financial Times
May 31, 2002
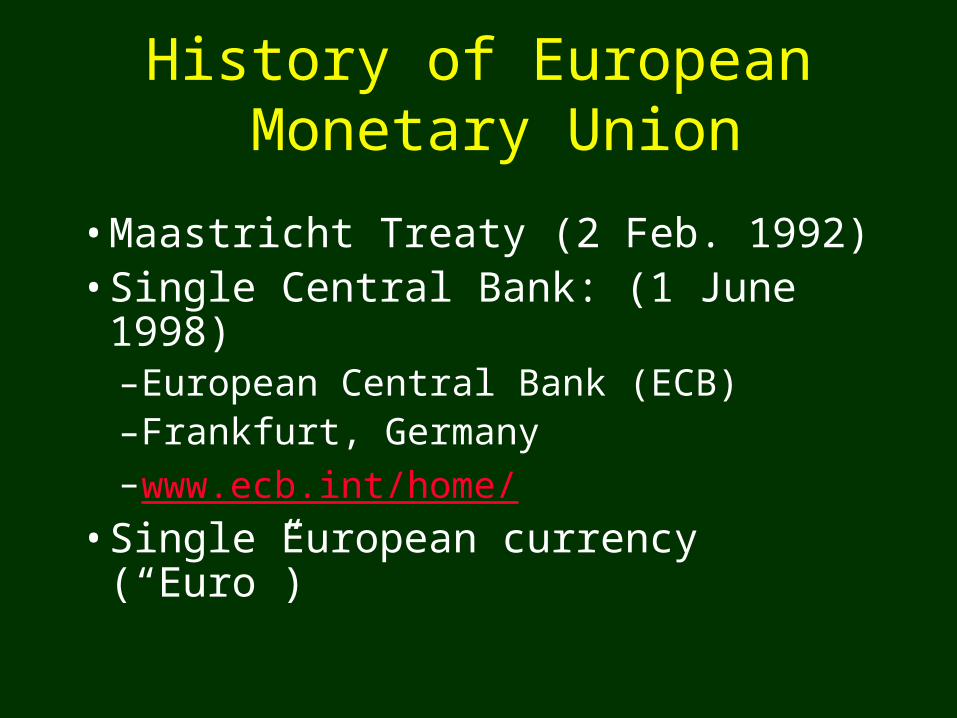
History of European Monetary Union
• Maastricht Treaty (2 Feb. 1992)• Single Central Bank: (1 June 1998)
– European Central Bank (ECB)– Frankfurt, Germany– www.ecb.int/home/
• Single European currency (“Euro”)

History of European Monetary Union
• Qualification standards:– inflation– interest rates– fiscal deficit– national debt
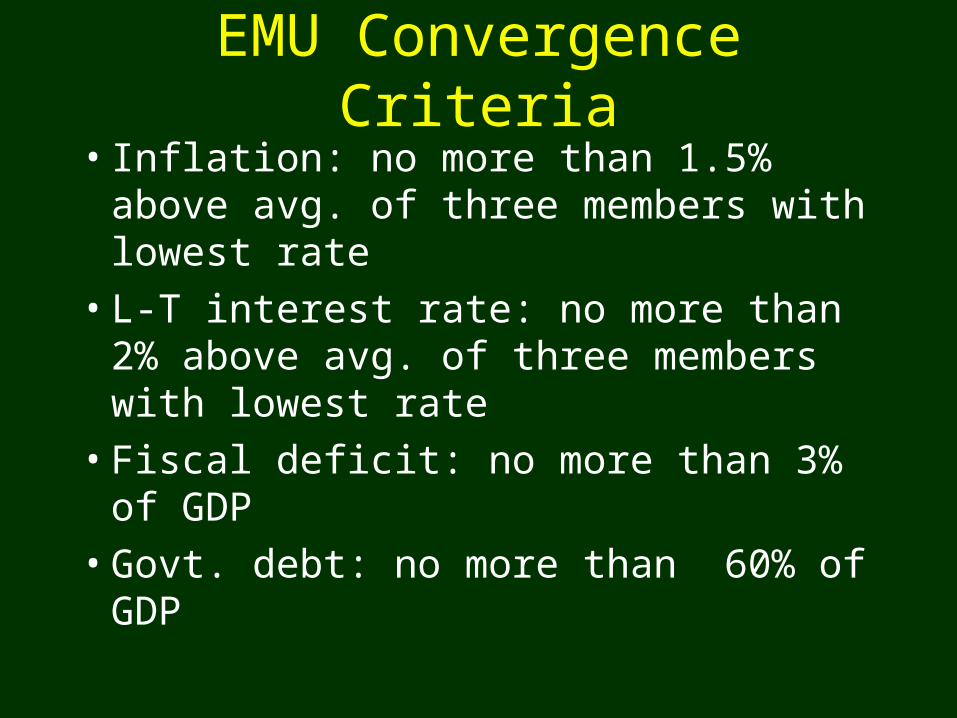
EMU Convergence Criteria
• Inflation: no more than 1.5% above avg. of three members with lowest rate
• L-T interest rate: no more than 2% above avg. of three members with lowest rate
• Fiscal deficit: no more than 3% of GDP
• Govt. debt: no more than 60% of GDP

History of the Euro (€)
• Officially introduced: 1 Jan 1999
• Currency and coins introduced: 1 Jan 2002
• “Legacy” currencies (Franc, Mark, Lira, etc.) no longer legal tender after 28 Feb 2002
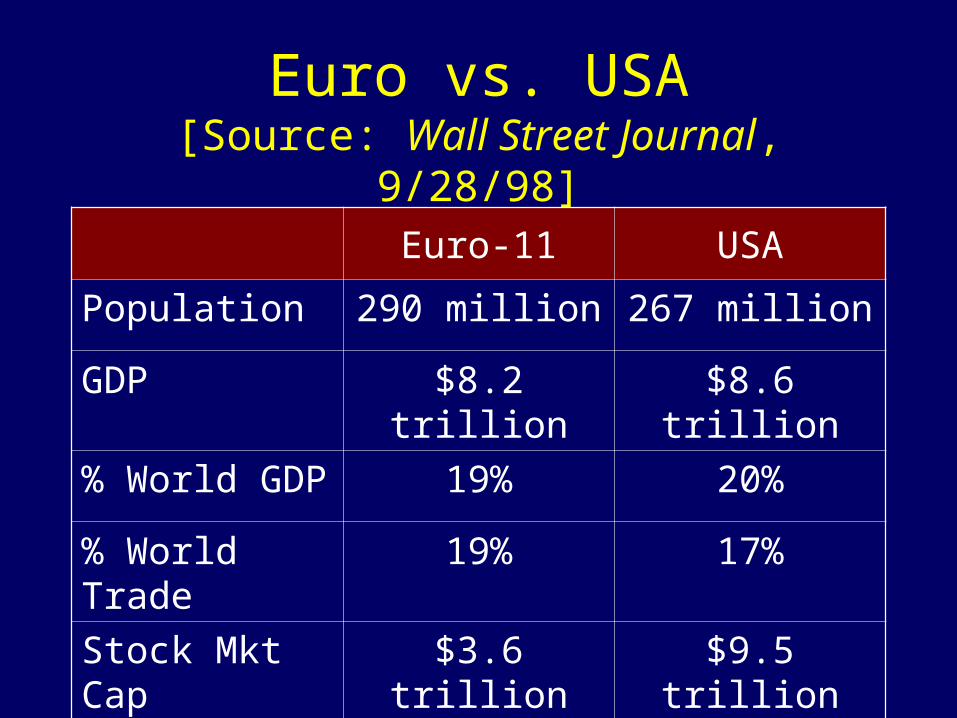
Euro vs. USA[Source: Wall Street Journal, 9/28/98]
Euro-11 USA
Population 290 million 267 million
GDP $8.2 trillion $8.6 trillion
% World GDP 19% 20%
% World Trade 19% 17%
Stock Mkt Cap $3.6 trillion $9.5 trillion
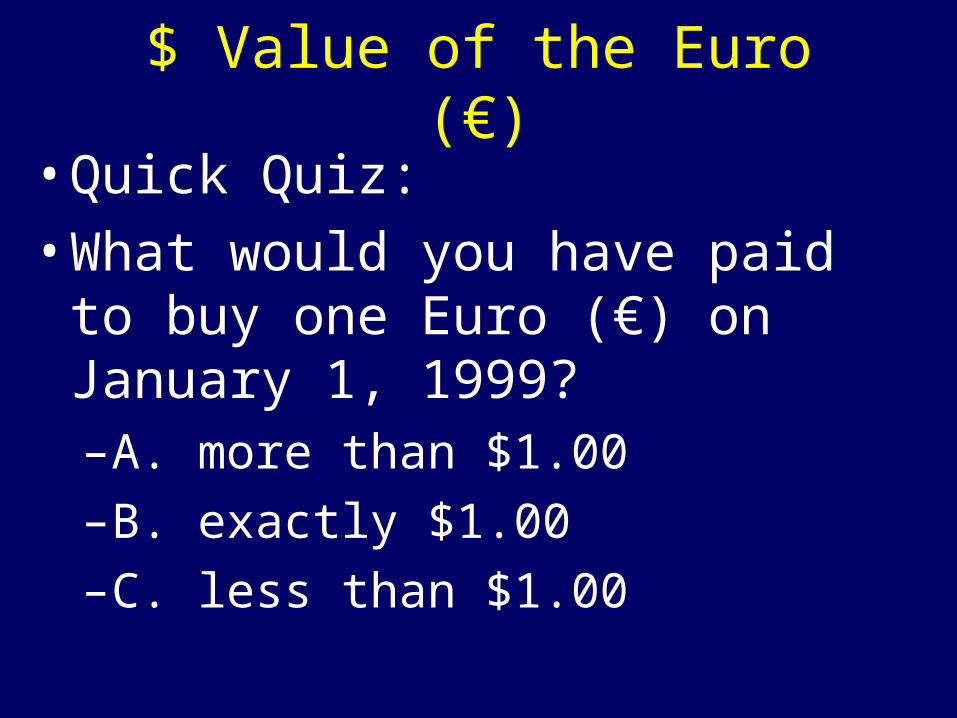
$ Value of the Euro (€)
• Quick Quiz:
• What would you have paid to buy one Euro (€) on January 1, 1999?– A. more than $1.00
– B. exactly $1.00
– C. less than $1.00
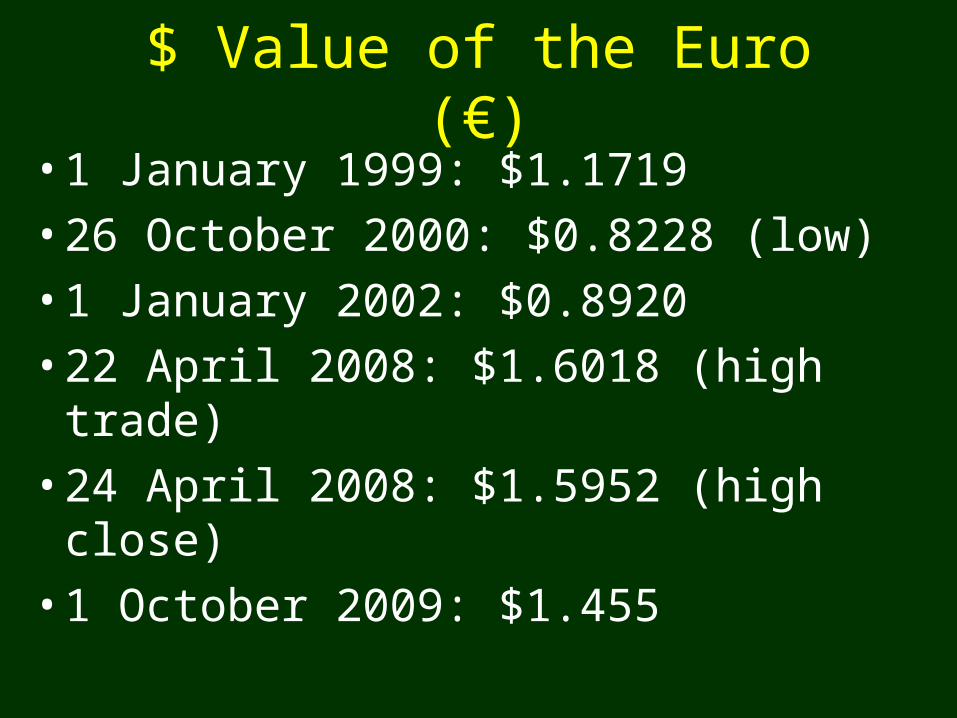
$ Value of the Euro (€)
• 1 January 1999: $1.1719
• 26 October 2000: $0.8228 (low)
• 1 January 2002: $0.8920
• 22 April 2008: $1.6018 (high trade)
• 24 April 2008: $1.5952 (high close)
• 1 October 2009: $1.455
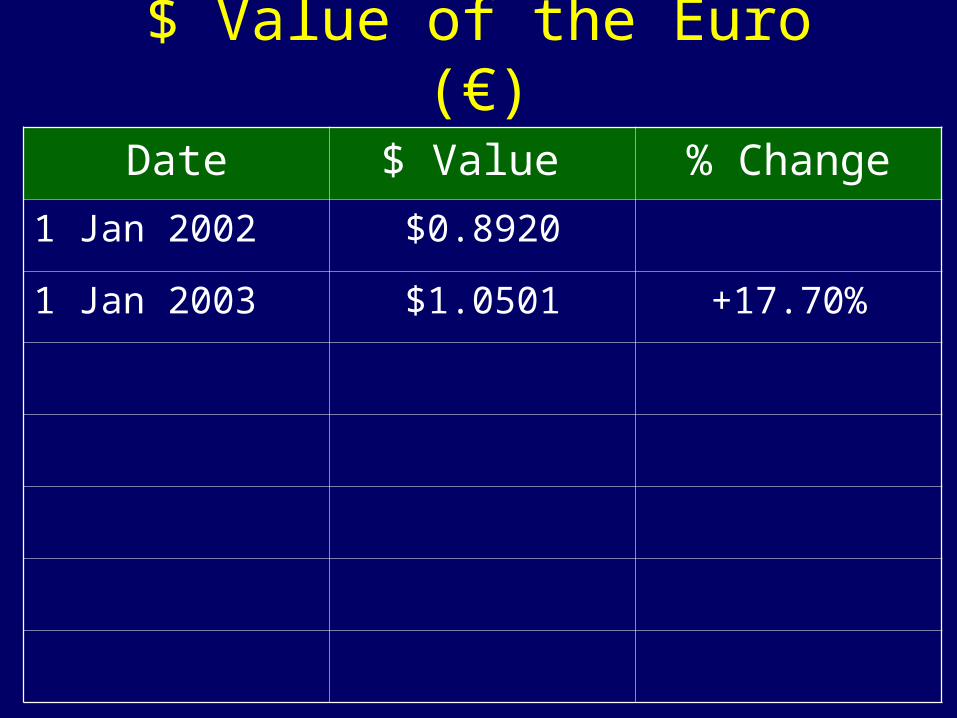
$ Value of the Euro (€)
Date $ Value % Change
1 Jan 2002 $0.8920
1 Jan 2003 $1.0501 +17.70%
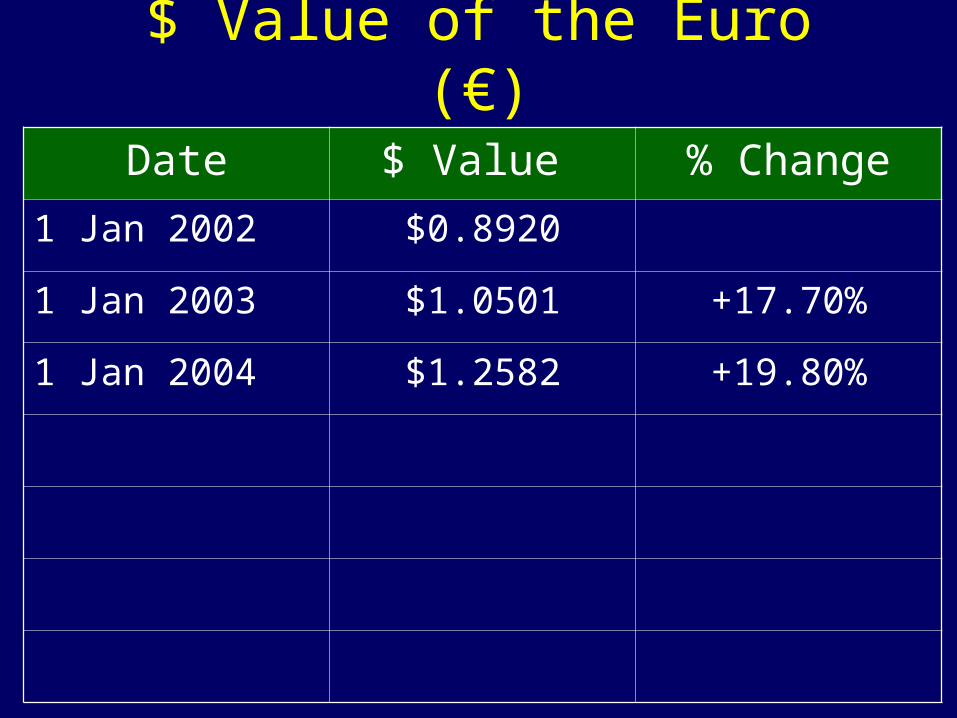
$ Value of the Euro (€)
Date $ Value % Change
1 Jan 2002 $0.8920
1 Jan 2003 $1.0501 +17.70%
1 Jan 2004 $1.2582 +19.80%
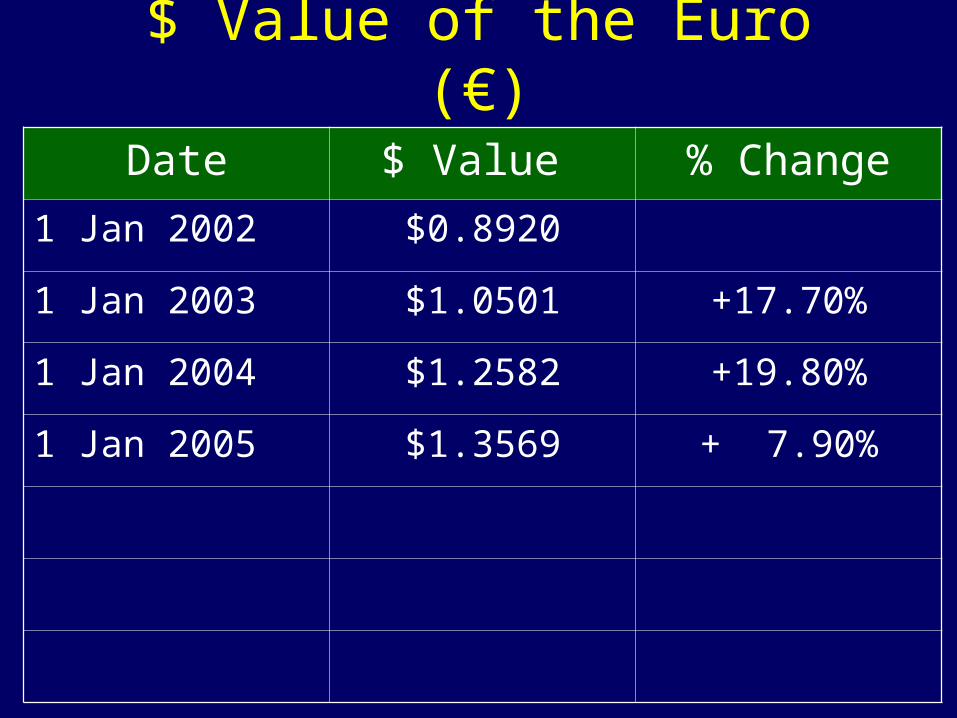
$ Value of the Euro (€)
Date $ Value % Change
1 Jan 2002 $0.8920
1 Jan 2003 $1.0501 +17.70%
1 Jan 2004 $1.2582 +19.80%
1 Jan 2005 $1.3569 + 7.90%

$ Value of the Euro (€)
Date $ Value % Change
1 Jan 2002 $0.8920
1 Jan 2003 $1.0501 +17.70%
1 Jan 2004 $1.2582 +19.80%
1 Jan 2005 $1.3569 + 7.90%
1 Jan 2006 $1.1842 - 12.73%
$ Value of the Euro (€)
Date $ Value % Change
1 Jan 2002 $0.8920
1 Jan 2003 $1.0501 +17.70%
1 Jan 2004 $1.2582 +19.80%
1 Jan 2005 $1.3569 + 7.90%
1 Jan 2006 $1.1842 - 12.73%
1 Jan 2007 $1.3203 +11.49%

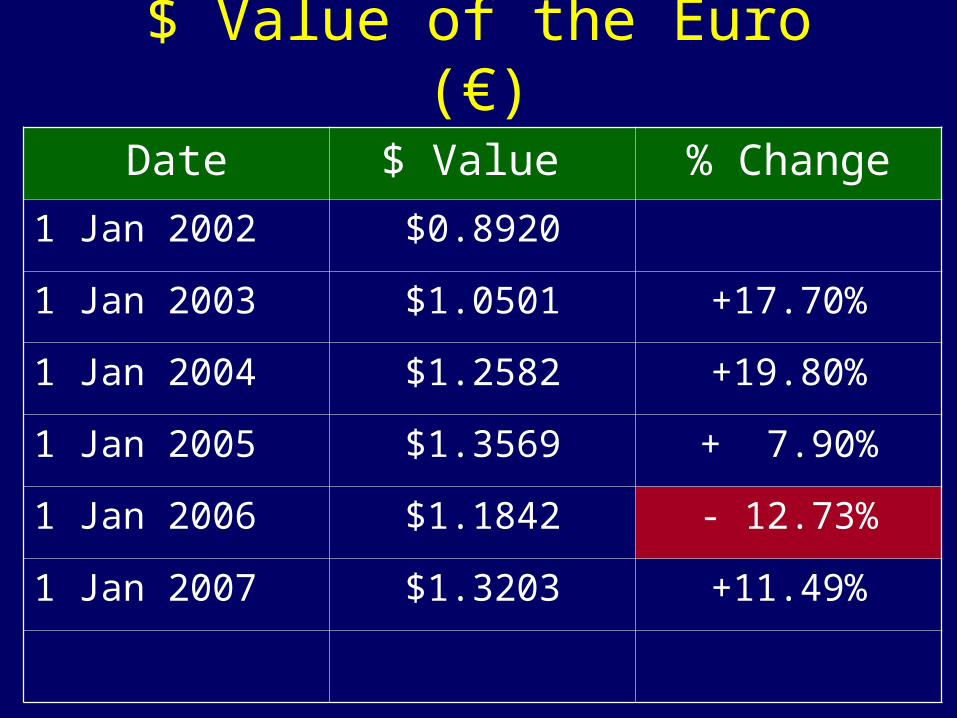
$ Value of the Euro (€)
Date $ Value % Change1 Jan 2002 $0.8920
1 Jan 2003 $1.0501 +17.70%
1 Jan 2004 $1.2582 +19.80%
1 Jan 2005 $1.3569 + 7.90%
1 Jan 2006 $1.1842 - 12.73%
1 Jan 2007 $1.3203 +11.49%
1 Jan 2008 $1.4704 +11.37%
1 Jan 2009 $1.4043 -4.49%
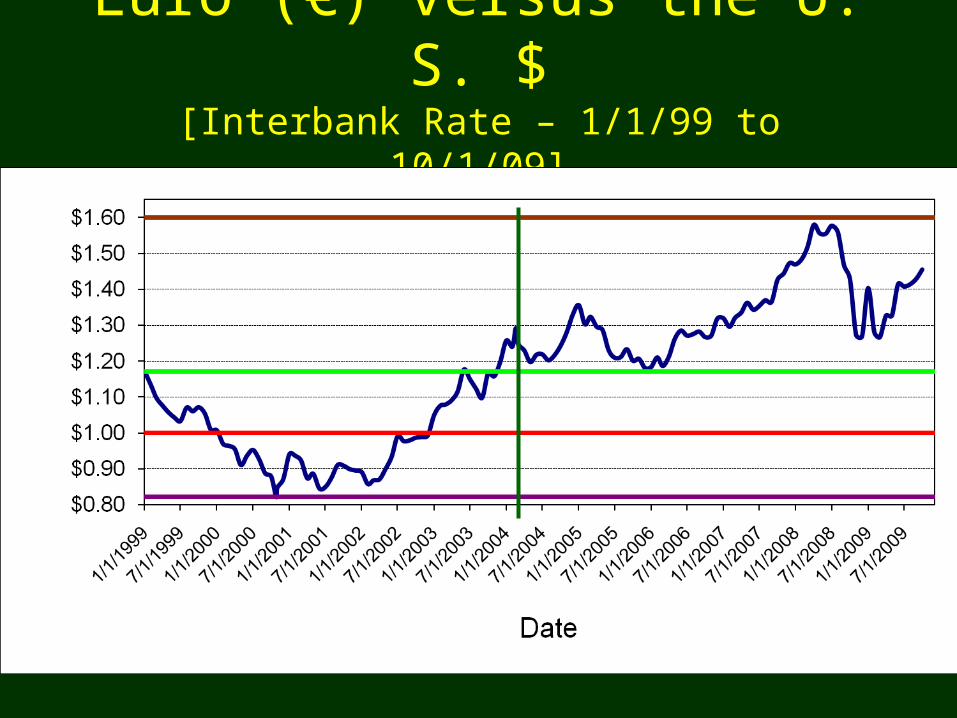
Euro (€) versus the U. S. $[Interbank Rate – 1/1/99 to 10/1/09]

Who Needs Dollars?
• People who want to …– buy U. S. goods and services
– invest in U. S. assets
– travel to the U. S.
• Anyone who wants to buy oil!
Why the weak Euro (€)?Why the strong U. S. Dollar ($)?
1. Stronger U. S. economic growth
2. Shrinking U. S. Government deficit
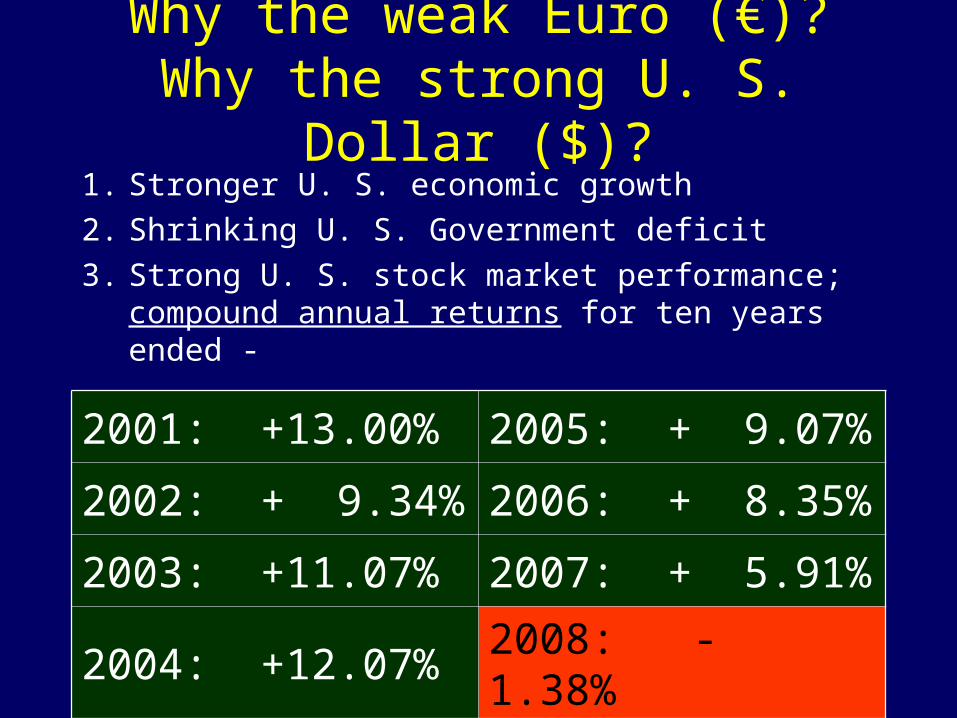
Why the weak Euro (€)?Why the strong U. S. Dollar ($)?
1. Stronger U. S. economic growth
2. Shrinking U. S. Government deficit
3. Strong U. S. stock market performance; compound annual returns for ten years ended -
2001: +13.00% 2005: + 9.07%
2002: + 9.34% 2006: + 8.35%
2003: +11.07% 2007: + 5.91%
2004: +12.07% 2008: - 1.38%
What’s Changed to Weaken the $?
• Slower U. S. growth

U. S. A. GDP Growth (%), 1993 - 2009
What’s Changed to Weaken the $?
• Slower U. S. growth
• Large U. S. government deficits
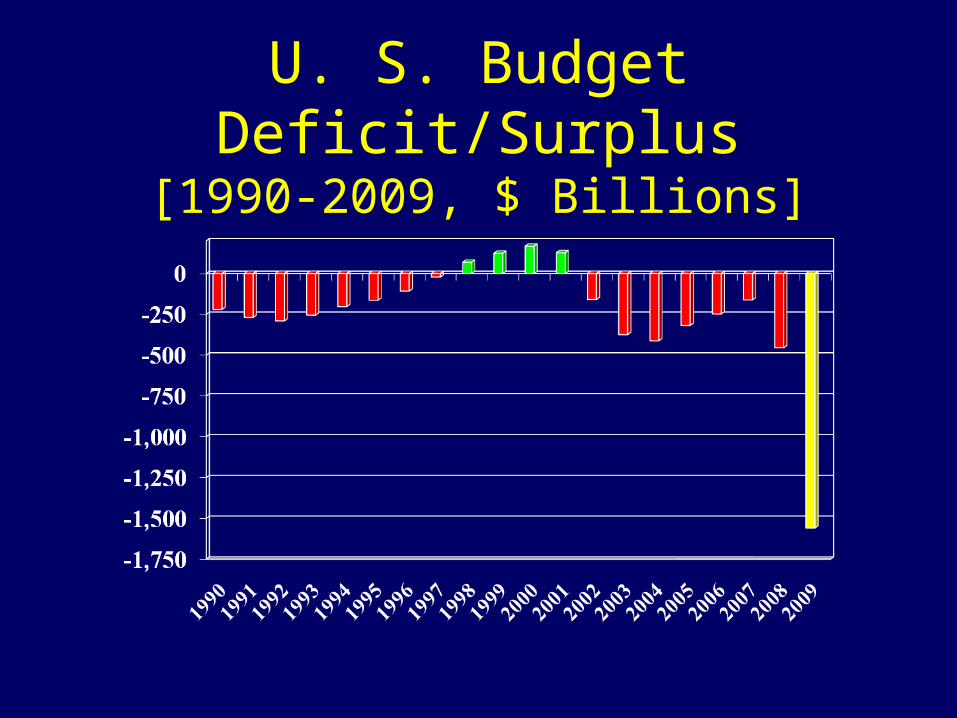
U. S. Budget Deficit/Surplus[1990-2009, $ Billions]
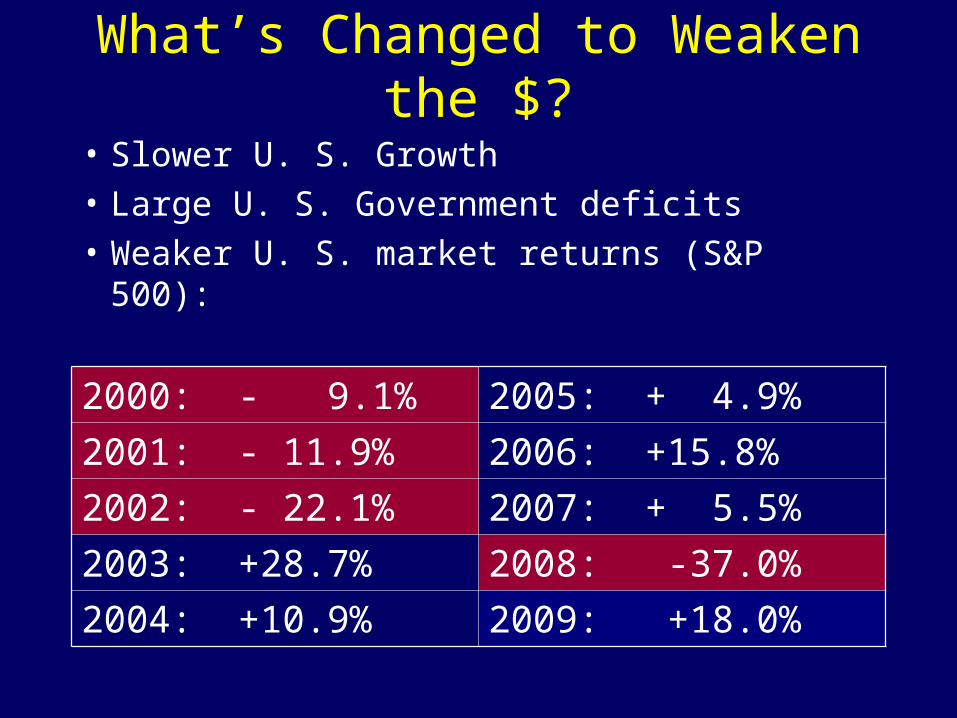
What’s Changed to Weaken the $?
• Slower U. S. Growth
• Large U. S. Government deficits
• Weaker U. S. market returns (S&P 500):
2000: - 9.1% 2005: + 4.9%
2001: - 11.9% 2006: +15.8%
2002: - 22.1% 2007: + 5.5%
2003: +28.7% 2008: -37.0%
2004: +10.9% 2009: +18.0%

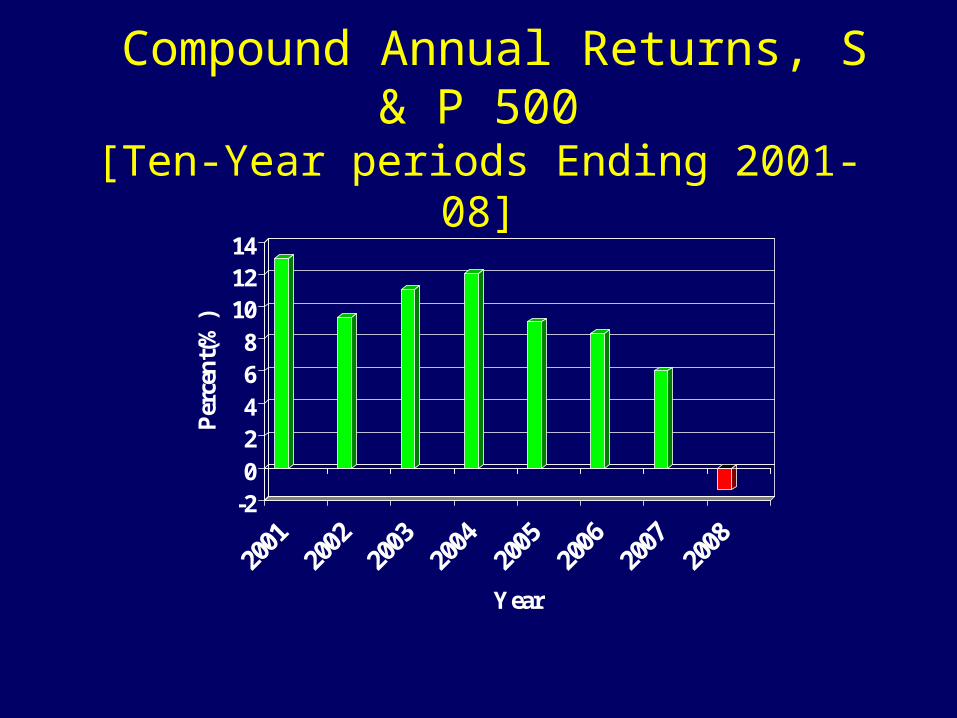
Compound Annual Returns, S & P 500[Ten-Year periods Ending 2001-08]
-202468101214
Percent(%)
2001
2002
2003
2004
2005
2006
2007
2008
Year
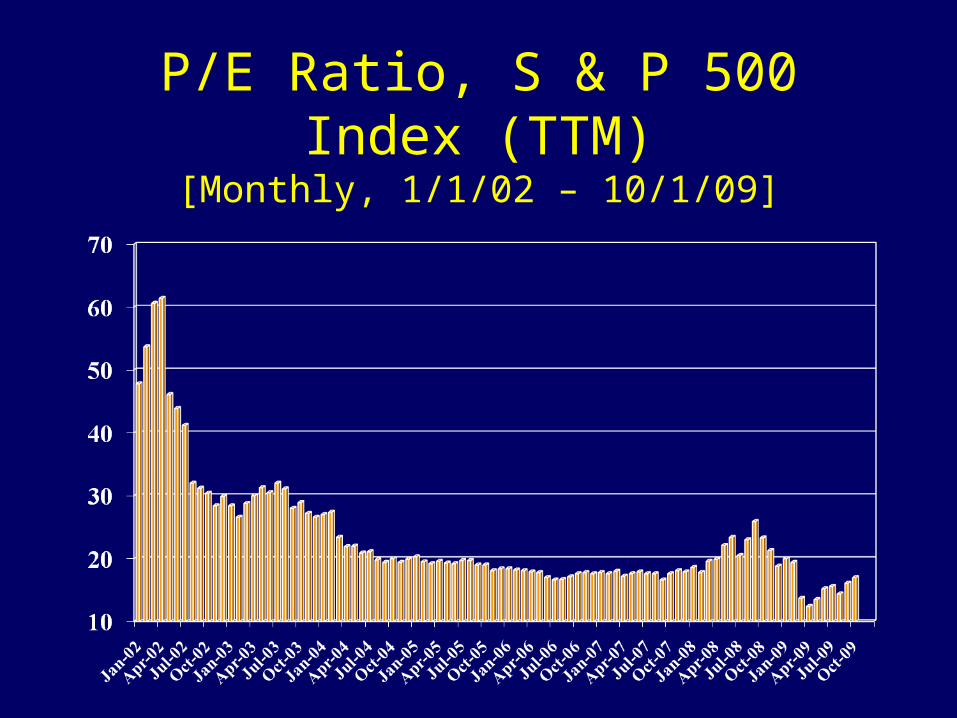
P/E Ratio, S & P 500 Index (TTM)[Monthly, 1/1/02 – 10/1/09]
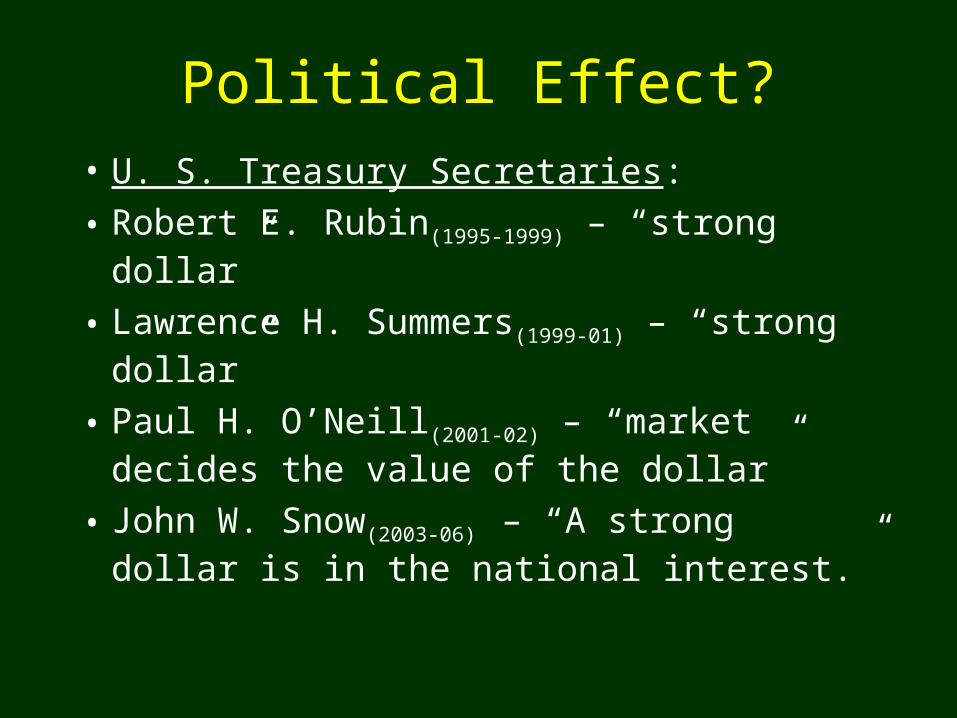
Political Effect?
• U. S. Treasury Secretaries:
• Robert E. Rubin(1995-1999) – “strong dollar”
• Lawrence H. Summers(1999-01) – “strong dollar”
• Paul H. O’Neill(2001-02) – “market decides the value of the dollar”
• John W. Snow(2003-06) – “A strong dollar is in the national interest.”

Political Effect?[U. S. Treasury Secretaries]
• Henry Paulson (2006 -2009) – “As I think you know, I believe very strongly that a strong dollar is in our nation’s interest, and I’m a big believer in currencies being set in a competitive, open marketplace.”
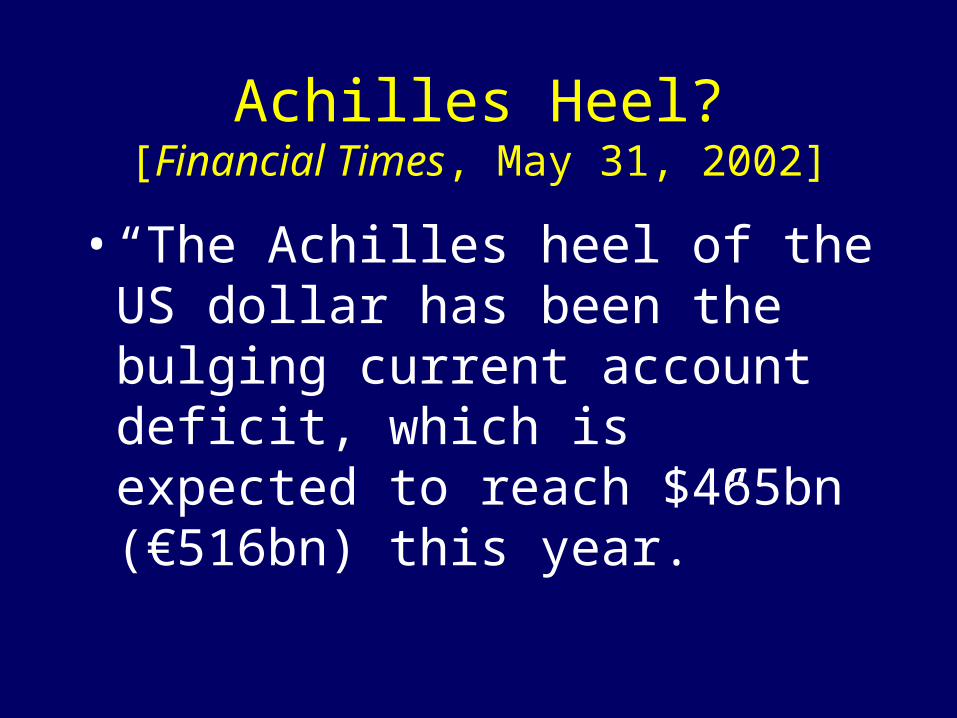
Achilles Heel?[Financial Times, May 31, 2002]
• “The Achilles heel of the US dollar has been the bulging current account deficit, which is expected to reach $465bn (€516bn) this year.”

U. S. Current Account Deficit[1998-2009, Quarterly, ($ Billions)]

Achilles Heel?[Financial Times, May 31, 2002]
• This means the US needs to attract $1.3bn in overseas funds every day to prevent the dollar from falling.”

U. S. Avg. Monthly Net Capital Inflow ($Billions, 2001-2002)
Financial Times , Friday, May 31, 2002
44
14.6
2001 2002
Year

Foreign Trade (-) and Capital Flows (+)[2005-2009; $ Billions]

Foreign Trade (-) and Capital Flows (+)[2005-2009; $ Billions]
Foreign Holdings of U. S. Treasury Securities
Source: U. S. Treasury International Capital (TIC) Reports, monthly
[www.treas.gov/tic/mfh.txt]

Total Foreign Holdings of U. S. Treasury Securities, $Bils., 2005-09
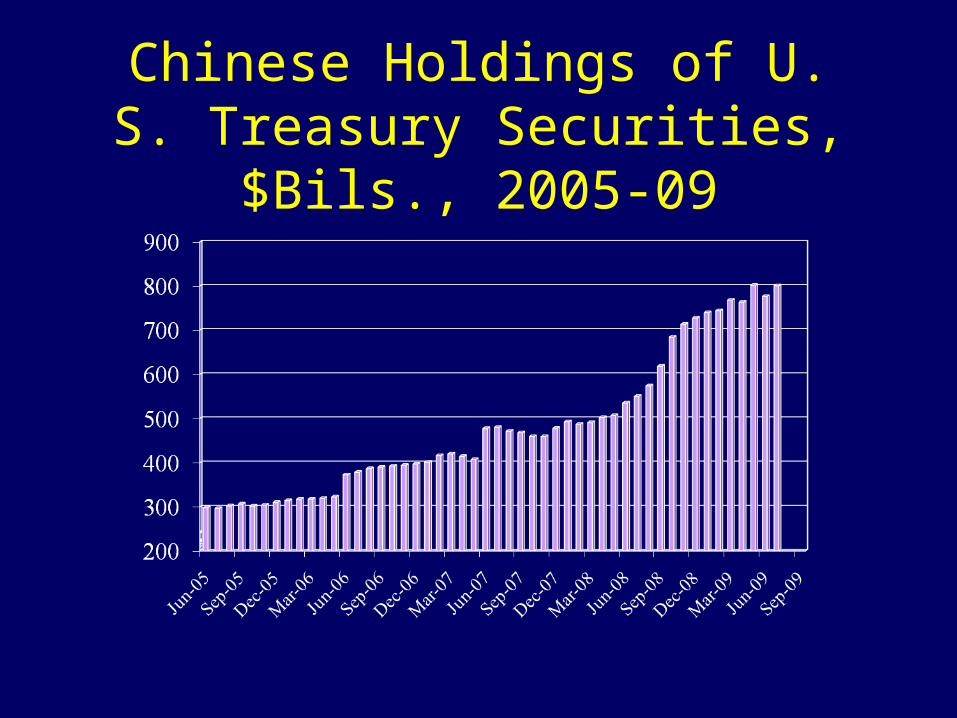
Chinese Holdings of U. S. Treasury Securities, $Bils., 2005-09

Japanese Holdings of U. S. Treasury Securities, $Bils. 2005-09
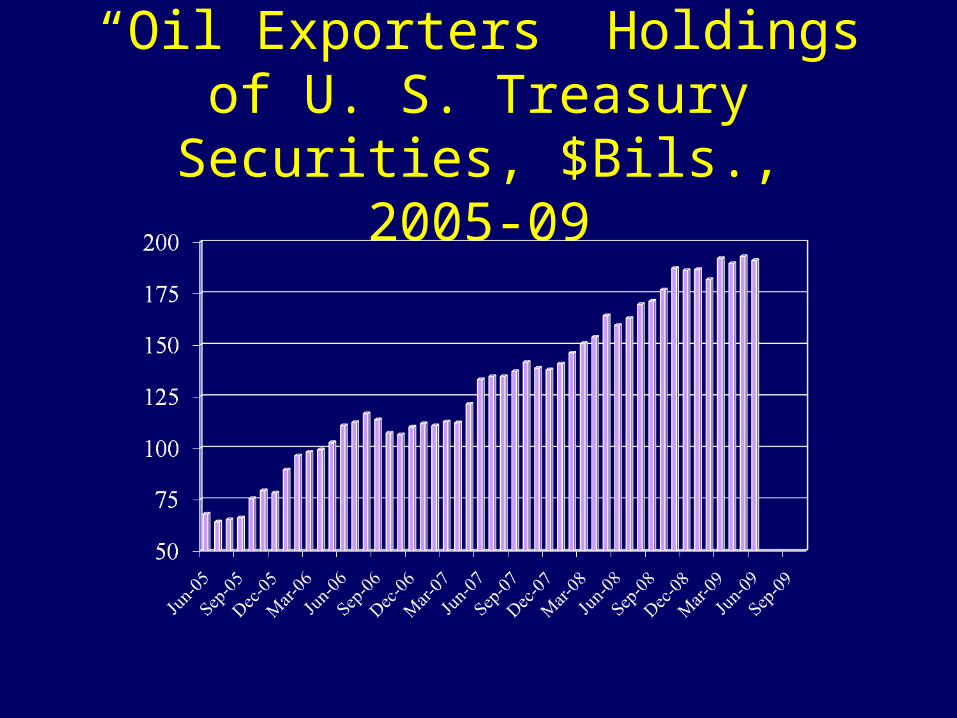
“Oil Exporters” Holdings of U. S. Treasury Securities, $Bils., 2005-09
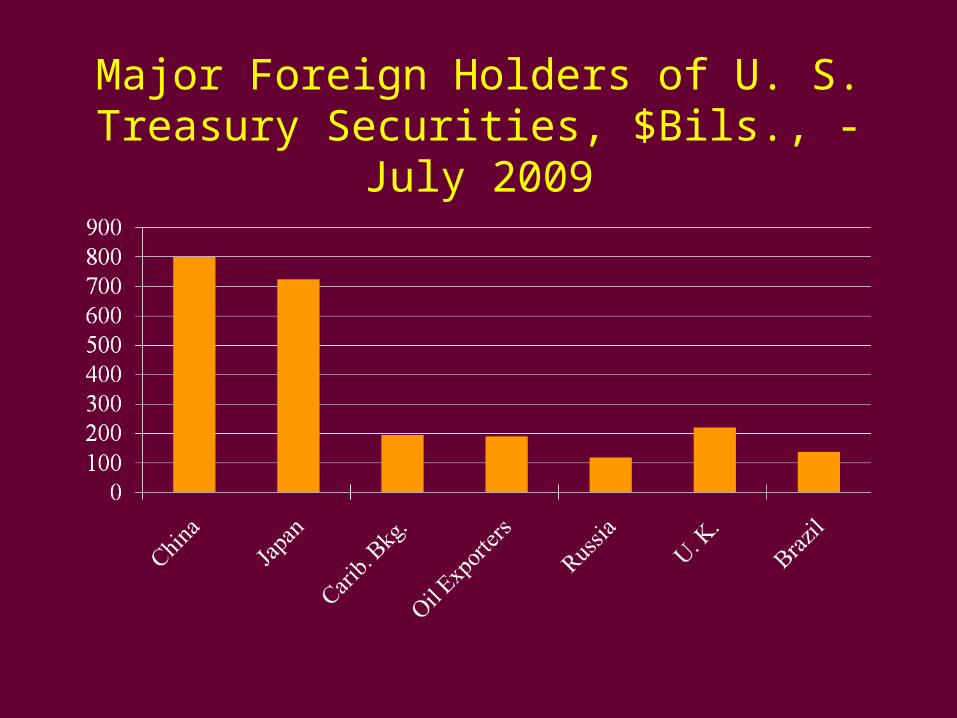
Major Foreign Holders of U. S. Treasury Securities, $Bils., - July 2009

Concerns About the US Economy?
1. Corporate governance and accounting standards (Enron; WorldCom; Xerox)
2. Productivity gains have not translated into higher corporate profitability
3. Surge in government spending …could depress economic growth

Impact of a Weaker U. S. Dollar[Disadvantages]
1. Foreign goods more expensive2. Foreign investment more
expensive3. Foreign travel more expensive4. U. S. interest rates – higher; less
foreign capital
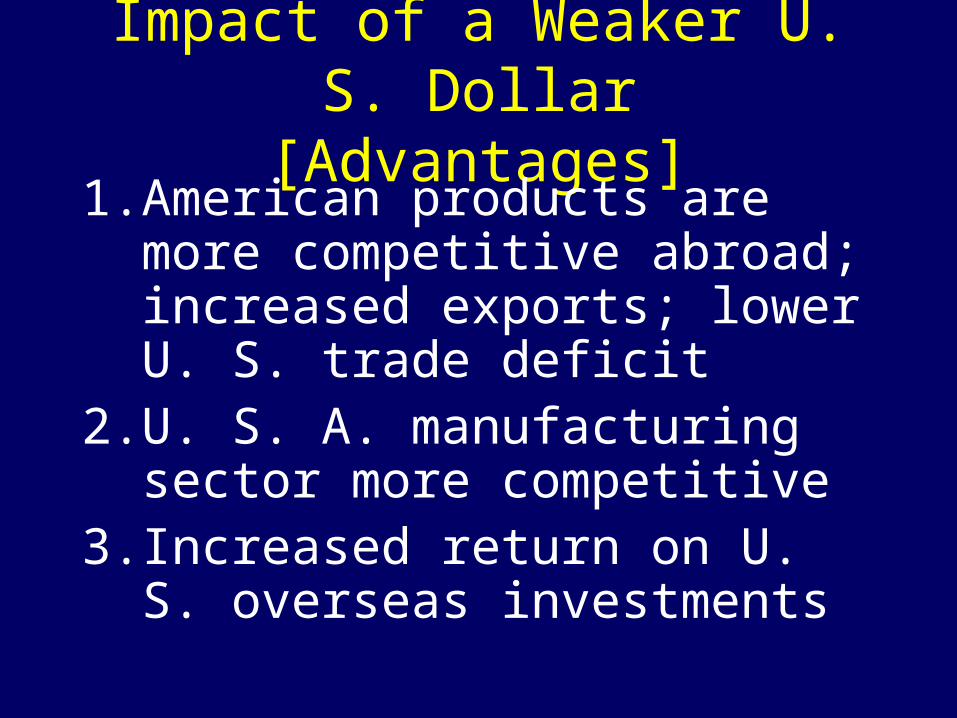
Impact of a Weaker U. S. Dollar[Advantages]
1. American products are more competitive abroad; increased exports; lower U. S. trade deficit
2. U. S. A. manufacturing sector more competitive
3. Increased return on U. S. overseas investments
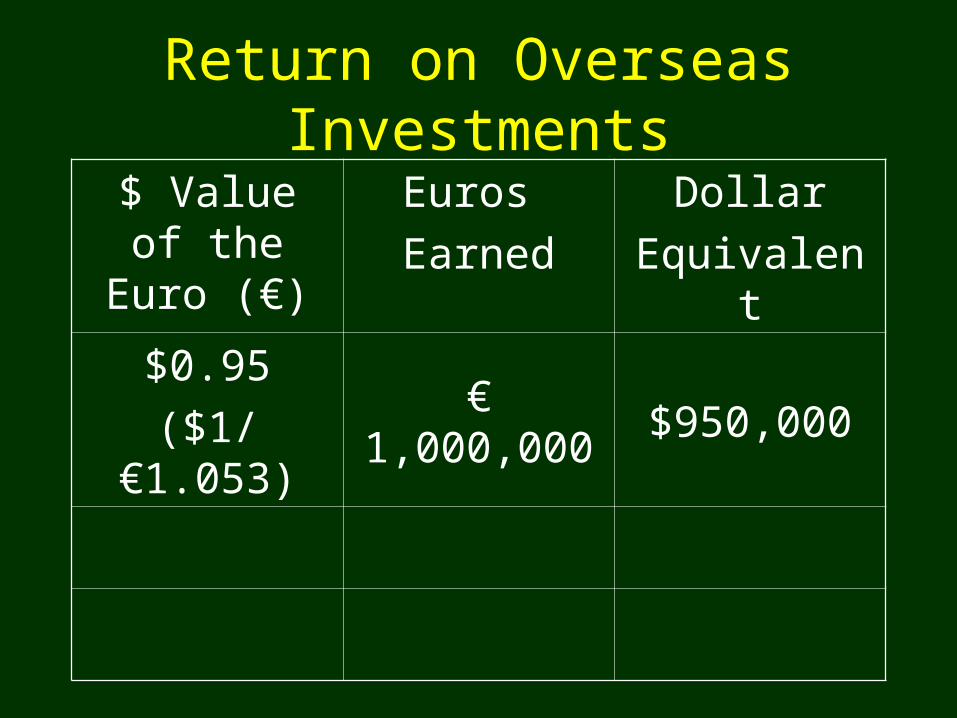
Return on Overseas Investments
$ Value of the Euro (€)
Euros
Earned
Dollar
Equivalent
$0.95
($1/ €1.053)€ 1,000,000 $950,000
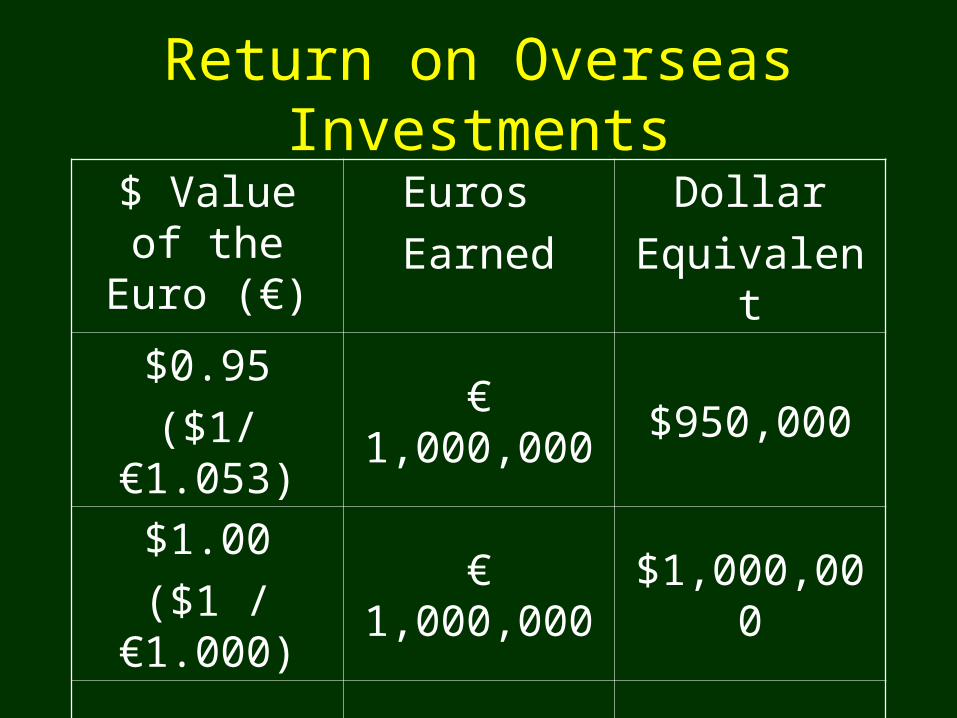
Return on Overseas Investments
$ Value of the Euro (€)
Euros
Earned
Dollar
Equivalent
$0.95
($1/ €1.053)€ 1,000,000 $950,000
$1.00
($1 / €1.000)€ 1,000,000 $1,000,000

Return on Overseas Investments
$ Value of the Euro (€)
Euros
Earned
Dollar
Equivalent
$0.95
($1/ €1.053)€ 1,000,000 $950,000
$1.00
($1 / €1.000)€ 1,000,000 $1,000,000
$1.55
($1 / €0.645)€ 1,000,000 $1,550,000

Where Do We Go From Here?
• “Dollar slips to all-time low ($1.3667) vs. Euro”
– Associated Press– December 31, 2004
• “Bears are betting on a decline in the dollar.”
– Barron’s– August 21, 2006
Where Do We Go From Here?
• “OFF THE CHARTS; Dollar Sinks the Lowest Since It Started to Float”
– The New York Times
– September 22, 2007
• “Fear of European Slump As Currency Sets Record”
– The New York Times
– September 22, 2007

Where Do We Go From Here?
• “As Dollars Pile Up, Uneasy Traders Lower the Currency’s Value”
– The New York Times– May 23, 2009


