45
The UK Solar Market & PV Products Barry Marsh – UK Country Manager
| Date post: | 16-Dec-2015 |
| Category: |
Documents |
| Upload: | melvyn-lewis-lester |
| View: | 215 times |
| Download: | 2 times |

The UK Solar Market & PV ProductsThe UK Solar Market & PV ProductsBarry Marsh – UK Country Manager
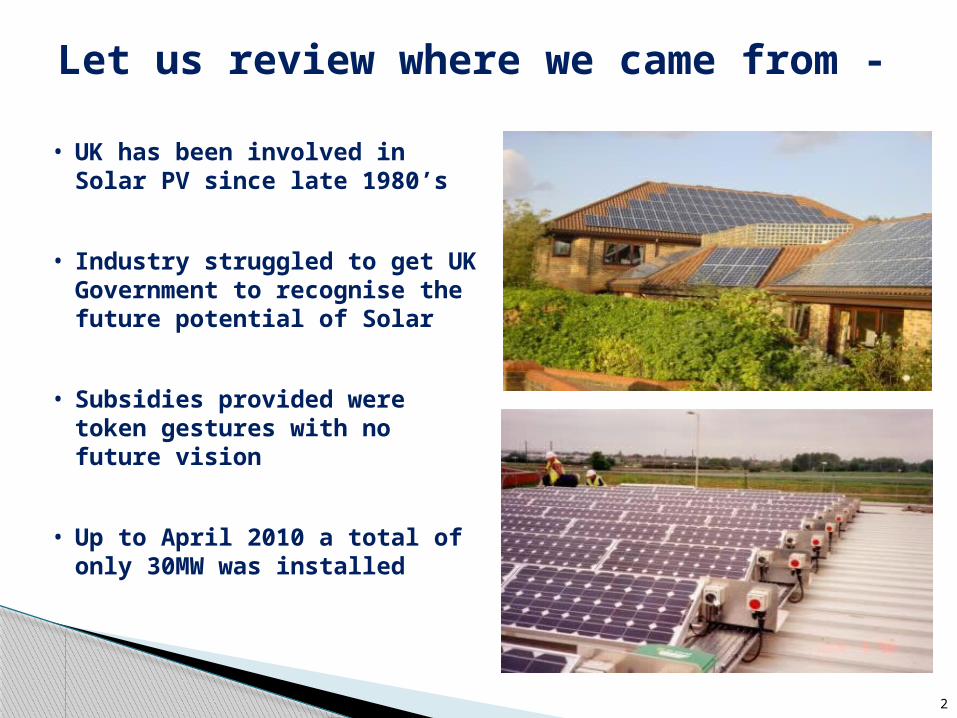
• UK has been involved in Solar PV since late 1980’s
• Industry struggled to get UK Government to recognise the future potential of Solar
• Subsidies provided were token gestures with no future vision
• Up to April 2010 a total of only 30MW was installed
2
Let us review where we came from -

• We designed and demonstrated the use of PV as a building material in the 1990’s
• Government supported this approach
3
UK developed BIPV

• Government saw this as being a Domestic program but with a installation size limit of 5MW!
• Government forgot about their BIPV strategy!
• Government were surprised by the interest and innovation of offers.
• In the first year the installations exceeded predictions by 50%
4
Finally in April 2010 we got a FIT

• Large Solar Roofs and Fields were built / planned
• Government excluded them from August 2011
• Industry moved to 50kW projects
5
Well, they did set a 5MW limit!
6
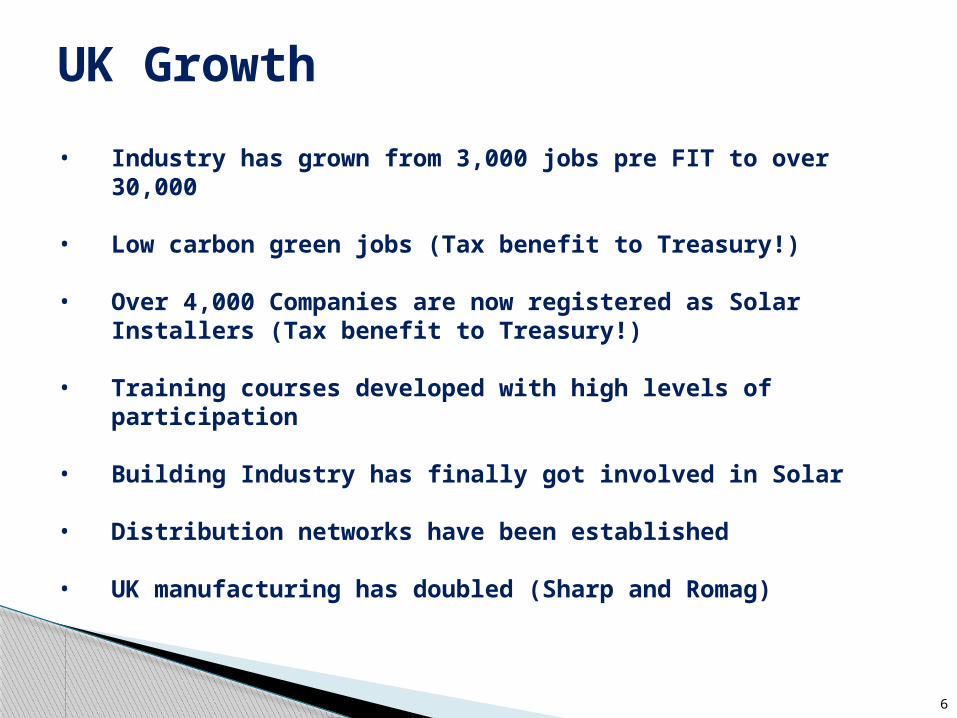
The UK Growth
• Industry has grown from 3,000 jobs pre FIT to over 30,000
• Low carbon green jobs (Tax benefit to Treasury!)
• Over 4,000 Companies are now registered as Solar Installers (Tax benefit to Treasury!)
• Training courses developed with high levels of participation
• Building Industry has finally got involved in Solar
• Distribution networks have been established
• UK manufacturing has doubled (Sharp and Romag)
UK Growth

7
The UK Growth
• MCS at times has struggled to keep up with the growth in product and the rate of installer applications
• REAL increased staffing numbers to handle the enquiries (and stop the Cowboys!)
• Utilities struggled to understand rate of connection and to process the FIT applications
• Ofgem struggled to keep up with registrations
• The Press however no longer considered the Solar Industry to be the green sandal brigade – we are now, at last, a
credible energy industry
UK Growth

8
Industry should congratulate itself!
• No matter what changes Government made to the FIT during the last year we adapted and got on with delivering
• Large Scale Fast Track Review – Industry showed you could deliver 5MW Fields in 6 weeks and 1MW Roofs in 4 weeks
• Loophole Closure – Industry showed you could deliver 5MW Fields in 4 weeks
• December 12th created, yet another “gold rush”, with over 100MW / week being installed generally on Domestic installs
• March 7th another goldrush
• June 30th – another goldrush?
Industry should congratulate itself

9
Industry should congratulate itself!
• Government told industry told to concentrate on Small Scale Domestic industry, time for an install reduced from 3 days to 1 day
• Government surprised by the amount of generation capacity Solar added to the grid, faster than any other technology
• Many customers are very happy as their system is generating more than predicted (10 -25%)
• Many customers have changed their behaviour to the use of energy as a result of having PV.
Industry should congratulate itself

• Little previous evidence of generation from PV in the UK
• Design programs tend to produce conservative results
• Reports of systems generating 10 – 20% more than predicted
• Latest Met Office map provides more detail
• FIT claims will provide true evidence of performance
10
PV performance in the UK

• Around 250,000 installations since the introduction of the FIT now 1.15GWp, Ofgem only records 883MWp
• Around 70% (by capacity) of the installations are Domestic installs
• By end of March 2012 around 1.3GWp will have been installed
11
Present situation

FIT comparison to January 2012
12
MW
AD Hydro Micro CHP Photovoltaic Wind0
200
400
600
800
1000
1200Installed Capacity (MW) (from Jan 2012)
13
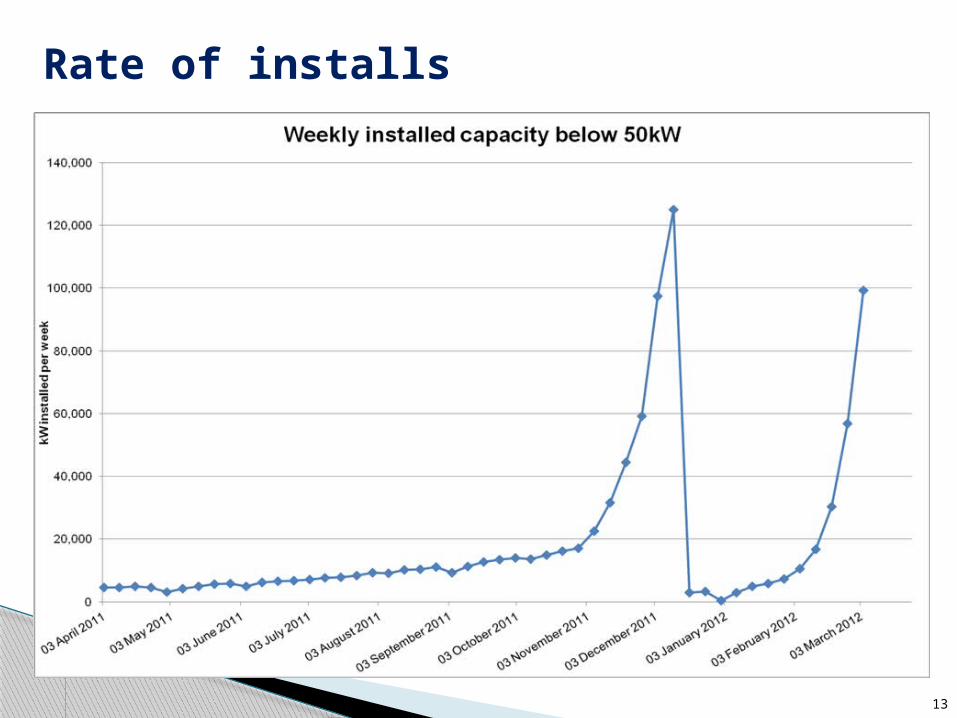
Rate of installs

Date DECC New Cumulative Actual New Cumulative
31/03/2011 51MW 51MW 78MW 78MW
31/03/2012 86MW 137MW 1075MW* 1153MW*
31/03/2013 147MW 284MW
31/03/2014 249MW 533MW
31/03/2015 299MW 832MW
What did DECC expect!• Despite incorrect Budget put forward to the CSR – Treasury will not
allow it to be corrected
• The Minister always said we had to keep to the budget (£860m)
• This is why the STA had called for a 25% cut in June 2011
• We needed to deliver a sustainable industry
9
*To Date
14

What happened?Costs driven down Demand driven up
Modules
• Technology• Mass production techniques
BOS
• Alternatives• Technology
Labour
• Familiarity• Efficiency
• Domestics
• Power Parks
• Commercial
Industry sectors working together to achieve a common aim
15

Bankability – function of reliabilityBankability – function of reliability
Bankability
Technology
ConstructionQuality
Financial Stability
LegalWarranties
Environment
Operation
16
LDK Solar CompanyLDK Solar Company
17
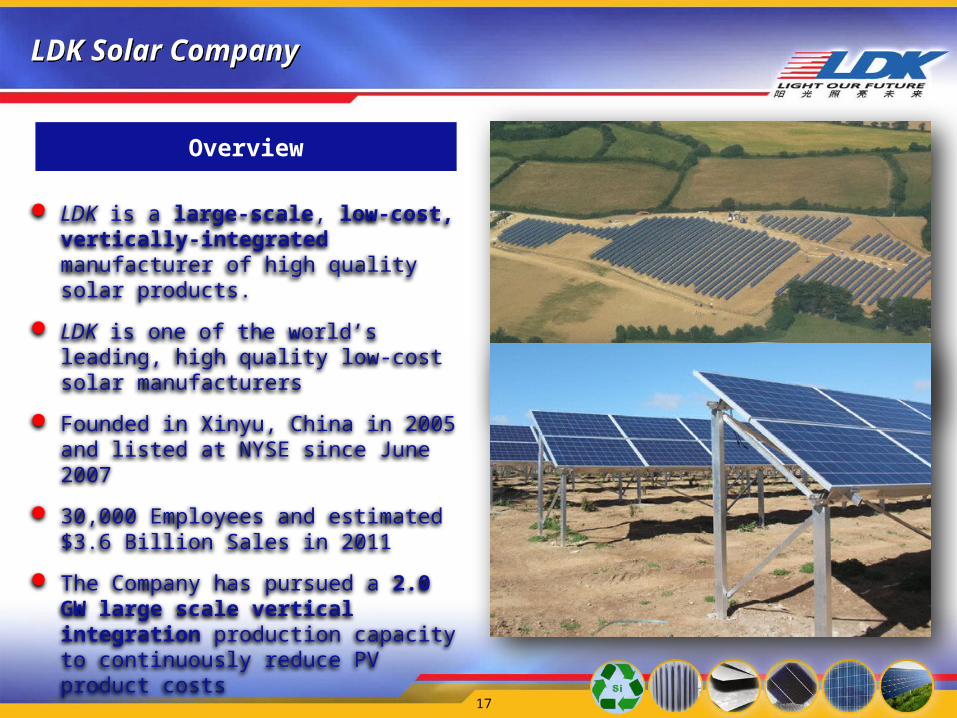
LDK is a large-scale, low-cost, vertically-integrated manufacturer of high quality solar products.
LDK is one of the world’s leading, high quality low-cost solar manufacturers
Founded in Xinyu, China in 2005 and listed at NYSE since June 2007
30,000 Employees and estimated $3.6 Billion Sales in 2011
The Company has pursued a 2.0 GW large scale vertical integration production capacity to continuously reduce PV product costs
Overview

LDK Solar CompanyLDK Solar Company
18
Demonstrates Leadership in PV Manufacturing Worldwide
2.0GW Vertically Integrated Solar Manufacturer
Proven Cost Reduction Roadmap
Strong and Diversified Customer Base
Key Strengths
Sustainable and Attractive Growth strategy
Strong Financial support from Chinese Bank

Sand to PV Module – ‘in-house’
Sand to PV Module – ‘in-house’
Silicone Wafer
Silicone Ingot
PV Module componentsPV Module components
PV Cell
PV Module
PV System
Silicone recycling
19

Diversified and High-Quality Customer BaseDiversified and High-Quality Customer Base
20
LDK supplies leading solar companies with PV products around the world
Canada
Czech Republic
HHI-KOMAX
Japan
India
Taiwan
France
U.S.
Belgium
Greece
Big Solar
Australia
KOMEX
Korea
Netherlands Germany
Portugal
Spain
China
“Golden Sun” Projects Wafer Customers
Module Customers
Polysilicon Customers Italy

LDK’s Grid Parity RoadmapLDK’s Grid Parity Roadmap
21

V2 - November 2011 - © LDK Solar Co., Ltd. All rights reserved. E.&O.E.
LDK Solar PV Modules QualityLDK Solar PV Modules Quality
22
• 0/+5 Wp power classification
• 10 years warranty on materials, 25 years warranty on the output power
• High conversion efficiency
• Ability to withstand high wind and snow, under extreme operating temperature variations
• Rigorous quality control meeting the highest international standards
• manufactured using high-quality certified components
MANUFACTURED UNDER STRINGENT QUALITY STANDARDS
LDK Solar PV Modules CertificationsLDK Solar PV Modules Certifications
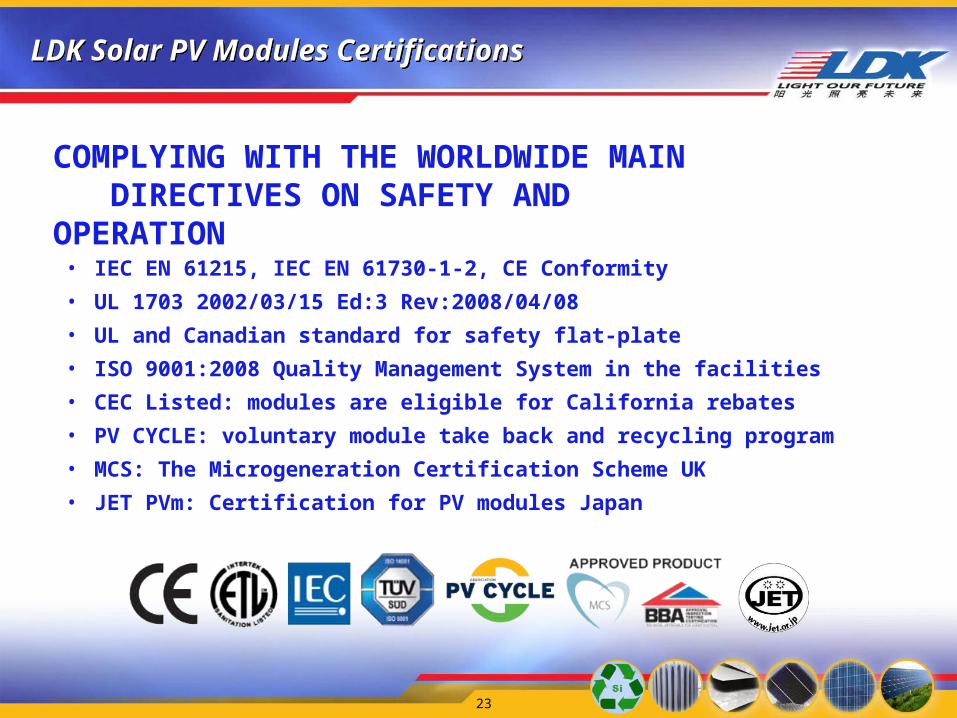
23
• IEC EN 61215, IEC EN 61730-1-2, CE Conformity
• UL 1703 2002/03/15 Ed:3 Rev:2008/04/08
• UL and Canadian standard for safety flat-plate
• ISO 9001:2008 Quality Management System in the facilities
• CEC Listed: modules are eligible for California rebates
• PV CYCLE: voluntary module take back and recycling program
• MCS: The Microgeneration Certification Scheme UK
• JET PVm: Certification for PV modules Japan
COMPLYING WITH THE WORLDWIDE MAIN DIRECTIVES ON SAFETY AND OPERATION

LDK Solar environmentally friendly PV modulesLDK Solar environmentally friendly PV modules
24
SINCE THE BEGINNING OF 2010, LDK SOLAR IS A PROUD MEMBER OF THE PV CYCLE ORGANIZATION
LDK Solar is committed to finding new ways to make its solar modules more and more environmentally friendly.
As a full member of the non-profit PV CYCLE association, LDK Solar is committed to establishing a voluntary
Program for free pickup and recycling at the end-of-life of solar modules.
This activity will minimize pollution and waste and will allow the recycling of useful raw materials for the production of new modules

Government Response to Consultation on Comprehensive Review Phase 1 – Tariffs for solar PV
Consultation on Comprehensive Review Phase 2A: Solar PV cost control◦ Closing date 3rd April 2012
Consultation on Comprehensive Review Phase 2B: Tariffs for non-PV technologies and scheme administration issues◦ Closing date 26th April 2012
25
Consultation Documents

• From the 1st April 2012 domestic and non-domestic buildings will have to hold a level D EPC – if not lower tariff of 9p will apply
• No transitional arrangements
• Buildings that are outside scope of EPC will be exempt from the energy efficiency requirement (await Ofgem guide)
• If building is outside scope of EPC but is connected to a building that is within scope e.g. a farmhouse, then the connected building will need to meet level D
◦ Buildings within scope of an EPC defined by the Energy Performance of Buildings Directive “a roofed construction having walls, for which energy is used to condition the indoor climate; a building may refer to the building as a whole or parts thereof that have been designed or altered to be used separately”
26
Energy Efficiency
• Tariff period for solar PV could be reduced from 25 to 20 years, which would bring it in line with other technologies
• Asking whether index linking of tariffs should: Be removed, Be changed from RPI to CPI
• Decision on PV may be applied to all technologies
• Export tariff could be increased, but still collecting evidence. If increased, generation tariff likely to be reduced to compensate
• Tariffs drop below 2 ROC - await outcome of the RO Banding Review to see whether solar PV will still get continue to get 2 ROCs from 2013
27
Other cost control proposals

• DECC new staff and recognise the benefit of Solar
• Found an additional £1.1bn to 2014/15 to keep FIT
• Aspiration by Government to see 22GW of PV installed by 2020 (4.5GW by end of 2014/15 FIT year) – but only if costs come down
• Linked to aggressive cost reduction – particularly PV – where tariff will be based on a 4.5% - 8% return rather than absolute 4.5%
• Cap of 21p kWh set as maximum tariff for any FIT technology
• Link between energy efficiency standard and receipt of a full tariff (initially PV) has been established
• Base level tariffs will not be increased with RPI post April 2012 increase
So tariff options are:-
28
Context

29
FIT TABLE To March 3rd
To June 30th
From July 1st (A)
From July 1st (B)
From July 1st (C)
4kW or less (newbuild)
37.8p
21.0p 13.6p 15.7p 16.5p
4kW or less(retrofit)
43.3p
21.0p 13.6p 15.7p 16.5p
4 – 10kW 37.8p
16.8p 10.9p 12.6p
13.2p
10 – 50kW 32.9p
15.2p 9.9p 11.4p
11.9p
50 – 100kW 19p 12.9p 7.7p 9.7p 10.1p
100 – 150kW
19p 12.9p 7.7p 9.7p 10.1p
150 – 250kW
15p 12.9p 5.8p 8.0p 10.1p
250kW – 5MW
8.5p 8.9p 4.7p 6.8p 7.1p
Stand alone 8.5p 8.9p 4.7p 6.8p 7.1p• A if 200MWp exceeded in March and April 2012• B if between 150 – 200MWp • C if less than 150MW• Below 9p/kWh move to 2ROC’s

30
Option ABand Tariff
Pt1 April 2012
Tariff Pt 2July 2012
TariffPt 3Oct2012
TariffPt 4Apr2013
TariffPt 5Oct2013
TariffPt 6Apr2014
TariffPt 7Oct2014
TariffPt 8Apr2015
< 4kW 21p 13.6p
12.9p
11.6p
10.4p
9.4p 8.5p 7.7p
4 – 10kW
16.8p
10.9p
10.4p
9.4p 8.5p 7.7p 6.9p 6.2p
10 – 50kW
15.2p
9.9p 9.4p 8.5p 7.7p 6.9p 6.2p 5.6p
50 -150kW
12.9p
7.7p 7.3p 6.6p 5.9p 5.3p 4.8p 4.3p
150-250kW
12.9p
5.8p 5.2p 4.7p 4.2p 3.8p 3.4p 3.0p
250 -5MW
8.9p 4.7p 4.7p 4.1p 3.7p 3.3p 3.0p 2.7p
Stand alone
8.9p 4.7p 4.7p 4.1p 3.7p 3.3p 3.0p 2.7p

31
Option BBand Tariff
Pt1 April 2012
Tariff Pt 2July 2012
TariffPt 3Oct2012
TariffPt 4Apr2013
TariffPt 5Oct2013
TariffPt 6Apr2014
TariffPt 7Oct2014
TariffPt 8Apr2015
< 4kW 21p 15.7p
14.9p
13.4p
12.1p
10.9p
9.8p 8.8p
4 – 10kW
16.8p
12.6p
12.0p
10.8p
9.7p 8.7p 7.8p 7.0p
10 – 50kW
15.2p
11.4p
10.8p
9.7p 8.7p 7.8p 7.0p 6.3p
50 -150kW
12.9p
9.7p
9.2p 8.3p 7.5p 6.8p 6.1p 5.5p
150-250kW
12.9p
8.0p
7.6p 6.9p 6.2p 5.6p 5.0p 4.5p
250 -5MW
8.9p 6.8p
6.5p 6.0p 5.4p 4.9p 4.4p 4.0p
Stand alone
8.9p 6.8p
6.5p 6.0p 5.4p 4.9p 4.4p 4.0p

32
Option CBand Tariff
Pt1 April 2012
Tariff Pt 2July 2012
TariffPt 3Oct2012
TariffPt 4Apr2013
TariffPt 5Oct2013
TariffPt 6Apr2014
TariffPt 7Oct2014
TariffPt 8Apr2015
< 4kW 21p 16.5p
15.7p
14.1p
12.7p
11.4p
10.3p
9.3p
4 – 10kW
16.8p
13.2p
12.5p
11.3p
10.2p
9.2p
8.3p
7.5p
10 – 50kW
15.2p
11.9p
11.3p
10.2p
9.2p
8.3p
7.5p
6.8p
50 -150kW
12.9p
10.1p
9.6p
8.6p
7.7p
6.9p
6.2p
5.6p
150-250kW
12.9p
10.1p
9.6p
8.6p
7.7p
6.9p
6.2p
5.6p
250 -5MW
8.9p
7.1p
6.7p 6.0p
5.4p
4.9p
4.4p
4.0p
Stand alone
8.9p
7.1p
6.7p 6.0p
5.4p
4.9p
4.4p
4.0p

• Option C is the best we will get – 16.5p/kWh band
• Move to 2ROC’s as soon 9.0p reached (but how long 2013?)
• Export Tariff should be increased (minimum of 5p)
• Installed pricing may not drop at rate predicted by DECC and industry could stall - DECC must cater for this.
• Industry may have to accept 20 year (like ROC’s)
• Clarity on Level D – eg ground mount / barn next to building
• Do not accept no index link (otherwise no investors)
• Clarity on Community Model / Social Housing
• DECC must add Solar to Roadmap (22GW by 2020)
• DECC must work with Solar Industry - need time to adapt
How should we respond?
33

• With the 16.5p/kWh tariff and 5p/kWh export, the domestic customer, with money in the bank, will still get a reasonable return and protect himself from part of future electricity prices rises
• May work if customer borrows the money
• Will Free Solar still work?
What will work? – Domestics?
34

• If 80% aggregation of tariff applied Social Housing and Community projects may NOT work
• If 16.5p/kWh and 5p/kWh offered it will just work, but is very tight and only in the better parts of the UK using a not for profit type arrangement
• Client may have his own funding
What will work? – Social Housing?
35

• With the 11.9p/kWh and the customer using the electricity in the better parts of the UK this will work if the customer has the money or raises his own finance, depending on the EPC band of the building
• Barns will work if they are exempt from EPC!
What will work? – Commercial Roofs?
36

• Ground mounted solar fields using 2ROC’s will work in the better areas of the UK – South!
• Funding sources will have to be long term investors
• Negotiated export electricity will need to be at 6p/kWh
• Selling to a customer through a PPA may attract a slightly higher tariff
What will work? – Fields?
37
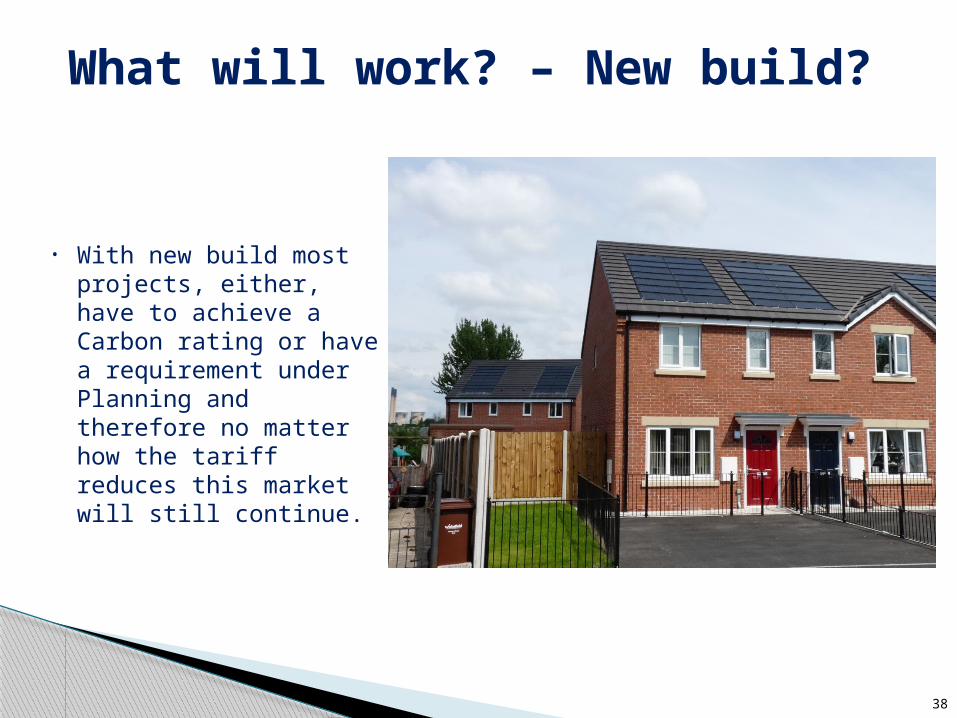
• With new build most projects, either, have to achieve a Carbon rating or have a requirement under Planning and therefore no matter how the tariff reduces this market will still continue.
What will work? – New build?
38
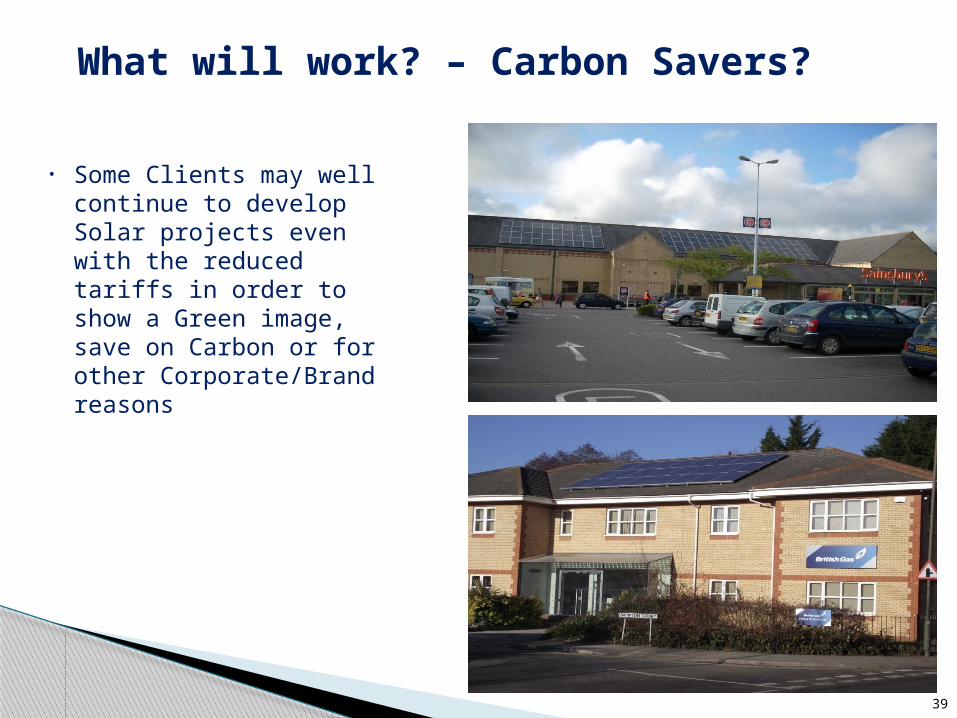
• Some Clients may well continue to develop Solar projects even with the reduced tariffs in order to show a Green image, save on Carbon or for other Corporate/Brand reasons
What will work? – Carbon Savers?
39
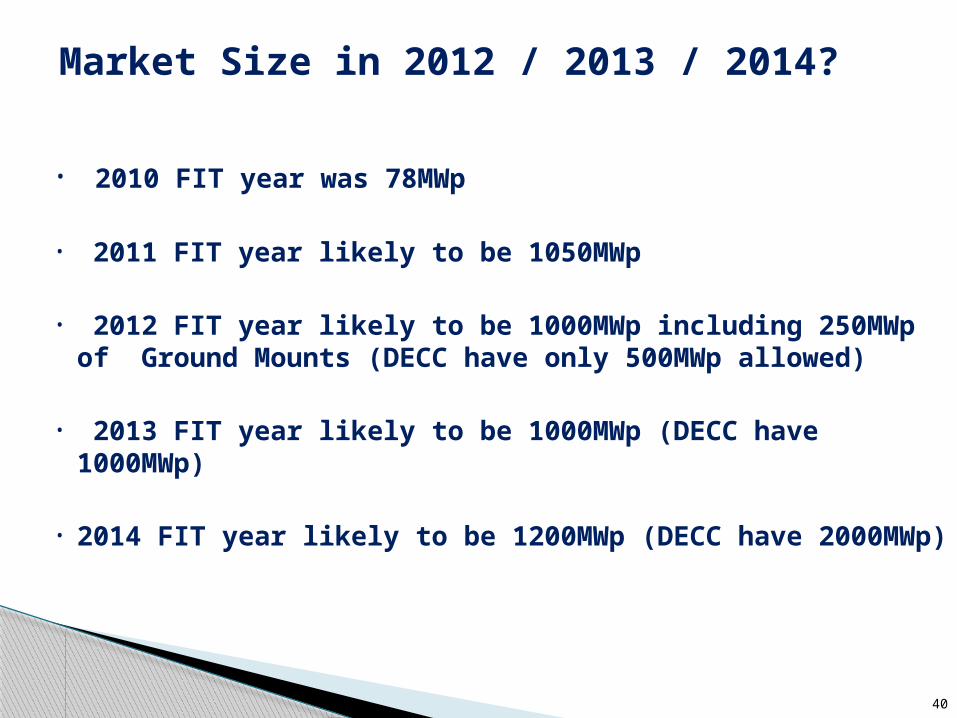
• 2010 FIT year was 78MWp
• 2011 FIT year likely to be 1050MWp
• 2012 FIT year likely to be 1000MWp including 250MWp of Ground Mounts (DECC have only 500MWp allowed)
• 2013 FIT year likely to be 1000MWp (DECC have 1000MWp)
• 2014 FIT year likely to be 1200MWp (DECC have 2000MWp)
Market Size in 2012 / 2013 / 2014?
40

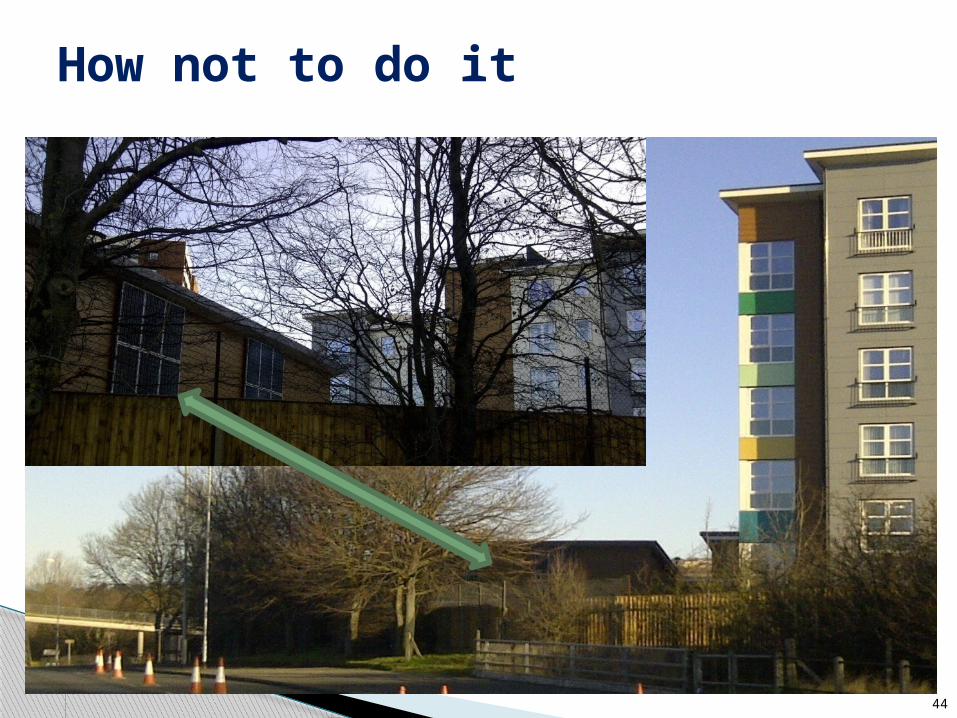
How not to do it
41

How not to do it
42

How not to do it
43
How not to do it
44

Thank youThank youBarry Marsh – UK Country Manager


