This Issue Brief was prepared by Robert W. Seifert, Policy Director of The Access Project. The Access Project, affiliated with the Schneider Institute for Health Policy at Brandeis University, is a national initiative that works to strengthen community action, promote social change, and improve health, especially for those who are most vulnerable. Prior to joining The Access Project in 1998, Seifert was a Policy Manager at the Massachusetts Division of Health Care Finance and Policy, formerly the Rate Setting Commission.
Executive Summary
The Commonwealth of Massachusetts has made a social commitment to the proposition that all residents of the state, regardless of their financial circumstances, should have some access to health care when they need it. For those who do not qualify for a public program, the Uncompensated Care Pool supports those who have no other way to pay for health care by paying hospitals and community health centers for services they provide to low-income persons. The Pool operationalizes the Common-wealth’s commitment through its statutory purpose: “to provide access to health care for low income uninsured and underinsured residents of the Commonwealth.” The Pool, created in 1985 and modified significantly in 1988, 1991 and 1997, is at the core of a health care safety net that distinguishes Massachusetts from most other states. Since its last reform in 1997, however, it again has lapsed into a state of disrepair. As the most recently appointed Uncompensated Care Pool Commission meets and deliberates the next round of reform, this Issue Brief examines the Uncompensated Care Pool through the lens of access to care. It presents the basics of the history of the Pool, how it works and how it is funded; considers how well the Pool promotes access to care; and examines whether Pool financing is adequate to fulfill its central purpose. Finally, the brief identifies areas of reform for policy makers to consider concerning financing, how and where care is provided, and the monitoring of Pool operations. Key considerations and findings in the report fall into the following areas:
Preserving and Strengthening the Safety Net Approximately 418,000 people in Massachusetts have no health insurance and thus lack a key instrument of access to health care. The Uncom-pensated Care Pool is a critical component of the health care safety net for these people. Only a handful of other states finance uncompensated care
using a redistributive mechanism that resembles the Pool. The Pool has achieved considerable success in providing for the most vulnerable, and it must be preserved and strengthened.
Chronic Underfunding and Growing Shortfalls Since 1990, allowable uncompensated care costs have exceeded the available funds in all but two years. This shortfall of funds is cause for concern, given the Commonwealth’s goal of expanded access. Indeed, while Pool payouts declined in the first three years of MassHealth expansion, demand is increase-ing, for reasons that are not entirely clear. At least part of the increase in uncompensated care demand relative to available funds, however, is health care cost inflation, which has accelerated in recent years. Another possible contributor to persistent shortfalls is the relative attractiveness of the Pool compared to other payers. For some hospitals and some services (particularly outpatient) it is possible that a given patient, if found eligible and enrolled in MassHealth, would yield a lower payment for the hospital than if the patient were simply qualified for the Pool. Pool regulations expressly forbid this and there is little evidence that hospitals forego MassHealth payment in favor of billing the Pool, yet the financial incentives exist, so further examination and/or enforcement are warranted.
The MassHealth Connection A looming challenge to the financial stability of the Pool is the severe curtailment of eligibility for the MassHealth Basic program, due to take effect on April 1, 2003; as a result of this policy, 50,000 currently insured people will likely become uninsured, and many of them will turn to the Pool to pay for their health care needs. These cuts to MassHealth Basic are expected to significantly increase demand on the Pool. MassHealth Basic cuts will also increase costs to the state for two reasons. Former MassHealth benefici-
3
aries will move from primary and preventive care settings to more expensive ones. Further, the state will forego federal matching funds because the dis -proportionate share hospital cap is nearly met here already.
Payment Methodology Revisited Some aspects of the Pool’s financing methodology are effective, while others are dysfunctional and badly in need of revision. Although the payout formula favors hospitals that provide more free care, its method is generally fair. There are policy arguments that serve to justify this methodology, but concerns for fairness suggest the need to reexamine the basis of the assessment and ask whether another measure of ability to pay might be more realistic. The financing mechanism – pay-in methodology needs attention. Hospital funding is a growing proportion of uncompensated care financing, while the contribution of payers is less “burdensome” as a proportion of revenues than is the hospital pay-in. It is important from a public policy standpoint to consider those groups that should share in this burden but escape it entirely. One such group is employers who do not offer coverage to their employees. Key recommendations for policy makers include: 1. Preserve MassHealth Basic The impending demise of the MassHealth Basic program threatens the future viability of the Pool with funding shortfalls that rival the size of the Pool itself. The reinstatement of MassHealth Basic would not solve the problems challenging the Pool, but it would at least return those problems to a level at which solutions would be more likely to preserve the Pool’s existence. In addition, it is important to note that the federal matching funds (FFP) the state receives through the DSH program on Pool payments to hospitals may be limited in the future by the federal DSH cap. The Medicaid program, of which MassHealth Basic is a part, faces no such constraint. 2. Broaden and Increase the Financing of the Pool Policy makers should consider both the equity and the adequacy of uncompensated care financing. With respect to equity, look at all sectors that contribute to and receive from the Pool. One approach would be to use revenue as a basis for the assessment calculation, which would probably result in the private sector contribution to the Pool falling more heavily on the payers (health plans and insurers) than it does now.
With respect to adequacy, it is a fundamental fact that the Pool has always struggled to meet the demand on its resources. There must be a broader base of funding. One strategy is to determine what groups are insulated from the uncompensated care burden that perhaps should not be. Another potential source of funds is the federal money the Commonwealth receives on Pool spending, of which about $120 million remain in the general fund. 3. Create and Expand Care Management Programs That Use the Pool As the Funding Base Policy makers should consider using the Pool more explicitly as a funding base for more integrated care for the uninsured. There are models in current demonstration projects in Massachusetts and elsewhere from which we can learn, but this problem is not yet solved. Approaches that would expand the range of services provided in key gap areas (e.g., drugs and physician services) must be explored fully. 4. Improve Accountability and Reporting The parties that now pay into the Pool should be able to expect a fair accounting of whether Pool dollars are being spent properly. Not enough is known about why demand on the Pool is increasing, or who uses the Pool. This is particularly important to ensure that hospitals that are net payers into the Pool are not paying for the excesses of others.
4
Introduction
Access to health care often comes down to a question of finances: a low-income person living within walking distance of the most advanced medical facilities in the world may not be able to use their services because of an inability to pay for them. In Massachusetts, a consensus exists that people should have some access to adequate health care regardless of their financial means. Public policy reflects this consensus in a network of programs and financing mechanisms available to low-income residents who do not have private health insurance. These include the multiple components of MassHealth,1 the Children’s Medical Security Plan, the Prescription Advantage program and others. Each offers coverage or financial assistance for a specific set of services to those who are eligible. For those who do not qualify for a public program, the Commonwealth administers the Uncompensated Care Pool (also known as the “Free Care” Pool) “to provide access to health care for low income uninsured and underinsured residents of the commonwealth,” to be administered in “the best interests of low income uninsured and underinsured persons.”2 The Pool pays hospitals and community health centers for services they provide to the uninsured and underinsured. The Pool was created in 1985 and modified several times since, most recently in 1997. The Pool is the “safety net” of our health care system. It supports those who have no other way to pay for care. The Pool provides financial recompense for some providers who deliver free care services. Equally significant to the issue of access is that state regulations specify a standard policy for eligibility that applies to all providers who receive funds from the Pool, as well as requirements for informing patients of its availability. The Commonwealth effectively guarantees access for needed care in hospitals and community health centers to all who meet the residential and financial criteria. This policy sets Massachusetts apart from most other states, where hospitals’ “charity care” policies are often left to individual hospitals to determine, and may not even be widely known to the general public. This Issue Brief approaches the Uncompensated Care Pool in this context – as one part of an overall commitment the Commonwealth has made, in a largely market-based health care system, to ensuring some level of access to all its residents. Issues concerning the structure and financing of the Pool are
important to the extent that they support this function, which is the Pool's statutory purpose. Following a section on the basics of the Pool – who and what it pays for, how it is financed, and how it has evolved over its history – the brief will address these questions: How Well Does the Pool Provide Access to Health Care? The Pool reimburses for care provided by acute hospitals and freestanding community health centers. Care provided and prescription drugs dispensed in other settings do not qualify for Pool reimbursement. This section will look at how and where uninsured people get health care, who gets care that is reimbursed by the Pool, what care they receive and what gaps remain. Is the Pool’s Financing and Reimbursement Adequate and Equitable to Serve its Purpose? How money flows into and out of the Pool is a perennial concern to those who fund it and those who benefit from it. This is especially the case in times like the present, when the cost of services eligible for Pool reimbursement exceeds the available resources. This section will examine important issues such as who bears the burden of Pool financing and who does not; trends in surpluses and shortfalls in the Pool; policies to control the growth of uncompensated care costs; and developments in health care policy and the health care marketplace in recent years that affect the adequacy of Pool funds. What Are the Major Issues for Policy Makers? Different constituencies – hospitals, health centers, consumers, insurers, employers and state government – have different perspectives on how and whether the Pool achieves its purpose and how the Pool might be improved to achieve its purpose more effectively. These interests are represented in the membership of a Special Commission convened this fall, mandated by an outside section of the FY2002 budget, to “[devise] a fair and equitable allocation of the burden of uncompensated care and free care among affected participants in the health care delivery system.”3 The final section of the brief suggests areas of reform for the Commission to consider concerning financing, how and where care is provided, and monitoring, all while keeping in central focus the primary purpose of the Pool – to provide people of limited means access to needed health care.
5
Background
Who the Pool pays for The Uncompensated Care Pool was established in 1985 as a financing mechanism, supplemental to the state’s hospital rate setting system, that would mitigate the financial disincentives that hospitals faced when providing care to low income people without health insurance. Before the Pool, individual hospitals and their affiliated community health centers bore the costs of the uncompensated care they provided, and could pass those costs along to privately insured patients. For hospitals that provided a large volume of uncompensated care because of their location or their mission, the costs of uncompensated care put them at a competitive disadvantage to hospitals that provided relatively less uncompensated care. The high uncompensated care hospitals had fewer private paying sources to subsidize their uncompensated costs. The Pool was seen as a solution that would spread the burden of financing these costs more equitably across hospitals. Today, the Pool reimburses hospitals and freestanding community health centers for the costs of all uncompensated care provided to low-income Massachusetts residents and for emergency or urgent care provided to non-residents. People with family incomes at or below 200 percent of the federal poverty income guidelines qualify for “full free care,” for which their entire liability may be billed to the Pool. Family incomes between 200 and 400 percent of the poverty guidelines are eligible for “partial free care.”4 In addition, a medical hardship provision allows the Pool to provide assistance to people regardless of income whose medical expenses exceed 30 percent of family income and who have insufficient assets to cover the expenses.5 The Pool also reimburses hospitals for emergency care provided to uninsured patients who cannot or do not pay what they owe. The Pool does not pay for any other type of “bad debt.” By far, most of the Pool’s funds are used for full free care; 80 percent of uncompensated care charges in FY2001 were for this use. Another 19 percent were for emergency bad debt, slightly more than one percent for partial free care, and one-tenth of one percent for medical hardship.6 In 2000, Massachusetts was home to 116,850 non-elderly uninsured people with incomes below 200 percent of the poverty line, the income eligibility standard for full free care.7
What the Pool pays for The Pool reimburses acute care hospitals and freestanding community health centers (CHCs) for the costs of medically necessary services they provide to eligible patients. In FY2001,8 61 percent of Pool funds were used for hospital outpatient services (including hospital-based CHCs), 34 percent for inpatient services, and 4 percent for services in community health centers. (The remaining 1 percent funded demonstration projects, discussed later in this Issue Brief.) In FY1995, the comparable percentages were 47 percent hospital inpatient, 50 percent hospital inpatient, and 3 percent CHCs, echoing a trend in the health care system toward greater use of outpatient and primary care services.9 While the Pool pays for many valuable services, it does not pay for many others. Care provided by physicians (including the physician care provided in a hospitals that is not part of its charges) and by non-acute (e.g. psychiatric and rehabilitation) hospitals, and prescription drugs (except when dispensed in hospital-licensed or CHC-licensed pharmacies) are three notable examples. Of course, many providers reduce or waive fees for their low-income patients without receiving reimbursement from the Pool.
How the Pool is Financed The Pool is funded by private sector and public sector contributions. The private sector liability to the Pool is $315 million per year according to state statute,10 though the legislature reduced it to $270 million in FY2002 and FY2003. It is divided between hospitals on the one hand and insurers, HMOs and individuals, known collectively as “payers,” on the other.11 The payers’ annual liability to the pool is fixed in statute at $100 million, paid as a surcharge on payments made to hospitals and ambulatory surgery centers, at a percentage calculated to yield the $100 million total.12 That percentage was 1.8 percent in FY2001, 2.15 percent in FY2002 and 1.85 percent in FY2003.13 The hospitals’ liability is the difference between the total private sector liability and $100 million. From FY1998 to FY 2001, that amount was $215 million. In FY2002 and FY2003, the legislature reduced the assessment to $170 million, and financed the difference with additional state funds.14 Hospitals also contribute by absorbing the shortfall that results when free care demand exceeds available Pool funds. The State legislature appropriates in the annual budget $30 million to the Pool.15 In FY2002, additional state funds were made available to fund uncompensated care (see below). Pool revenues are used to cover the costs of free care that hospitals
6
provide, after deductions for reimbursements to community health centers for their free care costs, withholding of contingency reserves, administrative costs and the costs of authorized demonstration projects.16 The legislature may also transfer funds from the Pool to the Children’s and Senior’s Health Care Assistance Fund to support MassHealth expansion programs.* This transfer is discussed later in this section. There is no provision in state law to adjust for inflation the statutory contributions from any of the private or public funders. A number of additional sources also support the provision of uncompensated care, though they are not are not mandated by statute nor are they, strictly speaking, part of the Pool. The most important is $70 million in federal funds that the Commonwealth receives through an arrangement that is part of its MassHealth research and demo nstration waiver from the federal government. The Division of Medical Assistance pays these funds, also referred to as the
* The 1997 Special Commission recommended, and the Pool statute specified, that a transfer be made to an account earmarked to fund the Insurance Reimbursement Program, now called the Insurance Partnership (IP), which is an element of the MassHealth expansions. The method of transfer outlined in the statute was not implemented, however, and the legislature’s annual appropriation of the transfer to the Children’s and Senior’s Fund has not specified that it go solely to the IP.
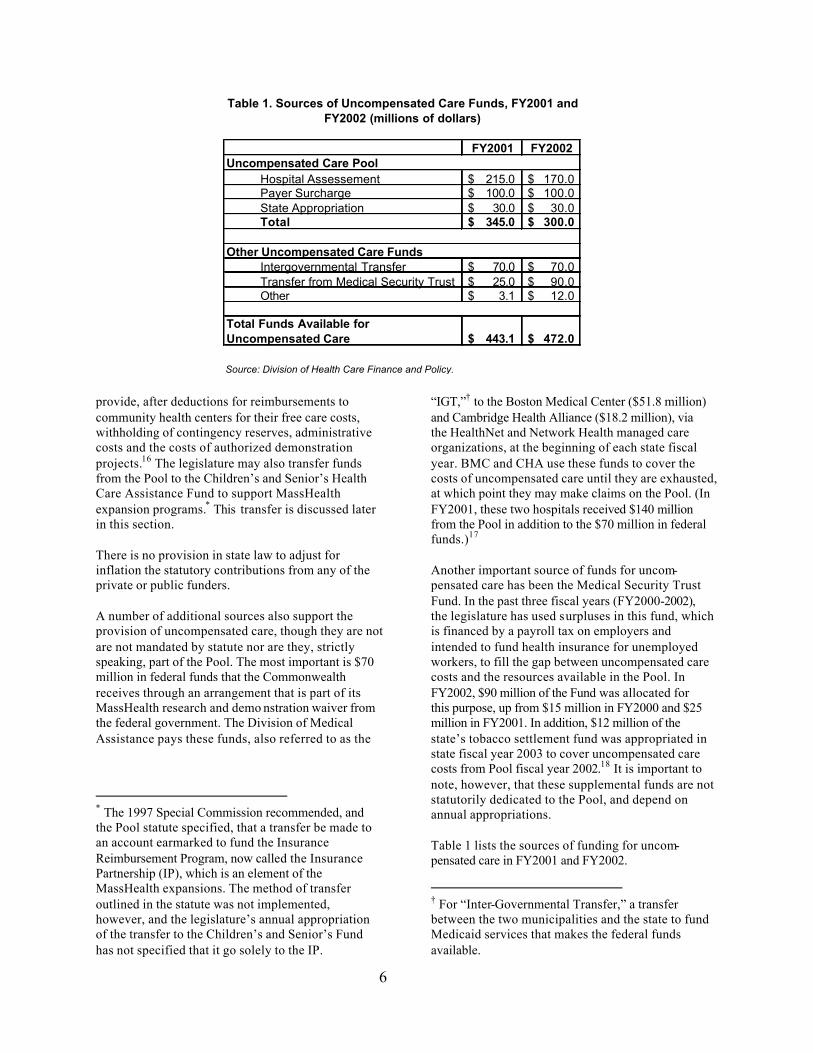
“IGT,”† to the Boston Medical Center ($51.8 million) and Cambridge Health Alliance ($18.2 million), via the HealthNet and Network Health managed care organizations, at the beginning of each state fiscal year. BMC and CHA use these funds to cover the costs of uncompensated care until they are exhausted, at which point they may make claims on the Pool. (In FY2001, these two hospitals received $140 million from the Pool in addition to the $70 million in federal funds.)17 Another important source of funds for uncom-pensated care has been the Medical Security Trust Fund. In the past three fiscal years (FY2000-2002), the legislature has used surpluses in this fund, which is financed by a payroll tax on employers and intended to fund health insurance for unemployed workers, to fill the gap between uncompensated care costs and the resources available in the Pool. In FY2002, $90 million of the Fund was allocated for this purpose, up from $15 million in FY2000 and $25 million in FY2001. In addition, $12 million of the state’s tobacco settlement fund was appropriated in state fiscal year 2003 to cover uncompensated care costs from Pool fiscal year 2002.18 It is important to note, however, that these supplemental funds are not statutorily dedicated to the Pool, and depend on annual appropriations. Table 1 lists the sources of funding for uncom-pensated care in FY2001 and FY2002.
† For “Inter-Governmental Transfer,” a transfer between the two municipalities and the state to fund Medicaid services that makes the federal funds available.
Table 1. Sources of Uncompensated Care Funds, FY2001 and FY2002 (millions of dollars)
FY2001 FY2002Uncompensated Care Pool
Hospital Assessement 215.0$ 170.0$ Payer Surcharge 100.0$ 100.0$ State Appropriation 30.0$ 30.0$ Total 345.0$ 300.0$
Other Uncompensated Care FundsIntergovernmental Transfer 70.0$ 70.0$ Transfer from Medical Security Trust 25.0$ 90.0$ Other 3.1$ 12.0$
443.1$ 472.0$
Source: Division of Health Care Finance and Policy.
Total Funds Available for Uncompensated Care
7
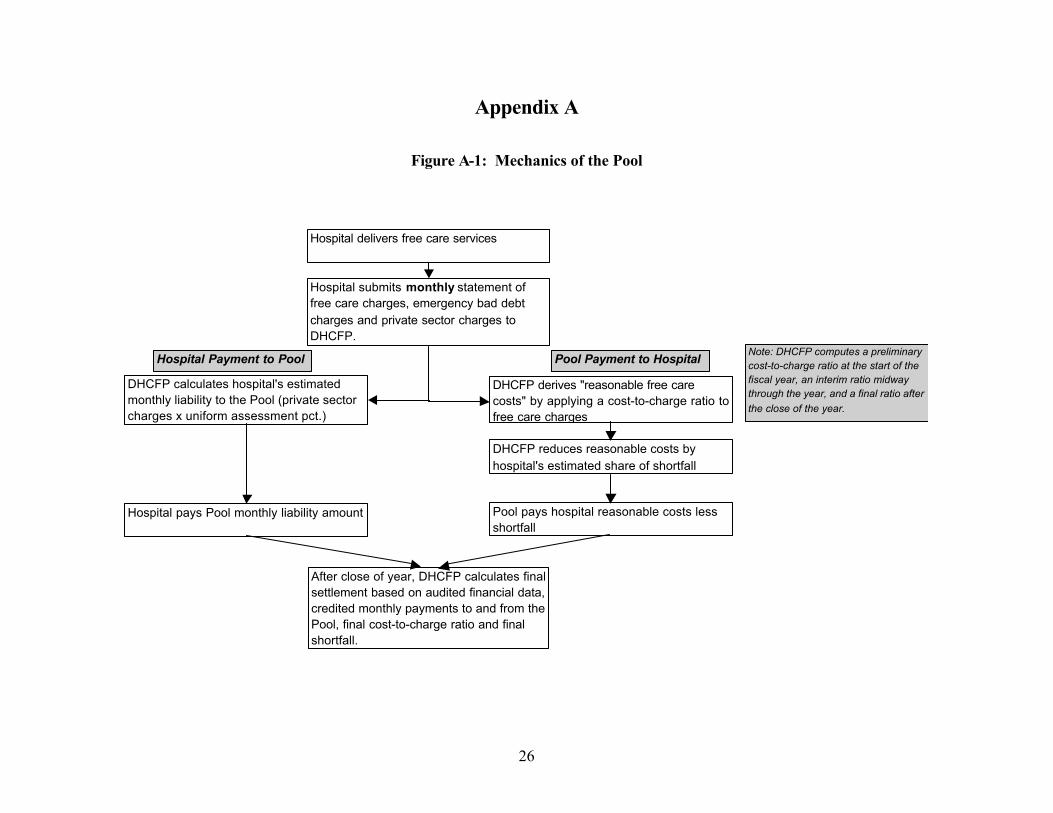
Pool payments made to hospitals qualify for matching “disproportionate share hospital” (DSH) payments from the federal government. This is also sometimes known as “Federal Financial Participa-tion,” or FFP. Massachusetts’s match rate for these funds is 50 percent, which means that the State receives 50 cents for every Pool dollar that is paid to acute hospitals. In other words, the Pool generates $150-160 million per year in federal funds. The Federal government has capped, in each state, its commitment to match DSH payments, and Massachusetts’s DSH payments, to hospitals from the Pool and in other programs – now draws FFP that approaches that cap. The full 50 percent match on Pool payments, therefore, may not be available in the future. The $30 million of state funds that the Common-wealth contributes to the Pool is drawn from the FFP it receives; the balance remains in the General Fund. The Mechanics of the Pool19 The Pool is really an accounting construct. Put simply, hospitals and community health centers
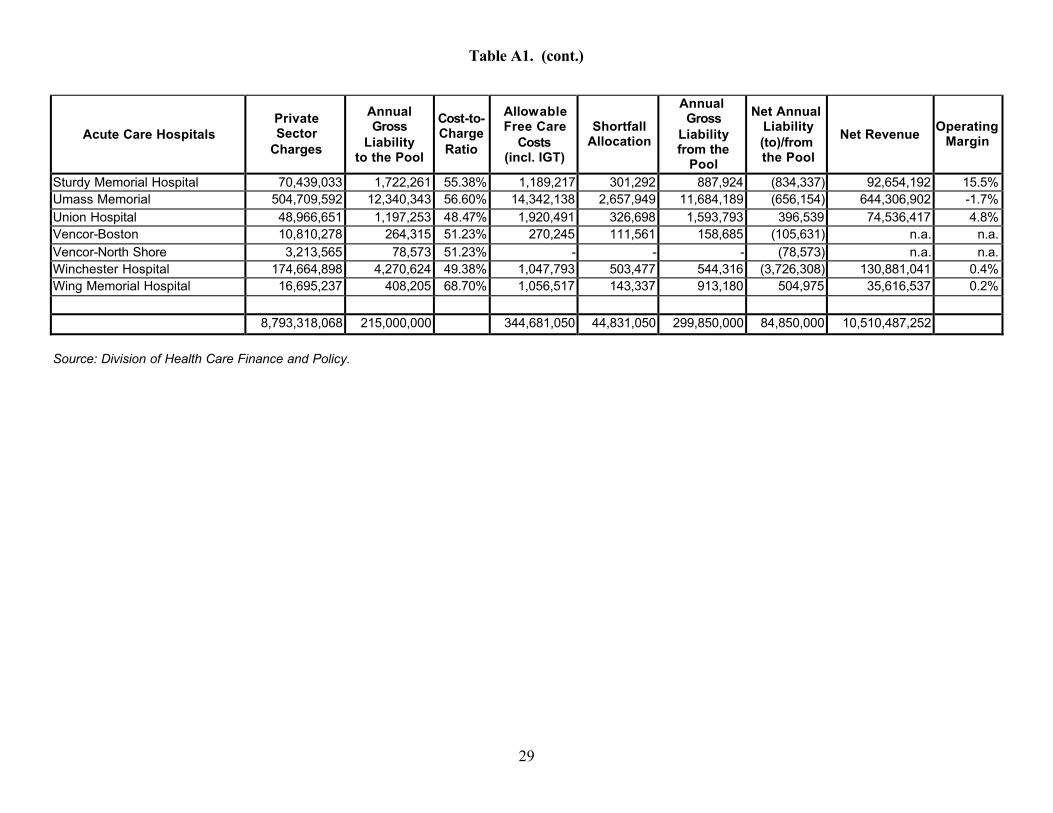
are reimbursed for the costs of the uncompensated care they provide by a Fund that is financed by contributions from hospitals, payers and the state. The details of how this is done get a little more complicated. The Division of Health Care Finance and Policy (DHCFP) calculates a hospital’s liability to or from the Pool monthly, with a final settlement after the close of a fiscal year. The hospital’s liability from the Pool consists of its allowable free care costs. The hospital reports to DHCFP the charges, analogous to list prices, for services it provided to patients eligible for free care during the month. To reduce this amount to the cost of the services, which is what the Pool reimburses, DHCFP applies a hospital-specific cost-to-charge ratio to the reported amount. This ratio has a direct effect on how much a hospital receives from the Pool, and its construction is described in the accompanying box.
Cost-to-Charge Ratio The ratio that reduces free care charges to free care costs is calculated as the sum of actual outpatient costs and “reasonable” inpatient costs, divided by total charges. Inpatient costs (exclusive of expenses for capital, medical education, malpractice, organ acquisition and physician salaries) are subject to an efficiency standard, which is the average cost per discharge across all hospitals adjusted for difference in areas wages and the relative resource intensity (known as “case mix”) of the patients different hospitals treat. “Reasonable” costs are the lesser of this efficiency standard and a hospital’s own inpatient costs. Similarly, the capital component of reasonable inpatient costs are limited to the median capital cost from FY1993, increased by annual inflation factors. An exception to this is that some hospitals – public service, sole community and specialty hospitals* – are exempt from the standards. For these hospitals, reasonable costs always equal actual costs. Finally a group of “disproportionate share” hospitals share additional allowances, added to their reasonable costs, for free care provided by physicians ($2.5 million) and for undocumentable free care ($1 million).**
The entire process for calculating reasonable costs is described in great detail in regulation.*** What is significant in this context is that this method means that the proportion of costs devoted to free care that are eligible for reimbursement from the Pool vary across hospitals – because some hospitals’ costs exceed the efficiency standards, and because other hospitals are exempted from them. We return to this subject in the discussion of equity in Section III.
___________________________ * The hospitals that are exempt from the efficiency standards are Boston Medical Center, Cambridge Health Alliance, Massachusetts Eye & Ear Infirmary, Dana Farber Cancer Institute, Children’s Hospital, Cape Cod Hospitals, and Nantucket Cottage Hospital.
** The hospitals receiving these allowances in FY2001 were Boston Medical Center, Brockton Hospital, Cambridge Health Alliance, Clinton Hospital, and Lawrence General Hospital.
*** 114.6 CMR 11.04(4)
8
These costs are further reduced by the hospital’s allocated share of the Pool shortfall (described later in this brief) to arrive at the final liability from the Pool. This is offset by a hospital’s liability to the Pool, which is its share of the total hospital assessment for the Pool, based on its share of private sector charges across all hospitals . Every month, the Pool pays the Pool's liability to each hospital, and hospitals pay their liability to the Pool. This process is shown in the diagram in Appendix Figure A1. The result at the end of the year is that some hospitals are so-called “net payers” to the Pool – that is, they paid more to the Pool than they received in payments from the Pool – and those who paid less to the Pool than they received are “net receivers.” This phenomenon is discussed further in the section on equitable distribution of financing beginning on page 16 of this Issue Brief. It is worth noting that this does not describe a claims -based system; that is, the Pool does not pay hospitals and CHCs based on claims for individual cases, as an insurance company might. Underlying all Pool payments, however, are specific services provided to eligible persons. Freestanding CHCs do not contribute to the funding of the Pool, so such a calculation is not necessary (charges at hospital-based CHCs are subject to the hospital assessment). A CHC simply submits a monthly voucher detailing the medical and dental visits that qualify for reimbursement. The Pool pays a flat rate for each visit, based on the type of professional who provided the service (physician, nurse practitioner, etc.) or the type of ancillary service provided (laboratory, radiology, etc.). Private payers contribute to the mechanics of the Pool through their payments into it. The private payers pay a surcharge based on a percentage DHCFP calculates as necessary to total to the $100 million payer share of the private sector liability. The payers, which include “self-pay” patients with bills over $10,000, make monthly payments directly to the Pool based on the surcharge percentage and the amounts subject to surcharge that they pay to hospitals and ambulatory surgery centers.
Early History of the Pool20 The Uncompensated Care Pool dates to 1985, when the legislature created it to redistribute more equitably the financing of the costs of free care and bad debt in hospitals. Chapter 574 of the Acts of 1985 established a uniform surcharge included in all private payers’ hospital bills; a simple analogy is a restaurant meals tax. The hospitals collected the
surcharge from payers to cover its uncompensated care costs. If the hospital was left with excess surcharge revenues after covering its costs, that excess went into the Pool; hospitals with deficits would receive payments from the Pool. The legislature revised the Pool with Chapter 23 of the Acts of 1988. The most important change was the establishment of a cap on private sector liability to the Pool. The legislature set the cap at $325 million in 1988 and gradually reduced it to $315 million, and it has remained at or near that level until the reduction to $270 million in the last two years. Part of the rationale for the cap was that the universal coverage provisions also enacted in Chapter 23 would gradually reduce the demand for uncom-pensated care. Universal coverage unfortunately remains elusive, though, and the cap is a real constraint that is often overwhelmed by demand. Chapter 23 did not provide for indexing the cap for inflation. In addition, Chapter 23 required a contribution from the Commonwealth for the first time, in part to cover some of the shortfall in the Pool that became possible with the private sector cap. The next major change to the Pool was in Chapter 495 of the Acts of 1991, the statute that deregulated hospital charges and allowed hospitals to negotiate payment arrangements with all payers. The law removed non-emergency bad debt from the costs that the Pool would reimburse. Free-standing community health centers were made eligible for payments from the Pool. And, in the spirit of the free market orient-ation of Chapter 495, contributions to the Pool were dubbed “assessments” for which hospitals were liable; the hospitals could, to the extent they were able, pass these costs along to payers in their negotiations.
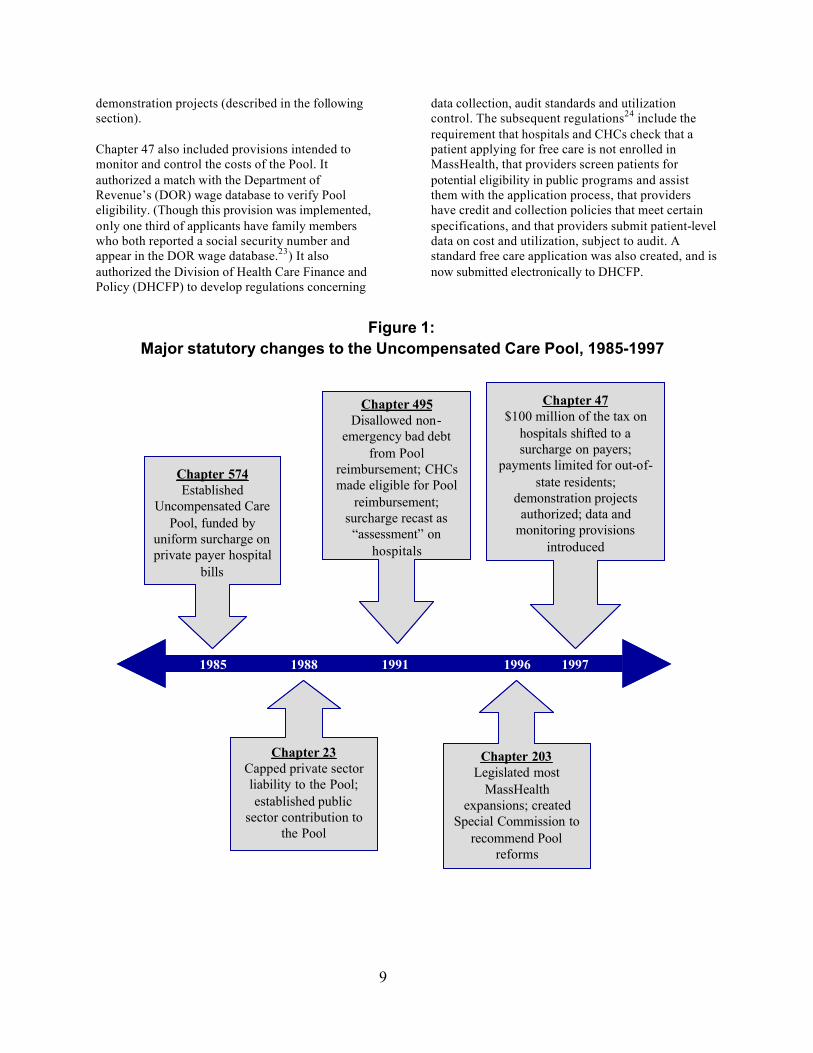
How We Got Here: Recent History21 Chapter 203 of the Acts of 1996 created a Special Commission on Uncompensated Care to “recommend a long-term plan to reform the operation of the uncompensated care pool.”22 The Commission issued its final report in February of 1997, including recommendations that led to Chapter 47 of the Acts of 1997. That legislation largely governs the Pool today. The funding of the Pool was altered by shifting $100 million of the private sector liability to a surcharge on private payers, a legislative acknowledgment that hospitals had not been completely successful in passing along its Pool liability in contract negotiations with payers. Free care payments from the Pool for out-of-state residents were limited to emergency and urgent care. And up to $10 million of Pool funds were authorized for
9
demonstration projects (described in the following section). Chapter 47 also included provisions intended to monitor and control the costs of the Pool. It authorized a match with the Department of Revenue’s (DOR) wage database to verify Pool eligibility. (Though this provision was implemented, only one third of applicants have family members who both reported a social security number and appear in the DOR wage database.23) It also authorized the Division of Health Care Finance and Policy (DHCFP) to develop regulations concerning
data collection, audit standards and utilization control. The subsequent regulations24 include the requirement that hospitals and CHCs check that a patient applying for free care is not enrolled in MassHealth, that providers screen patients for potential eligibility in public programs and assist them with the application process, that providers have credit and collection policies that meet certain specifications, and that providers submit patient-level data on cost and utilization, subject to audit. A standard free care application was also created, and is now submitted electronically to DHCFP.
Figure 1: Major statutory changes to the Uncompensated Care Pool, 1985-1997
1985 1988 1991 1996 1997
Chapter 574Established
Uncompensated Care Pool, funded by
uniform surcharge on private payer hospital
bills
Chapter 495Disallowed non-
emergency bad debt from Pool
reimbursement; CHCs made eligible for Pool
reimbursement; surcharge recast as
“assessment” on hospitals
Chapter 47$100 million of the tax on
hospitals shifted to a surcharge on payers;
payments limited for out-of-state residents;
demonstration projects authorized; data and
monitoring provisions introduced
Chapter 23Capped private sector liability to the Pool; established public
sector contribution to the Pool
Chapter 203Legislated most
MassHealth expansions; created
Special Commission to recommend Pool
reforms
10
Connection to MassHealth To better understand the Pool’s role in facilitating access to health care, one must understand its close association, both programmatically and financially, with the MassHealth program. MassHealth incorporates the Commonwealth’s Medicaid and Children’s Health Insurance programs and operates under a research and demonstration waiver from the U.S. Department of Health and Human Services that was first granted in 1997 and renewed for three years in 2002. The objective of the MassHealth demonstration is to “increase health insurance coverage while curbing the growth of the Commonwealth’s disproportionate share hospital (DSH) and uncompensated care pool expenses.”25 To achieve this objective, the MassHealth waiver permits the Commonwealth to extend insurance coverage to people who are beyond the bounds of standard Medicaid eligibility. Assuming that most of this “expansion population” was previously without insurance, it follows that the number of uninsured in the state would fall, as would demand on the Pool. The number of uninsured did, in fact, drop as the MassHealth expansions were implemented. In the first four years of the demonstration, enrollment in MassHealth increased by nearly 50 percent, and 259,000 previously uninsured Massachusetts residents gained coverage.26 (Hospitals have played a significant role in identifying people eligible for MassHealth.) Over a comparable period, the number of people in Massachusetts without health insurance declined from 496,000 in 1998 to 365,000 in 2000, increasing to about 418,000 in 2002.27 The number of “self-pay” (i.e. uninsured) discharges from hospitals also fell, as did allowable uncompensated care costs at hospitals.28 MassHealth thus appears to have been a successful expansion of coverage and, therefore, of access. The Pool remains a safety net for those who still do not qualify for MassHealth, as well as a feeder for MassHealth enrollment, by virtue of the requirement29 that providers screen patients for MassHealth eligibility before claiming reimbursement from the Pool. The screening requirement also represents a financial connection between the Pool and MassHealth; hospitals and CHCs can demand less of the Pool by informing eligible patients who otherwise would not have been aware of the availability of coverage. A more explicit connection is that the Pool is actually one source of funding for the MassHealth expan-sions, via a transfer from the Pool to the Children’s and Seniors’ Health Care Assistance Fund.30 The Fund was created to finance the benefits and ad-ministration of the MassHealth expansion. The Pool
was viewed as a source of revenue for the Fund because the expansions would replace some of the spending required of the Pool. When the transfer was proposed, the amounts projected to be available were $77 million in FY2000, $88 million in FY2001, and $99 million in FY2002.31 In fact, the transfers appropriated in the state budget for those years were $46 million, $44 million and $34 million respect-ively.32 In FY2003, the legislature eliminated the transfer in the budget, to partly cover the growing shortfall in the Pool.
Health Care Access for the Uninsured
Where Do Uninsured People Get Care? About 418,000 people in Massachusetts – 13 percent of them children – have no health insurance.33 This number will most likely increase because of recent economic trends and the rising cost of health insurance. By definition, the uninsured, particularly those with low in-comes, have limited means to pay for health care. It is also the case that the inability to pay for care limits access to it. The uninsured, there-fore, either forego care, attempt to pay for care out of their limited resources, or seek free care. In 1999, 40 percent of low-income uninsured adults in Massachusetts had no usual source of health care, and nearly a third reported an unmet need for either medical or dental care or prescription drugs. Two in ten of these adults reported a doctor’s office as their usual site of care, one in ten a hospital emergency room, and three in ten some other source, including clinics and hospital outpatient departments. Fewer than half visited a doctor in 1999. By comparison, fewer than one in ten insured low-income adults had no usual source of care and just under a quarter reported an unmet need. Over three-quarters visited a doctor during the year. Among low income uninsured children, fewer than six percent had no usual source of care, and fewer than 10 percent had an unmet need. This suggests that parents give priority to obtaining and paying for their children’s medical needs, and also perhaps that more sources of care for uninsured children are available, such as school clinics and other public health programs. Nearly four in ten children had a doctor’s office as their usual source of care, and almost half had another source such as a clinic or outpatient department. Only eight percent used the ER for routine health care, and more than sixty
11
percent visited a doctor or had a well-child checkup.34 A very rough consideration of these data suggests that the Uncompensated Care Pool would reimburse providers for care provided in the “usual source” to about 40 percent of low-income uninsured adults (emergency room and other), and slightly more than one half of children. The extent to which this represents a problem depends in part on where in Massachusetts one lives but, in general, it raises the question of the Pool’s reach to the sites where low-income uninsured people receive care, and its stated goal of access, particularly for adults.
Who Gets Care That is Reimbursed By the Pool? Compared to the situations the uninsured face in other states, the Pool is an important mechanism for breaking down some of the financial barriers to care at hospitals and community health centers. It is also well known that: 43 percent of uninsured adults in
the state’s 2000 survey were aware of the Pool, up from 17 percent in 1995.35 About three-fifths of Pool claims are for females, and most are non-elderly adults. Interestingly, about one in six Pool users, since FY2000, the first year in which these data were collected, is either a senior or a child, members of groups for whom insurance coverage is widespread or at least widely available.36 (For seniors, it is likely that much of the Pool activity is for Medicare coinsurance and deductibles.) In comparison with the demographics of the uninsured population of Massachusetts, younger people tend to use Pool services disproportionately less than their representation among the uninsured, and older people use them more. This is consistent with the idea that an older person is more likely in general to need hospital-based care, which is predominantly what the Pool pays for. Also, though a majority of Pool claims are for care delivered to girls and women,37 there are slightly more uninsured males in the state than females.
Adults Children Adults Children Adults ChildrenUsual source of care
Unmet need* 32.9% 9.6% 22.8% 9.0% 22.7% 13.4%Any doctor visit during year 45.2% 61.7% 75.3% 83.7% 81.2% 83.1%
* Medical, dental or prescription drugs.Source: Jennifer Haley and Matthew Fragale, Health Insurance, Access and Use: Massachusetts. The Urban Institute, December 2001.
Table 2. Access and Utilization of Services by Low-Income Adults and Children in Massachusetts, 1999
Source: Division of Health Care Finance and Policy.
Table 3. Age and Sex Distribution of Pool Users and Massachusetts Uninsured
12
What Type of Care Do They Get? Public data on the diagnoses for which users of the Pool are treated are available only for inpatient hospital services (though hospitals submit outpatient data as well). The most common diagnostic categories are the circulatory system, mental diseases and disorders, and the digestive system, which account for 40 percent of inpatient free care charges. Overall, the Pool is used disproportionately more for
conditions related to alcohol and drug use, injuries, and mental disorders, and less for respiratory, musculoskeletal and circulatory problem. The Pool is also charged infrequently for pregnancy and childbirth, probably because pregnant women are eligible for MassHealth and Healthy Start up to the same income level at which they are eligible for full free care from the Pool (200 percent of the federal poverty line).38
What Are the Gaps? The Pool covers the cost of services that are provided by acute hospitals and community health centers. Conversely, it does not cover many important services that are delivered outside of these settings, including: Physicians and other Professional Services: The Pool does not reimburse physicians’ costs other than those that are included in a hospital’s or CHC’s cost base. Thus excluded are private physician practices as well as alternative clinical settings for services such as behavioral health and women’s health. Physician costs accounted for nearly a third of total health care spending (exclusive of long-term care) in Massachusetts in 1998.39 Prescription Drugs: The Pool covers the costs of drugs that are used as part of inpatient treatment, and those dispensed by hospital-licensed or CHC-licensed outpatient pharmacies. There are only five such outpatient pharmacies, all in the Boston area.40 In addition, the licensed pharmacy at the Great Brook Valley Community Health Center in Worcester dispenses prescription drugs. Overall, drugs
accounted for 12 per-cent of Massachusetts health care spending. Oral Health: Similar to physicians’ services, the Pool does not reimburse dental care, six percent of total health spending in the state, provided outside of hospitals and CHCs. Though it is difficult to say precisely, because of how the data are categorized, it is reasonable to estimate that the benefits of the Pool do not apply to services that represent perhaps half of the health care spending in the Commonwealth.
Projects to Improve Care The legislation that reformed the Pool in 1997 set aside up to $10 million for projects to demonstrate how care to low-income uninsured and underinsured people might be improved and Pool costs reduced.41 The Division of Health Care Finance and Policy has funded twelve such demonstrations so far, focusing mainly on improving care for people who have chronic conditions or are otherwise especially vulnerable.42
Major Diagnostic Category Free Care MassHealth All PatientsCirculatory System 18.8% 10.8% 24.0%Mental Diseases & Disorders 11.0% 10.7% 4.3%Digestive System 10.9% 6.3% 9.0%Musculoskeletal System & Conn Tissue 8.1% 6.4% 10.5%Respiratory System 7.0% 9.3% 10.1%Nervous System 6.8% 6.1% 7.0%Hepatobiliary System & Pancreas 5.6% 4.3% 3.5%Alcohol/Drug Use Related Mental Disorders 5.4% 3.2% 1.0%Injuries, Poisonings & Toxic Effects of Drugs 3.1% 1.7% 1.1%Pregnancy, Childbirth & the Puerperium 2.7% 11.1% 5.3%Total 100.0% 69.9% 75.8%
Table 4: Distribution of charges by major diagnostic category, for Pool, Medicaid and All Patients, FY2001
Source: Free Care data from UC Pool; Medicaid and All Patient data from Hospital Discharge Database.
13
Congestive Heart Failure Demonstrations. Four demonstrations43 experimented with case management for uninsured people with congestive heart failure (CHF). The goals of the programs were to reduce CHF-related hospitalizations, reduce the need for frequent urgent care visits, and improve patient care. The focus was on primary and community-based care. Approximately 200 people, fewer than expected, enrolled in these projects. In spite of low enrollment, which increased the costs per person, one of the four programs was cost effective (i.e., it saved more than it cost) and two others came close. It is not clear, however, how much of the savings accrue to the Pool as opposed to other payers such as MassHealth. Apart from the programs’ cost effectiveness, though, they were effective in improving the health status of the people who participated, according to DHCFP indicators. These demonstrations concluded at the end of FY2001. Community- and Clinic-Based Demonstrations. DHCFP funded seven community-based providers44 in the fall of 1999. Each of the programs was designed to achieve at least one of three goals: reduce hospitalizations by providing primary care to patients with ambulatory care sensitive conditions, improve the coordination of care for patients with multiple or chronic conditions, or provide services in a more efficient or appropriate manner. The seven projects employed a variety of strategies and techniques to care for uninsured people who were at high risk of being hospitalized. All of the sites provided some form of case management to at least some of their target population. Several programs provided limited access to free prescription drugs and one made prescription drugs available to all uninsured patients at a community health center. Most of the programs targeted patients with conditions such as asthma, diabetes, hypertension, or combinations of these and other chronic conditions. A total of 2,722 people were enrolled in these demonstrations as of January 2001. Preliminary evaluations, which cover the programs’ startup and the first half of the three-year demonstration period, show no cost savings for the Pool, but some programs did considerably reduce the number of hospital days. Behavioral Health Demonstration. The state funded a mental health project that started in early 2001. The Behavioral Health Pathways (BHP) project provided behavioral health services to low-income uninsured and underinsured people in the western Massachusetts counties of Berkshire, Hampden, Hampshire and Franklin. Behavioral Health Network, Inc. administers the program, which uses social workers, case managers and nurses to provide
screening, case management and medication assistance. Preliminary findings suggest that hospitalizations have decline but it is too early to know if the reduction in hospitalizations will be sustained and whether the savings will compensate for the cost of the program. In addition to these demonstrations, the law also requires that three other programs be funded.45 The EcuHealth Care (in North Adams) and Hampshire Health Access (in Northampton) programs help link residents to available health care programs and, if not eligible for any, to local physicians who have agreed to provide services for reduced or no fees. The Massachusetts Fisherman’s Partnership offers fishermen and their families group health insurance, subsidized on a sliding scale by a trust fund that is funded by annual appropriations from the Pool and, in earlier years, from the U.S. Department of Commerce. These demonstration programs offer providers the opportunity to better tailor services to the patient populations they serve, and policy makers the chance to see how innovative uses of Pool funds might improve access, care, and health outcomes while also reducing (or at least not increasing) costs. While it is too early to know whether these results have been achieved in most of these projects, as evaluations of the still in-progress community- and clinic-based demonstrations as well as the behavioral health demonstration will not be completed until they are complete, the data we do have and the potential for improvement make continued experimentation and evaluation worthwhile.
Is the Pool’s Financing Adequate and Equitable?
The Commonwealth’s commitment to providing some level of health care access to all of its residents raises the question of whether the resources devoted to this are sufficient, and whether the financial bur-den of the commitment is distributed equitably across all who reasonably should be expected to bear it.
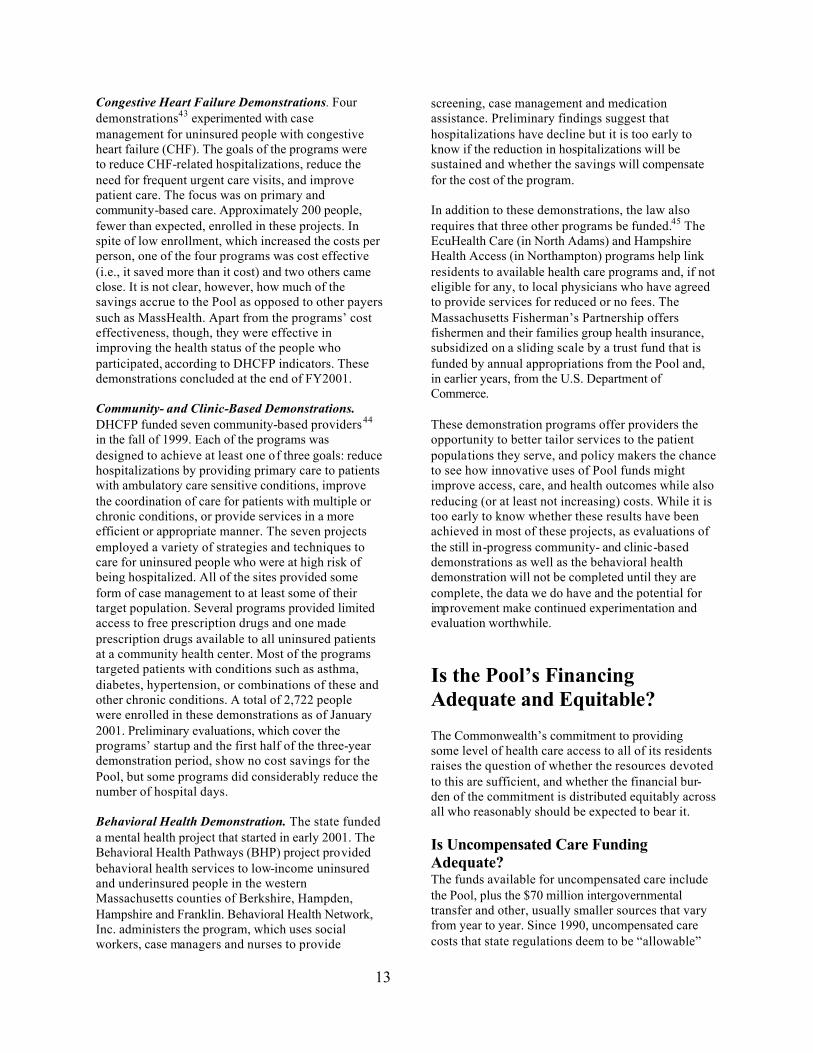
Is Uncompensated Care Funding Adequate? The funds available for uncompensated care include the Pool, plus the $70 million intergovernmental transfer and other, usually smaller sources that vary from year to year. Since 1990, uncompensated care costs that state regulations deem to be “allowable”
14
have exceeded the available funds in all but two years – FY1998 and FY1999. The portion of uncompen-sated care costs covered by available funds has ranged from all of them in those two years down to as little as two-thirds in FY1996.46
The shortfall of funds to finance uncompensated care is cause for concern, given the Commonwealth’s expressed desire to expand access to low-income people, manifest in public policy initiatives such as the expansions of MassHealth and the provisions of Chapter 47. It is worth exploring some of the possible reasons why this shortfall exists.
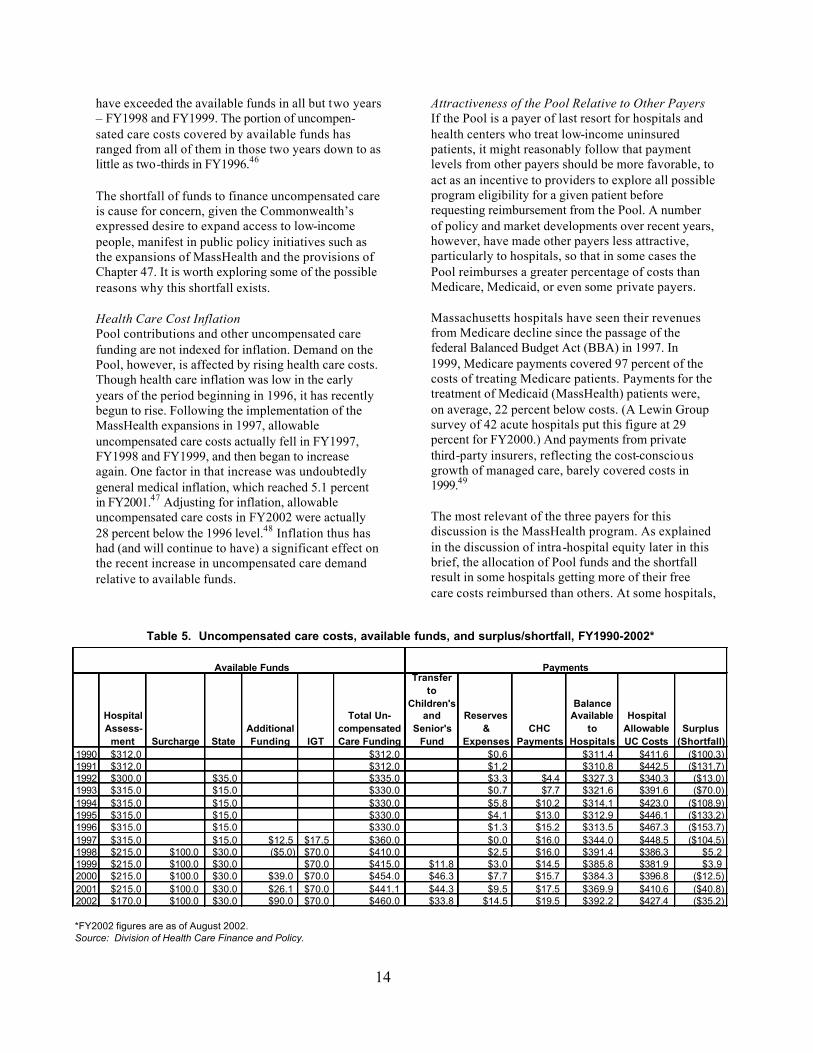
Health Care Cost Inflation Pool contributions and other uncompensated care funding are not indexed for inflation. Demand on the Pool, however, is affected by rising health care costs. Though health care inflation was low in the early years of the period beginning in 1996, it has recently begun to rise. Following the implementation of the MassHealth expansions in 1997, allowable uncompensated care costs actually fell in FY1997, FY1998 and FY1999, and then began to increase again. One factor in that increase was undoubtedly general medical inflation, which reached 5.1 percent in FY2001.47 Adjusting for inflation, allowable uncompensated care costs in FY2002 were actually 28 percent below the 1996 level.48 Inflation thus has had (and will continue to have) a significant effect on the recent increase in uncompensated care demand relative to available funds.
Attractiveness of the Pool Relative to Other Payers If the Pool is a payer of last resort for hospitals and health centers who treat low-income uninsured patients, it might reasonably follow that payment levels from other payers should be more favorable, to act as an incentive to providers to explore all possible program eligibility for a given patient before requesting reimbursement from the Pool. A number of policy and market developments over recent years, however, have made other payers less attractive, particularly to hospitals, so that in some cases the Pool reimburses a greater percentage of costs than Medicare, Medicaid, or even some private payers. Massachusetts hospitals have seen their revenues from Medicare decline since the passage of the federal Balanced Budget Act (BBA) in 1997. In 1999, Medicare payments covered 97 percent of the costs of treating Medicare patients. Payments for the treatment of Medicaid (MassHealth) patients were, on average, 22 percent below costs. (A Lewin Group survey of 42 acute hospitals put this figure at 29 percent for FY2000.) And payments from private third-party insurers, reflecting the cost-conscious growth of managed care, barely covered costs in 1999.49 The most relevant of the three payers for this discussion is the MassHealth program. As explained in the discussion of intra-hospital equity later in this brief, the allocation of Pool funds and the shortfall result in some hospitals getting more of their free care costs reimbursed than others. At some hospitals,
*FY2002 figures are as of August 2002.Source: Division of Health Care Finance and Policy.
Available Funds Payments
Table 5. Uncompensated care costs, available funds, and surplus/shortfall, FY1990-2002*
15
it is possible that a given patient, if found eligible and enrolled in MassHealth after presenting at a hospital, would yield a lower payment for the hospital than if the patient were simply qualified for the Pool. There is not much of a discrepancy in inpatient reimbursement, but a considerable one for outpatient care, which has accounted for a growing share of Pool payments to hospitals.50 Pool regulations clearly require that all providers screen patients for eligibility for public programs and eliminate the possibility of payment from any other source before billing the Pool.51 The regulations also outline how providers’ activities should be monitored and reported to ensure that the Pool does not pay for care for people who are eligible for other coverage, but these systems are not yet well established. There is little evidence currently that hospitals forego MassHealth payment in favor of billing the Pool. Yet the financial incentives exist; this issue is discussed further in the final section of this brief.
Projected Savings From Expansions The Insurance Partnership and Premium Assistance pieces of the MassHealth expansions (originally known collectively as the Insurance Reimbursement Program) were intended to make employer-sponsored coverage more available and affordable to those who would qualify, and therefore reduce pressure on the Pool. Enrollment in these programs have been below expectations, however, with just over 13,000 people enrolled in state FY2001, not all of whom were previously uninsured. On the other hand, enrollment in other components of MassHealth has surpassed expectations, thanks in large part to aggressive outreach initiatives. As noted earlier, enrollment in
the first four years of the new programs was about 259,000, bringing the total MassHealth population close to one million. It seems, then, that lackluster MassHealth enrollment is not an explanation for greater than expected Pool demand, though why Pool demand has not fallen more significantly as a result of the expansions remains an open question.
Future Funding Challenges A looming challenge to the financial stability of the Uncompensated Care Pool is the severe curtailment of eligibility for the MassHealth Basic program, which the legislature passed as part of the state FY2003 budget and is due to take effect on April 1, 2003. MassHealth Basic provides benefits to long-term unemployed adults with incomes below 133 percent of the federal poverty guideline. The budget changes will render about 50,000 currently insured people ineligible for coverage and, because they are poor and unemployed, they are unlikely to have access to coverage from any other source. Many will therefore turn to the state’s safety net, the Uncompensated Care Pool, to pay for needed hospital- and CHC-based care. The creation of MassHealth Basic was a major component of the 1997 expansions, and it exemplifies the Commonwealth’s unusually strong commitment to health care access. It brought into coverage many of the group of “predominant Pool users” described in the 1997 Special Commission report. It also receives half of its funds from the federal government. Eliminating coverage for these 50,000 recipients is likely to seriously threaten the viability of the Pool. The Division of Health Care Finance and Policy estimates additional
Figure 2.Uncompensated Care Costs, current and constant
dollars, FY1996-2002
$200
$300
$400
$500
1996 1997 1998 1999 2000 2001 2002Allo
wab
le U
nco
mp
ensa
ted
Car
e C
ost
s(m
illio
ns)
Actual Costs Inflation-Adjusted Costs
2002 uncompensated care data as of August 2002; inflation data as of July 2002. Sources: Division of Health Care Finance and Policy; U.S. Bureau of Labor Statistics.
16
uncompensated care costs to the Pool of $76 million in FY2003 (which will be half over when the cut takes effect) and about $160 million in FY2004.52 Because these costs will add to the Pool shortfall, it will place a great strain on the providers that will have to absorb these costs, particularly safety net facilities and providers of behavioral health services.
Is the Pool Financing Distributed Equitably? Who Pays? A companion to the question of whether funding for uncompensated care is adequate to meet the demand is that of whether the responsibility for the existing funding is distributed equitably among those who should be expected to pay. The principle of “fairness” in taxation systems is often (not always) a policy objective, and the following discussion assumes this is the case for Pool financing. The discussion of equity here uses simple criteria such as ability to pay and similar treatment of entities in similar circumstances to raise issues that warrant further analysis and debate.
Hospitals Hospitals are the largest contributor to the Uncompensated Care Pool. In the last and current fiscal years (FY2002 and FY2003), they have been assessed $170 million. Prior to that and back to FY1998, the hospital assessment was $215 million, and from FY1993 to FY1997 it was $315 million.53 The uniform assessment – the percentage of private sector charges that each hospital contributes to make up the total – has gone from over 10 percent in FY1990 steadily down to 1.76 percent in FY2002.54 Private sector charges, on which the uniform assessment is calculated, is not an amount that a hospital receives, though, since most private payers negotiate payment arrangements with hospitals at levels below charges. To evaluate a hospital’s contribution to the Pool in light of its actual income,
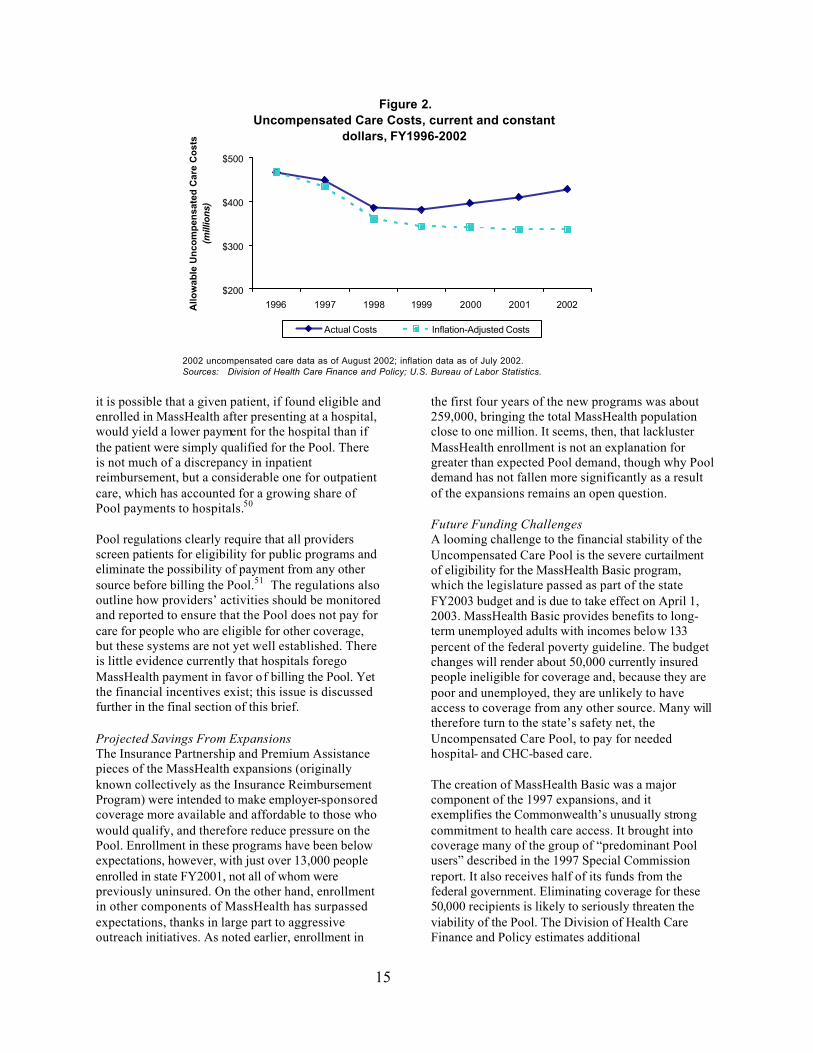
then, it is more instructive to look at a measure such as net patient revenue. From this perspective, the overall assessment in FY2001 represented on average 2 percent of hospital net patient revenues, ranging across individual hospitals from 0.5 percent to 3.4 percent.55 Hospitals also effectively fund the shortfall – that portion of allowable uncompensated care costs that exceed the available funds – since it is distributed across hospitals and figured into the calculation of each hospital’s net liability to or from the Pool. The shortfall is allocated on the principle of “greater proportional requirement.” Hospitals of equal size (based on total patient care costs) are allocated an equal portion of the shortfall, which is deducted from their allowable free care costs. The net result, illustrated in Figure 3, is that a hospital that provides more free care than another hospital of equal size has a greater proportion of its costs reimbursed.56 The shortfall allocation effectively increased each hospital’s assessment by an amount ranging from 0.1 percent to 0.6 percent of net revenue in FY2001. This share will grow larger in FY2003 and beyond, with the return of many former MassHealth Basic patients to the Pool. The Division of Health Care Finance and Policy, for example, projects that the Pool shortfall in FY2004 will be approximately $265 million.57 Critically important to the discussion of equity is how individual hospitals share the costs of uncompensated care. As noted above, the assessment, while uniformly based on private sector charges, claims a varying percentage of hospitals’ net revenue. The distribution of the shortfall adds to that variation. The financial significance comes clear when we look at hospitals’ operating margins, defined as net operating income as a percentage of total operating revenue. More than three quarters of all hospitals had an operating margin below 2 percent in FY2001, and the
Figure 3.Free Care Reimbursement for Like-Sized
Hospitals
0
20
40
60
80
100
Hospital A Hospital B
Total Costs
Total Costs
Total Free Care Costs
not reimbursed
Source: Healthpoint, Sept. 1996.
Total Free Care Costs
not reimbursed
17
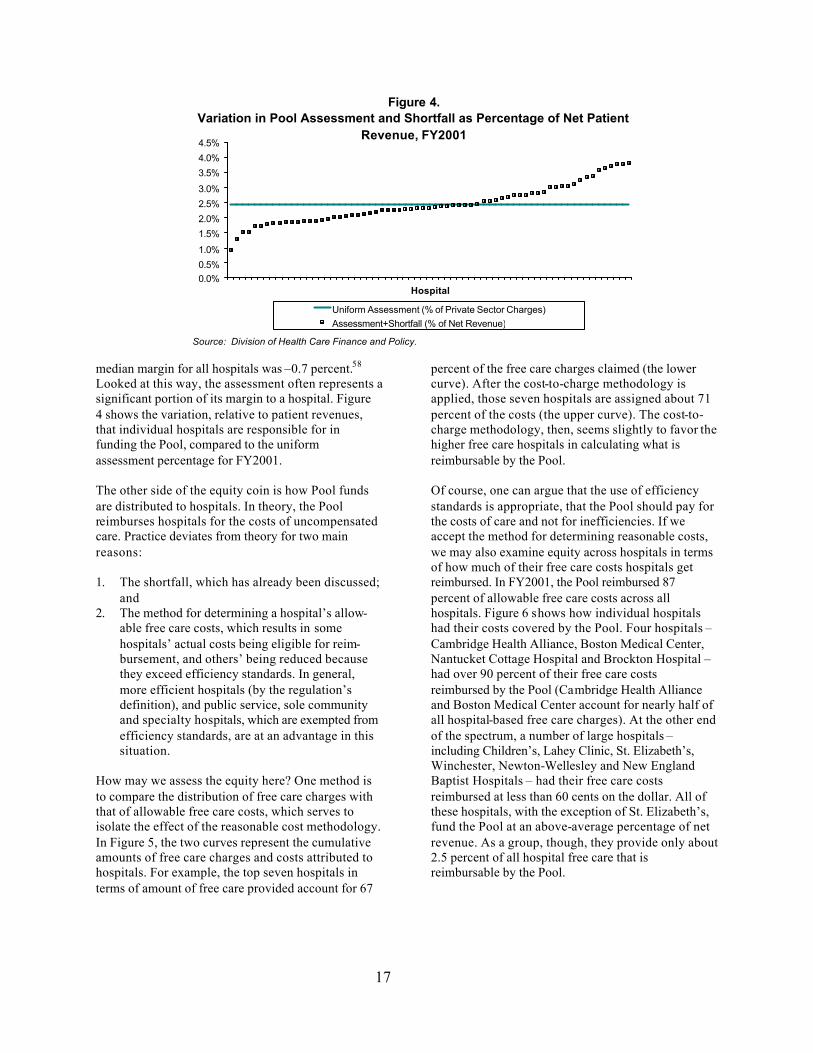
median margin for all hospitals was –0.7 percent.58 Looked at this way, the assessment often represents a significant portion of its margin to a hospital. Figure 4 shows the variation, relative to patient revenues, that individual hospitals are responsible for in funding the Pool, compared to the uniform assessment percentage for FY2001. The other side of the equity coin is how Pool funds are distributed to hospitals. In theory, the Pool reimburses hospitals for the costs of uncompensated care. Practice deviates from theory for two main reasons: 1. The shortfall, which has already been discussed;
and 2. The method for determining a hospital’s allow-
able free care costs, which results in some hospitals’ actual costs being eligible for reim-bursement, and others’ being reduced because they exceed efficiency standards. In general, more efficient hospitals (by the regulation’s definition), and public service, sole community and specialty hospitals, which are exempted from efficiency standards, are at an advantage in this situation.
How may we assess the equity here? One method is to compare the distribution of free care charges with that of allowable free care costs, which serves to isolate the effect of the reasonable cost methodology. In Figure 5, the two curves represent the cumulative amounts of free care charges and costs attributed to hospitals. For example, the top seven hospitals in terms of amount of free care provided account for 67
percent of the free care charges claimed (the lower curve). After the cost-to-charge methodology is applied, those seven hospitals are assigned about 71 percent of the costs (the upper curve). The cost-to- charge methodology, then, seems slightly to favor the higher free care hospitals in calculating what is reimbursable by the Pool. Of course, one can argue that the use of efficiency standards is appropriate, that the Pool should pay for the costs of care and not for inefficiencies. If we accept the method for determining reasonable costs, we may also examine equity across hospitals in terms of how much of their free care costs hospitals get reimbursed. In FY2001, the Pool reimbursed 87 percent of allowable free care costs across all hospitals. Figure 6 shows how individual hospitals had their costs covered by the Pool. Four hospitals – Cambridge Health Alliance, Boston Medical Center, Nantucket Cottage Hospital and Brockton Hospital – had over 90 percent of their free care costs reimbursed by the Pool (Cambridge Health Alliance and Boston Medical Center account for nearly half of all hospital-based free care charges). At the other end of the spectrum, a number of large hospitals – including Children’s, Lahey Clinic, St. Elizabeth’s, Winchester, Newton-Wellesley and New England Baptist Hospitals – had their free care costs reimbursed at less than 60 cents on the dollar. All of these hospitals, with the exception of St. Elizabeth’s, fund the Pool at an above-average percentage of net revenue. As a group, though, they provide only about 2.5 percent of all hospital free care that is reimbursable by the Pool.
Figure 4.Variation in Pool Assessment and Shortfall as Percentage of Net Patient
Revenue, FY2001
0.0%0.5%
1.0%
1.5%
2.0%
2.5%
3.0%
3.5%
4.0%
4.5%
Hospital
Uniform Assessment (% of Private Sector Charges)Assessment+Shortfall (% of Net Revenue)
Source: Division of Health Care Finance and Policy.
18
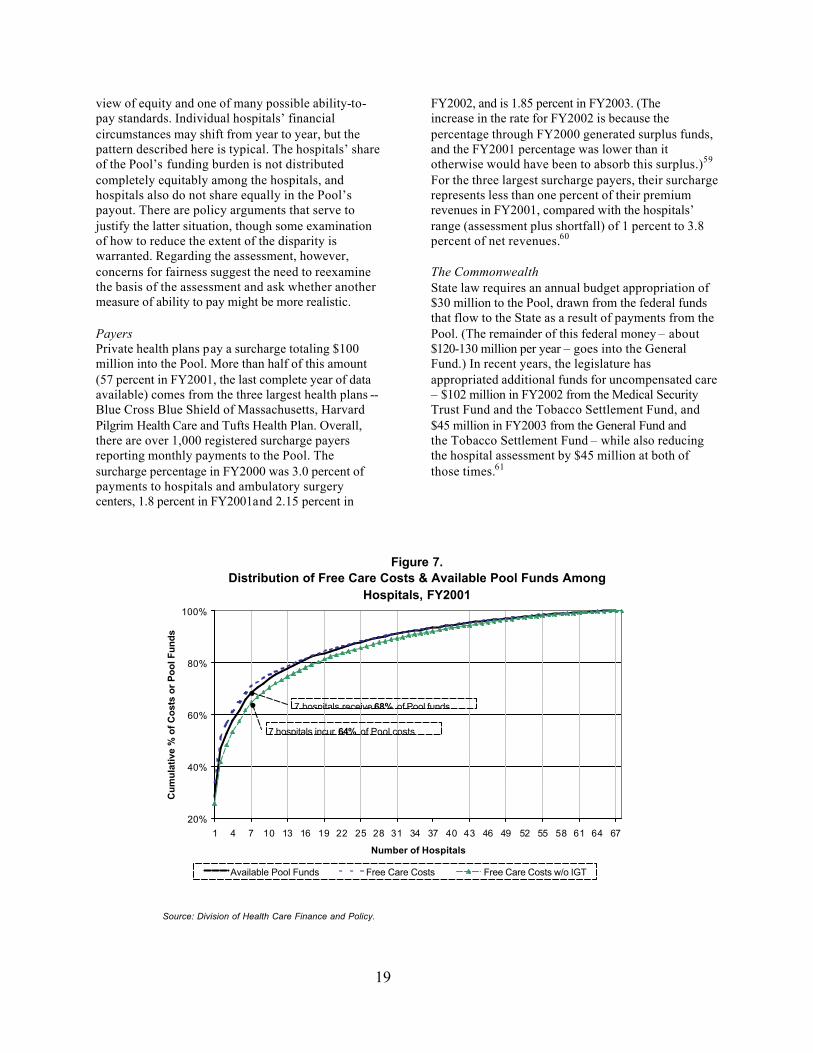
Finally, we can look at the distribution of Pool funds compared with the distribution of free care costs across hospitals. While it is true that a handful of hospitals receive the bulk of Pool dollars, it is also true that they deliver the bulk of free care. (Whether these costs are the best use of Pool funds is a separate question that is discussed elsewhere in this brief.) Figure 7 shows how these distributions track. The chart shows that, when the costs that are covered by the IGT for Boston Medical Center and Cambridge Health Alliance are removed from the distribution (creating the lower curve), it appears that the higher
free care cost hospitals receive a slightly disproportionate share of the available Pool funds (represented by the middle curve). For example, the seven hospitals that incur 64 percent of free care costs (net of the IGT) receive 68 percent of the Pool. This result is not surprising, and is not regarded as terribly unfair, given that the method that allocates the Pool shortfall explicitly favors those hospitals that deliver a greater proportion of free care services. We should note here that this analysis is based on a single year of data (hospital FY 2001), a particular
Figure 5.Distribution of Free Care Charges and Costs Among Hospitals, FY2001
Source: Division of Health Care Finance and Policy.
Figure 6.Reimbursement of Free Care Costs, FY2001
0
5
10
15
20
25
30
35
Over 90% 80%-90% 70%-80% 60-70% 50%-60% Under 50%
Percentage of Costs Reimbursed
Nu
mb
er o
f H
osp
ital
s Number in each bar is the portion of total allowable free care costs represented by each group
53%
31%
11%
2%
2% 1%
Source: Division of Health Care Finance and Policy.
19
view of equity and one of many possible ability-to-pay standards. Individual hospitals’ financial circumstances may shift from year to year, but the pattern described here is typical. The hospitals’ share of the Pool’s funding burden is not distributed completely equitably among the hospitals, and hospitals also do not share equally in the Pool’s payout. There are policy arguments that serve to justify the latter situation, though some examination of how to reduce the extent of the disparity is warranted. Regarding the assessment, however, concerns for fairness suggest the need to reexamine the basis of the assessment and ask whether another measure of ability to pay might be more realistic.
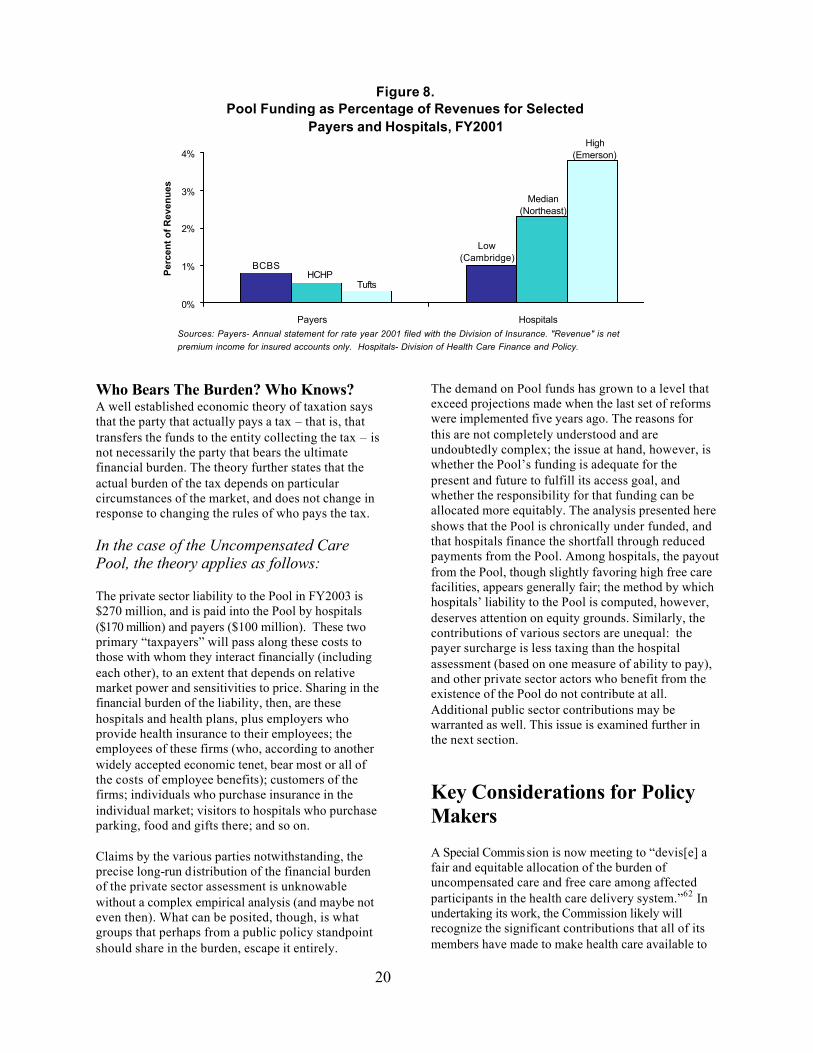
Payers Private health plans pay a surcharge totaling $100 million into the Pool. More than half of this amount (57 percent in FY2001, the last complete year of data available) comes from the three largest health plans -- Blue Cross Blue Shield of Massachusetts, Harvard Pilgrim Health Care and Tufts Health Plan. Overall, there are over 1,000 registered surcharge payers reporting monthly payments to the Pool. The surcharge percentage in FY2000 was 3.0 percent of payments to hospitals and ambulatory surgery centers, 1.8 percent in FY2001and 2.15 percent in
FY2002, and is 1.85 percent in FY2003. (The increase in the rate for FY2002 is because the percentage through FY2000 generated surplus funds, and the FY2001 percentage was lower than it otherwise would have been to absorb this surplus.)59
For the three largest surcharge payers, their surcharge represents less than one percent of their premium revenues in FY2001, compared with the hospitals’ range (assessment plus shortfall) of 1 percent to 3.8 percent of net revenues.60
The Commonwealth State law requires an annual budget appropriation of $30 million to the Pool, drawn from the federal funds that flow to the State as a result of payments from the Pool. (The remainder of this federal money – about $120-130 million per year – goes into the General Fund.) In recent years, the legislature has appropriated additional funds for uncompensated care – $102 million in FY2002 from the Medical Security Trust Fund and the Tobacco Settlement Fund, and $45 million in FY2003 from the General Fund and the Tobacco Settlement Fund – while also reducing the hospital assessment by $45 million at both of those times.61
Figure 7.Distribution of Free Care Costs & Available Pool Funds Among
Available Pool Funds Free Care Costs Free Care Costs w/o IGT
7 hospitals incur 64% of Pool costs
7 hospitals receive 68% of Pool funds
Source: Division of Health Care Finance and Policy.
20
Who Bears The Burden? Who Knows? A well established economic theory of taxation says that the party that actually pays a tax – that is, that transfers the funds to the entity collecting the tax – is not necessarily the party that bears the ultimate financial burden. The theory further states that the actual burden of the tax depends on particular circumstances of the market, and does not change in response to changing the rules of who pays the tax. In the case of the Uncompensated Care Pool, the theory applies as follows: The private sector liability to the Pool in FY2003 is $270 million, and is paid into the Pool by hospitals ($170 million) and payers ($100 million). These two primary “taxpayers” will pass along these costs to those with whom they interact financially (including each other), to an extent that depends on relative market power and sensitivities to price. Sharing in the financial burden of the liability, then, are these hospitals and health plans, plus employers who provide health insurance to their employees; the employees of these firms (who, according to another widely accepted economic tenet, bear most or all of the costs of employee benefits); customers of the firms; individuals who purchase insurance in the individual market; visitors to hospitals who purchase parking, food and gifts there; and so on. Claims by the various parties notwithstanding, the precise long-run distribution of the financial burden of the private sector assessment is unknowable without a complex empirical analysis (and maybe not even then). What can be posited, though, is what groups that perhaps from a public policy standpoint should share in the burden, escape it entirely.
The demand on Pool funds has grown to a level that exceed projections made when the last set of reforms were implemented five years ago. The reasons for this are not completely understood and are undoubtedly complex; the issue at hand, however, is whether the Pool’s funding is adequate for the present and future to fulfill its access goal, and whether the responsibility for that funding can be allocated more equitably. The analysis presented here shows that the Pool is chronically under funded, and that hospitals finance the shortfall through reduced payments from the Pool. Among hospitals, the payout from the Pool, though slightly favoring high free care facilities, appears generally fair; the method by which hospitals’ liability to the Pool is computed, however, deserves attention on equity grounds. Similarly, the contributions of various sectors are unequal: the payer surcharge is less taxing than the hospital assessment (based on one measure of ability to pay), and other private sector actors who benefit from the existence of the Pool do not contribute at all. Additional public sector contributions may be warranted as well. This issue is examined further in the next section.
Key Considerations for Policy Makers
A Special Commis sion is now meeting to “devis[e] a fair and equitable allocation of the burden of uncompensated care and free care among affected participants in the health care delivery system.”62 In undertaking its work, the Commission likely will recognize the significant contributions that all of its members have made to make health care available to
Figure 8.Pool Funding as Percentage of Revenues for Selected
Payers and Hospitals, FY2001
0%
1%
2%
3%
4%P
erce
nt o
f Rev
enu
es
Payers Hospitals
Tufts
Low (Cambridge)
Median(Northeast)
High(Emerson)
BCBSHCHP
Sources: Payers- Annual statement for rate year 2001 filed with the Division of Insurance. "Revenue" is net premium income for insured accounts only. Hospitals- Division of Health Care Finance and Policy.
21
low-income, un- and under-insured residents of the Commonwealth. The Commission should further recognize that the existence of the Uncompensated Care Pool, imperfect as it may be, makes Massachusetts rare among states in the level of commitment it places on this important access issue. This commitment, and its future viability, should be the centerpiece of the reform discussions now underway. The discussions will necessarily focus on financing, how and where care is delivered, and monitoring of the system, but the statutory goal of the Pool – access to care – should always be in view. 1. Preserve MassHealth Basic The impending demise of the MassHealth Basic program threatens the future viability of the Pool with funding shortfalls that rival the size of the Pool itself. The reinstatement of MassHealth Basic would not solve the problems challenging the Pool, but it would at least return those problems to a level at which solutions would be more likely to preserve the Pool’s existence. In addition, it is important to note that the FFP the state receives through the DSH program on Pool payments to hospitals may be limited in the future by the federal DSH cap. The Medicaid program, of which MassHealth Basic is a part, faces no such constraint.
2. Broaden and Increase the Financing of the Pool The question of financing has two dimensions: equity and adequacy. It is difficult to determine objectively how the financial burden of funding the Pool is ultimately distributed among all the involved parties – hospitals, payers and government – for reasons that are explained earlier in this brief. Nevertheless, it is worthwhile considering equalizing the starting point of the burden across entities according to some measure of ability to pay. Two such measures are net patient revenue (for hospitals) or premium revenues (for health plans and insurers). We saw earlier that the contributions to the Pool by individual hospitals and health plans, though in some sense uniform, actually vary widely relative to revenues. If it is the case (as this brief asserts) that the ultimate distribution of the burden is independent of who actually makes the payment to the Pool, then there is little to lose and much to gain (in terms of a sense of fairness) in changing the assessment and surcharge calculations to treat all parties more equitably. One approach would be to use revenue as a basis for the calculation (a moving average of three to five years would be appropriate). The probable result of this change, given the data presented here, is that
the private sector contribution to the Pool would fall more heavily on the payers than it does currently. This argument applies similarly within the hospital sector. Though the payout of Pool funds is minimally disproportionate in favor of hospitals with high levels of free care, the burden of the assessment, combined with the shortfall, varies widely relative to a hospital’s income. Again, in the interest of fairness, changing the basis of the assessment from charges to revenue should be considered. On the adequacy question, it is a fundamental fact that the Pool has always struggled to meet the demands on its resources, and that the situation is likely to worsen as health care costs increase and more people become uninsured or inadequately insured. There must be a broader base of funding. The most straightforward method of broadening the base would be to fund the Pool entirely out of general tax revenues, though this is not likely in the near term. Another strategy is to determine what groups are insulated from the burden of funding uncompensated care that perhaps should not be. One such group is employers who do not offer coverage to their employees. (Those that do offer coverage help finance the pool through their health insurance premiums, so this is an equity issue as well.) The Commission should consider recommending that the legislature construct a means to bring these employers into the community that has a financial stake in providing access to health care. Another potential source of additional funds is the federal money that the Commonwealth receives on Pool spending that goes to the General Fund and is not appropriated to the Pool. The State contributes $30 million to the Pool while over $120 million of federal match is retained for other purposes. The federal Disproportionate Share Hospital (DSH) program, under which these matching funds are granted, is intended to give states an incentive to provide additional funds to hospitals that serve a disproportionate number of low-income patients with special needs.63 Though states have flexibility in how they use the federal funds they receive, there is a compelling argument that the Pool or the MassHealth program should be given a high priority for them, given the DSH program’s intent. This issue provides an occasion to take a broad, philosophical view of the Pool and of the Commonwealth’s commitment to access, and to consider who should be expected to share in the responsibility for helping those without insurance receive needed health care. Any changes to how the
22
Pool is financed should not jeopardize the federal matching funds the Commonwealth receives, but the potential loss of federal funds that might result from not changing policy (i.e. because of the DSH cap) should be taken into consideration as well. 3. Create and Expand Care Management Programs That Use the Pool as the Funding Base With health care costs and the number of uninsured on the rise, it is an appropriate time to consider the Pool’s relatively hands-off approach to the care it pays for. In a sense, the Pool is an old-fashioned fee-for-service payer, imposing few controls that might save money or improve care. Patients who meet the Pool’s eligibility criteria may receive medically necessary services from any hospital or community health center that provides the service, without constraints like utilization review or coordination through a designated care manager. This is, of course, because the Pool is fundamentally a financing mechanism rather than a “program” in the sense that, for example, MassHealth or the Children’s Medical Security Plan are. The Pool does not offer a defined benefit package, it does not have members, and so on. The Pool simply acts as a safety net to pay for needed health care for those who cannot otherwise pay. Yet, there are some notable instances where the Pool finances what looks very much like a program. For example, Boston Medical Center enrolls uninsured people who qualify for Pool reimbursement in its CareNet program. CareNet issues a membership card, assigns patients a primary care physician, and promotes primary and preventive care and reduced emergency room use through BMC’s network of community health centers – the same network that BMC offers to enrollees in HealthNet, its MassHealth managed care plan. It can be argued that this sort of care management is appropriate and desirable, for patients as well as the Pool. Patients, who often churn in and out of MassHealth, would especially seem to benefit from the continuity of care and available providers that the overlapping networks offer. Similarly, the demonstration projects that the Division of Health Care Finance and Policy supports with Pool funds also seek to improve and manage care. The focus of many of the demonstrations is on patients with chronic or multiple conditions, who would ordinarily be expected to be the most intensive users of Pool resources. These demonstrations seek to benefit patients and identify beneficial practices in
providing care for the uninsured, without requiring additional Pool funds. The demonstrations hold potentially valuable lessons for better and more efficient care for the uninsured. The Pool is to be administered in “the best interests of low income uninsured and underinsured residents of the Commonwealth.”64 One interpretation of this phrase is that the Pool should provide not just access but access to appropriate, high quality and effective care. For this augmented goal, policy makers should consider using the Pool more explicitly as a funding base for programs of care for the uninsured such as those described here. These programs have the potential to save money and improve health, but there are also additional administrative costs of creating and operating them that must be weighed against the benefits. The state already collects a great deal of data that allow the evaluation of the costs and benefits of the programs that already exist and any that are created. Continued consideration of the cost effectiveness of these programs is essential. 4. Improve Accountability and Reporting A persistent mystery for Pool watchers is why the success of the MassHealth expansions, through which nearly 300,000 people have gained insurance coverage, has not resulted in a corresponding drop in Pool demand. Part of the reason is discussed in the previous section of this brief: uncompensated care costs did fall in the first three years following the expansions, and health care inflation has contributed substantially to increased Pool demand since then. Still, the 1997 Special Commission projected a large drop in demand that has not fully materialized. If the present Special Commission is to consider expanded funding of the Pool and the fate of the MassHealth Basic program, it needs a thorough and clear answer to this question. The parties that now pay into the Pool should be able to expect a fair accounting of whether Pool dollars are being spent properly. The Division of Health Care Finance and Policy is required by law to “manage the pool to encourage maximum efficiency and appropriate utilization of services.”65 DHCFP is authorized to collect data and conduct audits to ensure that hospitals and CHCs use Pool funds properly, and it has begun to do so.66 If it is determined that these data are insufficient to verify the eligibility of submitted charges, then the Division is authorized, although not required, to institute a claims-based payment system. Such claims adjudication would allow for closer scrutiny of the services paid for by the Pool, thus potentially
23
enhancing the accountability of those who submit charges to the Pool. Hospitals and CHCs are required to screen patients for other sources of coverage and are not entitled to reimbursement from the Pool for any patients who are eligible for other coverage. Given that incentives exist in some instances for providers to prefer the Pool to other sources of payment (particularly MassHealth), though, it is important for the integrity of the Pool that data collection and audits continue, that DHCFP report their results in a timely and public way, and that the agency pursue remediation when indicated. An important question to consider is whether the administrative policies that DHCFP has adopted to carry out statutory requirements adequately ensure accountability among all Pool participants.
Epilogue: Whither Access For the Uninsured?
Short of universal coverage, there will always be low-income people without health insurance who need health care, and the Commonwealth has dem-onstrated a social value of supporting the delivery of that care. In debates about the Pool, financial issues often eclipse discussion of the access question (though one is, to be sure, related to the other). In this epilogue, we return to the Pool's central purpose – access to health care – and address two questions: o Can care for the uninsured be improved or
delivered more efficiently, and is the Uncompensated Care Pool as currently designed the best mechanism for effecting improvement, or even maintaining current quality?
Some potential improvements are obvious. There is no financing mechanism for uncompensated care provided by professionals outside of a hospital or CHC, nor is there much available for uninsured and underinsured people who are unable to afford prescription drugs. The absence of financing, and the accompanying standards for eligibility, place these two important pieces of the health care system more out of reach to low-income uninsured people than care that is covered by the Pool. To be sure, uninsured people go to doctors’ offices and fill prescriptions, but the need to rely on a provider’s good will and charity can be a deterrent in itself to seeking care. And in the many cases in which free care or free drugs are not available, abundant
evidence shows that people do without needed care (often until a condition deteriorates enough to warrant hospitalization), cut out other necessary expenses such as food or rent, or go into debt in order to pay, which leads to further financial hardship as well. The question of whether care might be provided more efficiently to the uninsured is addressed to some extent earlier in this section. The introduction or expansion of care management programs, particularly for those with the greatest health care needs, might save costs that are equal to or greater than those of creating and administering the care management structures. The demonstrations that the Pool funds may have some answers. Evaluations of the projects on this question are essential, and further study is warranted. o Is the Uncompensated Care Pool the best
mechanism for access to care for the uninsured?
The Pool was created out of a need that arose from a now extinct, regulated hospital system and evolved into something that policy makers might not choose to create if they were starting from scratch today. To paraphrase Winston Churchill, the Pool might be the worst possible solution, except for the alternatives. But what are the alternatives? Only a handful of other states finance uncompensated care using a redistributive mechanism that resembles Massachusetts’s Pool. In the rest of the country, some of the following approaches are found: State-Funded Programs According to the National Conference of State Legislatures, 34 states besides Massachusetts have state-funded programs to provide health care access to their low-income residents.67 The programs fall into two general categories. A number of states fund or subsidize insurance coverage for people who do not qualify for Medicaid or the State Children’s Health Insurance Program, or who are “uninsurable” in the private insurance market. In Minnesota, for example, the MinnesotaCare program covers people who do not qualify for Medicaid but meet other eligibility criteria. Oregon subsidizes the employee share of employer-based insurance premiums through its Family Health Insurance Assistance Program. (Massachusetts also has both of these types of programs: state-funded coverage through the Children’s Medical Security Plan, and premium assistance through the Insurance Partnership.) “Uninsurable” people in 29 states have access to
24
state-subsidized coverage through high-risk pools. These pools are used by a limited group of higher-income individuals because of the high premiums that are required.68 The second category of state-funded program is that which makes direct payments to providers of uncompensated care. These programs differ across states by the services and providers that the program covers, the eligible population, and the level of reimbursement. They are usually funded out of general state revenues, though a dedicated tax is sometimes also used. Examples include Colorado’s Indigent Care Program, Maryland’s Primary Care Program, and Minnesota’s General Assistance Medical Care Program.69 In a sense, these programs are comparable to the Free Care Pool in Massachusetts in that they pay certain providers for the costs of care to certain people, and they are not insurance programs. They differ from the Pool in that they are typically funded out of general revenues that must be appropriated, and they are not explicitly redistributive among providers.
County-Based Programs Many states do not have uncompensated care pools or any other statewide mechanism for financing care for the uninsured. The responsibility of care in these states is left to the local community and its providers. Though this often results in an abysmal level of services for uninsured people, there are also many examples across the country of comprehensive, well run systems of care, financed by a combination of state, local and private funds. Hillsborough County, Florida (Tampa) is a national model of a county program that provides comprehensive, coordinated care to a large number of its uninsured residents, financed by a dedicated sales tax. This year, though, the plan faced financial challenges that forced the county commission to “shift funds, dip into reserves and slash services.”70 The Buncombe County, North Carolina (Asheville) Medical Society administers Project Access, which relies primarily on the contribution of volunteer services from 500 physicians to provide care to uninsured patients. The Wishard Advantage program in Marion County, Indiana (Indianapolis) uses city and county property taxes and federal DSH matching funds. The Shelby County Tennessee (Memphis) Health Care Network uses general county revenues, though the financing is capped and the program does not cover inpatient care.71
A number of states entirely shift the onus of providing care for their low-income uninsured populations to counties or other sub-state jurisdictions. In Texas, for example, counties have a fundamental responsibility under state law to be the provider of last resort for their very low-income residents. They may fulfill this responsibility by operating a public hospital, creating a hospital district with taxing authority, or administering a County Indigent Health Care Program. For the third option, a county receives a 90 percent subsidy from the state for spending on the program in excess of eight percent of the total county budget. Public hospitals and hospital districts are funded from local taxes, a state tertiary care fund, paying patients, and federal disproportionate share hospital and medical education payments. The funding tends to be spare, however, and the scope of these programs narrow. Texas law requires counties to serve, at a minimum, people whose incomes fall below 25 percent of the federal poverty threshold, though counties are free to establish more generous standards.72 There are innumerable variations across the country of how care for the uninsured is provided and financed. The keys to success for maximizing access are a stable and adequate funding source, support and participation of a full spectrum of providers, broad and effective dissemination of information about the availability of the program, and a public commitment to making health care available to those who are unable to pay.
Massachusetts meets these criteria to varying degrees; the challenge for the future is to increase the degree to which each is met. Of course, universal coverage is the best way to achieve the Uncompensated Care Pool’s goal of access to health care for low-income residents of the Commonwealth. However, until resources again permit serious consideration of this solution, a strong, reliable safety net must assist people who do not have the ability to pay to receive needed health care.
25
Acknowledgements: I am grateful to the help I received preparing this brief. Generous with their time, information and feedback were Sen. Richard Moore and Charlene DeLoach; Joe Kirkpatrick of the Massachusetts Hospital Association; Thomas Traylor of Boston Medical Center; Dr. Marylou Buyse of the Massachusetts Association of Health Plans; Bruce Bullen of Harvard Pilgrim Health Care; Peter Meade and Jay Curley of Blue Cross Blue Shield of Massachusetts; Rob Restuccia, Michael Miller, and Michele Lee of Health Care for All; Richard Lord of Associated Industries of Massachusetts; James Hunt, Jr. of the Massachusetts League of Community Health Centers; Ann Reale-Collins of the Executive Office of Administration and Finance; the knowledgeable and dedicated staff of the Massachusetts Division of Health Care Finance and Policy; Tricia Spellman of the Massachusetts Division of Medical Assistance; John McDonough and Brian Rosman of the Heller School, Brandeis University; Sarah Iselin of the Blue Cross Blue Shield of Massachusetts Foundation; Sarah Bachman of Boston University; Karen Quigley; and Nancy Turnbull of the Harvard School of Public Health. Their input was invaluable, both factually and contextually. Finally, I thank my colleagues at The Access Project for their forbearance, and Christie Hager of the Massachusetts Health Policy Forum for her good-humored help and encouragement, and her welcome calmness.
Glossary Bad debt An unpaid and uncollectible bill for services provided by a hospital or community health center that does not meet the eligibility standards for free care. Emergency bad debt An unpaid and uncollectible bill for services that meet the regulatory definition of emergency care (“medically necessary services provided after the sudden onset of a medical condition, whether physical or mental manifesting itself by acute symptoms of sufficient severity, including sever pain, which a prudent lay person would reasonably believe is an immediate threat to life or has a high risk of serious damage to the individual’s health.”) Free care Unpaid hospital or community health center charges for medically necessary services that are eligible for reimbursement from the Uncompensated Care Pool. Uncompensated care The sum of free care and bad debt (in the context of the Pool, emergency bad debt only). Uniform assessment A uniform percentage that is applied to a hospital’s charges for services paid for by private sector payers (commercial insurance, HMOs, individuals) to calculate the hospital’s liability to the Uncompensated Care Pool. Net patient revenue The total amount of payment a hospital receives for health care services it provides after deductions for free care and contractually negotiated discounts. Surcharge payer An individual or entity that makes payments for the purchase of health care services from hospitals or ambulatory surgery centers and are therefore contributors to the $100 million “private payer surcharge” to help fund the Pool. Medicaid, Medicare, other governmental programs and the workers compensation program are excluded.
26
Appendix A
Figure A-1: Mechanics of the Pool
Hospital delivers free care services
Hospital submits monthly statement of free care charges, emergency bad debt charges and private sector charges to DHCFP.
DHCFP derives "reasonable free care costs" by applying a cost-to-charge ratio to free care charges
DHCFP reduces reasonable costs by hospital's estimated share of shortfall
Pool pays hospital reasonable costs less shortfall
Hospital pays Pool monthly liability amount
After close of year, DHCFP calculates final settlement based on audited financial data, credited monthly payments to and from the Pool, final cost-to-charge ratio and final shortfall.
Note: DHCFP computes a preliminary cost-to-charge ratio at the start of the fiscal year, an interim ratio midway through the year, and a final ratio after the close of the year.
DHCFP calculates hospital's estimated monthly liability to the Pool (private sector charges x uniform assessment pct.)
Hospital Payment to Pool Pool Payment to Hospital
Table A1. Summary of FY 2001 Uncompensated Care Pool
Source: Division of Health Care Finance and Policy.
30
References
1 The legislature’s expansiveness regarding access to health care was reversed in the budget for FY2003 with the reduction in eligibility for the MassHealth Basic program, due to take effect in April 2003. This will be discussed later in this brief. 2 M.G.L. c. 118G, s. 18(a) 3 Acts of 2001, c. 177, s. 74. 4 The Federal Poverty Guideline for 2002 for a family of 4 is $18,100. 5 114.6 CMR 10.03 6 Division of Health Care Finance and Policy, presentation to Special Commission on Uncompensated Care, September 9, 2002. 7 Division of Health Care Finance and Policy 8 The fiscal year for the Pool coincides with hospital fiscal years – October through September. All references to fiscal years in this brief, unless otherwise noted, are to Pool fiscal years. 9 Massachusetts Division of Health Care Finance and Policy, Uncompensated Care Pool PFY 2001 Annual Report. August 2002. (Cited hereafter as Pool Annual Report) 10 Acts of 1997, c. 47, s. 26 11 The surcharge applies to individuals whose payment to a provider is $10,000 or more. 114.6 CMR 11.05(6). 12 M.G.L. c. 118G, s. 18A 13 Pool Annual Report; Massachusetts Division of Health Care Finance and Policy, PFY2002 Interim Report, September 2002 (Cited hereafter as Pool Interim Report) 14 Pool Annual Report 15 Acts of 1997, c. 47, s. 26. 16 114.6 CMR 11.04 17 Pool Annual Report 18 Pool Annual Report 19 114.6 CMR 11.00 20 Commonwealth of Massachusetts, Report of the Special Commission on Uncompensated Care. February, 1997. 21 Division of Health Care Finance and Policy, Free Care Reform. September 1999. 22 Acts of 1996, c. 203, s. 30. 23 Division of Health Care Finance and Policy 24 114.6 CMR 10 & 11 25 Division of Medical Assis tance, “MassHealth Waiver Extension Request.” June 28, 2001. 26 Division of Medical Assistance, “MassHealth 1115 Demonstration Project Annual Report SFY2001.” 27 Division of Health Care Finance and Policy 28 Pool Annual Report 29 114.6 CMR 10.04 30 MGL c. 28, s. 2FF
31
31 Commonwealth of Massachusetts, Report of the Special Commission on Uncompensated Care. February 1997. 32 Pool Annual Report. These figures are for the Pool fiscal year, the start of which is three months later than the state fiscal year. The actual figures in the state budget do not exactly match these because they encompass the parts of two Pool years. 33 Division of Health Care Finance and Policy 34 J. Haley and M. Fragale, Health Insurance, Access and Use: Massachusetts. The Urban Institute. December 2001. 35 Pool Annual Report; Report of the Special Commission on Uncompensated Care, 1997. 36 Division of Health Care Finance and Policy. 37 Though females dominate the number of Pool claims, males actually account for slightly more than half of Pool charges, because they use more expensive inpatient services to a significantly greater degree than females. 38 Division of Health Care Finance and Policy 39 The following health expenditure percentage estimates are from Centers for Medicare and Medicaid Services, Office of the Actuary, National Health Statistics Group. Health Expenditures by State of Residence. http://cms.hhs.gov/statistics/nhe/state-estimates-residence/ 40 The hospitals with outpatient pharmacies are Boston Medical Center, Cambridge Health Alliance, Massachusetts General, Brigham and Women’s, and Beth Israel Deaconess. 41 Acts of 1997, c. 47, s. 18(d) and (j). 42 All information on the demonstration projects is from Division of Health Care Finance and Policy. 43 Baystate Medical Center, Boston Medical Center, Brigham and Women’s Hospital and Cambridge Health Alliance. 44 Boston Health Care for the Homeless Program, Boston Public Health Commission, Falmouth Free Clinic, Family Health Center, Great Brook Valley Health Center, Lynn Community Health Center, and South Cove Community Health Center. 45 Acts of 1997, c. 47, ss. 21-22. 46 Pool Annual Report 47 Bureau of Labor Statistics. Medical Care CPI, Northeast urban series 48 Pool Annual Report and author’s calculations. 49 The Lewin Group, Inc. Analysis of the Reimbursement Rates for Acute Hospitals, Nonacute Hospitals, and Community Health Centers. Prepared for the Commonwealth of Massachusetts. 2001. Available on the Massachusetts Hospital Association website, www.mhalink.org. 50 Interview with Division of Health Care Finance and Policy staff, August 15, 2002. 51 114.6 CMR 10.04 52 Division of Health Care Finance and Policy 53 Pool Annual Report 54 Pool Interim Report 55 Pool Annual Report, DHCFP-403 reports, and author’s calculations. 56 Division of Health Care Finance and Policy, “The Uncompensated Care Pool.” Healthpoint Vol. 2 no. 1. September 1996. 57 Division of Health Care Finance and Policy 58 DHCFP-403 reports 59 Pool Annual Report
32
60 “Revenue” for surcharge payers, as used here, is defined as net premium income as filed with the Division of Insurance. This amount includes income from insured accounts only, excluding premium-equivalent income from self-insured business, so it is a relatively conservative figure. 61 Pool Annual Report 62 Acts of 2001, c. 177, s. 74 63 J. Guyer, A. Schneider and M. Spivey, Untangling DSH: A guide for community groups to using the Medicaid DSH program to promote access to care. The Access Project, 2000. 64 M.G.L. c. 118G, s. 18(a) 65 M.G. L. c. 118G, s. 18(i) 66 DHCFP began collecting eligibility (applications) data in October 2000 and utilization (claims) data in March 2001, though it began working with hospitals, CHCs, software vendors and consultants soon after Chapter 47 became law in 1997. The process of modifying hospitals’ systems to submit these data was very difficult technically to develop, but the effort was ultimately successful and data submission is now underway. 67 Major Health Care Policies: 50 State Profiles, 2000. Health Policy Tracking Service, National Conference of State Legislatures, 2001 68 Robert W. Seifert and Nancy Turnbull, An Advocate’s Guide to the Private Health Insurance Market. The Access Project, 2001. 69 Major Health Care Policies: 50 State Profiles, 2000. Health Policy Tracking Service, National Conference of State Legislatures, 2001 70 Dong-Phuong Nguyen, “County finds funds for indigent care.” St. Petersburg Times, January 31, 2002. 71 S. Silow-Carroll, S.E. Anthony, P.A. Seltman and J.A. Meyer, Community-Based Health Plans for the Uninsured: Expanding Access, Enhancing Dignity. W.K. Kellogg Foundation, 2001. 72 C. Fenz, Providing Health Care to the Uninsured in Texas: A Guide for County Officials. The Access Project, 2000.