The Un derstanding S evere T hund erstorms and A lberta B oundary L ayers E xperiment (UNSTABLE) 2 008: Preliminary Results Neil M. Taylor 1 , D. Sills 2 , J. Hanesiak 3 , J. A. Milbrandt 4 , C. D. Smith 5 , G. Strong 6 , S. Skone 7 , P. J. McCarthy 8 , and J. C. Brimelow 3 1 Hydrometeorology and Arctic Lab, Environment Canada 2 Cloud Physics and Severe Weather Research Section, Environment Canada 3 Centre for Earth Observation Science (CEOS), University of Manitoba 4 Recherche en Prévision Numérique [RPN] (Numerical Weather Prediction Research Section), Environment Canada 5 Climate Research Division, Environment Canada 6 Department of Earth and Atmospheric Sciences, University of Alberta (Adjunct) 7 Department of Geomatics Engineering, University of Calgary 8 Prairie and Arctic Storm Prediction Centre, Environment Canada College of DuPage Severe Weather Symposium Downers Grove, Illinois, 6 November 2009
Transcript
The Understanding Severe Thunderstorms and Alberta Boundary Layers Experiment (UNSTABLE) 2008: Preliminary Results
Neil M. Taylor1, D. Sills2, J. Hanesiak3, J. A. Milbrandt4, C. D. Smith5, G. Strong6, S. Skone7, P. J. McCarthy8, and J. C. Brimelow3
1Hydrometeorology and Arctic Lab, Environment Canada2Cloud Physics and Severe Weather Research Section, Environment Canada3Centre for Earth Observation Science (CEOS), University of Manitoba4Recherche en Prévision Numérique [RPN] (Numerical Weather Prediction Research Section), Environment Canada5Climate Research Division, Environment Canada6Department of Earth and Atmospheric Sciences, University of Alberta (Adjunct)7Department of Geomatics Engineering, University of Calgary8Prairie and Arctic Storm Prediction Centre, Environment Canada
College of DuPage Severe Weather SymposiumDowners Grove, Illinois, 6 November 2009
Outline
• UNSTABLE Rationale
• Experimental Design
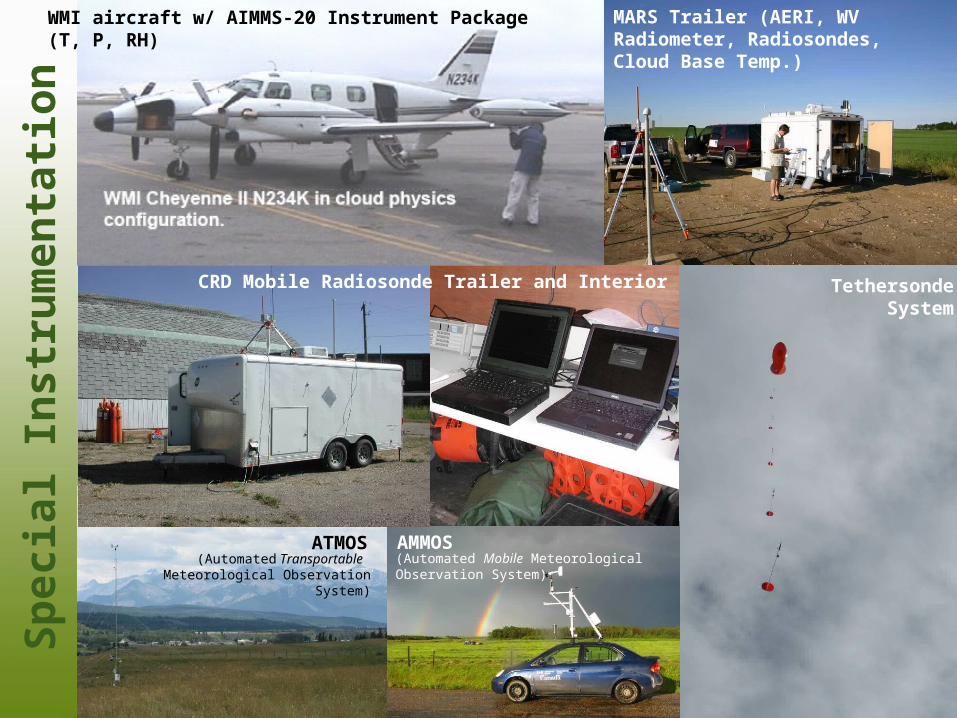
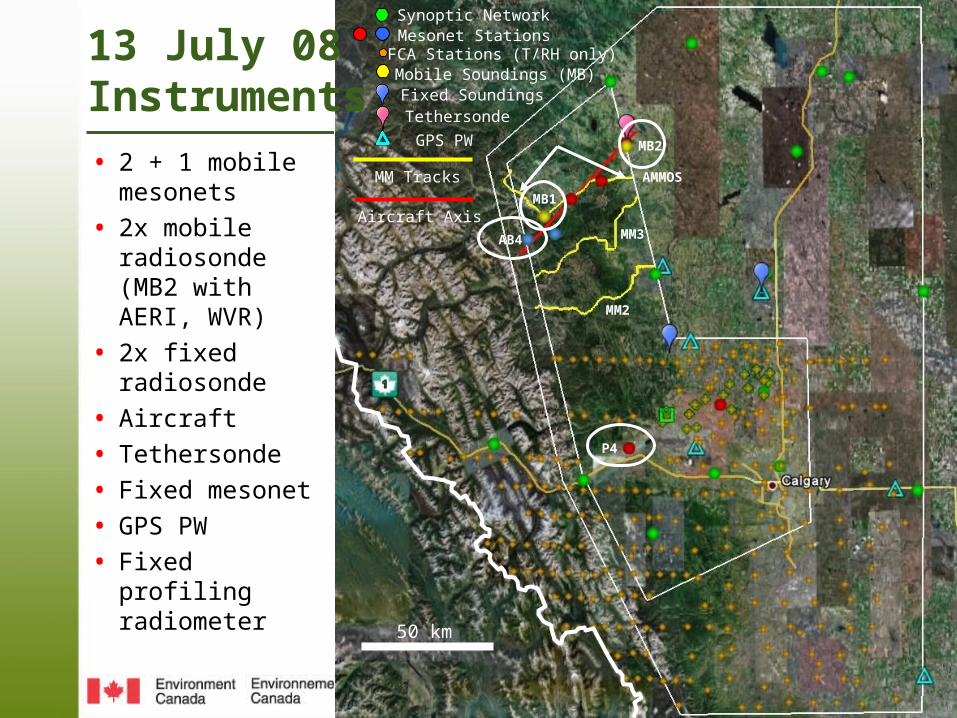
• Special Instrumentation and NWP
• Observations from 13 July 2008: Characterization of a moisture / convergence boundary in Alberta
• Summary
• Project Status
> 32
27-32
22-26
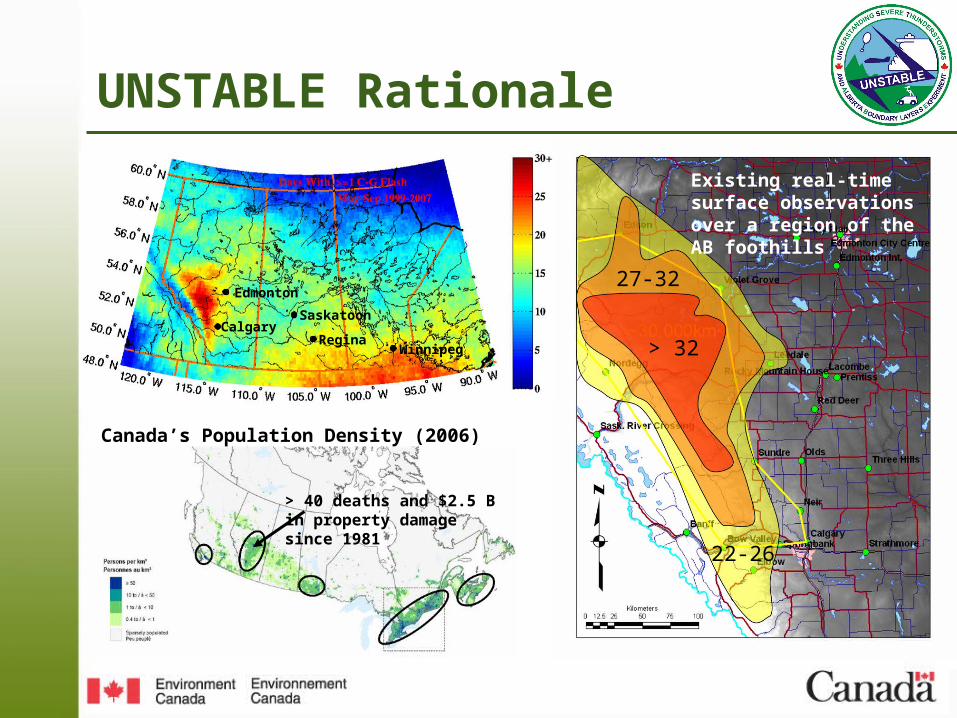
UNSTABLE Rationale
Canada’s Population Density (2006)
Existing real-time surface observations over a region of the AB foothills
Edmonton
CalgarySaskatoon
ReginaWinnipeg
> 40 deaths and $2.5 B in property damage since 1981
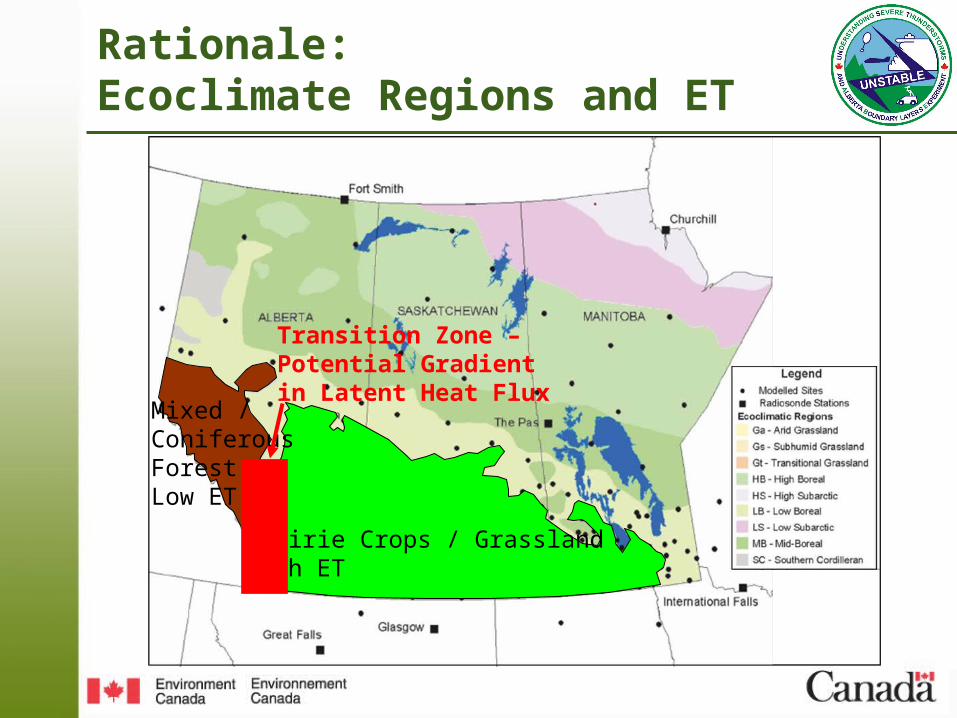
Rationale:Ecoclimate Regions and ET
Prairie Crops / GrasslandHigh ET
Mixed / Coniferous ForestLow ET
Transition Zone – Potential Gradient in Latent Heat Flux
Calgary
Red Deer
ExperimentalDesignUNSTABLE Goals• Improve understanding of
ABL processes and CI• Improve accuracy and lead
time for warnings• Assess utility of high-res
NWP to resolve processes and provide guidance
• Revise conceptual models for CI and severe wx
3 Main Science Areas1. ABL moisture and
convergence boundaries2. Surface processes (heat flux)3. High resolution NWP model
forecasts of CI and severe weather
Secondary DomainTargeting Storm Evolution
Primary DomainTargeting Storm Initiation
15km Spacing
25km Spacing
AMMOS ATMOS
TethersondeSystem
CRD Mobile Radiosonde Trailer and Interior
MARS Trailer (AERI, WV Radiometer, Radiosondes, Cloud Base Temp.)
(Automated Mobile Meteorological Observation System)
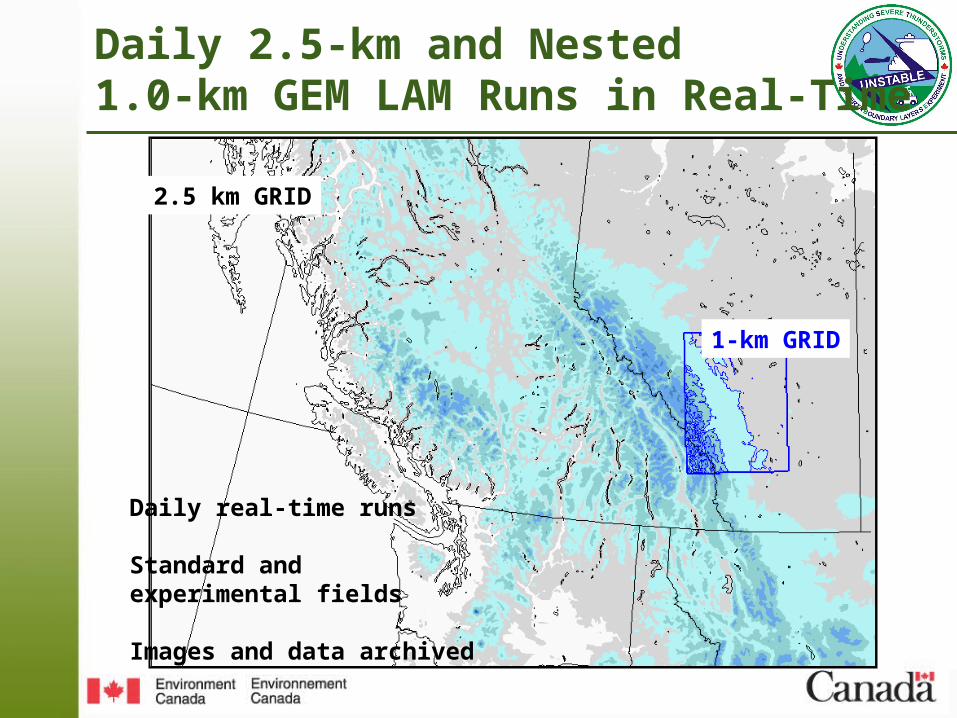
2.5 km GRID
1-km GRID
Daily 2.5-km and Nested 1.0-km GEM LAM Runs in Real-Time
Daily real-time runs
Standard and experimental fields
Images and data archived
An Aside: What’s in a name?• Existing Alberta-specific CI and severe weather outbreak conceptual models
had become outdated => little to no focus on mesoscale boundaries• Knott and Taylor (2000) first investigated role of surface moisture gradient
and convergence boundary in Alberta severe storms – referred to boundary as a dryline
• Later studies (e.g., Taylor 2001, 2004, Hill 2006) considered the boundary further but limited in-situ observations obtained
• An objective of UNSTABLE is to characterize this boundary and associated role in CI and storm evolution
– Are boundary characteristics consistent with a dryline?– What conceptual model should be used by forecasters? – What are implications for forecasting / nowcasting development, evolution, and
CI? Using the current operational network?• Focus mainly on characterization of the boundary itself (not synoptic
environment, storms and severe weather, etc.)– Surface Maps (θ and Td)– Fixed Mesonet Station Observations– AMMOS Observations– Soundings– Aircraft Observations
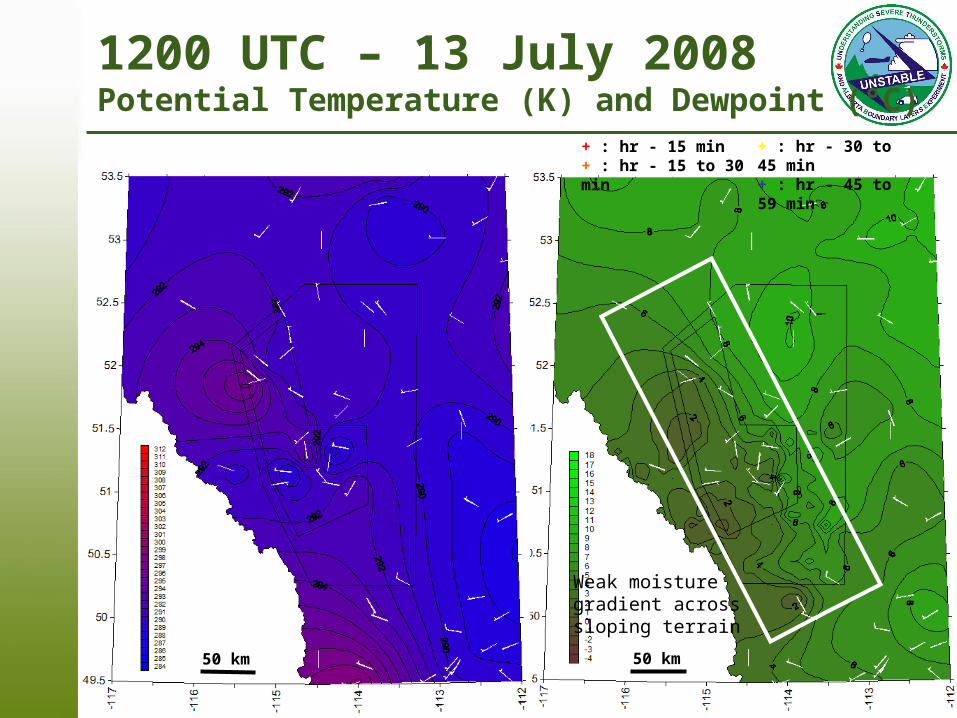
1200 UTC – 13 July 2008Potential Temperature (K) and Dewpoint (°C)
Weak moisture gradient across sloping terrain
+ : hr - 15 min+ : hr - 15 to 30 min
+ : hr - 30 to 45 min+ : hr - 45 to 59 min
50 km 50 km
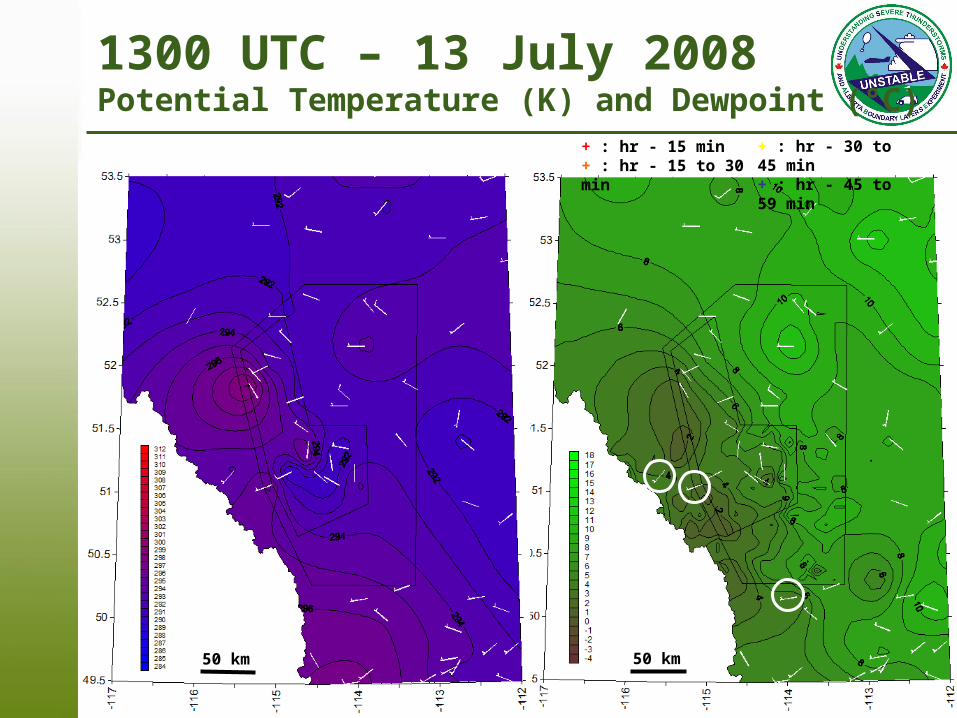
1300 UTC – 13 July 2008Potential Temperature (K) and Dewpoint (°C)
+ : hr - 15 min+ : hr - 15 to 30 min
+ : hr - 30 to 45 min+ : hr - 45 to 59 min
50 km 50 km
1400 UTC – 13 July 2008Potential Temperature (K) and Dewpoint (°C)
+ : hr - 15 min+ : hr - 15 to 30 min
+ : hr - 30 to 45 min+ : hr - 45 to 59 min
50 km 50 km
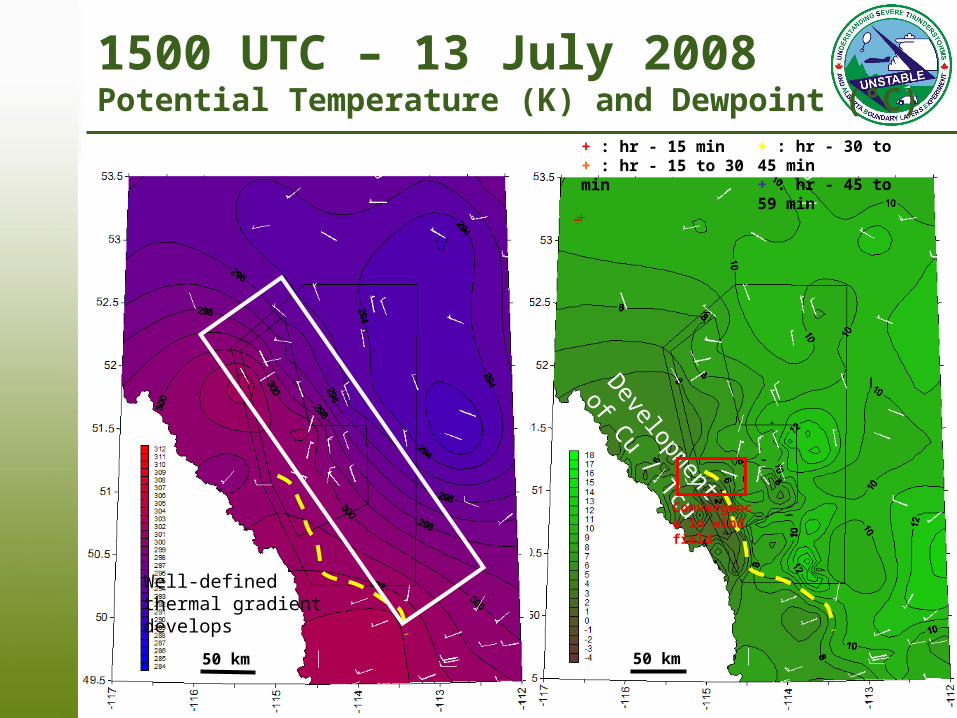
1500 UTC – 13 July 2008Potential Temperature (K) and Dewpoint (°C)
+ : hr - 15 min+ : hr - 15 to 30 min
+ : hr - 30 to 45 min+ : hr - 45 to 59 min
Well-definedthermal gradient develops
50 km 50 km
Development
of Cu / Tcu
Convergence in wind field
1600 UTC – 13 July 2008Potential Temperature (K) and Dewpoint (°C)
Cu / Tcu
+ : hr - 15 min+ : hr - 15 to 30 min
+ : hr - 30 to 45 min+ : hr - 45 to 59 min
50 km 50 km
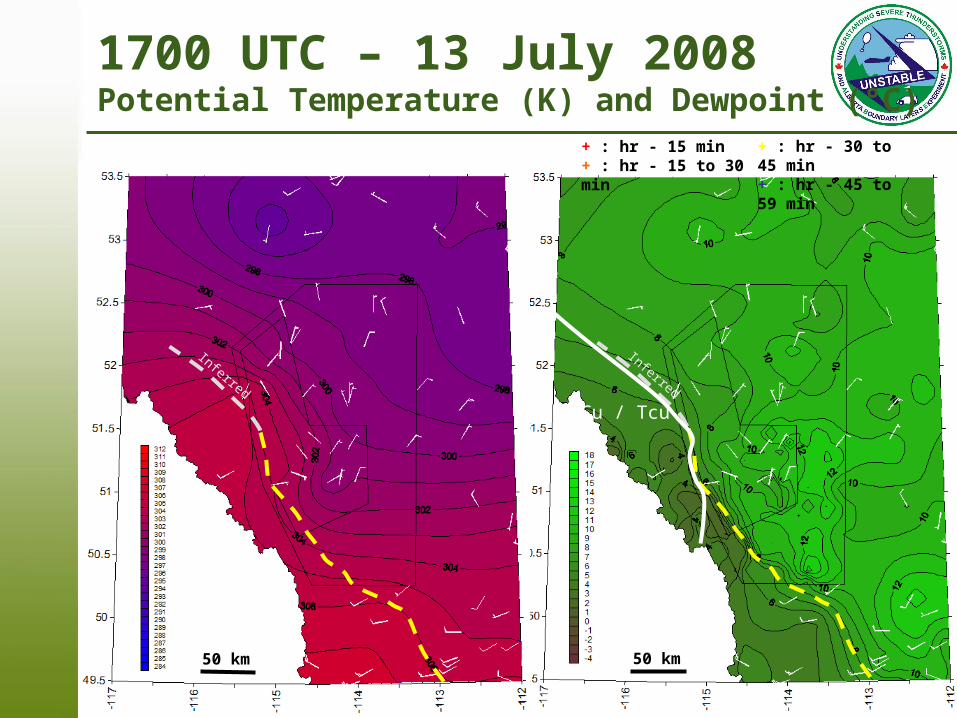
1700 UTC – 13 July 2008Potential Temperature (K) and Dewpoint (°C)
Cu / Tcu
+ : hr - 15 min+ : hr - 15 to 30 min
+ : hr - 30 to 45 min+ : hr - 45 to 59 min
Inferred
Inferred
50 km 50 km
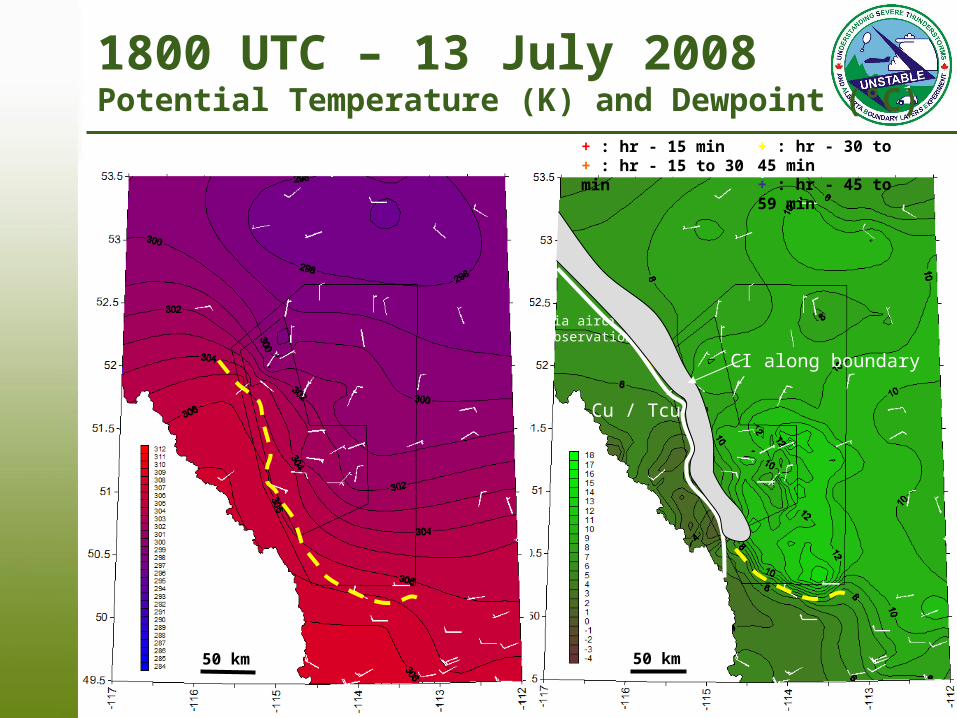
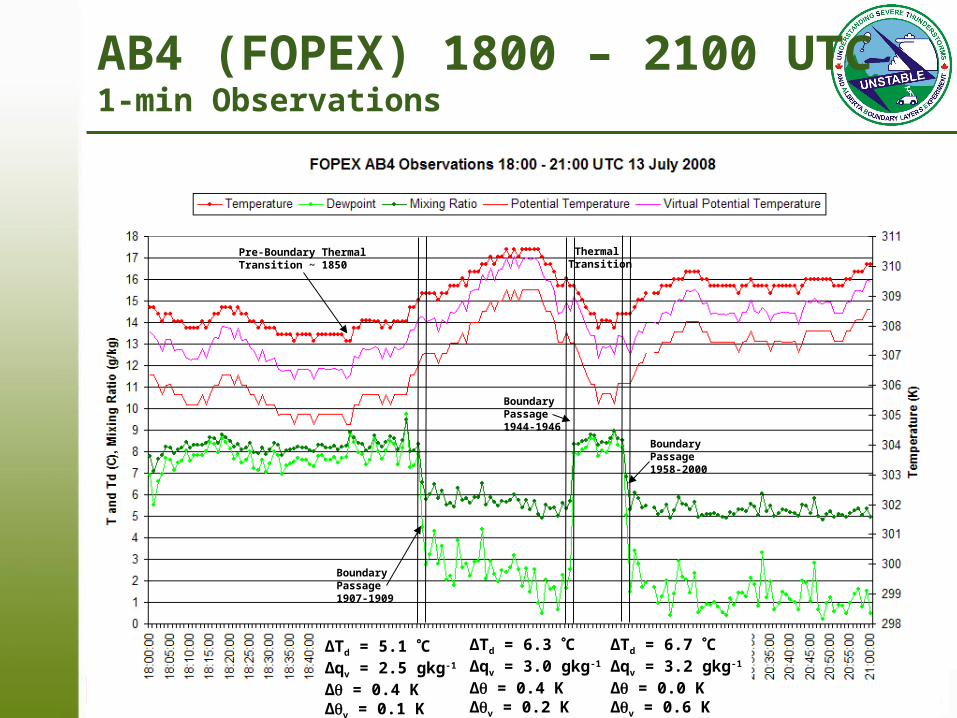
1800 UTC – 13 July 2008Potential Temperature (K) and Dewpoint (°C)
Via aircraft observations
Cu / Tcu
CI along boundary
+ : hr - 15 min+ : hr - 15 to 30 min
+ : hr - 30 to 45 min+ : hr - 45 to 59 min
50 km 50 km
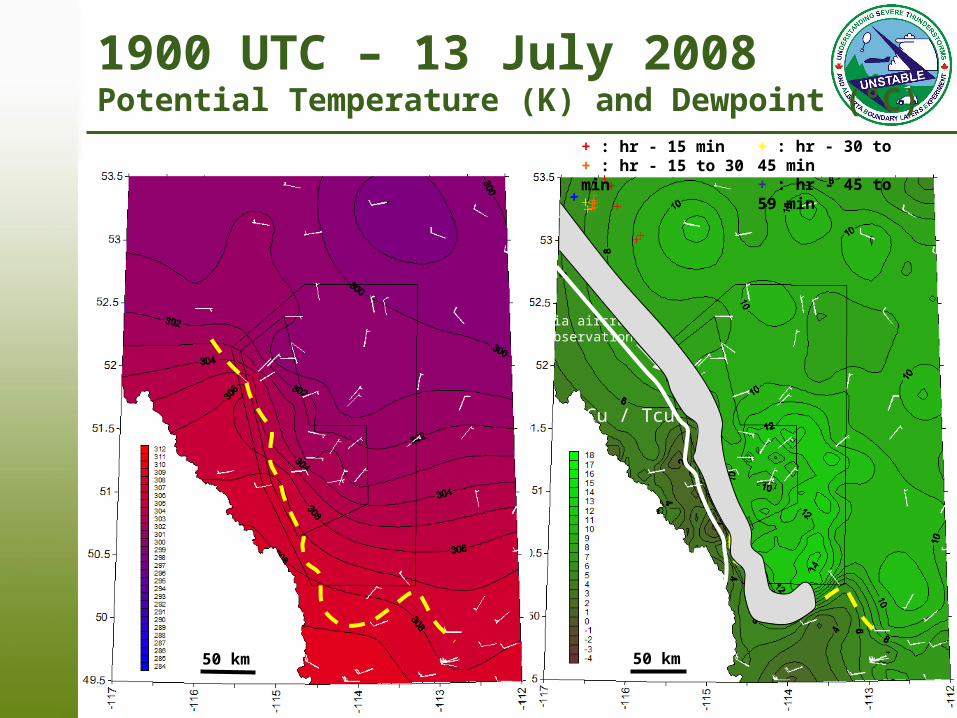
1900 UTC – 13 July 2008Potential Temperature (K) and Dewpoint (°C)
Via aircraft observations
Cu / Tcu
+ : hr - 15 min+ : hr - 15 to 30 min
+ : hr - 30 to 45 min+ : hr - 45 to 59 min
50 km 50 km
2000 UTC – 13 July 2008Potential Temperature (K) and Dewpoint (°C)
+ : hr - 15 min+ : hr - 15 to 30 min
+ : hr - 30 to 45 min+ : hr - 45 to 59 min
50 km 50 km
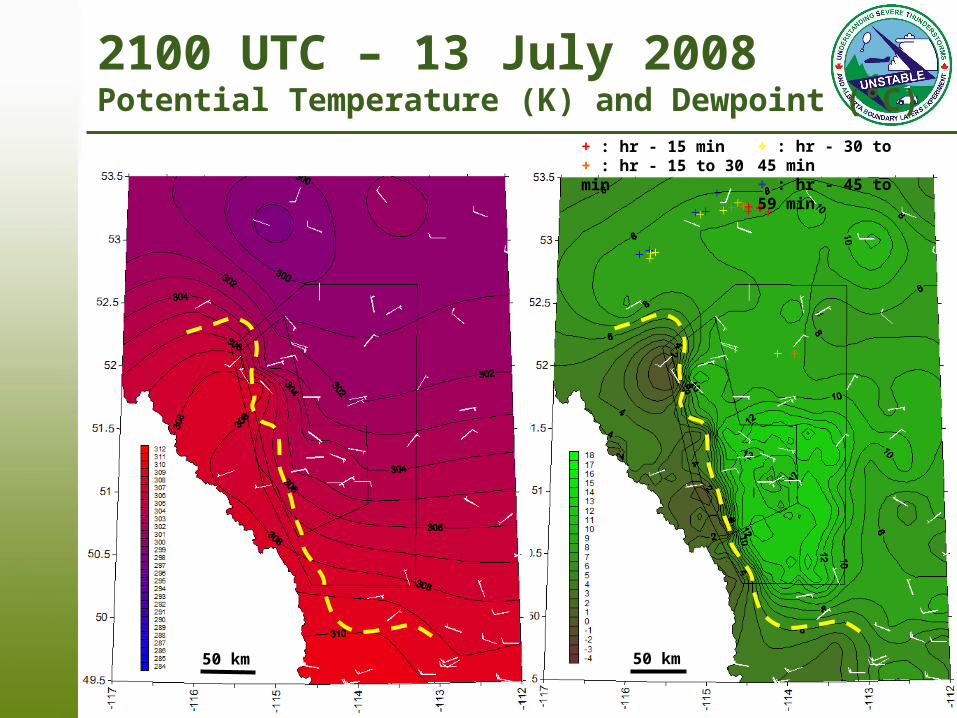
2100 UTC – 13 July 2008Potential Temperature (K) and Dewpoint (°C)
+ : hr - 15 min+ : hr - 15 to 30 min
+ : hr - 30 to 45 min+ : hr - 45 to 59 min
50 km 50 km
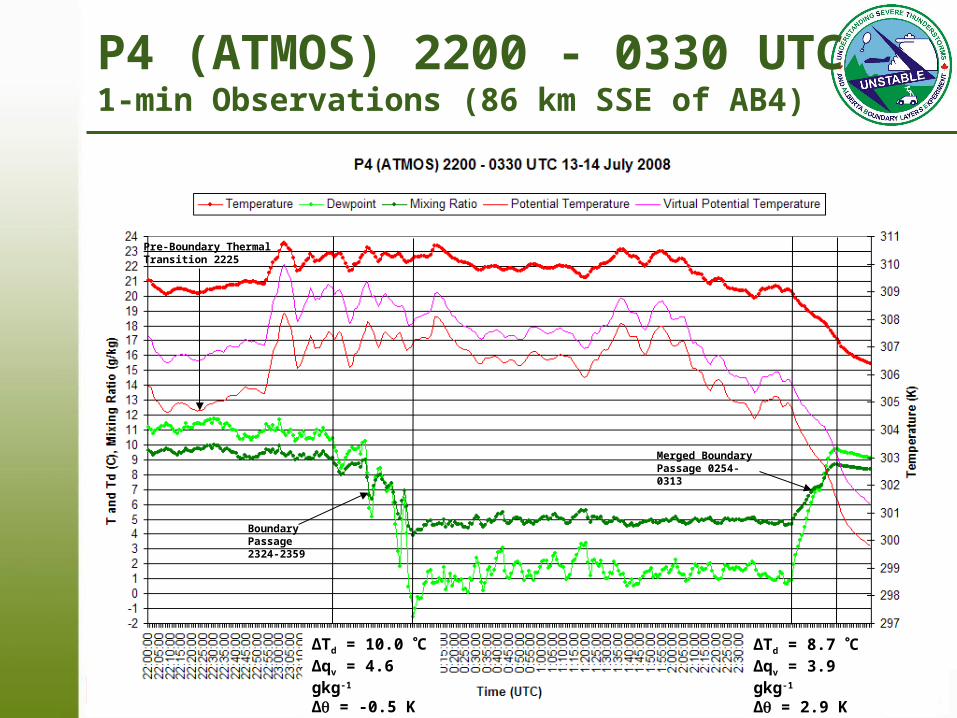
2200 UTC – 13 July 2008Potential Temperature (K) and Dewpoint (°C)
+ : hr - 15 min+ : hr - 15 to 30 min
+ : hr - 30 to 45 min+ : hr - 45 to 59 min
50 km 50 km
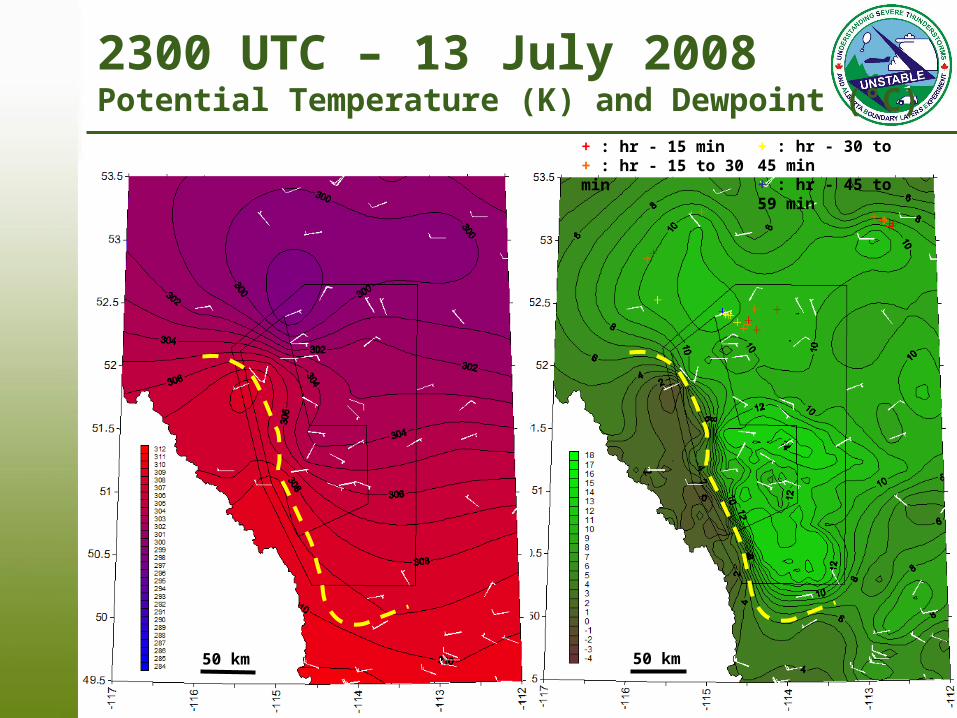
2300 UTC – 13 July 2008Potential Temperature (K) and Dewpoint (°C)
+ : hr - 15 min+ : hr - 15 to 30 min
+ : hr - 30 to 45 min+ : hr - 45 to 59 min
50 km 50 km
0000 UTC – 14 July 2008Potential Temperature (K) and Dewpoint (°C)
+ : hr - 15 min+ : hr - 15 to 30 min
+ : hr - 30 to 45 min+ : hr - 45 to 59 min
50 km 50 km
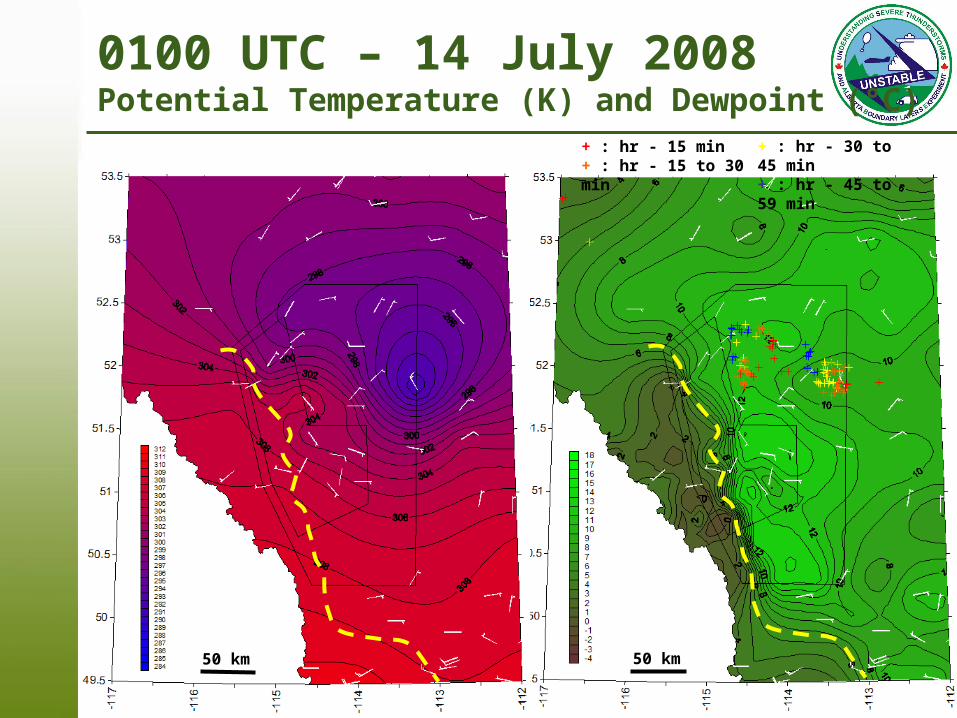
0100 UTC – 14 July 2008Potential Temperature (K) and Dewpoint (°C)
+ : hr - 15 min+ : hr - 15 to 30 min
+ : hr - 30 to 45 min+ : hr - 45 to 59 min
50 km 50 km
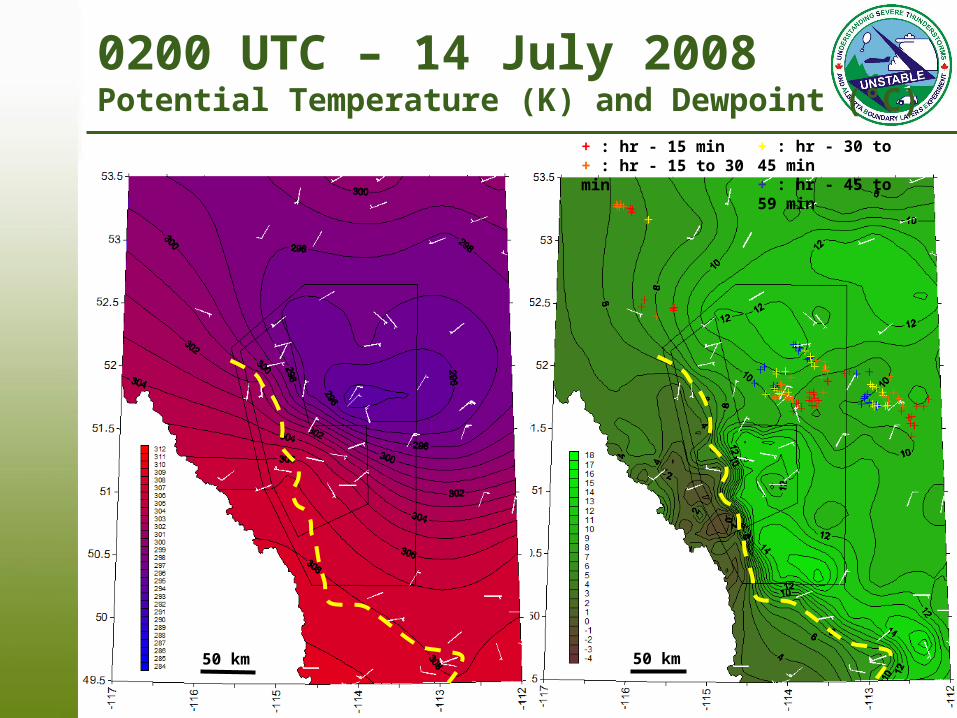
0200 UTC – 14 July 2008Potential Temperature (K) and Dewpoint (°C)
+ : hr - 15 min+ : hr - 15 to 30 min
+ : hr - 30 to 45 min+ : hr - 45 to 59 min
50 km 50 km
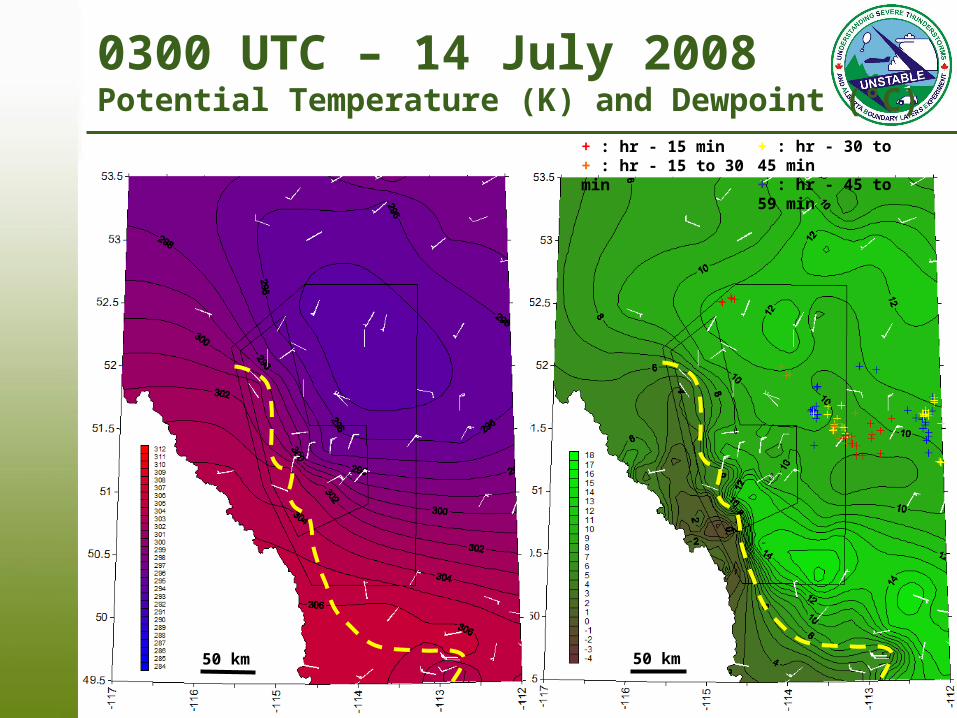
0300 UTC – 14 July 2008Potential Temperature (K) and Dewpoint (°C)
+ : hr - 15 min+ : hr - 15 to 30 min
+ : hr - 30 to 45 min+ : hr - 45 to 59 min
50 km 50 km
0400 UTC – 14 July 2008Potential Temperature (K) and Dewpoint (°C)
+ : hr - 15 min+ : hr - 15 to 30 min
+ : hr - 30 to 45 min+ : hr - 45 to 59 min
50 km 50 km
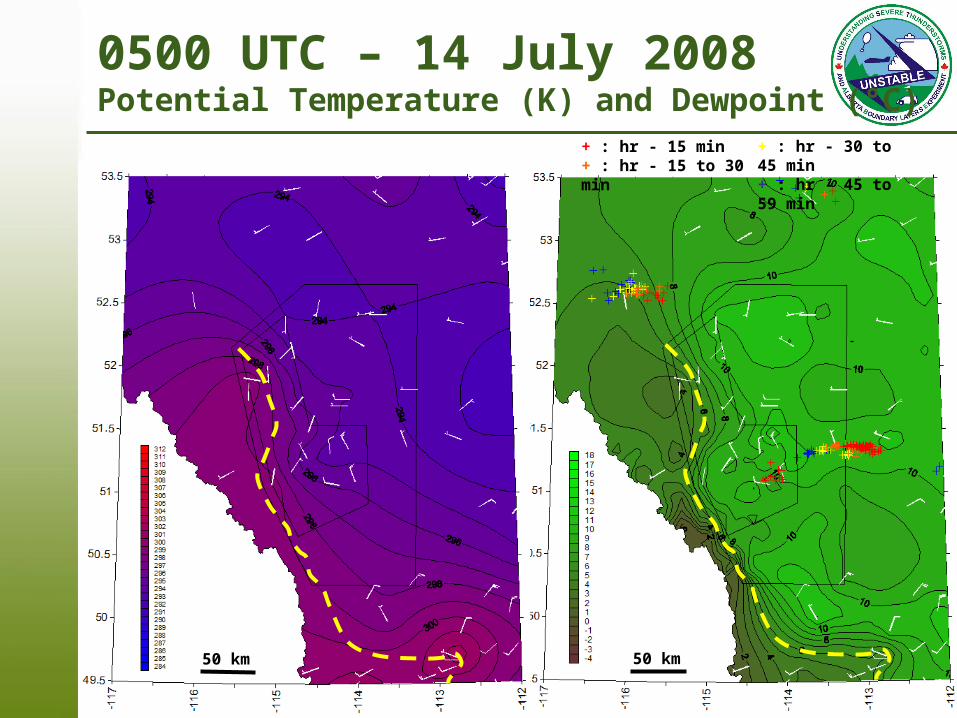
0500 UTC – 14 July 2008Potential Temperature (K) and Dewpoint (°C)
+ : hr - 15 min+ : hr - 15 to 30 min
+ : hr - 30 to 45 min+ : hr - 45 to 59 min
50 km 50 km
0600 UTC – 14 July 2008Potential Temperature (K) and Dewpoint (°C)
Dry ABL (MB1): ~ 3700 m, warmer, westerly winds nearly throughout
Moist ABL (MB2)*: ~ 1400 m, cooler, veering winds
00 UTC Td
MB1
MB2
Elevated Residual Layer
* MB2 appears to be under influence of storm outflow at this time
MB1 (Blue) and WVX (Red)Soundings Valid 00 UTC
Dry ABL (MB1): ~ 3700 m, warmer, westerly winds nearly throughout
Moist ABL (MB2)*: ~ 750 m, cooler, veering winds
00 UTC Td
MB1
Elevated Residual Layer
* MB2 is 68 km SE of MB1
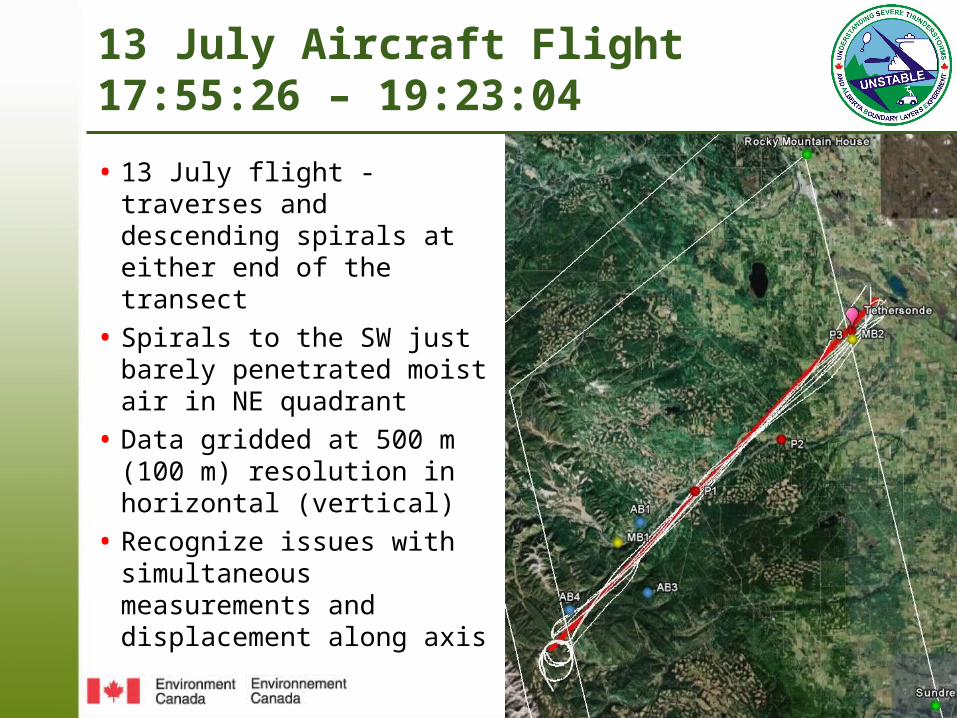
13 July Aircraft Flight17:55:26 – 19:23:04
• 13 July flight - traverses and descending spirals at either end of the transect
• Spirals to the SW just barely penetrated moist air in NE quadrant
• Data gridded at 500 m (100 m) resolution in horizontal (vertical)
• Recognize issues with simultaneous measurements and displacement along axis
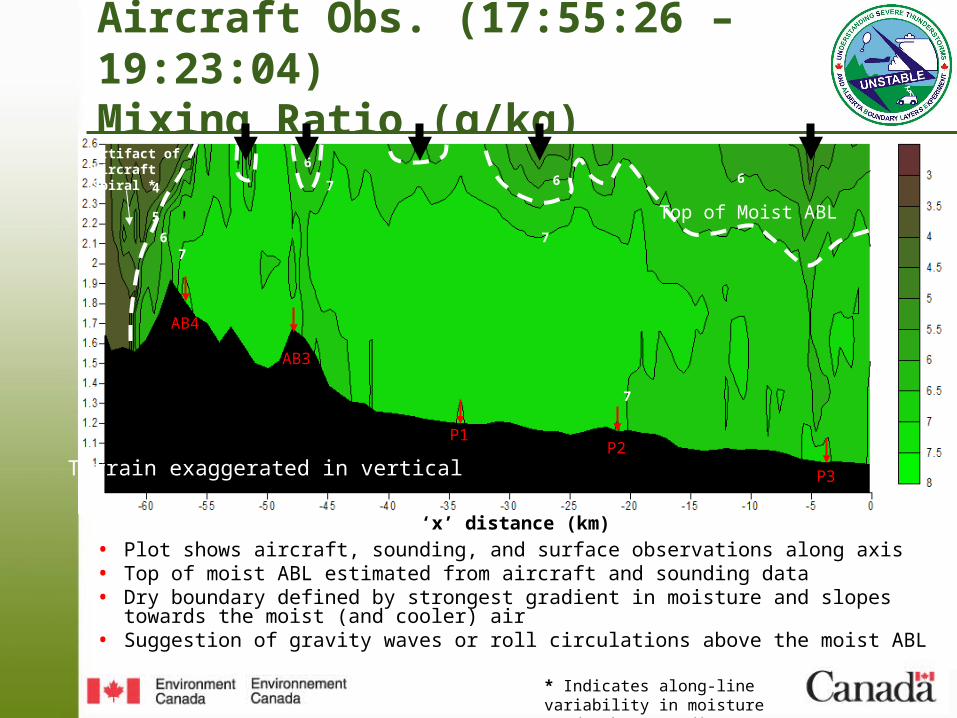
Aircraft Obs. (17:55:26 – 19:23:04) Mixing Ratio (g/kg)
• Plot shows aircraft, sounding, and surface observations along axis• Top of moist ABL estimated from aircraft and sounding data• Dry boundary defined by strongest gradient in moisture and slopes towards the moist
(and cooler) air• Suggestion of gravity waves or roll circulations above the moist ABL
66
6
5
46
77
7
7
Terrain exaggerated in vertical
AB4
AB3
P1P2
P3
Artifact of aircraft Spiral *
* Indicates along-line variability in moisture (and other) gradient(s)
‘x’ distance (km)
Top of Moist ABL
Aircraft Obs. (17:55:26 – 19:23:04) Potential Temperature (K)
306
30530
4
303
302
301
300
301
302
303
304
301
302
303
300
• Top of moist ABL from previous figure – within θ gradient• From surface maps and aircraft observations there may be a separation between
cooler, capped air downslope (NE) and thermal transition zone toward moisture boundary upslope (SW)
• Convective inhibition weakened in transition zone favouring CI closer to the moisture / convergence boundary
Terrain exaggerated in vertical
AB4
AB3
P1P2
P3
‘x’ distance (km)
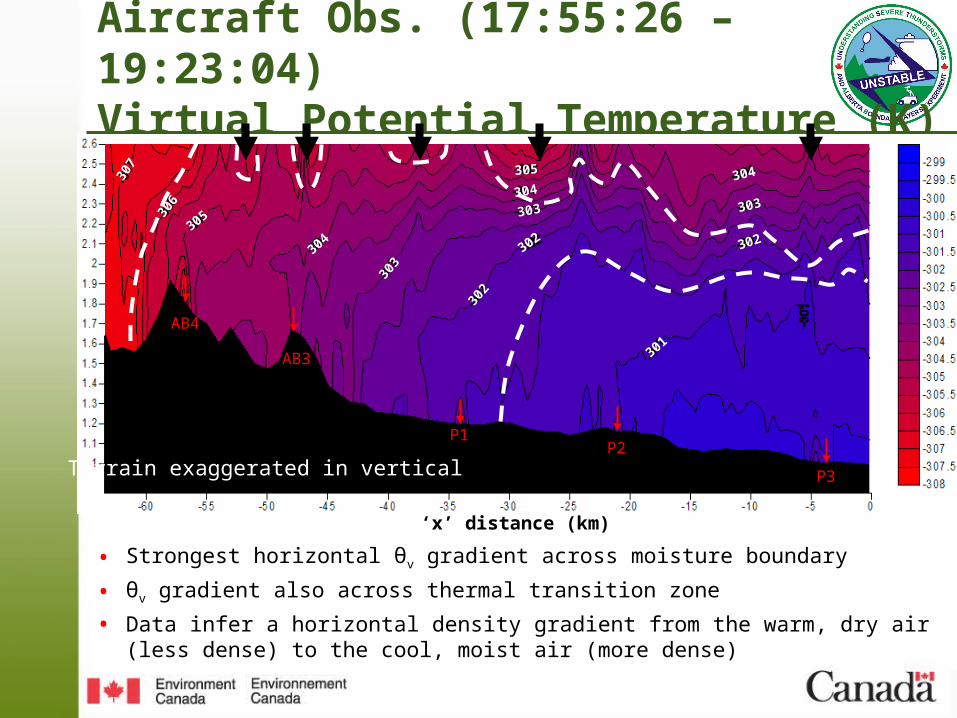
Aircraft Obs. (17:55:26 – 19:23:04) Virtual Potential Temperature (K)
303
304
302
302
301
305306
307
303304
305 304
303
302
AB4
AB3
P1P2
P3Terrain exaggerated in vertical
• Strongest horizontal θv gradient across moisture boundary
• θv gradient also across thermal transition zone
• Data infer a horizontal density gradient from the warm, dry air (less dense) to the cool, moist air (more dense)
‘x’ distance (km)
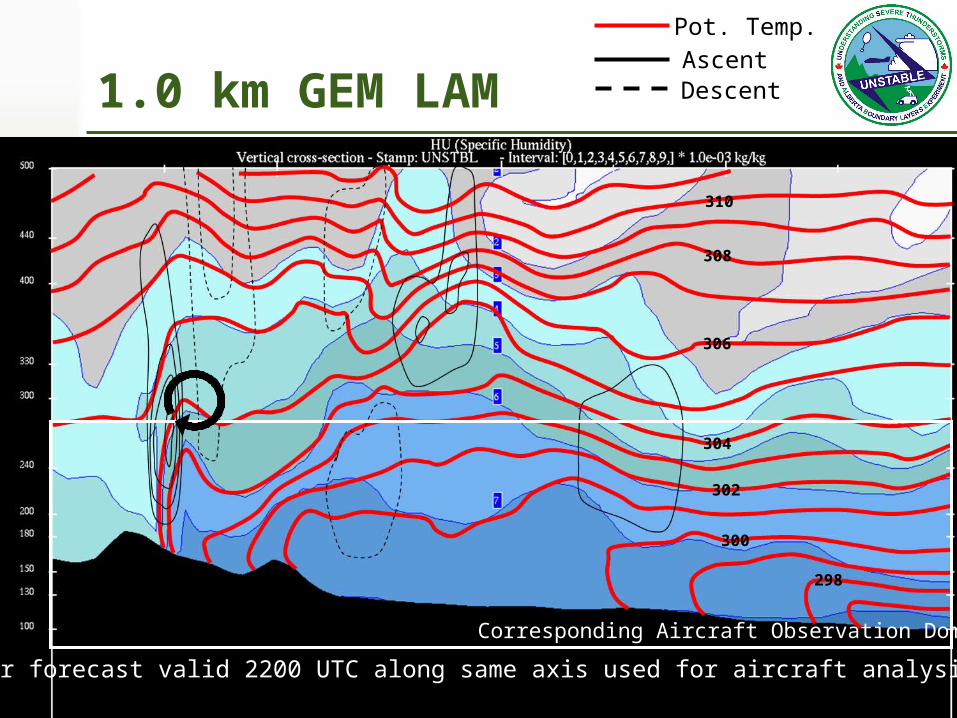
1.0 km GEM LAM
300
298
302
304
Pot. Temp.AscentDescent
T+7 hr forecast valid 2200 UTC along same axis used for aircraft analysis
306
308
310
Corresponding Aircraft Observation Domain
Ziegler and Rasmussen (1998)
Conceptualization
Cool, moist and capped ABL
Thermal transition zone between moisture boundary to the SW and cooler, capped ABL to the NE (CIN reduced towards moisture boundary)
Warm, dry air mixed to the surface.
Elevated Residual Layer overrunning capped ABL
Gravity waves or remnant role circulations(?)
Terrain exaggerated in vertical
1-1.5 km
Component of flow upslope
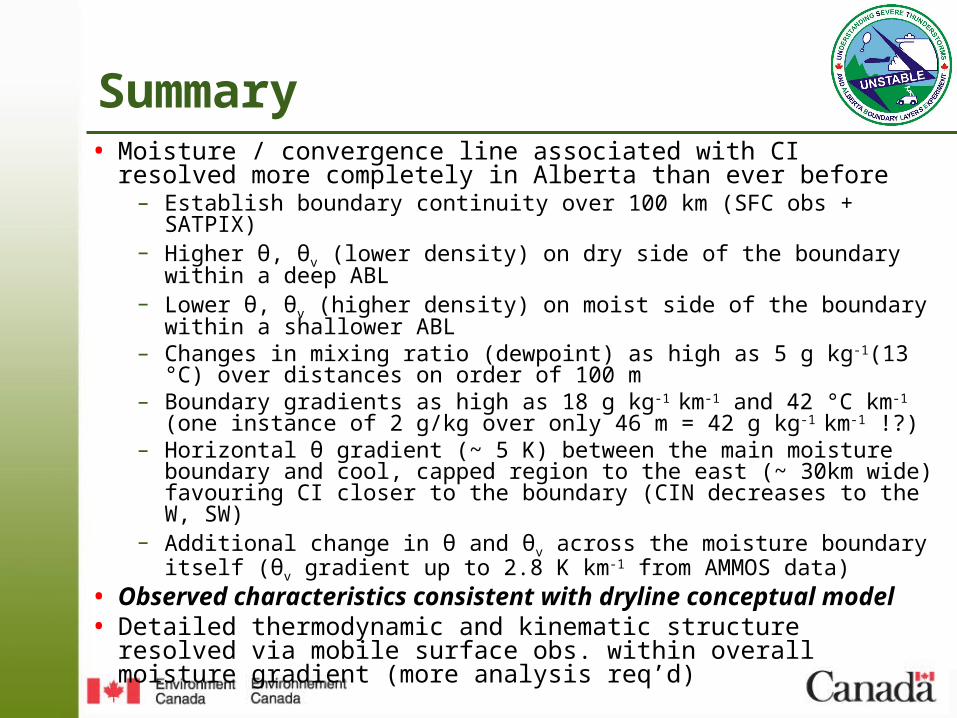
Summary• Moisture / convergence line associated with CI resolved more
completely in Alberta than ever before– Establish boundary continuity over 100 km (SFC obs + SATPIX)– Higher θ, θv (lower density) on dry side of the boundary within a deep
ABL– Lower θ, θv (higher density) on moist side of the boundary within a
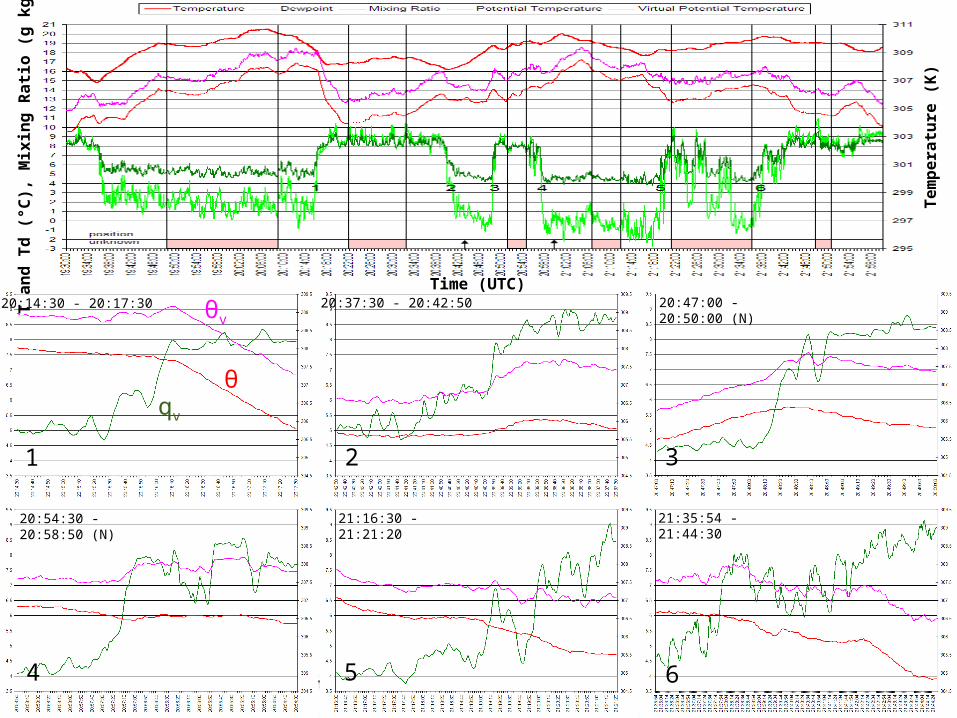
shallower ABL– Changes in mixing ratio (dewpoint) as high as 5 g kg-1(13 °C) over
distances on order of 100 m– Boundary gradients as high as 18 g kg-1 km-1 and 42 °C km-1 (one
instance of 2 g/kg over only 46 m = 42 g kg-1 km-1 !?)– Horizontal θ gradient (~ 5 K) between the main moisture boundary and
cool, capped region to the east (~ 30km wide) favouring CI closer to the boundary (CIN decreases to the W, SW)
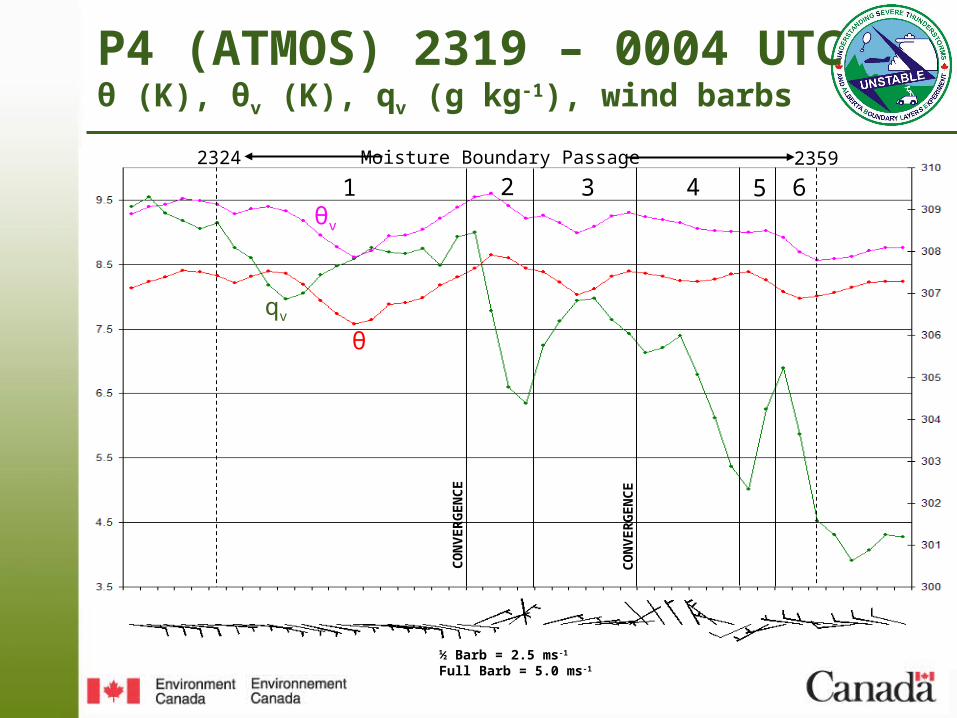
– Additional change in θ and θv across the moisture boundary itself (θv gradient up to 2.8 K km-1 from AMMOS data)
• Observed characteristics consistent with dryline conceptual model
• Detailed thermodynamic and kinematic structure resolved via mobile surface obs. within overall moisture gradient (more analysis req’d)
UNSTABLE Status• Analysis ongoing with plans for two papers in the short term
– BAMS article providing overview of the project and variety of preliminary results
– A more detailed look at 13 July focussing on dryline characteristics• Still many questions to be answered including
– Relative importance of moist / dry air processes for dryline genesis/evolution?
– Formal association of observed dryline to CI and storms?– How use conceptual model + operational observation networks to ID,
monitor, and nowcast dryline evolution and CI in operational setting?• Preparations to begin soon for full-scale project tentatively
scheduled for summer 2012– Mobile radar (!) including refractivity data– Flux measurements (surface and airborne)– Additional instrumented aircraft– More mesonet stations / soundings– Longer observation period– Changes to domain, station placement (?)
Acknowledgements / References
Acknowledgements• Dr. Shawn Marshall, University of Calgary – Foothills Climate Array (FCA) surface
observations• Dr. Gerhard Reuter, University of Alberta – contributions to aircraft and mobile surface
observations• Blaine Lowry for production of surface maps
References• Hill, L. M., 2006: Drylines observed in Alberta during A-GAME. M.Sc. Thesis,
Department of Earth and Atmospheric Sciences, University of Alberta, 111pp.• Knott, S. R. J. and N. M. Taylor, 2000: Operational Aspects of the Alberta severe
weather outbreak of 29 July 1993. Nat. Wea. Digest, 24, 11-23.• Taylor, N. M., 2001: Genesis and Morphology of the Alberta Dryline. Presented at the
35th Annual CMOS Congress, Winnipeg, Manitoba.• Taylor, N. M., 2004: The dryline as a mechanism for severe thunderstorm initiation on
the Canadian Prairies. Presented at the 38th Annual CMOS Congress, Edmonton, Alberta.
• Ziegler, C. L. and E. N. Rasmussen, 1998: The initiation of moist convection at the dryline: Forecasting issues from a case study perspective. Wea. Forecasting, 13, 1106–1131.
• UNSTABLE 2008 was mainly funded from within Environment Canada with in-kind support from Canadian Universities (U of Manitoba, U of Alberta, U of Calgary)