129
THE UNITED REPUBLIC OF TANZANIA GUIDELINES FOR THE PREPARATION OF PLANS AND BUDGET 2018/19 MINISTRY OF FINANCE AND PLANNING NOVEMBER, 2017
THE UNITED REPUBLIC OF TANZANIA
GUIDELINES FOR THE PREPARATION OF PLANS
AND BUDGET 2018/19
MINISTRY OF FINANCE AND PLANNING
NOVEMBER, 2017

ii
iii
INTRODUCTION
1. The Plan and Budget Guidelines (PBG) is prepared pursuant to Section 21 of the
Budget Act No. 11 of 2015 and the Budget Regulations of 2015. The 2018/19 PBG is
the third in implementing the Five Year Development Plan 2016/17 – 2020/21 (FYDP
II). The preparation of PBG takes into account: the 2015 Ruling Party Election
Manifesto, FYDP II and other Government directives.
2. The main objective of PBG is to guide mobilization and allocation of financial
resources for the implementation of Annual Development Plan and Budget for 2018/19
towards attaining socio-economic development and poverty reduction. Thus, PBG
provides guidance to all Accounting Officers in Ministries, Independent Departments
and Agencies (MDAs), Regional Secretariats (RSs), Local Government Authorities
(LGAs), and Public Institutions and Statutory Corporations (PISCs) to prepare their
plans and budget in line with the Government Acts, Regulations, Circulars and other
Government provisions.
3. The 2018/19 PBG is organized in two parts. Part one provides the generic
instruction for preparation of plan and budget in order to achieve the desired outcomes
in 2018/19. Part two contains details on the review of economic developments in
2016/17 and first quarter of 2017/18, and initial estimates of resource envelope and
expenditure framework for 2018/19. Both sections should be read concurrently, such
that, the 2018/19 projections should take into account issues addressed in section one.
These Guidelines should also be read together with its Annex which contains generic
forms which provide details on the plan and budget submission, implementation and
reporting.
4. Accounting Officers are instructed to ensure efficient utilization of public funds by
allocating resources into strategic areas with a large multiplier effect in attaining the
FYDP II objectives. Among the priority areas include: increasing electricity generation
by using various sources; strengthening mining sector by enhancing tax administration;
construction and rehabilitation of transport and communication infrastructure which will
include among others construction of central line Standard Gauge Railway (SGR),
strengthening of airports, and strengthening roads networks; strengthening agriculture
including irrigation infrastructure; strengthening livestock and fishing sectors; improving
health, education and clean water and sanitation; develop and promote tourists
attractions in the country including construction of enabling infrastructure; and
strengthen and improve industrial activities.
iv
PART I
INSTRUCTIONS FOR PLANS AND BUDGET

v

vi
TABLE OF CONTENTS
INTRODUCTION ................................................................................................................ iii
1.0 REFORMS ON BUDGETING SYSTEMS ........................................................................ 1
2.0 PREPARATION OF PLANS AND BUDGETS .................................................................. 3
3.0 RESOURCE ENVELOPE AND EXPENDITURE FRAMEWORK ........................................... 6
4.0 OTHER ISSUES TO BE CONSIDERED DURING PLAN AND BUDGET PREPARATION .......12
5.0 SPECIFIC INSTRUCTIONS FOR RSs & LGAs ..............................................................16
6.0 MONITORING, EVALUATION AND PERFORMANCE REPORTING ..................................18
7.0 CONCLUSION .........................................................................................................19
PART II ............................................................................................................................21
BUDGET REVIEW AND OUTLOOK .......................................................................................21
CHAPTER ONE ..................................................................................................................23
REVIEW OF RECENT ECONOMIC DEVELOPMENT AND MACROECONOMIC OUTLOOK ..............23
1.1 Overview ...............................................................................................................23
1.2 Recent economic Development ................................................................................24
1.2.1 Domestic Economic Development ..................................................................24
1.2.2 GDP Growth for East Africa Community Member States (EAC) .........................25
1.3 Review of Budget Implementation for 2016/17 .........................................................27
1.3.1 Domestic Revenue .......................................................................................27
1.3.2 External Resources ......................................................................................30
1.3.3 Expenditure ................................................................................................31
1.3.4 National Debt ..............................................................................................32
1.4 Monetary and Credit Developments .........................................................................33
1.4.1 Money Supply..............................................................................................33
1.4.2 Currency in circulation..................................................................................34
1.4.3 Liquidity Management and Interest Rates Developments .................................35
1.4.4 Exchange Rate Developments .......................................................................36
1.4.5 Banking Sector Performance Indicators .........................................................37
1.5 External Sector Development ..................................................................................38
1.6 Macroeconomic Outlook in the Medium Term ............................................................39
vii
1.6.1 Global Economic Growth and Outlook ............................................................39
CHAPTER TWO .................................................................................................................45
RESOURCE ENVELOPE AND EXPENDITURE FRAMEWORK FOR THE PERIOD 2018/19 - 2020/21
............................................................................................................................45
2.1 Introduction ...........................................................................................................45
2.2 Fiscal Policy ...........................................................................................................46
2.2.1 Revenue Policies ..........................................................................................46
2.2.2 Expenditure Policy .......................................................................................48
2.2.3 Management of Domestic Arrears .................................................................49
2.2.4 Deficit Financing Policy .................................................................................49
2.3 Resources Allocation Criteria ...................................................................................54
2.3.1 Recurrent Expenditure .................................................................................54
2.3.1.1 Specific Criteria for Regional Secretariats ............................................55
2.3.1.2 Criteria for Local Government Authorities ............................................55
2.3.2 Development Expenditure ............................................................................56
ANNEX:PLAN AND BUDGET SUBMISSION, IMPLEMENTATION AND REPORTING FORMARTS ...58
viii
LIST OF ACRONYMS
ADP Annual Development Plan
AGOA Africa Growth and Opportunity Act
AIDS Acquired Immune Deficiency Syndrome
ARV Antiretroviral
ATCL Air Tanzania Company Limited
ATM Average Time to Maturity
ATR Average Time to Re-fixing
BRN Big Results Now
CDR Council Development Reporting
CFR Council Financial Reporting
CFS Consolidated Fund Services
CHF Community Health Fund
CNHI China Merchant Holding International
DART Dar es Salaam Rapid Transit
DCF Development Cooperation Framework
DPs Development Partners
DRC Democratic Republic of Congo
DSA Debt Sustainability Analysis
DSF Debt Sustainability Framework
DUCE Dar es Salaam University College of Education
EAC East Africa Community
EFD Electronic Fiscal Devices
ENCB External Non Concessional Borrowing
EPZ Export Processing Zone
EPZ Economic Processing Zone
EU European Union
FEWSNET Famine Early Warning System Network
FYDP Five Year Development Plan
GBP Great Britain Pound
GBS General Budget Support
GDP Gross Domestic Product
GNI Gross National Income
GWh Giga Watts Hour
HIPC Highly Indebted Poor Countries
HIV Human Immunodeficiency Virus
ICT Information Communication Technology
IFMS Integrated Financial Management Systems
IMF International Monetary Fund
JAST Joint Assistance Strategy for Tanzania

ix
JNIA Julius Nyerere International Airport
KIA Kilimanjaro International Airport
KPIs Key Performance Indicators
LGAs Local Government Authorities
LGDG Local Government Development Grant
LICs Low Income Countries
LTPP Long Term Perspective Plan
M3 Extended Broad Money Supply
MDAs Ministries, Independent Departments and Agencies
MDGs Millennium Development Goals
MDRI Multilateral Debt Relief Initiatives
MEST Ministry of Education, Science and Technology
MKUKUTA Mkakati wa Kukuza Uchumi na Kupunguza Umaskini
MoFP Ministry of Finance and Planning
MSCL Marine Service Company Limited
MTEF Medium Term Expenditure Framework
MUCE Mkwawa University College of Education
MW Mega Watts
NDC National Development Corporation
NDS National Debt Strategy
NER Net Enrolment Rate
NFA Net Foreign Assets
NHIF National Health Insurance Fund
NKRAs National Key Results Areas
NOP Net Open Position
OC Other Charges
ODA Official Development Assistance
OFC Optic Fibre Cable
OPEC Organisation of Petroleum Exporting Countries
OTR Office of the Treasury Registrar
PBB Program Based Budget
PBG Plan and Budget Guidelines
PC Planning Commission
PE Personnel Emoluments
PIM-OM Public Investment Management - Operational Manual
PMO Prime Ministers’ Office
PO-PSMGG
President Office, Public Service Management and Good Governance
PO-RALG Presidents’ Office - Regional Administration and Local Government
PPP Public Private Partnership
PV Present Value
RSs Regional Secretariats’
x
SADC Southern Africa Development Community
SAGCOT Southern Agriculture Growth Corridor of Tanzania
SDGs Sustainable Development Goals
SEZ Special Economic Zone
SIDO Small Industry Development Organisation
SME Small and Medium Enterprise
STI Science, Technology and Innovation
TADB Tanzania Agricultural Development Bank
TANCIS Tanzania Customs Integrated System
TANESCO Tanzania Electricity Supply Company
TAZARA Tanzania – Zambia Railways Authority
TDV Tanzania Development Vision
TRA Tanzania Revenue Authority
TRL Tanzania Railways Limited
TTCL Tanzania Telecomunications Company Limited
UK United Kingdom
USA United State of America
USD United States Dollar
VAT Value Added Tax
WEO Ward Executive Officers
WEO World Economic Outlook

1
1.0 REFORMS ON BUDGETING SYSTEMS
1.1 Introduction
1. The Government has continued to carry out reforms in legal framework, payment
systems and the budget systems in its effort to improve management of public finance
and service delivery. Some of these recent reforms are as follows:
1.1.1 Legal Reforms
2. The Public Finance Act, CAP 348 has been amended by introducing Section 44
which provide legal mandate to embrace the utilization of ICT in collection of public
revenues. In addition, the Act obliges the Accounting Officers to utilize the GePG in
collection of revenues.
1.1.2 Use of ICT in Public Financial Management (PFM)
3. In its effort to reduce administrative costs and increasing efficiency in revenue
collection, payments of salaries, and goods and services, the Government has
introduced several systems which are:-
(i) Government e-Payment Gateway (GePG)
4. The new e-payment gateway system is an electronic system for tracking all
revenue collection by the Government. The Accounting Officer are instructed to
optimize the utilization of GePG to enhance control and visibility of the Government
funds; minimize leakages; increase collection efficiency; enhance accurate real time
reporting and forecasting of revenue.
(ii) Central Budget Management System (CBMS)
5. The new web based Central Budget Management System (CBMS) provides
improvement on budget preparation, allocation, implementation (execution) and
performance reporting. Some of the improvement includes use of the new Chart of
Accounts, revised GFS Codes 2014, cash flow forecasting, warrant releases and
recording of multiyear projects commitments. The system is expected to reduce time
spent on budget preparation as well as performance reporting. This system will be used
by MDAs and RSs in the preparation, allocation, implementation and performance
reporting with effect from 2018/19 budget. The CBMS replaces the use of SBAS in the
budget preparation.
2
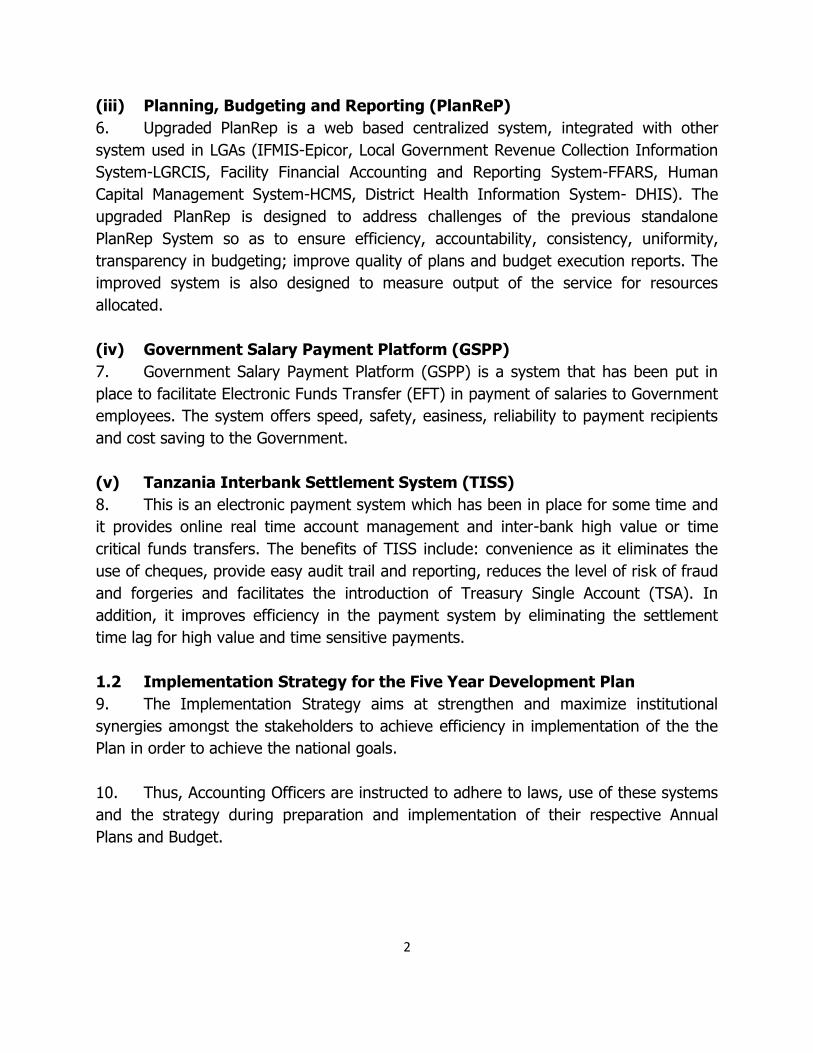
(iii) Planning, Budgeting and Reporting (PlanReP)
6. Upgraded PlanRep is a web based centralized system, integrated with other
system used in LGAs (IFMIS-Epicor, Local Government Revenue Collection Information
System-LGRCIS, Facility Financial Accounting and Reporting System-FFARS, Human
Capital Management System-HCMS, District Health Information System- DHIS). The
upgraded PlanRep is designed to address challenges of the previous standalone
PlanRep System so as to ensure efficiency, accountability, consistency, uniformity,
transparency in budgeting; improve quality of plans and budget execution reports. The
improved system is also designed to measure output of the service for resources
allocated.
(iv) Government Salary Payment Platform (GSPP)
7. Government Salary Payment Platform (GSPP) is a system that has been put in
place to facilitate Electronic Funds Transfer (EFT) in payment of salaries to Government
employees. The system offers speed, safety, easiness, reliability to payment recipients
and cost saving to the Government.
(v) Tanzania Interbank Settlement System (TISS)
8. This is an electronic payment system which has been in place for some time and
it provides online real time account management and inter-bank high value or time
critical funds transfers. The benefits of TISS include: convenience as it eliminates the
use of cheques, provide easy audit trail and reporting, reduces the level of risk of fraud
and forgeries and facilitates the introduction of Treasury Single Account (TSA). In
addition, it improves efficiency in the payment system by eliminating the settlement
time lag for high value and time sensitive payments.
1.2 Implementation Strategy for the Five Year Development Plan
9. The Implementation Strategy aims at strengthen and maximize institutional
synergies amongst the stakeholders to achieve efficiency in implementation of the the
Plan in order to achieve the national goals.
10. Thus, Accounting Officers are instructed to adhere to laws, use of these systems
and the strategy during preparation and implementation of their respective Annual
Plans and Budget.

3
2.0 PREPARATION OF PLANS AND BUDGETS
2.1 Introduction
11. Procedures and schedules in Plan and Budget preparations should be adhered to.
MDAs, RSs, LGAs and PISCs are required to have plans that take into account goals and
objectives of the Tanzania Development Vision 2025, FYDP II and institutional Strategic
Plans. These plans should be reflected in annual budget implementations and in the
medium term. Instructions are provided to be followed in different stages of preparation
of institutional plans and budgets for 2018/19.
2.2 Roadmap for Plans and Budget Submission
12. Preparation of plans and budget estimates for MDAs, RSs, LGAs and PISCs
should start immediately following the approval of this PBG using the Medium Term
Expenditure Framework (MTEF). The MTEFs should be submitted to MoFP for
scrutinization during the first week of February, 2018. RSs and LGAs are directed to
prepare and submit their estimates to the President’s Office – Regional Administration
and Local Government (PO-RALG) after approval by their respective Legislative
Authorities by the third week of January, 2018.
13. MoFP will facilitate technical scrutinization of MTEFs and consolidate MDAs’
budget estimates for submission to their respective Parliamentary Sectoral Standing
Committee from the third week of March, 2018 to the first week of April, 2018 for policy
prioritization scrutiny and recommendations for adjustment and improvement, if any.
Thereafter, the consolidated budget estimates will be submitted to the Parliament for
deliberation and approval from second week of April to fourth week of June, 2018.
Budget implementations will commence from 1st July, 2018 to 30th June, 2019
2.3 Budget Dialogue and Committees
14. Initial preparation of the plans and budgets at all levels of MDAs, RSs, LGAs, and
PISCs should start immediately following the approval of this PBG under close
supervision of Accounting Officers. The proposed plans and budgets must be presented
to their respective Worker’s Councils for guidance and approval in accordance with the
Public Service Negotiation Machinery Act, CAP 105.
15. The Budget Committees in Government and Public Institutions and Statutory
Corporations (PISCs) have specific roles in budget preparation including initial
scrutinization to enhance ownership. The Section 17(3) of the Budget Regulations of
2015 should be observed by the Budget Committees during the preparation of

4
institutional plans and budgets. Accounting Officers for PISCs are required to adhere to
Directives and Circulars issued by the Treasury Registrar. In addition, MTEFs should be
prepared and submitted in the format described in the Annex.
2.4 Budget Scrutinization Process and Submission
16. The Ministry of Finance and Planning (MoFP) in collaboration with President’s
Office, Public Service Management and Good Governance (PO-PSMGG); President’s
Office, Regional Administration and Local Government (PO-RALG); Office of the
Treasury Registrar (OTR); and other Stakeholders shall conduct budget scrutinization
on revenue and expenditure estimates of the MDAs, RSs, LGAs and PISCs pursuant to
Section 22(1) of the Budget Act No. 11 of 2015.
17. During budget scrutinization, MDAs, RSs, LGAs and PISCs are required to submit
two (2) hard copies and soft copy of their MTEF to MoFP and thereafter, submit two (2)
final signed hard and soft copies to the same authority. RSs and LGAs are also required
to submit one (1) final signed copy of MTEF to PO-RALG. Similarly, PISCs are required
to submit a soft copy and four (4) final signed hard copies of MTEFs, such that two (2)
submitted to their respective parent ministries and the other two (2) submitted to OTR.
2.5 Data Entry into the Budget System
18. According to the roadmap of budget preparation and scrutinization, Accounting
Officers are required to:
i. Timely complete data entry and ensure accuracy of data;
ii. Adhere to the Government Finance Statistics (GFS) 2014 codes and project
coding as provided by MoFP;
iii. Use standard units of measure especially those provided for in the CBMS; and
iv. Ensure use of standard unit costs on overheads estimates such as rent,
electricity, water and telephones.
2.6 Priority areas for the Year 2018/19
19. Priority areas and projects to be implemented in 2018/19 have been derived
from the FYDP II and its implementation strategy. Amongst the priority areas, special
emphasis will be on the following areas:
i. Electricity: In order to enhance industrial development, electricity is among the
catalyst and is a basic input. In order to achieve that, emphasis will be on
ensuring the availability of reliable power which will include construction of
production, transportation and distribution of power infrastructure;

5
ii. Minerals: Improving control to ensure anti-smuggling of minerals and illegal
trading, enhancing tax administration to curb tax evasion loopholes in the mining
sector and facilitating value addition activities on minerals within the country
which shall include construction of smelters;
iii. Construction of rehabilitation of transport and communication
infrastructure: continue with cconstruction of Standard Gauge Railway line
from Dar es Salaam to Morogoro and construction of Morogoro – Makutopora
section and ensure availability and reliable source of power for SGR;
strengthening airports; and strengthening roads network;
iv. Agriculture: Strengthening agriculture for food self sufficiency and industrial
raw materials; developing irrigation infrastructure, increase accessibility and
affordability of agro inputs, improvement of agro research in crops and improved
seeds, improvement of extension services; enhancing agro processing and
availability of storage and markets linkages;
v. Livestock and Fishing: strengthening extension services on animal production
in-order to obtain quality animal products (hides and meat), improving
marketing, livestock production infrastructure and value addition of livestock
products; strengthening and improving fishing activities in deep sea and other
sources, construction of fishing ports, protection of marine resources and valued
addition in fishing products;
vi. Health: Construction of five regional hospital for new regions; strengthening of
training institutes to ensure availability of human resources; equip referral,
specialized and national hospitals with medical equipment and reagents,
improving maternity and child care services; improving surgical services in health
centres; improving specialized doctor services, ensure universal access to health
care services designed to reduce new HIV infections, HIV related mortality
(stigma and discrimination); and prevention of malaria through application of
biolarvicide; and strengthening the availability of markets for locally
manufactured drugs;
vii. Education: continue strengthening educational environment at all levels;
strengthening education quality control; continue implementation of free basic
education program; continue with construction and strengthening of vocational
training institutes; enhance capacity of issuing loans to higher leaning students;
strengthening research science, technology and innovation;
viii. Clean and Safe Water and Sewage Control: management of water sources
and quality of water; construction of strategic dams; improvement and
management of environment conservation and water sources; and continue with
6
improvement of infrastructure for clean water and sewage system and provision
of safe and clean water in rural, urban and commercial areas;
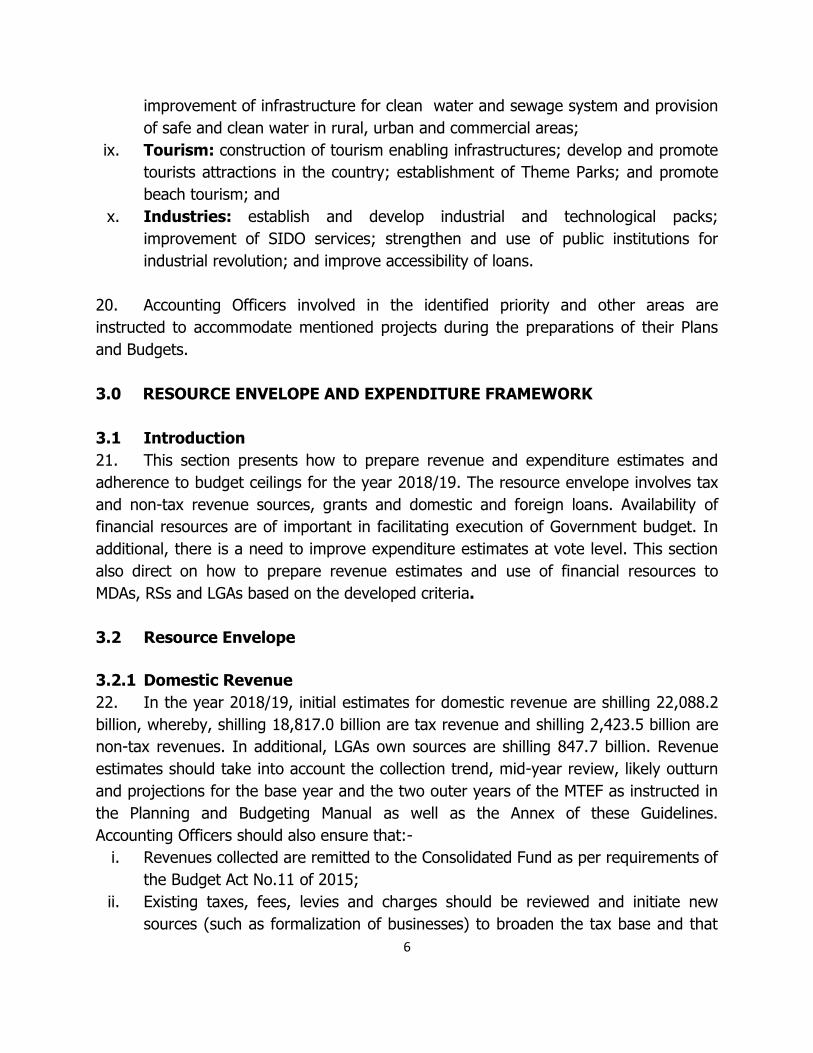
ix. Tourism: construction of tourism enabling infrastructures; develop and promote
tourists attractions in the country; establishment of Theme Parks; and promote
beach tourism; and
x. Industries: establish and develop industrial and technological packs;
improvement of SIDO services; strengthen and use of public institutions for
industrial revolution; and improve accessibility of loans.
20. Accounting Officers involved in the identified priority and other areas are
instructed to accommodate mentioned projects during the preparations of their Plans
and Budgets.
3.0 RESOURCE ENVELOPE AND EXPENDITURE FRAMEWORK
3.1 Introduction
21. This section presents how to prepare revenue and expenditure estimates and
adherence to budget ceilings for the year 2018/19. The resource envelope involves tax
and non-tax revenue sources, grants and domestic and foreign loans. Availability of
financial resources are of important in facilitating execution of Government budget. In
additional, there is a need to improve expenditure estimates at vote level. This section
also direct on how to prepare revenue estimates and use of financial resources to
MDAs, RSs and LGAs based on the developed criteria.
3.2 Resource Envelope
3.2.1 Domestic Revenue
22. In the year 2018/19, initial estimates for domestic revenue are shilling 22,088.2
billion, whereby, shilling 18,817.0 billion are tax revenue and shilling 2,423.5 billion are
non-tax revenues. In additional, LGAs own sources are shilling 847.7 billion. Revenue
estimates should take into account the collection trend, mid-year review, likely outturn
and projections for the base year and the two outer years of the MTEF as instructed in
the Planning and Budgeting Manual as well as the Annex of these Guidelines.
Accounting Officers should also ensure that:-
i. Revenues collected are remitted to the Consolidated Fund as per requirements of
the Budget Act No.11 of 2015;
ii. Existing taxes, fees, levies and charges should be reviewed and initiate new
sources (such as formalization of businesses) to broaden the tax base and that
7
all revenues shall be collected through electronic system (EFD) in order to
control revenue leakages. In addition, Accounting Officers are instructed to
award contracts only to suppliers, service providers and contractors who are
using EFDs;
iii. Entering into contracts with tax exemption clauses without prior approval by
Minister for Finance and Planning is avoided;
iv. Potential revenue sources as identified in the Financing Strategy of the FYDP II
are utilized in order to increase revenue collection;
v. Supervision and frequent inspections in the revenue collection centers such as
checkpoints, airports, ports and border posts are enhanced;
vi. Land use planning, survey and mapping should be undertaken for issuance of
title deeds;
vii. PISCs owned 100 percent by the Government should continue to submit their
revenue collection in the revenue accounts maintained at BOT and their
operational accounts maintained by their respective commercial banks;
viii. The selected PISCs should continue remitting to the Consolidated Fund the 15
percent of their gross revenues. All own sources collection should be reflected in
their respective MTEF document; and
ix. Performance contracts are entered with PO-PSMGG while PISCs should enter into
Performance Contracts with Office of Treasury Registrar (OTR), in order to
enhance efficiency and effectiveness in service delivery.
3.2.2 Grants and Concessional Loans
23. The Government is estimating to receive shilling 3,658.2 billlion from
Development Partners. Out of this, grants are estimated at shilling 946.0 billion,
concessional loans are estimated at shilling 2,153.3 billion and basket loans and grants
estimated at shilling 558.9 billion. However, of recent, trend in grants and concessional
loans were below commitment. In order to improve collection from this source,
Accounting Officers instructed to adhere to:
i. Timely completion of project write up and negotiation with Development
partners;
ii. Completion of all procedures required for project approval in the Government
budget before February 2018
iii. To ensure they fulfil agreed conditions with Development partners;
iv. Timely dissemination of project implementation reports; and
v. To have in place debt and grants management strategy during the first quarter
of the year.
8
3.2.3 Public Private Partnership
24. Accounting Officers of Contracting Authority (CA) are required to implement
Public Private Partnership (PPP) projects under the PPP arrangement in accordance with
PPP Act No. 18 of 2010 as amended in 2014.
25. Budget allocation to implement PPP projects will consider among other things
projects with feasibility study. Therefore, respective MDAs, RSs, LGAs and PISCs are
required to complete feasibility studies to enable implementation of those projects
under the PPP framework.
26. MDAs, RSs, LGAs and PISCs intending to partner with private sector should
conduct thorough feasibility studies before engaging private partners to implement such
projects. Therefore, Accounting Officers are required to:
i. Identify potential projects for PPP arrangement and submit to MoFP for scrutiny
as per PPP Act No. 18 of 2010 (as amended). In the case of RSs and LGAs
projects proposals should be submitted to PO-RALG for scrutiny and approval
and thereafter forwarded to MoFP;
ii. Integrate PPP projects into their sectoral strategies and plans;
iii. Submit to MoFP for appraisal of Government obligations such as feasibility
studies, viability gap funding (gap financing of the project), and availability
payment (claims for services rendered) and guarantees in PPP projects
implemented under their jurisdictions;
iv. Observe and comply to criteria for PPP projects to qualify for funding which
includes among others: feasibility study reports, affordability, value for money,
risk transfer, economic viability, financial and commercial viability; and
v. In implementing projects, commercial projects should be given first priority over
social projects.
3.3 Expenditure
27. Initial estimates in Government expenditure for the year 2018/19 are shilling
32,476.0 billion. Out of this, recurrent expenditure are estimated at shilling 20,227.6
billion including shilling 7,627.7 billion as wages and salaries. Development expenditure
are estimated at shilling 12,248.3 billion. Out of this, shilling 9,536.2 billion are locally
financed development expenditure.
9
3.3.1 Recurrent Expenditure
a. Personnel Emoluments and Remuneration
28. Budget estimates for PE should take into account:- existing and new employees,
annual increments, promotions, and statutory contributions. Therefore, Accounting
Officers are required to comply with instructions issued by PO-PSMGG and OTR. In
preparing PE budget, the following should be observed:-
i. Human Capital Management Information System (HCMIS) should be used in the
preparation of PE budgets for 2018/19;
ii. Payment of salaries for employees should abide to Treasury Circular No.2 of
2017 on the use of Government Salary Payments Platform (GSPP);
iii. Acting allowance dues to officer not holding substantive posts in respective of
duties should be part of PE budget and such payment will be made through the
payroll and not charged under OC budget. However, PO-PSMGG Circular No. 1 of
2015 instructed that acting allowances for reasons such as absence of the
incumbent due to illness, travel and leave will continue to be paid under the OC
budget;
iv. Conduct routinely human resource audit and ensure data cleaning as well as
undertaking an evaluation of existing staff in each cadre compared to actual
staffing level; and
v. Budgeting for payment of statutory contributions including gratuity for
contractual employees.
29. Accounting Officers should abide to the instructions issued by PO-PSM during
preparation of PE estimates while the PISCs should abide to guidelines issued by OTR.
b. Other Charges (OC)
30. Accounting Officers should ensure that, protected items and core functions
expenditure items are fully budgeted as per given ceiling in OC budget estimates. In
addition, Accounting Officers are required to allocate funds for payments of outstanding
commitments to service providers and suppliers and in order to avoid accumulation of
arrears and minimize costs accruing from interest and penalty. Also, they should
allocate funds for payments of employee’s outstanding claims.
c. Intergovernmental Fiscal Transfer
31. Fiscal transfers to LGAs will be granted to enable effective performance of their
main functions of providing social and economic services to their respective areas of
jurisdictions. The transfer grants will be provided in terms of Local Government

10
Development Grant, Recurrent Block Grants and Sector Specific Development Grants. In
2018/19, LGAs ceilings will be determined by considering resource allocation formula as
stipulated by different sectors including costs to cover fee for free education
(Capitation) for pre-primary, primary and ordinary secondary, responsibility allowance
for Head Teachers, Headmasters/Mistresses and Ward Education Coordinators, School
meals and schools with special needs. Part Two Chapter II provides more details on
resource allocation formula in MDAs, RSs and LGAs.
3.3.2 Development Budget
32. The Five Year Development Plan 2016/17-20/21 (FYDP II) is mandatory for
MDAs, RSs, LGAs and PISCs in the process of preparing development plans and budget
estimates. Accounting Officers are also instructed to use the Public Investment
Management Operational Manual (PIM-OM) as a guiding framework during preparation
of public investments projects. Special attention should be given to the following:
i. Continue with implementation of D by D policy by ensuring resources are
allocated to respective LGAs instead of MDAs;
ii. Allocation of funds for development projects shall be made to projects which
have been approved by MoFP;
iii. Take into consideration the priority areas in the PBG and intervention
areas/projects articulated in the Action Plan of the FYDP II Implementation
Strategy;
iv. Abide to FYDP II Communication, Financing, and Monitoring and Evaluation
Strategies;
v. Inclusion of ongoing development projects to the budget estimates;
vi. Valuation and compensation of land and property in strategic investment areas
for industrial development;
vii. Giving priority to industrial research geared towards facilitating development of
industries which utilize local materials;
viii. Facilitating development of industrial clusters and availability of simple and
affordable industrial technology;
ix. Payment of overdue debts to contractors to avoid costs accumulation of interest
and penalty;
x. Ensuring availability of enabling infrastructure for industrial investment;
xi. Preparation of strategic projects in line with the Annual Development Plan for
2018/19 requirements;
xii. Expenditure items to be financed using foreign funds should be clearly shown,
including the amount of funds required (form No.11B (D)); and
xiii. Set aside funds for monitoring and evaluation activities.
11
33. The Ministry of Finance and Planning will scrutinize and approve projects with
multi-year commitments as stipulated under Section 51 of the Budget Act No. 11 of
2015 and Public Private Partnership (PPP) Act No. 18 of 2010 as amended in 2014.
Likewise, the allocation of Local Government Development Grant will be guided by the
criteria stipulated in the Revised Local Government Development Grant Implementation
Guide.
34. Development budgets for foreign funded projects and programmes shall be
prepared by MDAs, RSs, LGAs and PISCs after confirmation of foreign resources. In this
case, it is essential for Accounting Officers to ascertain the following:-
i. Submit to MoFP the contracts of projects receiving foreign financial support;
ii. Submit quarterly progress reports of development projects to MoFP within 30
days after the end of each quarter;
iii. Submit Annual Performance Reports to MoFP not later than 15th October after
the end of financial year;
iv. Incorporate counterpart funds in their budgets;
v. Donor funded projects (including direct, reimbursable and cash categories) to be
reflected in the budget estimates; and
vi. Submit to MoFP on quarterly basis the report of cash, equipments and technical
assistance received through the D- Funds modality.
3.4 Criteria for Resource Allocation
35. The criteria for resource allocation will be determined in respect of the type of
Government expenditure (i.e Recurrent and Development expenditures) and in line with
core functions of the institution.
36. The Ministry of Finance and Planning will provide ceilings to all Votes to guide
them in the preparation of budget estimates. Ceilings for all Votes will be determined by
using existing criteria and formula developed and stipulated in these guidelines.
Accounting Officers are instructed to adhere to the approved budget ceilings for
2018/19 and allocate resources in line with their priorities. However, it should be noted
that there will be no additional budget provision outside the set ceilings.
12
4.0 OTHER ISSUES TO BE CONSIDERED DURING PLAN AND BUDGET
PREPARATION
4.1 Controlling Accumulation of Arrears
37. To avoid accumulation of arrears, Accounting Officers are instructed to operate
in accordance with Section 52(1) of the Budget Act No. 11 of 2015 and the Paymaster
General’s Circular No. 4 of 2014/15. Therefore, they are required to:
i. Ensure that existing arrears are verified by the Internal Auditor General;
ii. Prioritize budgeting for verified arrears;
iii. Refrain from committing new project without assurance of availability of funds;
and
iv. Committing all financial obligations through IFMS.
4.2 Contingent Liabilities
38. Accounting Officers are instructed to monitor guaranteed contracts that may lead
to creation of contingent liabilities and to take into account all the existing contingent
liabilities in their budget preparation. Also all existing contingent liabilities should be
disclosed in their final accounts.
4.3 Expenditure Control and Cost Reduction Measures
39. Accounting Officers are instructed to abide by Government expenditure policies
in line with the Budget Act, No. 11 of 2015, the Public Finance Act, CAP 348, the Local
Authorities Finances Act, CAP 290, the Procurement Act, CAP 410 and their respective
Regulations and other Government directives without compromising the quality of
service delivery. Therefore, they are instructed to:
i. Ensure that all contracts are quoted in Tanzanian Shilling to minimize
Government exposure to fiscal risks, unless the contracts involve international
companies;
ii. Continue implementing measures aimed at minimizing costs which include but
not limited to using Government facilities in conducting meetings, training,
seminars and workshops;
iii. Ensure that all commercially viable Public Institutions and Statutory Corporations
are operating profitably and not dependent upon Government subvention;
iv. Ensure value for money in the procurement of goods, services and works;
v. Control costs through periodic inspection of public utility systems (water,
telephone and electricity) and use energy saving technologies to avoid
unnecessary expenditure;
vi. Verify existing employees periodically to ensure salaries and wages are paid to
13
eligible employees only;
vii. Ensure that Embassies and Consulates use mortgage financing arrangement in
acquisition of buildings instead of renting;
viii. Continue with procurement of motor vehicles through Government’s Procurement
Services Agency (GPSA);
ix. Ensure that students’ loans in higher learning institutions are granted only to
eligible beneficiaries; and
x. Utilize e-Government system to facilitate communications among Government
Offices.
4.4 Exchange Rate
40. For budgeting purposes, the 2018/19 indicative exchange rate that will be used
to convert foreign currency to Tanzanian Shilling is 1 USD to Shilling 2,308.5.
4.5 Mainstreaming Cross-cutting Issues into Plans and Budgets
41. Accounting officers are instructed to allocate resources in 2018/19 budget to
cater for crosscutting issues such as gender, HIV and AIDS, people with disabilities,
population, social protection, child protection, youth and elderly people, and
environment in line with frameworks that guide integration of cross-cutting issues into
plans and budgets.
42. Accounting Officers responsible for the implementation of the National Plan of
Action to End Violence Against Women and Children (NPA-VAWC) should ensure their
2018/19 Budgets incorporate activities in line with NPA-VAWC 2017/18-2021/22.
43. Accounting Officers are required to allocate resources to continue implementing
reforms and initiatives in order to improve good governance, service delivery and
accountability. They include: (PFMRP) Phase V, Local Government Reform Program
(LGRP), Second Generation Financial Sector Reforms Programme (SGFRP), Anti-Money
Laundering, Africa Peer Review Mechanism (APRM) and National Human Rights Action
Plan Eradicating Corruption and promoting strong leadership, improve business
environment including land administration and formalization of properties, facilitation of
Government effectiveness and strengthening participation through Local Economic
Development (LED) approach thus, each institution is obliged to re-design their
programmes and allocate resources for effective implementation of their respective
reforms.
14
44. Accounting Officers from Line Ministries constituting the High Level Steering
Committee on Nutrition (HLSCN) should allocate resources for nutrition interventions as
enshrined in the National Multi-sectoral Nutrition Action Plan (NMNAP) 2016/17-
2020/21.
45. MDAs, RSs, LGAs and PISCs must ensure their budgets for 2018/19 incorporate
environment and climate change priorities in accordance with the Environmental
Management Act 2004, and the National Climate Change Strategy as follows:
i. Analyze likely environmental impacts (both positive and negative effects) of
planned activities and budget to address them through enhancement of positive
effects or mitigation of the negative ones;
ii. Ensure that Strategic Environmental Assessment (SEA) is undertaken during
preparation of policies and programs. The budget for SEA should be reflected
within MTEF;
iii. All new capital intensive projects will be required to conduct an Environmental
Impact Assessment (EIA) as part of their planning and ensure that budgets are
allocated for mitigation measures of negative impacts; and
iv. Ensure their role in monitoring of the sustainability indicators in the Sustainable
Development Goals is clearly indicated. Budgets should reflect environments
sustainability.
4.6 International and Regional Cooperation
46. With regards to International and Regional Cooperation MDAs, RSs and LGAs are
instructed to adhere to the following:-
i. Comply with instructions stipulated in the Development Co-operation Framework
(DCF) in implementing various agreements and treaties between Tanzania and
other countries;
ii. Mainstream EAC, SADC and other integration issues into their plans and budget;
iii. Submit to MoFP eligible contributions to international and regional organizations
for centralized budgeting and payment of all commitments;
iv. Submit to MoFP the required government contribution for development projects
implemented under counterpart arrangement for budget allocation;
v. To sensitise the public to utilize opportunities available in government plans in
regional and international cooperation arrangements; and
vi. Continue to build capacities specifically for Tanzania Embassies’ Government
officials for effective participation in international meetings and conferences with
special emphasis on economic diplomacy.
15
4.7 Management of Public Institutions and Statutory Corporation
47. Public Institutions and Statutory Corporations (PISCs) must ensure that they
operate efficiently and effectively so as to improve service delivery as well as generating
profit and contribute to the Government Consolidated Fund as required. Nonetheless,
management of PISCs must be aligned with good governance and institution
frameworks for improved service delivery.
48. In view of the above, OTR in particular is instructed to ensure:
i. Accounting officers of Public Institutions and Statutory Corporations minimize
administrative costs for efficient and effective performance. In the same way,
they must ensure that eligible institutions pay 15 percent contribution and
remittance are made quarterly;
ii. Every Public Corporation pays dividend in proportionate with what the
Government has invested. For other corporations in which the Government is a
minority shareholder, OTR should make sure that the Government stake is
monitored well;
iii. Collaboration with Accounting Officers of the sectoral Ministry is extended in
order to observe good governance and institution frameworks by appointing
competent board representatives who will ensure efficient and effective
performance of the institutions;
iv. Due diligence is undertaken so as to advice the Government on the
appropriate way of improving efficiency of the PISCs in accordance with
Treasury Registrar Act CAP 370, Sec 10(2b);
v. Follow up of remaining privatized farms and industries in collaboration with the
sectoral Ministries to ascertain whether they are operational. Engagement of
potential investors for revamping including Social Security Funds will highly be
considered to all farms and industries found to breach the asset and sale
agreements. Likewise, OTR will take measures to investors who breached sale
agreements on privatized government assets and repossessing such assets; and
vi. Physical verification of institutional owned land and landed properties is
undertaken for proper recording and custodianship of the Government asset in
collaboration with the sectoral Ministries.
4.8 Risk Management
49. The Treasury Circular No. 12 of 2012/2013 requires all Accounting Officers to
develop and implement an effective and robust risk management system. Therefore,
institutions are instructed to ensure that risk mitigation measures are integrated in their

16
plans and budgets by formulating targets for implementation of risk management
frameworks.
5.0 SPECIFIC INSTRUCTIONS FOR RSs & LGAs
50. In the financial year 2018/19 RSs and LGAs will continue implementing their core
functions of ensuring quality service delivery to the community. In the same vein they
are instructed to:
i. Planning, budgeting and budget management procedures should be conducted
through PlanRep system, unless instructed otherwise;
ii. Plans and budgets should be supported by accurate and reliable data;
iii. Maintain peace, order and tranquillity in their respective areas;
iv. Prepare and budget for Local Government Elections for the 2019 and include the
well-costed activities in their MTEF;
v. Ensure statutory meetings are conducted and put/upload resolutions in their
notice boards and websites respectively with special consideration on income and
expenditure reports of Villages/streets and Wards;
vi. Concentrate on the constructions, rehabilitations and equipping the existing
administrative areas;
vii. Identify settlements and other activities carried out in water catchment areas,
forest reserves and other reserved areas and prepare strategies to relocate those
communities;
viii. Continue reviewing strategic plans and profile to be in-line with the Ruling Party
Election Manifesto 2015, FYDP II and PO – RALG instrument and upload their
strategic plans in their websites;
ix. Monitor the implementation of D-by-D policy in their areas by ensuring that the
devolved functions and resources at Wards, Village/streets are well supervised in
order to achieve value for money objective;
x. Reinforce the use of Land Act No. 4 of 1999 and Village Land Act No. 5 of 1999
by strengthening land use planning in rural and urban areas and settle all issues
relating to land conflicts and also allocate land for industrial parks, MSMEs and
ensure that the areas are provided with basic infrastructure;
xi. Strengthen the use of e–Government to improve service delivery especially the
use of electronic devices in revenue collections and control of expenditure, the
use websites and planning and reporting system (the PlanRep, FFARS) to
increase efficiency, transparency, accountability and make the public well
informed with the Government business;
xii. Sensitize livestock keepers on the best livestock keeping practices in order to
have productive and manageable number of cattle, quality skin and hides for
17
industrial processing as well as avoiding conflict between livestock keepers and
farmers;
xiii. Ensure 40 to 60 percent of LGAs own source revenue is allocated and spent for
development activities. Taking into considerations to reinvest to the major
revenue generating sources (agriculture, fisheries, livestock, business etc) to
improve and sustain those sources;
xiv. Allocate 10 percent of council own source revenue for; Youth (4%), Women
(4%), and people with disabilities (2%) and monitor its implementations;
xv. Set aside funds for rehabilitations and constructions to improve social and
economic infrastructure in all sectors with major emphases in construction,
rehabilitations and equipping health facilities, classrooms, staff houses, latrines,
laboratories, hostels and dormitories. Priority should be to complete unfinished
projects, especially those initiated by communities;
xvi. Continue with construction, rehabilitation and equipping offices and residences
for RCs, RASs, DC, DASs and Offices for Divisional Secretaries, Wards and
Village/streets;
xvii. Carry over funds should be spent in accordance with Section 29(3) of the Budget
Act No. 11 of 2015 and the Budget Regulations of 2015;
xviii. Strengthen existing food and cash crops production and introduce new crops to
diversify risks and facilitate agro – processing industries;
xix. Indicate debt obligations from Local Government Loan’s Board (LGLB) in MTEF
through PlanRep to facilitate smooth repayment according to the approved
repayment schedule and contribution of minimum compulsory reserve;
xx. Given the budget preparation process from facility level (schools, dispensaries
and health centers), plans should be based on the identification of the Facility
code, and therefore budget will be analyzed based on the account where the
fund will be transferred to facility or council level;
xxi. Ensure provision of conducive working environment to employees through
provision of working tools and trainings;
xxii. Ensure that environmental issues such as climatic changes are properly
addressed during planning and implementation of projects;
xxiii. Ensure that child protection, nutrition and community development are included
in plans and budgets;
xxiv. Include requirements of vulnerable groups and people with special needs in the
plans and budgets in line with existing policies, laws and circulars; and
xxv. Facilitate TARURA to perform their mandated functions.

18
5.1 Specific Instructions to LGAs on Designing and Submission of Strategic
Projects for Revenue Generation
51. The LGAs are urged to explore and design strategic projects that will enhance
revenue generation and reduce dependence on Central Government grants. In attaining
this, LGAs are therefore required to: -
i. Identify and budget for strategic projects for revenue generation to be
implemented in the financial year 2018/19. Such projects include constructions of
bus stands, markets, car parking, abattoir, infrastructure for areas of services,
and other viable sectoral opportunities.
ii. Submit to MoFP projects for scrutinization to be considered for funding in year
2018/19. The following criteria should be considered: -
a) Projects included in the LGAs’ Strategic Plan and MTEF;
b) Projects with write-up documents and complete feasibility studies;
c) Projects with reliable opportunity to increase revenue;
d) Projects that LGAs have capacity to operate efficiently or in collaboration with
other stakeholders;
e) Projects that comply with sustainable industrial integration strategy, value
addition and packaging system; and
f) Projects that increase employment opportunities, income and well-being of
the citizens.
6.0 MONITORING, EVALUATION AND PERFORMANCE REPORTING
6.1 Introduction
52. Successful implementation of Plans and Budgets depends on effectiveness of
monitoring, evaluation and reporting systems. This has been accorded special emphasis
in 2018/19.
6.2 Monitoring and Evaluation
53. Performance of monitoring and evaluation will depend on prepared plans and
budget based on clear indicator, criteria and goals. Accounting Officers are instructed to
ensure that development projects, programme and activities designed are aligned with
clear indicator, criteria and goals which will be taken into account during project
implementation and monitoring as stipulated in the FYDP II Implementation Strategy
for realization of desired outcomes based on the approved budgets. Preparation of
plans and budget should adhere to the earmarked criteria.
19
54. After budget approval, MDAs, RSs, LGAs and PISCs are required:
i. To prepare action plan and cash flow plans;
ii. To adhere to the Medium Term Expenditure Framework;
iii. To adhere Public Investment Management - Operational Manual 2015;
iv. To adhere to FYDP II Monitoring and Evaluation Strategy (FYDP II-MES) so as to
achieve quality of public investments;
v. To allocate funds for conducting Monitoring and Evaluation; and
vi. To allocate funds for Human Capital development on Monitoring and Evaluation
skills.
6.3 Performance Reporting
55. Pursuant to Section 55(4) of the Budget Act No. 11 of 2015 and Section 30(5) of
the Budget Regulations of 2015, all Accounting Officers are required to submit quarterly
progress reports to MoFP within 30 days after the end of each quarter. In addition, they
are required to submit Annual Performance Reports to MoFP not later than 15th
October after the end of financial year.
56. Accounting Officers are required:
i. Submit Quarterly progress and annual performance reports in hard and soft
copies should be submitted to MoFP, PO-PSMGG, PO-RALG (for RSs and LGAs)
and OTR (for Public Entities); and
ii. Adhere to the formats provided in the Annex during plan and budget
preparation, implementation and performance reporting.
7.0 CONCLUSION
57. Accounting Officers are instructed to adhere to the instructions and its Annex,
and comply with the Budget Act No 11 of 2015 and the Budget Regulations of 2015 as
well as Government circulars and directives.

20
PART II
BUDGET REVIEW AND OUTLOOK

22
23
CHAPTER ONE
REVIEW OF RECENT ECONOMIC DEVELOPMENT AND MACROECONOMIC
OUTLOOK
1.1 Overview
1. Performance of the economy in the past five years (2012-2016) remained
buoyant with real GDP growing at an annual average rate of 6.7 percent supported
mainly by improvement in transport infrastructure, communication, construction and
financial services. In 2016, the economy grew by 7.0 percent, missing the target of 7.2
percent by 0.2 percentage point mainly on account of underperformance in agriculture
sector, which accounts for a significant share to GDP of 28.9 percent. During the first
half of 2017, real GDP grew by 6.8 percent compared with 7.7 percent in the
corresponding period in 2016. Real GDP growth is projected at 7.0 percent in 2017 and
further up to an annual average of 7.4 percent in the medium term. This projection
continues to be supported by successful implementation of FYDP II.
2. Inflation is still on check with single digit, mainly on account of increased food
supply in the domestic and neighbouring markets, general slowdown in global
commodity prices, particularly oil prices, and implementation of contractionary fiscal
policy. The value of Tanzanian shilling against the US dollar remained broadly stable
throughout 2016/17, consistent with liquidity conditions in the economy and the
improvement in the current account balance. Deficit in the current account narrowed
significantly to USD 1,353.3 million in 2016/17 from USD 2,954.2 million in 2015/16,
mainly on account of substantial decline in imports of goods and services.
3. During 2016/17, annual growth of monetary aggregates slowed down, with
broad money supply (M3) growing by 6.1 percent in June 2017, compared to 12.7
percent recorded in June 2016. Likewise, annual growth of credit to the private sector
slowed down from 19.1 percent recorded in June 2016 to a growth of 1.3 percent in
June 2017. The slowdown was on account of cautious measures taken by commercial
bank in lending to private sector following the increase in non-performing loans.
However, the banking sector remained sound, stable and profitable with levels of
capital and liquidity generally above regulatory requirements. The slowdown in growth
of credit to private sector may deny funds to private investment and trade, and
consequently affecting GDP performance. In addressing liquidity challenge in the
economy, the Government through Bank of Tanzania reduced the minimum reserve
24
requirement and discount rate with a view to broaden lending to private sector in order
to accelerate economic activities. In addition, the Government has continued to invest
in public infrastructure in a view to create conducive environment for private
investment.
1.2 Recent economic Development
1.2.1 Domestic Economic Development
GDP Growth
4. The real GDP growth between 2012 and 2016, remained strong, with real GDP
growing at an average rate of 6.7 percent. In 2016, real GDP grew by 7.0 percent
supported mainly by increase in power supply, specifically from natural gas; increase in
manufactured goods; stability in transport services; and increase in Government
spending on education which resulted from increased enrolment for standard one pupils
and form one students due to Government free basic education policy which started in
January 2016.
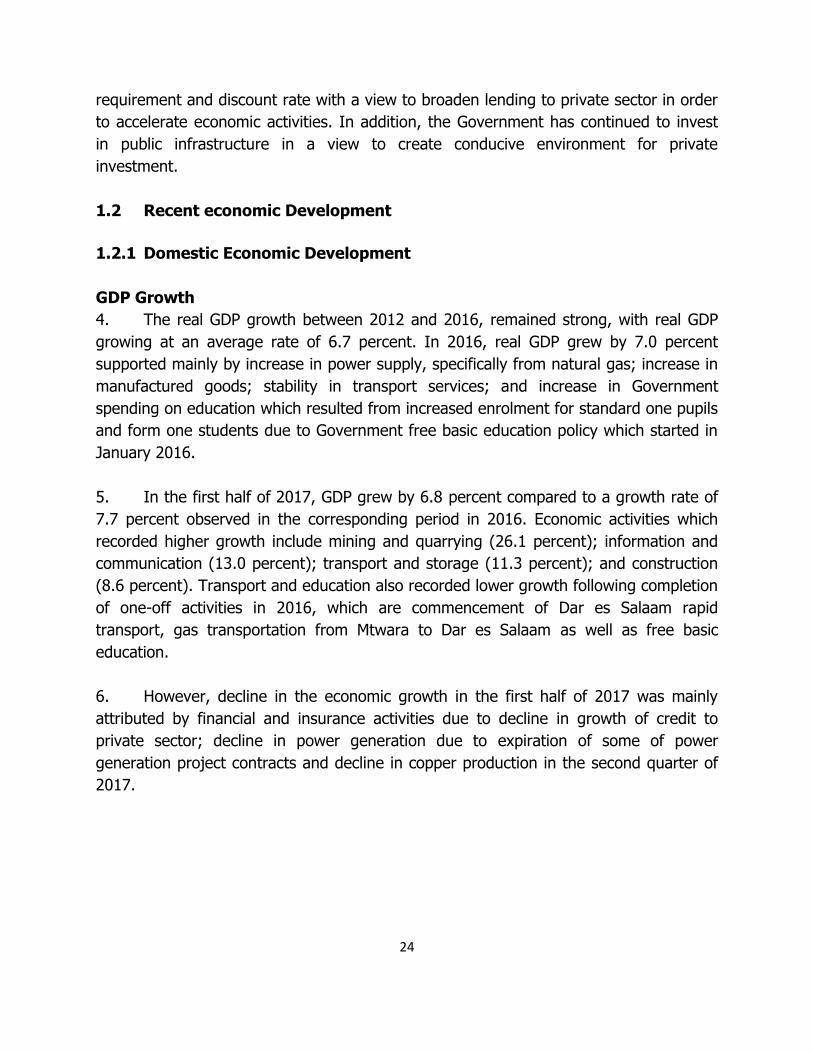
5. In the first half of 2017, GDP grew by 6.8 percent compared to a growth rate of
7.7 percent observed in the corresponding period in 2016. Economic activities which
recorded higher growth include mining and quarrying (26.1 percent); information and
communication (13.0 percent); transport and storage (11.3 percent); and construction
(8.6 percent). Transport and education also recorded lower growth following completion
of one-off activities in 2016, which are commencement of Dar es Salaam rapid
transport, gas transportation from Mtwara to Dar es Salaam as well as free basic
education.
6. However, decline in the economic growth in the first half of 2017 was mainly
attributed by financial and insurance activities due to decline in growth of credit to
private sector; decline in power generation due to expiration of some of power
generation project contracts and decline in copper production in the second quarter of
2017.
25
Chart 1.1: Semi Annual GDP Growth Rates by Selected Economic Activities (%)
2.7%
10.1
%
8.2%
4.7%
0.9%
10.0
%
5.5%
0.6%
17.4
%
12.4
%
13.0
%
20.6
%
8.6%
5.5% 7.
7%
3.1%
26.1
%
8.5%
2.3%
2.1%
8.6%
6.1%
3.4%
11.3
%
13.0
%
8.1%
-3.8
%
5.2% 7.
4%
6.8%
-10.0%
-5.0%
0.0%
5.0%
10.0%
15.0%
20.0%
25.0%
30.0%Semi Annual 2016 Semi Annual 2017
1.2.2 GDP Growth for East Africa Community Member States (EAC)
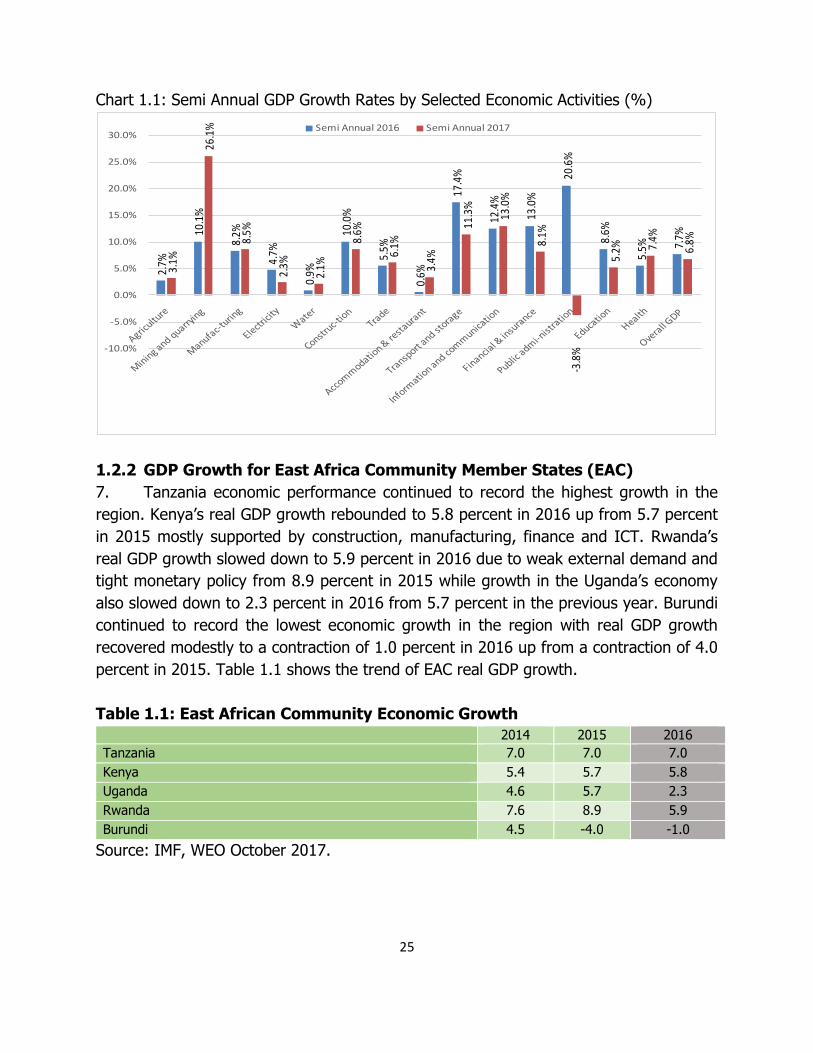
7. Tanzania economic performance continued to record the highest growth in the
region. Kenya’s real GDP growth rebounded to 5.8 percent in 2016 up from 5.7 percent
in 2015 mostly supported by construction, manufacturing, finance and ICT. Rwanda’s
real GDP growth slowed down to 5.9 percent in 2016 due to weak external demand and
tight monetary policy from 8.9 percent in 2015 while growth in the Uganda’s economy
also slowed down to 2.3 percent in 2016 from 5.7 percent in the previous year. Burundi
continued to record the lowest economic growth in the region with real GDP growth
recovered modestly to a contraction of 1.0 percent in 2016 up from a contraction of 4.0
percent in 2015. Table 1.1 shows the trend of EAC real GDP growth.
Table 1.1: East African Community Economic Growth
2014 2015 2016
Tanzania 7.0 7.0 7.0
Kenya 5.4 5.7 5.8
Uganda 4.6 5.7 2.3
Rwanda 7.6 8.9 5.9
Burundi 4.5 -4.0 -1.0
Source: IMF, WEO October 2017.

26
Inflation Trends
(i) Inflation in Tanzania
8. Throughout the first half of 2017, headline inflation continued to be at single
digit supported by contractionary fiscal policy, general slowdown in global commodity
prices, particularly oil prices and slower pace in the increase of domestic food prices.
However, when compared to similar period in 2016, inflation has increased marginally.
During the first half of 2017, headline inflation averaged at 5.8 percent up from 5.6
percent in the corresponding period in 2016, while food inflation averaged at 10.5
percent against 8.4 percent in the same time frame in 2016. On the other hand, core
inflation improved from an average of 2.8 percent in the first half of 2016 to 2.2
percent in the first half of 2017. In September 2017, headline inflation stood at 5.3
percent while core inflation averaged at 1.7 percent.
Chart 1.2: Tanzania Inflation Developments (January 2016 – September
2017)
-2.0
0.0
2.0
4.0
6.0
8.0
10.0
12.0
14.0
Pe
rce
nt
Headline Food Energy Non Food Core
(ii) Inflation Rates for EAC Member States
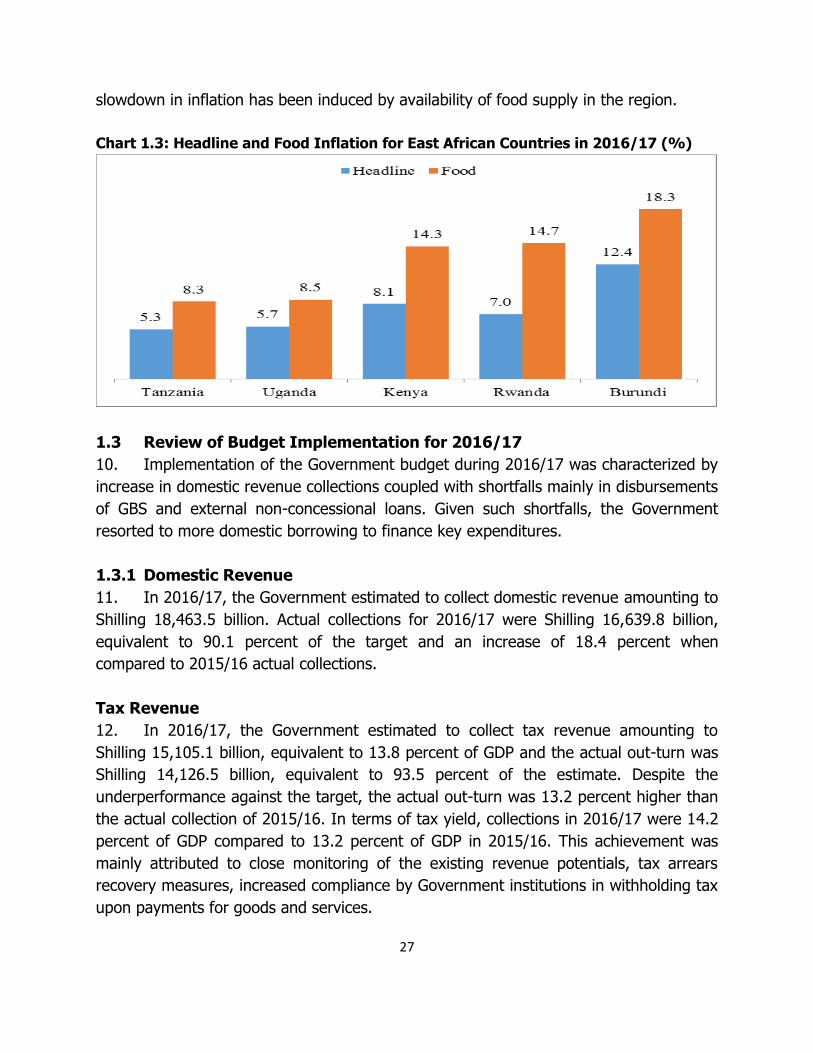
9. The average inflation rate in the EAC region continued to be stable maintaining
single digit of 7.7 percent in 2016/17. During the year, Tanzania recorded the lowest
annual average headline inflation of 5.3 percent followed by Uganda 5.7 percent,
Rwanda 7.0 percent, Kenya 8.1 percent and Burundi recorded the highest annual
average headline inflation of 12.4 percent as shown in Chart 1.3. Generally, the
27
slowdown in inflation has been induced by availability of food supply in the region.
Chart 1.3: Headline and Food Inflation for East African Countries in 2016/17 (%)
1.3 Review of Budget Implementation for 2016/17
10. Implementation of the Government budget during 2016/17 was characterized by
increase in domestic revenue collections coupled with shortfalls mainly in disbursements
of GBS and external non-concessional loans. Given such shortfalls, the Government
resorted to more domestic borrowing to finance key expenditures.
1.3.1 Domestic Revenue
11. In 2016/17, the Government estimated to collect domestic revenue amounting to
Shilling 18,463.5 billion. Actual collections for 2016/17 were Shilling 16,639.8 billion,
equivalent to 90.1 percent of the target and an increase of 18.4 percent when
compared to 2015/16 actual collections.
Tax Revenue
12. In 2016/17, the Government estimated to collect tax revenue amounting to
Shilling 15,105.1 billion, equivalent to 13.8 percent of GDP and the actual out-turn was
Shilling 14,126.5 billion, equivalent to 93.5 percent of the estimate. Despite the
underperformance against the target, the actual out-turn was 13.2 percent higher than
the actual collection of 2015/16. In terms of tax yield, collections in 2016/17 were 14.2
percent of GDP compared to 13.2 percent of GDP in 2015/16. This achievement was
mainly attributed to close monitoring of the existing revenue potentials, tax arrears
recovery measures, increased compliance by Government institutions in withholding tax
upon payments for goods and services.
28
Performance of Major Tax Categories
13. In 2016/17, import duty collection was Shilling 1,538.0 billion against the target
of Shilling 1,497.6 billion, implying over-performance by 2.7 percent. Value Added Tax
(VAT) on non-petroleum imports were Shilling 1,803.6 billion against the target of
Shilling. 2,102.4 billion. This marks a performance of 85.5 percent or a growth of 4.4
percent from collection realized in 2015/16. The excise duty on imports recorded
unsatisfactory performance of 62.2 percent by collecting Shilling 345.6 billion against
the target of Shilling 555.9 billion. This collection represents decline in growth rate by
35.9 percent from Shilling 539.3 billion that was collected in 2015/16. The
underperformance of these taxes on imports was mainly attributed to decline in the
value of consumer goods, which attracts high duty rates.
14. Revenue collected from imported petroleum products was Shilling 1,884.8 billion
which is 93.5 percent of the target of Shilling 2,025.8 billion. However, this is equivalent
to 9.6 percent increase from 1,719.8 billion in 2015/16. The excise duty on petroleum,
petroleum levy-REA and fuel levy performed slightly below the target by registering the
performance of 97.5, 99.0 and 86.5 percent respectively. The performance and growth
is ascribed to close control and monitoring of the importation of petroleum products.
15. Revenue collection from the corporate tax amounted to Shilling 1,450.3 billion
which is 89.8 percent of the target of Shilling 1,615.9 billion equivalents to 5.1 percent
increase when compared to year 2015/16. Under performance of corporate tax was
attributed by decline of sales of goods in the local markets faced by companies
producing among others cement, beer, and soft drinks; downward revision of
corporation tax due to increase in production costs; and financial market liquidity
squeeze which reduced profitability of some of the financial institutions.
16. PAYE performance was at 90.5 percent with revenue collection amounted to
Shillings 2,278.1 billion against the set target of Shillings 2,516.7 billion equivalent to
1.4 percent increase when compared to previous year. The underperformance of PAYE
was caused by the retrenchment of workers in some companies due to slowdown of
economic activities. Such companies include Pangea and Bulyanhulu Mining, Bakhresa
Food Products Ltd, SSB Grain Mills Ltd, Azam Bakeries and Mtibwa Sugar. Furthermore,
declined wage bill resulted from the Government postponement of employment of
public servants due to on-going verification exercise and removal of unqualified workers
attributed to the underperformance of PAYE.

29
17. Taxes on local goods and services amounted to Shilling 3,045.5 billion equivalent
to 98 percent of the target of Shilling 3,078.2 billion. The underperformance in some of
major tax items especial domestic VAT and excise duty was attributed to decline in
consumption of some manufactured goods such as cigarettes, beer, soft drinks and
hard drinks which have affected the taxable base. Low performance in telecoms
economic activity as a result of the changes of consumption pattern of
telecommunication services from airtime to lower cost bundled products triggered by
stiff competition in the industry.
Chart 1.4: Performance of Major tax categories for 2015/16- 2016/17
-
500.00
1,000.00
1,500.00
2,000.00
2,500.00
1,3
44
.30
1,8
40
.7
1,7
27
.2
86
8.6
1,2
75
.8 2
,24
6.8
70
4.6
1,3
79
.7
1,5
38
.0
2,1
58
.5
1,7
73
.2
94
4.9
1,1
60
.4
2,2
78
.1
76
0.0
1,4
50
.3
2015/16 2016/17
Non-Tax Revenue
18. In 2016/17, actual non-tax revenue collection (excluding LGAs own sources) was
Shilling 2,072.9 billion against the target of Shilling 2,718.6 billion equivalent to 76.3
percent. Contributions, dividends and excess capital redeemed from Government
Entities were Shilling 893.9 billion against the target of 1,306.5 billion. The performance
was attributed mainly by dividends from parastatals and collections from some MDAs as
a result of use of revenue collection electronic systems. LGAs collection from own
sources was Shilling 511.7 billion equivalent to 76.0 percent of the target.
Tax Exemptions
19. In 2016/17, tax exemptions were Shilling 952.5 billion compared to Shilling
1,103.3 billion in 2015/16 equivalent to a decline of 14 percent. Similarly, the proportion
of tax exemption to total tax collection declined from 7.8 percent of tax revenue
collected in 2015/16 to 6.7 percent in 2016/17. The share of exemption to GDP has also
30
declined to 0.9 percent in 2016/17 from 1.2 percent registered in 2015/16. Decline in
exemption was attributed to both policy and administrative measures taken by the
Government, aiming at minimizing unproductive tax exemptions, scrutiny and
monitoring of exemption requested before being granted.
1.3.2 External Resources
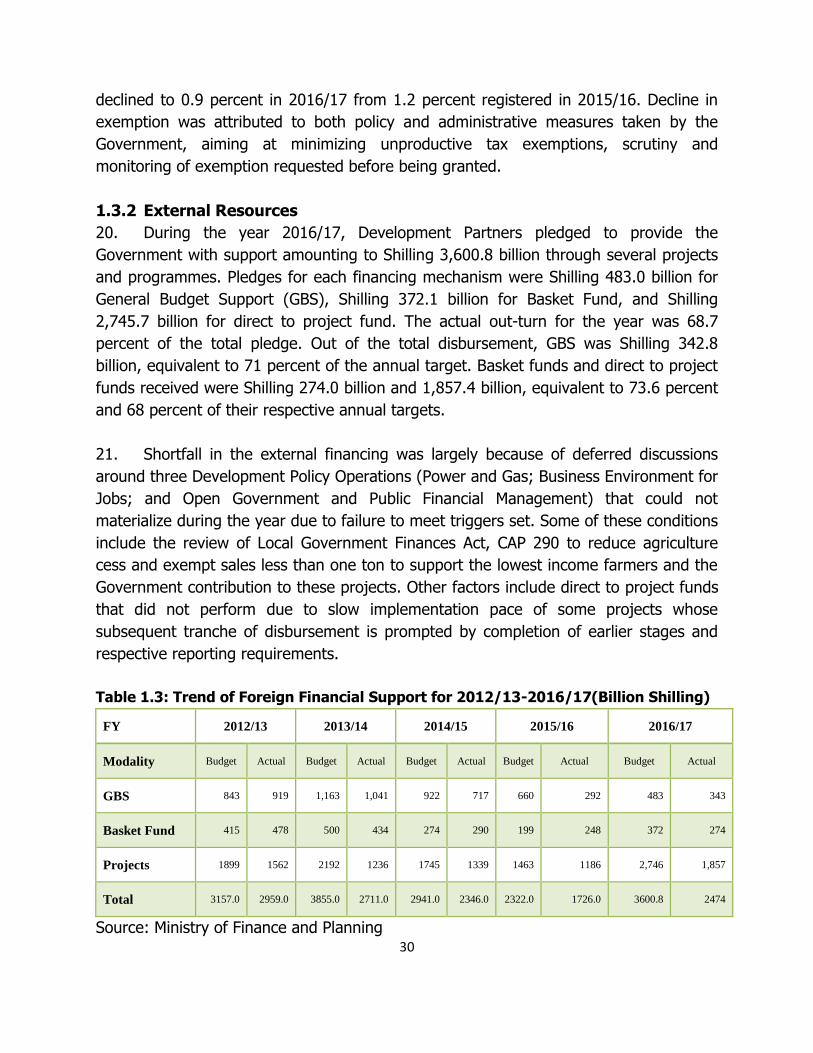
20. During the year 2016/17, Development Partners pledged to provide the
Government with support amounting to Shilling 3,600.8 billion through several projects
and programmes. Pledges for each financing mechanism were Shilling 483.0 billion for
General Budget Support (GBS), Shilling 372.1 billion for Basket Fund, and Shilling
2,745.7 billion for direct to project fund. The actual out-turn for the year was 68.7
percent of the total pledge. Out of the total disbursement, GBS was Shilling 342.8
billion, equivalent to 71 percent of the annual target. Basket funds and direct to project
funds received were Shilling 274.0 billion and 1,857.4 billion, equivalent to 73.6 percent
and 68 percent of their respective annual targets.
21. Shortfall in the external financing was largely because of deferred discussions
around three Development Policy Operations (Power and Gas; Business Environment for
Jobs; and Open Government and Public Financial Management) that could not
materialize during the year due to failure to meet triggers set. Some of these conditions
include the review of Local Government Finances Act, CAP 290 to reduce agriculture
cess and exempt sales less than one ton to support the lowest income farmers and the
Government contribution to these projects. Other factors include direct to project funds
that did not perform due to slow implementation pace of some projects whose
subsequent tranche of disbursement is prompted by completion of earlier stages and
respective reporting requirements.
Table 1.3: Trend of Foreign Financial Support for 2012/13-2016/17(Billion Shilling)
FY 2012/13 2013/14 2014/15 2015/16 2016/17
Modality Budget Actual Budget Actual Budget Actual Budget Actual Budget Actual
GBS 843 919 1,163 1,041 922 717 660 292 483 343
Basket Fund 415 478 500 434 274 290 199 248 372 274
Projects 1899 1562 2192 1236 1745 1339 1463 1186 2,746 1,857
Total 3157.0 2959.0 3855.0 2711.0 2941.0 2346.0 2322.0 1726.0 3600.8 2474
Source: Ministry of Finance and Planning

31
Chart 1.5: Trend of Foreign Financial Support for 2012/13-2016/17(Billion Shilling)
Source: Ministry of Finance and Planning
1.3.3 Expenditure
22. Total approved budget for 2016/17 was Shilling 29,539.6 billion of which
recurrent expenditure was estimated at Shilling 17,719.1 billion and development
expenditure was estimated at Shilling 11,820.5 billion. Actual expenditure as of end
June, 2017 was Shilling 23,634.6 billion, equivalent to 80.0 percent of the approved
budget. Total expenditure for 2016/17 increased by 6.5 percent compared with Shilling
22,099.1 billion in 2015/16. Out of the total expenditure for 2016/17, recurrent
expenditure was Shilling 17,136.2 billion, equivalent to 96.7 percent of budget
estimates and development expenditure was Shilling 6,498.3 billion, equivalent to 55.0
percent of the estimates.
23. The major components of recurrent expenditure were Consolidated Fund
Services (CFS) and wages and salaries. Actual CFS was Shilling 8,781.6 billion
equivalent to 51.2 percent of the recurrent expenditure. Wages and salaries was shilling
6,367.1 billion equivalent to 37.2 percent of recurrent expenditure and 96.5 percent of
the budget estimate.
24. Achievements in implementation of 2016/17 development budget included:
financing free primary and secondary education (Shilling 206.9 billion); procurement of
two new planes (Shilling 103.4 billion) and advance payment for four new planes
(Shilling 320.1 billion) to revive the national air carrier; construction of phase I standard
gauge railway line from Dar es Salaam to Morogoro (Shilling 1,000.0 billion);
investment in power generation (Shilling 176.5 billion); transmission and expansion of

32
rural electricity infrastructure (Shilling 361.5 billion); construction and maintenance of
roads through Road Funds (Shilling 807.4 billion); investment in urban and rural water
supplies infrastructure (Shilling 137.4 billion); higher learning students loans (Shilling
495.4 billion) and medical supplies and equipment (Shilling 165.0 billion).
25. Other achievements includes: securing a tender of construction of crude oil
pipeline from Hoima-Uganda to Chongoleani-Tanga (USD 3.5 billion) whereby the
country is expected to benefit in terms of employment, expertise and business
opportunities; expansion of Dar es Salaam port (USD 345 million); 100 percent
ownership of TTCL by government through redemption of 35 percent shares (Shilling
14.9 billion); and strengthening defence and Security of people and natural resources.
1.3.4 National Debt
26. As of June, 2017 the National Debt stood at USD 26,115.2 million compared to
USD 22,320.76 million recorded in the corresponding period in 2016, which was an
increase of 17.0 percent. The increase was on account of new borrowing to finance
development projects including: Standard Gauge Railway; Strategic Cities; Dar es Salam
Rapid Transport; Malagarasi Power Generation; and Dar es Salaam clean water. Out of
the national debt, USD 7,643.2 million is domestic and USD 18,472.0 million is the
external. The external debt comprises of public and publicly guaranteed debt of USD
14,800.5 million and private external debt of USD 3,671.50 million.
National Debt Sustainability
27. The Government Loans Guarantees and Grants Act CAP 134, requires the
Government to conduct an annual Debt Sustainability Analysis (DSA) which among
other things indicate the trend of various debt sustainability indicators including
description of economic situation in different scenarios and recommend measures for
maintaining sustainable level of debt. Results of DSA conducted in November 2016
indicates that, the present value of public debt to GDP was 32.5 percent, implying that
Tanzania’s debt remains at low risk of debt distress and that the debt outlook in the
medium to long term is sustainable both under baseline and alternative scenarios. All
debt burden indicators have remained below their indicative thresholds as shown in
Table 1.4.
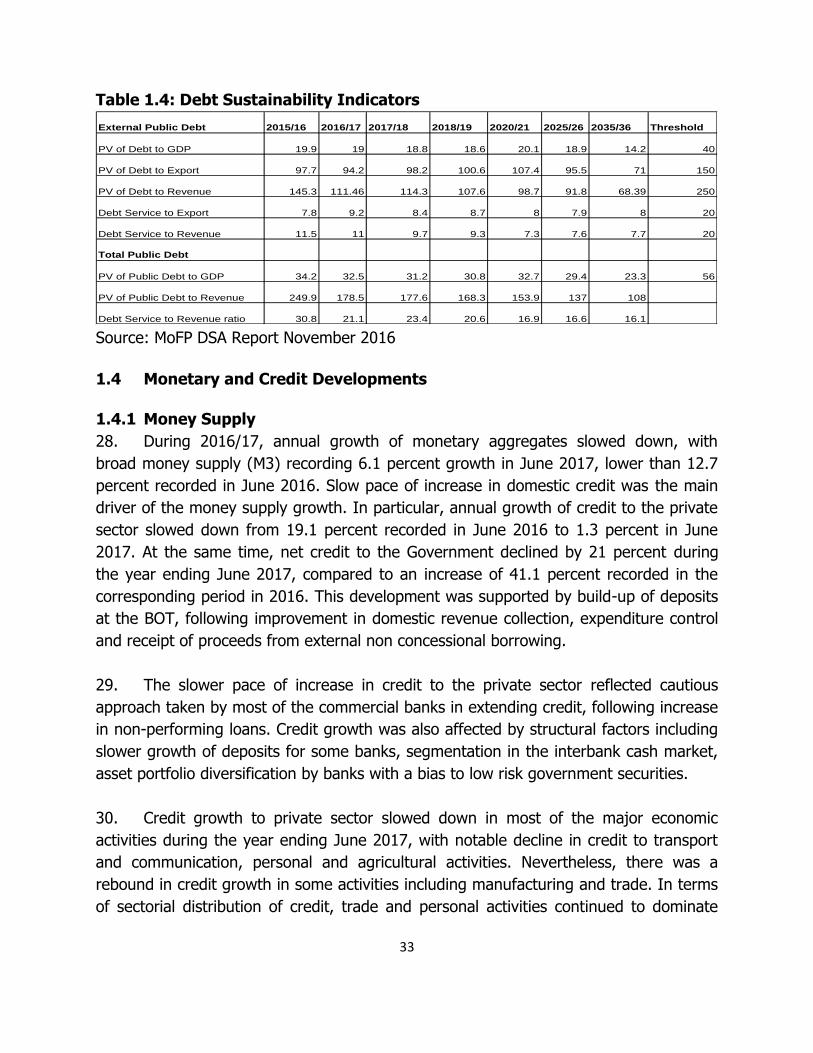
33
Table 1.4: Debt Sustainability Indicators
External Public Debt 2015/16 2016/17 2017/18 2018/19 2020/21 2025/26 2035/36 Threshold
PV of Debt to GDP 19.9 19 18.8 18.6 20.1 18.9 14.2 40
PV of Debt to Export 97.7 94.2 98.2 100.6 107.4 95.5 71 150
PV of Debt to Revenue 145.3 111.46 114.3 107.6 98.7 91.8 68.39 250
Debt Service to Export 7.8 9.2 8.4 8.7 8 7.9 8 20
Debt Service to Revenue 11.5 11 9.7 9.3 7.3 7.6 7.7 20
Total Public Debt
PV of Public Debt to GDP 34.2 32.5 31.2 30.8 32.7 29.4 23.3 56
PV of Public Debt to Revenue 249.9 178.5 177.6 168.3 153.9 137 108
Debt Service to Revenue ratio 30.8 21.1 23.4 20.6 16.9 16.6 16.1 Source: MoFP DSA Report November 2016
1.4 Monetary and Credit Developments
1.4.1 Money Supply
28. During 2016/17, annual growth of monetary aggregates slowed down, with
broad money supply (M3) recording 6.1 percent growth in June 2017, lower than 12.7
percent recorded in June 2016. Slow pace of increase in domestic credit was the main
driver of the money supply growth. In particular, annual growth of credit to the private
sector slowed down from 19.1 percent recorded in June 2016 to 1.3 percent in June
2017. At the same time, net credit to the Government declined by 21 percent during
the year ending June 2017, compared to an increase of 41.1 percent recorded in the
corresponding period in 2016. This development was supported by build-up of deposits
at the BOT, following improvement in domestic revenue collection, expenditure control
and receipt of proceeds from external non concessional borrowing.
29. The slower pace of increase in credit to the private sector reflected cautious
approach taken by most of the commercial banks in extending credit, following increase
in non-performing loans. Credit growth was also affected by structural factors including
slower growth of deposits for some banks, segmentation in the interbank cash market,
asset portfolio diversification by banks with a bias to low risk government securities.
30. Credit growth to private sector slowed down in most of the major economic
activities during the year ending June 2017, with notable decline in credit to transport
and communication, personal and agricultural activities. Nevertheless, there was a
rebound in credit growth in some activities including manufacturing and trade. In terms
of sectorial distribution of credit, trade and personal activities continued to dominate
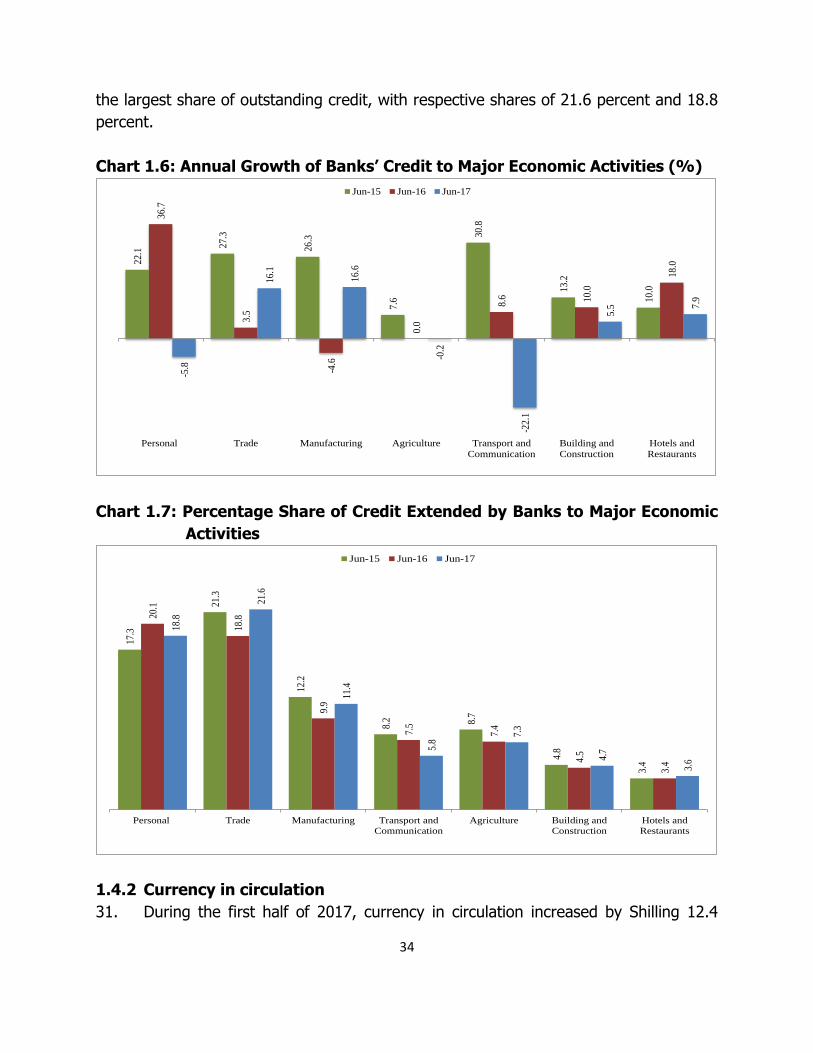
34
the largest share of outstanding credit, with respective shares of 21.6 percent and 18.8
percent.
Chart 1.6: Annual Growth of Banks’ Credit to Major Economic Activities (%)
22.1
27.3
26.3
7.6
30.8
13.2
10.0
36.7
3.5
-4.6
0.0
8.6 10
.0
18.0
-5.8
16.1
16.6
-0.2
-22.
1
5.5 7.
9
Personal Trade Manufacturing Agriculture Transport and
Communication
Building and
Construction
Hotels and
Restaurants
Jun-15 Jun-16 Jun-17
Chart 1.7: Percentage Share of Credit Extended by Banks to Major Economic
Activities
17.3
21.3
12.2
8.2 8.
7
4.8
3.4
20.1
18.8
9.9
7.5
7.4
4.5
3.4
18.8
21.6
11.4
5.8
7.3
4.7
3.6
Personal Trade Manufacturing Transport and
Communication
Agriculture Building and
Construction
Hotels and
Restaurants
Jun-15 Jun-16 Jun-17
1.4.2 Currency in circulation
31. During the first half of 2017, currency in circulation increased by Shilling 12.4

35
billion much lower than the average increase of Shilling 222.6 billion recorded in the
similar period over the past three years. The decrease of currency in circulation was
associated with the impact of contractionary fiscal policy and slowdown in credit to
private sector. However, the increased use of digital financial services in the country
has partly dampened the slowdown impact of currency in circulation on growth of
economic activities.
Chart 1.8: Annual Change in Currency in Circulation (Billions Shilling)
196.1
307.6299.1
61.2
12.4
2012/13 2013/14 2014/15 2015/16 2016/17
6-Month Change January - June
1.4.3 Liquidity Management and Interest Rates Developments
32. In addressing liquidity condition, the Bank of Tanzania pursued expansionary
monetary policy in order to support the growth of economic activities and credit to the
private sector, while ensuring stability of money market rates. The Bank reduced the
statutory minimum reserve (SMR) requirement on private sector deposits from 10.0
percent to 8.0 percent in April 2017, alongside the adoption of reserve averaging
framework in January 2017. The Bank also reduced the discount rate from 16.0 percent
to 12.0 percent with effect from March 2017. Further, the Bank used a mix of policy
instruments in order to inject liquidity into the economy including purchase of foreign
exchange from domestic market, inward foreign exchange swaps and provision of short
term loans to banks. The standby facilities at the Bank of Tanzania were also available
for any bank in need of short term liquidity. In addition, the Government has continued
to invest in public infrastructure and payment of verified arrears aiming at attracting
private investment, increasing liquidity in the economy, reducing the level of non-
performing loans and stimulating economic activities.

36
33. Following these measures, excess reserves of banks increased and the overnight
interbank cash market rate decreased to 4.08 percent in June 2017 from an average of
14.89 percent recorded in the first half of 2016/17 when liquidity among banks was
tight. Likewise, Treasury bills rates responded, following oversubscriptions in the
auctions. The overall Treasury bills rate decreased to 7.64 percent in June 2017 from an
average rate of 15.56 percent recorded in the first half of 2016/17.
34. Developments in the money market rates were not fully mirrored in the
commercial banks interest rates. During 2016/17, deposits rates were on average
higher than those recorded in 2015/16, reflecting increased competition in deposit
mobilisation, while lending rates increased largely associated with liquidity squeeze
among banks, owing to moderate net fiscal outlays and the rise in risk premium due to
weakening of banks’ asset quality following increase in non-performing loans. During
2016/17, overall deposit rate rose to an average rate of 9.61 percent compared with
average rate of 9.25 percent in 2015/16, while twelve - month deposits rate averaged
11.66 percent, compared with 11.17 percent recorded in 2015/16. Likewise, the overall
lending rate increased to an average rate of 16.53 percent compared with average rate
of 16.17 percent recorded in 2015/16, whereas one-year lending rate averaged at 15.38
percent, compared with 14.19 percent recorded in 2015/16. As a result, the spread
between one year deposit and lending rates increased to 3.72 percentage points in
2016/17 from 3.02 percentage points recorded in 2015/16.
1.4.4 Exchange Rate Developments
35. The value of Tanzanian shilling against the US dollar remained broadly stable
throughout 2016/17, consistent with shilling liquidity conditions in the economy and the
improvement in the current account balance. The exchange rate fluctuated within a
range of Shilling 2,171.0 to Shilling 2,230.1 against the US dollar, compared with a
range of Shilling 2,020.3 to Shilling 2,182.3 per US dollar in the corresponding period of
2015/16. In mid-January 2017 though, the shilling experienced a short-lived sharp
depreciation against the US dollar, a phenomenon that was primarily associated with
developments in the external environment but stabilized thereafter.
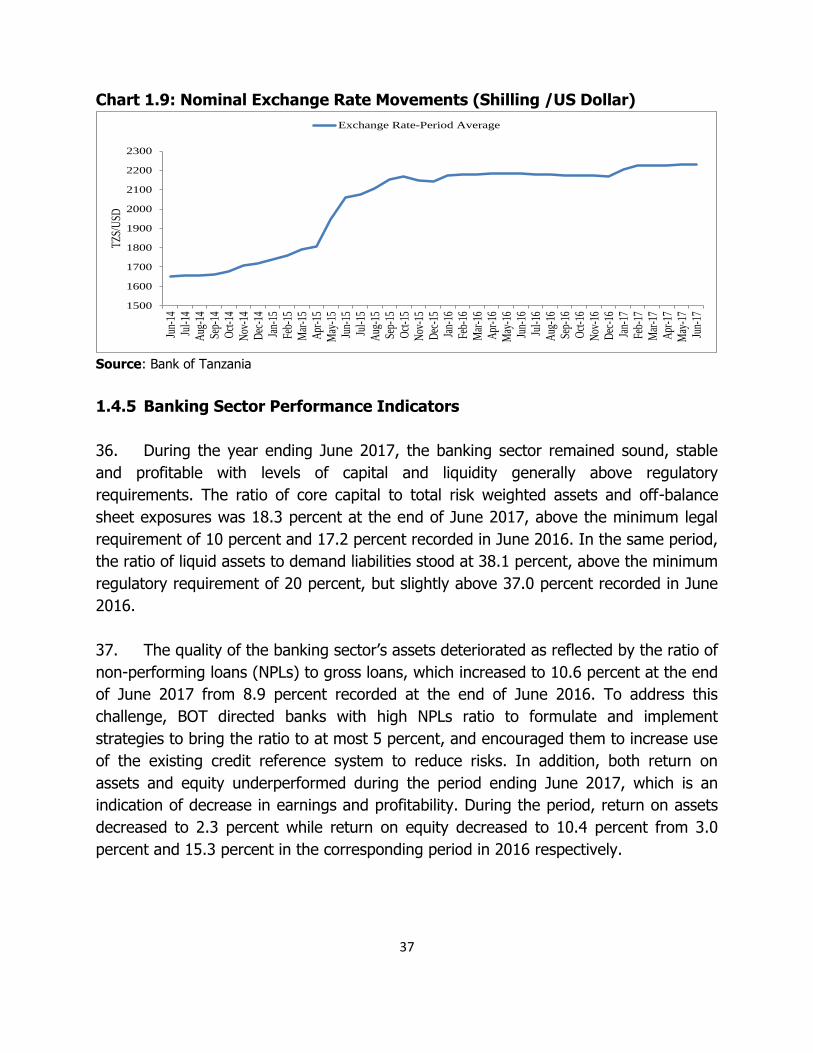
37
Chart 1.9: Nominal Exchange Rate Movements (Shilling /US Dollar)
1500
1600
1700
1800
1900
2000
2100
2200
2300
Jun-
14Ju
l-14
Aug
-14
Sep-
14O
ct-1
4N
ov-1
4D
ec-1
4Ja
n-15
Feb-
15M
ar-1
5A
pr-1
5M
ay-1
5Ju
n-15
Jul-
15A
ug-1
5Se
p-15
Oct
-15
Nov
-15
Dec
-15
Jan-
16Fe
b-16
Mar
-16
Apr
-16
May
-16
Jun-
16Ju
l-16
Aug
-16
Sep-
16O
ct-1
6N
ov-1
6D
ec-1
6Ja
n-17
Feb-
17M
ar-1
7A
pr-1
7M
ay-1
7Ju
n-17
TZS
/USD
Exchange Rate-Period Average
Source: Bank of Tanzania
1.4.5 Banking Sector Performance Indicators
36. During the year ending June 2017, the banking sector remained sound, stable
and profitable with levels of capital and liquidity generally above regulatory
requirements. The ratio of core capital to total risk weighted assets and off-balance
sheet exposures was 18.3 percent at the end of June 2017, above the minimum legal
requirement of 10 percent and 17.2 percent recorded in June 2016. In the same period,
the ratio of liquid assets to demand liabilities stood at 38.1 percent, above the minimum
regulatory requirement of 20 percent, but slightly above 37.0 percent recorded in June
2016.
37. The quality of the banking sector’s assets deteriorated as reflected by the ratio of
non-performing loans (NPLs) to gross loans, which increased to 10.6 percent at the end
of June 2017 from 8.9 percent recorded at the end of June 2016. To address this
challenge, BOT directed banks with high NPLs ratio to formulate and implement
strategies to bring the ratio to at most 5 percent, and encouraged them to increase use
of the existing credit reference system to reduce risks. In addition, both return on
assets and equity underperformed during the period ending June 2017, which is an
indication of decrease in earnings and profitability. During the period, return on assets
decreased to 2.3 percent while return on equity decreased to 10.4 percent from 3.0
percent and 15.3 percent in the corresponding period in 2016 respectively.

38
Table 1.5: Banking Sector Financial Soundness Indicators (%) Indicator Regulatory Limit Jun-16 Sep-16 Dec-16 Mar-17 Jun-17
Capital adequacy
Core capital to total risk weighted assets plus off
balance sheet exposure
Minimum 10 17.2 17.3 17.8 19.0 18.3
Total capital to total risk weighted assets plus off
balance sheet exposure
Minimum 12 19.2 19.2 19.8 21.0 20.3
Liquidity
Liquid assets to demand liabilities Minimum 20 37.0 34.2 42.4 36.0 38.1
Total loans to customer deposits N/A 85.8 87.1 86.3 86.0 83.1
Earnings and profitability
Return on assets N/A 3.0 2.5 2.4 2.4 2.3
Return on equity N/A 15.3 12.0 10.5 11.3 10.4
Non-interest expenses to total income N/A 65.0 66.9 67.6 67.3 51.5
Assets quality
Non-performing loans to gross loans N/A 8.9 9.1 9.5 11.0 10.6 Source: Bank of Tanzania
1.5 External Sector Development
38. The current account deficit narrowed significantly from USD 2,954 million in
2015/16 to USD 1,350 million in 2016/17 due to a considerable decrease in the value of
imports of goods and services and a slight decrease in the value of exports of goods
and services. As a percentage of GDP, current account deficit was 2.8 percent in
2016/17 compared to a deficit of 6.5 percent in 2015/16. Following this development,
the overall balance of payments registered a surplus of USD 1,226 million from a deficit
of USD 368 million in the year ending June 2016. The stock of gross official reserves as
at end-June 2017 amounted to USD 5,022 million, sufficient to cover 5.8 months of
projected imports of goods and services excluding those financed by foreign direct
investment.
39. In 2016/17, the value of exports of goods and services decreased marginally by
0.8 percent to USD 8,908.0 million compared to USD 8,981.0 million recorded in
2015/16 mainly on account of underperformance in manufacturing exports. Export of
manufactured goods declined by 29.8 percent to USD 893.0 million from USD 1,273
million recorded in 2015/16. The low performance is partly explained by security
concern particularly in DRC, which is among the largest market for the country’s
manufactured goods. Nevertheless, good performance was recorded in transport
service receipts and export value of gold and traditional goods. The value of gold
exports increased to USD 1,517.9 million from USD 1,243.3 million, due to increase in
both volume and unit price.
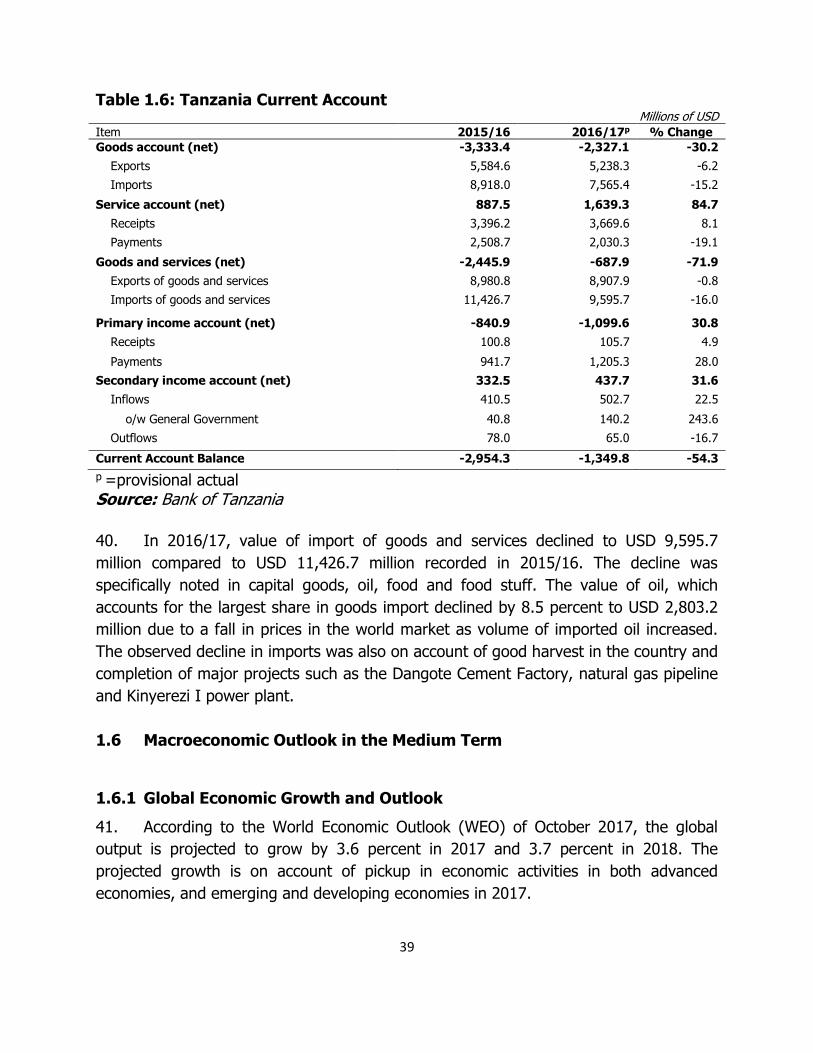
39
Table 1.6: Tanzania Current Account Millions of USD
Item 2015/16 2016/17p % Change
Goods account (net) -3,333.4 -2,327.1 -30.2
Exports 5,584.6 5,238.3 -6.2
Imports 8,918.0 7,565.4 -15.2
Service account (net) 887.5 1,639.3 84.7
Receipts 3,396.2 3,669.6 8.1
Payments 2,508.7 2,030.3 -19.1
Goods and services (net) -2,445.9 -687.9 -71.9
Exports of goods and services 8,980.8 8,907.9 -0.8
Imports of goods and services 11,426.7 9,595.7 -16.0
Primary income account (net) -840.9 -1,099.6 30.8
Receipts 100.8 105.7 4.9
Payments 941.7 1,205.3 28.0
Secondary income account (net) 332.5 437.7 31.6
Inflows 410.5 502.7 22.5
o/w General Government 40.8 140.2 243.6
Outflows 78.0 65.0 -16.7
Current Account Balance -2,954.3 -1,349.8 -54.3
p =provisional actual
Source: Bank of Tanzania
40. In 2016/17, value of import of goods and services declined to USD 9,595.7
million compared to USD 11,426.7 million recorded in 2015/16. The decline was
specifically noted in capital goods, oil, food and food stuff. The value of oil, which
accounts for the largest share in goods import declined by 8.5 percent to USD 2,803.2
million due to a fall in prices in the world market as volume of imported oil increased.
The observed decline in imports was also on account of good harvest in the country and
completion of major projects such as the Dangote Cement Factory, natural gas pipeline
and Kinyerezi I power plant.
1.6 Macroeconomic Outlook in the Medium Term
1.6.1 Global Economic Growth and Outlook
41. According to the World Economic Outlook (WEO) of October 2017, the global
output is projected to grow by 3.6 percent in 2017 and 3.7 percent in 2018. The
projected growth is on account of pickup in economic activities in both advanced
economies, and emerging and developing economies in 2017.
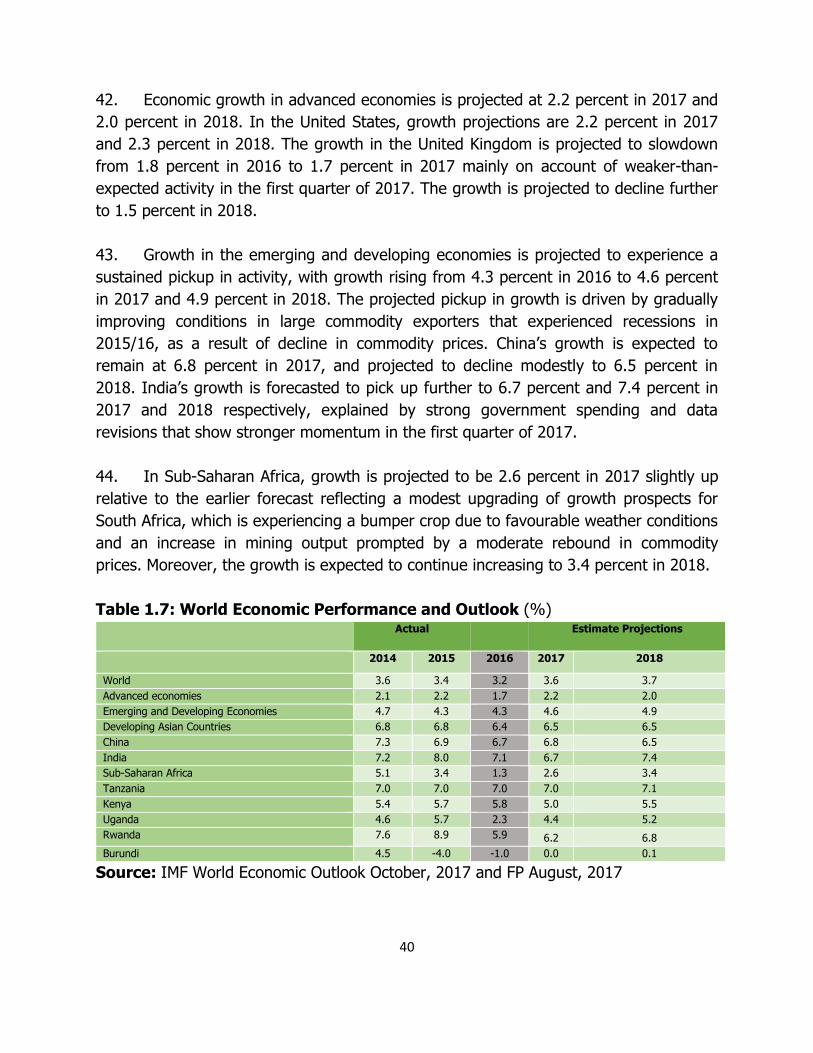
40
42. Economic growth in advanced economies is projected at 2.2 percent in 2017 and
2.0 percent in 2018. In the United States, growth projections are 2.2 percent in 2017
and 2.3 percent in 2018. The growth in the United Kingdom is projected to slowdown
from 1.8 percent in 2016 to 1.7 percent in 2017 mainly on account of weaker-than-
expected activity in the first quarter of 2017. The growth is projected to decline further
to 1.5 percent in 2018.
43. Growth in the emerging and developing economies is projected to experience a
sustained pickup in activity, with growth rising from 4.3 percent in 2016 to 4.6 percent
in 2017 and 4.9 percent in 2018. The projected pickup in growth is driven by gradually
improving conditions in large commodity exporters that experienced recessions in
2015/16, as a result of decline in commodity prices. China’s growth is expected to
remain at 6.8 percent in 2017, and projected to decline modestly to 6.5 percent in
2018. India’s growth is forecasted to pick up further to 6.7 percent and 7.4 percent in
2017 and 2018 respectively, explained by strong government spending and data
revisions that show stronger momentum in the first quarter of 2017.
44. In Sub-Saharan Africa, growth is projected to be 2.6 percent in 2017 slightly up
relative to the earlier forecast reflecting a modest upgrading of growth prospects for
South Africa, which is experiencing a bumper crop due to favourable weather conditions
and an increase in mining output prompted by a moderate rebound in commodity
prices. Moreover, the growth is expected to continue increasing to 3.4 percent in 2018.
Table 1.7: World Economic Performance and Outlook (%) Actual Estimate Projections
2014 2015 2016 2017 2018
World 3.6 3.4 3.2 3.6 3.7
Advanced economies 2.1 2.2 1.7 2.2 2.0
Emerging and Developing Economies 4.7 4.3 4.3 4.6 4.9
Developing Asian Countries 6.8 6.8 6.4 6.5 6.5
China 7.3 6.9 6.7 6.8 6.5
India 7.2 8.0 7.1 6.7 7.4
Sub-Saharan Africa 5.1 3.4 1.3 2.6 3.4
Tanzania 7.0 7.0 7.0 7.0 7.1
Kenya 5.4 5.7 5.8 5.0 5.5
Uganda 4.6 5.7 2.3 4.4 5.2
Rwanda 7.6 8.9 5.9 6.2 6.8
Burundi 4.5 -4.0 -1.0 0.0 0.1
Source: IMF World Economic Outlook October, 2017 and FP August, 2017
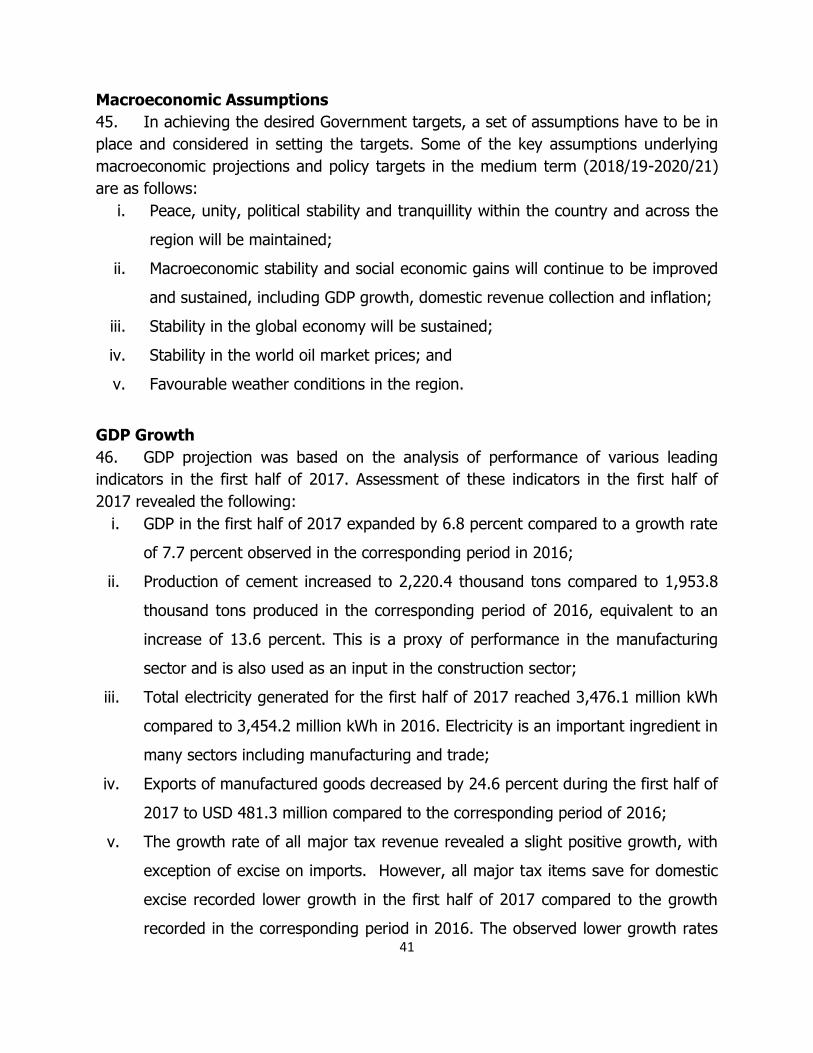
41
Macroeconomic Assumptions
45. In achieving the desired Government targets, a set of assumptions have to be in
place and considered in setting the targets. Some of the key assumptions underlying
macroeconomic projections and policy targets in the medium term (2018/19-2020/21)
are as follows:
i. Peace, unity, political stability and tranquillity within the country and across the
region will be maintained;
ii. Macroeconomic stability and social economic gains will continue to be improved
and sustained, including GDP growth, domestic revenue collection and inflation;
iii. Stability in the global economy will be sustained;
iv. Stability in the world oil market prices; and
v. Favourable weather conditions in the region.
GDP Growth
46. GDP projection was based on the analysis of performance of various leading
indicators in the first half of 2017. Assessment of these indicators in the first half of
2017 revealed the following:
i. GDP in the first half of 2017 expanded by 6.8 percent compared to a growth rate
of 7.7 percent observed in the corresponding period in 2016;
ii. Production of cement increased to 2,220.4 thousand tons compared to 1,953.8
thousand tons produced in the corresponding period of 2016, equivalent to an
increase of 13.6 percent. This is a proxy of performance in the manufacturing
sector and is also used as an input in the construction sector;
iii. Total electricity generated for the first half of 2017 reached 3,476.1 million kWh
compared to 3,454.2 million kWh in 2016. Electricity is an important ingredient in
many sectors including manufacturing and trade;
iv. Exports of manufactured goods decreased by 24.6 percent during the first half of
2017 to USD 481.3 million compared to the corresponding period of 2016;
v. The growth rate of all major tax revenue revealed a slight positive growth, with
exception of excise on imports. However, all major tax items save for domestic
excise recorded lower growth in the first half of 2017 compared to the growth
recorded in the corresponding period in 2016. The observed lower growth rates
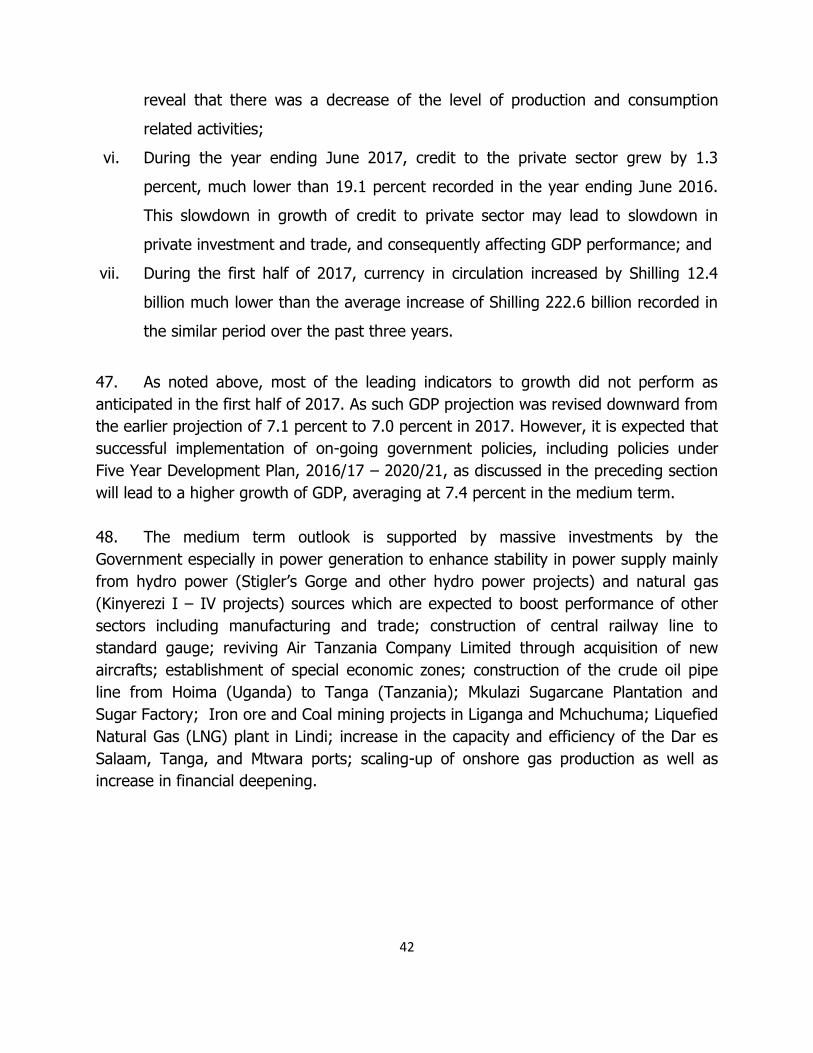
42
reveal that there was a decrease of the level of production and consumption
related activities;
vi. During the year ending June 2017, credit to the private sector grew by 1.3
percent, much lower than 19.1 percent recorded in the year ending June 2016.
This slowdown in growth of credit to private sector may lead to slowdown in
private investment and trade, and consequently affecting GDP performance; and
vii. During the first half of 2017, currency in circulation increased by Shilling 12.4
billion much lower than the average increase of Shilling 222.6 billion recorded in
the similar period over the past three years.
47. As noted above, most of the leading indicators to growth did not perform as
anticipated in the first half of 2017. As such GDP projection was revised downward from
the earlier projection of 7.1 percent to 7.0 percent in 2017. However, it is expected that
successful implementation of on-going government policies, including policies under
Five Year Development Plan, 2016/17 – 2020/21, as discussed in the preceding section
will lead to a higher growth of GDP, averaging at 7.4 percent in the medium term.
48. The medium term outlook is supported by massive investments by the
Government especially in power generation to enhance stability in power supply mainly
from hydro power (Stigler’s Gorge and other hydro power projects) and natural gas
(Kinyerezi I – IV projects) sources which are expected to boost performance of other
sectors including manufacturing and trade; construction of central railway line to
standard gauge; reviving Air Tanzania Company Limited through acquisition of new
aircrafts; establishment of special economic zones; construction of the crude oil pipe
line from Hoima (Uganda) to Tanga (Tanzania); Mkulazi Sugarcane Plantation and
Sugar Factory; Iron ore and Coal mining projects in Liganga and Mchuchuma; Liquefied
Natural Gas (LNG) plant in Lindi; increase in the capacity and efficiency of the Dar es
Salaam, Tanga, and Mtwara ports; scaling-up of onshore gas production as well as
increase in financial deepening.

43
Chart 1.10: Actual and Projected GDP (2008/09-2020/21)
35,4
12
41,0
51
48,6
07
57,0
98
66,1
94
75,3
36
85,2
91 97
,304
106,
879 11
8,81
9 132,
878 14
7,53
1
165,
779
5.4%
6.4%
7.9%
5.1%
7.3%7.0% 7.0% 7.0% 7.0% 7.1%
7.3%7.6%
8.0%
-
20,000
40,000
60,000
80,000
100,000
120,000
140,000
160,000
180,000
0.0%
1.0%
2.0%
3.0%
4.0%
5.0%
6.0%
7.0%
8.0%
9.0%
2008/09 2009/10 2010/11 2011/12 2012/13 2013/14 2014/15 2015/16 2016/17 2017/18 2018/19 2019/20 2020/21
Year
Total GDP at current market prices (Bln TZS) RHS Real GDP Growth (Calendar Year) LHS
Note: Calendar year corresponding to for example 2008/09 is 2009.
Table 1.8: Nominal and Real GDP (Actual and Projection)
NORMINAL GDP BIL. SHILLING
2013 2014 2015 2016 2017 2018 2019 2020 2021
70,953.2 79,718.4 90,863.8 103,744.6 110,013.1 127,625.7 138,131.2 156,931.7 174,626.8
2012/13 2013/14 2014/15 2015/16 2016/17 2017/18 2018/19 2019/20 2020/21
66,193.7 75,335.8 85,291.1 97,304.2 106,878.9 118,819.4 132,878.4 147,531.5 165,779.2
REAL GDP BIL.SHILLING
2013 2014 2015 2016 2017 2018 2019 2020 2021
38,546.5 41,231.4 44,100.8 47,174.9 50,454.2 54,022.2 57,987.5 62,392.9 67,356.7
2012/13 2013/14 2014/15 2015/16 2016/17 2017/18 2018/19 2019/20 2020/21
37,241.5 39,889.0 42,666.1 45,637.9 48,814.5 52,238.2 56,004.8 60,190.2 64,874.8
Source: Abridged from FP August 2017
Inflation Outlook
49. Inflation is projected at 5.0 percent through June 2018, and is expected to
remain at that rate in the medium term. The inflation forecast is supported by the
following:
i. Reduction in the production costs on account of reliable and affordable power
supply emanating from increase in gas powered electricity generation as well as
cost reduction in oil import for power generation;
44
ii. Improvement in food supply in 2017/18 on account of favorable weather
condition in the region. According to Famine Early Warning System Network
(FEWSNET) report of August 2017, national cereal production is estimated at 14
percent above last year production;
iii. The impact of increase in global oil prices will be partly dampened by continued
use of natural gas as alternative source energy; and
iv. Prudent fiscal policy including public expenditure management.
Monetary Policy
50. The extended broad money supply (M3) is projected to grow in line with the
projected pace of expansion of economic activities and moderate change in velocity of
money in circulation. Growth of M3 is expected to pick up to 12.0 percent by June 2018
from 6.1 percent recorded in June 2017, while credit to private sector is projected to
grow by about 10 percent, from 1.3 percent. In the medium term growth of M3 is
projected to remain at around 12.5 percent, while credit to the private sector is
projected to grow at annual average rate of 18 percent.
External trade Sector
51. The current account balance is projected to record a deficit of 4.2 percent of
GDP in 2017/18 compared to a deficit of 2.8 percent in the preceding year. In the
medium term, the ratio of current account deficit to GDP is projected at an average of
6.6 percent as growth in imports of capital goods for industrialization is projected to be
relatively higher compared to exports.
52. The ratio of export of goods and services to GDP in 2017/18 is estimated at 17.6
percent, which is lower compared to 18.3 percent recorded in the preceding year. In
the medium term, the ratio of export of goods and services to GDP is projected at an
average of 16.4 percent.
53. The ratio of import of goods and services to GDP is estimated at 21.4 percent in
2017/18 compare to 19.7 percent recorded in the preceding year. The projected
increase in imports is consistent with the expansion of economic activities such as
implementation of some major investment projects including construction of the central
railway line to standard gauge level, Stigler’s Gorge Hydro dam and the crude oil
pipeline from Hoima (Uganda) to Tanga. In the medium-term, the ratio of import of
goods and services to GDP is projected to average about 22.6 percent.
45
CHAPTER TWO
RESOURCE ENVELOPE AND EXPENDITURE FRAMEWORK FOR THE PERIOD
2018/19 - 2020/21
2.1 Introduction
54. This chapter outlines the key issues related to development of medium term
fiscal projections as provided for by the Budget Act No. 11 of 2015 and the Budget
Regulations of 2015. The Budget Act provides for adherence to principles of fiscal
responsibility and that revenue, expenditures and financing presented in the budget and
for periods beyond are founded on a credible and consistent macroeconomic
framework.
55. Resource and expenditure allocations for fiscal year 2018/19 and for two
upcoming financial years present a complete picture of the government finances for
realization of FYDP II objectives. Cognisant of that, the Government has prepared a
comprehensive financing strategy and forecasts of expenditure areas to match with the
financial requirements for the implementation of the FYDP II. The aim is to secure
adequate resources to fasten completion of projects and therefore reduce the risk of
underperforming of the Plan.
56. The strategy highlights the traditional ways of resource mobilization including tax
revenues, non-tax revenues, domestic borrowing, and external financing and identifies
innovative (non-traditional) sources of financing emphasizing the use of Bonds (Local
Government/Municipal Bonds), Pension Equity Fund, Foreign Market Bond, National
Climate Fund, Public Private Partnerships (PPP) and enhanced use of Development
Financial Institutions for financing development project.
57. The budget for 2018/19 is estimated at shillings 32,476.0 billion, which is an
increase of 2.4 percent from the 2017/18 approved budget of shillings 31,712.0 billion.
The budget frame for 2018/19 – 2020/21 is shown in Table No. 2.1. These figures
provide indicative projections of revenue and expenditure that government intends to
anchor its medium term policy.

46
2.2 Fiscal Policy
2.2.1 Revenue Policies
58. The Government will continue to strengthen and build an effective domestic
revenue system with a view to having predictable and sustainable revenue needed to
finance its expenditure. Furthermore, it will continue to progressively strengthen tax
administration in order to reduce tax evasion and broaden tax base by formalizing
economic activities as well as encouraging growth of small and medium business sector
that is an engine for employment generation and economic growth.
59. In the medium term, implementation of revenue policies and administrative
measures are expected to increase domestic revenue (including LGAs own source) to
17.5 percent of GDP by 2020/21 from 16.6 percent of GDP estimated in 2018/19. These
levels are consistent with Sub-Saharan Africa average yield.
Tax Revenue
60. The Government will continue to support voluntary compliance through
strengthening of a Comprehensive Taxpayer Communication Strategy and improving
presumptive taxation scheme. Administrative intervention will include among others:
providing a single platform for processing clearance of documents through
implementation of e-Single Window system for port community and cross border trade;
implementing an Integrated Domestic Revenue Administration System (IDRAS);
strengthening management and controls at Dar es Salaam port and other ports of
entry; and continue with identification and registration of taxpayers in the database.
61. The Government will also continue to strengthen the capacity to monitor transfer
pricing and invoice mispricing by multinationals; enhancing risk based compliance
management; enhancing administration and monitoring of the block management
system; and enhancing information sharing and exchange with Government Agencies;
and Regional Revenue Bodies to combat tax evasion.
62. Tax policies and administration interventions will be geared towards increasing
tax revenue yield to 14.2 percent of GDP in 2018/19.
Non Tax Revenue
63. The Government will continue undertaking policy and administrative measures to
strengthen non tax revenue collection by MDAs, LGAs and Public Entities. In addition,
the Government will continue with implementation of the road map for gradual transfer
47
of non-tax revenue administration function from MDAs, LGAs and Public Entities to
Tanzania Revenue Authority and enhance Government e-Payment Revenue Gateway
System to accommodate the accounting of non-tax revenue. Furthermore the
Government will continue to enforce the transfer of non-tax revenue collected by MDAs,
LGAs and Public Entities to the Consolidated Fund in accordance with the Budget Act
No. 11 of 2015.
64. The Government efforts to strengthen non tax revenue collection by MDAs, LGAs
and Public Entities will be geared towards raising non tax revenue collection (including
LGAs own source) to about 1.9 percent of GDP in the medium term.
65. Specific policy and administrative interventions for strengthening administration
and collection of domestic revenue will include:
(i) Expansion of tax base through enforcing registration of new taxpayers for
Income Tax and VAT;
(ii) Implementing an Automated Tax Stamp System to minimize the risk of tax
evasion for the excisable products such as soft drinks, beers and cigarettes;
(iii) Effective monitoring of EFD usage through surveillance programmes, and
implementation of tax incentives with the aim of curtailing revenue losses;
(iv) To continue streamlining multiplicity of levies and fees imposed by various
Government Agencies / Institutions;
(v) Enforcing the use of Government electronic Payment Revenue Gateway System
(GePGS) in non-tax revenue collection in order to enhance efficiency and control
revenue losses;
(vi) Continuing to monitor Public Entities to ensure appropriate dividends,
contribution and surplus are remitted to the Consolidated Fund;
(vii) Continuing with mass valuation of rateable properties to increase revenue;
(viii) Continuing with formalization of land ownership with the view of increasing
revenue; and
(ix) Reviewing various rate of fees and levies charged by Ministries, Regions and
Independent Departments in order to rationalize with the current level of
economic growth.
Grants and Concessional Loans
66. The Government in collaboration with Development Partners have agreed on the
improved Development Cooperation Framework (DCF) that will be implemented staring
2018/19. This Framework will enable Development Partners to honour their
commitment and thus bring efficiency in the implementation of the government budget.

48
67. In the Medium term, Development Partners’ support will remain an essential
source of financing the Government budget. Meanwhile, the Government will increase
efforts to mobilize non-aid resources in order to reduce dependency and achieve
desired development goals.
68. Projections for financial year 2018/19 indicate that Development Partners will
provide Shillings 3,658.2 billion, of which General Budget Support is estimated at
shilling 946.0 billion; Basket Funds and Project funds amounting to shillings 558.9 billion
and 2,153.3 billion respectively.
2.2.2 Expenditure Policy
69. Effective spending prioritization and prudent fiscal management are the main
enforcement mechanisms for implementation of 2018/19 budget and the two
subsequent financial years. Expenditure policy over the medium term is designed to
consolidate the gains made towards achieving fiscal sustainability and macroeconomic
stability and maintaining the Government convergence path towards the East Africa
Community Monetary Union protocol. The policy stance is to ensure that recurrent
expenditure in Government budget is reduced to create fiscal space for financing
infrastructure.
70. Allocation for development expenditure in the medium term, will be maintained
at the range of 30 to 40 percent of the total budget. The focus will be to implement the
strategic projects (flagship projects) and new development initiatives. Commercially
viable projects will be financed through Public Private Partnership arrangements. In
addition, the Government will continue to recognize the development expenditure from
earmarked funds for specific investments of national interest such as the Roads fund,
Railway Development Fund, Rural Energy Development Fund, and Water Development
Fund.
71. Total expenditure for 2018/19 is estimated to be shillings 32,476.0 billion
equivalent to 24.5 percent of GDP. Out of this, recurrent expenditure is expected to be
shillings 20,227.6 equivalent to 15.2 percent of GDP of which wages and salaries
(including Parastatals) are estimated to be shillings 7,627.7 billion (5.7 percent of GDP)
and CFS are expected to be shillings 9,705.2 billion (7.3 percent of GDP). Development
expenditure is projected to be shillings 12,248.3 billion equivalent 9.2 percent of GDP in
2018/19.

49
2.2.3 Management of Domestic Arrears
72. The Government policy stance is as per PMG Treasury Circular No. 4 of 2014/15
which issued instructions and strategies aiming at improving budget credibility, reducing
stock of domestic arrears and preventing creation of new arrears. The emphasis is on
strengthening cash management function and ensuring that MDAs, RSs & LGAs submit
credible action plans and cash flow plans that will be the basis for allocating available
resources.
73. Currently, one of the Government’s initiatives is to continue to verify unpaid
claims and use earmarked budget allocation to clear stock of arrears (Suppliers,
Contractors and Staff) in phases. Other initiatives include:
(i) Scrutinizing all MDAs, RSs, and LGAs MTEF so as to maintain credible spending
components and reducing less priotised expenditure;
(ii) Prohibiting supplying of goods and services for the Government without
providing system generated Local Purchase Order (LPO) from the IFMS;
(iii) Strictly subjecting Government commitments to funds availability and awarding
of contracts supported by warrants to spend;
(iv) Government institutions seeking approval from the Minister for Finance and
Planning before borrowing as stipulated in the Government Loans Guarantees
and Grants Act, CAP 134; and
(v) Reducing transaction costs in acquisition of Government common usage by using
existing bodies for acquisition; e.g. the use of GPSA in acquisition of motor
vehicles etc. and the use of public facilities to minimize expenditures etc.
2.2.4 Deficit Financing Policy
74. The Government will continue borrowing from domestic and external sources to
finance the deficit. External non-concessional borrowing will be undertaken cautiously
and limited to capital expenditure with viable expected returns. Consistent with the
recent Medium Term Debt Strategy (MTDS) 2016, the Government will increasingly rely
on Multilateral Development Banks and Export Credit Agencies on project financing,
which is more affordable compared to market terms. Upon completion of credit rating
process the Government may explore other alternative sources of financing including
issuance of Euro Bond with a view to diversify our funding sources for capital
expenditures while at the same time reducing pressures on domestic market.
75. Government borrowing from the domestic market will be limited to levels that
will not crowd out the private sector. Moreover, in reducing rollover risks, the
Government will aim at lengthening the average maturity of domestic debt. On external
50
financing, the Government will continue borrowing more on concessional terms and
fixed interest rates in order to minimize foreign exchange and interest rate risk
exposure.
76. Based on the projected revenues and expenditures, in 2018/19 the fiscal deficit
(excluding grants), is projected at shillings 4,612.4 billion (equivalent to 3.5 percent of
GDP) against the estimated fiscal deficit of shillings 5,604.1 billion (equivalent 4.6
percent of GDP) in 2017/18. The overall deficit (including grants) is projected at
shillings 3,310.5 billion (equivalent to 2.5 percent of GDP) in 2018/19 against the
estimated fiscal deficit of shillings 4,560.3 billion (equivalent to 3.8 percent of GDP) in
FY 2017/18. The fiscal deficit in 2018/19 of 2.5 percent of GDP, will be financed by net
external financing of shillings 1,983.5 billion (equivalent to 1.5 percent of GDP) and
shillings 1,327.0 billion (equivalent to 1 percent of GDP) from net domestic borrowing.
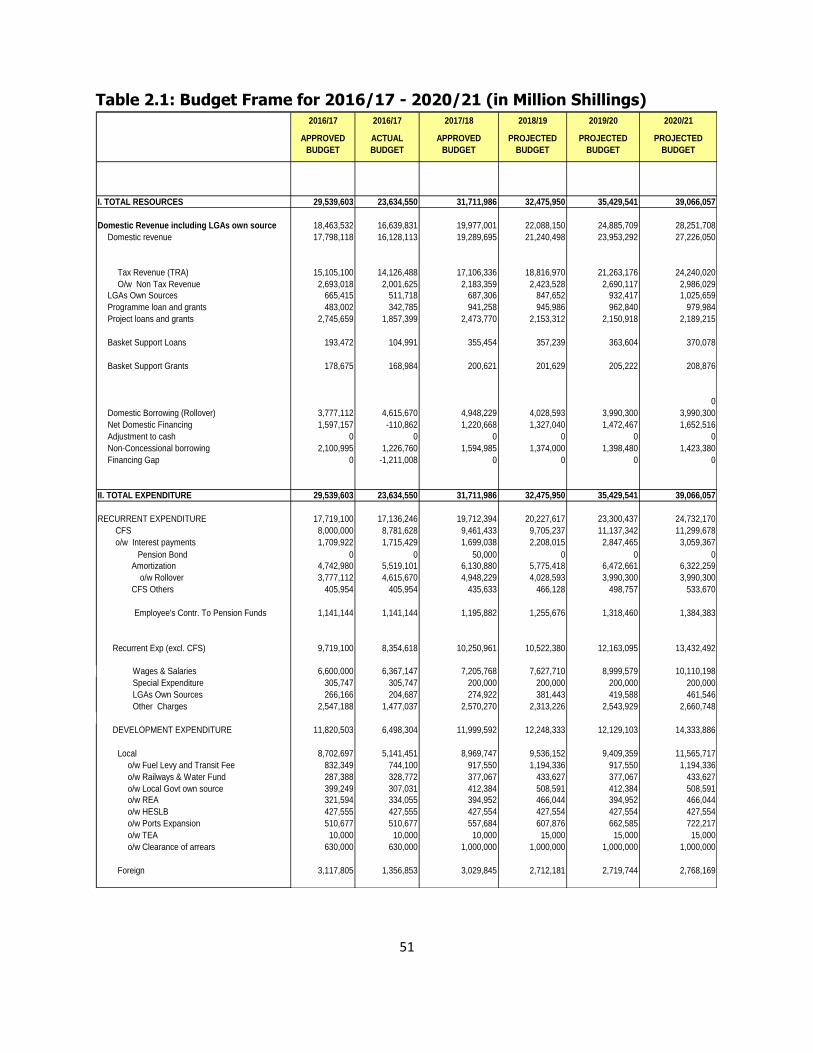
51
Table 2.1: Budget Frame for 2016/17 - 2020/21 (in Million Shillings) 2016/17 2016/17 2017/18 2018/19 2019/20 2020/21
I. TOTAL RESOURCES 29,539,603 23,634,550 31,711,986 32,475,950 35,429,541 39,066,057
Domestic Revenue including LGAs own source 18,463,532 16,639,831 19,977,001 22,088,150 24,885,709 28,251,708
Domestic revenue 17,798,118 16,128,113 19,289,695 21,240,498 23,953,292 27,226,050
Tax Revenue (TRA) 15,105,100 14,126,488 17,106,336 18,816,970 21,263,176 24,240,020
O/w Non Tax Revenue 2,693,018 2,001,625 2,183,359 2,423,528 2,690,117 2,986,029
LGAs Own Sources 665,415 511,718 687,306 847,652 932,417 1,025,659
Programme loan and grants 483,002 342,785 941,258 945,986 962,840 979,984
Project loans and grants 2,745,659 1,857,399 2,473,770 2,153,312 2,150,918 2,189,215
Basket Support Loans 193,472 104,991 355,454 357,239 363,604 370,078
Basket Support Grants 178,675 168,984 200,621 201,629 205,222 208,876
0
Domestic Borrowing (Rollover) 3,777,112 4,615,670 4,948,229 4,028,593 3,990,300 3,990,300
Net Domestic Financing 1,597,157 -110,862 1,220,668 1,327,040 1,472,467 1,652,516
Adjustment to cash 0 0 0 0 0 0
Non-Concessional borrowing 2,100,995 1,226,760 1,594,985 1,374,000 1,398,480 1,423,380
Financing Gap 0 -1,211,008 0 0 0 0
II. TOTAL EXPENDITURE 29,539,603 23,634,550 31,711,986 32,475,950 35,429,541 39,066,057
RECURRENT EXPENDITURE 17,719,100 17,136,246 19,712,394 20,227,617 23,300,437 24,732,170
CFS 8,000,000 8,781,628 9,461,433 9,705,237 11,137,342 11,299,678
o/w Interest payments 1,709,922 1,715,429 1,699,038 2,208,015 2,847,465 3,059,367
Pension Bond 0 0 50,000 0 0 0
Amortization 4,742,980 5,519,101 6,130,880 5,775,418 6,472,661 6,322,259
o/w Rollover 3,777,112 4,615,670 4,948,229 4,028,593 3,990,300 3,990,300
CFS Others 405,954 405,954 435,633 466,128 498,757 533,670
Employee's Contr. To Pension Funds 1,141,144 1,141,144 1,195,882 1,255,676 1,318,460 1,384,383
Recurrent Exp (excl. CFS) 9,719,100 8,354,618 10,250,961 10,522,380 12,163,095 13,432,492
Wages & Salaries 6,600,000 6,367,147 7,205,768 7,627,710 8,999,579 10,110,198
Special Expenditure 305,747 305,747 200,000 200,000 200,000 200,000
LGAs Own Sources 266,166 204,687 274,922 381,443 419,588 461,546
Other Charges 2,547,188 1,477,037 2,570,270 2,313,226 2,543,929 2,660,748
DEVELOPMENT EXPENDITURE 11,820,503 6,498,304 11,999,592 12,248,333 12,129,103 14,333,886
Local 8,702,697 5,141,451 8,969,747 9,536,152 9,409,359 11,565,717
o/w Fuel Levy and Transit Fee 832,349 744,100 917,550 1,194,336 917,550 1,194,336
o/w Railways & Water Fund 287,388 328,772 377,067 433,627 377,067 433,627
o/w Local Govt own source 399,249 307,031 412,384 508,591 412,384 508,591
o/w REA 321,594 334,055 394,952 466,044 394,952 466,044
o/w HESLB 427,555 427,555 427,554 427,554 427,554 427,554
o/w Ports Expansion 510,677 510,677 557,684 607,876 662,585 722,217
o/w TEA 10,000 10,000 10,000 15,000 15,000 15,000
o/w Clearance of arrears 630,000 630,000 1,000,000 1,000,000 1,000,000 1,000,000
Foreign 3,117,805 1,356,853 3,029,845 2,712,181 2,719,744 2,768,169
ACTUAL
BUDGET
APPROVED
BUDGET
PROJECTED
BUDGET
PROJECTED
BUDGET
PROJECTED
BUDGET
APPROVED
BUDGET
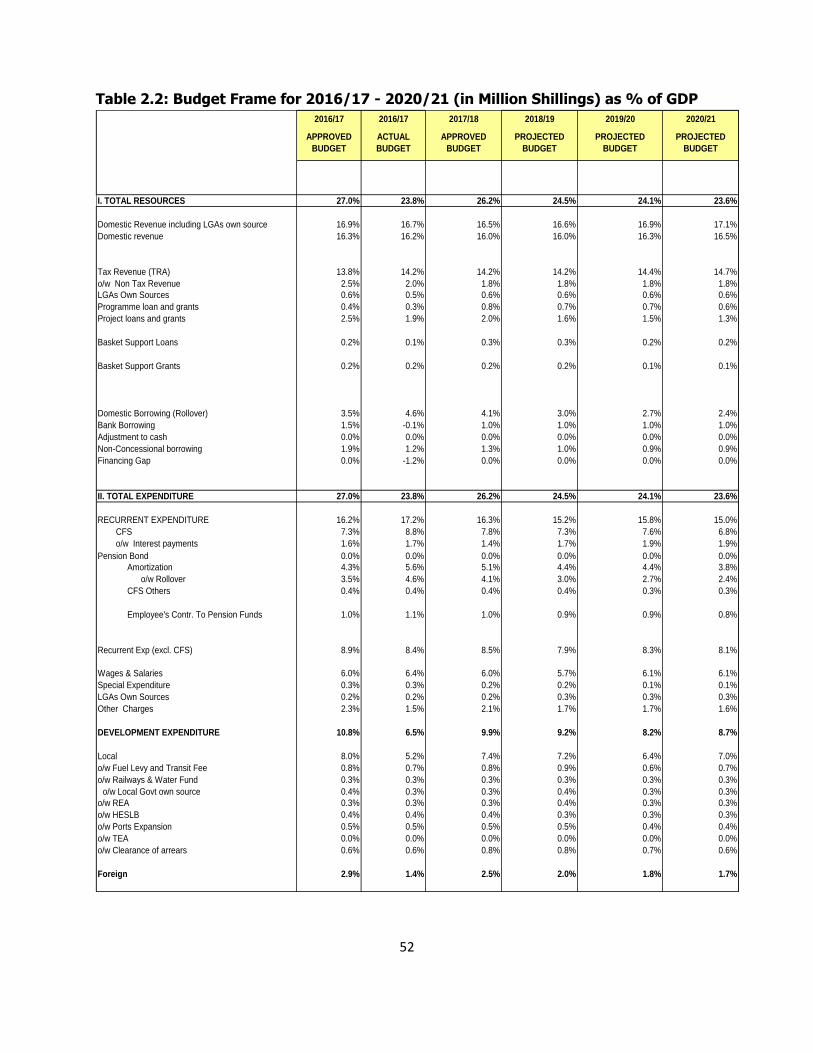
52
Table 2.2: Budget Frame for 2016/17 - 2020/21 (in Million Shillings) as % of GDP
2016/17 2016/17 2017/18 2018/19 2019/20 2020/21
I. TOTAL RESOURCES 27.0% 23.8% 26.2% 24.5% 24.1% 23.6%
Domestic Revenue including LGAs own source 16.9% 16.7% 16.5% 16.6% 16.9% 17.1%
Domestic revenue 16.3% 16.2% 16.0% 16.0% 16.3% 16.5%
Tax Revenue (TRA) 13.8% 14.2% 14.2% 14.2% 14.4% 14.7%
o/w Non Tax Revenue 2.5% 2.0% 1.8% 1.8% 1.8% 1.8%
LGAs Own Sources 0.6% 0.5% 0.6% 0.6% 0.6% 0.6%
Programme loan and grants 0.4% 0.3% 0.8% 0.7% 0.7% 0.6%
Project loans and grants 2.5% 1.9% 2.0% 1.6% 1.5% 1.3%
Basket Support Loans 0.2% 0.1% 0.3% 0.3% 0.2% 0.2%
Basket Support Grants 0.2% 0.2% 0.2% 0.2% 0.1% 0.1%
Domestic Borrowing (Rollover) 3.5% 4.6% 4.1% 3.0% 2.7% 2.4%
Bank Borrowing 1.5% -0.1% 1.0% 1.0% 1.0% 1.0%
Adjustment to cash 0.0% 0.0% 0.0% 0.0% 0.0% 0.0%
Non-Concessional borrowing 1.9% 1.2% 1.3% 1.0% 0.9% 0.9%
Financing Gap 0.0% -1.2% 0.0% 0.0% 0.0% 0.0%
II. TOTAL EXPENDITURE 27.0% 23.8% 26.2% 24.5% 24.1% 23.6%
RECURRENT EXPENDITURE 16.2% 17.2% 16.3% 15.2% 15.8% 15.0%
CFS 7.3% 8.8% 7.8% 7.3% 7.6% 6.8%
o/w Interest payments 1.6% 1.7% 1.4% 1.7% 1.9% 1.9%
Pension Bond 0.0% 0.0% 0.0% 0.0% 0.0% 0.0%
Amortization 4.3% 5.6% 5.1% 4.4% 4.4% 3.8%
o/w Rollover 3.5% 4.6% 4.1% 3.0% 2.7% 2.4%
CFS Others 0.4% 0.4% 0.4% 0.4% 0.3% 0.3%
Employee's Contr. To Pension Funds 1.0% 1.1% 1.0% 0.9% 0.9% 0.8%
Recurrent Exp (excl. CFS) 8.9% 8.4% 8.5% 7.9% 8.3% 8.1%
Wages & Salaries 6.0% 6.4% 6.0% 5.7% 6.1% 6.1%
Special Expenditure 0.3% 0.3% 0.2% 0.2% 0.1% 0.1%
LGAs Own Sources 0.2% 0.2% 0.2% 0.3% 0.3% 0.3%
Other Charges 2.3% 1.5% 2.1% 1.7% 1.7% 1.6%
DEVELOPMENT EXPENDITURE 10.8% 6.5% 9.9% 9.2% 8.2% 8.7%
Local 8.0% 5.2% 7.4% 7.2% 6.4% 7.0%
o/w Fuel Levy and Transit Fee 0.8% 0.7% 0.8% 0.9% 0.6% 0.7%
o/w Railways & Water Fund 0.3% 0.3% 0.3% 0.3% 0.3% 0.3%
o/w Local Govt own source 0.4% 0.3% 0.3% 0.4% 0.3% 0.3%
o/w REA 0.3% 0.3% 0.3% 0.4% 0.3% 0.3%
o/w HESLB 0.4% 0.4% 0.4% 0.3% 0.3% 0.3%
o/w Ports Expansion 0.5% 0.5% 0.5% 0.5% 0.4% 0.4%
o/w TEA 0.0% 0.0% 0.0% 0.0% 0.0% 0.0%
o/w Clearance of arrears 0.6% 0.6% 0.8% 0.8% 0.7% 0.6%
Foreign 2.9% 1.4% 2.5% 2.0% 1.8% 1.7%
PROJECTED
BUDGET
APPROVED
BUDGET
ACTUAL
BUDGET
PROJECTED
BUDGET
PROJECTED
BUDGET
APPROVED
BUDGET

53
Table 2.3: Budget Frame for 2016/17 - 2020/21 (in Million Shillings) as % of
Total Budget 2016/17 2016/17 2017/18 2018/19 2019/20 2020/21
I. TOTAL RESOURCES 100.0% 100.0% 100.0% 100.0% 100.0% 100.0%
Domestic Revenue including LGAs own source 62.5% 70.4% 63.0% 68.0% 70.2% 72.3%
Domestic revenue 60.3% 68.2% 60.8% 65.4% 67.6% 69.7%
Tax Revenue (TRA) 51.1% 59.8% 53.9% 57.9% 60.0% 62.0%
o/w Non Tax Revenue 9.1% 8.5% 6.9% 7.5% 7.6% 7.6%
LGAs Own Sources 2.3% 2.2% 2.2% 2.6% 2.6% 2.6%
Programme loan and grants 1.6% 1.5% 3.0% 2.9% 2.7% 2.5%
Project loans and grants 9.3% 7.9% 7.8% 6.6% 6.1% 5.6%
Basket Support Loans 0.7% 0.4% 1.1% 1.1% 1.0% 0.9%
Basket Support Grants 0.6% 0.7% 0.6% 0.6% 0.6% 0.5%
Domestic Borrowing (Rollover) 12.8% 19.5% 15.6% 12.4% 11.3% 10.2%
Net Domestic Financing 5.4% -0.5% 3.8% 4.1% 4.2% 4.2%
Adjustment to cash 0.0% 0.0% 0.0% 0.0% 0.0% 0.0%
Non-Concessional borrowing 7.1% 5.2% 5.0% 4.2% 3.9% 3.6%
Financing Gap 0.0% -5.1% 0.0% 0.0% 0.0% 0.0%
II. TOTAL EXPENDITURE 100.0% 100.0% 100.0% 100.0% 100.0% 100.0%
RECURRENT EXPENDITURE 60.0% 72.5% 62.2% 62.3% 65.8% 63.3%
CFS 27.1% 37.2% 29.8% 29.9% 31.4% 28.9%
o/w Interest payments 5.8% 7.3% 5.4% 6.8% 8.0% 7.8%
Pension Bond 0.0% 0.0% 0.2% 0.0% 0.0% 0.0%
Amortization 16.1% 23.4% 19.3% 17.8% 18.3% 16.2%
o/w Rollover 12.8% 19.5% 15.6% 12.4% 11.3% 10.2%
CFS Others 1.4% 1.7% 1.4% 1.4% 1.4% 1.4%
Employee's Contr. To Pension Funds 3.9% 4.8% 3.8% 3.9% 3.7% 3.5%
Recurrent Exp (excl. CFS) 32.9% 35.3% 32.3% 32.4% 34.3% 34.4%
Wages & Salaries 22.3% 26.9% 22.7% 23.5% 25.4% 25.9%
Special Expenditure 1.0% 1.3% 0.6% 0.6% 0.6% 0.5%
LGAs Own Sources 0.9% 0.9% 0.9% 1.2% 1.2% 1.2%
Other Charges 8.6% 6.2% 8.1% 7.1% 7.2% 6.8%
DEVELOPMENT EXPENDITURE 40.0% 27.5% 37.8% 37.7% 34.2% 36.7%
Local 29.5% 21.8% 28.3% 29.4% 26.6% 29.6%
o/w Fuel Levy and Transit Fee 2.8% 3.1% 2.9% 3.7% 2.6% 3.1%
o/w Railways & Water Fund 1.0% 1.4% 1.2% 1.3% 1.1% 1.1%
o/w Local Govt own source 1.4% 1.3% 1.3% 1.6% 1.2% 1.3%
o/w REA 1.1% 1.4% 1.2% 1.4% 1.1% 1.2%
o/w HESLB 1.4% 1.8% 1.3% 1.3% 1.2% 1.1%
o/w Ports Expansion 1.7% 2.2% 1.8% 1.9% 1.9% 1.8%
o/w TEA 0.0% 0.0% 0.0% 0.0% 0.0% 0.0%
o/w Clearance of arrears 2.1% 2.7% 3.2% 3.1% 2.8% 2.6%
Foreign 10.6% 5.7% 9.6% 8.4% 7.7% 7.1%
ACTUAL BUDGET PROJECTED
BUDGET
PROJECTED
BUDGET
PROJECTED
BUDGET
APPROVED
BUDGET
APPROVED
BUDGET
54
2.3 Resources Allocation Criteria
77. During 2017/18, the Government developed a descriptive resource allocation
formula to forecast expenditure for MDAs. Resource allocation formula for LGAs was
developed and used since financial year 2005/06. The Government will continue using
the developed formula in allocating resources at individual vote level based on set
criteria. Priority areas for resource allocation have been identified in the Part One of this
Guideline. Therefore, resource allocations aim to ensure adequate funding for the on-
going projects/ activities and other key priority areas identified. To ensure strategic
focus in resource allocation is maintained, development expenditures are allocated 30 –
40 percent of total budget.
2.3.1 Recurrent Expenditure
78. Under this category of expenditure the focus of resource allocation will be based
on the following criteria:-
(i) Personnel Emolument (PE): Salary scales and the number of existing
employees, new employees, promotions, and annual increments;
(ii) Consolidated Fund Services (CFS): Estimated costs of servicing public debts
(both principal repayments and interest expenses), statutory contributions,
gratuities and pension;
(iii) Contingency Fund: Regulations 22 of the Budget Act No.11 of 2015 provides a
one percent of the total budget of the prevailing financial year to be set aside for
Contingency Fund;
(iv) Protected Expenditures: Estimated cost to cover core operating expenses
committed by the Government. These include; Inmates (Prisoners) food, ration
allowance, examination expenses for primary and secondary schools, foreign
service allowance, grants to political parties, Government contributions to
regional and international organizations, rental charges to Government offices,
entitlements for retired leaders, internship allowances, on-call allowance, and
constituency allowance;
(v) One-off Expenditures: Estimated costs related to general elections, Local
government elections, population and housing censuses, etc; and
(vi) Administrative Costs: Number of staff and management team, number of
statutory meetings, office rent and fuel and core functions of MDAs as specified
in the establishing instrument.
To establish the resource requirements mathematical computation is done by
using block computation methodology where data sets collected from various
MDAs are broken down into expenditure blocks as follows:-

55
Block 1: Leaders - Computation of this block expenditure is delivered by
considering the number of leaders and number of cars in use. These help to
compute the estimated budget for fuel, utilities (telephone, electricity, water),
maintenance, furniture and house rent for the leaders in a specific vote.
Block 2: General administration - To deliver the estimate cost of office
running and fulfilling the organization’s mandate, parameters like number of
employees, cars used by staff other than leaders are used to compute budget for
fuel, maintenance, travel expenses, annual leave and other staff allowances.
Block 3: Protected Items - Computation of this expenditure block is delivered
by identifying beneficiaries, applicable rate and parameters used to establish
amounts to be protected in a specific Vote.
Block 4: Salary and wages – Allocation to this category will be based on
salary scales and number of existing employees, new employees, promotions and
annual increments.
2.3.1.1 Specific Criteria for Regional Secretariats
79. Allocation of other charges estimates to RSs will be determined according to their
responsibility of coordinating and backstopping LGAs in their endeavour to deliver social
services and facilitate economic development at local levels. The following criteria will
be used to allocate resources to RSs: -
i. Administration costs including overhead costs, leaders entitlements, etc;
ii. Regions sharing borders with neighbouring countries;
iii. Number of Councils in the Region (Cost of Service provision);
iv. Number of state visitors (Local and International);
v. Distance of Region Headquarters to Dodoma (number of kms);
vi. Distance of Regional Headquarters to District Headquarters (number of kms);
vii. Geographical size of the region (square kilometers); and
viii. Regional hospital operations cost. (Population).
2.3.1.2 Criteria for Local Government Authorities
80. The formula for resource allocation to LGAs will be based on the cost variations
for providing local services. LGAs are categorized as follows:
i. Category A, Urban LGAs (TC/MC/CC);
ii. Category B, Rural LGAs (> 50 people/square km);

56
iii. Category C, Rural LGAs (< 50 people/square km); and
iv. Category D, Special cases ( to be determined).
81. Special circumstances affecting the cost of social service delivery will be
additional criteria.
82. In allocating resources to specific sector within LGAs, the following criteria will be
used:-
a. Education Sector Block Grant:- proportion of the (cost-adjusted) number of
school-aged children (primary), proportion number of students (Secondary) and
proportion to enrolment of eligible students, as approved by MoEST.
i. The capitation grant for primary schools will continue to be Shillings
10,000 per enrolled pupil per annum, including pre-primary pupils and
those in special schools. Forty percent (40%) of the capitation grant to be
kept centrally (MoEST) through Tanzania Institute of Education for bulk
procurement of books and the remaining sixty percent (60%) for
operational costs at school level;
ii. The capitation grant for secondary schools will continue to be Shillings
25,000 per enrolled day and boarding student per annum. Fifty percent
(50%) of the grant will be used for bulk procurement of books centrally
and the remaining fifty percent (50%) for operational costs at school
level; and
iii. The budget for school meals estimates will be at an average of Shillings
540,000 per annum (i.e. Shillings 2,000 x 270 school days) per student
enrolled in registered boarding primary and secondary schools.
b. Health OC Block Grant: The number of residents and estimated number of
poor households and Under Five (5) Mortality Rate.
c. Health Sector Basket Fund: The number of residents, estimated number of
poor households and Under Five (5) Mortality Rate.
d. Agriculture Sector Block Grant: The proportion of number of villages,
estimated number of rural residents and rainfall.
e. Water Sector Block Grant: The fixed amount per Council and proportion to
the number of rural residents; and
f. Local Government Development Grant (LGDG): The proportion of the
(cost-adjusted) number of residents and estimated number of poor households.
2.3.2 Development Expenditure
83. Under this category of expenditure the focus of resource allocation will be based

57
on the following criteria: -
i. Protected Expenditures: Estimated cost to cover expenses committed by the
Government include; capitation, school meals, medical supplies and Constituency
Catalyst Development Fund;
ii. Contractual obligation arrears;
iii. Cost of finalizing on-going projects;
iv. Foreign funded projects requiring counterpart funds;
v. New projects approved by MoFP for implementation under FYDP II;
vi. Implementation of flagship projects and other priority areas;
vii. Projects implemented under PPP framework;
viii. Projects implemented under the earmarked development expenditures financed
through ring fenced sources of revenue such as fuel levy; skills development
levy; livestock development fund; petroleum levy; railway development levy;
National Water Investment Fund; and education levy;
ix. Projects funded by Social Security Funds which requires counterpart fund; and
x. Land acquisition and property compensation.
58
ANNEX
PLAN AND BUDGET SUBMISSION, IMPLEMENTATION AND REPORTING
FORMARTS
84. This annex provides the formats to be used by MDAs, RSs and LGAs in Plan and
Budget preparation, implementation and performance reporting for 2018/19 - 2020/21.
The annex includes:
i. MTEF presentation format;
ii. Quarterly and annual performance reporting formats;
iii. Budget preparation forms: Form 1, 3 (A-C), 4, 6, 6.1, 7, 8 (A-F), 9, 10 (A&C),
15A and Form 16 for pilot Ministries implementing Programme Based Budgeting.
iv. Budget Implementation forms: Form 11A (R) and Form 11A (D); Form 11B (R)
and Form 11B (D); Form 14B (R), Form 14B (D) and Form 14C; and
v. Performance reporting forms: Form 10B, Form 12A; Form 12B; Form 12C; Form
13A and 13B; and Form 13(C1 – C5); and Form 15B.
85. Furthermore, during planning, implementation and reporting, the following
documents/tools can be used as reference materials: Public Investment Management -
Operational Manual (PIM-OM) which provides guidance on methods and procedures
involved in selecting, financing, implementation and evaluation of public investment
projects; Medium Term Strategic Planning and Budgeting Manual (2008) which guides
MDAs, RSs, LGAs and Public Entities on Strategic Plans (SPs) and MTEF preparation as
well as their monitoring and reporting; Planning, Budgeting and Reporting System Tool
(PLANREP) and Facility Financial Accounting and Reporting System (FFARS) designed
to incorporate LGAs medium term strategic Planning, budgeting and reporting to the
service delivery output level.
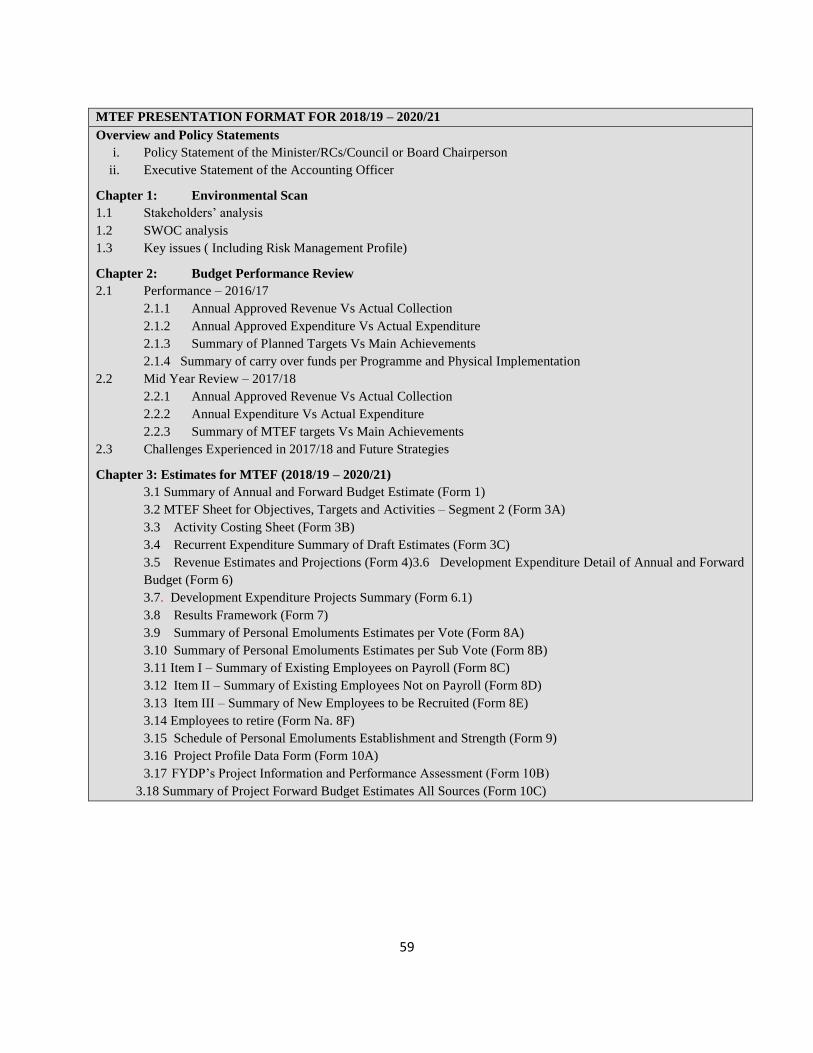
59
MTEF PRESENTATION FORMAT FOR 2018/19 – 2020/21
Overview and Policy Statements
i. Policy Statement of the Minister/RCs/Council or Board Chairperson
ii. Executive Statement of the Accounting Officer Chapter 1: Environmental Scan
1.1 Stakeholders’ analysis
1.2 SWOC analysis
1.3 Key issues ( Including Risk Management Profile) Chapter 2: Budget Performance Review
2.1 Performance – 2016/17
2.1.1 Annual Approved Revenue Vs Actual Collection
2.1.2 Annual Approved Expenditure Vs Actual Expenditure
2.1.3 Summary of Planned Targets Vs Main Achievements
2.1.4 Summary of carry over funds per Programme and Physical Implementation
2.2 Mid Year Review – 2017/18
2.2.1 Annual Approved Revenue Vs Actual Collection
2.2.2 Annual Expenditure Vs Actual Expenditure
2.2.3 Summary of MTEF targets Vs Main Achievements
2.3 Challenges Experienced in 2017/18 and Future Strategies
Chapter 3: Estimates for MTEF (2018/19 – 2020/21)
3.1 Summary of Annual and Forward Budget Estimate (Form 1)
3.2 MTEF Sheet for Objectives, Targets and Activities – Segment 2 (Form 3A)
3.3 Activity Costing Sheet (Form 3B)
3.4 Recurrent Expenditure Summary of Draft Estimates (Form 3C)
3.5 Revenue Estimates and Projections (Form 4)3.6 Development Expenditure Detail of Annual and Forward
Budget (Form 6)
3.7. Development Expenditure Projects Summary (Form 6.1)
3.8 Results Framework (Form 7)
3.9 Summary of Personal Emoluments Estimates per Vote (Form 8A)
3.10 Summary of Personal Emoluments Estimates per Sub Vote (Form 8B)
3.11 Item I – Summary of Existing Employees on Payroll (Form 8C)
3.12 Item II – Summary of Existing Employees Not on Payroll (Form 8D)
3.13 Item III – Summary of New Employees to be Recruited (Form 8E)
3.14 Employees to retire (Form Na. 8F)
3.15 Schedule of Personal Emoluments Establishment and Strength (Form 9)
3.16 Project Profile Data Form (Form 10A)
3.17 FYDP’s Project Information and Performance Assessment (Form 10B)
3.18 Summary of Project Forward Budget Estimates All Sources (Form 10C)

60
STRUCTURE OF THE QUARTERLY REPORTS
I. Title/cover page II. Table of contents
III. Main body Introduction
Overview of Implementation of Milestones/Priority Interventions: This Section of the quarterly report describes progress in implementing milestones, which are
developed during the planning process. To collect information on the implementation of milestones the officer responsible for preparing the report should informally interview implementers (verbally),
rather than distribute a form or sheet for them to fill out. Issues and Constraints:
During the process of monitoring milestones and targets, issues and constraints should typically be
identified. Issues arising may concern, delays in implementation, reduced scope or quality of outputs, constraints in terms of resource availability, etc. The identification of issues to be reported
is, however, a subjective matter and there will be a need to prioritize which issues affected the achievement of the set milestones and targets within the specified period.
Remedial Actions IV. ** Summary of budget variations and their justification (for Quarter II only)
V. Annex and Tables
Annex 1: Form 12A: Quarterly Cumulative MTEF Target Monitoring Form Annex 2: Form 12B: Quarterly Cumulative Milestone (Priority) Form
Annex 3: Form 13A: Quarterly Cumulative Financial Overview Form Annex 4: Form 13B: Quarterly Cumulative Financial Detailed Form
Key: ** included during the mid-year progress report only

61
STRUCTURE OF AN ANNUAL PERFORMANCE REPORT
TITLE/COVER PAGE
TABLE OF CONTENTS
PREFACE
1. Statement by the Minister/RC/Board Chairperson/Council Chairperson
2. Statement by the Accounting Officer.
3. Executive Summary
MAIN BODY
1. Part 1: Introduction. This should include the following:
Section 1.1 (Introduction): a short description of the purpose of the report, the approach adopted, and the methods
used.
Section 1.2 (structure) Describe the layout and structure of the remainder of the document.
2. Part II: Overall Performance
Section 2.1 (Progress towards reaching outcomes): Provides highlights of performance, in words and in a summary
indicator table format. Makes reference to a more detailed annex. This should explicitly make reference to
progress in meeting SDG, FYDP II goals and targets, or ruling party commitments.
Section 2.2 Progress in improving service delivery (quality, efficiency, timeliness, or satisfaction); discuss what
changes have occurred within the organization to improve the services it provides to its clients. For example, if
passports are delivered more quickly, if cost savings have been generated for the taxpayer, etc.
Section 2.3 (Evaluation and Reviews): Summarizes (very briefly) the results of studies that will be used to prepare
the 3-Year Outcome report, and the general progress in terms of evaluation results.
Section 2.4 Milestones or Priority Interventions: a discussion of interventions that were considered to be critical to
achieve overall objectives or ensure effective implementation of the plan.
Section 2.5 (Issues): Highlight problems or issues, carefully identifying targets at risk or targets which were not
met. This may be brief with more details explained in Part III. Describe the actions taken by management to
address these problems.
3. Part III: Achievement of Annual Targets. This chapter should be presented on a sub-vote by sub-vote basis. It
should provide the written details about each target and what happened during implementation. The chapter may also
document details about key activities (especially those not implemented) and overview expenditure data on a
particular target.
4. Part IV: Financial Performance. This chapter should provide overall aggregate expenditure data compared to
budgets as well as revenue collection trends (where applicable). Expenditure information should be derived from the
Integrated Financial Management Systems (IFMS.
5. Part V: HR Review. Summarizes staffing levels, vacancies, and other key issues including the balance between PE
and OC.
ANNEX and TABLES
Annex 1: Form 12A: Quarterly Cumulative MTEF Target Monitoring Form
Annex 2: Form 12B: Quarterly Cumulative Milestone (Priority) Monitoring Form
Annex 3: Form 12C: Outcome Indicator Monitoring Form
Annex 4: Form 13A: Quarterly Cumulative Financial Overview Form
Annex 5: Form 13B: Quarterly Cumulative Financial Detailed Form
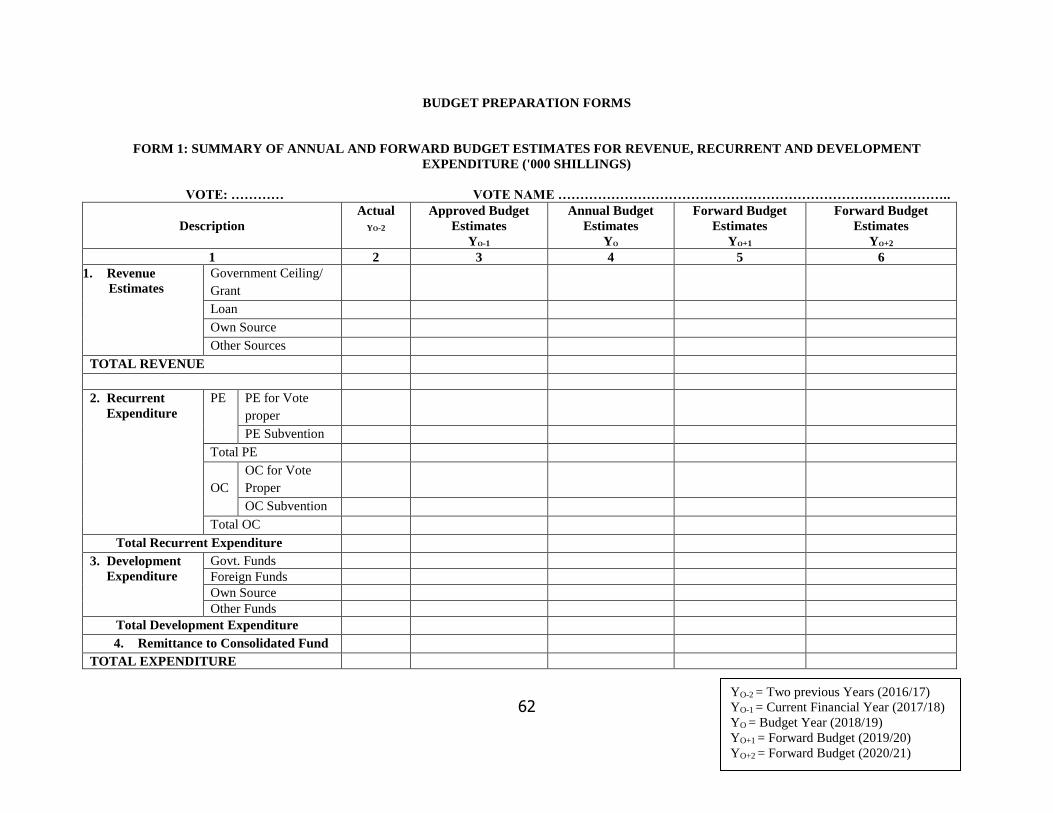
62
BUDGET PREPARATION FORMS
FORM 1: SUMMARY OF ANNUAL AND FORWARD BUDGET ESTIMATES FOR REVENUE, RECURRENT AND DEVELOPMENT
EXPENDITURE ('000 SHILLINGS)
VOTE: ………… VOTE NAME ……………………………………………………………………………..
Description
Actual
YO-2
Approved Budget
Estimates
YO-1
Annual Budget
Estimates
YO
Forward Budget
Estimates
YO+1
Forward Budget
Estimates
YO+2
1 2 3 4 5 6
1. Revenue
Estimates
Government Ceiling/
Grant
Loan
Own Source
Other Sources
TOTAL REVENUE
2. Recurrent
Expenditure
PE PE for Vote
proper
PE Subvention
Total PE
OC
OC for Vote
Proper
OC Subvention
Total OC
Total Recurrent Expenditure
3. Development
Expenditure
Govt. Funds
Foreign Funds
Own Source
Other Funds
Total Development Expenditure
4. Remittance to Consolidated Fund
TOTAL EXPENDITURE
YO-2 = Two previous Years (2016/17)
YO-1 = Current Financial Year (2017/18)
YO = Budget Year (2018/19)
YO+1 = Forward Budget (2019/20)
YO+2 = Forward Budget (2020/21)
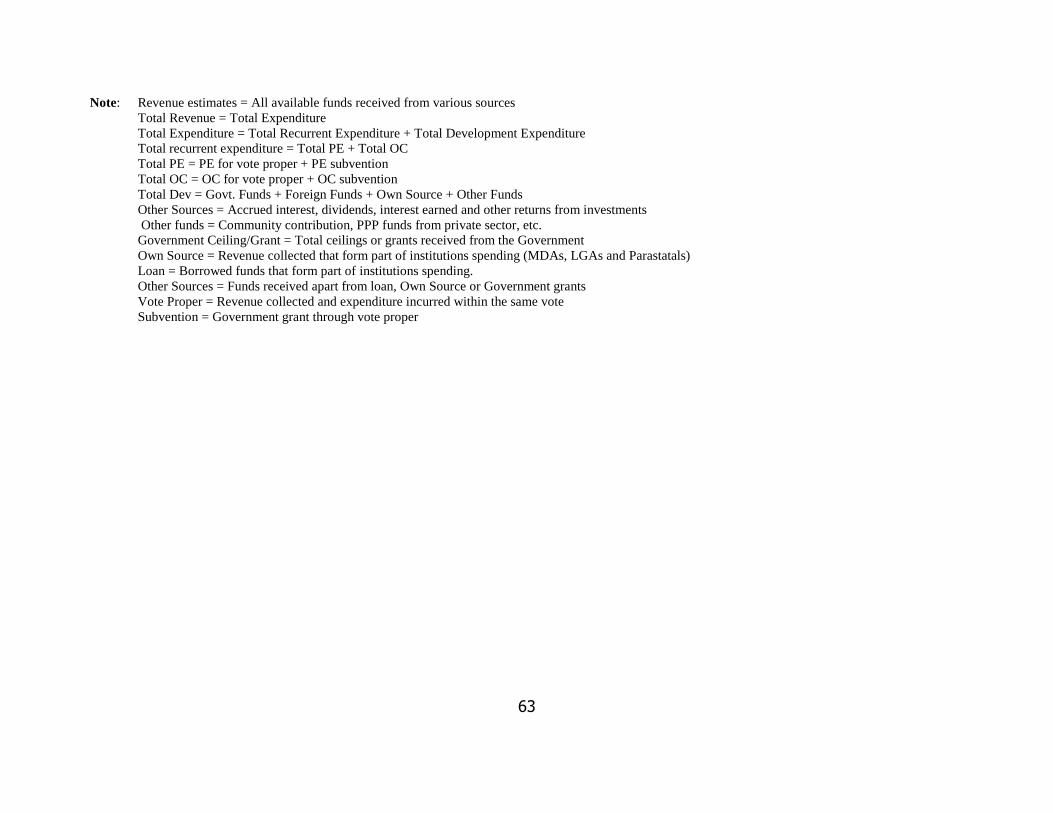
63
Note: Revenue estimates = All available funds received from various sources
Total Revenue = Total Expenditure
Total Expenditure = Total Recurrent Expenditure + Total Development Expenditure
Total recurrent expenditure = Total PE + Total OC
Total PE = PE for vote proper + PE subvention
Total OC = OC for vote proper + OC subvention
Total Dev = Govt. Funds + Foreign Funds + Own Source + Other Funds
Other Sources = Accrued interest, dividends, interest earned and other returns from investments
Other funds = Community contribution, PPP funds from private sector, etc.
Government Ceiling/Grant = Total ceilings or grants received from the Government
Own Source = Revenue collected that form part of institutions spending (MDAs, LGAs and Parastatals)
Loan = Borrowed funds that form part of institutions spending.
Other Sources = Funds received apart from loan, Own Source or Government grants
Vote Proper = Revenue collected and expenditure incurred within the same vote
Subvention = Government grant through vote proper

64
FORM 3A: MTEF SHEET FOR OBJECTIVES, TARGETS AND ACTIVITY COSTING
VOTE: ………… VOTE NAME ……………………………………………………………………………..
SUB-VOTE CODE: ………… SUB-VOTE NAME ………………………………………………………………………..
Objective Target Target
Type
Activity
Code
Segment 2 Activity
Description
Actual
YO-2
Approved
Budget
Estimates
YO-1
Annual
Budget
Estimates
YO
Forward
Budget
Estimates
YO+1
Forward
Budget
Estimates
YO+2
A
01
S
01 A01S01
TOTAL

65
FORM 3B: ACTIVITY COSTING SHEET
VOTE: ………… VOTE NAME ……………………………………………………………………………........
SUB-VOTE CODE: ………… SUB-VOTE NAME ……………………………………………………………………………..
OBJECTIVE NO: ………… OBJECTIVE DESCRIPTION:……………………………………………………….................
TARGET CODE: ………… TARGET DESCRIPTION:………………………………………………………………..........
Tick the appropriate (√)
FYDP II
Other
Segment 2
Code and
Description
Segment 4
(GFS Code)
Required Inputs
Annual Budget
Estimates
Y0
Forward Budget
Estimates
Y0+1
Forward Budget
Estimates
Y0+2
Segment 4
Description (GFS
Code Description)
Unit of
Measure
Unit cost
of Inputs
No of
Units Estimates
No of
Units Estimates
No of
Units Estimates
1 2 3 4 5 6 7 8 9 10 11
TOTAL
Notes
Column 1: Segment 2 includes objective, target, target type and activity;
Column 7 equals column 5 x column 6
Column 9 equals column 5 x column 8
Column 11 equals column 5 x column 10
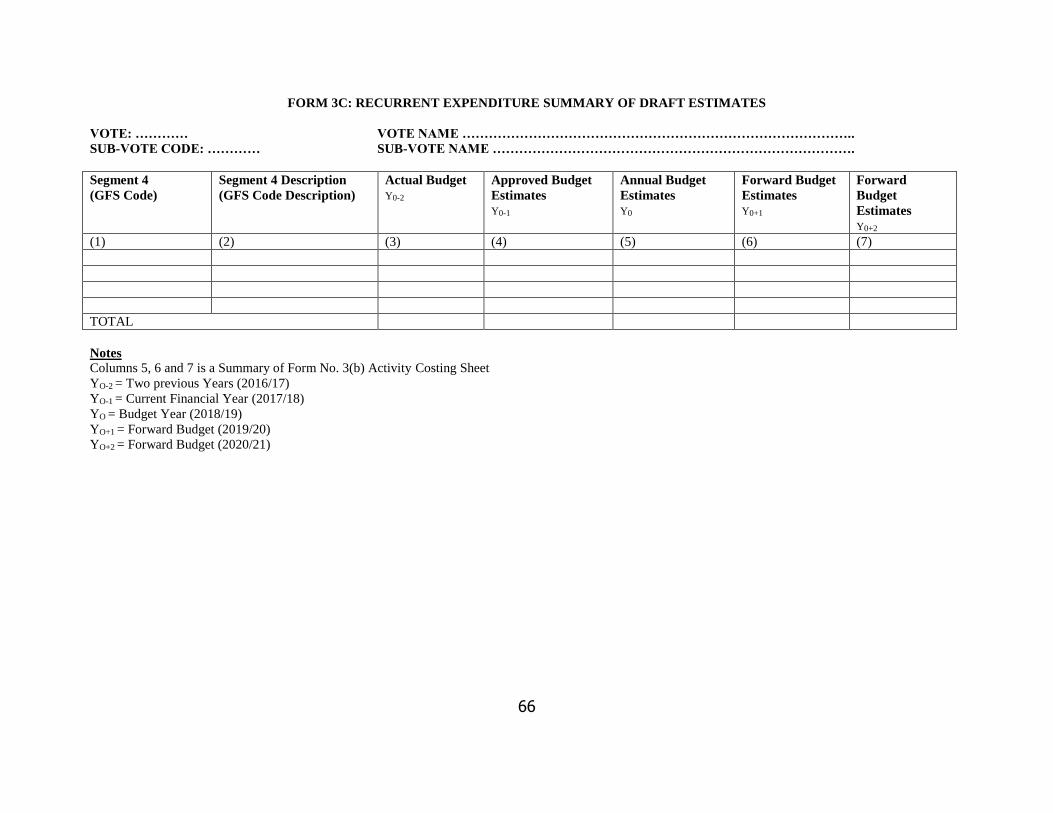
66
FORM 3C: RECURRENT EXPENDITURE SUMMARY OF DRAFT ESTIMATES
VOTE: ………… VOTE NAME ……………………………………………………………………………..
SUB-VOTE CODE: ………… SUB-VOTE NAME ……………………………………………………………………….
Segment 4
(GFS Code)
Segment 4 Description
(GFS Code Description)
Actual Budget
Y0-2
Approved Budget
Estimates
Y0-1
Annual Budget
Estimates
Y0
Forward Budget
Estimates
Y0+1
Forward
Budget
Estimates
Y0+2
(1) (2) (3) (4) (5) (6) (7)
TOTAL
Notes
Columns 5, 6 and 7 is a Summary of Form No. 3(b) Activity Costing Sheet
YO-2 = Two previous Years (2016/17)
YO-1 = Current Financial Year (2017/18)
YO = Budget Year (2018/19)
YO+1 = Forward Budget (2019/20)
YO+2 = Forward Budget (2020/21)
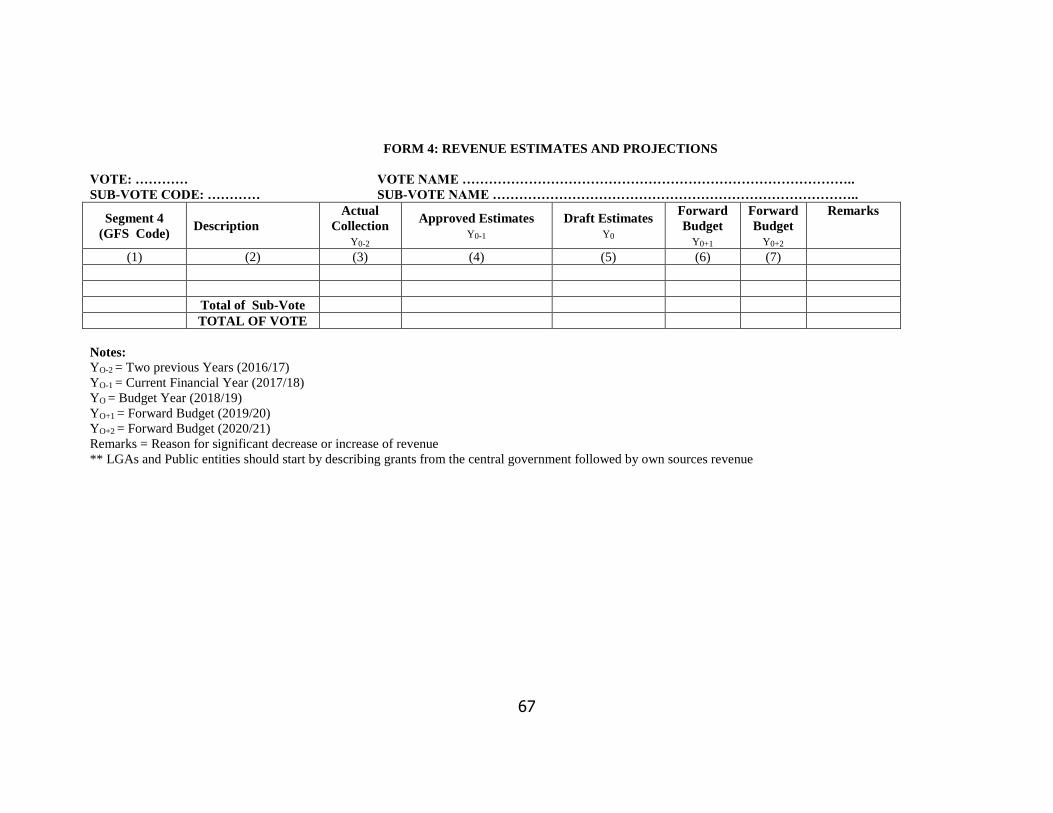
67
FORM 4: REVENUE ESTIMATES AND PROJECTIONS
VOTE: ………… VOTE NAME ……………………………………………………………………………..
SUB-VOTE CODE: ………… SUB-VOTE NAME ………………………………………………………………………..
Segment 4
(GFS Code) Description
Actual
Collection
Y0-2
Approved Estimates
Y0-1
Draft Estimates
Y0
Forward
Budget
Y0+1
Forward
Budget
Y0+2
Remarks
(1) (2) (3) (4) (5) (6) (7)
Total of Sub-Vote
TOTAL OF VOTE
Notes:
YO-2 = Two previous Years (2016/17)
YO-1 = Current Financial Year (2017/18)
YO = Budget Year (2018/19)
YO+1 = Forward Budget (2019/20)
YO+2 = Forward Budget (2020/21)
Remarks = Reason for significant decrease or increase of revenue
** LGAs and Public entities should start by describing grants from the central government followed by own sources revenue

68
FORM 6: DEVELOPMENT EXPENDITURE DETAILS OF ANNUAL AND FORWARD BUDGET
VOTE: ………… VOTE NAME ……………………………………………………………………………..
SUB-VOTE CODE: ………… SUB-VOTE NAME ………………………………………………………………….........
PROJECT CODE: ………………. PROJECT NAME: ………………………………………………….................................
OBJECTIVE NO: ……………… OBJECTIVE DESCRIPTION: ……………………………………………………….........
TARGET CODE: ………… TARGET DESCRIPTION: ………………………………………………...........................
Tick the appropriate (√)
FYDP II
Other
(Seg. 2)
Performance
Budget Codes
Activities
Description
Segment
4 (GFS
Code)
Segment 4
(GFS Code
Description
Annual Budget
Estimates Y0
Forward Budget
Estimates Y0+1
Forward Budget
Estimates Y0+2
Local Foreign L/G D Donor Total Local Foreign Total Local Foreign Total
(1) (2) (3) (4) (5) (6) (7) (8) (9) (10) (11) (12) (13) (14) (15) (16)
Total of
Target
Total of
Project
TOTAL OF SUB-VOTE
Notes
Total Target is Sum of all activities under a Target
Total Project is Sum of all targets under a Project
Total Sub-Vote is Sum of all Projects under the Sub-Vote
Total = Local fund + Foreign fund
L/G = Loan/Grant
D = (Direct to project)

69
FORM 6.1 DEVELOPMENT EXPENDITURE PROJECTS SUMMARY
Project code
Project
name
Annual Budget
Estimates Y0
Forward Budget
Estimates Y0+1 Forward Budget Estimates Y0+2
Local
Foreign
Total Local Foreign Total Local Foreign Total Government
Own
Source L/G D
(1) (2) (3) (4) (5) (6)
(7) (8) (9) (10) (11) (12)
Total of Sub
Vote
Total of Vote
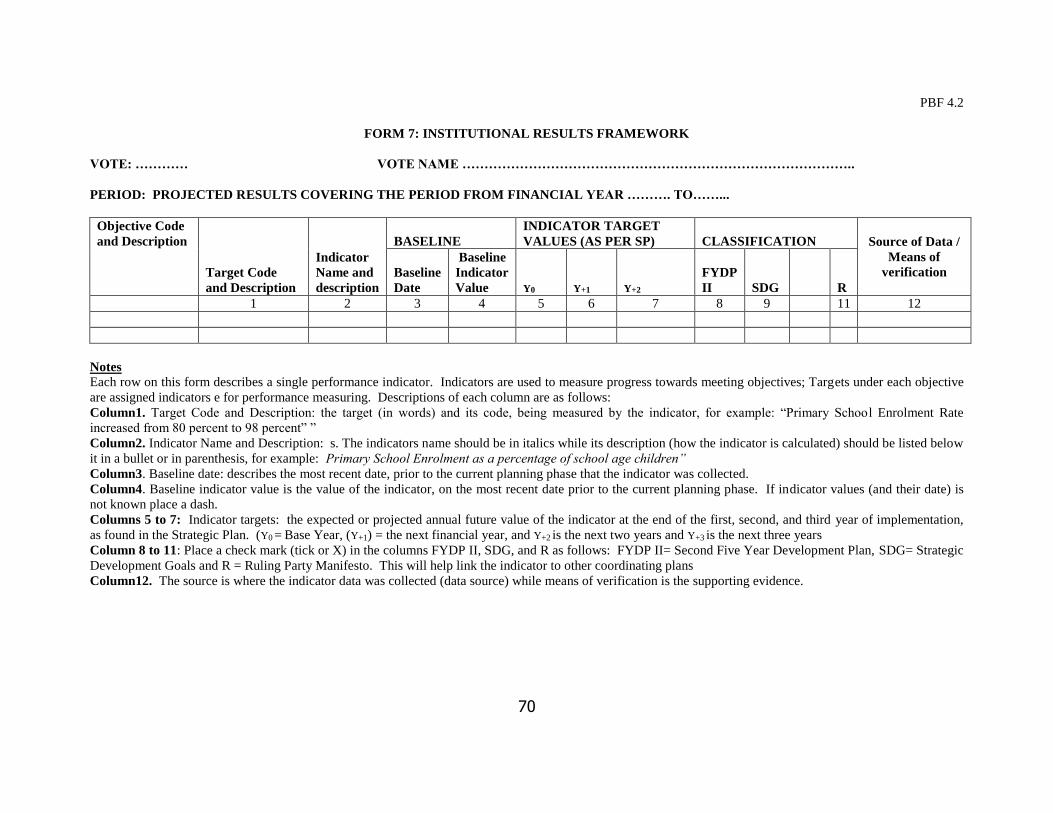
70
PBF 4.2
FORM 7: INSTITUTIONAL RESULTS FRAMEWORK
VOTE: ………… VOTE NAME ……………………………………………………………………………..
PERIOD: PROJECTED RESULTS COVERING THE PERIOD FROM FINANCIAL YEAR ………. TO……...
Objective Code
and Description
Target Code
and Description
Indicator
Name and
description
BASELINE
INDICATOR TARGET
VALUES (AS PER SP) CLASSIFICATION Source of Data /
Means of
verification Baseline
Date
Baseline
Indicator
Value Y0 Y+1 Y+2
FYDP
II SDG R
1 2 3 4 5 6 7 8 9 11 12
Notes
Each row on this form describes a single performance indicator. Indicators are used to measure progress towards meeting objectives; Targets under each objective
are assigned indicators e for performance measuring. Descriptions of each column are as follows:
Column1. Target Code and Description: the target (in words) and its code, being measured by the indicator, for example: “Primary School Enrolment Rate
increased from 80 percent to 98 percent” ”
Column2. Indicator Name and Description: s. The indicators name should be in italics while its description (how the indicator is calculated) should be listed below
it in a bullet or in parenthesis, for example: Primary School Enrolment as a percentage of school age children”
Column3. Baseline date: describes the most recent date, prior to the current planning phase that the indicator was collected.
Column4. Baseline indicator value is the value of the indicator, on the most recent date prior to the current planning phase. If indicator values (and their date) is
not known place a dash.
Columns 5 to 7: Indicator targets: the expected or projected annual future value of the indicator at the end of the first, second, and third year of implementation,
as found in the Strategic Plan. (Y0 = Base Year, (Y+1) = the next financial year, and Y+2 is the next two years and Y+3 is the next three years
Column 8 to 11: Place a check mark (tick or X) in the columns FYDP II, SDG, and R as follows: FYDP II= Second Five Year Development Plan, SDG= Strategic
Development Goals and R = Ruling Party Manifesto. This will help link the indicator to other coordinating plans
Column12. The source is where the indicator data was collected (data source) while means of verification is the supporting evidence.
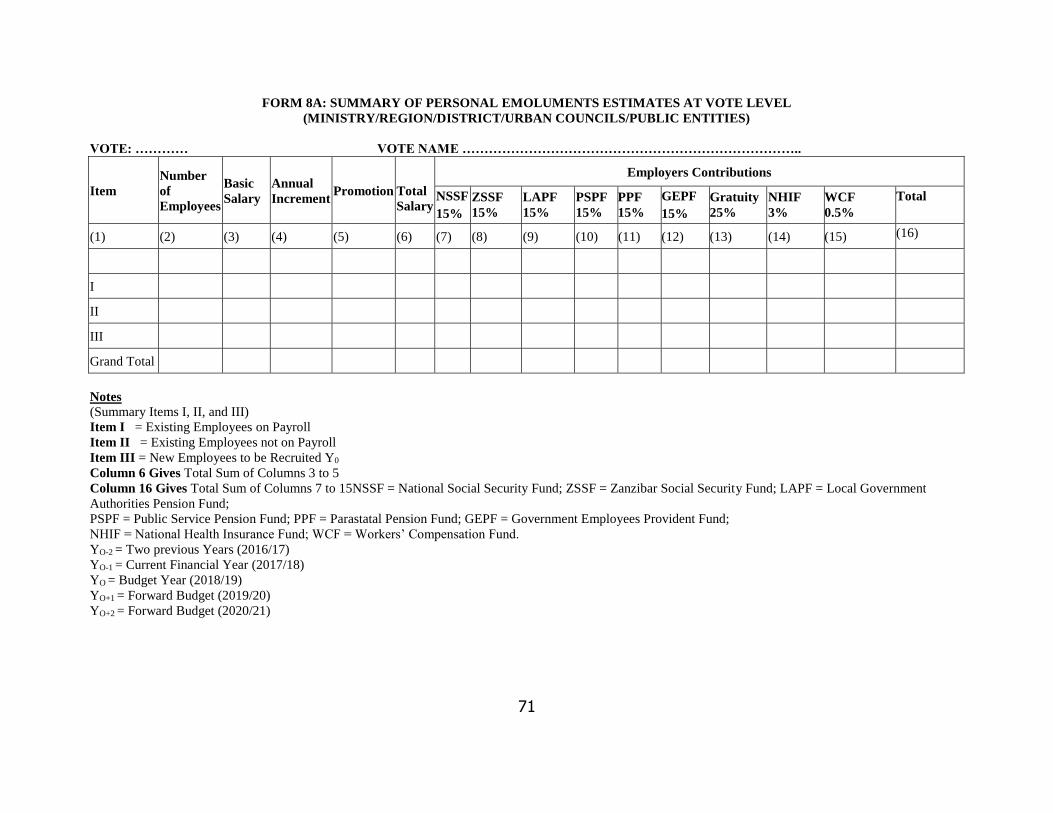
71
FORM 8A: SUMMARY OF PERSONAL EMOLUMENTS ESTIMATES AT VOTE LEVEL
(MINISTRY/REGION/DISTRICT/URBAN COUNCILS/PUBLIC ENTITIES)
VOTE: ………… VOTE NAME …………………………………………………………………..
Item
Number
of
Employees
Basic
Salary
Annual
Increment Promotion
Total
Salary
Employers Contributions
NSSF
15%
ZSSF
15%
LAPF
15%
PSPF
15%
PPF
15%
GEPF
15%
Gratuity
25%
NHIF
3%
WCF
0.5%
Total
(1) (2) (3) (4) (5) (6) (7) (8) (9) (10) (11) (12) (13) (14) (15) (16)
I
II
III
Grand Total
Notes
(Summary Items I, II, and III)
Item I = Existing Employees on Payroll
Item II = Existing Employees not on Payroll
Item III = New Employees to be Recruited Y0
Column 6 Gives Total Sum of Columns 3 to 5
Column 16 Gives Total Sum of Columns 7 to 15NSSF = National Social Security Fund; ZSSF = Zanzibar Social Security Fund; LAPF = Local Government
Authorities Pension Fund;
PSPF = Public Service Pension Fund; PPF = Parastatal Pension Fund; GEPF = Government Employees Provident Fund;
NHIF = National Health Insurance Fund; WCF = Workers’ Compensation Fund.
YO-2 = Two previous Years (2016/17)
YO-1 = Current Financial Year (2017/18)
YO = Budget Year (2018/19)
YO+1 = Forward Budget (2019/20)
YO+2 = Forward Budget (2020/21)
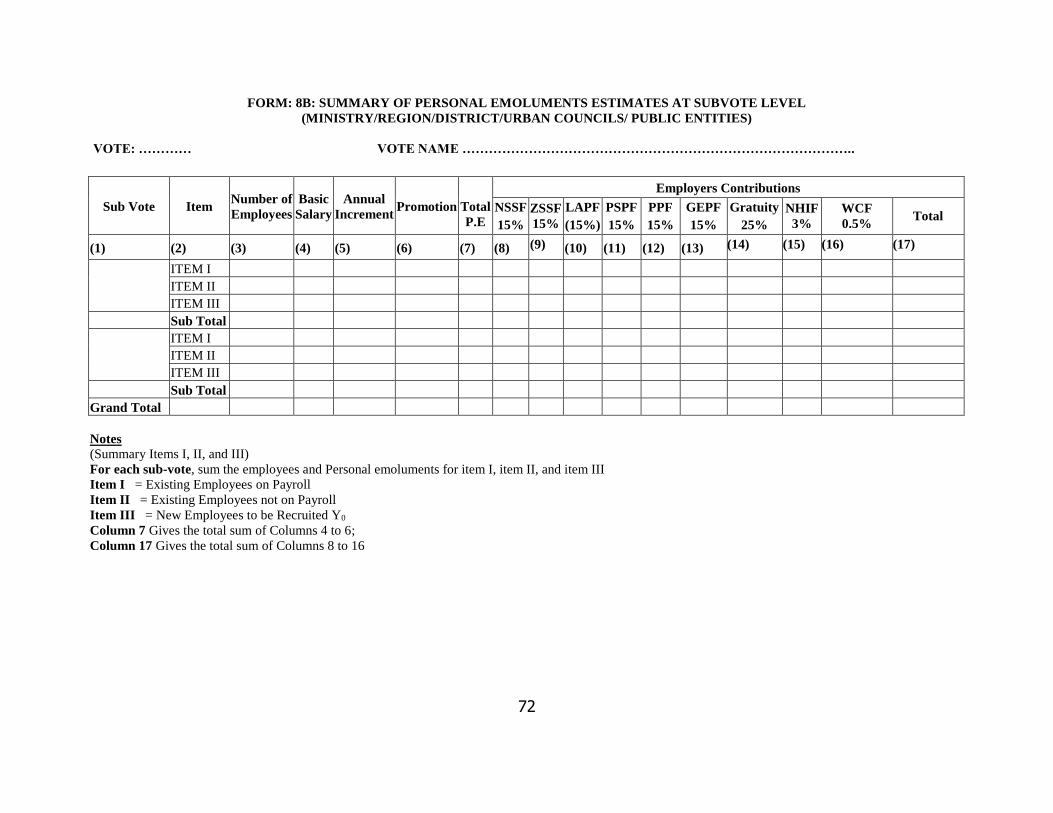
72
FORM: 8B: SUMMARY OF PERSONAL EMOLUMENTS ESTIMATES AT SUBVOTE LEVEL
(MINISTRY/REGION/DISTRICT/URBAN COUNCILS/ PUBLIC ENTITIES)
VOTE: ………… VOTE NAME ……………………………………………………………………………..
Notes
(Summary Items I, II, and III)
For each sub-vote, sum the employees and Personal emoluments for item I, item II, and item III
Item I = Existing Employees on Payroll
Item II = Existing Employees not on Payroll
Item III = New Employees to be Recruited Y0
Column 7 Gives the total sum of Columns 4 to 6;
Column 17 Gives the total sum of Columns 8 to 16
Sub Vote Item Number of
Employees
Basic
Salary
Annual
Increment Promotion
Total
P.E
Employers Contributions
NSSF
15%
ZSSF
15%
LAPF
(15%)
PSPF
15%
PPF
15%
GEPF
15%
Gratuity
25%
NHIF
3%
WCF
0.5% Total
(1) (2) (3) (4) (5) (6) (7) (8) (9) (10) (11) (12) (13) (14) (15) (16) (17)
ITEM I
ITEM II
ITEM III
Sub Total
ITEM I
ITEM II
ITEM III
Sub Total
Grand Total
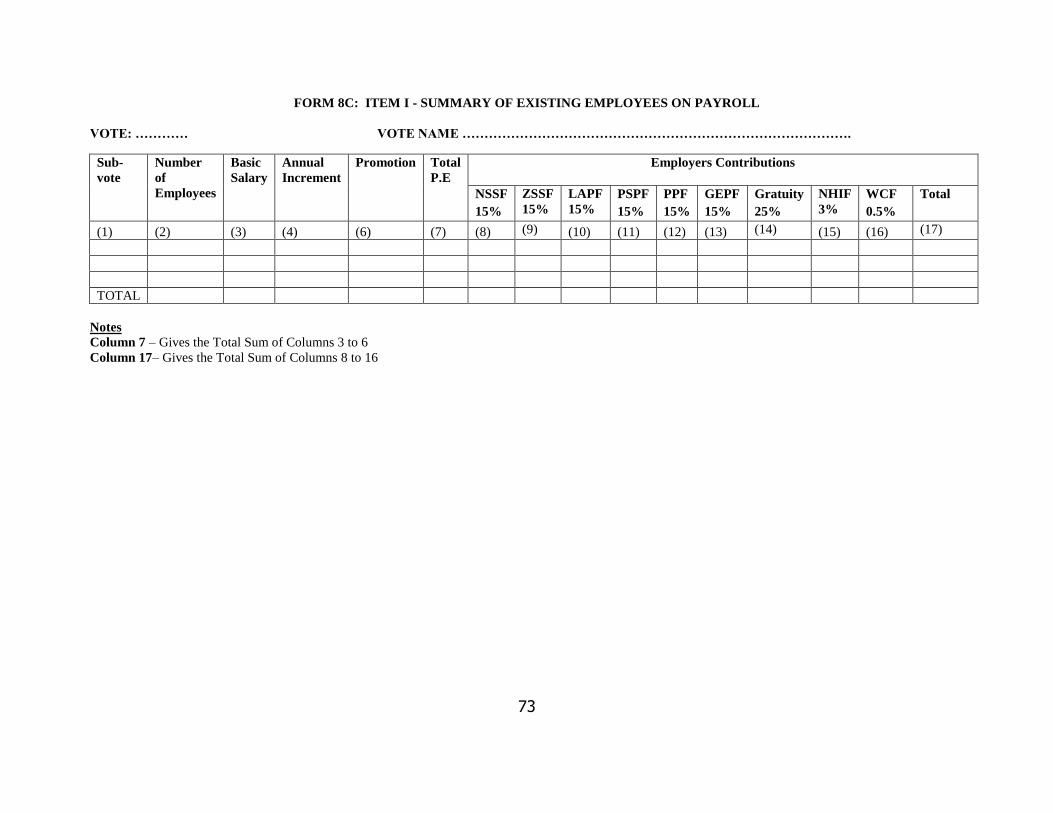
73
FORM 8C: ITEM I - SUMMARY OF EXISTING EMPLOYEES ON PAYROLL
VOTE: ………… VOTE NAME …………………………………………………………………………….
Notes
Column 7 – Gives the Total Sum of Columns 3 to 6
Column 17– Gives the Total Sum of Columns 8 to 16
Sub-
vote
Number
of
Employees
Basic
Salary
Annual
Increment
Promotion Total
P.E
Employers Contributions
NSSF
15%
ZSSF
15%
LAPF
15%
PSPF
15%
PPF
15%
GEPF
15%
Gratuity
25%
NHIF
3%
WCF
0.5%
Total
(1) (2) (3) (4) (6) (7) (8) (9) (10) (11) (12) (13) (14) (15) (16) (17)
TOTAL

74
FORM 8D: ITEM II - SUMMARY OF EXISTING EMPLOYEES NOT ON PAYROLL
VOTE: ………… VOTE NAME ……………………………………………………………………………..
Notes
Column 7 – Gives the Total Sum of Columns 3 to 6
Column 17 – Gives the Total Sum of Columns 8 to 16
Sub-
vote
Number
of
Employe
es
Basic
Salar
y
Annual
Incremen
t
Promotio
n
Tota
l P.E
Employers Contributions
NSSF
15%
ZSS
F
15%
LAP
F
15%
PSP
F
15%
PPF
15%
GEP
F
15%
Gratuit
y 25%
NHIF
3%
WCF
0.5%
Total
(1) (2) (3) (4) (6) (7) (8) (9) (10) (11) (12 ) (13) (14) (15) (16) (17)
TOTA
L
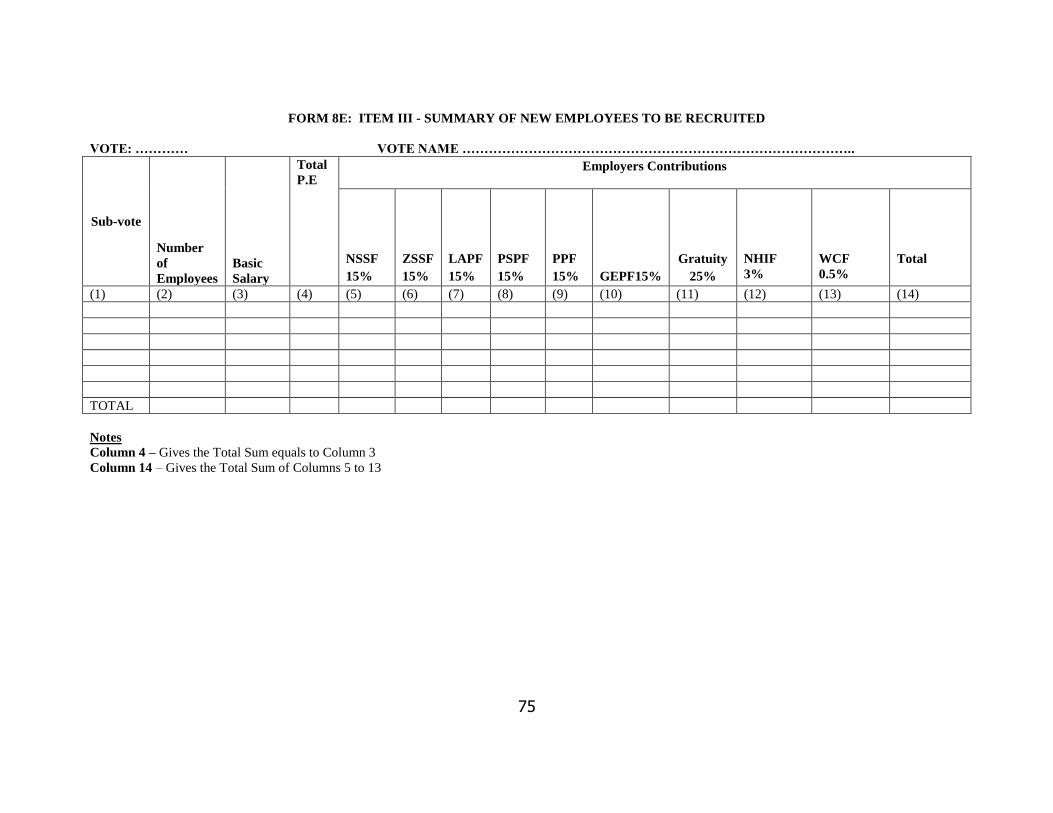
75
FORM 8E: ITEM III - SUMMARY OF NEW EMPLOYEES TO BE RECRUITED
VOTE: ………… VOTE NAME ……………………………………………………………………………..
Sub-vote
Number
of
Employees
Basic
Salary
Total
P.E Employers Contributions
NSSF
15%
ZSSF
15%
LAPF
15%
PSPF
15%
PPF
15% GEPF15%
Gratuity
25%
NHIF
3%
WCF
0.5%
Total
(1) (2) (3) (4) (5) (6) (7) (8) (9) (10) (11) (12) (13) (14)
TOTAL
Notes
Column 4 – Gives the Total Sum equals to Column 3
Column 14 – Gives the Total Sum of Columns 5 to 13

76
FORM: 8F: LIST OF EMPLOYEES EXPECTED TO RETIRE
VOTE:......................... VOTE NAME (MDA/RS/LGA/PUBLIC ENTITIES)..................................................
S/No Name of Employees Check Number Designation Salary Scale Basic Salary Retirement
Date
1
2
3
.
.
.
.

77
FORM 9: SCHEDULE OF PERSONAL EMOLUMENTS (ESTABLISHMENT AND STRENGTH)
VOTE: ………… VOTE NAME ……………………………………………………………………………..
SUB VOTE: ………… SUB VOTE NAME ……………………………………………………………………………..
Employee
Code Description
Salary
Scale
Establishment Actual
Strength
at Present
Variation
(+ Over) or
(- Under) Remarks Y0-2 Y0-1 Y0 Y0+1 Y0+2
(1) (2) (3) (4) (5) (6) (7) (8) (9) (10) (11)
Notes
YO-2 = Two previous Years (2016/17)
YO-1 = Current Financial Year (2017/18)
YO = Budget Year (2018/19)
YO+1 = Forward Budget (2019/20)
YO+2 = Forward Budget (2020/21)
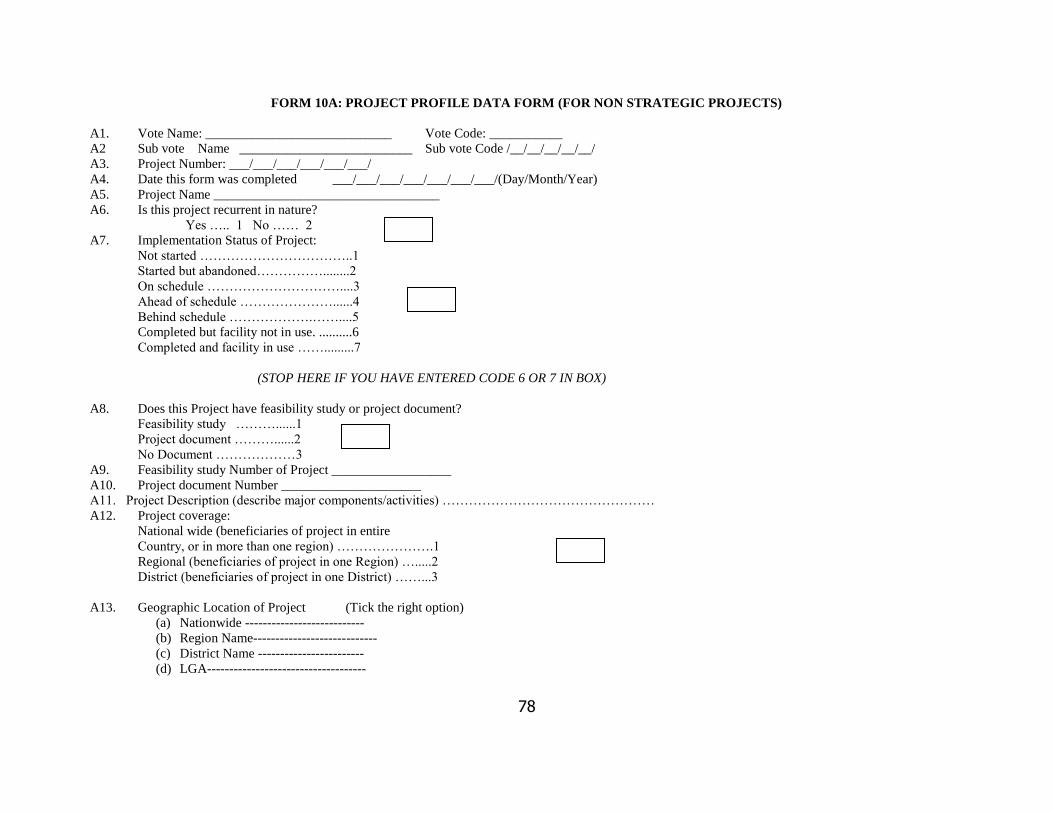
78
FORM 10A: PROJECT PROFILE DATA FORM (FOR NON STRATEGIC PROJECTS)
A1. Vote Name: ____________________________ Vote Code: ___________
A2 Sub vote Name __________________________ Sub vote Code /__/__/__/__/__/
A3. Project Number: ___/___/___/___/___/___/
A4. Date this form was completed ___/___/___/___/___/___/___/(Day/Month/Year)
A5. Project Name __________________________________
A6. Is this project recurrent in nature?
Yes ….. 1 No …… 2
A7. Implementation Status of Project:
Not started ……………………………..1
Started but abandoned……………........2
On schedule …………………………....3
Ahead of schedule …………………......4
Behind schedule ……………….……....5
Completed but facility not in use. ..........6
Completed and facility in use …….........7
(STOP HERE IF YOU HAVE ENTERED CODE 6 OR 7 IN BOX)
A8. Does this Project have feasibility study or project document?
Feasibility study ………......1
Project document ………......2
No Document ………………3
A9. Feasibility study Number of Project __________________
A10. Project document Number _____________________
A11. Project Description (describe major components/activities) …………………………………………
A12. Project coverage:
National wide (beneficiaries of project in entire
Country, or in more than one region) ………………….1
Regional (beneficiaries of project in one Region) ….....2
District (beneficiaries of project in one District) ……...3
A13. Geographic Location of Project (Tick the right option)
(a) Nationwide ---------------------------
(b) Region Name----------------------------
(c) District Name ------------------------
(d) LGA------------------------------------
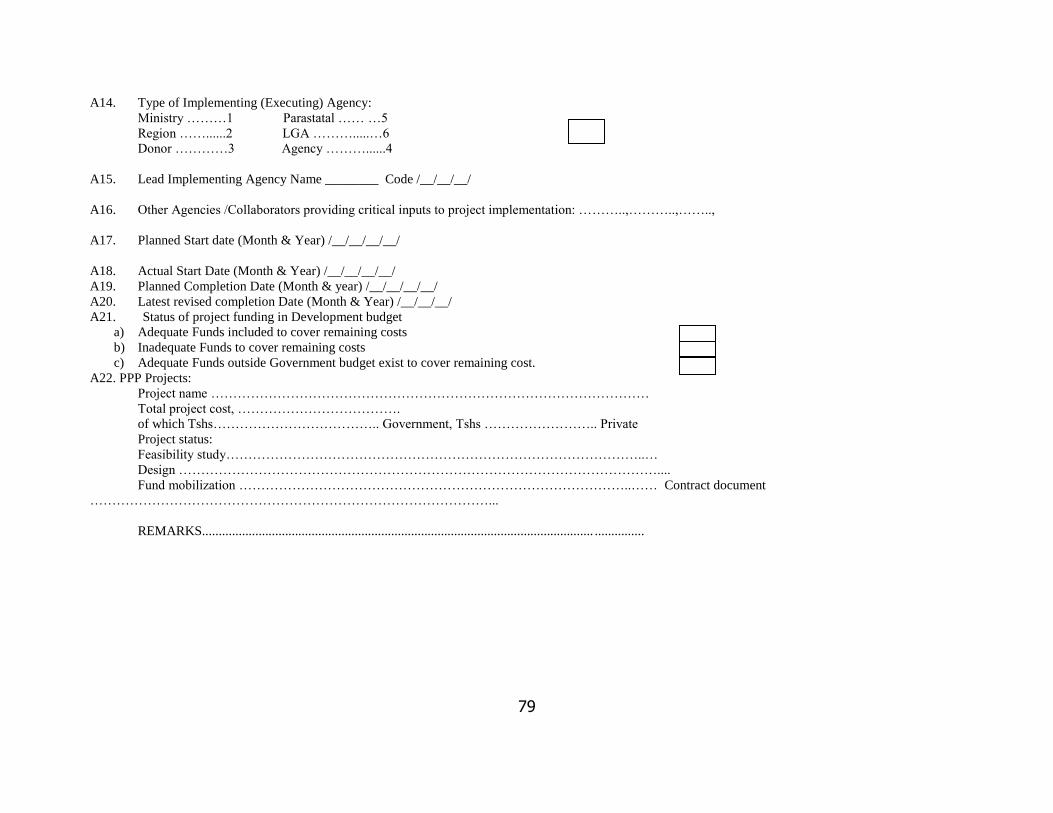
79
A14. Type of Implementing (Executing) Agency:
Ministry ………1 Parastatal …… …5
Region ……......2 LGA ……….....…6
Donor …………3 Agency ………......4
A15. Lead Implementing Agency Name ________ Code /__/__/__/
A16. Other Agencies /Collaborators providing critical inputs to project implementation: ………..,………..,……..,
A17. Planned Start date (Month & Year) /__/__/__/__/
A18. Actual Start Date (Month & Year) /__/__/__/__/
A19. Planned Completion Date (Month & year) /__/__/__/__/
A20. Latest revised completion Date (Month & Year) /__/__/__/
A21. Status of project funding in Development budget
a) Adequate Funds included to cover remaining costs
b) Inadequate Funds to cover remaining costs
c) Adequate Funds outside Government budget exist to cover remaining cost.
A22. PPP Projects:
Project name ………………………………………………………………………………………
Total project cost, ……………………………….
of which Tshs……………………………….. Government, Tshs …………………….. Private
Project status:
Feasibility study…………………………………………………………………………………..…
Design ………………………………………………………………………………………………....
Fund mobilization ……………………………………………………………………………..…… Contract document
………………………………………………………………………………...
REMARKS...................................................................................................................... ...............
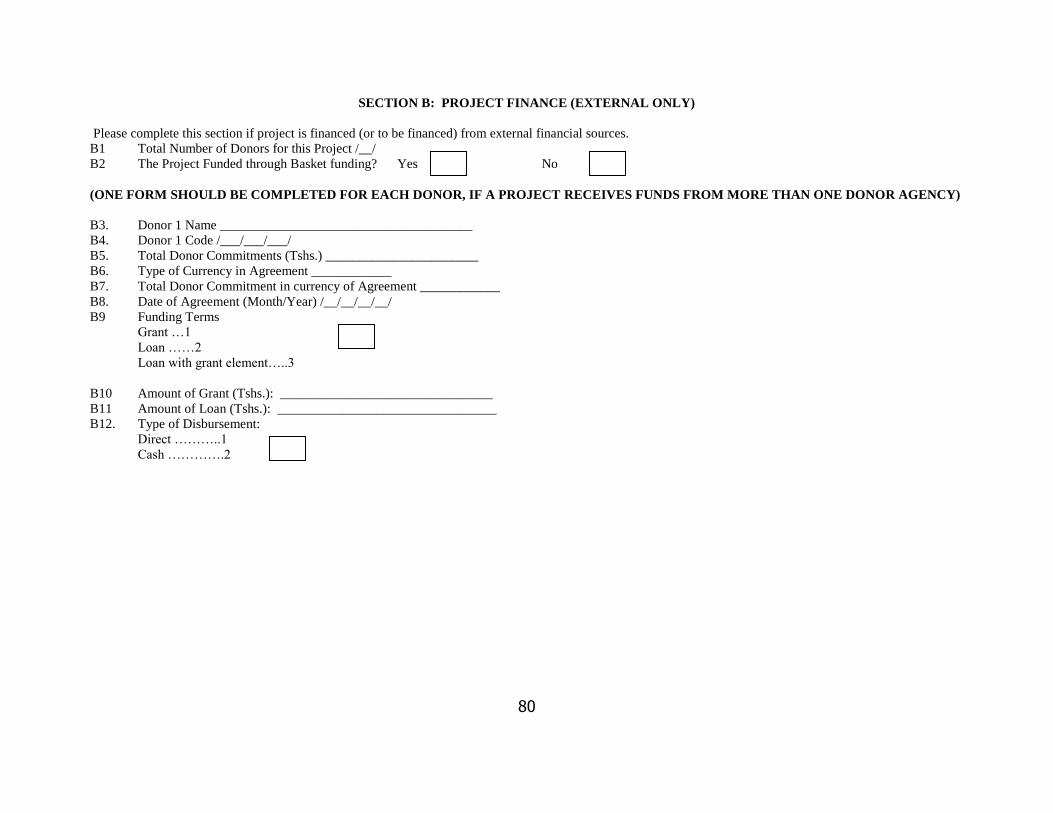
80
SECTION B: PROJECT FINANCE (EXTERNAL ONLY)
Please complete this section if project is financed (or to be financed) from external financial sources.
B1 Total Number of Donors for this Project /__/
B2 The Project Funded through Basket funding? Yes No
(ONE FORM SHOULD BE COMPLETED FOR EACH DONOR, IF A PROJECT RECEIVES FUNDS FROM MORE THAN ONE DONOR AGENCY)
B3. Donor 1 Name ______________________________________
B4. Donor 1 Code /___/___/___/
B5. Total Donor Commitments (Tshs.) _______________________
B6. Type of Currency in Agreement ____________
B7. Total Donor Commitment in currency of Agreement ____________
B8. Date of Agreement (Month/Year) /__/__/__/__/
B9 Funding Terms
Grant …1
Loan ……2
Loan with grant element…..3
B10 Amount of Grant (Tshs.): ________________________________
B11 Amount of Loan (Tshs.): _________________________________
B12. Type of Disbursement:
Direct ………..1
Cash ………….2

81
FORM 10C: SUMMARY OF PROJECT FORWARD BUDGET ESTIMATES AT VOTE LEVEL (ALL SOURCES)
VOTE: ………… VOTE NAME ……………………………………………………………………………..
DEVELOPMENT EXPENDITURE ( in ‘000’ Tshs) Approved Budget
Estimate
Yo-1
Annual Estimate
Yo
Forward Budget
Estimates
Yo+1
Forward Budget
Estimates
Yo+2
A: Government Funds: -Local
-Foreign
B: Other Sources: -Special Funds
-Own Funds
-Bank Loans
-PPP
-Others
TOTAL BUDGET ESTIMATES
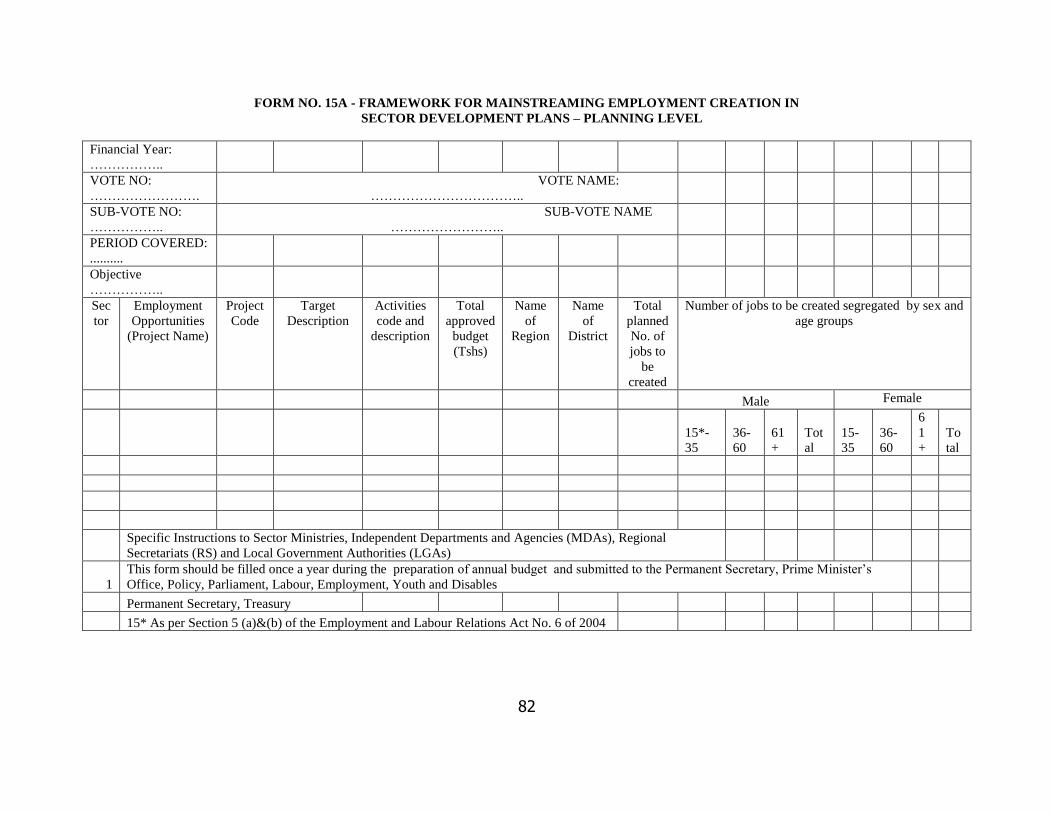
82
FORM NO. 15A - FRAMEWORK FOR MAINSTREAMING EMPLOYMENT CREATION IN
SECTOR DEVELOPMENT PLANS – PLANNING LEVEL
Financial Year:
……………..
VOTE NO:
…………………….
VOTE NAME:
……………………………..
SUB-VOTE NO:
……………..
SUB-VOTE NAME
……………………..
PERIOD COVERED:
..........
Objective
……………..
Sec
tor
Employment
Opportunities
(Project Name)
Project
Code
Target
Description
Activities
code and
description
Total
approved
budget
(Tshs)
Name
of
Region
Name
of
District
Total
planned
No. of
jobs to
be
created
Number of jobs to be created segregated by sex and
age groups
Male Female
15*-
35
36-
60
61
+
Tot
al
15-
35
36-
60
6
1
+
To
tal
Specific Instructions to Sector Ministries, Independent Departments and Agencies (MDAs), Regional
Secretariats (RS) and Local Government Authorities (LGAs)
1
This form should be filled once a year during the preparation of annual budget and submitted to the Permanent Secretary, Prime Minister’s
Office, Policy, Parliament, Labour, Employment, Youth and Disables
Permanent Secretary, Treasury
15* As per Section 5 (a)&(b) of the Employment and Labour Relations Act No. 6 of 2004
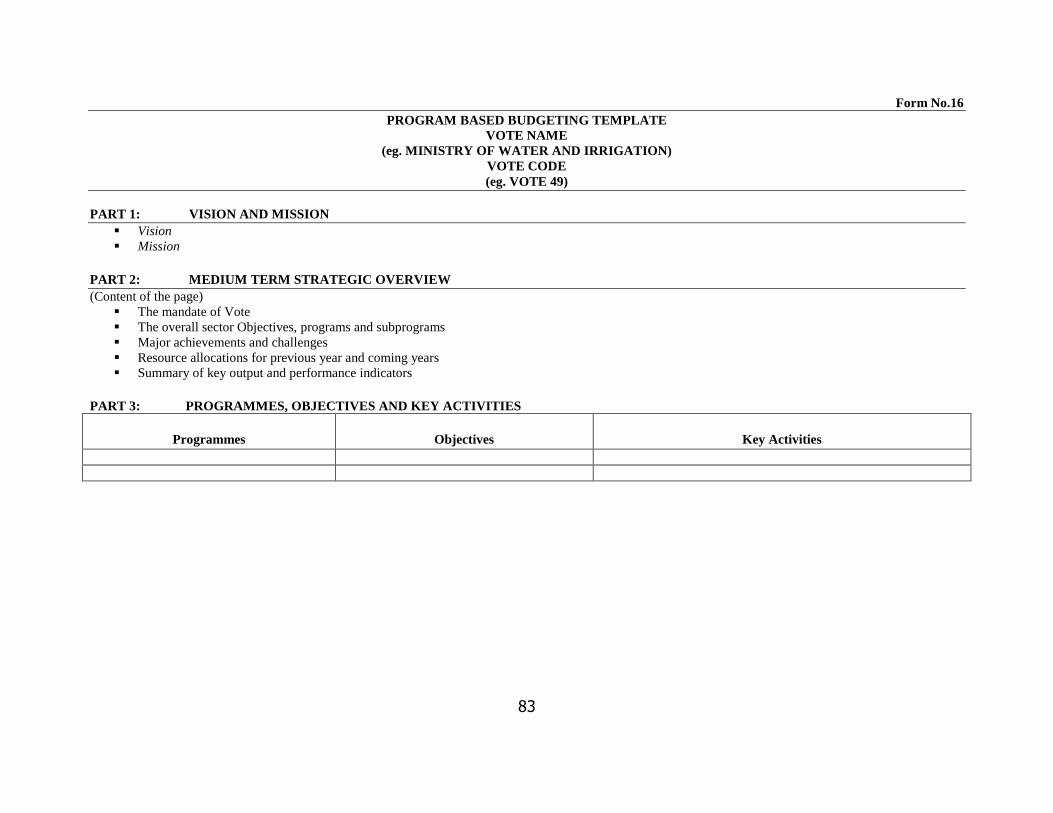
83
Form No.16
PROGRAM BASED BUDGETING TEMPLATE
VOTE NAME
(eg. MINISTRY OF WATER AND IRRIGATION)
VOTE CODE
(eg. VOTE 49)
PART 1: VISION AND MISSION
Vision
Mission
PART 2: MEDIUM TERM STRATEGIC OVERVIEW
(Content of the page)
The mandate of Vote
The overall sector Objectives, programs and subprograms
Major achievements and challenges
Resource allocations for previous year and coming years
Summary of key output and performance indicators
PART 3: PROGRAMMES, OBJECTIVES AND KEY ACTIVITIES
Programmes
Objectives
Key Activities
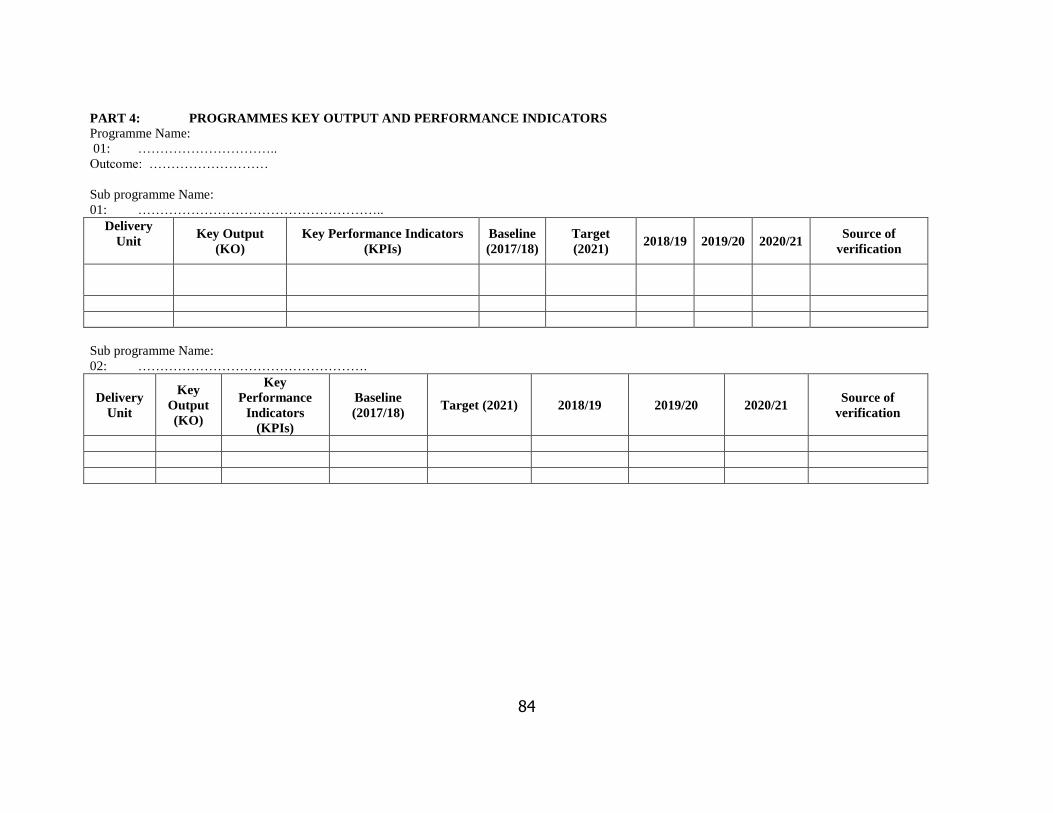
84
PART 4: PROGRAMMES KEY OUTPUT AND PERFORMANCE INDICATORS
Programme Name:
01: …………………………..
Outcome: ………………………
Sub programme Name:
01: ………………………………………………..
Delivery
Unit
Key Output
(KO)
Key Performance Indicators
(KPIs)
Baseline
(2017/18)
Target
(2021) 2018/19 2019/20 2020/21
Source of
verification
Sub programme Name:
02: …………………………………………….
Delivery
Unit
Key
Output
(KO)
Key
Performance
Indicators
(KPIs)
Baseline
(2017/18) Target (2021) 2018/19 2019/20 2020/21
Source of
verification

85
PART 5: ESTIMATES OF EXPENDITURE
5A: MEDIUM TERM ALLOCATIONS BY ECONOMIC CLASSIFICATION
Expenditure Type Sub Group 2017/18 2018/19 2019/20 2020/21
Compensation of
Employees
O/w Wages and Salaries
Employers' social contributions
Allowances
Use of goods and services
O/w Office and general supplies and services
Utilities supplies and services
Fuel, oils, lubricants
Medical supplies & services
Military supplies and services
Clothing,bedding, footwear and services
Rental expenses
Training - domestic
Training - foreign
Travel - in - country
Travel out of country
Communication & information
Educational materials, services and supplies
Hospitality supplies and services
Agricultural And Livestock Supplies &
Services
Printing, advertizing and Information
Supplies and Services
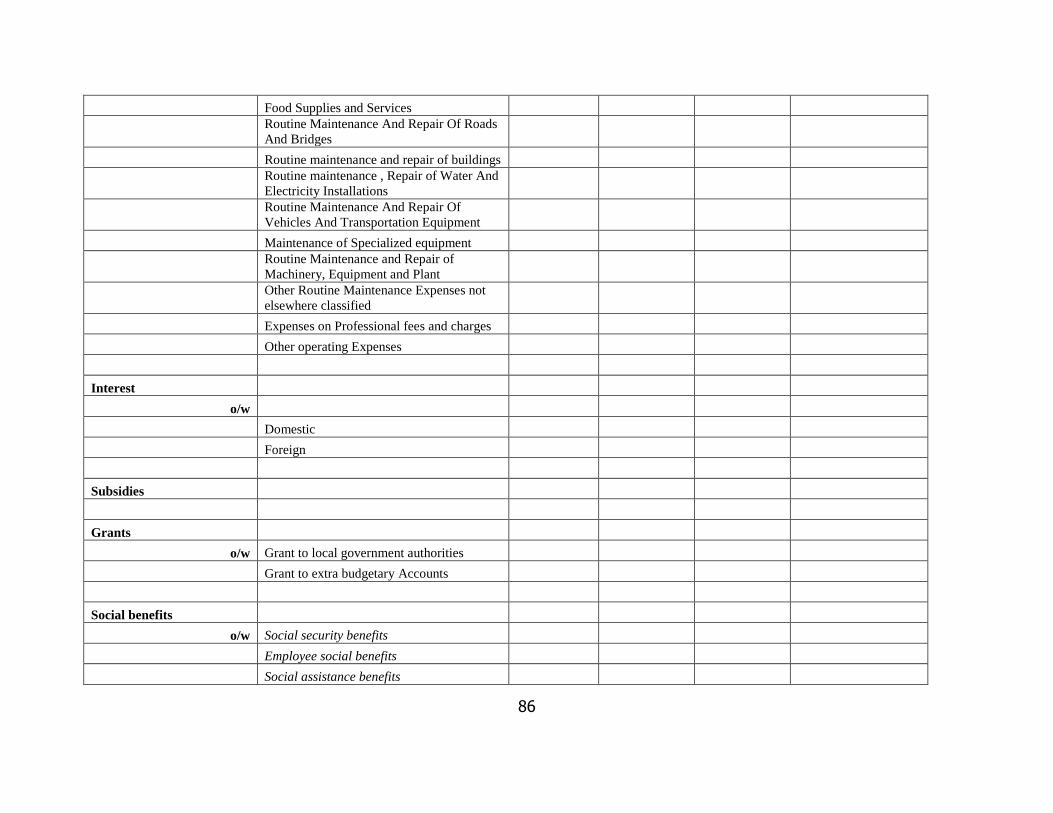
86
Food Supplies and Services
Routine Maintenance And Repair Of Roads
And Bridges
Routine maintenance and repair of buildings
Routine maintenance , Repair of Water And
Electricity Installations
Routine Maintenance And Repair Of
Vehicles And Transportation Equipment
Maintenance of Specialized equipment
Routine Maintenance and Repair of
Machinery, Equipment and Plant
Other Routine Maintenance Expenses not
elsewhere classified
Expenses on Professional fees and charges
Other operating Expenses
Interest
o/w
Domestic
Foreign
Subsidies
Grants
o/w Grant to local government authorities
Grant to extra budgetary Accounts
Social benefits
o/w Social security benefits
Employee social benefits
Social assistance benefits

87
Others expenses
o/w Transfers not elsewhere classified
Net/gross investment in
nonfinancial assets
o/w Fixed assets
Inventories
Valuables
Nonproduced assets
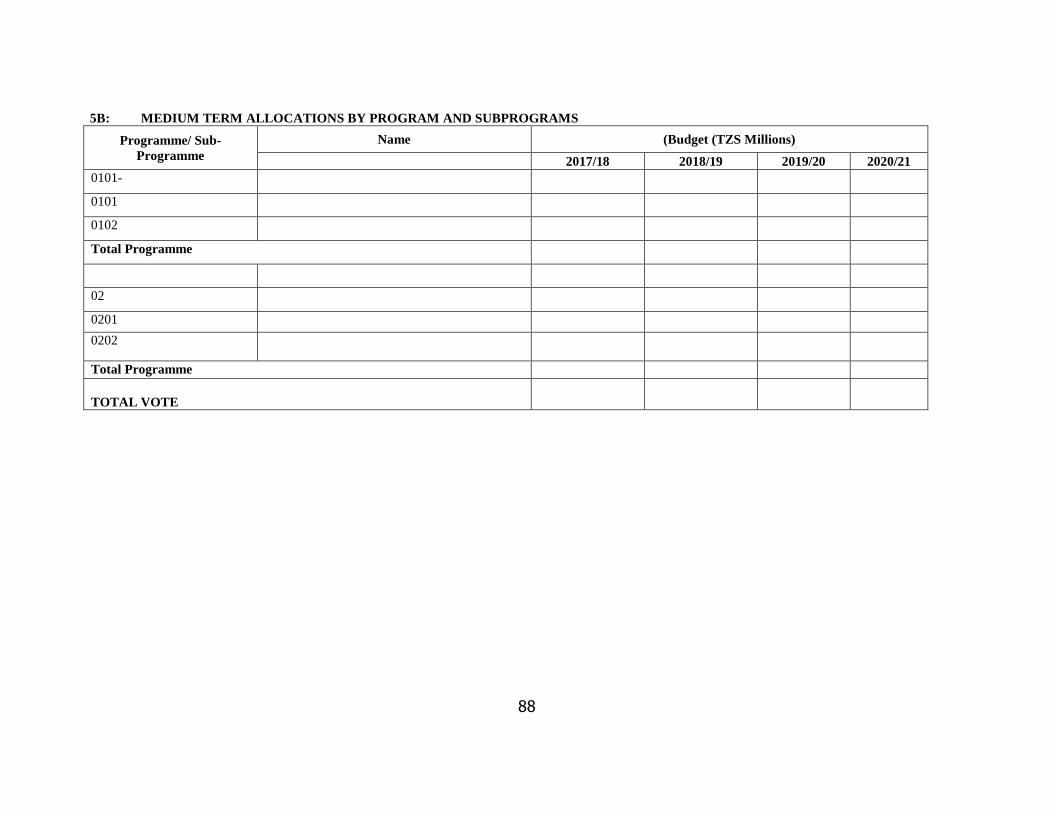
88
5B: MEDIUM TERM ALLOCATIONS BY PROGRAM AND SUBPROGRAMS
Programme/ Sub-
Programme
Name (Budget (TZS Millions)
2017/18 2018/19 2019/20 2020/21
0101-
0101
0102
Total Programme
02
0201
0202
Total Programme
TOTAL VOTE
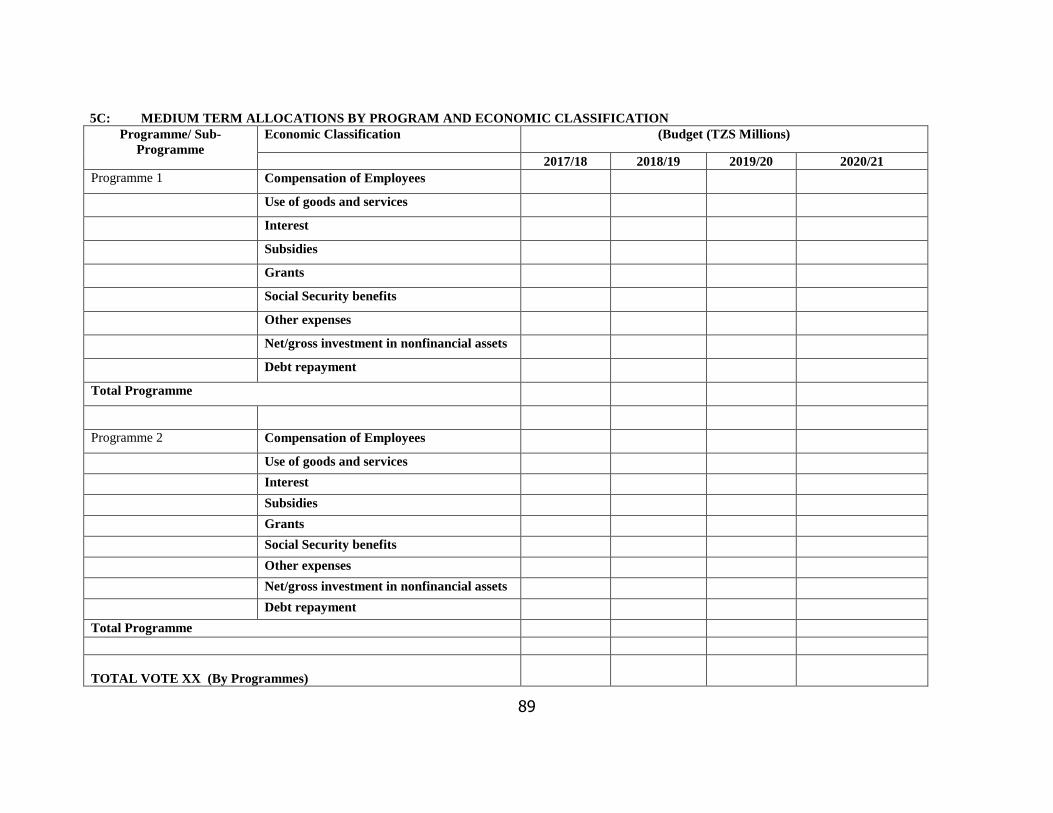
89
5C: MEDIUM TERM ALLOCATIONS BY PROGRAM AND ECONOMIC CLASSIFICATION
Programme/ Sub-
Programme
Economic Classification (Budget (TZS Millions)
2017/18 2018/19 2019/20 2020/21
Programme 1 Compensation of Employees
Use of goods and services
Interest
Subsidies
Grants
Social Security benefits
Other expenses
Net/gross investment in nonfinancial assets
Debt repayment
Total Programme
Programme 2 Compensation of Employees
Use of goods and services
Interest
Subsidies
Grants
Social Security benefits
Other expenses
Net/gross investment in nonfinancial assets
Debt repayment
Total Programme
TOTAL VOTE XX (By Programmes)
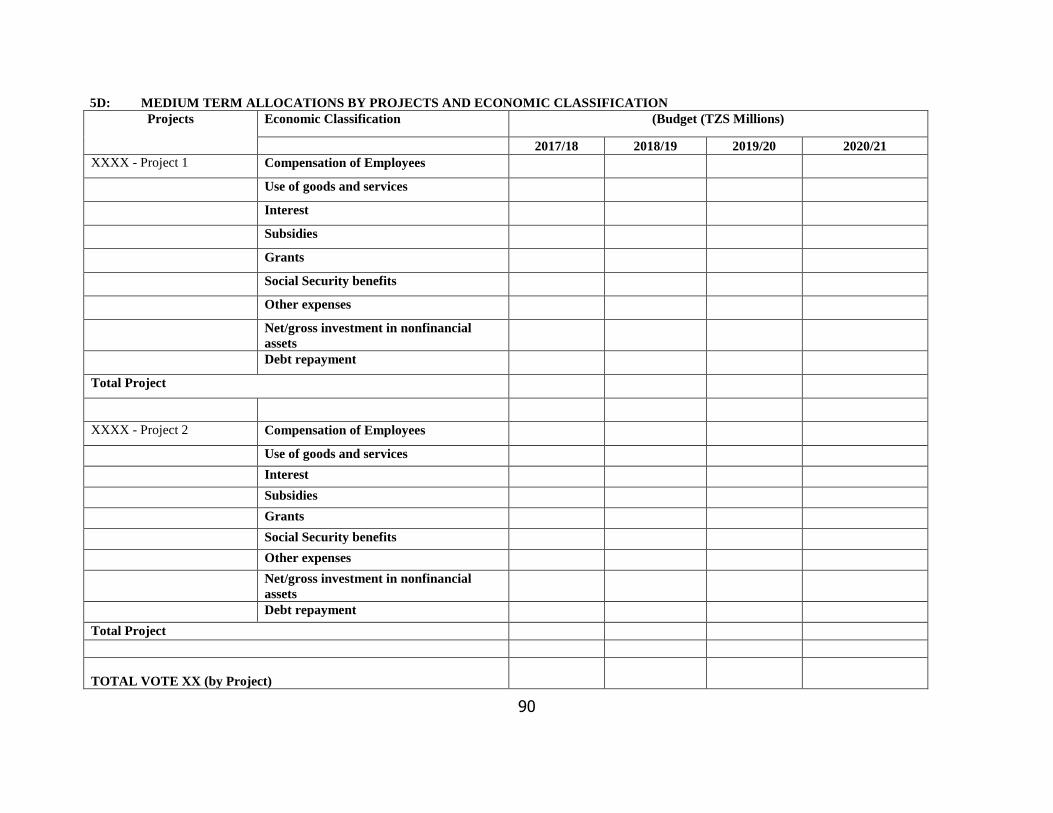
90
5D: MEDIUM TERM ALLOCATIONS BY PROJECTS AND ECONOMIC CLASSIFICATION
Projects Economic Classification (Budget (TZS Millions)
2017/18 2018/19 2019/20 2020/21
XXXX - Project 1 Compensation of Employees
Use of goods and services
Interest
Subsidies
Grants
Social Security benefits
Other expenses
Net/gross investment in nonfinancial
assets
Debt repayment
Total Project
XXXX - Project 2 Compensation of Employees
Use of goods and services
Interest
Subsidies
Grants
Social Security benefits
Other expenses
Net/gross investment in nonfinancial
assets
Debt repayment
Total Project
TOTAL VOTE XX (by Project)
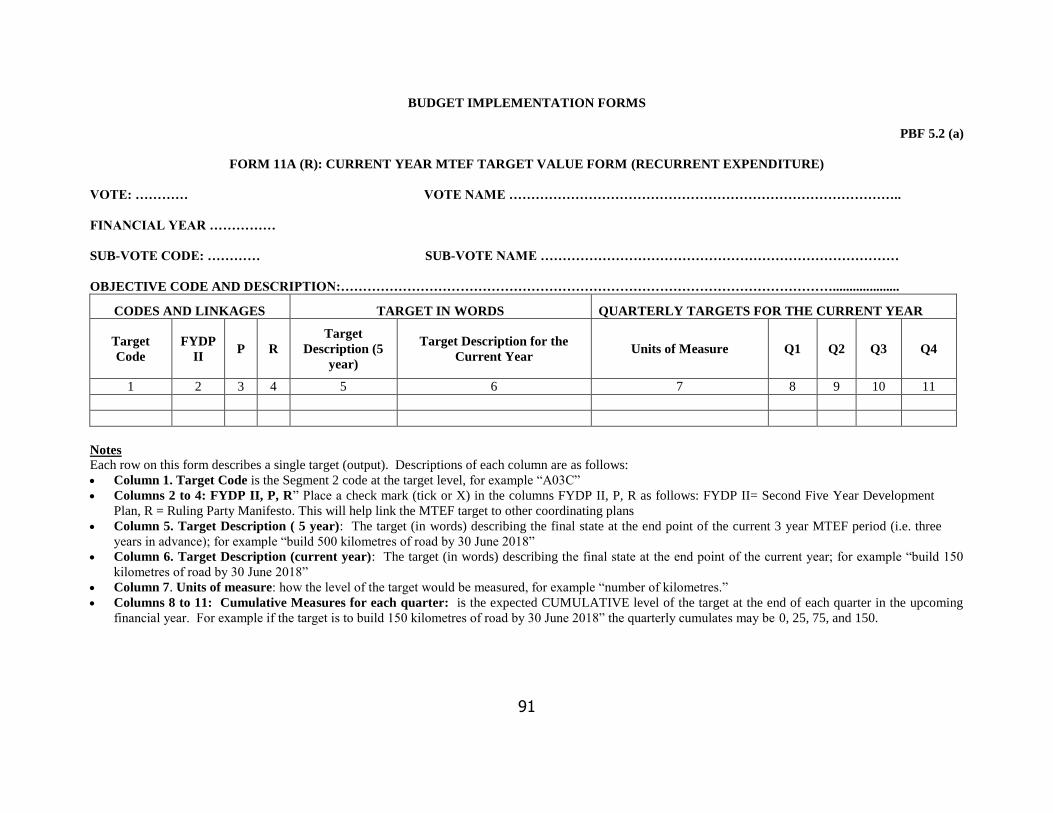
91
BUDGET IMPLEMENTATION FORMS
PBF 5.2 (a)
FORM 11A (R): CURRENT YEAR MTEF TARGET VALUE FORM (RECURRENT EXPENDITURE)
VOTE: ………… VOTE NAME ……………………………………………………………………………..
FINANCIAL YEAR ……………
SUB-VOTE CODE: ………… SUB-VOTE NAME ………………………………………………………………………
OBJECTIVE CODE AND DESCRIPTION:…………………………………………………………………………………………………....................
CODES AND LINKAGES TARGET IN WORDS QUARTERLY TARGETS FOR THE CURRENT YEAR
Target
Code
FYDP
II P R
Target
Description (5
year)
Target Description for the
Current Year Units of Measure Q1 Q2 Q3 Q4
1 2 3 4 5 6 7 8 9 10 11
Notes
Each row on this form describes a single target (output). Descriptions of each column are as follows:
Column 1. Target Code is the Segment 2 code at the target level, for example “A03C”
Columns 2 to 4: FYDP II, P, R” Place a check mark (tick or X) in the columns FYDP II, P, R as follows: FYDP II= Second Five Year Development
Plan, R = Ruling Party Manifesto. This will help link the MTEF target to other coordinating plans
Column 5. Target Description ( 5 year): The target (in words) describing the final state at the end point of the current 3 year MTEF period (i.e. three
years in advance); for example “build 500 kilometres of road by 30 June 2018”
Column 6. Target Description (current year): The target (in words) describing the final state at the end point of the current year; for example “build 150
kilometres of road by 30 June 2018”
Column 7. Units of measure: how the level of the target would be measured, for example “number of kilometres.”
Columns 8 to 11: Cumulative Measures for each quarter: is the expected CUMULATIVE level of the target at the end of each quarter in the upcoming
financial year. For example if the target is to build 150 kilometres of road by 30 June 2018” the quarterly cumulates may be 0, 25, 75, and 150.

92
PBF 5.2 (b)
FORM 11A (D) CURRENT YEAR MTEF TARGET VALUE FORM (DEVELOPMENT EXPENDITURE)
VOTE: ………… VOTE NAME ……………………………………………………………………………..
FINANCIAL YEAR ……………
PROJECT CODE AND NAME: ……………………….
SUB-VOTE CODE AND NAME: ……………………..
OBJECTIVE CODE AND DESCRIPTION: …………..
CODES AND LINKAGES TARGET IN WORDS
QUARTERLY TARGETS FOR THE CURRENT
YEAR
Target
Code FYDP R
Target Description (5
year)
Target Description for the
Current Year Units of Measure Q1 Q2 Q3 Q4
1 2 4 5 6 7 8 9 10 11
Notes
Each row on this form describes a single target (output). Descriptions of each column are as follows:
Column 1. Target Code is the Segment 2 code at the target level, for example “A03C”
Columns 2 to 4: FYDP, P, R” Place a check mark (tick or X) in the columns FYDP, P, R as follows: FYDP= Five Year Development Plan, (); R = Ruling
Party Manifesto. This will help link the MTEF target to other coordinating plans
Column 5. Target Description ( 5 year): The target (in words) describing the final state at the end point of the current 3 year MTEF period (i.e. three years in
advance); for example “build 500 kilometres of road by 30 June 2018”
Column 6. Target Description (current year): The target (in words) describing the final state at the end point of the current year; for example “build 150
kilometres of road by 30 June 2018”
Column 7. Units of measure: how the level of the target would be measured, for example “number of kilometres.”
Columns 8 to 11: Cumulative Measures for each quarter: is the expected CUMULATIVE level of the target at the end of each quarter in the upcoming
financial year. For example if the target is to build 150 kilometres of road by 30 June 2018” the quarterly cumulates may be 0, 25, 75, and 150.
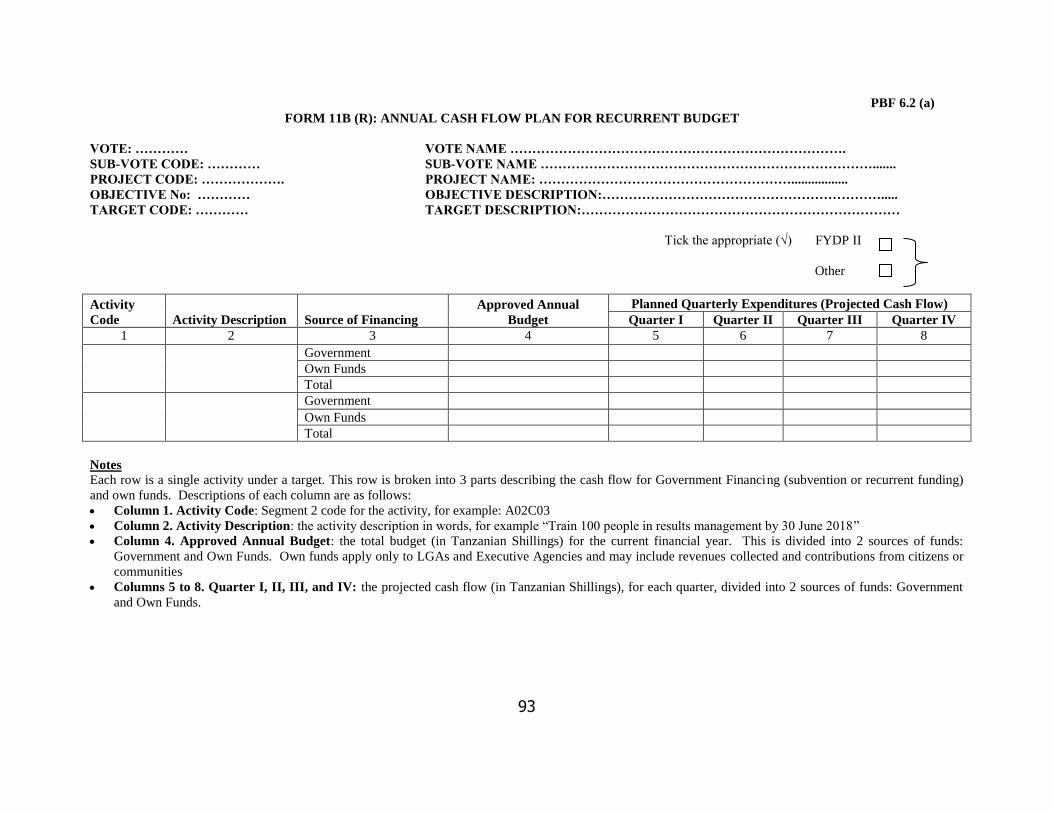
93
PBF 6.2 (a)
FORM 11B (R): ANNUAL CASH FLOW PLAN FOR RECURRENT BUDGET
VOTE: ………… VOTE NAME ………………………………………………………………….
SUB-VOTE CODE: ………… SUB-VOTE NAME ………………………………………………………………….......
PROJECT CODE: ………………. PROJECT NAME: ………………………………………………….................
OBJECTIVE No: ………… OBJECTIVE DESCRIPTION:……………………………………………………….....
TARGET CODE: ………… TARGET DESCRIPTION:………………………………………………………………
Tick the appropriate (√) FYDP II
Other
Activity
Code Activity Description Source of Financing
Approved Annual
Budget
Planned Quarterly Expenditures (Projected Cash Flow)
Quarter I Quarter II Quarter III Quarter IV
1 2 3 4 5 6 7 8
Government
Own Funds
Total
Government
Own Funds
Total
Notes
Each row is a single activity under a target. This row is broken into 3 parts describing the cash flow for Government Financing (subvention or recurrent funding)
and own funds. Descriptions of each column are as follows:
Column 1. Activity Code: Segment 2 code for the activity, for example: A02C03
Column 2. Activity Description: the activity description in words, for example “Train 100 people in results management by 30 June 2018”
Column 4. Approved Annual Budget: the total budget (in Tanzanian Shillings) for the current financial year. This is divided into 2 sources of funds:
Government and Own Funds. Own funds apply only to LGAs and Executive Agencies and may include revenues collected and contributions from citizens or
communities
Columns 5 to 8. Quarter I, II, III, and IV: the projected cash flow (in Tanzanian Shillings), for each quarter, divided into 2 sources of funds: Government
and Own Funds.

94
PBF 6.2 (b)
FORM 11B (D): ANNUAL CASH FLOW PLAN FOR DEVELOPMENT BUDGET
VOTE: ………… VOTE NAME ………………………………………………………………
SUB-VOTE CODE: ………… SUB-VOTE NAME ………………………………………………………………….
PROJECT CODE: ………………. PROJECT NAME: …………………………………………………...........
OBJECTIVE No: ………… OBJECTIVE DESCRIPTION:………………………………………………………
TARGET CODE: ………… TARGET DESCRIPTION:……………………………………………………………
Tick the appropriate (√)
FYDP II
Other
Activity
Code
Activity
Description
Source of
Financing
Approved
Annual
Budget
Amount to be Spent in
Foreign Currency ($,£,€,¥)
Planned Quarterly Expenditures (Projected Cash Flow)
Quarter I Quarter II Quarter III Quarter IV
1 2 3 4 5 6 7 8 9
Local
Foreign
Own Source
PPP
Total
Local
Foreign
Own Source
PPP
Total
Notes
Each row is a single activity under a target. This row is broken into 3 parts describing the cash flow for Government Financing (subvention or recurrent
funding) and own funds. Descriptions of each column are as follows:
Column 1. Activity Code: Segment 2 code for the activity, for example: A02C03
Column 2. Activity Description: the activity description in words, for example “ To construct 30 classrooms by June 2019”
Column 4. Approved Annual Budget: the total budget (in Tanzanian Shillings) for the current financial year. This is divided into 2 sources of funds:
Government and Own Funds. Own funds apply only to LGAs and Executive Agencies and may include revenues collected and contributions from citizens or
communities.
Column 5. Amount of Total Budget to be spent in foreign currency ($,£,€,¥): This wll include spending in activities that will require forex
Columns 6 to 9. Quarter I, II, III, and IV: the projected cash flow (in Tanzanian Shillings), for each quarter, divided into 2 sources of funds:
Government and Own Funds.
PPP=Government contribution to Public Private Partnership Project Financing

95
PBF 6.3(a)
FORM 14B (R): ANNUAL ACTION PLAN FOR RECURRENT BUDGET FOR THE FY ………. …..
VOTE NO: ……………………. VOTE NAME: ……………………………..
SUB-VOTE CODE: …………….. SUB-VOTE NAME: ……………………....
Objective
Code and
Description
Target Code
and
Description PA
F
FY
DP
II
Ma
nif
esto
Activity
Code and
Description
Main
Tasks
(activity
phases)
Sub – Tasks
(Milestone)
Pla
nn
ed S
tart
Da
te
Pla
nn
ed F
inis
h
Da
te
Ap
pro
ved
Bu
dg
et
Wo
rk D
ay
s
Lead Agency
Responsible
Person
(Officer)
1 2 3 4 5 6 7 8 9 10 11 12 13 14
Notes
Each row of this form describes a single activity. The form should only be used internally.
Column 1: the Objective Code (A, B, C, etc) as well as the objective’s description, for example: “A. Improve Access to markets.” Part of the Segment 2 code.
Column 2: the Target Code (A01C or B02S etc) as well its description, for example: “ To train 10 staff in MTEF preparation by June 2019
Columns 3 to 5: place a check mark (√) to link your target as appropriate with those planning frameworks as described in other forms above.
Column 6: the Activity Code (A01C03 or B02S01 etc) as well as the activity’s description, for example: “A01D05. Train 100 people in Results Management
by June 2018.” Part of the Segment 2 code.
Column 7: list main tasks or phases which enable respective activity to be completed when such tasks are implemented.
Column 8: list sub tasks or milestone which enable respective task to be completed when such milestones are implemented.
Column 9: the date at which the activity should start. The start of an activity should include its procurement, where applicable.
Column 10: the date at which the activity should be completed.
Column 11: the approved budget of the target or activity. The target’s budget is the sum of the budgets for all activities under it
Column 12: the expected workdays on the activity. Some activities may have long durations in which implementation is sporadic. For example an activity
“supervision of procurement” may take place over a 3 month period, but may only involve 2 workdays per month.
Column 13: the institution or agency responsible (accountable) for the execution of the activity. This should be shown as a institution, such as “TRA, UDOM,
COSTECH, TMMA, etc.”
Column 14: the person responsible (accountable) for the completion of the activity. This should be listed as a position, such as “Commissioner for Budget,
DPP, DHRM, etc.”

96
PBF 6.3(b)
FORM 14B (D): ANNUAL ACTION PLAN FOR THE DEVELOPMENT BUDGET FOR THE FY ………. ……..
VOTE NO: ……………………. VOTE NAME: ……………………………..
SUB-VOTE NO: …………….. SUB-VOTE NAME: ……………………...
PROJECT CODE ……………. PROJECT NAME ……………...................
Objective
Code and
Description
Target Code
and
Description PA
F
FY
DP
II
Ma
nif
esto
Activity
Code and
Description
Main
Tasks
(activity
phases)
Sub – Tasks
(Milestone)
Pla
nn
ed S
tart
Da
te
Pla
nn
ed F
inis
h
Da
te
Ap
pro
ved
Bu
dg
et
Wo
rk D
ay
s
Lead Agency
Responsible
Person
(Officer)
1 2 3 4 5 6 7 8 9 10 11 12 13 14
Notes
Each row of this form describes a single activity. The form should only be used internally.
Column 1: the Objective Code (A, B, C, etc) as well as the objective’s description, for example: “A. Improve Access to markets.” Part of the Segment 2 code.
Column 2: the Target Code (A01C or B02S etc) as well its description, for example: “A01D. Construct 25 Kilometres of road by June 2018.”
Columns 3 to 5: place a check mark (√) to link your target as appropriate with those planning frameworks as described in other forms above.
Column 6: the Activity Code (A01C03 or B02S01 etc) as well as the activity’s description, for example: “ To construct 30 classrooms by June 2019”Column
7: List main tasks or phases which enable respective activity to be completed when such tasks are implemented.
Column 8: List sub tasks or milestone which enable respective task to be completed when such milestones are implemented.
Column 9: The date at which the activity should start. The start of an activity should include its procurement, where applicable.
Column 10: The date at which the activity should be completed.
Column 11: The approved budget of the target or activity. The target’s budget is the sum of the budgets for all activities under it
Column 12: The expected work days on the activity. Some activities may have long durations in which implementation is sporadic. For example an activity
“supervision of procurement” may take place over a 3 month period, but may only involve 2 work days per month.
Column 13: The institution or agency responsible (accountable) for the execution of the activity. This should be shown as an institution, such as “TRA,
UDOM, etc.”
Column 14: The person responsible (accountable) for the completion of the activity. This should be listed as a position, such as “Commissioner for Budget,
DPP, DHRM, etc.”
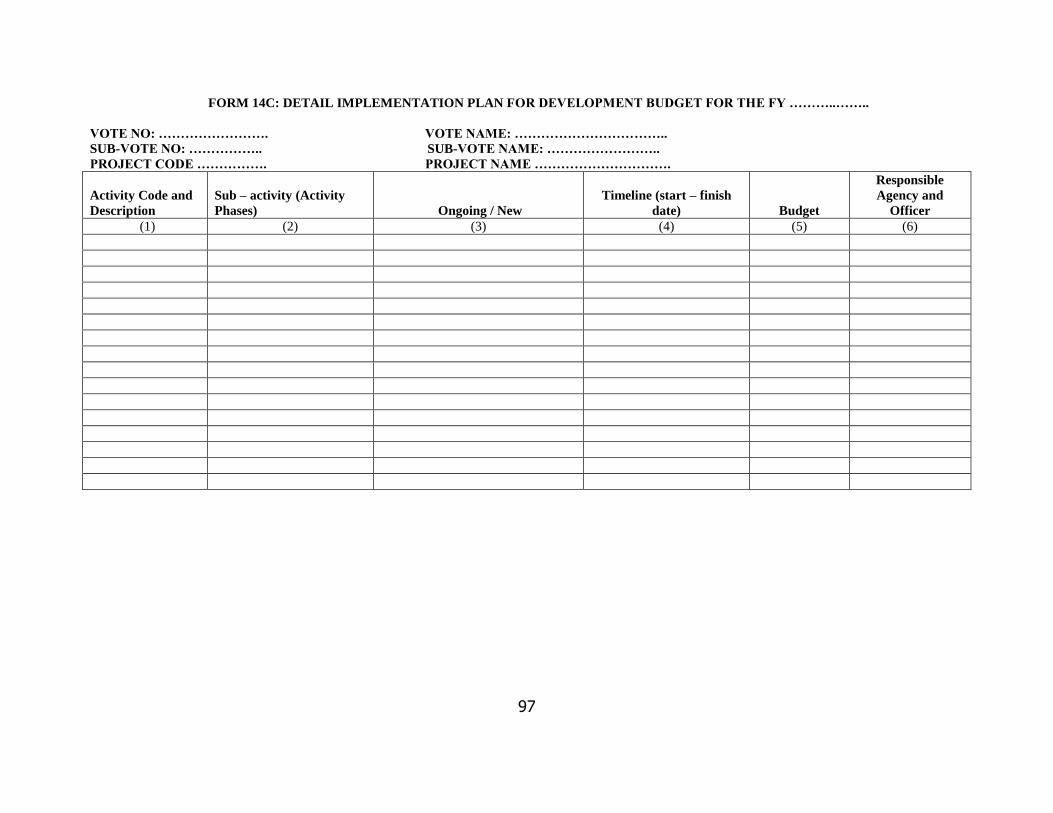
97
FORM 14C: DETAIL IMPLEMENTATION PLAN FOR DEVELOPMENT BUDGET FOR THE FY ………..……..
VOTE NO: ……………………. VOTE NAME: ……………………………..
SUB-VOTE NO: …………….. SUB-VOTE NAME: ……………………..
PROJECT CODE ……………. PROJECT NAME ………………………….
Activity Code and
Description
Sub – activity (Activity
Phases) Ongoing / New
Timeline (start – finish
date) Budget
Responsible
Agency and
Officer
(1) (2) (3) (4) (5) (6)

98
MEF 7
PERFORMANCE REPORTING FORMS
FORM 10B: FYDP II PROJECT IMPLEMENTATION - QUARTERLY PERFORMANCE ASSESSMENT FORM FOR FISCAL YEAR………………
(THIS FORM SHOULD BE FILLED ONLY FOR PROJECTS UNDER STRATEGIC INVESTMENT)
1. EXPLANATIONS AND DEFINITIONS FOR THE TERMS USED FOR QUARTERLY PERFORMANCE ASSESSMENT FORM
TERM EXPLANATION/DEFINITION
Project/Activity Name: The exact name of the assessed Project/Activity/Name as listed under investments it is associated with.
Responsible Ministry Ministry under which Project/Activity is implemented
Lead implementer Institution responsible for day to day management of the Project/Activity
Contact Person(s): Name (if possible), designation and phone as well as well as e-mail contacts for the person(s) who will be responsible for
providing the required information, so that this person can be contacted for clarification if needed.
Project /Activity Location Physical address of the Project/Activity
Annual Target(s) for
2017/18:
Stage(s)/steps of the project/activities expected to be completed/reached by end of FY 2017/18
Target(s) for Each Quarter:
Stage(s)/steps of the project/activity expected to be completed/reached by end of each quarter in FY 2017/18
Achievements for Stage(s)/steps of the project/activity actually completed/reached by end of each Quarter in FY 2017/18
Constraints: Any current or anticipated obstacle that is hindering or has potential to hinder the project/activity reaching its fruitful
completion in the allocated time
Remarks:
Proposals on how the identified constraints can be addressed
Any information deemed pertinent for the successful implementation and completion of the Project/Activity
Target(s) for next/ following
Quarter :
Stage(s)/Steps of the project/activities expected to be completed /reached by end of next quarter
Annual Budget 2017/18 Total Planned expenditure on the Project/Activity for FY 2017/18 as well as a breakdown of expected source of funds to be
used
Expenditure Approved for
specific quarter
Total Planned expenditure on the Project/Activity for the specific quarter of FY 2017/18 as well as a breakdown of expected
source of funds to be used for the quarter
Funds Released for Q Actual funds allocated to the Project/Activity for that Quarter and break down of the sources of the released funds.
Cumulative Expenditure Total expenditure on the project/activity for up to that Q of FY and a breakdown of where the funds used were sourced.
Percent (Expenditure vs.
Budget)
Proportion of planned total fund spent on the project/activity up to that Quarter with breakdown according to source of funds.
Constraints Current or potential financial constraint facing the project/activity

99
TERM EXPLANATION/DEFINITION
Remarks Proposals on how the identified financial constraints can be addressed
Any financial information deemed pertinent for the successful implementation and completion of the project/activity
GOT Funds from the Government of Tanzania
PPP Funds obtained from Public Private Partnerships
DPs Funds from Development Partners
Others Funds from sources other than the ones listed
2. BASIC PROJECT/ACTIVITY INFORMATION
Project/Activity/Name; …...…………………………………………….…………….……..………………
Responsible Ministry:……………………………...…………………………………………….…….………
Leading Implementer:………………………………………………………………………………………….
Contact Person(s):
Designation:………………………………..……………….……………………..
Phone:………………………………………………..………...…………………..
E-mail:……………………………………………………...……………..……..…
3. IMPLEMENTATION ASSESMENT
TABLE A: ACTIVITY ASSESSMENT
Project Location
Annual Target(s) for 2017/18
Target(s) for Q
Achievements for Q
Constraints
Remarks
Target(s) for next Q
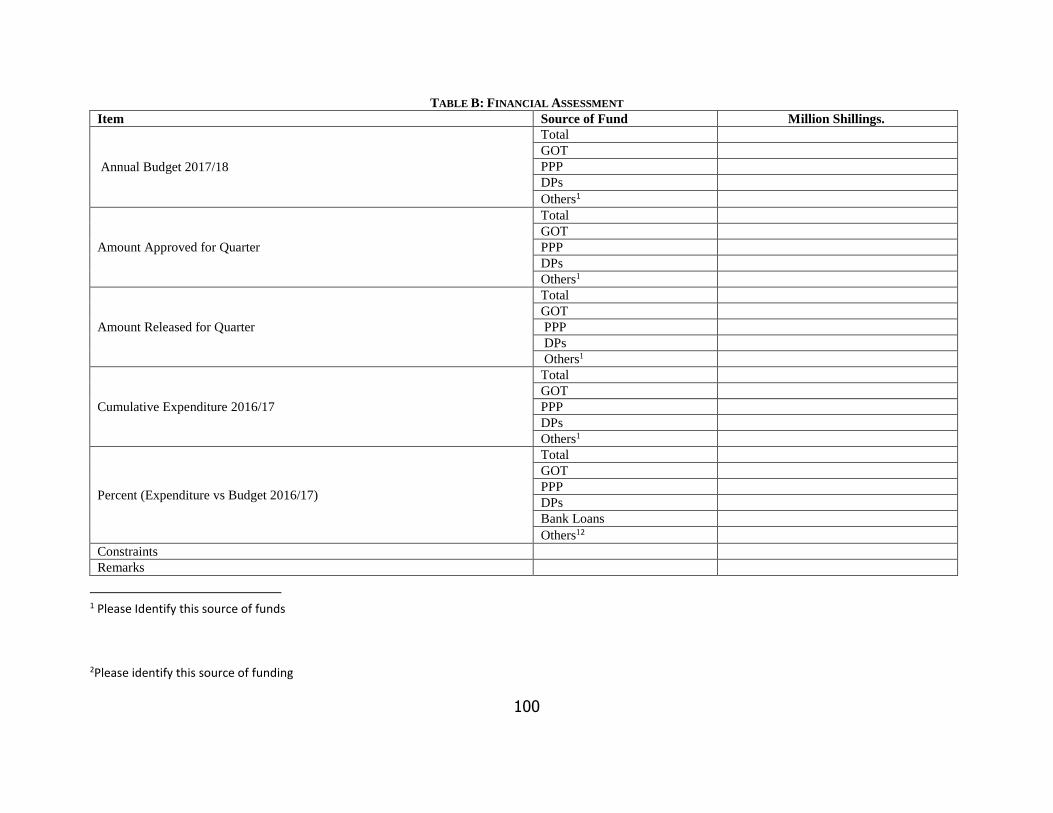
100
TABLE B: FINANCIAL ASSESSMENT
Item Source of Fund Million Shillings.
Annual Budget 2017/18
Total
GOT
PPP
DPs
Others1
Amount Approved for Quarter
Total
GOT
PPP
DPs
Others1
Amount Released for Quarter
Total
GOT
PPP
DPs
Others1
Cumulative Expenditure 2016/17
Total
GOT
PPP
DPs
Others1
Percent (Expenditure vs Budget 2016/17)
Total
GOT
PPP
DPs
Bank Loans
Others12
Constraints
Remarks
1 Please Identify this source of funds
2Please identify this source of funding

101
FORM 12A: CUMULATIVE QUARTERLY MTEF TARGET MONITORING FORM
VOTE: ………… VOTE NAME ……………………………………………………………………………..
PERIOD COVERED: QUARTER ENDING ……………………………... IN THE FINANCIAL YEAR …………………………
BUDGET COVERAGE: (DEVELOPMENT OR RECURRENT)………………………………………………………..……………
PROJECT CODE AND NAME: ……………………………………………………………………………………………..…..........
SUB-VOTE CODE AND NAME:…………………………………………………………………………………………..…........
OBJECTIVE CODE AND NAME: ……………………………………………………………………………..………………....
Notes: Each row is a single target. Descriptions of each column are as follows:
Column 1. Target Code is the Segment 2 code at the target level, for example “A03C”
Column 2 to 4: FYDP, P, R” Place a check mark (tick or X) in the columns FYDP, P, R as follows: FYDP= Five Year Development Plan, P = PAF Matrix (if it is
a PAF target); R = Ruling Party Manifesto. This will help link the MTEF target to other coordinating plans
Column 5. Annual Physical Target Description (current year): The target (in words) describing the final state at the end point of the current year; for example
“build 150 kilometres of road by 30 June 2017”
Column 6: this is the cumulative total as of the current quarter, for example “60 kilometres were constructed by 31st March 2018.”
Column 7: Estimated % complete: if the target is quantitative divide the Actual Value by the Planned Value, for example 60 kms built / 150 km planned = 40%
Columns 8-10 (Assessment): Check or tick one of the columns “on track,” “at risk” or ‘unknown”
Columns 11-12: Cumulative Actual Expenditure as of Quarter XXX: this is the actual expenditure (not the disbursed or the released amount) while the
Cumulative Budget is the amount that was expected to be spent (according to the cash flow plan) by quarter XXX;.
Column 14: % spent: the actual expenditure to date divided by the budgeted expenditure for the financial year.
CODES AND LINKAGES
ANNUAL
PHYSICAL
TARGET
CUMULATIVE STATUS ON MEETING
THE PHYSICAL TARGET EXPENDITURE STATUS REMARK
S ON
IMPLEME
NTATION
Target
Code
FYDP
II
P R Target Description Actual
Progress
Estimated
%
Completed
On
tra
ck
At
Ris
k
Off
tra
ck
Cumulative
Budget
Cumulative
Actual
Expenditure
%
Spent
1 2 3 4 5 6 7 8 9 10 11 12 13 14
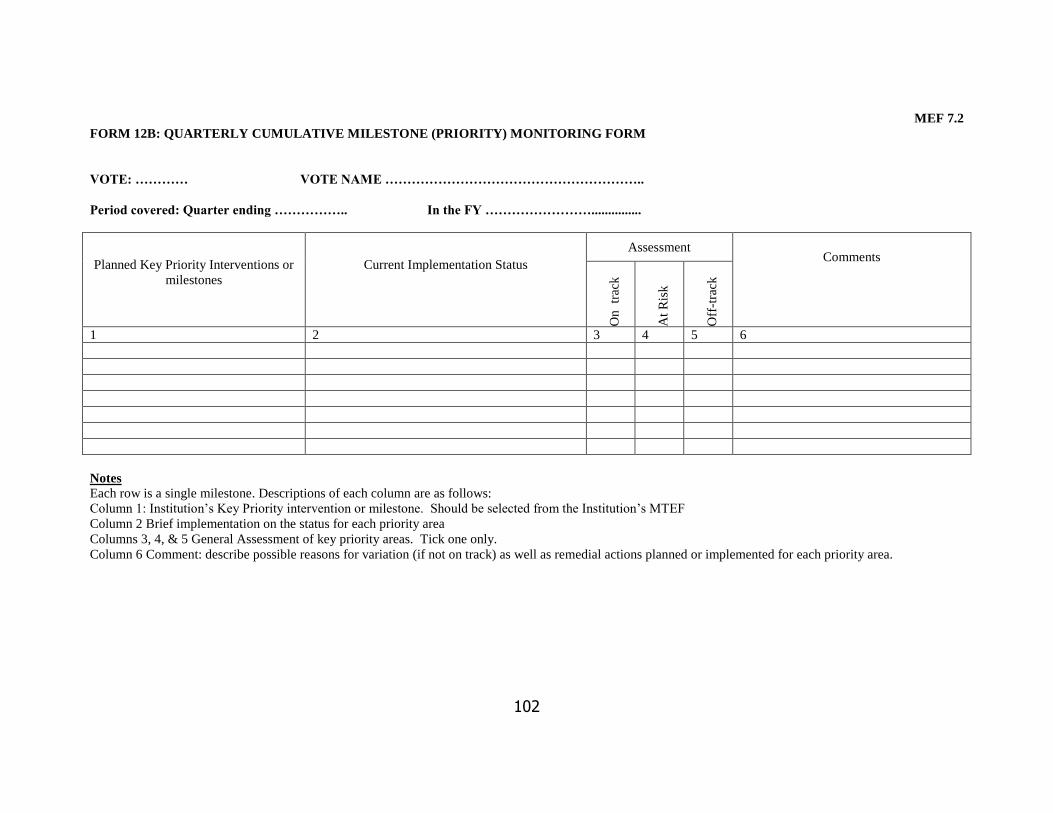
102
MEF 7.2
FORM 12B: QUARTERLY CUMULATIVE MILESTONE (PRIORITY) MONITORING FORM
VOTE: ………… VOTE NAME …………………………………………………..
Period covered: Quarter ending …………….. In the FY ……………………...............
Planned Key Priority Interventions or
milestones
Current Implementation Status
Assessment Comments
On
tr
ack
At
Ris
k
Off
-tra
ck
1 2 3 4 5 6
Notes
Each row is a single milestone. Descriptions of each column are as follows:
Column 1: Institution’s Key Priority intervention or milestone. Should be selected from the Institution’s MTEF
Column 2 Brief implementation on the status for each priority area
Columns 3, 4, & 5 General Assessment of key priority areas. Tick one only.
Column 6 Comment: describe possible reasons for variation (if not on track) as well as remedial actions planned or implemented for each priority area.

103
MEF 7.3
FORM 12C: OUTCOME INDICATOR MONITORING FORM
VOTE: ………… VOTE NAME ……………………………………………………………………………..
PERIOD: RESULTS AS OF THE END OF FINANCIAL YEAR …………………………
Objective
and Code
Indicator
Name and
description
BASELINE
INDICATOR
TARGET VALUES
(AS PER SP)
ACTUAL
INDICATOR
VALUES CLASSIFICATIONS Source of
Data /
Means of
verification Comment
Base-
line
Date
Baseline
Indicator
Value y0 y+1 y+2 y+3 y0 y+1 y+2 y+3 FYDP SDG P R
1 2 3 4 5 6 7 8 9 10 11 12 13 14 15 16 17 18
Notes
Each row on this form describes a single performance indicator. Indicators are used to measure progress towards meeting objectives; they are performance
measures. Descriptions of each column are as follows:
Column 1. Objective Code and Description: the objective (in words) and its code, being measured by the indicator, for example: “B. Increase Access to Education”
Column 2. Indicator Name and Description: this is in two parts. The indicators name should be in italics while its description (how the indicator is calculated)
should be listed below it in a bullet or in parenthesis, for example: Annual Salary Arrears as a percentage of total annual salaries.
Column 3. Baseline date: describes the most recent date, prior to the current planning phase that the indicator was collected.
Column 4. Baseline indicator value is the value of the indicator, on the most recent date prior to the current planning phase.
Columns 5 to 8: Indicator targets: the expected or projected annual future value of the indicator at the end of the first, second, and third year of implementation,
as found in the Strategic Plan. (y0 = the end of the current financial year being planned, (y+1) = the next financial year, y+2 is the next two years and y+3 is the
next three years
Columns 9 to 12: Actual Indicator values: the actual or realized value of the indicator at the end of the first, second, and third year of implementation, as found in
the Strategic Plan. (y0 = the end of the current financial year being planned, (y+1) = the next financial year, y+2 is the next two years and y+3 is the next two
years.
Columns 13 to 16: FYDP, P, R” Place a check mark (tick or X) in the columns FYDP, P, R as follows: FYDP= Five Year Development Plan, P = PAF Matrix; R
= Ruling Party Manifesto. This will help link the indicator to other coordinating plans
Column 18: The source is where the indicator is collected (its data source) while means of verification is the supporting evidence that the indicator may have
Column 19: Comment: any comment describing implementation
MEF 7.4 (a)

104
FORM 13A: QUARTERLY CUMULATIVE FINANCIAL OVERVIEW FORM
VOTE: ………… VOTE NAME ……………………………………………………………………………..
PERIOD: CUMULATIVE RESULTS FOR THE QUARTER ENDING …………….. IN THE FINANCIAL YEAR …………….......
ITEM / COMPOSITION
BUDGET RELEASED ACTUAL EXPENDITURE
Amount in
TShs.
(Millions) % of Total
Amount in
TShs.
(Millions)
Amount Released as a %
of the Budget Amount
(4 ÷ 2)
Amount in
TShs
(Millions)
Actual Value as
a % of the
Budget Amount
(6 ÷ 2)
% of
Total
1 2 3 4 5 6 7 8
EXPENDITURE BY BUDGET
CATEGORY
P.E
O.C
Development Local Funds
Development Foreign Funds
Total 100 100
EXPENDITURE BY FYDP II
CATEGORY (Excludes PE)
FYDP II Strategic Projects
FYDP II Other Projects
Total 100 100
Notes: This report should be printed from the Integrated Financial Management System (IFMS)
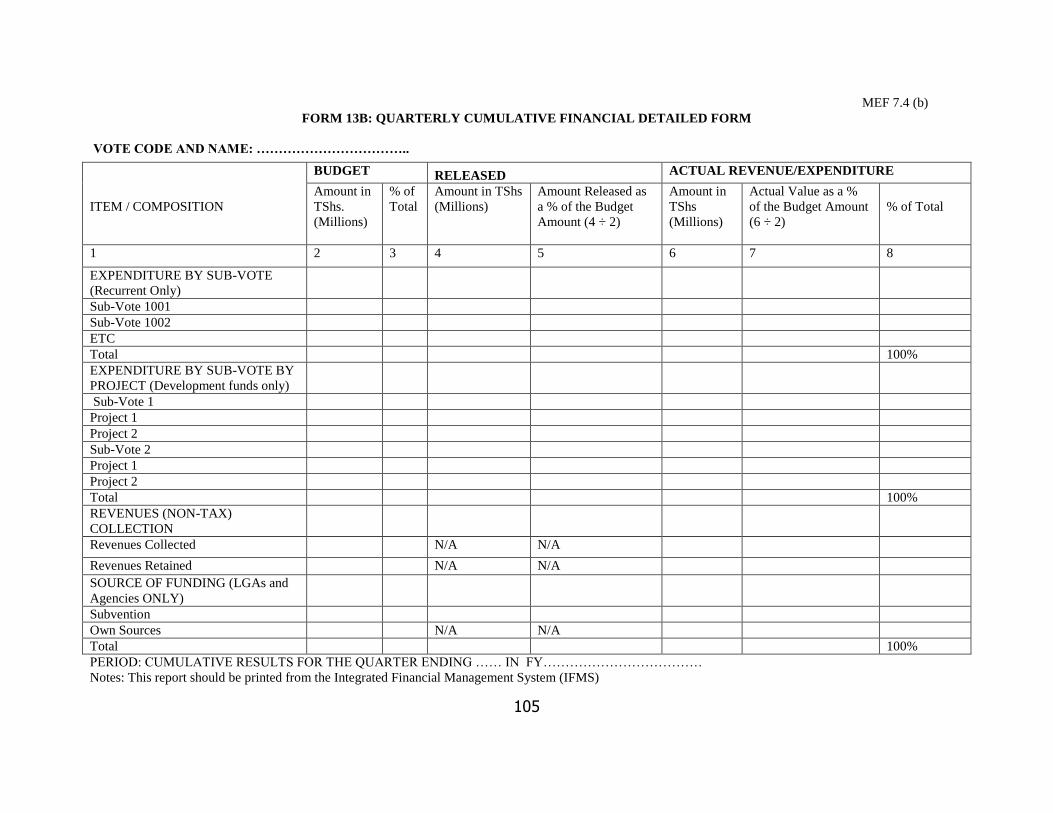
105
MEF 7.4 (b)
FORM 13B: QUARTERLY CUMULATIVE FINANCIAL DETAILED FORM
VOTE CODE AND NAME: ……………………………..
PERIOD: CUMULATIVE RESULTS FOR THE QUARTER ENDING …… IN FY………………………………
Notes: This report should be printed from the Integrated Financial Management System (IFMS)
ITEM / COMPOSITION
BUDGET RELEASED ACTUAL REVENUE/EXPENDITURE
Amount in
TShs.
(Millions)
% of
Total
Amount in TShs
(Millions)
Amount Released as
a % of the Budget
Amount (4 ÷ 2)
Amount in
TShs
(Millions)
Actual Value as a %
of the Budget Amount
(6 ÷ 2)
% of Total
1 2 3 4 5 6 7 8
EXPENDITURE BY SUB-VOTE
(Recurrent Only)
Sub-Vote 1001
Sub-Vote 1002
ETC
Total 100%
EXPENDITURE BY SUB-VOTE BY
PROJECT (Development funds only)
Sub-Vote 1
Project 1
Project 2
Sub-Vote 2
Project 1
Project 2
Total 100%
REVENUES (NON-TAX)
COLLECTION
Revenues Collected N/A N/A
Revenues Retained N/A N/A
SOURCE OF FUNDING (LGAs and
Agencies ONLY)
Subvention
Own Sources N/A N/A
Total 100%

106
COUNCIL FINANCIAL REPORT (CFR)
FORM 13C1: Quarterly Financial Progress Report - Own Revenues (LGA's)
Council Name: ……………………………
Quarterly Financial Report As At:……………………………….
All amounts in Tanzanian Shillings
Own Source Revenues Annual Estimate as per
Approved Budget
Actual Collection/Received Cumulative as % of
Annual Estimate Cumulative Amount,
Previous Quarter
For the
Quarter
Cumulative Amount,
Year to Date
A B C D E
Local Taxes (Rates, Levies
and Cesses)
Property Tax - - - - 0.0
Land Rent - - - - 0.0
Produce Cess - - - - 0.0
Service Levy - - - - 0.0
Guest House Levy - - - - 0.0
Other Levies on Business
Activity - - - - 0.0
Subtotal, Local Taxes - - - - 0.0
Licenses and Permits
Licenses and permits on
business activities - - - - 0.0
Permits on construction
activities - - - - 0.0
Licenses on extraction of
forest products - - - - 0.0
Licenses/permits on vehicles
and transport. - - - - 0.0
Sub-Total, Licenses and
Permits - - - - 0.0
Fees and Charges
Market fees and charges - - - - 0.0
Sanitation fees and charges - - - - 0.0
Specific service fees - - - - 0.0
o/w Parking Fees - - - - 0.0
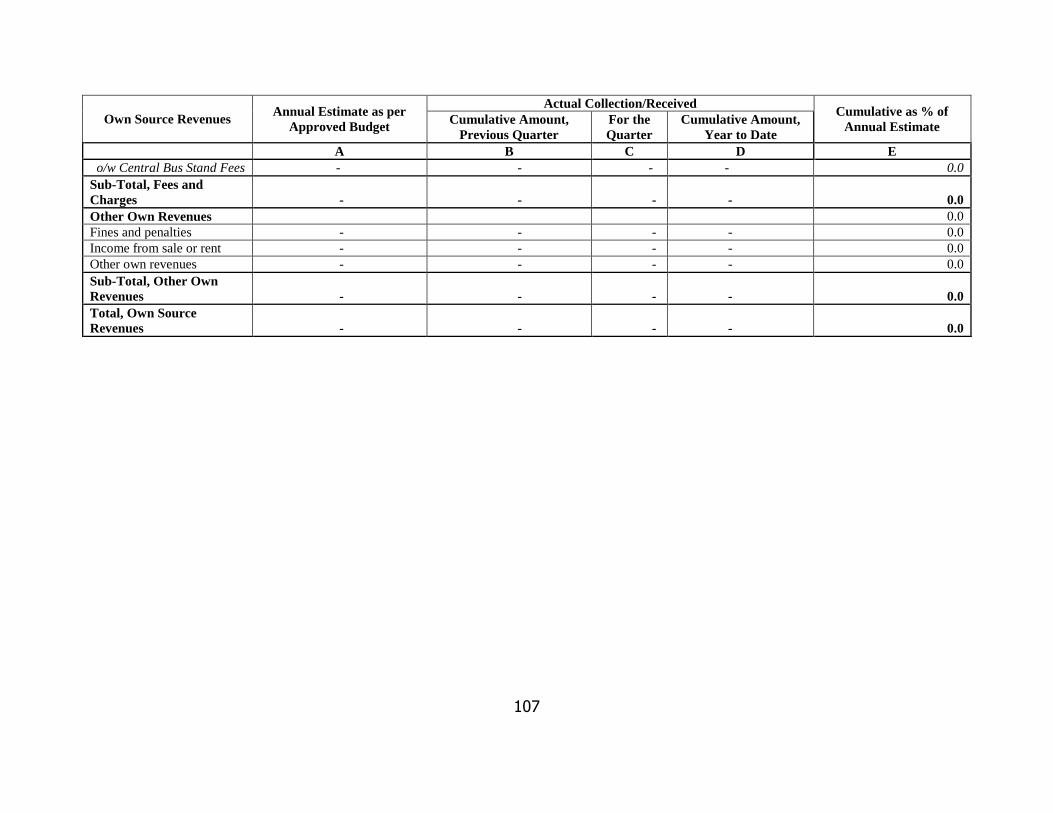
107
Own Source Revenues Annual Estimate as per
Approved Budget
Actual Collection/Received Cumulative as % of
Annual Estimate Cumulative Amount,
Previous Quarter
For the
Quarter
Cumulative Amount,
Year to Date
A B C D E
o/w Central Bus Stand Fees - - - - 0.0
Sub-Total, Fees and
Charges - - - - 0.0
Other Own Revenues 0.0
Fines and penalties - - - - 0.0
Income from sale or rent - - - - 0.0
Other own revenues - - - - 0.0
Sub-Total, Other Own
Revenues - - - - 0.0
Total, Own Source
Revenues - - - - 0.0

108
Account Balances
Opening Account
Balance for Budget
Year
Opening
Account
Balance for
Quarter
Closing
Account
Balance for
Quarter
Change in Balance
for Quarter
Own Source Revenue Collection Account - - - 0.0
Personal Emoluments Account - - - 0.0
Other Charges Account - - - 0.0
Miscellaneous Deposit Account - - - 0.0
Development Account - - - 0.0
Road Fund Account - - - 0.0
Total Account Balances - - - 0.0

109
COUNCIL FINANCIAL REPORT (CFR)
FORM 13 C2: Quarterly Financial Progress Report – Transfers (LGA's)
Council Name
Quarterly Financial Report As At:……………………………
All amounts in Tanzanian Shillings
Description of Transfer Sources
Annual Estimate
as per Approved
Budget
Actual Collection/Received
Cumulative as % of
Annual Estimate Cumulative Amount,
Previous Quarter
For the
Quarter
Cumulative
Amount, Year
to Date
A B C D E
Recurrent Grants:
(I) Block Grants
Primary Education Block Grant: PE Amount - - - - 0.0
: OC Amount - - - - 0.0
Secondary Ed. Block Grant : PE Amount - - - - 0.0
: OC Amount - - - - 0.0
Health Block Grant : PE Amount - - - - 0.0
: OC Amount - - - - 0.0
Agriculture Block Grant : PE Amount - - - - 0.0
: OC Amount - - - - 0.0
Roads Block Grant : PE Amount - - - - 0.0
: OC Amount - - - - 0.0
Water Block Grant : PE Amount - - - - 0.0
: OC Amount - - - - 0.0
General Purpose (incl. Admin) : PE Amount - - - - 0.0
: OC Amount - - - - 0.0
Sub-Total, Block Grants - - - - 0.0
(II) Sector Baskets and other subventions
Primary Education - - - - 0.0
Secondary Education - - - - 0.0
Health (HSBF and MSD supplies) - - - - 0.0
Roads - - - - 0.0
HIV/AIDS (TACAIDS, Global Fund and others) - - - - 0.0
National Mult-sectoral Strategic Fund (NMSF) - - - - 0.0
Other subventions - - - - 0.0

110
Description of Transfer Sources
Annual Estimate
as per Approved
Budget
Actual Collection/Received
Cumulative as % of
Annual Estimate Cumulative Amount,
Previous Quarter
For the
Quarter
Cumulative
Amount, Year
to Date
Sub-Total, Sector Baskets and Other Subv. - - - - 0.0
Sub-Total, Recurrent Transfers - - - - 0.0
(III) Development Grants / Funds:
LG Development Grants (LGDG): CDG and CBG - - - - 0.0
Primary Education Development Grants - - - - 0.0
Secondary Education Development Grants - - - - 0.0
Health Development Grants - - - - 0.0
Roads Sector Development Grants - - - - 0.0
Water Sector Development Grants - - - - 0.0
Agriculture Sector Development Grants - - - - 0.0
TASAF - - - - 0.0
Tanzania Strategic Cities Project Fund (TSCP) - - - - 0.0
Constituent Development Catalyst Funds (CDCF) - - - - 0.0
Other Dev. Grants / Funds * - - - - 0.0
Sub-Total Dev. Grants / Funds - - - - 0.0
Total, Transfers - - - - 0.0
Local Borrowing: 0.0
Local Government Loans Board - - - - 0.0
Other Loans - - - - 0.0
Total, Local Borrowing - - - - 0.0
*Other Development Grants means: VTTP, LGTP, UDEM,SWM, PFM,
Others – exceeding 5% of the total own source should been explained
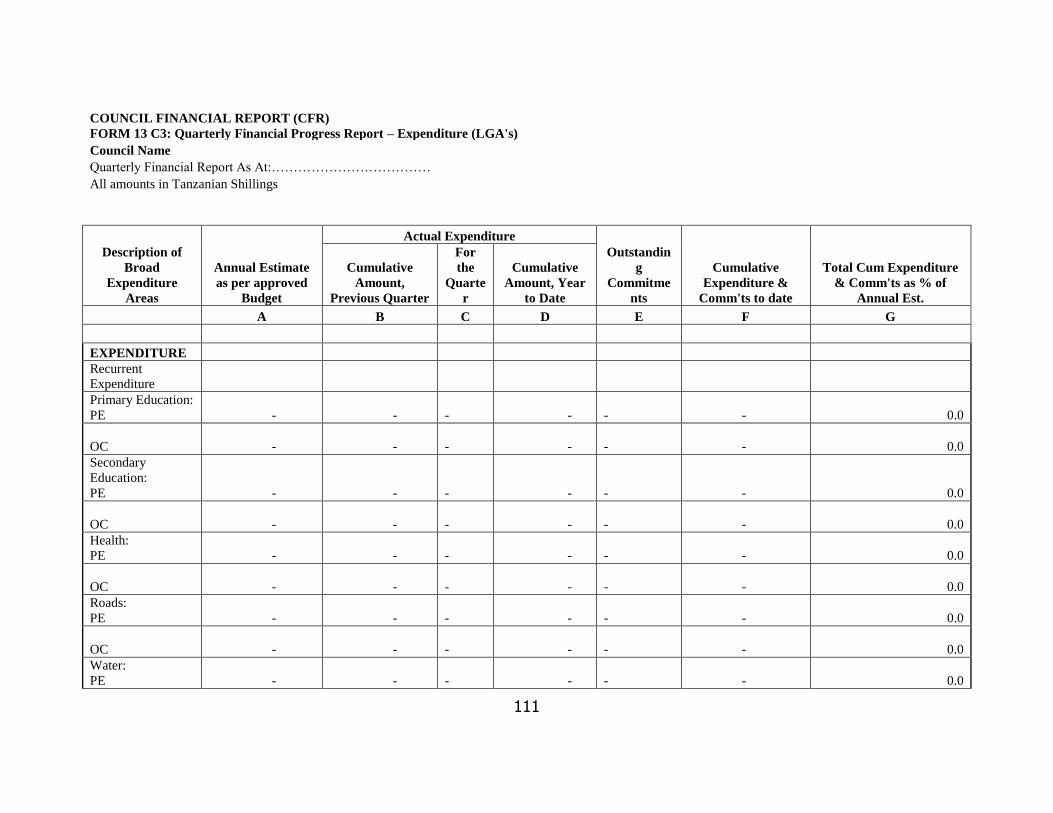
111
COUNCIL FINANCIAL REPORT (CFR)
FORM 13 C3: Quarterly Financial Progress Report – Expenditure (LGA's)
Council Name
Quarterly Financial Report As At:………………………………
All amounts in Tanzanian Shillings
Description of
Broad
Expenditure
Areas
Annual Estimate
as per approved
Budget
Actual Expenditure
Outstandin
g
Commitme
nts
Cumulative
Expenditure &
Comm'ts to date
Total Cum Expenditure
& Comm'ts as % of
Annual Est.
Cumulative
Amount,
Previous Quarter
For
the
Quarte
r
Cumulative
Amount, Year
to Date
A B C D E F G
EXPENDITURE
Recurrent
Expenditure
Primary Education:
PE - -
- -
- - 0.0
OC - -
- -
- - 0.0
Secondary
Education:
PE - -
- -
- - 0.0
OC - -
- -
- - 0.0
Health:
PE - -
- -
- - 0.0
OC - -
- -
- - 0.0
Roads:
PE - -
- -
- - 0.0
OC - -
- -
- - 0.0
Water:
PE - -
- -
- - 0.0
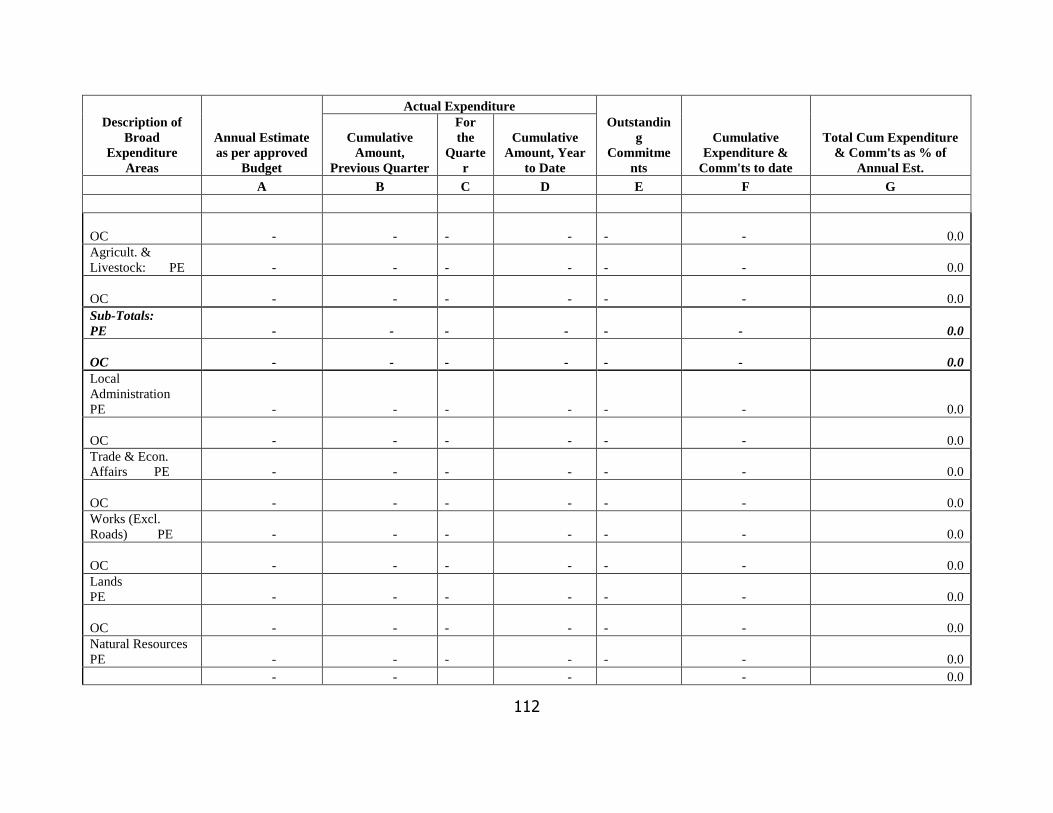
112
Description of
Broad
Expenditure
Areas
Annual Estimate
as per approved
Budget
Actual Expenditure
Outstandin
g
Commitme
nts
Cumulative
Expenditure &
Comm'ts to date
Total Cum Expenditure
& Comm'ts as % of
Annual Est.
Cumulative
Amount,
Previous Quarter
For
the
Quarte
r
Cumulative
Amount, Year
to Date
A B C D E F G
OC - -
- -
- - 0.0
Agricult. &
Livestock: PE - -
- -
- - 0.0
OC - -
- -
- - 0.0
Sub-Totals:
PE - -
- -
- - 0.0
OC - -
- -
- - 0.0
Local
Administration
PE - -
- -
- - 0.0
OC - -
- -
- - 0.0
Trade & Econ.
Affairs PE - -
- -
- - 0.0
OC - -
- -
- - 0.0
Works (Excl.
Roads) PE - -
- -
- - 0.0
OC - -
- -
- - 0.0
Lands
PE - -
- -
- - 0.0
OC - -
- -
- - 0.0
Natural Resources
PE - -
- -
- - 0.0
- - - - 0.0

113
Description of
Broad
Expenditure
Areas
Annual Estimate
as per approved
Budget
Actual Expenditure
Outstandin
g
Commitme
nts
Cumulative
Expenditure &
Comm'ts to date
Total Cum Expenditure
& Comm'ts as % of
Annual Est.
Cumulative
Amount,
Previous Quarter
For
the
Quarte
r
Cumulative
Amount, Year
to Date
A B C D E F G
OC - -
Community Dev.
PE - -
- -
- - 0.0
OC - -
- -
- - 0.0
Other Departments
PE - -
- -
- - 0.0
OC - -
- -
- - 0.0
Sub-Totals:
PE - -
- -
- - 0.0
OC - -
- -
- - 0.0
Sub-Total;
Recurrent: PE - -
- -
- - 0.0
OC - -
- -
- - 0.0
Sub-Total,
Recurrent Exp. - -
- -
- - 0.0
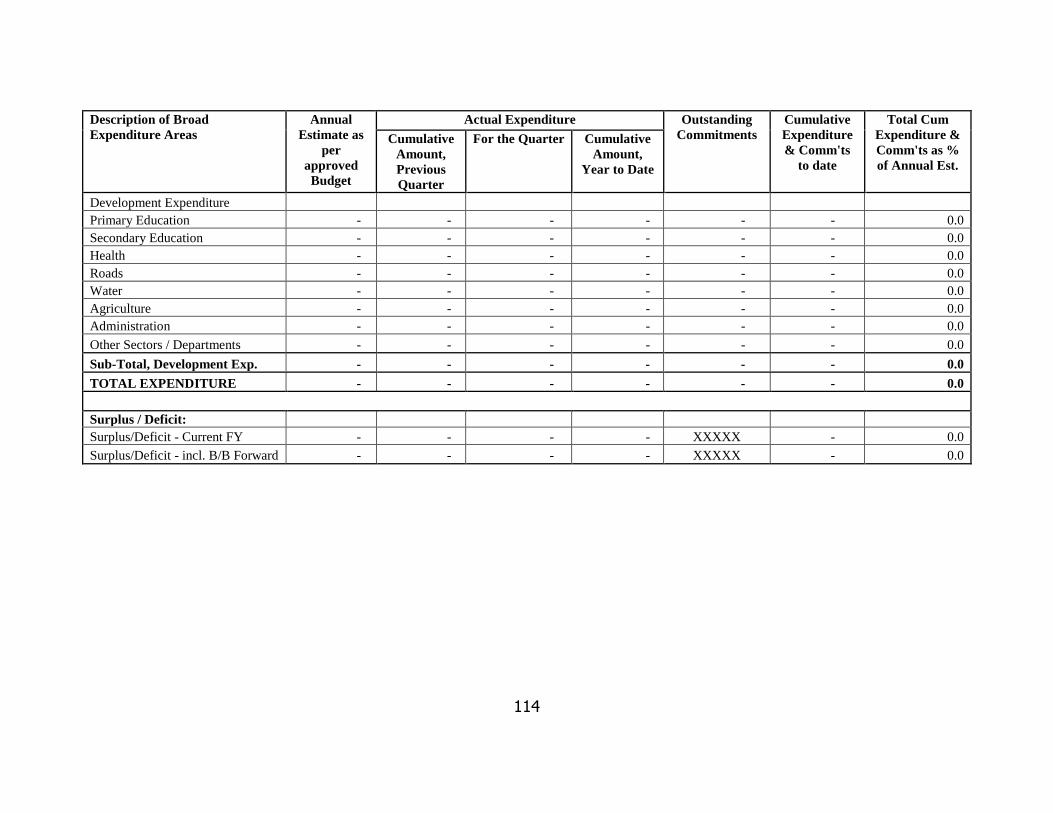
114
Description of Broad
Expenditure Areas
Annual
Estimate as
per
approved
Budget
Actual Expenditure Outstanding
Commitments
Cumulative
Expenditure
& Comm'ts
to date
Total Cum
Expenditure &
Comm'ts as %
of Annual Est.
Cumulative
Amount,
Previous
Quarter
For the Quarter Cumulative
Amount,
Year to Date
Development Expenditure
Primary Education - - - - - - 0.0
Secondary Education - - - - - - 0.0
Health - - - - - - 0.0
Roads - - - - - - 0.0
Water - - - - - - 0.0
Agriculture - - - - - - 0.0
Administration - - - - - - 0.0
Other Sectors / Departments - - - - - - 0.0
Sub-Total, Development Exp. - - - - - - 0.0
TOTAL EXPENDITURE - - - - - - 0.0
Surplus / Deficit:
Surplus/Deficit - Current FY - - - - XXXXX - 0.0
Surplus/Deficit - incl. B/B Forward - - - - XXXXX - 0.0
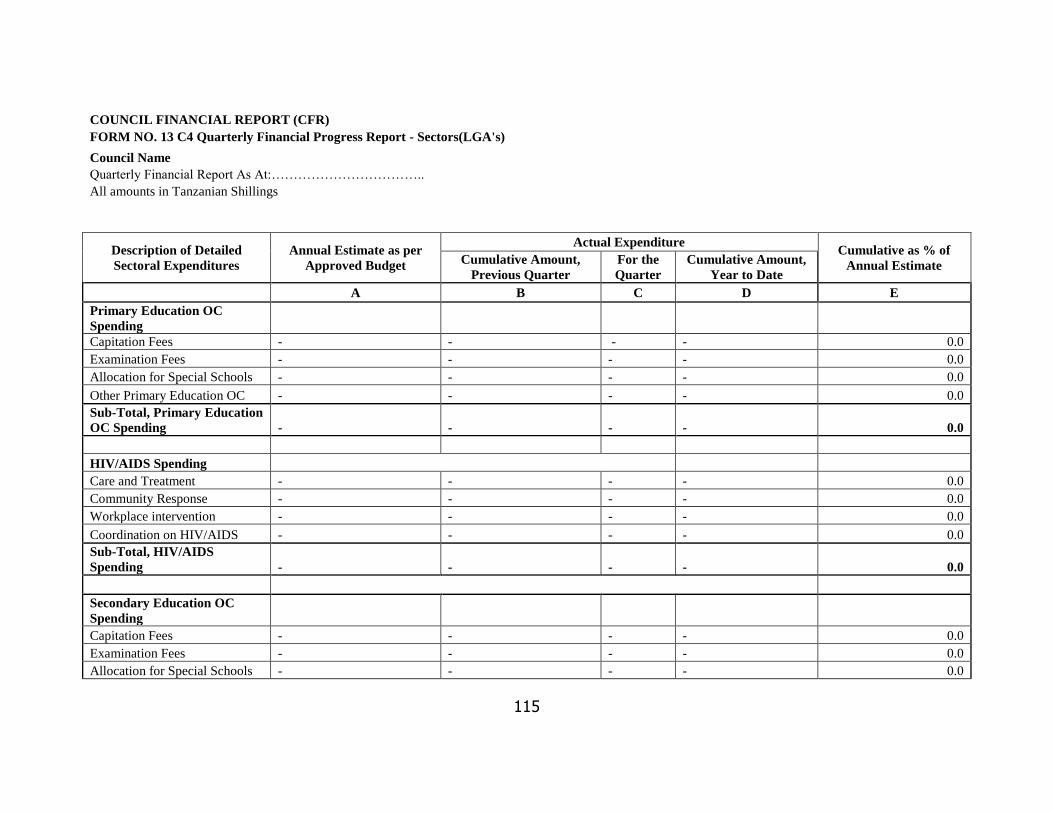
115
COUNCIL FINANCIAL REPORT (CFR)
FORM NO. 13 C4 Quarterly Financial Progress Report - Sectors(LGA's)
Council Name
Quarterly Financial Report As At:……………………………..
All amounts in Tanzanian Shillings
Description of Detailed
Sectoral Expenditures
Annual Estimate as per
Approved Budget
Actual Expenditure Cumulative as % of
Annual Estimate Cumulative Amount,
Previous Quarter
For the
Quarter
Cumulative Amount,
Year to Date
A B C D E
Primary Education OC
Spending
Capitation Fees - - - - 0.0
Examination Fees - - - - 0.0
Allocation for Special Schools - - - - 0.0
Other Primary Education OC - - - - 0.0
Sub-Total, Primary Education
OC Spending - - - - 0.0
HIV/AIDS Spending
Care and Treatment - - - - 0.0
Community Response - - - - 0.0
Workplace intervention - - - - 0.0
Coordination on HIV/AIDS - - - - 0.0
Sub-Total, HIV/AIDS
Spending - - - - 0.0
Secondary Education OC
Spending
Capitation Fees - - - - 0.0
Examination Fees - - - - 0.0
Allocation for Special Schools - - - - 0.0
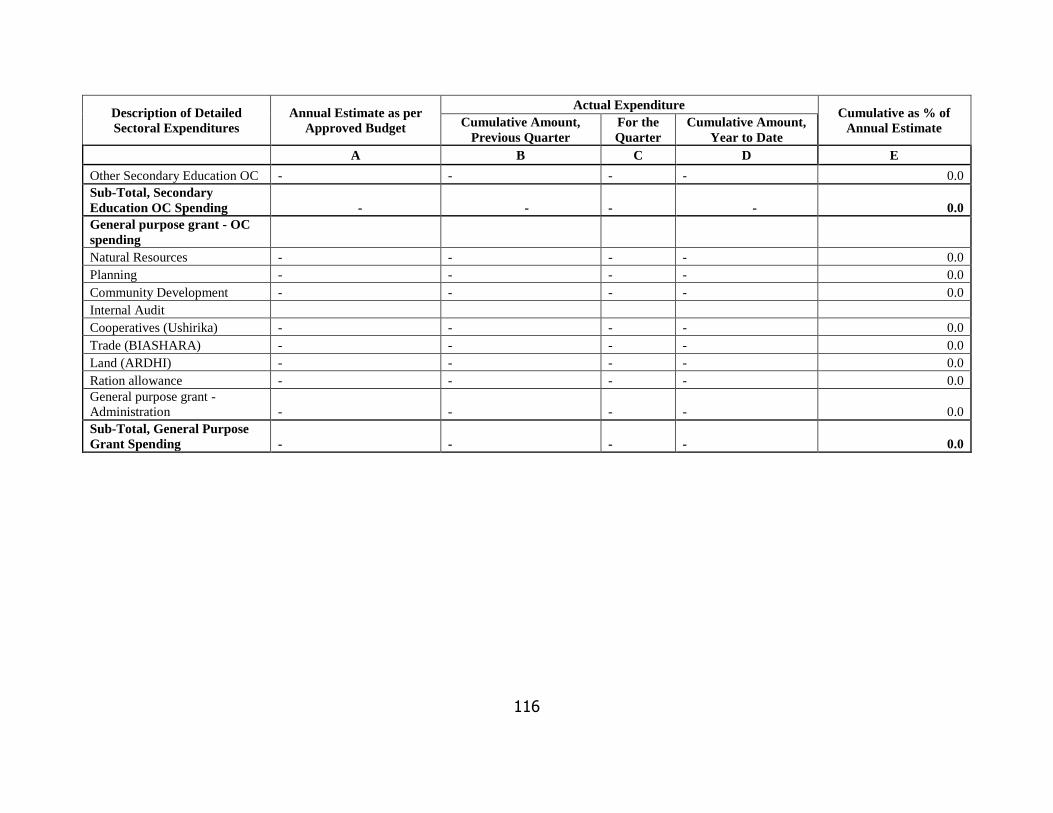
116
Description of Detailed
Sectoral Expenditures
Annual Estimate as per
Approved Budget
Actual Expenditure Cumulative as % of
Annual Estimate Cumulative Amount,
Previous Quarter
For the
Quarter
Cumulative Amount,
Year to Date
A B C D E
Other Secondary Education OC - - - - 0.0
Sub-Total, Secondary
Education OC Spending - -
- - 0.0
General purpose grant - OC
spending
Natural Resources - - - - 0.0
Planning - - - - 0.0
Community Development - - - - 0.0
Internal Audit
Cooperatives (Ushirika) - - - - 0.0
Trade (BIASHARA) - - - - 0.0
Land (ARDHI) - - - - 0.0
Ration allowance - - - - 0.0
General purpose grant -
Administration - - - - 0.0
Sub-Total, General Purpose
Grant Spending - - - - 0.0

117
Form No. 13 C- 5 QUARTERLY FINANCIAL AND PHYSICAL PROGRESS REPORT FOR LGA DEVELOPMENT ACTIVITIES
Cover page
Council: Select your council here - - - - - - - -
Vote Code: 000000
FY: FY 20../..
Quarter Q1
Period ending: September 30, 20....
CDR Workbook Number: 1
Project Type: Select
Project
Initiated: Select
Name of Project:
Contract Details
Council: [No Council Selected]
Type of Procurement Select
Location:
Procurement Method Select
Description:
Contractor/Consultant/Serv.
Prov.
Contract
Sum
Start Date (Planned)
mm/dd/yy
yy
Completion Date (Planned)
mm/dd/yy
yy
Project Budget:
Project Details:
Main Project Outputs:
Approved Council Budget:
Project (Activity) Code :
Number Unit
Supplementary Council Budget
Sector /
Dept. : Select
Select
Total Approved Council Budget 0
HLG / LLG:
Select
Select
Community Contribution:
FYDP II:
Select
Select
Other Off Budget Funding:
Objective:
Select
Total Budget (incl Comm. Contr.
and Off Budget Funding) 0
Target:
Select
Expenditure
Category:
Select
Main Funding Source: Select
Co-Funding From Other Source: Select

118
Notes
i. In the Council Development Reporting (CDR) forms there are DP1-DP100, each DP is one development activity as it appears in the Plan-Rep
ii. Select the Council Name and Quarter from the dropdown menu in the cover page sheet, other information (Dates and Reporting Period will be generated
automatic)
iii. The forms are self-explanatory, you are required to type or select the information from only the coloured cell (other areas is protected and the information will
generated automatic
iv. Second and third boxes represents the Council Planned Budget as it appears in PlanRep and is prepared once in a year while the fourth and fifth boxes is for
reporting the implementations and is to be filled in Quarterly basis in the respective quarter.
v. The form contains the formulas which provides a cumulative information building from each quarter of reporting
Financial Progress Report: Actual Allocations and Expenditures
Quarter
Actual
Allocation
(Quarter)
Cumulative
Allocation
Actual
Expenditure
(Quarter)
Cumulative
Expenditur
e
Performan
ce Ratio
(%)
Balance
(TShs.)
Remarks Regarding Financial
Progress
1 0 0 0
2
3
4
Physical Progress Report
Quarter Planned Activity Actual
Implementation
Cumulative Implementation (0-
100%)
Remarks on Physical
Progress
1
2
3
4
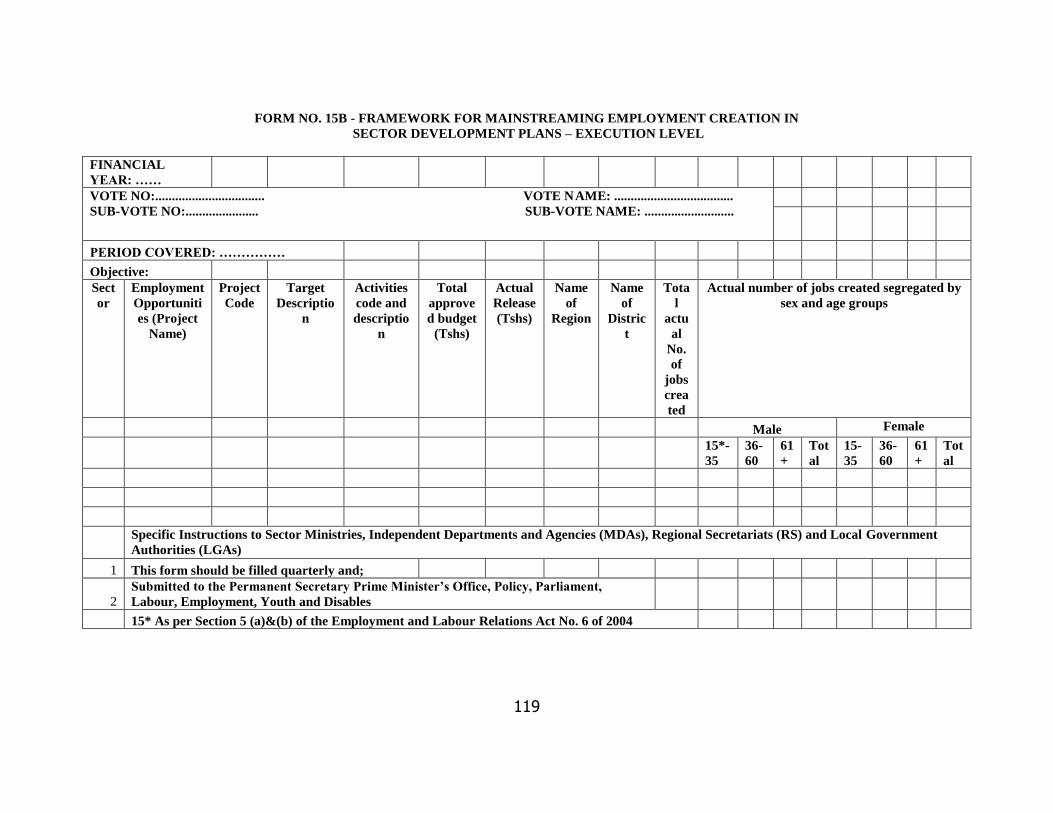
119
FORM NO. 15B - FRAMEWORK FOR MAINSTREAMING EMPLOYMENT CREATION IN
SECTOR DEVELOPMENT PLANS – EXECUTION LEVEL
FINANCIAL
YEAR: ……
VOTE NO:................................. VOTE NAME: ....................................
SUB-VOTE NO:...................... SUB-VOTE NAME: ...........................
PERIOD COVERED: ……………
Objective:
Sect
or
Employment
Opportuniti
es (Project
Name)
Project
Code
Target
Descriptio
n
Activities
code and
descriptio
n
Total
approve
d budget
(Tshs)
Actual
Release
(Tshs)
Name
of
Region
Name
of
Distric
t
Tota
l
actu
al
No.
of
jobs
crea
ted
Actual number of jobs created segregated by
sex and age groups
Male Female
15*-
35
36-
60
61
+
Tot
al
15-
35
36-
60
61
+
Tot
al
Specific Instructions to Sector Ministries, Independent Departments and Agencies (MDAs), Regional Secretariats (RS) and Local Government
Authorities (LGAs)
1 This form should be filled quarterly and;
2 Submitted to the Permanent Secretary Prime Minister’s Office, Policy, Parliament,
Labour, Employment, Youth and Disables
15* As per Section 5 (a)&(b) of the Employment and Labour Relations Act No. 6 of 2004


