+ All Categories
Home > Documents > THE UNITED REPUBLIC OF TANZANIA - mof.go.tz 2011_12 TRH 18_MAR… · the united republic of...

THE UNITED REPUBLIC OF TANZANIA - mof.go.tz 2011_12 TRH 18_MAR… · the united republic of...

Date post: 06-Mar-2018
Category:
Upload: hoangthien
View: 213 times
Download: 0 times
Share this document with a friend
179
THE UNITED REPUBLIC OF TANZANIA GUIDELINES FOR THE PREPARATION OF PLAN AND BUDGET FOR 2011/12 WITHIN THE FIVE YEAR DEVELOPMENT PLAN FRAMEWORK (2011/12 – 2015/16) PART I & II Ministry of Finance P. O. BOX 9111 DAR ES SALAAM MARCH, 2011
Transcript

THE UNITED REPUBLIC OF TANZANIA

GUIDELINES FOR THE PREPARATION OF PLAN AND BUDGET FOR

2011/12 WITHIN THE FIVE YEAR DEVELOPMENT PLAN FRAMEWORK

(2011/12 – 2015/16)

PART I & II

Ministry of Finance P. O. BOX 9111 DAR ES SALAAM MARCH, 2011

ii

TABLE OF CONTENTS

LIST OF ABBREVIATIO S ................................................................................................................... III

PREAMBLE ................................................................................................................................................. V

CHAPTER ONE ............................................................................................................................................ 1

THE FIVE YEAR PLAN FORMULATION FRAMEWORK ................................................................... 1

CHAPTER TWO ........................................................................................................................................... 8

FIVE YEAR DEVELOPMENT PLAN OBJECTIVES AND FOCUS ..................................................... 8

MACROECONOMIC ASSUMPTIONS AND OUTLOOK ............................................................................ 8 TARGETS OF KEY ECONOMIC ACTIVITIES ...................................................................................... 9 STRATEGIC FOCUS FOR THE FIVE YEAR PLAN ............................................................................... 15

CHAPTER THREE ..................................................................................................................................... 20

SPECIFIC ISSUES TO REGIONAL ADMINISTRATION AND ...................................................... 20

LOCAL GOVERNMENT............................................................................................................................ 20

HARMONIZATION OF DEVELOPMENT GRANTS ............................................................................... 33 OVERALL BUDGETARY GUIDANCE ............................................................................................. 33

CHAPTER FOUR ....................................................................................................................................... 35

HUMAN RESOURCE PLANNING AND MANAGEMENT ................................................................. 35

INTRODUCTION ................................................................................................................... 35 HUMAN RESOURCE PLANNING ................................................................................................. 35 ETHICS AND INTEGRITY ......................................................................................................... 38 HUMAN RESOURCES DEVELOPMENT .......................................................................................... 39

CHAPTER FIVE ......................................................................................................................................... 41

RESOURCE ENVELOPE AND EXPENDITURE FRAMEWORK ...................................................... 41

OF THE FIVE YEAR PLAN 2011/12 – 2015/16 ............................................................................. 41

REVENUE POLICIES AND INITIATIVES ......................................................................................... 44 DOMESTIC FINANCING AND NON-CONCESSIONAL BORROWING ......................................................... 45

CHAPTER SIX ........................................................................................................................................... 46

PERFORMANCE MONITORING, EVALUATION AND REPORTING SYSTEM ......................... 46

SPECIFIC INSTRUCTIONS TO MDAS, REGIONS AND LGAS ............................................................... 48 PERFORMANCE MONITORING AND REPORTING ............................................................................. 49

CHAPTER SEVEN ..................................................................................................................................... 50

INSTITUTIONAL RESPONSIBILITIES FOR IMPLEMENTATION OF THE PLAN AND

BUDGET ...................................................................................................................................................... 50

ROLES OF ACCOUNTING OFFICERS IN PLANNING AND EXECUTION ..................................................... 50 EXPENDITURE CONTROL AND COST REDUCTION ........................................................................... 52 GOVERNMENT PROCUREMENT SYSTEM AND MANAGEMENT .............................................................. 53 NATIONAL PRIORITIES FOR THE FIVE YEAR DEVELOPMENT PLAN ...................................................... 54 PREPARATION OF PERSONAL EMOLUMENTS BUDGET ...................................................................... 54 PREPARATION OF REVENUE ESTIMATES ...................................................................................... 55 IMPLEMENTATION OF INSTITUTIONAL PLANS AND BUDGETS: ........................................................... 56

iii

LIST OF ABBREVIATIONS

ARV - Anti Retro Virals ASDP - Agricultural Sector Development Programme BEST - Business Environment Strengthening for Tanzania BOT - Bank of Tanzania BWM-SEZ - Benjamin William Mkapa Special Economic Zone CCM - Chama Cha Mapinduzi COMSIP - Community Savings and Investment Promotion D by D - Decentralization by Devolution DADPs - District Agriculture Development Plans EU - European Union EAC-CM - East African Community Common Market GRB - Gender Responsive Budget GDP GFC

- Gross Domestic Product Global Financial Crisis

GEPF - Government Employees Pension Fund HIPC - Highly Indebted Poor Countries HR - Human Resource ICT - Information and Communication Technology IFMS - Integrated Financial Management System LGAs - Local Government Authorities LSRP - Legal Sector Reform Program LAPF - Local Authorities Provident Fund LGCDG - Local Government Capital Development Grant LGRP - Local Government Reform Programme MDGs - Millennium Development Goals MACMOD - Macro-economic Model MIS - Management Information System MOF - Ministry of Finance MTEF - Medium Term Expenditure Framework MoEVT - Ministry of Education and Vocational Training MTP - Medium Term Plan NACSAP - National Anti-Corruption Strategy and Action Plan NGSDA - National Geographical Spatial Data Infrastructure NSGRP - National Strategy for Growth and Reduction of Poverty NHIF - National Health Insurance Fund NEEC - National Economic Empowement Council NSSF - National Social Security Fund PADEP - Participatory Agriculture Development and Empowerment

Project PBG - Plan and Budget Guidelines PCCB - Prevention and Combating of Corruption Bureau PEDP - Primary Education Development Programme PER - Public Expenditure Review

iv

PE - Personal Emolment PFA - Public Finance Act PFMRP - Public Financial Management Reform Programme PLWHAs - People Living with HIV and AIDS PHSDP PMO-RALG

- Primary Health Service Development Proramme Prime Minister’s Office – Regional Administration & Local Government

PMCT - Prevention of Mother to Child Transmission PO-PSM - President’s Office – Public Service Management PPP - Public – Private Partnership PSRP - Public Service Reform Programme PSPF - Public Service Pension Fund PPF - Parastatal Pension Fund RS - Regional Secretariat RCs - Regional Commissioners R&D - Research and Development SADC - Southern Africa Development Community SBAS - Strategic Budget Allocation System SEDP - Secondary Education Development Programme SEZ - Special Economic Zone SMEs - Small and Medium Enterprises SPs - Strategic Plans SUMATRA - Surface and Marine Transport Regulatory Authority TASAF - Tanzania Social Action Fund TCRA - Tanzania Communication Regulatory Authority TR - Treasury Registrar TDHS - Tanzania Demographic and Health Survey TIC - Tanzania Investment Centre THIS - Tanzania HIV and AIDS Indicator Survey TRL TSCP

- Tanzania Railways Limited Tanzania Strategic Cities Project

TSIP - Transport Sector Investment Program VAT - Value Added Tax

v

PREAMBLE

The Plan and Budget Guidelines have been prepared taking into account the

ongoing process of the review of achievements of objectives and targets of the

Tanzania Development Vision (TDV) 2025 and the preparation of the Five Year

Development Plan 2011/12 – 2015/16 whose implementation will start in the

year 2011/12. These guidelines also draw from priorities outlined in MKUKUTA II

and the 2010 – 2015 CCM Election Manifesto. In addition, the guidelines reflect

the 13 priority areas highlighted by the President H.E. Dr. Jakaya Mrisho

Kikwete, during his inaugural address to the Parliament on 18th November 2010.

These priorities indicate areas to which the public resources should be directed in

order to catalyze development at all levels and seek to address specific

bottlenecks to the country’s socio-economic development. These Guidelines also

recognize the Government effort to implement the policy of Decentralization by

Devolution (D by D).

The Guidelines document is divided into two parts. Part I is organized in seven

chapters which are integrated and synchronized in order to make them

wholesome. This part presents the Medium Term Focus and review of

macroeconomic performance, MKUKUTA I implementation, RSs and LGAs, Public

Sector Reforms, and Public Investments. Details of these reviews are provided in

the Annex. Part II of the Guidelines constitutes the standard forms to facilitate

the MDAs, RSs and LGAs to effect the preparation, execution and monitoring and

evaluation of their budgets.

Chapter One sets the stage for the Five Year Development Plan Framework. The

chapter presents the background and a review of achievements of objectives and

targets of the TDV 2025. It also highlights the implementation set-up and

performance, achievements recorded and challenges encountered in the course

of implementation. It briefly elaborates on the rationale for a paradigm shift in

vi

the planning framework. This chapter concludes with highlighting on the issues

(or challenges) that the coming Five Year Development Plan seek to address.

Chapter Two spells out the Five Year Development Plan Framework, objectives

and focus. The chapter dwells on the key macroeconomic assumptions and

policy targets for 2011/12 - 2015/16. Further, the chapter summarises national

priority areas to be considered during the first year of the Plan as well as sectoral

priorities for Five year Plan period.

Chapter Three provides an insight into issues that are considered specific to

Regional Administration and Local Government Authorities. The chapter spells

out the national focus over these levels of administration in the Five Year

Development Plan including the issue of resource generation and expenditure

priority areas while taking into consideration local priorities. The strategic

position of these levels of administration in the implementation of annual plans

as compared to MDAs is articulated.

Chapter Four underscores the role and strategic importance of Human Resource

in the execution of the Five Year Development Plan and Budget. Specific

guidance has been given to MDAs, RSs and LGAs to adequately address issues of

HR planning, management, ethics, integrity and development. Also issues to be

addressed in this area will include determination of quality and quantity of HR

needs to meet requirements of critical sectors to growth of the economy

including underserved areas and the realignment of skills to meet the

requirement of the regional labour market.

Chapter Five provides the budget frame for the five year plan period, 2011/12 -

2015/16. The budget frame sets targets for domestic and foreign resources, as

well as expenditure ceilings for the plan period along with the policies and

strategies that will be adopted and implemented for attaining the targets.

vii

Chapter Six outlines a mechanism by which MDAs, RSs and LGAs will monitor,

evaluate and report the execution of the Five Year Development Plan as well as

the 2011/12 plan and budget. Specific instructions regarding the preparation and

effective implementation of plans and budgets are provided to MDAs, RSs and

LGAs.

The last Chapter dwells on issues of institutional responsibilities for the

implementation of the Five Year Development Plan and the Annual Plan and

Budget for 2011/12. It reminds the Accounting Officers and Plan and Budget

Committees of respective institutions on their roles and responsibilities in

planning and budgeting. The chapter also underscores adherence to regulations

and procedures governing the use of public resources.

Different from previous years’ guidelines, detailed information including

achievements and challenges recorded during 2009/10 and the first half of

2010/11 has been provided in the Annex. The Annex comprises reviews of the

macroeconomic development, implementation of MKUKUTA I, Regions and LGAs’

performance as well as performance of Public Sector Reforms and Public

Investments. MDAs, Regions and LGAs are therefore obliged to go through the

Annex in order to prepare credible plans and budgets.

1

CHAPTER ONE

THE FIVE YEAR PLAN FORMULATION FRAMEWORK

National Development Agenda

1. The thrust of development agenda of this nation since its independence has

been on economic growth and poverty reduction, with the prime objective of

ensuring the majority of Tanzanians have access to development opportunities to be

able to enjoy the accruing benefits. In an effort to spearhead the pace of achieving

the desired development agenda, the Government in 1999 launched the Tanzania

Development Vision 2025. The gist of the Vision is that by 2025 Tanzania should

have made unprecedented economic transformation and development to achieve

middle income status characterised by high levels of industrialisation,

competitiveness, quality livelihood, rule of law; and having in place a learned and

pro-learning society.

Review of Implementation of the Vision

2. An independent study that was commissioned in 2009 to critically review

implementation of the vision after 10 years of its launch revealed that progress

towards implementation of Vision 2025 was a mixed one. Noticeable milestones have

been recorded in propelling national development towards its desired path. There

has been rapid progress towards the achievement of social development targets and

visible improvement of business environment following implementation of policy and

structural reforms. Consequently, Tanzania has managed to attract substantial

amounts of Foreign Direct Investments (FDIs) mainly into primary production sectors

and extractive industries, notably mining. However, the challenge remains of

hastening the transformation of the country’s production and trade supply structures

commensurate with the dynamics of global demand. Efforts taken to transform the

country’s supply structure to enable Tanzania realise the benefit of globalisation

continue to be hampered by the existence of weak supportive infrastructure,

notably, power and transport. Despite the existence of a numerous power

generation resources, the country’s production has remained largely reliant on

hydropower and therefore the wills of nature. Poor transport infrastructure has also

2

failed the country to optimally exploit its strategic geographic location as a regional

trade gateway and transport logistical hub.

3. To be able to achieve the target of becoming a middle income country by year

2025 entails to address the following challenges;

(i) Need for coherent action to implement TDV 2025 during the remaining two

thirds of its period;

(ii) Prepare medium term plan to implement TDV 2025; and

(iii) A paradigm shift from needs-based planning which is resource based, to the

opportunity-based planning.

The Need to Review the National Planning Framework

4. In his inaugural speech to the 10th Parliament, the President, H.E. Dr. Jakaya

Mrisho Kikwete, emphasized the need to re-engineer Tanzania’s economic planning

framework outlining four important steps:

(i) Reassessing the objectives and targets of the National Development Vision

2025 considering the domestic, regional and global economies since the

Vision was promulgated in 1999 and validating it accordingly;

(ii) Crafting an indicative roadmap which will be the basis for developing three

five year development plans that will guide realization of the Vision objectives

and targets over the remaining 15 years;

(iii) Undertaking to develop a unifying planning framework for institutional,

sectoral and national development plans in liaison with benchmarks and

performance criteria set for the realization of the medium term plan to

implement Vision 2025; and

(iv) Undertaking coherent and persistent efforts to strengthen and sustain

planning and analytical capacities at all levels to guide and inform the course

of implementing the Vision.

Specific Changes in the Planning Framework

5. A number of changes are envisaged in the planning framework and these will

include the following:

3

(i) Plan Horizon: Effective from July 2011, the plan horizon will be five years and

the first five year plan will cover the period 2011/12 – 2015/16.

(ii) Planning Instruments: The following will hereafter be the planning

instruments from which institutional, sectoral and national plans will be drawn:

• The Tanzanian Development Vision 2025;

• The Fifteen Year (Long Term Plan) Roadmap to the realization of the

Development Vision;

• The Five Year Development Plans; and

• MKUKUTA II, Sector Policies and Strategies.

(iii) Plan Orientation: The new orientation calls for a paradigm shift from needs -

based planning which is resource based, to the opportunity-based planning

which requires thinking beyond the resource constrained box towards

strategically positioning the country to maximize on every opportunity that

presents itself thus making resources the means rather than the end.

During the first five year plan, Tanzania will have to compete and benefit from

the unfolding opportunities presented by increasingly integrating regional

markets taking full advantage of its strategic geographical location that stand to

be the regional competitive trade gateway to serve most of the hinterland and

the surrounding land-locked countries. Tanzania is also endowed with natural

resources (mineral, fertile land, tourist attraction sites) and energy sources

(such as biomass and agricultural wastes, coal, hydro, natural gas, thermal,

geothermal, solar and wind) all of which are potentially capable of spurring the

growth to the desired development path.

(iv) Institutional Framework: The following institutional framework will support

the development and implementation of the Five Year Development Plan:

• The Planning Commission will, apart from providing strategic thinking and

advice to the Government, also play a pivotal role in coordinating, monitoring

and evaluating implementation of the Plan, and in collaboration with the

Ministry of Finance, will advise on mobilization and management of financial

resources for implementation of development projects;

4

• The MoF will continue to mobilize financial resources and ensure optimal

allocation in attending identified priority areas of the Plan; and

• MDAs, Regions and LGAs will remain to be the change and implementation

agents of the Plan, interpreting the planning guidelines in respect of their

mandates and supervising implementation of approved projects and activities

for realization of the objectives and targets of the Plan.

Review of MKUKUTA I

6. The National Strategy for Growth and Reduction of Poverty - MKUKUTA in

Tanzania’s development agenda played a pivotal role in the national planning

framework and resource allocation. It was implemented between 2005 and 2010

under three clusters namely: Growth and reduction of income poverty; improved

quality of life and social wellbeing; and good governance and accountability.

7. The assessment of MKUKUTA I show that, within the five years of its

implementation the economy grew at an average of 6.9 percent per annum,

collection of domestic revenue improved and inflation was contained at single digit

level. Performance of key economic sectors was impressive and expansion of social

sectors i.e. education, health and water was encouraging. Systems and programmes

for achieving good governance and accountability were established and

strengthened. Core reforms on Public Service Management, Public Finance

Management, Legal Sector, Local Government and Business Environment were

implemented as planned. Democratic processes were improved and efforts to curb

corruption were intensified through National Anticorruption Strategy and Action Plan

(NACSAP).

8. Despite of the recorded achievements, the following challenges need to be

addressed:

(i) Improving the productive capacity of the economy particularly in areas of

efficiency in power supply, infrastructure development and value addition

activities;

(ii) Trickling down the macroeconomic gains to the individual (community) level

to realize results of poverty reduction efforts;

5

(iii) Sustaining the quality and quantity of social services delivered;

(iv) Developing complementary strategies and plans;

(v) Prioritization and sequencing of interventions; and

(vi) Deepening the implementation of core reforms in view of improving

governance structures.

9. In 2010 the Government developed MKUKUTA II to be implemented from

2010/11 – 2014/15 in order to address the challenges of MKUKUTA I. To ensure full

implementation of the strategic focus of MKUKUTA II, the Government resolved that,

there is a need to have a long term and medium term development plans. In this

regard, a Medium Term plan which will accommodate all national programs, plans

and strategies including MKUKUTA II is being prepared and its implementation will

commence in the financial year 2011/12.

Paradigm Shift in the Planning Framework

10. The planning framework has undergone a number of fundamental changes

over time to influence socio economic management policies and national

development priorities from centrally prepared plans to indicative plans. In the

absence of Five Year Medium Term Plans which were to facilitate the

operationalization of the vision’s aspiration, MKUKUTA though designed as an

implementation strategy took precedence as the medium term plan to implement

Vision 2025. Therefore, there is a need to revive Five Year Medium Term Plans to

implement the Vision 2025. Priority areas to be focused by all players will be

identified and implemented.

Key Challenges to be addressed

11. The following are challenges to be addressed in the Five Year plan:-

(i) Infrastructural Gaps: Analysis of the growth drivers has shown that

infrastructural inadequacies are the most binding constraint. While physical

capital accumulation has been impressive over the past period with an equally

impressive contribution to the growth that has been recorded over the period,

investment in physical infrastructure has not been consistent particularly in

the transport, energy and agriculture sectors;

6

(ii) Sustaining Macroeconomic Stability on account of: Fiscal sustainability;

Maintaining price stability (inflation, interest and exchange rates); National

debt sustainability; and improving productivity;

(iii) Improving Business Environment: Improving business environment to attract

investment both local and foreign;

(iv) Developing Private Sector: Increasing the pace of growth of the local private

sector and facilitating its effective participation in the economic development;

(v) Harnessing the strategic geographical location to serve as a gateway and hub

for regional trade and logistics;

(vi) Exploiting natural resource base: Tanzania is endowed with natural resources

including energy sources, minerals, water, forest and wildlife all of which need

to be exploited to spur the growth to the desired development path;

(vii) Human Capital Development: Investment in HR to address skills gaps which

emerge in critical sectors that are directly linked to economic growth. This

include creation of employment opportunities especially for youth groups as

well as attracting and retaining qualified staff in underserved areas;

(viii) Provision of quality social services along with good governance and

accountability at all levels;

(ix) Enhancing agricultural productivity, ensuring food self sufficiency and export;

(x) Improving financial sector in terms of borrowing and interest rates as well as

vibrant financial markets;

(xi) Strengthening cooperatives development; and

(xii) Ensuring access to quality housing for citizens.

Thrust of the First Five Year Plan

12. The thrust of the first five year development plan 2011/12 – 2015/16 should

reflect the whole issue of unlocking Tanzania’s growth potentials. It will however be

necessary to prioritize a few key interventions and in orderly sequence in their

implementation so that they can complement each other to enable effective and

optimal resource allocation. Focus will therefore be in the priority areas of

agriculture, infrastructural development, industrialization, investment in human

resource, environmental sustainability, land management, town planning and human

7

settlement, enhancing public private partnership and sustaining achievements made

in social sectors.

8

CHAPTER TWO

FIVE YEAR DEVELOPMENT PLAN OBJECTIVES AND FOCUS

13. The focus of this chapter is on the assumptions underlying macro economic

projections and policy targets for the Five Year Development Plan Framework

(2011/12-2015/16). The emphasis is in line with Vision 2025; Five Year Development

Plan Framework, the CCM Election Manifesto of 2010; the President’s inaugural

speech to the 10th Parliament; MKUKUTA II; Sector policies and other Government

policy directives, including implementation of KILIMO KWANZA and addressing

infrastructure bottlenecks among others, with a view to accelerating economic

growth and reducing poverty.

Macroeconomic Assumptions and Outlook

Key Macroeconomic Assumptions

14. The following are key macroeconomic assumptions underlying macroeconomic

projections and policy targets for the next five years (2011/12 – 2015/16):

(i) Political stability will be sustained including the maintenance of peace, order

and tranquillity;

(ii) Water sources (catchment areas) will be preserved to increase water

accessibility and availability for hydropower generation, irrigation, industrial

and domestic use;

(iii) Macroeconomic stability will continue to be sustained and socio-economic

development will continue to improve;

(iv) Domestic revenue collection will be enhanced to facilitate implementation of

the five year plan framework;

(v) Continue using MKUKUTA II for designing and implementing the Five Year

Development Plan Framework;

(vi) Continue with implementation of 10 pillars of Kilimo Kwanza;

(vii) Promote private sector participation in economic development, including

further improvements in the business environment;

(viii) Monetary and fiscal policies will remain prudent;

(ix) Continued co-operation with development partners; and

(x) Continuing with implementation of the National Identification Project.

9

Targets of Key Economic Activities

Domestic Economy

15. The inadequate short rains in 2010/11 season have caused substantial

reduction in hydro power generation in January and February 2011 and this may

affect GDP growth. The sectors that are likely to be affected most are

manufacturing, trade and repair, agricultural production and Small and Medium-

Sized Enterprises (SMEs). In addition, the soaring oil prices exacerbated by the

arising instability in the Arab Countries are expected to have a negative effect on

economic performance. Consequently, the growth is likely to slow down to 6.8

percent in 2011 from the earlier projected growth of 7.3 percent. This calls for

measures to address the dependence of hydro power generation and rain fed

agriculture.

16. On the assumption of successful implementation of national economic policies

and availability of favourable weather, economic activities are expected to pick up

with real GDP growth projected to increase to 7.5 percent by 2012 as the economy

stabilizes, and continue to grow, reaching an average of 10.0 percent by 2015.

Agriculture

17. During the five year period, growth of the agriculture activity is expected to

pick up to an average of 5.0 percent, mainly on the assumption that agricultural

production will be motivated by the recovery of the world economy. Moreover,

implementation of Kilimo Kwanza programmes (such as road construction, agro

processing, markets improvement, and irrigation), initiatives to establish the

Agricultural Development Bank and the current agricultural lending window at TIB

are expected to boost agriculture performance in the medium term.

Fishing

18. Following Government’s efforts to modernize fishing activities, increased

demand for fish and fish products in both domestic and foreign markets,

implementation of supply-enhancing sector policies, as well as curbing illegal fishing

practices, domestic fish production is expected to rise substantially in the medium

10

term. Fishing activities are projected to pick up and maintain growth rate of around

4.7 percent in the five year plan.

Industry and construction

19. These activities are poised for higher growth, projected to maintain an annual

average growth rate of 9.6 percent in the five year plan. Growth of the activity is

expected to accrue from all its sub-activities, namely mining and quarrying,

manufacturing, electricity and gas, water supply and construction.

20. Manufacturing: In the five year plan, growth of the sub-activity is projected

to pick up emanating from improved power supply, implementation of the Special

Economic Zone (SEZ) programme, implementation of the SME policy including agro

processing and the Tanzania Trade Integrated Strategy (TTIS) and other supportive

trade policies. The target in the medium term is to achieve a growth rate of 12.5 by

2015.

21. Construction: The sub-activity is expected to maintain an annual growth of

above 9.8 percent in the five year plan, largely due to increased infrastructure

developments, including roads and bridges, water supply projects, construction of

power plants, shopping malls, commercial and residential dwellings as well as land

development.

Services

22. The services economic activity is projected to grow at an average of 8.5

percent in the five year plan (2011-2015). This growth is expected to be driven by

increased export promotion initiatives, improvement of standards and capacity of

hotels, improvements and scaling-up of investments in transport and communication

infrastructure. The activity will also be bolstered by expansion of education and

health services, increased demand for financial intermediation in response to growth

of other economic activities in the country, and sustained implementation of public

service and financial sector reforms.

23. Trade and Repairs: The sub-activity is projected to grow at an average of

10.3 percent in the five year plan. The projected growth rate will be largely

11

attributed to increased export promotion initiatives, including SEZ, EPZ and

concessional regional trading arrangements such as EAC and SADC; promotion of

exports through the Export Credit Guarantee Scheme; improved business

environment (facilitated through the BEST programme) and construction of new

shopping centers.

24. Hotels and Restaurants: In the five year plan, the activity is expected to

grow at an average rate of 7.7 percent. This growth is attributed to an increase in

the number of international tourists following recovery from the global financial crisis

and government initiatives to promote domestic tourism and construction of new

hotels.

Figure 1.1: GDP at Constant 2001 Market Prices (Actual and Projection)

15

,96

5

17

,94

1

20

,94

8

24

,78

2

28

,21

3

32

,58

3

37

,01

8

42

,20

1

47

,87

8 54

,43

1 61

,94

9

7.4%

6.7%7.1%

7.4%

6.0%

7.0% 6.8%

7.5%7.8%

8.1%8.5%

0

10,000

20,000

30,000

40,000

50,000

60,000

70,000

0.0%

1.0%

2.0%

3.0%

4.0%

5.0%

6.0%

7.0%

8.0%

9.0%

2005 2006 2007 2008 2009 2010 2011 2012 2013 2014 2015

T

s

h

s

.

B

i

l

l

i

o

n

Year

Total GDP at current market prices GDP by activity at constant 2001 prices

12

Table 2.1: Real GDP Growth (Percentage)

Actual Est. Projection

ECONOMIC ACTIVITY 2006 2007 2008 2009 2010 2011 2012 2013 2014 2015

Agriculture, Hunting and Forestry 3.8 4.0 4.6 3.2 4.1 4.3 4.9 5.1 5.2 5.3

Crops 4.0 4.5 5.1 3.4 4.4 4.8 5.4 5.5 5.6 5.5

Livestock 2.4 2.4 2.6 2.3 2.7 2.3 2.6 3.2 3.4 3.9

Hunting and Forestry 4.6 2.9 3.4 3.5 3.5 3.7 4.4 4.8 5.0 5.6

Fishing 5.0 4.5 5.0 2.7 4.2 4.2 4.6 4.7 4.8 5.2

Industry and construction 8.5 9.5 8.6 7.0 8.0 8.1 9.0 9.8 10.2 11.0

Mining and quarrying 15.6 10.7 2.5 1.2 2.6 3.2 4.1 5.5 6.8 8.3

Manufacturing 8.5 8.7 9.9 8.0 8.7 8.8 10.1 11.3 11.8 12.5

Electricity, gas -1.9 10.9 5.4 8.4 8.8 7.7 8.3 8.3 8.4 8.5

Water supply 6.2 6.5 6.6 5.6 5.0 4.7 4.5 4.4 4.5 5.3

Construction 9.5 9.7 10.5 7.5 8.7 9.2 9.6 9.8 9.6 10.6

Services 7.8 8.1 8.5 7.2 8.1 7.6 8.4 8.5 8.9 9.3

Trade and repairs 9.5 9.8 10.0 7.5 9.0 8.8 10.0 10.4 11.0 11.3

Hotels and restaurants 4.3 4.4 4.5 4.4 5.7 5.9 7.0 7.6 8.4 9.9

Transport 5.3 6.5 6.9 6.0 6.9 6.7 7.5 7.8 8.0 8.5

Communications 19.2 20.1 20.5 21.9 22.1 18.8 19.0 19.0 19.2 19.2

Financial intermediation 11.4 10.2 11.9 9.0 9.7 9.1 9.9 10.0 10.2 10.5

Real estate and business services 7.3 7.0 7.1 6.8 6.1 5.5 5.9 5.7 5.9 6.1

Public administration 6.5 6.7 7.0 4.4 6.0 5.1 4.9 3.4 3.6 3.0

Education 5.0 5.5 6.9 7.1 7.6 7.0 7.8 8.2 8.3 8.6

Health 8.5 8.8 9.0 6.7 7.0 6.8 7.6 8.1 8.2 8.7

Other social and personal services 3.7 3.2 3.1 3.2 3.6 3.5 3.8 3.9 3.9 4.1 Gross value added before adjustments 6.8 7.3 7.5 6.1 7.0 6.9 7.7 8.0 8.3 8.8

less FISIM 14.9 15.3 11.0 8.7 9.0 8.4 9.2 9.3 9.5 9.6 Gross value added at constant basic prices 6.7 7.2 7.4 6.0 7.0 6.9 7.6 7.9 8.3 8.8

add Taxes on products 6.8 6.9 7.8 5.8 6.5 5.7 5.9 5.7 5.4 5.1 GDP at Constant 2001 market prices 6.7 7.1 7.4 6.0 7.0 6.8 7.5 7.8 8.1 8.5

Source: Ministry of Finance

13

Table 2.2: Share to Overall GDP (Percentage)

Actual Est. Projection

ECONOMIC ACTIVITY 2006 2007 2008 2009 2010 2011 2012 2013 2014 2015

Agriculture, Hunting and Forestry 26.2 25.8 25.7 24.6 21.9 21.4 20.8 20.1 19.4 18.7

Crops 19.2 19.0 19.0 18.4 16.7 16.4 16.0 15.5 15.0 14.5

Livestock 4.8 4.7 4.7 4.0 3.4 3.3 3.1 2.9 2.8 2.7

Hunting and Forestry 2.2 2.1 2.0 2.2 1.8 1.7 1.7 1.6 1.6 1.5

Fishing 1.3 1.3 1.2 1.4 1.4 1.4 1.3 1.3 1.2 1.2

Industry and construction 20.8 21.2 21.0 22.0 20.8 21.1 21.2 21.4 21.7 22.0

Mining and quarrying 3.2 3.5 3.4 3.3 2.3 2.2 2.1 2.1 2.0 2.0

Manufacturing 7.8 7.8 7.8 8.6 9.3 9.5 9.7 9.9 10.2 10.5

Electricity, gas 1.5 1.6 1.7 1.7 2.0 2.1 2.1 2.1 2.0 2.0

Water supply 0.4 0.4 0.4 0.4 0.4 0.4 0.4 0.4 0.3 0.3

Construction 7.8 7.8 7.7 7.9 6.7 6.8 6.9 7.0 7.0 7.1

Services 43.3 43.3 43.8 43.6 47.1 47.5 47.5 47.5 47.4 47.5

Trade and repairs 11.4 11.5 11.6 11.8 14.1 14.4 14.6 14.8 15.1 15.4

Hotels and restaurants 2.6 2.7 2.6 2.3 2.2 2.2 2.1 2.1 2.1 2.1

Transport 4.3 4.2 4.2 5.0 4.9 4.9 4.9 4.8 4.8 4.7

Communications 2.1 2.3 2.5 2.1 3.0 3.3 3.6 4.0 4.3 4.7

Financial intermediation 1.7 1.6 1.6 1.7 1.9 2.0 2.0 2.0 2.0 2.1 Real estate and business services 9.6 9.5 9.6 9.0 9.8 9.7 9.5 9.2 9.0 8.7

Public administration 8.0 7.9 8.2 8.1 7.5 7.4 7.2 6.8 6.5 6.1

Education 1.5 1.4 1.3 1.4 1.8 1.8 1.8 1.7 1.7 1.7

Health 1.5 1.6 1.5 1.6 1.4 1.4 1.4 1.4 1.4 1.3 Other social and personal services 0.7 0.6 0.6 0.6 0.6 0.6 0.6 0.5 0.5 0.5 Gross value added before

adjustments 91.7 91.6 91.6 91.6 91.1 91.3 90.8 90.2 89.7 89.3

less FISIM -0.9 -1.0 -1.0 -1.2 -1.2 -1.2 -1.2 -1.2 -1.2 -1.2 Gross value added at constant basic prices 90.7 90.7 90.6 90.4 89.9 90.1 89.6 89.0 88.4 88.1

add Taxes on products 9.3 9.3 9.4 9.6 10.1 9.9 10.4 11.0 11.6 11.9 GDP at Constant 2001 market prices 100 100 100 100 100 100 100 100 100 100

Source: Ministry of Finance

Table 2.3: Nominal and Real GDP (Actual and Projection) Tshs. Million

Calendar Year 2008 2009 2010 2011 2012 2013 2014 2015

GDP at Constant 2001 market

prices 14,828,345

15,721,301

16,813,941

17,954,218 19,304,358 20,808,732 22,500,591 24,419,497

GDP at Current market prices 24,781,679 28,212,646 32,582,866 37,017,509 42,200,512 47,877,662 54,430,570 61,948,870

Fiscal Year 2007/08 2008/09 2009/10 2010/11 2011/12 2012/13 2013/14 2014/15

GDP at Constant 2001 market prices

14,315,133

15,274,823

16,267,621 17,384,079 18,629,288 20,056,545 21,654,662 23,460,044

GDP at Current market prices 22,865,041 26,497,163 30,397,756 34,800,187 39,609,010 45,039,087 51,154,116 58,189,720

Source: Ministry of Finance

14

Macroeconomic Projections and Policy Targets

25. The main objective of the Five year Development Plan Framework will be to

increase growth and reduce poverty. Specifically, the macroeconomic projections

and policy targets for the period 2011/12 – 2015/16 are as follows:

(i) Accelerating economic growth rate so as to be a middle income country by

2025 whose real GDP grow rate will be at an average of 10 percent or more.

Based on the preliminary economic growth rate, it is estimated that, during

the implementation of Five Year Development Plan (2011/12 – 2015/16,

preliminary projection of real GDP growth rate will range between 6.8 and

10.0 percent;

(ii) Maintaining single digit inflation;

(iii) Domestic revenue collection as a ratio to GDP is projected at 16.2 percent in

2011/12; 16.5 percent in 2012/13; 16.9 percent in 2013/14; 17.4 percent in

2014/15 and 17.9 percent in 2015/16; and

(iv) Maintaining adequate official foreign reserves sufficient to cover a minimum of

six months worth of imports of goods and non-factor services.

National Debt 26. In the five year plan, the government will continue to rely primarily on

concessional borrowing to finance the scaling up of spending to address critical

infrastructure gaps. Further, the government projects to use domestic financing of 1

percent of GDP each year and non-concessional external financing of USD 525

million in 2011/12 and USD 450 million in 2012/13 to finance infrastructure projects.

Borrowing decisions will be made within the framework of a sound debt

management strategy and a public investment management process to help

maximize returns on investments. The government will cautiously evaluate and use

non-concessional borrowing for financing key infrastructure projects designed to

ensure efficiency gains. The projects to be implemented include those aimed at

increasing capacity for energy generation, and construction and rehabilitation of

roads and railways that are critical for improving the integration of transportation

networks within the country and in the region. It is also expected that in the medium

term, more infrastructure projects will be developed through the Public Private

Partnership (PPP) arrangements.

15

Strategic Focus for the Five year Plan 27. The Government will focus on selected national priority areas of high impact

which will bring quick results and accelerate economic growth. The priority areas are

divided into five broad interventions as follows:

(i) Sustaining macroeconomic stability: Need to improve macroeconomic

fundamentals including food supply, inflation, GDP growth, and money supply

all of which will bring peace and harmony. Further, good governance will be

emphasized in all sectors in order to speed-up and sustain the economy at

large;

(ii) Improving social services delivery: While sustaining macroeconomic

stability, the achievements recorded in the social sector should be sustained.

In this regards, more emphasis will be put on quality of education, health,

and water services as well as social welfare at all levels;

(iii) Exploiting Natural resources: Tanzania is endowed with various natural

resources such as land, water, minerals (uranium) and natural gas. Medium

term interventions will also focus on the deepening exploitation of these

resources to foster growth;

(iv) Geographical advantage in the region: The strategic location of Tanzania

within the region provides opportunities to become a business center and

transport hub for the great lake countries. The five year development Plan will

put emphasis on improving the ports, construction of railway to standard

gauge, improving trunk roads, the national ICT hub, and improving air

transport services and infrastructure;

(v) Technology and skills development: Intervention areas will focus on

improving technology to facilitate value addition particularly on agro

processing and minerals. Further, skills development and improving science,

technology and use of ICT will be emphasized.

28. MDAs, Regions and LGAs should adhere to the above mentioned pillars during

the preparation and implementation of their plan and budget within the five year

plan framework. Each institution should identify priority areas and align them to the

above pillars. They should also collaborate with other key stakeholders in the

16

preparation and execution of the plan and budget based on priorities set. Consistent

to the above broad interventions, the following are specific national priorities:-

(i) Education a. Improving the quality of education at all levels especially availability of

textbooks, laboratories and school desks. Emphasis should also focus on

people with disabilities;

b. Improving the education and training policy and its strategies including

skills development;

c. Strengthening the financing of higher education; and

d. Improving teachers’ services including housing and incentives.

(ii) Agriculture, Livestock and Fisheries

a. Developing and improving infrastructure for irrigation and livestock use;

b. Increasing availability and utilization of inputs and implements for

agriculture, livestock and fisheries;

c. Strengthening research and extension services;

d. Empowering the private sector to invest in agriculture, livestock and

fishing; and

e. Improving market access and agro-processing.

(iii) Energy a. Increasing level of production of electricity by using different sources of

power;

b. Strengthening and expanding infrastructure for generation, transmission

and distribution of electricity in the country;

c. Continue with studies and exploration of natural gas and oil; and

d. Expanding natural gas infrastructures.

(iv) Transport and Infrastructure Development

a. Construction and rehabilitation of roads, bridges and ferries;

b. Establishment of Road Development Fund and expanding revenue base for

the Road Maintenance Fund;

c. Construction and rehabilitation of Government buildings and houses,

including development of newly established administrative areas (Regions,

17

Districts and LGAs) such as administration blocks, staff houses, police

posts, prisons, courts and hospitals;

d. Construction and rehabilitation of the railways to meet international

standard;

e. Improving air transport services including rehabilitation and construction

of airports; and

f. Construction and rehabilitation of ports and ship assembling.

(v) Industrial Development

a. Developing conducive environment for trade, industrial development and

investments;

b. Facilitating and promoting SMEs technologies by expanding and deepening

of value addition through agro-processing, development of incubator sites

and industrial and trade premises;

c. Intensifying the promotion and development of designated industrial

parks, export processing zones (EPZs) and special economic zones (SEZs),

including pro-identification and provision of prior serviced industrial plots;

d. Facilitating citizens/entrepreneurs to participate in establishing small

industries (SIDO).

(vi) Health a. Enhancing quality of curative, preventive and rehabilitative services at all

levels;

b. Construction and rehabilitation of health facilities at all levels;

c. Improving housing and incentives for public health workers; and

d. Training and recruiting all new medical doctor, nurses and paramedical

graduates.

(vii) Water

a. Implementing Rural Water Supply and Sanitation Programme;

b. Implementing a special program for improving water supply and sewerage

services in Dar es Salaam City;

c. Continue to implement ongoing water projects and facilitate Urban Water

Authorities to control water leakages and rehabilitate water supply

infrastructure; and

18

d. Extending the implementation of Lake Victoria - Shinyanga – Kahama

Water Project to neighboring districts of Nzega, Igunga and Tabora

including villages and townships along the project.

(viii) Lands, Housing and Settlements

a. Establishing the National satellite direct receiving station to facilitate land

use planning;

b. Strengthening and expanding ICT infrastructure for land information

system to facilitate provision of efficient land services including address

and postcode system;

c. Establishment of Mortgage Financing Fund; and

d. To facilitate land surveying, mapping and issuance of title deeds; and

e. Establishment of institution responsible for management of land bank.

(ix) Science and Technology

a. Improving ICT infrastructure and services including completion of the

construction, and create awareness on the use of the national backbone

(optical fibre);

b. Strengthening Science, technology and innovation institutional

infrastructure including technical institutions, Science parks and

incubators; and

c. Enhancing Research and Development (R&D) and commecialization of

research results.

(x) Financial Services

a. Reviewing the micro finance policy and improving provision of credits;

b. Conducting public Education Programs for Financial Markets and promote

citizens’ participation in Dar es salaam Stock Exchange;

c. Improving the management of social security funds with emphasis in

efficient, profitable and risk free investments; and

d. Developing and implementing a comprehensive PFMRP IV Medium Term

Strategic Plan;

e. Conducting public Education Programs on financial services and

enterpreneurship; and

19

f. Establishing regulatory office for micro finance institutions.

(xi) Cross Cutting Issues

a. Improving environmental conservation including legislative enforcement,

public education, and sustainable management of natural resources;

b. Enhancing good governance including rule of law, combating corruption

and improving transparence and accountability at all levels;

c. Promote gender interventions through implementation of gender policy

and elimination of harmful traditional practices and violence against

women and vulnerable groups;

d. Establishment of HIV/AIDS Control Fund and improving interventions at

all levels in line with the National HIV and AIDS Multi-Sectoral Strategic

Framework; and

e. Strengthening the existing economic empowerment initiatives.

29. All MDAs, RSs and LGAs should align and allocate adequate resources for

implementation of the above national priorities in 2011/12.

20

CHAPTER THREE

SPECIFIC ISSUES TO REGIONAL ADMINISTRATION AND

LOCAL GOVERNMENT

Introduction

30. Regional Administration and Local Government are instrumental in translating

the various sectoral plans into actual action at the regional and local government

levels. In this regard, the Chapter provides focus and specific instructions on

planning and budgeting for 2011/12 – 2015/16, as well as resource allocation

interventions.

National Focus during the Five Year Plan

31. During the five year plan, RSs and LGAs will be facilitated to execute their

functions and responsibilities in adherence to the following interventions:

(i) Continue embedding Decentralization by Devolution across Government by

which process at each level of administration will, guided by the principle of

subsidiarity, steadfastly work for transfer of powers, authority, responsibilities

and resources to the people through their democratically instituted LGAs;

(ii) Raising awareness and understanding among the people of Tanzania

concerning their civic rights consistent with the Constitution and respective

laws;

(iii) Undertaking construction and rehabilitation of infrastructural projects and

provision of physical incentives that will serve to attract and retain trained and

qualified staff in local government service and especially in the underserved

parts of the country;

(iv) Widening revenue base and improve tax administration of the LGAs;

(v) Enhancing the capacity of Regional Administration to provide enabling

environment for development agents, including LGAs; and

(vi) Improving public financial management and accountability both at higher and

lower local government levels (Wards, Villages and Mitaa).

21

Regional Administration Focus

32. During the five year plan, Regional Administration will focus on the following

priorities:-

(i) Continuing with maintenance of peace, order and tranquillity in respective

areas of their jurisdiction;

(ii) Reviewing institutional Strategic Plans and Client Service Charters in line with

appropriate national guidelines;

(iii) Improving coordination and supportive supervision of social economic

development within each region;

(iv) Developing proposals on Regional Integrated Development Programmes and

mobilizing potential sources of revenue for alternative financing;

(v) Coordinating interventions aimed at successful implementation of Kilimo

Kwanza in each region, including establishment of agro-mechanization centres

and agro-processing small scale industries;

(vi) Construction and rehabilitation of Regional blocks, District Commissioners

Offices, District Commissioners residences, Division offices and quarters;

(vii) Construction, rehabilitation and equipping regional hospitals;

(viii) Construction of newly established Regions and District offices; and

(ix) Improving monitoring, evaluation and timely reporting of social economic

activities performed by the Government and other stakeholders in their

respective areas of jurisdiction.

Local Government Authorities’ Focus

33. With regard to LGAs’ mandates, their priorities will focus on the following:

(i) Continuing with maintenance of peace, order and tranquillity in respective

areas of their jurisdiction;

(ii) Continue to strengthen Public Financial Management (PFM) at the local level

including the roll-out of Integrated Financial Management System (IFMS) to

the new LGAs;

(iii) Reviewing institutional SPs as well as villages’ O&OD in line with appropriate

national guidelines;

22

(iv) Facilitating implementation of Kilimo Kwanza initiatives in terms of production,

value added processing, storage, transporting, marketing and financing,

among and between various stakeholders;

(v) Construction, rehabilitation and equipping of social economic infrastructure,

including Education (classrooms, houses, laboratories, hostels, offices, latrines

and stores); Water (domestic, industries and irrigation), Health, Agriculture,

Livestock, Fisheries, and Roads, in line with national qualities and standards;

(vi) Preparation of land use plans and demarcation of plots and farms;

(vii) Improving councils’ infrastructures, including ring-roads, sewerage systems,

and parking areas in Dar es Salaam city and Dodoma municipality;

(viii) Strengthening monitoring, evaluation and timely reporting;

(ix) Building capacity of Councillors on their roles and responsibilities;

(x) Strengthening institutional interventions on prevention and combating

corruption;

(xi) Ensuring environmental cleanliness and sanitation;

(xii) Construction of headquarters for the newly established LGAs; and

(xiii) Enhancing conducive business environment (bureaucracy, building permits).

Resource Allocation During the Five Year Plan

34. The Government will continue to allocate resources using the Strategic

Budget Allocation System (SBAS) for Regions, while LGAs will be allocated resources

based on the formula. LGAs are also instructed to exhaust all potential avenues to

increase revenue collection from own sources. In this context therefore, the grant

allocation plus estimated own sources revenue will constitute the resource envelopes

for respective LGAs.

Revenue from Own Sources

35. Following the Government’s commitment to provide improved social and

economic services, LGAs own source will be used for administration and co-financing

of development projects funded by Government subventions. During 2009/10, the

approved budget for all LGAs’ own source revenue was shillings 138.1 billion and the

revenue projection for 2010/11 was shillings 158.8 billion. The trend over the past

three years is shown in table 3.1 below:

23

Table 3.1: Council’s Own Revenues for the period 2007/08 – 2009/10

(Amount in Million Tshs)

Year No. of Councils Estimates Actual %

2007/08 133 80,137.3 79,770.3 99.5

2008/09 133 109,258.0 100.659.0 92.1

2009/10 133 158,108.0 117,783.5 74.5

GRAND TOTAL 133 347,503.3 298,212.8 85.8

36. Given the revenue potentials and opportunities in LGAs’ environment, there

has been underperformance of revenue collections from own sources. Such

performance has led to increased dependency on central Government resources. In

the process of setting revenue targets for 2011/12, LGAs should systematically

conduct intensive SWOT analyses and raise their own sources of revenues as well as

reducing the cost of revenue collection. The findings from such SWOT analysis

should also serve as a baseline in strengthening the sources and establishing a

realistic future focus that will lead to optimum utilization of Councils revenue base.

All LGAs are urged to enforce existing by-laws and/or enact new by-laws as

appropriate, for effective revenue collection.

Inter -Governmental Fiscal Transfers

37. In pursuit of the D by D policy, a number of functions and responsibilities

along with respective budgets have been devolved to LGAs. Likewise, higher levels

of LGAs are obliged to transfer internally funds allocated for implementation of

activities at lower levels (Wards, Villages/Mitaa and Vitongoji), to enable effective

governance and accountability at all levels. Notwithstanding the D by D policy,

Government subventions for implementation of activities and projects under vertical

programmes will continue to be channeled through respective MDAs.

38. During the Five Year Development Plan, LGAs will continue to receive

recurrent block grants for implementing planned activities in all departments as will

be guided by the resource envelope and as passed by the Full Council meeting and

finally approved by the Parliament. In this context, recurrent block grants will be

provided to LGAs in the form of Other Charges (OC). The PE budget will be

allocated based on approved establishment, while the OC budget will be determined

by using the established formula, whose variables reflect service delivery indicators

as shown in the annex.

24

39. With regard to formula allocation system, some LGAs will be given ‘earmarked

resources’ based on specific requirements, such as school meals, special schools and

ration allowances (for fire and rescue services). Each LGA should prepare the PE and

OC budget, forming the recurrent budget, which along with the development budget

section will complete the MTEF document to be submitted to MoF for scrutinization,

consolidation and finally processed for approval by the Parliament.

40. Furthermore, underserved LGAs will be given additional resources depending

on specific problems identified during the Five Year Plan. These include those which

do not attract qualified staff due to some inhibitive factors such as lack of basic

facilities.

Allocation of Resources by Sectors

a) Education Sector

41. The Education Block Grant is provided for effective administration and

delivery of primary, secondary and adult education at the council level, including

school operating costs. The following conditions will guide the use of the education

block grant funds for primary and secondary education during the medium term:-

(i) LGAs should abide by all standards and procedures in the delivery of primary

and secondary education as set forth by the MoEVT;

(ii) Ensure all school-age children are enrolled;

(iii) LGAs should budget a capitation grant for primary schools at an average of

Tshs. 10,000 per enrolled pupil per annum, including those in special schools.

This budget should be used for text books, teaching and learning materials,

maintenance, minor repairs, furniture, and school administration. In this

regard, 40 percent of capitation grant will be earmarked and retained at the

centre for bulky procurement of text books;

(iv) LGAs should budget a capitation grant for secondary schools at an average of

Tsh. 20,000.00 per enrolled day school’s student per annum. This budget

should be used for text books, teaching and learning materials, maintenance,

minor repairs, furniture, and school administration;

25

(v) LGAs should budget an average of Tsh. 1,500.00 per student per school day

for meals in registered boarding (primary and secondary) schools; and

(vi) LGAs should also ensure budgeting and effective collection of Tsh. 20,000.00

for each student enrolled in Day Secondary Schools and Tsh. 70,000.00 for

each student enrolled in Boarding Secondary Schools as part of Capitation

fund from Council own sources through the cost sharing basis.

42. Primary Schools’ Inspectorate Unit: With regard to quality control of

education in primary schools, it has been agreed to transfer the funds for schools

inspection through respective LGAs. The transfers will be done directly to LGAs and

they are to be ring-fenced for this purpose only. LGAs will be provided with a

separate sub-vote for this purpose and allocations of funds under this sub-vote will

be done through the use of Plan-Rep. The funds will be transferred from the Vote of

the MoEVT and will be allocated to LGAs on formula basis.

43. Schools Desks: Available statistics indicate that there is acute shortage of

primary school desks across the country. Total requirement of desks stands at

3,280,619 but there are at present 2,092,498 desks leaving a gap of 1,188,121

desks which is 36.2 percent of the total requirement. It is however, acknowledged

that the situation is more critical in some LGAs than in others. In a bid to arrest the

situation, Regions and LGAs are hereby urged to approach this issue in number of

ways including the following:

(i) To prepare a strategy for financing schools desks for both primary and

secondary schools and thus allocate more funds within their development

budgets for the purpose of systematically addressing this issue;

(ii) To identify areas where the situation is more deplorable and address them in

collaboration with parents / guardians; and

(iii) To mount special national sensitization campaigns country-wide among

parents and guardians of pupils and the communities at large so that the

problem is acknowledged far and wide with a possible result that some of the

economically better off citizens may make voluntary financial contributions for

purchasing school desks for our pupils.

26

44. Development of Sports: The Government has decided to mould young

Tanzanians into sportsmen and sportswomen in primary and secondary schools and

at community level. This is also in realization of the fact that participation in sports

will result into healthy bodies and minds, thus excelling in academics as well. In

realization of the above, it is hereby instructed as follows:

(i) Ensure that all primary and secondary schools have basic sports facilities and

that sports talents among the pupils and youth are identified and developed

quite early in their lives;

(ii) Allocate funds in their budgets for developing sports infrastructure in their

areas of jurisdiction and inculcate the sports culture among the communities;

(iii) Allocate funds that will be encourage communities to establish sports clubs

and champion sportsmanship in their localities taking into consideration

diverse potentialities existing in various parts of the country; and

(iv) Relevant institutions at various levels should provide budgetary allocations for

sports development in schools.

b) Agriculture Sector

45. The Agriculture Block and Livestock Block Grant is provided to enable LGAs to

administer and deliver effective agricultural and livestock extension services and thus

raising productivity and ensuring food security within their areas of jurisdiction. LGAs

should allocate Agriculture Block Grant funds to cover the recurrent cost of providing

basic training and support to the farmers and livestock keepers. The following are

sector specific conditions to guide the allocation of the grant:-

(i) Each LGA should finalise the restructuring process of Agriculture, Livestock

and Cooperative Departments to facilitate allocation of sub-votes;

(ii) LGAs should allocate Agriculture Block Grant funds for execution of agriculture

and livestock extension activities at the Council, Ward and Village levels; and

(iii) LGAs should coordinate all stakeholders in determining priorities for

implementation of Kilimo Kwanza as explained in Chapter Seven (Strategic

Medium Term Objectives and Focus) and ensure effective implementation in

their respective areas of jurisdiction.

27

46. Development activities under the Agriculture Sector Development Programme

(ASDG) at district level are to be implemented by each LGA, based on a District

Agricultural Development Plans (DADP) which is part of the Council Strategic Plan.

During the medium term, the Government will continue to provide the ASDG to LGAs

which include: District Agricultural Development Grant (DADG); Agricultural

Extension Block Grant (A-EBG); and Agricultural Capacity Building Grant (A-CBG).

These agriculture development grants are allocated by formula and disbursed to

LGAs based on performance assessment results, whose resources range between 50

to 100 percent of the resources entitled.

47. The DADG is provided for implementation of community priorities identified in

the DADPs on a cost-sharing basis, with beneficiaries contributing additional labour

and materials in varying proportions, depending on the nature of investments in line

with the LGDG system. These include: rural roads; small-scale irrigation schemes;

group or community productive investments and agricultural inputs (seeds, fertilizers

and agro-chemicals). In addition, LGAs are provided with the A-EBG for funding both

public extension services, as a Government contribution, and for Non State Actors.

The grant is allocated on formula basis and in line with the performance assessment

and conditions as outlined in the 2010 LGDG Assessment Manual.

48. The A-CBG is provided to build capacity of agricultural interventions and

improve the performance criteria in subsequent years. The grant should be used on

improving district agricultural planning, agricultural investment appraisal and review,

agricultural services reform, and enhancing stakeholder engagement. LGAs should

develop a capacity building plan to systematically identify the capacity building

priorities to be funded through the CBG.

c) Works (Road) Sector

49. The Road Block Grant will be provided to cover maintenance of council roads

and meeting the costs of administering the Works Department. According to

restructuring arrangements at LGAs level, the Roads Department should combine

activities provided by the Fire and Rescue Brigade especially in urban areas, in order

to improve working efficiency within areas of their jurisdiction. Each LGAs should use

28

the Road Block Grant funds to cover the cost of maintaining the existing local road

network.

50. With regard to the Road and Fuel Toll Act, CAP 220, the Central Government

is allocated 70 percent of total road fund resources collected and LGAs are allocated

30 percent. In this regard, the formula described above for the Road Block Grant will

be applied in the allocation of ceilings to LGAs for the 30% share from the Roads

Fund. Each LGA will be allocated funds with specific ceilings for “Road Fund

Maintenance Budget”. During budget execution, road funds will be transferred

directly from the Treasury to the respective LGAs, in order to speed up

implementation of planned activities in line with D by D policy.

d) Health Sector

51. The Health Block Grant is provided for the operation and delivery of primary

health care services at council level, including procurement of drugs, medicines and

hospital supplies, as well as health education, immunization and social welfare

services. The grant will be allocated in line with the Comprehensive Council Health

Plan Guidelines (CCHP) based on ‘cost centres’ and types of expenditures.

52. All LGAs are also provided with Health Sector Basket Fund (HSBF) to

supplement the Health Block Grant for the operation and delivery of primary health

care services at council level, including district hospitals, health centres, and

dispensaries, as well as local health programmes, such as immunization and health

education. The HSBF is allocated to LGAs by using the same formula applied for the

Health Block Grant

53. In this regard, the following conditions will guide LGAs in the use of funds

allocated to the Health Department:-

(i) Set performance objectives and targets within the context of the Guidelines

for Preparation of a Comprehensive Council Health Plan, taking into account

interventions, conditions and priorities set in each cost centre;

29

(ii) The OC for DDHs, VAH and other Health Facilities will be financed by the

Government, based on the priority areas of support as approved by the

respective LGAs in the CCHP;

(iii) Purchase additional drugs and medical supplies by using own source revenue

collected from cost sharing arrangements, including the Community Health

Fund and National Health Insurance Fund; and

(iv) Make follow-up on MSD zonal offices and maintain proper accounts for the

drugs and medical supplies received from MSD and the appropriate balances.

e) Water Sector

54. The Water Block Grant is provided for community water schemes, including

the monitoring of local access to potable water and implementation of new local

water schemes for underserved communities. Once development of such schemes is

completed, the actual operation and maintenance of the schemes is to be handed

over to semi-autonomous local water providers, such as user-groups, local water

boards, or incorporated water authorities. Councils should ensure that water users

establish funds for the operation and maintenance of water supply schemes from

user fees or community contributions.

55. Furthermore, LGAs are provided with Water Sector Development Program

(WSDP) in order to strengthen planning, implementation and management of local

projects on water supply and sanitation. The WSDG has been established as a

window of the LGDG system and which consists of “Council Development Grant”

(WSDG-CDG) and “Capacity Building Grant” (WSDP-CBG). The WSDG-CDG funds can

be used for implementation of infrastructures such as drilling of boreholes,

construction of dams, installation of pumps, construction of piped systems, and

construction of demonstration latrines. On the WSDG-CBG side, funds may be used

in strengthening District Water Sanitation Teams (DWSTs), preparation of water

plans and projects, operation and maintenance of offices, monitoring of water

services delivery as well as promoting hygiene and sanitation.

30

56. With regard to Urban Water Authorities, LGAs should mobilize funds and

ensure availability of resources for operation, maintenance and development of

water services in areas of their jurisdiction. For Grade Three Authorities which have

been receiving funds from the Ministry of Water in previous years, should plan on

their own because there will no longer be such funds flowing to them from the

Ministry. Water authorities are encouraged to review their user charges to meet the

increased costs in line with water policies and guidelines.

57. The following instructions should be observed by each LGA in the preparation

of their plans and budgets for the use of the Water Block Grant:

(i) To abide by all standards in the monitoring and support of local water delivery

as set forth by the Ministry of Water;

(ii) Allocate the Water Block Grant funds to cover the recurrent cost of monitoring

access to potable water across the district and the administrative expenses for

implementing new water schemes for underserved communities; and

(iii) Urban councils should use part of the Water Block Grant funds to improve

water access for the underserved population including appropriate modalities

of supplying water to destitute families in their catchment areas.

f) Other Sectors

58. The General Purpose Grant (GPG) together with local own source revenues

are used to finance basic council administration costs, including facilitation of council

meetings. Councils are allowed to use part of GPG funds to mobilize their own

source revenue and provide co-funding for local development projects budgeted

under the LGDG system.

59. Each LGA is also provided with GPG to finance other departments, including

Human Resources Management, Planning and Statistics, Finance and Accounts,

Community Development, Trade, Cooperatives, Natural Resources, Lands, Sports

and Cultural Development and Internal Audit Unit. Councils are obliged to allocate

additional funds from their own source revenue or GPG to those departments and

units, apart from the ceiling provided by the Treasury in order to enhance execution

of their mandated functions.

31

g) Council Multi-Sectoral HIV and AIDS Interventions

60. The National Multi-Sectoral Framework (NMSF) Grant for HIV and AIDS for

the 2011/12 – 2015/16, will be allocated based on the following formula: Population

(70%), the number of poor residents (10%); District Medical vehicle route (10%),

and the council’s estimated HIV and AIDS prevalence rate (10%). LGAs are

responsible for budgeting resources to locally prioritized targets and activities.

61. The following conditions are applicable to LGAs when using the NMSF Grant

for HIV and AIDS interventions:-

(i) Ensure a functioning Council Multi-Sectoral HIV and AIDS Committee;

(ii) To have an existing plan and budget consistent with guidance from TACAIDS,

PMO-RALG and the MoHSW. Priority should be given to support programmes

with a good performance record of reaching PLWHA and their primary carers

within the household and community;

(iii) Ensure that HIV and AIDS targets and activities are developed and coded as

“Objective A”, to enable expenditure tracking. TACAIDS has developed the

“minimum package of interventions” which encompasses key areas, including

prevention, care and impact mitigation activities, as set in the National Multi-

Sectoral Framework of 2008 – 2012; and

(iv) All LGAs are required to submit quarterly HIV and AIDS technical and financial

reports to PMO-RALG for consolidation.

h) Economic Planning and Statistics

62. LGAs will be allocated development funds through the Local Government

Development Grant (LGDG) system as well as parallel project funds coordinated by

national programmes. Through the LGDG System, discretionary Council Development

Grants (CDG) and Capacity Building Grants (CBG) as well as sector-specific

development grants for agriculture (ASDG) and water (WSDG) will be provided. In

this regard, the Government will continue to harmonize sources of development

funds to LGAs so as to have the LGDG system as the main mechanism for

channeling all development funds to LGAs.

32

63. During the Five Year Plan, LGAs will be assessed in nine key areas as

explained in the 2010 Assessment Manual, in order to determine their performance.

LGAs will be classified based on aggregate performance score, and resources will be

allocated between 25 to 100 percent of their entitlements, depending on the

assessment results. LGAs which fail to meet the minimum conditions will receive 25

percent of the entitled LGDG allocation, subject to strict oversight from PMO-RALG

and respective Regional Secretariats.

64. The Council Development Grant (CDG) is provided to enable the LGAs to

construct and rehabilitate infrastructure, according to locally-defined priorities. This

will be guided by a broad investment menu with a view to empowering communities,

improving service delivery and reducing poverty. The CDG will be allocated based

on the following formula: 70 percent for proportion to the population size, 10

percent for proportion to the land area, and 20 percent for proportion to the

estimated number of poor residents in each LGA.

65. Annual assessments that are undertaken under the LGDG system have been

revealing areas of weaknesses in the participating LGAs. All LGAs will be provided

with CBG to address these weaknesses and improve their performance in order to

qualify for receipt of higher amounts of LGDG in the future. Therefore, LGAs are

directed to link their capacity building activities with the weaknesses observed in the

course of undertaking the annual assessment under the LGDG system.

66. With regard to capacity building of LGAs, the Government has decided to use

Hombolo Local Government Training Institute in providing induction and refresher

training courses to various staff cadres of LGAs. PMO-RALG in consultation with the

Hombolo Local Government Training Institute will provide further instructions on the

modality of effecting this decision, including budgetary provision that needs to be

made by individual LGAs.

67. Apart from the LGDG System, some LGAs will receive a variety of other

development funds that will be limited to specific area, programmes, sectors and

purposes. These transfers cover the following, among others:-

33

(i) Participatory Forest Management (PFM);

(ii) District Irrigation Development Fund (DIDF);

(iii) Sustainable Wetland Management (SWM);

(iv) Local Government Transport Programme (LGTP);

(v) Tanzania Social Action Fund (TASAF);

(vi) Child Survival and Development through UNICEF Grant Support;

(vii) One UN Supported Projects from UNDP; and

(viii) Tanzania Strategic Cities (TSC).

68. In general, each of the special development grants is earmarked for specific

purposes and criteria. These development funds should be allocated, planned and

budgeted in accordance with the Local Government Acts as well as relevant financial

management regulations and conditions as determined by the specific sector

ministries, PMO-RALG and MOF. LGAs which receive these special development

grants should consult the appropriate institutions for guidance.

Harmonization of Development Grants

69. There have been numerous development grants and funding sources to LGAs,

with different allocation formulae and conditions that at times confuse LGAs, to the

extent of impinging good governance and accountability. On the other hand,

differences in implementation modalities and conditions such as different

percentages of cash and/or in-kind community contributions, as well as reporting

frameworks have overburdened LGAs from time to time. As a result, a large number

of projects have remained uncompleted and some projects are not reported on time.

In this regard, MoF in collaboration with PMO-RALG will consult stakeholders so that

each grant can progressively be harmonized into the LGDG system.

Overall Budgetary Guidance

70. All Regions and LGAs are expected to observe the following specific

instructions:-

(i) Adherence to the principles of good governance which call for participation,

transparency and accountability;

(ii) Allocate resources for Regional and Districts Courts’ Integrity Committees;

34

(iii) Facilitate construction and rehabilitation of courts’ infrastructures in areas of

jurisdiction;

(iv) Enhancing planning and budgeting capacities of Council, Villages and Mitaa;

(v) Timely submit approved annual plan and budget to PMO-RALG and MOF

through the respective Regional Secretariat;

(vi) LGAs should re-budget funds that remained unspent at the end of the

preceding financial year so that they form part of the budget for the new

financial year;

(vii) Internal Audit Units should be strengthened to carry out their functions

effectively and efficiently;

(viii) Internal staff transfers should be limited to a maximum of 3% of the total

number of employees per annum;

(ix) All LGAs are urged to strictly adhere to the International Public Sector

Accounting Standards (IPSAS); and

(x) Higher LGAs should facilitate Lower LGAs in abiding by procurement

procedures especially for those funds which are disbursed to wards and

villages accounts.

35

CHAPTER FOUR

HUMAN RESOURCE PLANNING AND MANAGEMENT

Introduction

71. Achievement of Tanzania Development Vision 2025 together with MKUKUTA

II, Millennium Development Goals (MDGs) and the success of public sector reforms

depends on effective utilization of human resources. Therefore, consideration of this

component during allocation of resources cannot be over-emphasized if the nation

wants to achieve the well articulated MKUKUTA goals together with Vision 2025.

72. This chapter provides an overview of human resource management and

Remunerations for the public service. Specific emphasis is given to areas of human

resource management, performance management systems, human resource

planning and capacity building, payment systems and rewards. In each area focus

will be on achievements, challenges and the way forward.

Human Resource Planning

73. Human Resource Planning entails determination of HR requirements to meet

current and future job needs. The objective of the Human Resource Planning is to

put in place sufficient number of staff identified within the government and from the

labour market, with right skills, competencies and experience deployed in

appropriate location at an appropriate time to perform their duties effectively and

efficiently. HR Planning is part of MDAs strategic plans in terms of realigning human

resource requirements as inputs in the service delivery matrix. This also entails,

aligning skills requirements to job requirements and potentialities of people already

employed to fill vacant positions as a results of natural attrition in the government.

Therefore, the government has experienced vacancies resulted from natural attrition

and filled through succession planning process or acquisition of new employees from

the labour market.

Achievements

(i) Human Resource Planning Manual has been developed and rolled out to 24

Ministries and 16 Regions;

36

(ii) HR data that will be used in implementing HR planning and specifically

succession planning in all MDAs, RSs and LGAs has been collected; and

(iii) Capacity building measures have been taken as part of HR planning by

enhancing capacity of training Institutions to meet day to day skills

requirement of current and potential government employees. For example

expanded Paramedical schools, Universities, and Agricultural Training

Institutions.

Challenges

(i) Training capacity to cope with service delivery;

(ii) Appropriate training programmes for effective service delivery and career

development; and

(iii) Sustainability of realistic future staffing requirements in line with budget

expenditure limits.

Human Resource Management

74. Human Resource Management entails acquisition of staff to fill vacant position

at appropriate levels, development of staff, taking appropriate steps to ensure

compliance with predetermined standards and rules, motivation of employees and

deployment of staff as, and when required. The Government has strengthened HRM

through the enactment of the Public Service Act, CAP. 298 that devolved powers for

recruitment, discipline, staff development, management of attrition at employer

level. Accountability in terms of staff deployment and utilisation has been reinforced

by routine PE Budgeting processes, allocation of new employees after a permit has

been obtained from Chief Secretary and by routine staff inspections targeted to

assess staff utilisation at various levels.

75. As part of enhancement of HRM, the Government has developed Performance

Management System (PMS) intended to enhance accountability of public servants as

part of HRM in dealing with standards and rules that enhance performance of

individual employees. PMS tools that are in place include; Strategic Plans (SP), Open

Performance Review and Appraisal Systems (OPRAS), Client Service Charter, Service

Delivery Surveys , complemented by a number of legal and quasi-legal Instruments

37

namely the Public Service Act, CAP. 298, the Public Service Regulations, the

Executive Agency Act, CAP. 245, and other Public Service Codes of Good Practice.

76. Salary Administration as of part of HR intervention focuses on three specific

areas, namely;

(i) Determination of appropriate levels of pay based on the schemes of service

profile for relevant carders or posts;

(ii) Reinforcement of accountability, transparency and equality among various

position holders with a view of reflecting hierarchy of authority and

responsibility of each officers in the public service; and

(iii) Payroll integrity in relations to all decisions made regarding payments of

individual salaries based in prevailing financial and HR rules and regulations.

77. Productivity and moral of Public Servants will continue to depend on good

leadership, management, enhanced salary packages and use of incentive in line with

the Public Service Pay and Incentive Policy. Therefore, the Government will continue

to enhance salaries of various technical, professionals and management positions

relative to its labour market comparators. On the other hand, the Government will

continue to carry out assessment of the impact of brain drain to our economy and

take necessary measures to reduce the trend.

Achievements

(i) Recruitment of staff to offer services in the priority sectors (Education, Health

and Agriculture) has been given priority for improved productivity and service

delivery;

(ii) The Public Service Pay and Incentive Policy has been adopted. The thrust of

the policy is to achieve harmonization of pay among public servants,

rationalization of pay and incentive with emphasis on reward packages that

are tied to productivity and retention, as well as enhancement of pay levels

to compensate for inflation and other economic and social factors within the

economy;

(iii) Human resources capacity has been enhanced in LGAs by devolving both

functions and human resource management from MDAs;

38

(iv) Staff inspections carried out in Education, Health, Legal sectors, all Regions,

all District Designated Hospitals (DDH), and Voluntary Agency Hospitals has

enhanced integrity, discipline and accountability in the management of

payroll; and

(v) PMS tools developed are increasingly being adopted and practiced by both

employers and employees as mechanism for enhancing accountability and

productivity in the public service.

Challenges

(i) Effective implementation and compliance of PMS tools, rules and regulations

in the public service;

(ii) Effective deployment and optimal utilization of human capital in the public

service;

(iii) Capacity of training institutions to produce enough experts to join the public

service;

(iv) Attracting and retaining competent personnel from the labour market to join

the public sector;

(v) Disparities of remuneration for equal valued jobs in the public service;

(vi) Setting realistic service standards to meet objectives of Clients Service

Charters;

(vii) Strengthening D by D policy for effective service delivery;

(viii) Integrity of the payroll in MDAs, RSs and LGAs; and

(ix) Integrity, accountability and responsiveness in the public service.

Ethics and Integrity

78. Ethics and integrity are pillars for successful human resources management

and transparency between management and its employees. Integrity is about

adherence to rules and regulations when making decisions, putting public interests

before individual interest in all actions and deeds as well as adoption of value for

money principle in all services rendered.

39

Achievements

(i) Complaints handling mechanism rolled out to 44 MDAs;

(ii) A total of six Zonal Offices of Ethics Secretariat in Dodoma, Tabora, Arusha,

Mtwara, Mwanza and Mbeya have been established; and.

(iii) The Ethics Tribunal has been established and mandated to conduct thorough

inquiry on complaints which establish prima facie case on preliminary

investigation conducted by the Ethics Secretariat.

Challenges

(i) Adherence to Public Service Rules and Regulations;

(ii) Resistance to change; and

(iii) Impartiality in serving the Government of the day by some public servants.

Human Resources Development 79. Efficient public service depends on the interventions made on its employees in

terms of developing staff capacity of those recruited into service based on demands

of schemes of service, job contents of the job holders and skills needed to perform

the job/tasks adequately. Human resources development also involves employees

with career management by ensuring various staff who work in the Government are

promoted or appointed based on position requirements, including qualifications and

experience of relevant employees and availability of approved position and budget.

Achievements

(i) Public Service Training Institutions have been strengthened in order to

develop skills that are needed in the public service. Specific focus has been

given to the establishment of Leadership College, expansion of Teacher

Training Colleges, Health and Agricultural sector Institutions, research and

development institutions as well as development of capacity building and

succession plans;

(ii) Government has continually approved positions and budgets through which

qualified employed have been appointed and promoted to fill vacant

positions; and

(iii) A total of 44 MDAs have been facilitated to conduct training needs

assessments and develop their training programs.

40

Challenges

(i) Capacity of Training Institutions to develop relevant training programs that

contribute to improvement of employees’ skills;

(ii) Transparency in dealing with issues of staff development and promotions;

(iii) Adequate funding of staff development programs; and

(iv) Retention of experience and skilled staff.

Medium Term Focus 80. In all human resources perspectives surrounding each sector and as identified

in the aforementioned challenges, the five years the Human Resource Plan will focus

on the following interventions:

(i) Strengthening skills development to provide human resource base to meet

labour market skills especially science teachers and medical doctors;

(ii) Strengthening capacity of each sector to undertake realistic human resource

plans, human resource development and skill needs analysis to meet

requirement of each sector man power demand;

(iii) Strengthening accountability for employers to enable them pursue effective

policies for utilization of human resource for increased efficiency and

productivity;

(iv) Carry on periodic assessment of the work force to compete in East African

Labour market and where appropriate take necessary measures;

(v) Concentrate resources in developing skills that will be needed to harness the

available economic resources potential specifically in the areas of hospitality

industry, mining, chemical engineering, energy and agro-processing;

(vi) Reduce the degree of brain drain especially in the scientific and technological

professionals through adapting responsive incentive regimes.

(vii) Strengthening capacity of the Ethics Secretariat;

(viii) Enhancing the use of ICT in human resources management of the public

service;

(ix) Continuing with implementation of the National Identification project;

(x) Promote employment opportunities in formal and informal sectors; and

(xi) To finalize the construction of Leadership College.

41

CHAPTER FIVE

RESOURCE ENVELOPE AND EXPENDITURE FRAMEWORK

OF THE FIVE YEAR PLAN 2011/12 – 2015/16

Introduction

81. In the medium term, the Government will continue to focus on sustaining

macroeconomic stability through implementation of prudent monetary and fiscal

policies. Emphasis will be placed on strengthening domestic resource mobilization by

widening the tax base and bringing the informal sector into the tax net, facilitated by

the introduction of national IDs and administrative efforts to manage and control tax

exemptions. Domestic revenue collection (both tax and non-tax) is estimated at

[16.2] percent of GDP in 2011/12 and projected to improve further to reach [17.9]

percent by 2015/16.

82. The Government will enhance efficiency in the use of public funds with

particular emphasis on potential areas for accelerating growth for poverty reduction.

This will be made possible through Government commitment to scale-up

investments, particularly in infrastructure and increasing the share of domestic

revenue in development expenditure. The Government will focus on aligning the

medium term plan and the budget in order to harmonize planning with execution of

the budget. The emphasis of government budget for fiscal year 2011/12 and the

medium term will be on infrastructure investment, while maintaining increased levels

of priority in social spending. Total expenditure is estimated at [30.4] percent of GDP

in 2011/12, out of which 18.7 percent is recurrent and 11.7 percent is development

expenditure. In the five year plan, the Government will scale-up efforts for revenue

collection and contain the growth of recurrent spending to increase domestic saving

for investment spending. Foreign financed development expenditure is assumed to

take a downward trend.

83. Foreign Resources (grants and loans) are set at 11.2 percent of GDP in

2011/12 and are projected to decline to 5.5 percent in 2015/16.The projected

decline is partly attributed to unpredictability of aid flows.

42

2010/11 2010/11 2011/12 2012/13 2013/14 2014/15 2015/16

Budget Likely Outturn Ceiling Projection Projection Projection Projection

I. TOTAL RESOURCES 11,609,557 11,099,140 11,970,356 12,751,733 13,228,417 14,783,869 16,573,834

Domestic revenue 6,003,590 5,629,418 6,396,400 7,355,860 8,459,239 9,812,717 11,382,752

o/w TRA collection 5,652,590 5,313,518 6,045,400 6,952,210 7,995,042 9,194,298 10,573,442

LGAs Own Sources 172,582 172,582 200,195 232,330 272,645 313,541 360,572

Programme loan and grants 821,645 1,056,000 710,659 694,088 712,345 726,591 741,123

Project loans and grants 1,706,370 1,462,700 1,979,780 2,019,376 2,059,764 2,100,959 2,142,978

Basket Support Loans 256,219 246,150 275,803 281,319 286,946 292,685 298,538

Basket Support Grants 221,569 285,400 238,506 243,276 248,141 253,104 258,166

HIPC relief-Multilateral 0 0 0 0 0 0 0

MDRI (IMF) 0 0 0 0 0 0 0

MCC (MCA-T) 268,750 268,750 418,890 186,566 52,254 53,299 54,365

Non Bank Borrowing (Rollover) 797,620 797,620 569,237 605,662 635,945 667,743 701,130

Bank Borrowing 600,000 346,520 393,782 445,101 501,139 563,230 634,209

Adjustment to cash 0 0 0 0 0 0 0

Privatisation Funds 30,000 30,000 0 0 0 0 0

Non-Concessional borrowing 731,212 804,000 787,105 688,154 0 0 0

Financing Gap 0 0 0 0 0 0 0

II. TOTAL EXPENDITURE 11,609,557 11,099,140 11,970,356 12,751,733 13,228,417 14,783,869 16,573,834

RECURRENT EXPENDITURE 7,790,506 7,469,997 7,376,372 8,018,999 8,397,882 9,238,135 10,177,306

CFS 1,756,044 1,484,044 1,416,852 1,551,645 1,617,947 1,705,199 1,793,705

Debt service 1,204,415 1,132,415 889,460 945,607 981,607 1,037,042 1,092,140

Interest 364,470 286,795 259,273 253,244 264,874 282,600 299,975

Amortization 839,946 845,620 630,187 692,363 716,733 754,442 792,164

o/w Rollover 797,620 797,620 569,237 605,662 635,945 667,743 701,130

Others 551,629 351,629 527,392 606,038 636,340 668,157 701,565

Recurrent Exp (excl. CFS) 6,034,462 5,985,953 5,959,520 6,467,354 6,779,934 7,532,936 8,383,601

o/w Salaries & wages 2,205,430 2,363,430 2,480,826 2,670,606 2,756,266 3,097,768 3,488,152

Designated Items 318,454 318,454 332,785 347,760 363,409 381,580 400,659

Parastatal PE 461,371 483,371 518,983 558,685 576,605 648,046 729,714

LGAs Own Sources 172,582 172,582 200,195 232,330 272,645 313,541 360,572

Rescue Package 0 0 0 0 0 0 0

Other Charges 2,876,625 2,648,116 2,426,730 2,657,972 2,811,010 3,092,001 3,404,505

DEVELOPMENT EXPENDITURE 3,819,051 3,629,143 4,593,984 4,732,734 4,830,535 5,545,734 6,396,528

Local 1,366,143 1,366,143 1,681,005 2,002,197 2,183,431 2,845,688 3,642,481

o/w (MCA-T) 0 0 111,694 91,754 0 0 0

Non-Concessional borrowing 1,331,212 1,150,520 1,180,887 1,133,255 501,139 563,230 634,209

Foreign 2,452,908 2,263,000 2,912,979 2,730,537 2,647,104 2,700,046 2,754,047

o/w MCC (MCA-T) 268,750 268,750 418,890 186,566 52,254 53,299 54,365

Table 4.1: BUDGET FRAME FOR 2011/12 - 2015/16 (ACCOUNTING)

In million shillings

43

2010/11 2010/11 2011/12 2012/13 2013/14 2014/15 2015/16

Budget Likely Outturn Ceiling Projection Projection Projection Projection

I. TOTAL RESOURCES 33.4% 32.1% 30.4% 28.6% 26.4% 26.2% 26.1%

Domestic revenue 17.3% 16.3% 16.2% 16.5% 16.9% 17.4% 17.9%

o/w TRA collection 16.3% 15.4% 15.4% 15.6% 16.0% 16.3% 16.7%

LGAs Own Sources 0.5% 0.5% 0.5% 0.5% 0.5% 0.6% 0.6%

Programme loan and grants 2.4% 3.1% 1.8% 1.6% 1.4% 1.3% 1.2%

Project loans and grants 4.9% 4.2% 5.0% 4.5% 4.1% 3.7% 3.4%

Basket Support Loans 0.7% 0.7% 0.7% 0.6% 0.6% 0.5% 0.5%

Basket Support Grants 0.6% 0.8% 0.6% 0.5% 0.5% 0.4% 0.4%

HIPC relief-Multilateral 0.0% 0.0% 0.0% 0.0% 0.0% 0.0% 0.0%

MDRI (IMF) 0.0% 0.0% 0.0% 0.0% 0.0% 0.0% 0.0%

MCC (MCA-T) 0.8% 0.8% 1.1% 0.4% 0.1% 0.1% 0.1%

Non Bank Borrowing (Rollover) 2.3% 2.3% 1.4% 1.4% 1.3% 1.2% 1.1%

Bank Borrowing 1.7% 1.0% 1.0% 1.0% 1.0% 1.0% 1.0%

Adjustment to cash 0.0% 0.0% 0.0% 0.0% 0.0% 0.0% 0.0%

Privatisation Funds 0.1% 0.1% 0.0% 0.0% 0.0% 0.0% 0.0%

Non-Concessional borrowing 2.1% 2.3% 2.0% 1.5% 0.0% 0.0% 0.0%

Financing Gap 0.0% 0.0% 0.0% 0.0% 0.0% 0.0% 0.0%

II. TOTAL EXPENDITURE 33.4% 32.1% 30.4% 28.6% 26.4% 26.2% 26.1%

RECURRENT EXPENDITURE 22.4% 21.6% 18.7% 18.0% 16.8% 16.4% 16.0%

CFS 5.1% 4.3% 3.6% 3.5% 3.2% 3.0% 2.8%

Debt service 3.5% 3.3% 2.3% 2.1% 2.0% 1.8% 1.7%

Interest 1.0% 0.8% 0.7% 0.6% 0.5% 0.5% 0.5%

Amortization 2.4% 2.4% 1.6% 1.6% 1.4% 1.3% 1.2%

o/w Rollover 2.3% 2.3% 1.4% 1.4% 1.3% 1.2% 1.1%

Others 1.6% 1.0% 1.3% 1.4% 1.3% 1.2% 1.1%

Recurrent Exp (excl. CFS) 17.4% 17.3% 15.1% 14.5% 13.5% 13.4% 13.2%

o/w Salaries & wages 6.3% 6.8% 6.3% 6.0% 5.5% 5.5% 5.5%

Designated Items 0.9% 0.9% 0.8% 0.8% 0.7% 0.7% 0.6%

Parastatal PE 1.3% 1.4% 1.3% 1.3% 1.2% 1.2% 1.2%

LGAs Own Sources 0.5% 0.5% 0.5% 0.5% 0.5% 0.6% 0.6%

Rescue Package 0.0% 0.0% 0.0% 0.0% 0.0% 0.0% 0.0%

Other Charges 8.3% 7.7% 6.2% 6.0% 5.6% 5.5% 5.4%

DEVELOPMENT EXPENDITURE 11.0% 10.5% 11.7% 10.6% 9.6% 9.8% 10.1%

Local 3.9% 3.9% 4.3% 4.5% 4.4% 5.1% 5.7%

o/w MCA-T 0.0% 0.0% 0.3% 0.2% 0.0% 0.0% 0.0%

Non-Concessional borrowing 3.8% 3.3% 3.0% 2.5% 1.0% 1.0% 1.0%

Foreign 7.1% 6.5% 7.4% 6.1% 5.3% 4.8% 4.3%

o/w MCC (MCA-T) 0.8% 0.8% 1.1% 0.4% 0.1% 0.1% 0.1%

Table 4.2: BUDGET FRAME FOR 2011/12 - 2015/16 (ACCOUNTING) AS % OF GDP

44

Revenue Policies and Initiatives Domestic Revenue

84. Revenue Policies aim at improving tax administration and maximizing domestic

revenue collection. The Government will undertake various reforms to strengthen

domestic resource mobilization/tax administration and limit tax leakages. This will be

achieved through initiating various reforms in the tax system by focusing, but not

limited to, the following:

(i) Improving tax structure; widening the tax base by bringing the informal

sector into the tax net, implement properties and businesses formalization

programme and implement National Identity Cards);

(ii) Strengthen block management, supervision and managing performance;

(iii) Intensify enforcement of collection of tax arrears and tax compliance;

(iv) Improving tax administration by implementing the Tanzania Revenue

Authority’s Third Five-year Corporate Plan;

(v) Undertake policy reform measures in non tax revenue collection; and

(vi) Improving management and control of tax exemptions.

Foreign Resources

85. The General Budget Support (GBS) continues to be the Government’s

preferred aid delivery modality due to its comparative advantages over other

modalities, in terms of predictability and strengthening Government ownership over

resources allocation across MDA, Regions and LGAs. Despite efforts made by

Government to promote GBS, project and basket funding continued to increase

drastically. The trend of GBS remained at a constant level with an increasing shift

towards sector budget support.

86. Unpredictability of Basket and Project funding modalities poses immense

challenges to the government to strategically planning and effectively prioritizing

development projects. The unpredictability of funds through such modalities is due

to multiple donor conditionality and capacity constraints. The Government continues

to advocate for project funding to be used for large scale infrastructure investment,

piloting and emergency assistance, while Basket funding could be used in transition

period for shifting to GBS.

45

Domestic Financing and Non-concessional Borrowing

87. In the medium term, the government will continue to rely primarily on

concessional borrowing to finance the scaling up of spending to address critical

infrastructure gaps. Further, the government projects to use domestic financing of 1

percent of GDP each year and non-concessional external financing of USD 525

million in 2011/12 and USD 450 million in 2012/13. Borrowing decisions will be made

within the framework of a sound debt management strategy and a public investment

management process to help maximize returns on investments. The government

will cautiously evaluate and use non-concessional borrowing for key infrastructure

projects designed to ensure efficiency gains including those aimed at increasing

capacity for energy generation, and construction and rehabilitation of roads and

railways that are critical for improving the integration of transportation networks

within the country and in the region. It is also expected that in the medium term,

more infrastructure projects will be developed through the Public Private Partnership

(PPP) arrangements.

88. Ceilings for resource allocation for MDAs, Regions and LGAs will be circulated

at a later stage before finalization of the budget. This is to allow all the Development

Partners to firm up their commitments for the next Financial Year before inclusion in

the budget.

46

CHAPTER SIX

PERFORMANCE MONITORING, EVALUATION AND REPORTING SYSTEM

Introduction

89. The Government has been undertaking strategic interventions since financial

year 2007/2008 to improve the performance of MDAs, Regions and LGAs for

increased accountability. A result based Monitoring and Evaluation System as well as

Performance Reporting Framework were put in place to ensure that policies, plans,

programmes and projects are timely executed and tangible results are achieved.

90. During the financial year 2009/10, the Government continued to strengthen

the MDAs, Regions and LGAs in terms of performance monitoring and reporting. This

Chapter highlights major achievements, challenges encountered and the way

forward.

Achievements

(i) In the Road sector, usage of funds was ascertained for the work done in

selected Regions and LGAs. The exercise enabled release of funds to LGAs,

whose roads and bridges were swept away by floods. It was revealed that

rehabilitation was done and certificates for completed works were paid;

(ii) With regard to the education sector, a number of primary and secondary

schools were visited as well as higher learning institutions;

• The exercise was carried out to ascertain the flow of funds from central

Government to Primary and Secondary Schools, and the distribution of

funds among councils and between school as well as private/parents

contributions to the schools.

• In the distribution of funds, it was realised that out of Shs. 544 billion

allocated to primary schools, 87% equal to Shs. 473.0 billion were

released and received by the schools, while secondary education Shs.

156.1 billion were released and received by schools out of Shs. 170.2

billion allocated, equivalent to 91.9%.

47

• Private/Contributions like extra classes apart from school fees end

contributions in kind remain unknown.

(iii) Payroll inspection was carried out in 21 Regions, 132 LGAs, 4 Public

Institutions, 88 Designated District Hospitals (DDHs) and Voluntary Agencies

Hospital (VAHs) whereby Shs. 7.0 billion worth of unclaimed salaries were

recovered and returned to the Treasury. In the same exercise, 9,000 ghost

workers were deleted from the Government Payroll;

(iv) 15 Ministries were trained on Performance Reporting and their annual

performance reports for the year 2009/10 are in place;

(v) LGAs Financial Statements were prepared using International Public Sector

Accounting Standards (IPSAS) and submitted timely to Controller and Auditor

General (CAG);

(vi) Monitoring and Evaluation (M&E) framework for LGAs to track on Local

Government Reform Programme outcomes including D by D was piloted in 15

LGAs;

(vii) Strengthening capacity of M&E sections in all directorates of Policy and

Planning by recruiting requisite staff; and

(viii) Establishment of Internal Audit Department to strengthen Central and Local

Government internal audit functions.

Challenges

(i) Non-existence of M&E Policy including its enforcement and institutional

framework;

(ii) Adherence to harmonized Performance Reporting Framework particularly on

formats;

(iii) Absence of a common base year for Institutional Strategic Plans for the

preparation of three year outcome performance report; and

(iv) Attracting and retaining M&E specialists in the public sector.

48

The Way Forward

91. In the medium term focus, the Government will continue to strengthen

Performance Monitoring, Evaluation and Reporting by undertaking the following:

(i) Harmonizing the existing monitoring systems and software for effective

performance monitoring and reporting;

(ii) Developing monitoring and evaluation policy including enforcement

mechanisms and institutional framework;

(iii) Continuing to strengthen M&E Sections under the Policy and Planning

Divisions/Departments/Units in MDAs, Regions and LGAs including building

capacity of M&E in the public sector;

(iv) Enforcing the use of the Performance Reporting Framework for increased

accountability; and

(v) Enhancing the capacity of MDAs, Regions and LGAs in strategic planning and

budgeting for better results.

Specific Instructions to MDAs, Regions and LGAs

Institutional Strategic Plans

92. In order to address the above challenges, MDAs, Regions and LGAs will be

required to:

(i) Review their Strategic Plans and prepare the Five year Development plans

(2011/12 – 2015/16) in line with the Vision 2025, MDGs, MKUKUTA II Clusters

and Strategies, Ruling Party Election Manifesto of 2010 – 2015, Sectoral

policies and strategies; and

(ii) Develop Outcome Indicators and SMART Targets for attainment of Institutional

Five Year Plan. Results Framework Forms should be filled respectively for three

years and later the harmonization committee will provide Five Years’ forms to

cover the entire plan. This includes Performance Outcome Indicator values and

baseline data for preparation of Three Years Outcome Performance Report.

49

Performance Monitoring and Reporting

(i) For performance monitoring and reporting purposes in year 2011/12, all

MDAs, RSs and LGAs should continue using the current forms as shown in Part

II of these Guidelines. The forms will be reviewed and harmonized by the

Harmonization Committee to suit five year reporting requirement. The

Committee will also look into the newly introduced LGAs reporting forms and

see how they can fit into the rest of the forms and come up with common

forms which will suit everyone's requirement;

(ii) All MDAs, RSs and LGAs are reminded to comply with the Performance

Reporting Framework and ensure timely submission of their reports to PO-

PSM, PMO, and MoF as instructed in part II of these Guidelines;

(iii) All Regions and LGAs should submit additional copy of their reports to PMO-

RALG. Further, LGAs are required to submit such reports to their respective

Regions;

(iv) All Government Agencies are required to submit their performance reports to

their parent Ministries;

(v) Ministries and Regions are reminded to submit Quarterly Progress Reports

in two weeks period after the end of each quarter, and LGAs by 30th of each

month following the end of a quarter; and

(vi) All MDAs, Regions and LGAs are reminded to timely submit their Annual

Performance Reports to PO-PSM, PMO, PMO-RALG and MoF by 1st of October

following completion of each financial year.

50

CHAPTER SEVEN

INSTITUTIONAL RESPONSIBILITIES FOR IMPLEMENTATION OF

THE PLAN AND BUDGET

Introduction

93. This chapter spells out the roles and responsibilities of Accounting Officers as

well as Plan and Budget Committees of respective institutions. It also serves as a

reminder of what need to be adhered to in the preparation and execution of

institutional plans and budgets. The chapter also shows priority areas which must be

adequately financed in the medium term if national priority objectives are to be

realized.

Roles of Accounting Officers in Planning and Execution

94. Accounting Officers have the responsibility of providing leadership in the

entire processes of preparing plans and budgets for their institutions that are in line

with Vision 2025 and MKUKUTA II. They are also obliged to supervise

implementation of the planned activities as well as monitoring and evaluation of the

results. Detailed responsibilities of Accounting Officers are:

(i) To strengthen and build capacity of Plan and Budget Committees in order to

enable them to discharge their duties effectively;

(ii) To ensure that monitoring, evaluation and performance reporting are

conducted on regular basis as a tool for enforcing accountability and control;

(iii) To provide clear guidance on policy priorities to be incorporated in

institutional plans and budgets;

(iv) To facilitate Institutions, Agencies and Independent Departments under their

jurisdiction to prepare their respective MTEF;

(v) To strengthen human resource management in the area of salary

administration and human resource database;

(vi) To scrutinize effectively all payrolls before the payment of salaries every

month;

(vii) To ensure all reforms under their jurisdiction/umbrella are financed and

implemented as planned;

51

(viii) To supervise Government Agencies to become more efficient and abide to the

national policies so as to contribute to the government coffers as appropriate;

(ix) To ensure government regulatory and profit making institutions expenditures

are monitored so as to enable government to accrue revenue from their

surpluses/profits;

(x) To ensure Government Agencies and Independent Departments execute their

plans and budget as per their action plans; and

(xi) To enhance capacity of LGAs in the delivery of public services.

Plan and Budget Committees

95. Plan and Budget Committees are composed of Accounting Officers and all

heads of Departments. The Committees are responsible for planning and managing

budgeting processes. The Committees are therefore responsible for:

(i) Preparing realistic institutional plans and budget including setting of revenue

and expenditure targets as well as allocation of resources;

(ii) Ensuring that all revenues collected and funds allocated are accounted for in

accordance with the Public Finance Act of 2001 and its subsequent

amendments;

(iii) Collaborate with other MDAs who are implementing inter-sectoral

programmes to avoid duplication in resource allocation;

(iv) Ensure Plan and Budget Guidelines instructions are adhered to; and

(v) Ensure performance reports are timely prepared and submitted.

96. Institutions are required to come up with well formulated and focused

budgets aligned with MKUKUTA II cluster strategies. In that regard, MDAs, Regions

and LGAs should be guided by the following checklist:-

(i) Adhere to existing National policies, the Medium Term Plan, Plan and Budget

Guidelines and institutional priorities;

(ii) Ensure that the allocation of resources is properly aligned to implement

aspirations of the CCM Election Manifesto (2010 -2015), President’s 10th

Parliament inaugural speech, MDGs, MKUKUTA II, KILIMO KWANZA, as well

as specific directives issued by the President in your areas;

52

(iii) Prioritize funding of projects with the emphasis to complete the ongoing

projects;

(iv) Adhere to the set ceiling with regard to recurrent and development estimates;

(v) Ensure that there is clear demarcation between Recurrent and Development

Budget and between Ministry, Departments and Agencies so as to avoid

double funding of similar activities;

(vi) Prepare and submit institutional plan and budget that include estimates of

revenue as well as recurrent and development expenditure;

(vii) Ensure that resources are allocated for maintenance of public infrastructures

and equipments;

(viii) In line with Public Private Partnership Act No 18 of 2010, utilize all available

options to attract Public Private Partnership to increase efficiency in

undertaking non-core functions of the government and promoting investment;

(ix) Ensure that Budget submissions for 2011/12 – 2015/16 adhere to the

approved formats and forms contained in Plan and Budget Guidelines Part II

that are dully filled; and

(x) Update plan and budget to accommodate adjustments after budget scrutiny

by the Treasury and Parliamentary Standing Committees and thereafter re-

submit to the Treasury by mid June.

Expenditure Control and Cost Reduction

97. Accounting Officers are obliged to continue maintaining a high degree of

financial discipline and operate within the limits of approved budget. Efforts of

cutting expenditures in procurement of vehicles, seminars and workshops,

employment allowances, travel and government hospitality should be sustained. In

doing so, it will be possible to release resources from these areas and re-direct them

to financing strategic areas. To this end, Accounting Officers should continue to

pursue effective cost-cutting measures in the following areas:-

53

Procurement of Government Vehicles

98. In procuring vehicles, Accounting Officers should observe the specifications

issued by the Government. It should be re-emphasized that, procurement of vehicles

is still subject to the approval by the Prime Minister’s Office. In addition, measures of

cutting down maintenance and running costs of vehicles should also be sustained.

Seminars and Workshops

99. In the FY 2010/11, there has been a notable decline in allocation of resources

to allowance related expenditures. In spite of this improvement, Accounting Officers

are required to continue ensuring that seminars and workshops are curbed and

where necessary should be productivity focused. Public institutions facilities should

continue to be used when conducting seminars and workshops to cut down costs.

Travel Allowances

100. Efforts of scaling down allocation on travel allowances should be sustained.

Expenditures incurred on travel allowances should be only those that have value

addition to the economy.

Furniture

101. Accounting Officers are reminded to procure durable and quality furniture

manufactured using local raw materials. Replacement of furniture and other related

items should be done in such a manner that Government standards are being

observed.

Government Procurement System and Management

102. Accounting Officers are urged to realize value for money in all procurements

by abiding to the Public Procurement Act, 2004 and corresponding Regulations. In

order to speed-up the budget execution at all levels, MDAs, RSs and LGAs should

start the procurement procedures up to awarding stage immediately after the

budget approval instead of commencing the process after the receipt of funds. In

addition, Accounting Officers are obliged to build the capacity of the Procurement

Management Units (PMUs) to efficiently discharge their duties and responsibilities.

54

Similarly, the Public Procurement Regulatory Authority (PPRA) should continue to

oversee effective implementation of the Public Procurement Legislations.

National Priorities for the Five Year Development Plan

103. Accounting Officers should ensure their institutions are aligned to the national

pillars and allocate adequate resources to implement activities identified under

respective national priorities. In particular, the key national priorities in the Five Year

Plan period are as stipulated in Chapter Two. Co

National PPP Policy 104. Accounting Officers should abide to national Public-Private Partnership (PPP)

Policy and strategy during implementation of projects and programmes. This should

be preceded by initial studies in order to identify potential areas of

cooperation/opportunities before involving private sector in implementation.

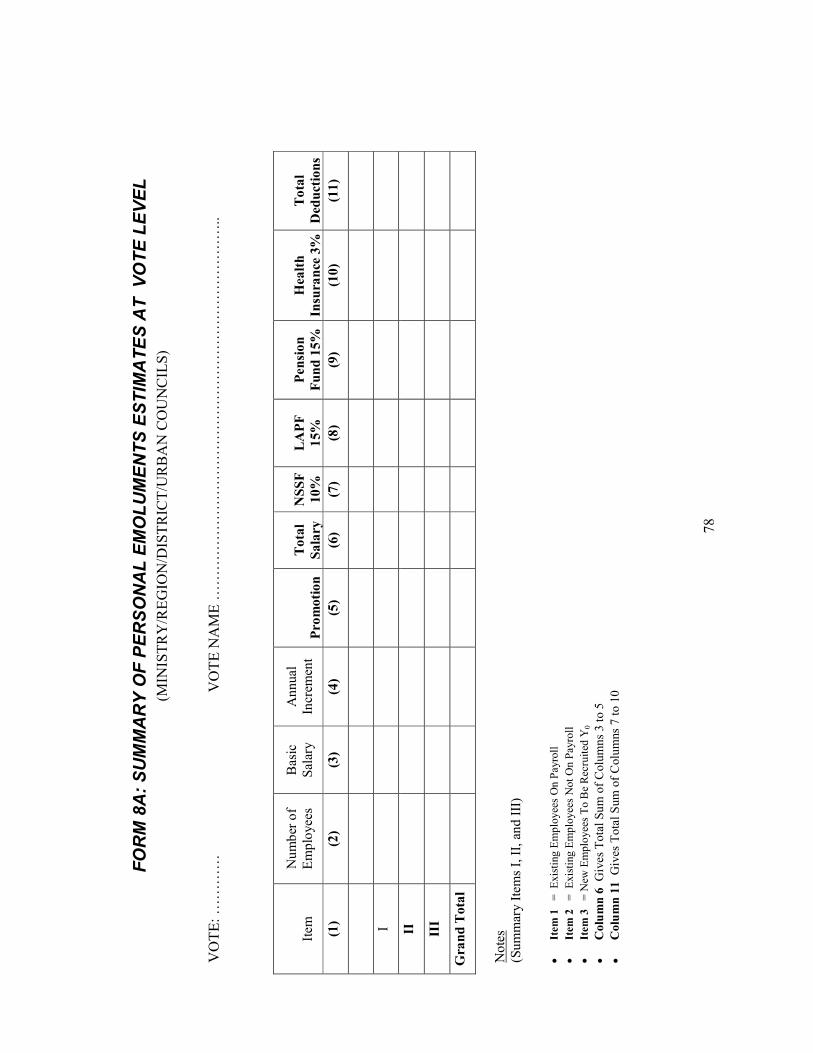
Preparation of Personal Emoluments Budget

105. Preparation of Personal Emoluments (PE) should adhere to guidelines issued

by President’s Office-Public Service Management (PO-PSM) and Treasury Registrar’s

(TR) in the case of Public Institutions. Specifically, MDAs, Regions and LGAs are

therefore required to observe the following:

(i) Before preparing PE budget for FY 2011/12 Accounting Officers should ensure

that their employees’ HR information is validated, approved and computerised

by PO-PSM;

(ii) PE budget for new employees, should be based on establishments approval

granted during PE discussions with PO-PSM and TR;

(iii) PE budget for the existing employees should be prepared by using the March

2011 payroll;

(iv) PE budget should also include statutory contributions to social security funds

including PSPF, LAPF, NSSF, GEPF, NHIF and PPF as appropriate;

(v) MDAs, Regions and LGAs should adhere to PE submission formats shown in

part II of these Guidelines ( i.e. Forms No. 8A-8F and 9);

(vi) Ensure that PE budgets are prepared in consultations with parent ministry;

55

(vii) PE budget for Public Institutions should be submitted to the Treasury

Registrar using Forms No. 8A-8F and 9;

(viii) All Government entities/Agencies should adhere to relevant instructions that

limit them on decision to promote or recruit their employees without approved

budget allocation and also approval to fill vacant position from the President’s

Office-Public Service Management;

(ix) In order to ensure effective wage bill control and monitoring, Public

Institutions/Agencies should submit payroll returns to the Treasury on

quarterly basis;

(x) MDAs should ensure all PE information of Public Institutions and other

Independent Departments falling under their jurisdiction is accurately and

exhaustively captured in their budgets;

(xi) Salary adjustments should be promptly effected to avoid accumulation of

salary arrears;

(xii) Ensure salary claims generated in 2010/11 are budgeted for in 2011/12; and

(xiii) For the purpose of realizing salary integrity and control over PE budget

expenditure, Accounting Officers should undertake constant validation of their

payrolls and those of their respective Executive Agencies and Public

Institutions.

Preparation of Revenue Estimates

106. During the medium term, MDAs, Public Institutions, RSs and LGAs should

adhere to the following:-

(i) Ensure that all sources and potentials of tax and non-tax revenues are

explored to enhance domestic revenue collection;

(ii) Develop comprehensive strategies for revenue collection with realistic

projections;

(iii) Continue to reflect local Government own source of revenues in their

budgets; and

(iv) Public Institutions should disclose and submit their own sources of revenue in

their budgets.

56

Accumulation of debts and stock of arrears

107. Institutions have been accruing debt emanating from contract payment

arrears, employees’ statutory allowances and suppliers, including leave travel,

moving expenses, salaries, and utilities. In this regard, MDAs, Regions and LGAs are

required to:

(i) Continue to clear backlogs of debt including office supplies, employees

statutory requirements and utilities by ensuring that accrued debts are

considered as first charge within the given resource ceiling;

(ii) Accounting Officers should adhere to procurement procedures and ensure

that funds are available before engaging a consultant/contractor/supplier so

as to be consistent with cash budget system; and

(iii) Minimize government guarantees practises to curtail Government expenditure.

Implementation of Institutional Plans and Budgets:

108. It is the role of the Accounting Officer and the Institutional Budget Committee

to coordinate plans and budgets preparation and their implementation. Prior and

during implementation of budget MDAs, Regions and LGAs should undertake the

following:

(i) Prepare action plan, cash flow plan and procurement plan for implementation

of planned interventions for revenue, recurrent and development budgets

according to the format provided in the PBG Part II;

(ii) Take measures that will ensure efficient utilization of public funds;

(iii) Ensure timely commencement of procurement processes for effective budget

execution;

(iv) Ensure that revenue is collected using proper exchequer receipts vouchers

and timely remitted to the Consolidated Fund;

(v) Make follow up to ensure individual plan and budget by Public Institutions and

other Independent Department are executed as planned;

(vi) Ensure that budget is executed as planned, avoid budget deviation resulting

from reallocating funds to non-contingent activities and also avoid applying

for funds outside the approved budget by Parliament;

(vii) Ensure proper management of resources at institutional level and address

weaknesses as pointed out in the Controller and Auditor General’s reports;

57

(iii) Conduct regular staff and payrolls inspections to ascertain their proper

utilization and payroll accuracy and integrity respectively;

(iv) Account for all unclaimed salaries on monthly basis and ensure the sum is

returned to Treasury through depositing the same into designated bank

accounts;

(viii) During the budget submission all arrears accrued to December 2010 should

be submitted to MoF;

(v) All uncommitted funds as of 30th June should be remitted to the Treasury on

1st October of the following financial year;

(vi) Strengthening the Internal Audit Offices at all levels; and

(vii) Improving LGA’s financial management.

Embedding D by D across the Government Structure

109. Implementation of D by D is to be accorded special attention during the five

year plan as clear milestones should be seen to be covered by end of the plan

period. To that end, the structures of ministries will have to be revisited with a view

to determining functions and responsibilities that should be devolved to LGAs along

with human and financial resources. Ministries should indicate in their plans and

budget the current status in embedding D by D in their ministerial activities and

what they plan to do in respect of D by D implementation in their respective sectors.

NACSAP II

110. In promoting good governance the momentum of fighting corruption needs to

be sustained for effective service delivery and efficient use of public resources. All

MDAs, Regions, LGAs and Public Institutions should continue to implement

effectively the government policy of preventing and combating corruption.

Specifically, MDAs, Regions and LGAs should continue undertake the following

activities:

(i) To review and strengthen capacity of the Integrity Committees in respective

institutions and ensure they operate as expected;

58

(ii) To plan and budget for Anti-Corruption interventions;

(iii) To increase efforts in curbing corruption;

(iv) To monitor, evaluate and review the institutional Anti-Corruption action plans

and operational strategies where appropriate; and

(v) To ensure timely submission of quarterly progress reports in accordance with

the NACSAP II.

Gender (Diversity) Responsive Budget

111. The Government is giving more emphasis on Gender Responsive Budget

(GRB). Major key areas for integrating GRB in Planning and Budget system include:

identification of gender articulation gaps in strategic and annual plans, budgeting

tools and medium term frameworks reports; a comprehensive capacity assessment

of planning and budgeting institutions; developing a multi-media and multi-audience

communication strategy to create awareness on GRB; and a review of legal

framework which governs planning and budgeting in Tanzania. Accounting Officers

are urged to:

(i) Strengthen Gender Focal persons to support the integration of GRB in the

Institutional Plans;

(ii) Build capacity of budget and planning officers to identify development

disparities between men and women;

(iii) Allocate resources to activities addressing gender disparities and strengthen

mechanism to monitor, track and evaluate gender indicators; and

(iv) Support affirmative actions geared to women empowerment.

59

PART II

BUDGET SUBMISSION AND REPORTING FORMATS

60

TABLE OF CONTENTS

BUDGET SUBMISSIO FORMS ............................................................................................................ 68

FORM 1: SUMMARY OF ANNUAL AND FORWARD BUDGET ESTIMATES REVENUE, RECURRENT AND DEVELOPMENT ................................................................................................................ 68 FORM 2: RECURRENT EXPENDITURE FORWARD BUDGET (SUMMARY OF PERSONAL EMOLUMENTS

AND OTHER CHARGES AT VOTE LEVEL) ............................................................................ 69 FORM 3A (R): 3 YEAR MTEF TARGET VALUE FORM (RECURRENT EXPENDITURE) .................. 70 FORM 3A (D): 3 YEAR MTEF TARGET VALUE FORM (DEVELOPMENT EXPENDITURE) ............. 71 FORM 3B: ACTIVITY COSTING SHEET ............................................................................... 72 FORM 3C: RECURRENT EXPENDITURE SUMMARY OF DRAFT ESTIMATES ............................. 73 FORM 4: DOMESTIC REVENUE FORWARD BUDGET ............................................................. 74 FORM 5: DOMESTIC REVENUE .......................................................................................... 75 FORM 6: DEVELOPMENT EXPENDITURE DETAILS OF ANNUAL AND FORWARD BUDGET ........ 76 FORM 7B: INSTITUTIONAL RESULTS FRAMEWORK ............................................................. 77 FORM 8A: SUMMARY OF PERSONAL EMOLUMENTS ESTIMATES AT VOTE LEVEL .................. 78 FORM 8B: SUMMARY OF PERSONAL EMOLUMENTS ESTIMATES AT SUBVOTE LEVEL ............. 79 FORM 8C: ITEM 1 - SUMMARY OF EXISTING EMPLOYEES ON PAYROLL ................................ 80 FORM 8D: ITEM II - SUMMARY OF EXISTING EMPLOYEES NOT ON PAYROLL ........................ 81 FORM 8E: ITEM III - SUMMARY OF NEW EMPLOYEES TO BE RECRUITED ............................. 82 FORM. 8F: LIST OF EMPLOYEES TO BE DELETED FROM THE PAYROLL ................................ 83 FORM 9: SCHEDULE OF PERSONAL EMOLUMENTS (ESTABLISHMENT AND STRENGTH) ......... 84 FORM 10A: PROJECT PROFILE DATA FORM ........................................................................ 85 FORM 10B: SUMMARY OF PROJECT FORWARD BUDGET ESTIMATES AT VOTELEVEL (ALL SOURCES) ....................................................................................................................................... 88

OPERATIO AL PLA I G FORMS ................................................................................................... 89

FORM 11A (R): CURRENT YEAR MTEF TARGET VALUE FORM (RECURRENT EXPENDITURE) ... 89 FORM 11A (D) CURRENT YEAR MTEF TARGET VALUE FORM (DEVELOPMENT EXPENDITURE) 90 FORM 11B (R): ANNUAL CASH FLOW PLAN FOR RECURRENT BUDGET (FOR MDAS, REGIONS & COUNCILS) ...................................................................................................................... 91 FORM 11B (D): ANNUAL CASH FLOW PLAN FOR DEVELOPMENT BUDGET (FOR MDAS, REGIONS & COUNCILS) ...................................................................................................................... 92 FORM 14B (R): ANNUAL ACTION PLAN FOR RECURRENT BUDGET FOR THE FY ………. ….. ..... 93 FORM 14B (D): ANNUAL ACTION PLAN FOR THE DEVELOPMENT BUDGET FOR THE FY ………. …….. ....................................................................................................................................... 94

PERFORMA CE REPORTI G FORMS ............................................................................................... 95

FORM 12A: CUMULATIVE QUARTERLY MTEF TARGET MONITORING FORM ........................... 95 FORM 12B: QUARTERLY CUMULATIVE MILESTONE (PRIORITY) MONITORING FORM ............ 96 FORM 12C: OUTCOME INDICATOR MONITORING FORM ..................................................... 97 FORM 13A: QUARTERLY CUMULATIVE FINANCIAL OVERVIEW FORM ................................... 98 FORM 13B: QUARTERLY CUMULATIVE FINANCIAL DETAILED FORM .................................... 99

I TER AL FORMS ................................................................................................................................ 100

FORM 14A: SUMMARY OF THE STRATEGIC PLAN ............................................................... 100

MTEF PRESE TATIO FORMAT (FOR Y0 TO Y0+2) ................................................................... 101

61

112. Part II of the guidelines for preparation of Plan and Budget constitute

standard forms that enables Ministries, Independent Departments and Agencies

(MDAs), Regional Secretariats (RSs) and Local Government Authorities (LGAs) to

prepare, execute and monitor their budgets effectively and efficiently. These forms

have been designed in a participatory way that encompasses various needs and

formats as compiled by the Harmonization Team. The detail information on the use

and submission processes for each form is documented in the Medium Term

Strategic Planning and Budgeting Manual (MTSPBM). In this regards, Part II of the

guidelines for preparation of Plan and Budget provides the following forms into 4

categories namely: Submission; Operational Planning; Performance Reporting; and

Internally Used Form.

Budget Submission Forms

113. During the budget preparation, MDAs, RSs and LGAs are obliged to submit

their MTEF budgets in adherence to the standard format shown at the end of this

guideline (i.e. MTEF Presentation Format). Each institution should provide accurate

and up to date information in order to reflect the true situation to all stakeholders.

Likewise, the following forms should be filled properly and submitted in the MTEF

document:

(i) Form 1: Summary of Annual and Forward Budget Estimates (Revenue,

Recurrent And Development)

(ii) Form 2: Recurrent Expenditure Forward Budget (Summary of Personal

Emoluments and Other Charges at Vote Level)

(iii) Form 3a (R): 3 Year MTEF Target Value Form (Recurrent Expenditure)

(iv) Form 3a (D): 3 Year MTEF Target Value Form (Development Expenditure)

(v) Form 3b: Activity Costing Sheet

(vi) Form 3c: Recurrent Expenditure Summary of Draft Estimates

(vii) Form 4: Domestic Revenue Forward Budget

(viii) Form 5: Domestic Revenue (Details Of Draft Annual Estimates)

(ix) Form 6: Development Expenditure Details Of Annual And Forward Budget

62

(x) Form 7b: Institutional Results Framework

(xi) Form 8a: Summary of Personal Emoluments Estimates at Vote Level

(xii) Form 8b: Summary of Personal Emoluments Estimates at Sub-vote Level

(xiii) Form 8c: Item I - Summary of Existing Employees on Payroll

(xiv) Form 8d: Item II - Summary of Existing Employees Not on Payroll

(xv) Form 8e: Item III - Summary of New Employees to be Recruited

(xvi) Form 9: Schedule Of Personal Emoluments( Establishment And Strength)

(xvii) Form 10a: Project Profile Data Form

(xviii) Form 10b: Summary of Project Forward Budget Estimates Vote (All Sources)

Operational Planning Forms

114. Based on the budget process, MDAs, RSs and LGAs have been preparing

various forms in order to monitor the institutional trends for inflows, outflows and

execution implementation of planned activities. The forms include cash flow and

action plan which are aligned in the current years’ targets set by respective

institution. In this regard, the following forms should be filled properly and

submitted to MoFEA before 15th July in order to be used during the allocation and

release of:

(i) Form 11A (R): Current year MTEF Target Value form (Recurrent Expenditure)

(ii) form 11A (D) current year MTEF target value form (development expenditure)

(iii) Form 11B (R): Annual Cash Flow Plan for the Recurrent Budget

(iv) Form 11B (D): Annual Cash Flow Plan for the Development Budget

(v) Form 14B (R): Annual Action Plan for the Recurrent Budget

(vi) Form 14B (D): Annual Action Plan for the Development Budget

Performance Reporting Forms

115. All MDAs, LGAs and RSs have been reporting on their performance in

compliance with statutory requirements. In order to improve the scope and quality

of the reports and to better link reports to Strategic Plans and the MKUKUTA,

Government institutions are obliged to report, in more detail, on their performance

against plans. In the process of reporting results, the Monitoring and Evaluation

63

(M&E) techniques will be needed to collect, manage, analyze, and interpret data.

This will include the definition of key performance indicators, collection of indicator

data, and the undertaking of analytical or evaluative studies.

116. In addition, performance reporting will go beyond sheets and forms by

requiring Government institutions to prepare more analytical reports. In this context

therefore, Government institutions are required to submit the following performance

reports:

(i) Quarterly Reports on cumulative targets and expenditures, against the

annual plan and budget

(ii) Annual Performance Reports on targets and outcome monitoring, against

the annual plan and budget

(iii) A 3-Year Outcome Evaluation Report against medium term Strategic Plan

objectives and outcomes

Quarterly Progress Reports 117. The Quarterly Progress Report is intended to provide an overview of

implementation progress on a cumulative basis against an institution’s set targets

and budget. The report also provides information on the implementation of a sub-

set of high profile or priority interventions.

118. At mid-year, reports should also focus on budget variations and justifications

for adjustments. The main body of this report should not exceed five pages. The

following three quarterly reports will be produced:

(i) Quarter 1 Progress Report, summarizing implementation during Quarter 1

(ii) Mid Year Progress Report, summarizing cumulative implementation (Quarter 1

+ Quarter 2) together with a focus on budget variations

(iii) Quarter 3 Progress Report, summarizing cumulative implementation (Quarter

1 + Quarter 2 + Quarter 3)

119. In terms of submission and dissemination, Quarterly reports do not have to

be submitted to Parliamentary Committees or disseminated to the public. MDAs and

RSs should submit their reports by the 15th of each month following the end of a

64

given quarter, while LGAs should submit their reports by the 30th of each month

following the end of a given quarter.

STRUCTURE OF THE QUARTERLY REPORT

I. Title/cover page

II. Table of contents III. Main body

• Introduction • Overview of Implementation of Milestones/Priority Interventions: • This Section of the quarterly report describes progress in implementing milestones, which are developed during the planning process. To collect information on the implementation of

milestones the officer responsible for preparing the report should informally interview

implementers (verbally), rather than distribute a form or sheet for them to fill out.

• Issues and Constraints: • During the process of monitoring milestones and targets, issues and constraints should typically be identified. Issues arising may concern, delays in implementation, reduced scope

or quality of outputs, constraints in terms of resource availability, etc. The identification of

issues to be reported is, however, a subjective matter and there will be a need to prioritise

which issues affected the achievement of the set milestones and targets within the specified

period.

• Remedial Actions IV. ** Summary of budget variations and their justification (for Quarter II only) V. Annex and Tables

• Annex 1: Form 12A: Cumulative Quarterly MTEF Target Monitoring Form

• Annex 2: Form 12B: Quarterly Cumulative Milestone (Priority) Form

• Annex 3: Form 13A: Quarterly Cumulative Financial Overview Form

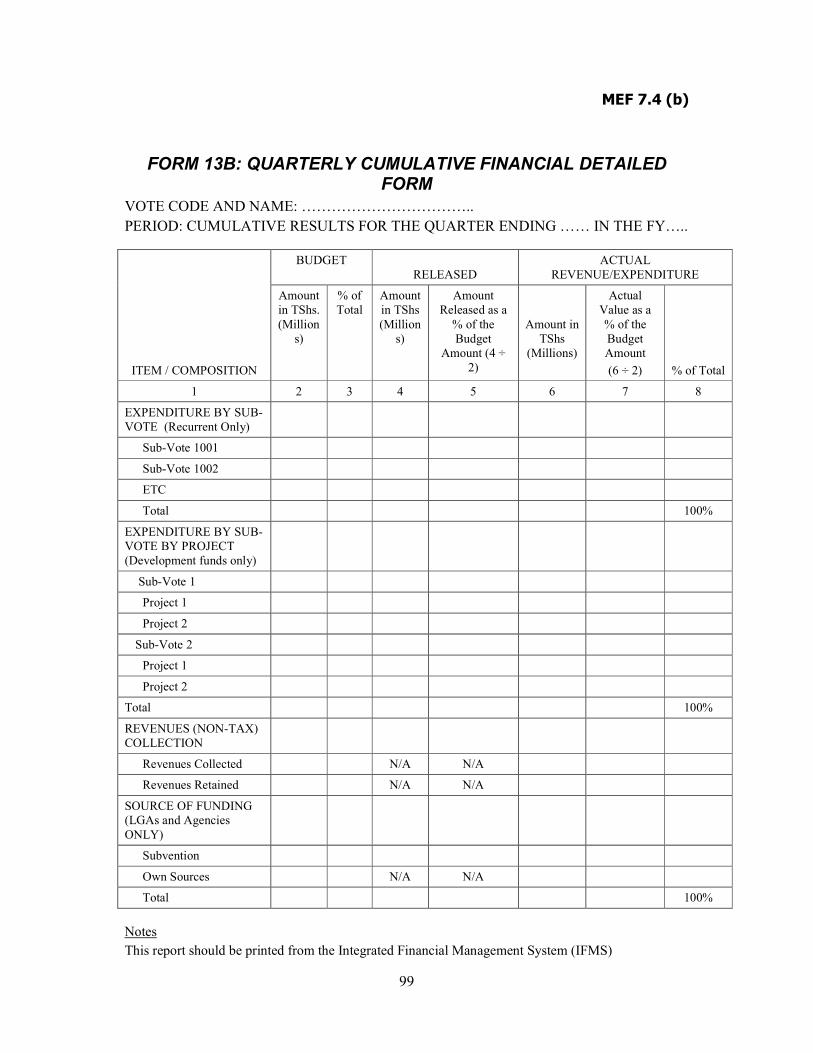
• Annex 4: Form 13B: Quarterly Cumulative Financial Detailed Form

Key: ** included during the mid-year progress report only

The Annual Performance Report 120. The Annual Performance Report is intended to provide a detailed description

of an institution’s main achievements in terms of the targets reached and the

progress realized in improving its service delivery. The report should also address

performance on revenues and expenditures as well as Human Resources status.

Responsibility for the preparation and accuracy of the report lies with the Accounting

Officer for each MDA, RS, and LGA.

121. The report should be prepared and submitted to PO-PSM, PMO, PMO-RALG

(for LGAs and RSs) and MoFEA by the 1st October following the completion of each

financial year. It should also be made available to other stakeholders, including the

the Parliamentary Committees and members of the public (on the institution’s web

65

site or through other relevant media). It is expected that, the main body of this

report will be between 20 and 40 pages. The structure of the Annual Performance

Report should be as shown here under:

Structure of an Annual Performance Report

TITLE/COVER PAGE TABLE OF CONTENTS PREFACE 1. Statement by the Minister/RC/Council Chairperson 2. Statement by the Accounting Officer. 3. Executive Summary MAIN BODY 1. Part 1: Introduction. This should include the following:

• Section 1.1 (Introduction): a short description of the purpose of the report, the approach adopted, and the methods used.

• Section 1.2 (structure) Describe the layout and structure of the remainder of the document. 2. Part II: Overall Performance

• Section 2.1 (Progress towards reaching outcomes): Provides highlights of performance, in words and in a summary indicator table format. Makes reference to a more detailed annex. This should explicitly make reference to progress in meeting MDG, MKUKUTA goals and targets, or ruling party commitments.

• Section 2.2 Progress in improving service delivery (quality, efficiency, timeliness, or satisfaction); discuss what changes have occurred within the organisation to improve the services it provides to its clients. For example, if passports are delivered more quickly, if cost savings have been generated for the taxpayer, etc.

• Section 2.3 (Evaluation and Reviews): Summarizes (very briefly) the results of studies that will be used to prepare the 3-Year Outcome report, and the general progress in terms of evaluation results.

• Section 2.4 Milestones or Priority Interventions: a discussion of interventions that were considered to be critical to achieve overall objectives or ensure effective implementation of the plan.

• Section 2.5 (Issues): Highlight problems or issues, carefully identifying targets at risk or targets which were not met. This may be brief with more details explained in Part III. Describe the actions taken by management to address these problems.

3. Part III: Achievement of Annual Targets. This chapter should be presented on a sub-vote by sub-vote basis. It should provide the written details about each target and what happened during implementation. MKUKUTA, the Performance Assessment Framework (PAF), and Ruling Party targets should be clearly identified. The chapter may also document details about key activities (especially those not implemented) and overview expenditure data on a particular target.

4. Part IV: Financial Performance. This chapter should provide overall aggregate expenditure data compared to budgets as well as revenue collection trends (where applicable). Expenditure information should be derived from the Integrated Financial Management Systems (IFMS) for those who are already using the system.

5. Part V: HR Review. Summarises staffing levels, vacancies, and other key issues including the balance between PE and OC.

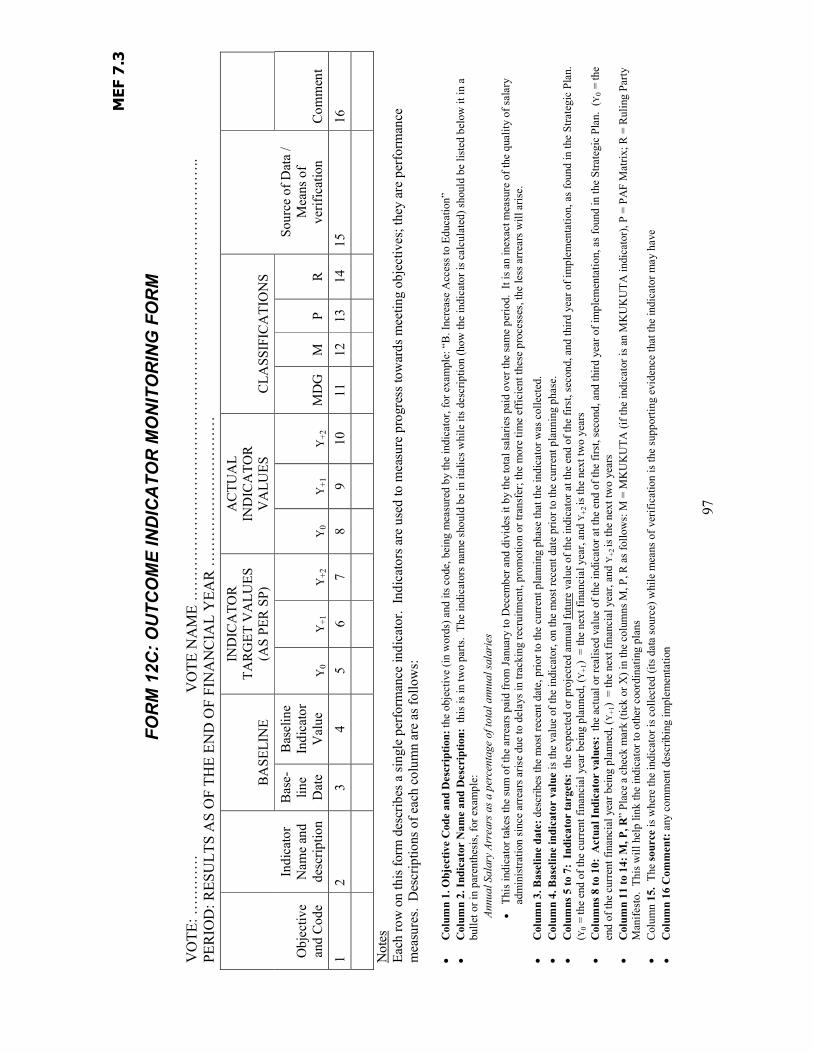
ANNEX and TABLES • Annex 1: Form 12A: Cumulative Quarterly MTEF Target Monitoring Form • Annex 2: Form 12B: Quarterly Cumulative Milestone (Priority) Form • Annex 3: Form 12C: Outcome Indicator Monitoring Form • Annex 4: Form 13A: Quarterly Cumulative Financial Overview Form • Annex 5: Form 13B: Quarterly Cumulative Financial Detailed Form

Three Year Outcome Report 122. The outcome report should be prepared at the end of the Strategic Planning

cycle. It should focus on assessing the degree to which the institution is meeting its

planned objectives or outcomes documented in the Strategic Plan. The report should

summarize the findings of the main evaluations, analytical studies, and reviews

66

undertaken during the period. For each objective the report should describe what

the expected achievements were, how they were measured, and what the main

findings or results of the assessments were. These assessments should be linked to

all national frameworks including MDGs, MKUKUTA and Ruling party Manifesto.

123. The report should be submitted to PO-PSM, PMO, PMO-RALG (for LGAs and

RSs) and MoFEA, by the 1st October following the completion of the Strategic

Planning cycle. As was the case with the Annual Performance Report, the 3-Year

Outcome Report should be made available to stakeholders, including appropriate

Parliamentary Committees and members of the public (on the institution’s web site

or through other relevant media). The structure of the 3-Year Outcome Report is

provided below.

Structure of a Three Year Outcome Performance Report

TITLE/COVER PAGE TABLE OF CONTENTS PREFACE

1. Statement by the Minister/RC/Council Chairperson 2. Statement by the Accounting Officer. 3. Executive Summary

MAIN BODY 1. Part 1: Introduction. This should include the following:

o Section 1.1 Introduction; who is preparing the report, the period it covers, the purpose of the report, the approach adopted, and the methods used.

o Section 1.2 Restatement of the objectives/outcomes from the SP and how they were derived (MKUKUTA linkages, etc).

o Section 1.3 A short description of the approach adopted and broad methods used. o Section 1.4 Limitations, including limitations on the availability of information, (especially baseline

data), problems of attribution, etc. o Section 1.5 The layout and structure of the remainder of the report.

2. Part II: Assessment of progress in meeting each objective: (each objective should constitute a chapter.) Within each chapter there should be the following sections:

EVALUATION OF OBJECTIVE A o Section 2.1 Introduction: Review the objective/outcome and why it is important (i.e. its context). o Section 2.2 Methods: Methods Used to collect data and draw conclusions. This may include:

� Performance against specific indicators for the objective � Surveys of clients satisfaction with the services (quality, timeliness, etc) provided by the

MDA/RS/LGA/other institutions. � Compliance with standards, rules and regulations � Results of other relevant evaluations, studies or surveys (secondary data) prepared by

others � Other methods, where relevant

o Section 2.3 Data and Main Findings � Discuss the data, the results to be inferred from the data and the main conclusions � Are there reasons why objectives may not have been met?

o Section 2.4 Summary: summarise results and focus on the issue of improvement: are things getting better?

REPEAT EVALUATIONS FOR OBJECTIVES, B, C, D, etc.

67

Structure of a Three Year Outcome Performance Report

LIST OF ANNEX:

• Annex 1: Form 12C: Outcome Indicator Monitoring Form • Annex 2: Bibliography • Annex 3: Other Supporting Data

68

Budget Submission Form

s

FO

RM

1:

SU

MM

AR

Y O

F A

NN

UA

L A

ND

FO

RW

AR

D B

UD

GE

T E

ST

IMA

TE

S R

EV

EN

UE

, R

EC

UR

RE

NT

AN

D

DE

VE

LO

PM

EN

T EXPENDITURE ('000 TSHS)

VO

TE

: ……

……

VO

TE

NA

ME

……

……

……

……

……

……

……

……

……

……

……

……

……

……

…..

Des

crip

tio

n

Act

ua

l

Bu

dg

et

Y0-

2

Ap

pro

ved

Bu

dg

et

Est

ima

tes

Y0-

1

An

nu

al

Bu

dg

et

Est

ima

tes

Y

0

Fo

rward

Bu

dg

et

Est

ima

tes

Y0+

1

Fo

rwa

rd B

ud

get

Est

ima

tes

Y0+

2

1

2

3

4

5

6

1.

To

tal

Do

mes

tic

Rev

enu

es

Rec

urr

ent

Ex

pen

dit

ure

PE

OC

2.

To

tal

Rec

urr

ent

Ex

pen

dit

ure

Dev

elo

pm

ent

Ex

pen

dit

ure

G

ovt.

Fund

s

Fore

ign

Fund

s

Oth

er F

unds

3.

To

tal

Dev

elo

pm

ent

Ex

pen

dit

ure

TO

TA

L E

XP

E

DIT

UR

E

o

te:

Tot

al E

xpen

ditu

re =

Tot

al R

ecur

rent

Exp

endi

ture

+ T

otal

Dev

elop

men

t Exp

endi

ture

Not

e:

Item

1: I

n th

e ca

se o

f L

GA

s T

otal

Dom

estic

Rev

enue

mea

n ow

n re

venu

es.

Y0

-2

= 2

Pre

cedi

ng y

ears

(2

year

s ba

ck)

Y0

+1

= F

orw

ard

Bud

get (

Nex

t yea

r)

Y0

-1

= P

revi

ous

year

(la

st F

inan

cial

Yea

r)

Y

0+

2

= F

orw

ard

Bud

get (

next

2 y

ears

)

Y0

=

Cur

rent

Fin

anci

al Y

ear

69

FO

RM

2:

RE

CU

RR

EN

T E

XP

EN

DIT

UR

E F

OR

WA

RD

BU

DG

ET

(S

UM

MA

RY

OF

PE

RS

ON

AL

EM

OL

UM

EN

TS

A

ND

OT

HE

R C

HA

RG

ES

AT

VO

TE

LE

VE

L)

VO

TE

: ……

……

VO

TE

NA

ME

……

……

……

……

……

……

……

……

……

……

……

……

……

……

…..

All

va

lues

in

00

0 T

shs.

Des

crip

tio

n

Act

ua

l

Bu

dg

et

Y0-

2

Ap

pro

ved

Bu

dg

et E

stim

ate

s Y

0-1

An

nu

al

Bu

dg

et E

stim

ate

s

Y0

Fo

rwa

rd B

ud

get

Est

ima

tes

Y0+

1

Fo

rward

Bu

dg

et

Est

ima

tes

Y0+

2

1 2

3 4

5 6

1.

To

tal

Per

son

al

Em

olu

men

t

Oth

er C

ha

rges

Vo

te p

rop

er O

.C

Inte

rna

l

Su

bven

tio

n

PE

OC

Ext

erna

l Sub

vent

ions

2.

To

tal

Oth

er C

ha

rges

G

RA

D

TO

TA

L P

E +

OC

o

te:

Gra

nd T

otal

is e

qual

to T

otal

Per

sona

l Em

olum

ent +

Tot

al O

ther

Cha

rges

70

PB

F 5

.1 (

a)

FO

RM

3A

(R

): 3

YE

AR

MT

EF

TA

RG

ET

VA

LU

E F

OR

M (

RE

CU

RR

EN

T E

XP

EN

DIT

UR

E)

VO

TE

: ……

……

VO

TE

NA

ME

……

……

……

……

……

……

……

……

……

……

……

……

……

……

…..

PE

RIO

D: Q

UA

RT

ER

PR

OJE

CT

ED

RE

SUL

TS

CO

VE

RIN

G T

HE

PE

RIO

D F

RO

M F

INA

NC

IAL

YE

AR

……

…. T

O F

/Y …

SUB

-VO

TE

CO

DE

: ……

……

SUB

-VO

TE

NA

ME

……

……

……

……

……

……

……

……

……

……

……

……

……

……

…..

O

BJE

CT

IVE

CO

DE

AN

D N

AM

E:

CO

DE

S A

ND

LIN

KA

GE

S

C

UM

UL

AT

IVE

ME

ASU

RE

S B

Y Y

EA

R

Tar

get C

ode

M

P

R

T

arge

t Des

crip

tion

(3 y

ear)

U

nits

of

Mea

sure

Y

0 Y

+1

Y+

2

1 2

3 4

5 6

7 8

9

Not

es

Eac

h ro

w o

n th

is f

orm

des

crib

es a

sin

gle

targ

et (

outp

ut).

Des

crip

tions

of

each

col

umn

are

as f

ollo

ws:

Colu

mn

1 T

arg

et C

od

e is

the

Segm

ent 2

cod

e at

the

targ

et le

vel,

for

exam

ple

“A03

C”

Colu

mn

s 2

to 4

(M

, P

, R

)” P

lace

a c

heck

mar

k (t

ick

or X

) in

the

colu

mns

M, P

, R a

s fo

llow

s: M

= M

KU

KU

TA

(if

the

targ

et is

an

MK

UK

UT

A ta

rget

), P

= P

AF

Mat

rix

(if

it is

a P

AF

targ

et);

R =

Rul

ing

Par

ty M

anif

esto

. T

his

will

hel

p lin

k th

e M

TE

F ta

rget

to o

ther

coo

rdin

atin

g pl

ans

Colu

mn

s 5

an

d 6

. T

arg

et D

escr

ipti

on

: A

ll ta

rget

s sh

ould

be

conv

erte

d to

the

end

poin

t of

the

curr

ent 3

yea

r M

TE

F pe

riod

(i.e

. thr

ee y

ears

in a

dvan

ce);

for

exa

mpl

e or

if th

e ta

rget

is

“bui

ld 5

00 k

ilom

etre

s of

roa

d by

30

June

200

9” th

e u

nit

s of

mea

sure

are

“K

ilom

eter

s of

roa

d bu

ilt.”

Colu

mn

s 7

to 9

: C

um

ula

tive

Mea

sure

s b

y y

ear:

is

the

expe

cted

CU

MU

LA

TIV

E le

vel o

f th

e ta

rget

at t

he e

nd o

f th

e up

com

ing

3 fi

nanc

ial y

ears

. Fo

r ex

ampl

e if

the

targ

et is

to b

uild

500

ki

lom

eter

s of

roa

d th

e Y

0 v

alue

may

be

150,

the

Y+

1 va

lue

may

be

400

and

the

Y+

2 va

lue

may

be

500.

71

PB

F 5

.1 (

b)

FO

RM

3A

(D

): 3

YE

AR

MT

EF

TA

RG

ET

VA

LU

E F

OR

M (

DE

VE

LO

PM

EN

T E

XP

EN

DIT

UR

E)

VO

TE

: ……

……

VO

TE

NA

ME

……

……

……

……

……

……

……

……

……

……

……

……

……

……

…..

PER

IOD

: QU

AR

TE

R P

RO

JEC

TE

D R

ESU

LT

S C

OV

ER

ING

TH

E P

ER

IOD

FR

OM

FIN

AN

CIA

L Y

EA

R …

……

. TO

FY

……

PR

OJE

CT

CO

DE

AN

D N

AM

E:

SUB

-VO

TE

CO

DE

: ……

……

SUB

-VO

TE

NA

ME

……

……

……

……

……

……

……

……

……

……

……

……

……

……

…..

OB

JEC

TIV

E C

OD

E A

ND

NA

ME

: N

otes

E

ach

row

on

this

for

m d

escr

ibes

a s

ingl

e ta

rget

(ou

tput

). D

escr

iptio

ns o

f ea

ch c

olum

n ar

e as

fol

low

s:

Colu

mn

1.

Ta

rget

Cod

e is

the

Segm

ent 2

cod

e at

the

targ

et le

vel,

for

exam

ple

“A03

C”

Colu

mn

s 2

to 4

: M

, P

, R

” Pl

ace

a ch

eck

mar

k (t

ick

or X

) in

the

colu

mns

M, P

, R a

s fo

llow

s: M

= M

KU

KU

TA

(if

the

targ

et is

an

MK

UK

UT

A ta

rget

), P

= P

AF

Mat

rix

(if

it is

a P

AF

targ

et);

R =

Rul

ing

Par

ty M

anif

esto

. T

his

will

hel

p lin

k th

e M

TE

F ta

rget

to o

ther

coo

rdin

atin

g pl

ans

Colu

mn

s 5

an

d 6

. T

arg

et D

escr

ipti

on

: A

ll ta

rget

s sh

ould

be

conv

erte

d to

the

end

poin

t of

the

curr

ent 3

yea

r M

TE

F pe

riod

(i.e

. thr

ee y

ears

in a

dvan

ce);

for

exa

mpl

e or

if th

e ta

rget

is

“bui

ld 5

00 k

ilom

etre

s of

roa

d by

30

June

200

9” th

e u

nit

s of

mea

sure

are

“ki

lom

etre

s of

roa

d bu

ilt.”

Colu

mn

s 7

to 9

: C

um

ula

tive

Mea

sure

s b

y y

ear:

is

the

expe

cted

CU

MU

LA

TIV

E le

vel o

f th

e ta

rget

at t

he e

nd o

f th

e up

com

ing

3 fi

nanc

ial y

ears

. Fo

r ex

ampl

e if

the

targ

et is

to b

uild

500

ki

lom

etre

s of

roa

d th

e Y

0 v

alue

may

be

150,

the

Y+

1 va

lue

may

be

400

and

the

Y+

2 va

lue

may

be

500.

CO

DE

S A

ND

LIN

KA

GE

S

C

UM

UL

AT

IVE

ME

ASU

RE

S B

Y Y

EA

R

Tar

get C

ode

M

P

R

T

arge

t Des

crip

tion

(3 y

ear)

U

nits

of

Mea

sure

Y

0 Y

+1

Y+

2

1 2

3 4

5 6

7 8

9

72

FO

RM

3B

: A

CT

IVIT

Y C

OS

TIN

G S

HE

ET

VO

TE

: ……

……

VO

TE

NA

ME

……

……

……

……

……

……

……

……

……

……

……

……

……

……

…..

SUB

-VO

TE

CO

DE

: ……

……

SUB

-VO

TE

NA

ME

……

……

……

……

……

……

……

……

……

……

……

……

……

……

…..

O

BJE

CT

IVE

NO

: …

……

O

BJE

CT

IVE

DE

SCR

IPT

ION

:……

……

……

……

……

……

……

……

……

……

TA

RG

ET

CO

DE

: ……

……

TA

RG

ET

DE

SCR

IPT

ION

:……

……

……

……

……

……

……

……

……

……

……

……

NSG

RP

O

ther

T

ick

(√)

Seg

men

t 2

Per

form

an

ce

Bu

dg

et C

od

e

Seg

men

t 4

(GF

S C

od

e)

Req

uir

ed I

np

uts

An

nu

al

Bu

dg

et

Est

ima

tes

Y

0

Fo

rward

Bu

dg

et

Est

ima

tes

Y0+

1

Fo

rward

Bu

dg

et

Est

ima

tes

Y0+

2

Seg

men

t 4

Des

crip

tio

n

(GF

S C

od

e

Des

crip

tio

n)

Un

it o

f

Mea

sure

Un

it c

ost

of

Inp

uts

o

of

Un

its

Est

ima

tes

o

of

Un

its

Est

ima

tes

o

of

Un

its

Est

ima

tes

1 2

3 4

5 6

7 8

9 10

11

To

tal

TS

hs…

……

……

……

….

Not

es

Colu

mn

1:

Segm

ent 2

incl

udes

obj

ectiv

e, ta

rget

, tar

get t

ype

and

acti

vity

Colu

mn

7 e

qual

s co

lum

n 5

X c

olum

n 6

Colu

mn

9 e

qual

s co

lum

n 5

X c

olum

n 8

Colu

mn

11

equ

als

colu

mn

5 X

col

umn

10

73

FO

RM

3C

: R

EC

UR

RE

NT

EX

PE

ND

ITU

RE

SU

MM

AR

Y O

F D

RA

FT

ES

TIM

AT

ES

VO

TE

: ……

……

VO

TE

NA

ME

……

……

……

……

……

……

……

……

……

……

……

……

……

……

…..

SUB

-VO

TE

CO

DE

: ……

……

SUB

-VO

TE

NA

ME

……

……

……

……

……

……

……

……

……

……

……

……

……

……

…..

Seg

men

t 4

(GF

S C

od

e)

Seg

men

t 4

Des

crip

tio

n (

GF

S

Co

de

Des

crip

tio

n)

Act

ua

l B

ud

get

Y

0-2

Ap

pro

ved

Bu

dg

et

Est

ima

tes

Y0-

1

An

nu

al

Bu

dg

et

Est

ima

tes

Y

0

Fo

rward

Bu

dg

et

Est

ima

tes

Y0+

1

Fo

rwa

rd B

ud

get

Est

ima

tes

Y0+

2

(1)

(2)

(3)

(4)

(5)

(6)

(7)

Not

es

Col

umns

5, 6

and

7 is

a S

umm

ary

of F

orm

No.

3(a

) A

ctiv

ity

Cos

ting

She

et)

74

FO

RM

4:

DO

ME

ST

IC R

EV

EN

UE

FO

RW

AR

D B

UD

GE

T

V

OT

E: …

……

V

OT

E N

AM

E …

……

……

……

……

……

……

……

……

……

……

……

……

……

……

.. SU

B-V

OT

E C

OD

E: …

……

SU

B-V

OT

E N

AM

E …

……

……

……

……

……

……

……

……

……

……

……

……

……

……

..

Seg

men

t 4

(GF

S C

od

e)

Des

crip

tio

n

Act

ua

l C

oll

ecti

on

Y

0-2

Ap

pro

ved

Est

ima

tes

Y0-

1 D

raft

Est

ima

tes

Y

0

Fo

rward

Bu

dg

et

Y0+

1 F

orw

ard

Bu

dg

et

Y0+

2

(1)

(2)

(3)

(4)

(5)

(6)

(7)

To

tal

of

Su

b-V

ote

T

OT

AL

OF

V

OT

E

Not

es:

Y0

=

Cur

rent

Fin

anci

al Y

ear

Y0

+1

= F

orw

ard

Bud

get (

Nex

t yea

r)

Y0

-1

= P

revi

ous

fina

ncia

l yea

r (l

ast F

inan

cial

Yea

r)

Y

0+

2

= F

orw

ard

Bud

get (

next

2 y

ears

)

Y0

-2

= 2

Pre

viou

s ye

ars

(2 y

ears

bac

k)

75

FO

RM

5:

DO

ME

ST

IC R

EV

EN

UE

DE

TA

ILS

OF

DR

AF

T A

UA

L E

ST

IMA

TE

S

VO

TE

: ……

……

VO

TE

NA

ME

……

……

……

……

……

……

……

……

……

……

……

……

……

……

…..

SUB

-VO

TE

CO

DE

: ……

……

SUB

-VO

TE

NA

ME

……

……

……

……

……

……

……

……

……

……

……

……

……

……

…..

Seg

men

t 4

(GF

S C

od

e)

Des

crip

tio

n

Act

ua

l

Co

llec

tio

n

Y0

-2

Act

ua

l

Co

llec

tio

n u

p t

o

Feb

. Y

0-1

Pro

ject

ion

s

Ma

rch

to

Ju

ne,

Y

0-1

Lik

ely

Ou

t-

turn

Ju

ly to

J

un

e Y

0-1

Ap

pro

ved

Est

ima

tes

Y0

-1

Dra

ft

Est

ima

tes

Y0

(1)

(2)

(3)

(4)

(5)

(6)

(7)

(8)

TO

TA

L O

F S

UB

-VO

TE

T

OT

AL

OF

PR

OG

RA

MM

E

Not

es:

Y0

=

Cur

rent

Fin

anci

al Y

ear

Y0

+1

= F

orw

ard

Bud

get (

Nex

t yea

r)

Y0

-1

= P

revi

ous

fina

ncia

l yea

r (l

ast F

inan

cial

Yea

r)

Y

0+

2

= F

orw

ard

Bud

get (

next

2 y

ears

)

Y0

-2

= 2

Pre

viou

s ye

ars

(2 y

ears

bac

k)

76

FO

RM

6:

DE

VE

LO

PM

EN

T E

XP

EN

DIT

UR

E D

ET

AIL

S O

F A

NN

UA

L A

ND

FO

RW

AR

D B

UD

GE

T

V

OT

E: …

……

V

OT

E N

AM

E …

……

……

……

……

……

……

……

……

……

……

……

……

……

……

.. SU

B-V

OT

E C

OD

E: …

……

SU

B-V

OT

E N

AM

E …

……

……

……

……

……

……

……

……

……

……

……

……

..

PRO

JEC

T C

OD

E: …

……

……

….

PR

OJE

CT

NA

ME

: …

……

……

……

……

……

……

……

……

……

O

BJE

CT

IVE

NO

: …

……

O

BJE

CT

IVE

DE

SCR

IPT

ION

:……

……

……

……

……

……

……

……

……

……

TA

RG

ET

CO

DE

: ……

……

TA

RG

ET

DE

SCR

IPT

ION

:……

……

……

……

……

……

……

……

……

……

……

……

NSG

RP

O

ther

T

ick

(√)

(Seg

men

t 2)

Per

form

an

ce

Bu

dg

et C

od

es

Act

ivit

ies

Des

crip

tion

Seg

men

t 4

(GF

S C

od

e)

Seg

men

t 4

(GF

S C

od

e

Des

crip

tion

An

nu

al

Bu

dg

et

Est

ima

tes

Y0

Forw

ard

Bu

dg

et E

stim

ate

s

Y0

+1

F

orw

ard

Bu

dget

Est

ima

tes

Y0

+2

Gover

nm

ent

Fu

nd

s G

over

nm

ent

Fu

nd

s G

over

nm

ent

Fu

nd

s

Loca

l F

ore

ign

L

/G

C/D

D

on

or

Tota

l

Govt.

Fu

nd

L

oca

l F

ore

ign

Tota

l

Govt.

Fu

nd

L

oca

l

Fo

reig

n

Tota

l G

ovt

Fu

nd

(1)

(2)

(3)

(4)

(5)

(6)

(7)

(8)

(9)

(10

) (1

1)

(12)

(13

) (1

4)

(15

) (1

6)

Tota

l of

Ta

rget

Tota

l of

Pro

ject

TO

TA

L O

F S

UB

-VO

TE

Not

es

1.

To

tal

Targ

et i

s S

um

of

all

act

ivit

ies

un

der

a T

arg

et

2.

To

tal

Pro

ject

is

Su

m o

f a

ll t

arg

ets

un

der

a P

roje

ct

3.

To

tal

Su

b-V

ote

is

Su

m o

f a

ll P

roje

cts

un

der

th

e S

ub

-Vo

te

4.

To

tal

Go

vt.

Fu

nd

= L

oca

l fu

nd

+ F

ore

ign

fu

nd

5.

L/G

= L

oa

n/G

ran

t

6.

C/D

= C

ash

/Dir

ect

to p

roje

ct

77

PB

F 4

.2

FO

RM

7B

: IN

ST

ITU

TIO

NA

L R

ES

UL

TS

FR

AM

EW

OR

K

VO

TE

: ……

……

VO

TE

NA

ME

……

……

……

……

……

……

……

……

……

……

……

……

……

……

…..

PER

IOD

: PR

OJE

CT

ED

RE

SUL

TS

CO

VE

RIN

G T

HE

PE

RIO

D F

RO

M F

INA

NC

IAL

YE

AR

……

…. T

O F

INA

NC

IAL

YE

AR

……

Obj

ectiv

e C

ode

and

Des

crip

tion

Indi

cato

r N

ame

and

desc

ript

ion

BA

SEL

INE

IN

DIC

AT

OR

TA

RG

ET

V

AL

UE

S (A

S PE

R S

P)

CL

ASS

IFIC

AT

ION

S

Sour

ce o

f D

ata

/ Mea

ns o

f ve

rifi

catio

n B

asel

ine

Dat

e

Bas

elin

e In

dica

tor

Val

ue

Y0

Y+

1 Y

+2

MD

G

M

P R

1 2

3 4

5 6

7 8

9 10

11

12

Not

es

Eac

h ro

w o

n th

is f

orm

des

crib

es a

sin

gle

perf

orm

ance

indi

cato

r. I

ndic

ator

s ar

e us

ed to

mea

sure

pro

gres

s to

war

ds m

eetin

g ob

ject

ives

; the

y ar

e pe

rfor

man

ce

mea

sure

s. D

escr

iptio

ns o

f ea

ch c

olum

n ar

e as

fol

low

s:

Colu

mn

1.

Ob

ject

ive

Cod

e a

nd

Des

crip

tion

: th

e ob

ject

ive

(in

wor

ds)

and

its c

ode,

bei

ng m

easu

red

by th

e in

dica

tor,

for

exa

mpl

e: “

B. I

ncre

ase

Acc

ess

to E

duca

tion”

Colu

mn

2.

Ind

ica

tor

am

e an

d D

escr

ipti

on

: th

is is

in tw

o pa

rts.

The

indi

cato

rs n

ame

shou

ld b

e in

ital

ics

whi

le it

s de

scri

ptio

n (h

ow th

e in

dica

tor

is c

alcu

late

d) s

houl

d be

list

ed b

elow

it

in a

bul

let o

r in

par

enth

esis

, for

exa

mpl

e: A

nn

ual

Sa

lary

Arr

ears

as

a p

erce

nta

ge

of

tota

l a

nn

ual

sala

ries

Thi

s in

dica

tor

take

s th

e su

m o

f th

e ar

rear

s pa

id f

rom

Jan

uary

to D

ecem

ber

and

divi

des

it b

y th

e to

tal s

alar

ies

paid

ove

r th

e sa

me

peri

od.

The

indi

cato

r is

an

inex

act m

easu

re

of th

e qu

ality

of

sala

ry a

dmin

istr

atio

n si

nce

arre

ars

aris

e du

e to

del

ays

in e

nter

ing

chan

ges

due

to r

ecru

itm

ent,

prom

otio

n or

tran

sfer

; the

mor

e ti

me

effi

cien

t the

se p

roce

sses

, th

e le

ss a

rrea

rs w

ill a

rise

. H

owev

er, a

rrea

rs p

aym

ent t

ends

to b

e "l

umpy

" w

ith p

aym

ents

bei

ng m

ade

acco

rdin

g to

the

avai

labi

lity

of

fund

s. T

his

redu

ces

the

valid

ity

of th

e in

dica

tor

as a

n ef

fici

ency

mea

sure

. T

he d

eriv

atio

n of

targ

ets

assu

med

arr

ear

rate

s fo

r 20

05/0

6 w

ould

be

cut i

n ha

lf.

Colu

mn

3.

Base

lin

e d

ate

: de

scri

bes

the

mos

t rec

ent d

ate,

pri

or to

the

curr

ent p

lann

ing

phas

e th

at th

e in

dica

tor

was

col

lect

ed.

Colu

mn

4.

Base

lin

e in

dic

ato

r valu

e is

the

valu

e of

the

indi

cato

r, o

n th

e m

ost r

ecen

t dat

e pr

ior

to th

e cu

rren

t pla

nnin

g ph

ase.

If

indi

cato

r va

lues

(an

d th

eir

date

) is

not

kno

wn

plac

e a

dash

. •

Colu

mn

s 5

to 7

: I

nd

ica

tor

targ

ets:

th

e ex

pect

ed o

r pr

ojec

ted

annu

al f

utur

e va

lue

of th

e in

dica

tor

at th

e en

d of

the

firs

t, se

cond

, and

thir

d ye

ar o

f im

plem

enta

tion

, as

foun

d in

the

Stra

tegi

c Pl

an.

(Y0

= th

e en

d of

the

curr

ent f

inan

cial

yea

r be

ing

plan

ned,

(Y

+1)

= th

e ne

xt f

inan

cial

yea

r, a

nd Y

+2 is

the

next

two

year

s •

Colu

mn

8 t

o 1

1:

M,

P, R

” P

lace

a c

heck

mar

k (t

ick

or X

) in

the

colu

mns

M, P

, R a

s fo

llow

s: M

= M

KU

KU

TA

(if

the

indi

cato

r is

an

MK

UK

UT

A in

dica

tor)

, P =

PA

F M

atri

x; R

= R

ulin

g Pa

rty

Man

ifes

to.

Thi

s w

ill h

elp

link

the

indi

cato

r to

oth

er c

oord

inat

ing

plan

s •

Colu

mn

12

. T

he s

ou

rce

is w

here

the

indi

cato

r is

col

lect

ed (

its d

ata

sour

ce)

whi

le m

eans

of

veri

fica

tion

is th

e su

ppor

ting

evi

denc

e th

at th

e in

dica

tor

may

hav

e

78

FO

RM

8A

: S

UM

MA

RY

OF

PE

RS

ON

AL

EM

OL

UM

EN

TS

ES

TIM

AT

ES

AT

V

OT

E L

EV

EL

(MIN

IST

RY

/RE

GIO

N/D

IST

RIC

T/U

RB

AN

CO

UN

CIL

S)

VO

TE

: ……

……

VO

TE

NA

ME

……

……

……

……

……

……

……

……

……

……

……

……

…..

Item

N

umbe

r of

E

mpl

oyee

s B

asic

Sa

lary

A

nnua

l In

crem

ent

Pro

moti

on

To

tal

Sa

lary

S

SF

10

%

LA

PF

15%

Pen

sio

n

Fu

nd

15

%

Hea

lth

Insu

ran

ce 3

%

To

tal

Ded

uct

ion

s

(1)

(2)

(3)

(4)

(5)

(6)

(7)

(8)

(9)

(10

) (1

1)

I

II

III

Gra

nd

Tota

l

N

otes

(S

umm

ary

Item

s I,

II,

and

III

)

Item

1 =

Exi

stin

g E

mpl

oyee

s O

n P

ayro

ll

Item

2 =

Exi

stin

g E

mpl

oyee

s N

ot O

n Pa

yrol

l •

Item

3 =

New

Em

ploy

ees

To

Be

Rec

ruite

d Y

0

Colu

mn

6

Giv

es T

otal

Sum

of

Col

umns

3 to

5

Colu

mn

11

Giv

es T

otal

Sum

of

Col

umns

7 to

10

79

FO

RM

8B

: S

UM

MA

RY

OF

PE

RS

ON

AL

EM

OL

UM

EN

TS

ES

TIM

AT

ES

AT

SU

BV

OT

E L

EV

EL

(MIN

IST

RY

/RE

GIO

N/D

IST

RIC

T/U

RB

AN

CO

UN

CIL

S)

VO

TE

: ……

……

VO

TE

NA

ME

……

……

……

……

……

……

……

……

……

……

……

……

……

……

…..

Sub

Vot

e It

em

Num

ber

of

Em

ploy

ees

Bas

ic

Sala

ry

Ann

ual

Incr

emen

t Pr

omot

ion

To

tal

P.E

NSS

F 10

% L

APF

(15

%)

Pens

ion

Fund

15%

Hea

lth

Insu

ranc

e

3%

Tot

al

Ded

uctio

ns

(1)

(2)

(3)

(4)

(5)

(6)

(7)

(8)

(9)

(10

) (1

1)

(12

)

ITE

M I

ITE

M I

I

ITE

M I

II

Su

b T

otal

ITE

M I

ITE

M I

I

ITE

M I

II

Su

b T

otal

Gra

nd T

otal

Not

es

(Sum

mar

y It

ems

I, I

I, a

nd I

II)

For

each

su

b-v

ote

, sum

the

empl

oyee

s an

d P

erso

nal e

mol

umen

ts f

or it

em 1

, ite

m 2

, and

item

3

Item

I =

Exi

stin

g E

mpl

oyee

s O

n Pa

yrol

l •

Item

II

=

Exi

stin

g E

mpl

oyee

s N

ot O

n P

ayro

ll

Item

III

=

New

Em

ploy

ees

To

Be

Rec

ruite

d Y

0

Colu

mn

7

Giv

es th

e to

tal s

um o

f C

olum

ns 4

to 6

Colu

mn

12

G

ives

the

tota

l sum

of

Col

umns

8 to

11

80

FO

RM

8C

: IT

EM

1 -

SU

MM

AR

Y O

F E

XIS

TIN

G E

MP

LO

YE

ES

ON

PA

YR

OL

L

VO

TE

: ……

……

VO

TE

NA

ME

……

……

……

……

……

……

……

……

……

……

……

……

……

……

…..

Su

b-v

ote

u

mb

er o

f

Em

plo

yee

s

Ba

sic

Sa

lary

An

nu

al

Incr

emen

t P

rom

oti

on

T

otal

P.E

NSS

F 10

%

LA

PF

15%

Pen

sio

n

Fu

nd

15

%

Hea

lth

Insu

ran

ce 3

%

Tot

al

Ded

uctio

ns

(1)

(2)

(3)

(4)

(6)

(7)

(8)

(9)

(10

) (1

1)

(12

)

TO

TA

L

N

otes

Colu

mn

7 –

Giv

es th

e T

otal

Sum

of

Col

umns

3 to

6

Colu

mn

12

– G

ives

the

Tot

al S

um o

f C

olum

ns 8

to 1

1

81

FO

RM

8D

: IT

EM

II -

SU

MM

AR

Y O

F E

XIS

TIN

G E

MP

LO

YE

ES

NO

T O

N P

AY

RO

LL

V

OT

E: …

……

V

OT

E N

AM

E …

……

……

……

……

……

……

……

……

……

……

……

……

……

……

..

N

otes

Colu

mn

9 –

Giv

es th

e T

otal

Sum

of

Col

umns

3 to

6

Colu

mn

12

– G

ives

the

Tot

al S

um o

f C

olum

ns 8

to 1

1

Su

b-v

ote

u

mb

er o

f

Em

plo

yee

s

Ba

sic

Sa

lary

An

nu

al

Incr

emen

t

Pro

moti

on

Tot

al P

.E

S

SF

10

%

LA

PF

15%

Pen

sio

n

Fu

nd

15%

Hea

lth

Insu

ran

ce 3

%

Tot

al

Ded

uctio

ns

(1)

(2)

(3)

(4)

(6)

(7)

(8)

(9)

(10)

(1

1 )

(12

)

TO

TA

L

82

FO

RM

8E

: I

TE

M III -

SU

MM

AR

Y O

F N

EW

EM

PL

OY

EE

S T

O B

E R

EC

RU

ITE

D

VO

TE

: ……

……

VO

TE

NA

ME

……

……

……

……

……

……

……

……

……

……

……

……

……

……

…..

Su

b-v

ote

u

mb

er o

f

Em

plo

yee

s B

asi

c S

ala

ry

To

tal

P.E

S

SF

10

%

LA

PF

15%

Pen

sio

n F

un

d

15

%

Hea

lth

Insu

ran

ce 3

%

Tot

al

Ded

uctio

ns

(1)

(2)

(3)

(4)

(5)

(6)

(7)

(8)

(9)

TO

TA

L

N

otes

Colu

mn

4 –

Giv

es th

e T

otal

Sum

equ

als

to C

olum

n 3

Colu

mn

9 –

Giv

es th

e T

otal

Sum

of

Col

umns

5 to

8

83

FO

RM

. 8F

: L

IST

OF

EM

PL

OY

EE

S T

O B

E D

EL

ET

ED

FR

OM

TH

E P

AY

RO

LL

VO

TE

:.................

........

V

OT

E D

ES

CR

IPT

IO

(P

arast

ata

l/M

DA

/RS

/LG

A).

..............

..........................

.........

S/N

o

EM

PLO

YE

ES

' N

AM

E

CH

EC

K N

UM

BE

R

DE

SIG

NA

TIO

N

SA

LAR

Y S

CA

LE

BA

SIC

SA

LAR

Y

RE

AS

ON

FO

R D

ELE

TIO

N

1

2

3

.

.

.

.

.

.

.

.

.

.

.

.

.

84

FO

RM

9:

SC

HE

DU

LE

OF

PE

RS

ON

AL

EM

OL

UM

EN

TS

(E

ST

AB

LIS

HM

EN

T A

ND

ST

RE

NG

TH

)

VO

TE

: ……

……

VO

TE

NA

ME

……

……

……

……

……

……

……

……

……

……

……

……

……

……

…..

SU

B

VO

TE

D

escr

ipti

on

Sa

lary

Sca

le

Tsh

s.

ES

TA

BL

ISH

ME

T

A

ctu

al

Str

ength

at

Pre

sen

t

Va

ria

tio

n

+ O

ver

- U

nd

er

Y0

-2

Y0

-1

Y0

Y

0+

1

Y0

+2

(1)

(2)

(3)

(4)

(5)

(6)

(7)

(8)

(9)

(10

)

Y

0-2

= 2

Pre

cedi

ng y

ears

(2

year

s ba

ck)

Y0

+1

= F

orw

ard

Bud

get (

Nex

t yea

r)

Y0

-1

= P

revi

ous

year

(la

st F

inan

cial

Yea

r)

Y0

+2

= F

orw

ard

Bud

get (

next

2 y

ears

)

Y0

=

Cur

rent

Fin

anci

al Y

ear

85

FORM 10A: PROJECT PROFILE DATA FORM

A1. Vote Name: ____________________________ Vote Code: ___________

A2 Sub vote Name __________________________ Code /__/__/__/__/__/

A3. Project item Number: ___/___/___/___/___/___/

A4. Date this form was completed ___/___/___/___/___/___/___/

(Day/Month/Year) A5. Project Name __________________________________

A6. Vote Name __________________________ Code /___/___/

A7. Is this project recurrent in nature?

Yes ….. 1 No …… 2

A8. Implementation Status of Project: Not started …………………………….. 1 On schedule …………………………… 2 Ahead of schedule …………………….. 3 Behind schedule ………………………. 4 Complete but facility not in use ………. 5 Completed and facility in use ………… 6

(STOP HERE IF YOU HAVE E�TERED CODE 5 OR 6 I� BOX)

A9. Does this Project have feasibility study or project document?

Feasibility study ………..1 Project document ………..2 No Document ……………3

A10. Feasibility study Number of Project __________________

A11. Project document Number _____________________

A12. Project Description( describe major components/activities) A13. MKUKUTA Cluster and cluster strategy closely related to this project Cluster:

Cluster strategy: …………………………….. � MKUKUTA Cluster: prepare box to

choose…………………………………. � MKUKUTA Cluster Strategy

……………………………

A14. Project coverage: National wide (beneficiaries of project in entire Country, or in more than one region) ………………….1 Regional (beneficiaries of project in one Region) ……..2 District (beneficiaries of project in one District) ………3

86

A15. Geographic Location of Project.

(a) Nation wide ………………………… (b) Region Name _________________ (c) District Name _________________ (d) LGA

A16. Type of Implementing (Executing) Agency: Ministry ………1 Parastatal …… …5 Region …….....2 LGA ………….6 Donor …………3 Agency ………..4

A17. Principal Implementing Agency Name ________ Code /__/__/__/

A18. Other Agencies /Collaborators providing critical inputs to project Implementation: ……….,…………..,………..,……..,

A19. Planned Starting date (Month & Year) /__/__/__/__/

A20. Actual Starting Date (Month & Year) /__/__/__/__/

A21. Planned Completion Date (Month & year) /__/__/__/__/

A22. Latest revised completion Date (Month & Year) /__/__/__/

A23 Status of project funding in Development budget

� Adequate Funds included to cover remaining costs

� Inadequate Funds to cover remaining costs

� Adequate Funds outside Government budget exist to cover remaining cost.

SECTIO C: PROJECT FI A CE (EXTER AL O LY) (Please complete this section if project is financed (or to be financed) from external financial sources?

B1 Total Number of Donors for this Project /__/ B2 The Project Funded through Basket funding

Yes

No

87

[O E FORM SHOULD BE COMPLETED FOR EACH DO OR

PROJECT, IF THE PROJECT RECEIVES FU DS FROM MORE

THA O E DO OR AGE CY]

DO OR

B3. Donor 1 Name ______________________________________

B4. Donor 1 Code /___/___/___/

B5. Total Donor Commitments (Tshs.) _______________________

B6. Type of Currency in Agreement ____________

B7. Total Donor Commitment in currency of agreement ____________

B8. Date of Agreement (Month/Year) /__/__/__/__/

B9 Funding Terms Grant …1 Loan ……2

B10 Amount of Grant (Tshs.): ________________________________

B11 Amount of Loan (Tshs.): _________________________________ B12. Type of Disbursement:

Direct ………..1 Cash ………….2

88

FO

RM

10B

: S

UM

MA

RY

OF

PR

OJE

CT

FO

RW

AR

D B

UD

GE

T E

ST

IMA

TE

S A

T V

OT

EL

EV

EL

(A

LL

SO

UR

CE

S)

VO

TE

: ……

……

VO

TE

NA

ME

……

……

……

……

……

……

……

……

……

……

……

……

……

……

…..

DE

VE

LO

PM

E

T E

XP

E

DIT

UR

E (

in ‘

000

Tsh

s)

Ap

pro

ved

Bu

dg

et e

stim

ate

Yo

-1

An

nu

al

Est

ima

te

Yo

Fo

rwa

rd B

ud

get

Est

ima

tes

Yo+

1

Fo

rward

Bu

dg

et

Est

ima

tes

Yo

+2

1 2

3 4

5

A:

Gov

ernm

ent F

unds

: -

Loc

al

-

For

eign

B:

Oth

er S

ourc

es

-

Spec

ial F

unds

-

Ow

n Fu

nds

-

Ban

k L

oans

-

Oth

ers

T

OT

AL

B

UD

GE

T E

ST

IMA

TE

S

89

Operational Planning Form

s

PBF 5.2 (a)

FO

RM

11A

(R

): C

UR

RE

NT

YE

AR

MT

EF

TA

RG

ET

VA

LU

E F

OR

M (

RE

CU

RR

EN

T E

XP

EN

DIT

UR

E)

VO

TE

: ……

……

VO

TE

NA

ME

……

……

……

……

……

……

……

……

……

……

……

……

……

……

…..

PER

IOD

CO

VE

RE

D: F

INA

NC

IAL

YE

AR

……

……

SUB

-VO

TE

CO

DE

: ……

……

SUB

-VO

TE

NA

ME

……

……

……

……

……

……

……

……

……

……

……

……

……

……

OB

JEC

TIV

E C

OD

E A

ND

DE

SCR

IPT

ION

: …

……

……

……

……

……

……

……

……

……

……

……

……

……

……

……

……

……

……

. C

OD

ES

AN

D L

INK

AG

ES

TA

RG

ET

IN

WO

RD

S Q

UA

RT

ER

LY

TA

RG

ET

S FO

R T

HE

CU

RR

EN

T Y

EA

R

Tar

get C

ode

M

P

R

T

arge

t Des

crip

tion

(3 y

ear)

T

arge

t Des

crip

tion

for

the

Cur

rent

Yea

r U

nits

of

Mea

sure

Q

1 Q

2 Q

3 Q

4

1 2

3 4

5 6

7 8

9 10

11

N

otes

E

ach

row

on

this

for

m d

escr

ibes

a s

ingl

e ta

rget

(ou

tput

). D

escr

iptio

ns o

f ea

ch c

olum

n ar

e as

fol

low

s:

Colu

mn

1. T

arg

et C

od

e is

the

Segm

ent 2

cod

e at

the

targ

et le

vel,

for

exam

ple

“A03

C”

Colu

mn

s 2

to 4

: M

, P

, R

” Pl

ace

a ch

eck

mar

k (t

ick

or X

) in

the

colu

mns

M, P

, R a

s fo

llow

s: M

= M

KU

KU

TA

(if

the

targ

et is

an

MK

UK

UT

A ta

rget

), P

= P

AF

Mat

rix

(if

it is

a P

AF

targ

et);

R =

Rul

ing

Par

ty M

anif

esto

. T

his

will

hel

p lin

k th

e M

TE

F ta

rget

to o

ther

coo

rdin

atin

g pl

ans

Colu

mn

5. T

arg

et D

escr

ipti

on

(3

yea

r):

The

targ

et (

in w

ords

) de

scri

bing

the

fina

l sta

te a

t the

end

poi

nt o

f th

e cu

rren

t 3 y

ear

MT

EF

peri

od (

i.e. t

hree

yea

rs in

adv

ance

); f

or e

xam

ple

“bui

ld

500

kilo

met

res

of r

oad

by 3

0 Ju

ne 2

011”

Colu

mn

6. T

arg

et D

escr

ipti

on

(cu

rren

t yea

r):

The

targ

et (

in w

ords

) de

scri

bing

the

fina

l sta

te a

t the

end

poi

nt o

f th

e cu

rren

t yea

r; f

or e

xam

ple

“bui

ld 1

50 k

ilom

etre

s of

roa

d by

30

June

20

09”

Colu

mn

7. U

nit

s of

mea

sure

: how

the

leve

l of

the

targ

et w

ould

be

mea

sure

d, f

or e

xam

ple

“num

ber

of k

ilom

etre

s.”

Colu

mn

s 8

to 1

1:

Cu

mu

lati

ve

Mea

sure

s fo

r ea

ch q

uart

er:

is th

e ex

pect

ed C

UM

UL

AT

IVE

leve

l of

the

targ

et a

t the

end

of

each

qua

rter

in th

e up

com

ing

fina

ncia

l yea

r. F

or e

xam

ple

if

the

targ

et is

to b

uild

150

kil

omet

res

of r

oad

by 3

0 Ju

ne 2

009”

the

quar

terl

y cu

mul

ates

may

be

0, 2

5, 7

5, 1

50.

90

PBF 5.2 (b)

FO

RM

11A

(D

) C

UR

RE

NT

YE

AR

MT

EF

TA

RG

ET

VA

LU

E F

OR

M (

DE

VE

LO

PM

EN

T E

XP

EN

DIT

UR

E)

VO

TE

: ……

……

VO

TE

NA

ME

……

……

……

……

……

……

……

……

……

……

……

……

……

……

…..

PER

IOD

CO

VE

RE

D: F

INA

NC

IAL

YE

AR

……

……

PRO

JEC

T C

OD

E A

ND

NA

ME

: SU

B-V

OT

E C

OD

E A

ND

NA

ME

: O

BJE

CT

IVE

CO

DE

AN

D D

ESC

RIP

TIO

N:

N

otes

E

ach

row

on

this

for

m d

escr

ibes

a s

ingl

e ta

rget

(ou

tput

). D

escr

iptio

ns o

f ea

ch c

olum

n ar

e as

fol

low

s:

Colu

mn

1. T

arg

et C

od

e is

the

Segm

ent 2

cod

e at

the

targ

et le

vel,

for

exam

ple

“A03

C”

Colu

mn

s 2

to 4

: M

, P

, R

” Pl

ace

a ch

eck

mar

k (t

ick

or X

) in

the

colu

mns

M, P

, R a

s fo

llow

s: M

= M

KU

KU

TA

(if

the

targ

et is

an

MK

UK

UT

A ta

rget

), P

= P

AF

Mat

rix

(if

it is

a P

AF

targ

et);

R =

Rul

ing

Par

ty M

anif

esto

. T

his

will

hel

p lin

k th

e M

TE

F ta

rget

to o

ther

coo

rdin

atin

g pl

ans

Colu

mn

5. T

arg

et D

escr

ipti

on

(3

yea

r):

The

targ

et (

in w

ords

) de

scri

bing

the

fina

l sta

te a

t the

end

poi

nt o

f th

e cu

rren

t 3 y

ear

MT

EF

peri

od (

i.e. t

hree

yea

rs in

adv

ance

); f

or e

xam

ple

“bui

ld

500

kilo

met

res

of r

oad

by 3

0 Ju

ne 2

011”

Colu

mn

6. T

arg

et D

escr

ipti

on

(cu

rren

t yea

r):

The

targ

et (

in w

ords

) de

scri

bing

the

fina

l sta

te a

t the

end

poi

nt o

f th

e cu

rren

t yea

r; f

or e

xam

ple

“bui

ld 1

50 k

ilom

etre

s of

roa

d by

30

June

20

09”

Colu

mn

7. U

nit

s of

mea

sure

: how

the

leve

l of

the

targ

et w

ould

be

mea

sure

d, f

or e

xam

ple

“num

ber

of k

ilom

etre

s.”

Colu

mn

s 8

to 1

1:

Cu

mu

lati

ve

Mea

sure

s fo

r ea

ch q

uart

er:

is th

e ex

pect

ed C

UM

UL

AT

IVE

leve

l of

the

targ

et a

t the

end

of

each

qua

rter

in th

e up

com

ing

fina

ncia

l yea

r. F

or e

xam

ple

if

the

targ

et is

to b

uild

150

kil

omet

res

of r

oad

by 3

0 Ju

ne 2

009”

the

quar

terl

y cu

mul

ates

may

be

0, 2

5, 7

5, 1

50.

PBF 6.2 (a)

CO

DE

S A

ND

LIN

KA

GE

S T

AR

GE

T I

N W

OR

DS

QU

AR

TE

RL

Y T

AR

GE

TS

FOR

TH

E C

UR

RE

NT

YE

AR

Tar

get C

ode

M

P

R

T

arge

t Des

crip

tion

(3 y

ear)

T

arge

t Des

crip

tion

for

the

Cur

rent

Yea

r U

nits

of

Mea

sure

Q

1 Q

2 Q

3 Q

4

1 2

3 4

5 6

7 8

9 10

11

91

FO

RM

11B

(R

): A

NN

UA

L C

AS

H F

LO

W P

LA

N F

OR

RE

CU

RR

EN

T B

UD

GE

T

(FO

R M

DA

s, R

EG

ION

S &

C

OU

NC

ILS

) V

OT

E: …

……

V

OT

E N

AM

E …

……

……

……

……

……

……

……

……

……

……

……

……

……

……

.. SU

B-V

OT

E C

OD

E: …

……

SU

B-V

OT

E N

AM

E …

……

……

……

……

……

……

……

……

……

……

……

……

..

PRO

JEC

T C

OD

E: …

……

……

….

PR

OJE

CT

NA

ME

: …

……

……

……

……

……

……

……

……

……

O

BJE

CT

IVE

No:

……

……

OB

JEC

TIV

E D

ESC

RIP

TIO

N:…

……

……

……

……

……

……

……

……

……

……

T

AR

GE

T C

OD

E: …

……

TA

RG

ET

DE

SCR

IPT

ION

:……

……

……

……

……

……

……

……

……

……

……

……

NSG

RP

O

ther

T

ick

(√)

A

ctiv

ity

Cod

e A

ctiv

ity

Des

crip

tion

So

urce

of

Fina

ncin

g A

ppro

ved

Ann

ual B

udge

t Pl

anne

d Q

uart

erly

Exp

endi

ture

s (P

roje

cted

Cas

h Fl

ow)

Qua

rter

I

Qua

rter

II

Qua

rter

III

Q

uart

er I

V

1 2

3 4

5 6

7 8

Gov

ernm

ent

O

wn

Fund

s

Tot

al

G

over

nmen

t

Ow

n Fu

nds

T

otal

N

otes

E

ach

row

is a

sin

gle

acti

vity

und

er a

targ

et. T

his

row

is b

roke

n in

to 3

par

ts d

escr

ibin

g th

e ca

sh f

low

for

Gov

ernm

ent F

inan

cing

(su

bven

tion

or r

ecur

rent

fun

ding

) an

d ow

n fu

nds.

Des

crip

tions

of

each

col

umn

are

as f

ollo

ws:

Colu

mn

1. A

ctiv

ity

Cod

e: S

egm

ent 2

cod

e fo

r th

e ac

tivit

y, f

or e

xam

ple:

A02

C03

Colu

mn

2. A

ctiv

ity

Des

crip

tion

: the

act

ivit

y de

scri

ptio

n in

wor

ds, f

or e

xam

ple

“Tra

in 1

00 p

eopl

e in

res

ults

man

agem

ent b

y 30

Jun

e 20

07”

Colu

mn

4. A

pp

roved

An

nu

al

Bu

dget

: the

tota

l bud

get (

in T

anza

nian

Shi

llin

gs)

for

the

curr

ent f

inan

cial

yea

r. T

his

is d

ivid

ed in

to 2

sou

rces

of

fund

s: G

over

nmen

t and

Ow

n Fu

nds.

Ow

n fu

nds

appl

y on

ly to

LG

As

and

Exe

cutiv

e A

genc

ies

and

may

incl

ude

reve

nues

col

lect

ed a

nd c

ontr

ibut

ions

fro

m c

itiz

ens

or c

omm

uniti

es.

Colu

mn

s 5

to 8

. Q

ua

rter

I, II

, II

I, a

nd

IV

: th

e pr

ojec

ted

cash

flo

w (

in T

anza

nian

Shi

llin

gs),

for

eac

h qu

arte

r, d

ivid

ed in

to 2

sou

rces

of

fund

s: G

over

nmen

t and

Ow

n Fu

nds.

92

PBF 6.2 (b)

FO

RM

11

B (

D):

AN

NU

AL

CA

SH

FL

OW

PL

AN

FO

R D

EV

EL

OP

ME

NT

BU

DG

ET

(F

OR

MD

As,

RE

GIO

NS

&

CO

UN

CIL

S)

VO

TE

: ……

……

VO

TE

NA

ME

……

……

……

……

……

……

……

……

……

……

……

……

……

……

…..

SUB

-VO

TE

CO

DE

: ……

……

SUB

-VO

TE

NA

ME

……

……

……

……

……

……

……

……

……

……

……

……

…..

PR

OJE

CT

CO

DE

: ……

……

……

.

PRO

JEC

T N

AM

E :

……

……

……

……

……

……

……

……

……

OB

JEC

TIV

E N

o: …

……

O

BJE

CT

IVE

DE

SCR

IPT

ION

:……

……

……

……

……

……

……

……

……

……

TA

RG

ET

CO

DE

: ……

……

T

AR

GE

T D

ESC

RIP

TIO

N:…

……

……

……

……

……

……

……

……

……

……

……

N

SGR

P

Oth

er

Tic

k (

√)

A

ctiv

ity

Cod

e A

ctiv

ity

Des

crip

tion

So

urce

of

Fina

ncin

g A

ppro

ved

Ann

ual B

udge

t

Plan

ned

Qua

rter

ly E

xpen

ditu

res

(Pro

ject

ed C

ash

Flow

) Q

uart

er I

Q

uart

er I

I Q

uart

er I

II

Qua

rter

IV

1 2

3 4

5 6

7 8

Fore

ign

L

ocal

Ow

n Fu

nds

T

otal

Fore

ign

L

ocal

Ow

n Fu

nds

T

otal

Not

es

Eac

h ro

w is

a s

ingl

e ac

tivi

ty u

nder

a ta

rget

. Thi

s ro

w is

bro

ken

into

3 p

arts

des

crib

ing

the

cash

flo

w f

or G

over

nmen

t Fin

anci

ng (

subv

entio

n or

rec

urre

nt f

undi

ng)

and

own

fund

s. D

escr

iptio

ns o

f ea

ch c

olum

n ar

e as

fol

low

s:

Colu

mn

1. A

ctiv

ity

Cod

e: S

egm

ent 2

cod

e fo

r th

e ac

tivit

y, f

or e

xam

ple:

A02

C03

Colu

mn

2. A

ctiv

ity

Des

crip

tion

: the

act

ivit

y de

scri

ptio

n in

wor

ds, f

or e

xam

ple

“Tra

in 1

00 p

eopl

e in

res

ults

man

agem

ent b

y 30

Jun

e 20

07”

Colu

mn

4. A

pp

roved

An

nu

al

Bu

dget

: the

tota

l bud

get (

in T

anza

nian

Shi

llin

gs)

for

the

curr

ent f

inan

cial

yea

r. T

his

is d

ivid

ed in

to 2

sou

rces

of

fund

s: G

over

nmen

t and

Ow

n Fu

nds.

Ow

n fu

nds

appl

y on

ly to

LG

As

and

Exe

cutiv

e A

genc

ies

and

may

incl

ude

reve

nues

col

lect

ed a

nd c

ontr

ibut

ions

fro

m c

itiz

ens

or c

omm

uniti

es.

Colu

mn

s 5

to 8

. Q

ua

rter

I, II

, II

I, a

nd

IV

: th

e pr

ojec

ted

cash

flo

w (

in T

anza

nian

Shi

llin

gs),

for

eac

h qu

arte

r, d

ivid

ed in

to 2

sou

rces

of

fund

s: G

over

nmen

t and

Ow

n Fu

nds.

93

PBF 6.1(a)

FO

RM

14B

(R

): A

NN

UA

L A

CT

ION

PL

AN

FO

R R

EC

UR

RE

NT

BU

DG

ET

FO

R T

HE

FY

99

9.

9..

V

OT

E N

O: …

……

……

……

….

VO

TE

NA

ME

: ……

……

……

……

……

…..

SUB

-VO

TE

CO

DE

: ……

……

…..

SU

B-V

OT

E N

AM

E: …

……

……

……

…..

Obj

ectiv

e C

ode

and

Des

crip

tion

Tar

get

Cod

e an

d D

escr

iptio

n

MKUKUTA Target

Manifesto Target

Act

ivity

Cod

e an

d D

escr

iptio

n

Planned Start Date

Planned Finish Date

Approved Budget

Work Days to be spent

on the

Tim

e Fr

ame

Res

pon-

sibl

e P

erso

n

J A

S

O

N

D

J F

M

A

M

J 1

2 3

4 5

6 7

8 9

10

11

Not

es

Eac

h ro

w o

f th

is f

orm

des

crib

es a

sin

gle

acti

vity

. T

he f

orm

sho

uld

only

be

used

inte

rnal

ly.

Col

umn

1: th

e O

bjec

tive

Cod

e (A

, B, C

, etc

) as

wel

l as

the

obje

ctiv

e’s

desc

ript

ion,

for

exa

mpl

e: “

A. I

mpr

ove

Acc

ess

to m

arke

ts.”

Par

t of

the

Seg

men

t 2 c

ode.

Col

umn

2: th

e T

arge

t Cod

e (A

01C

or

B02

S et

c) a

s w

ell i

ts d

escr

ipti

on, f

or e

xam

ple:

“A

01D

. Con

stru

ct 2

5 K

ilom

etre

s of

roa

d by

Jun

e 20

08.”

Col

umn

3: p

lace

a c

heck

m

ark

(√)

if th

e ta

rget

is a

n M

KU

KU

TA

Tar

get.

If

it is

non

-MK

UK

UT

A le

ave

this

col

umn

blan

k

Col

umn

4: p

lace

a c

heck

mar

k (√

) if

the

targ

et is

in th

e ru

ling

par

ty m

anif

esto

. If

it is

not

leav

e th

is c

olum

n bl

ank

Col

umn

5: th

e A

ctiv

ity

Cod

e (A

01C

03 o

r B

02S0

1 et

c) a

s w

ell a

s th

e ac

tivi

ty’s

des

crip

tion

, for

exa

mpl

e: “

A01

D05

. Tra

in 1

00 p

eopl

e in

Res

ults

Man

agem

ent b

y Ju

ne

2008

.” P

art o

f th

e S

egm

ent 2

cod

e.

Col

umn

6: th

e da

te a

t whi

ch th

e ac

tivi

ty s

houl

d st

art.

The

sta

rt o

f an

act

ivit

y sh

ould

incl

ude

its p

rocu

rem

ent,

whe

re a

pplic

able

. •

Col

umn

7: th

e da

te a

t whi

ch th

e ac

tivi

ty s

houl

d be

com

plet

ed.

Col

umn

8: th

e ap

prov

ed b

udge

t of

the

targ

et o

r ac

tivit

y. T

he ta

rget

’s b

udge

t is

the

sum

of

the

budg

ets

for

all a

ctiv

ities

und

er it

Col

umn

9: th

e ex

pect

ed w

ork

days

on

the

acti

vity

. S

ome

acti

vitie

s m

ay h

ave

long

dur

atio

ns in

whi

ch im

plem

enta

tion

is s

pora

dic.

For

exa

mpl

e an

act

ivit

y “s

uper

visi

on

of p

rocu

rem

ent”

may

take

pla

ce o

ver

a 3

mon

th p

erio

d, b

ut m

ay o

nly

invo

lve

2 w

ork

days

per

mon

th.

Col

umn

10: a

Gan

tt ch

art r

epre

sent

atio

n of

the

impl

emen

tati

on o

f th

e ac

tivi

ty, f

rom

its

plan

ned

star

t to

its

plan

ned

fini

sh.

Thi

s m

ay i

nvol

ve p

utti

ng X

’s in

eac

h co

lum

n,

fill

ing

the

colu

mn

(i.e

. sha

ding

it)

or a

ny o

ther

gra

phic

al r

epre

sent

atio

n •

Col

umn

11: t

he p

erso

n re

spon

sibl

e (a

ccou

ntab

le)

for

the

com

plet

ion

of th

e ac

tivi

ty.

Thi

s sh

ould

be

liste

d as

a p

ositi

on, s

uch

as “

Ass

ista

nt D

irec

tor

for

Fish

erie

s D

evel

opm

ent.”

94

PBF 6.1(b)

FO

RM

14B

(D

): A

NN

UA

L A

CT

ION

PL

AN

FO

R T

HE

DE

VE

LO

PM

EN

T B

UD

GE

T F

OR

TH

E F

Y 9

99

. 9

9..

V

OT

E N

O: …

……

……

……

….

V

OT

E N

AM

E: …

……

……

……

……

……

.. SU

B-V

OT

E N

O: …

……

……

..

SUB

-VO

TE

NA

ME

: ……

……

……

……

.. PR

OJE

CT

CO

DE

……

……

….

PR

OJE

CT

NA

ME

……

……

….

Obj

ectiv

e C

ode

and

Des

crip

tion

Tar

get

Cod

e an

d D

escr

iptio

n

MKUKUTA Target

Manifesto Target

Act

ivity

Cod

e an

d D

escr

iptio

n

Planned Start Date

Planned Finish Date

Approved Budget

Work Days to be spent

on the

Tim

e Fr

ame

Res

pon-

sibl

e P

erso

n

J A

S

O

N

D

J F

M

A

M

J 1

2 3

4 5

6 7

8 9

10

11

Not

es

Eac

h ro

w o

f th

is f

orm

des

crib

es a

sin

gle

activ

ity.

The

for

m s

houl

d on

ly b

e us

ed in

tern

ally

. •

Col

umn

1: th

e O

bjec

tive

Cod

e (A

, B, C

, etc

) as

wel

l as

desc

ript

ion,

for

exa

mpl

e: “

A. I

mpr

ove

Acc

ess

to m

arke

ts.”

Par

t of

the

Segm

ent 2

cod

e.

Col

umn

2: th

e T

arge

t Cod

e (A

01C

or

B02

S et

c) a

s w

ell i

ts d

escr

iptio

n, f

or e

xam

ple:

“A

01D

. Con

stru

ct 2

5 K

ilom

etre

s of

roa

d by

Jun

e 20

08.”

Col

umn

3:

plac

e a

chec

k m

ark

(√)

if th

e ta

rget

is a

n M

KU

KU

TA

Tar

get.

If

it is

non

-MK

UK

UT

A le

ave

this

col

umn

blan

k

Col

umn

4: p

lace

a c

heck

mar

k (√

) if

the

targ

et is

in th

e ru

ling

part

y m

anif

esto

. If

it is

not

leav

e th

is c

olum

n bl

ank

Col

umn

5: th

e A

ctiv

ity C

ode

(A01

C03

or

B02

S01

etc)

as

wel

l as

the

activ

ity’s

des

crip

tion

Col

umn

6: th

e da

te a

t whi

ch th

e ac

tivity

sho

uld

star

t. T

he s

tart

of

an a

ctiv

ity s

houl

d in

clud

e its

pro

cure

men

t, w

here

app

licab

le.

Col

umn

7: th

e da

te a

t whi

ch th

e ac

tivity

sho

uld

be c

ompl

eted

.

Col

umn

8: th

e ap

prov

ed b

udge

t of

the

targ

et o

r ac

tivity

. T

he ta

rget

’s b

udge

t is

the

sum

of

the

budg

ets

for

all a

ctiv

ities

und

er it

Col

umn

9: th

e ex

pect

ed w

ork

days

on

the

activ

ity.

Som

e ac

tiviti

es m

ay h

ave

long

dur

atio

ns in

whi

ch im

plem

enta

tion

is s

pora

dic.

For

exa

mpl

e an

ac

tivity

“su

perv

isio

n of

pro

cure

men

t” m

ay ta

ke p

lace

ove

r a

3 m

onth

per

iod,

but

may

onl

y in

volv

e 2

wor

k da

ys p

er m

onth

. •

Col

umn

10: a

Gan

tt ch

art r

epre

sent

atio

n of

the

impl

emen

tatio

n of

the

activ

ity, f

rom

its

plan

ned

star

t to

its p

lann

ed f

inis

h. T

his

may

invo

lve

putti

ng X

’s in

ea

ch c

olum

n, f

illin

g th

e co

lum

n (i

.e. s

hadi

ng it

) or

any

oth

er g

raph

ical

rep

rese

ntat

ion

Col

umn

11: t

he p

erso

n re

spon

sibl

e (a

ccou

ntab

le)

for

the

com

plet

ion

of th

e ac

tivity

. T

his

shou

ld b

e lis

ted

as a

pos

ition

, suc

h as

“A

ssis

tant

Dir

ecto

r fo

r Fi

sher

ies

Dev

elop

men

t.”

95

Perform

ance Reporting Form

s

MEF 7.1

FO

Rm

12A

: C

UM

UL

AT

IVE

QU

AR

TE

RL

Y M

TE

F T

AR

GE

T M

ON

ITO

RIN

G F

OR

M

VO

TE

: ……

……

VO

TE

NA

ME

……

……

……

……

……

……

……

……

……

……

……

……

……

……

…..

PER

IOD

CO

VE

RE

D: Q

UA

RT

ER

EN

DIN

G …

……

……

……

……

……

...

IN

TH

E F

INA

NC

IAL

YE

AR

……

……

……

……

……

B

UD

GE

T C

OV

ER

AG

E: (

DE

VE

LO

PME

NT

OR

RE

CU

RR

EN

T)…

……

……

……

……

……

……

……

……

……

……

..……

……

PRO

JEC

T C

OD

E A

ND

NA

ME

: …

……

……

……

……

……

……

……

……

……

……

……

……

……

……

……

……

……

..…

SUB

-VO

TE

CO

DE

AN

D N

AM

E:…

……

……

……

……

……

……

……

……

……

……

……

……

……

……

……

……

…..…

.. O

BJE

CT

IVE

CO

DE

AN

D N

AM

E: …

……

……

……

……

……

……

……

……

……

……

……

……

……

……

..……

……

……

Not

es

Eac

h ro

w is

a s

ingl

e ta

rget

. Des

crip

tion

s of

eac

h co

lum

n ar

e as

fol

low

s:

Colu

mn

1.

Ta

rget

Cod

e is

the

Segm

ent 2

cod

e at

the

targ

et le

vel,

for

exam

ple

“A03

C”

Colu

mn

2 t

o 4

: M

, P

, R

” P

lace

a c

heck

mar

k (t

ick

or X

) in

the

colu

mns

M, P

, R a

s fo

llow

s: M

= M

KU

KU

TA

(if

the

targ

et is

an

MK

UK

UT

A ta

rget

), P

= P

AF

Mat

rix

(if

it is

a P

AF

targ

et);

R

= R

ulin

g P

arty

Man

ifes

to.

Thi

s w

ill h

elp

link

the

MT

EF

targ

et to

oth

er c

oord

inat

ing

plan

s •

Colu

mn

5.

An

nu

al

Ph

ysi

cal

Targ

et D

escr

ipti

on

(cu

rren

t yea

r):

The

targ

et (

in w

ords

) de

scri

bing

the

fina

l sta

te a

t the

end

poi

nt o

f th

e cu

rren

t yea

r; f

or e

xam

ple

“bui

ld 1

50 k

ilom

etre

s of

ro

ad b

y 30

Jun

e 20

09”

Colu

mn

6: t

his

is th

e cu

mul

ativ

e to

tal a

s of

the

curr

ent q

uart

er, f

or e

xam

ple

“60

kilo

met

res

wer

e co

nstr

ucte

d by

30

Mar

ch 2

009.

Colu

mn

7 E

stim

ate

d %

com

ple

te: i

f th

e ta

rget

is q

uant

itativ

e di

vide

the

Act

ual V

alue

by

the

Pla

nned

Val

ue, f

or e

xam

ple

60 k

ms

built

/ 15

0 km

pla

nned

= 4

0%

Colu

mn

s 8

-10

(A

sses

smen

t): C

heck

or

tick

one

of th

e co

lum

ns “

on tr

ack,

” “a

t ris

k” o

r ‘u

nkno

wn”

Colu

mn

s 1

1-1

2:

Cu

mu

lati

ve

Act

ua

l E

xp

end

itu

re a

s of

Qu

art

er X

XX

: th

is is

the

actu

al e

xpen

ditu

re (

not t

he d

isbu

rsed

or

the

rele

ased

am

ount

) w

hile

the

Cum

ulat

ive

Bud

get i

s th

e am

ount

that

was

exp

ecte

d to

be

spen

t (ac

cord

ing

to th

e ca

sh f

low

pla

n) b

y qu

arte

r X

XX

.Colu

mn

13:

% s

pen

t: th

e ac

tual

exp

endi

ture

to d

ate

divi

ded

by th

e bu

dget

ed e

xpen

ditu

re f

or th

e fi

nanc

ial y

ear

CO

DE

S A

D

LI

KA

GE

S

A

U

AL

PH

YS

ICA

L

TA

RG

ET

CU

MU

LA

TIV

E S

TA

TU

S O

M

EE

TI

G T

HE

PH

YS

ICA

L T

AR

GE

T

EX

PE

D

ITU

RE

ST

AT

US

RE

MA

RK

S O

IMP

LE

ME

T

AT

IO

Targ

et

Cod

e

M

P

R

T

arg

et D

escr

ipti

on

A

ctu

al

Progre

ss

Est

ima

ted

%

Com

ple

ted

On

track

Risk

Unkn

own

Cu

mu

lati

ve

Bu

dg

et

Cu

mu

lati

ve

Actu

al

Exp

en

dit

ure

%

S

pen

t

1

2

3

4

5

6

7

8

9

10

11

12

13

14

96

MEF 7.2

FORM 12B: QUARTERLY CUMULATIVE MILESTONE (PRIORITY) MONITORING FORM

VOTE: ………… VOTE NAME ………………………………………………….. PERIOD COVERED: QUARTER ENDING …………….. IN THE FY ……………………

Planned Key Priority Interventions or

milestones

Current Implementation Status

Assessment

Comments O

n tr

ack

At R

isk

Off

-tra

ck

1 2 3 4 5 6 Notes Each row is a single milestone. Descriptions of each column are as follows:

• Column 1: Institution’s Key Priority intervention or milestone. Should be selected from the Institution’s MTEF • Column 2 Brief implementation on the status for each priority area

• Columns 3, 4, & 5 General Assessment of key priority areas. Tick one only. • Column 6 Comment: describe possible reasons for variation (if not on track) as well as remedial actions planned or

implemented for each priority area

97

MEF 7.3

FO

RM

12C

: O

UT

CO

ME

IN

DIC

AT

OR

MO

NIT

OR

ING

FO

RM

VO

TE

: ……

……

VO

TE

NA

ME

……

……

……

……

……

……

……

……

……

……

……

……

……

……

…..

PER

IOD

: RE

SU

LT

S A

S O

F T

HE

EN

D O

F FI

NA

NC

IAL

YE

AR

……

……

……

……

……

Obj

ectiv

e an

d C

ode

Indi

cato

r N

ame

and

desc

ript

ion

BA

SEL

INE

IND

ICA

TO

R

TA

RG

ET

VA

LU

ES

(AS

PER

SP)

AC

TU

AL

IN

DIC

AT

OR

V

AL

UE

S C

LA

SSIF

ICA

TIO

NS

Sour

ce o

f D

ata

/ M

eans

of

veri

fica

tion

Bas

e-lin

e D

ate

Bas

elin

e In

dica

tor

Val

ue

Y0

Y+

1 Y

+2

Y0

Y+

1 Y

+2

MD

G

M

P R

C

omm

ent

1 2

3 4

5 6

7 8

9 10

11

12

13

14

15

16

Not

es

Eac

h ro

w o

n th

is f

orm

des

crib

es a

sin

gle

perf

orm

ance

indi

cato

r. I

ndic

ator

s ar

e us

ed to

mea

sure

pro

gres

s to

war

ds m

eetin

g ob

ject

ives

; the

y ar

e pe

rfor

man

ce

mea

sure

s. D

escr

iptio

ns o

f ea

ch c

olum

n ar

e as

fol

low

s:

Colu

mn

1. O

bje

ctiv

e C

od

e an

d D

escr

ipti

on

: th

e ob

ject

ive

(in

wor

ds)

and

its c

ode,

bei

ng m

easu

red

by th

e in

dica

tor,

for

exa

mpl

e: “

B. I

ncre

ase

Acc

ess

to E

duca

tion”

Colu

mn

2. In

dic

ato

r

am

e a

nd

Des

crip

tion

: th

is is

in tw

o pa

rts.

The

indi

cato

rs n

ame

shou

ld b

e in

ital

ics

whi

le it

s de

scri

ptio

n (h

ow th

e in

dica

tor

is c

alcu

late

d) s

houl

d be

list

ed b

elow

it in

a

bull

et o

r in

par

enth

esis

, for

exa

mpl

e:

Annu

al

Sa

lary

Arr

ears

as

a p

erce

nta

ge

of

tota

l a

nn

ua

l sa

lari

es

Thi

s in

dica

tor

take

s th

e su

m o

f th

e ar

rear

s pa

id f

rom

Jan

uary

to D

ecem

ber

and

divi

des

it b

y th

e to

tal s

alar

ies

paid

ove

r th

e sa

me

peri

od.

It is

an

inex

act m

easu

re o

f th

e qu

alit

y of

sal

ary

adm

inis

trat

ion

sinc

e ar

rear

s ar

ise

due

to d

elay

s in

trac

king

rec

ruitm

ent,

prom

otio

n or

tran

sfer

; the

mor

e ti

me

effi

cien

t the

se p

roce

sses

, the

less

arr

ears

will

ari

se.

Colu

mn

3. B

ase

lin

e d

ate

: de

scri

bes

the

mos

t rec

ent d

ate,

pri

or to

the

curr

ent p

lann

ing

phas

e th

at th

e in

dica

tor

was

col

lect

ed.

Colu

mn

4. B

ase

lin

e in

dic

ato

r valu

e is

the

valu

e of

the

indi

cato

r, o

n th

e m

ost r

ecen

t dat

e pr

ior

to th

e cu

rren

t pla

nnin

g ph

ase.

Colu

mn

s 5

to 7

: I

nd

ica

tor

targ

ets:

th

e ex

pect

ed o

r pr

ojec

ted

annu

al f

utur

e va

lue

of th

e in

dica

tor

at th

e en

d of

the

firs

t, se

cond

, and

thir

d ye

ar o

f im

plem

enta

tion

, as

foun

d in

the

Stra

tegi

c P

lan.

(Y

0 =

the

end

of th

e cu

rren

t fin

anci

al y

ear

bein

g pl

anne

d, (

Y+

1) =

the

next

fin

anci

al y

ear,

and

Y+

2 is

the

next

two

year

s •

Colu

mn

s 8

to 1

0:

Act

ua

l In

dic

ato

r va

lues

: th

e ac

tual

or

real

ised

val

ue o

f th

e in

dica

tor

at th

e en

d of

the

firs

t, se

cond

, and

thir

d ye

ar o

f im

plem

enta

tion

, as

foun

d in

the

Stra

tegi

c P

lan.

(Y

0 =

the

end

of th

e cu

rren

t fin

anci

al y

ear

bein

g pl

anne

d, (

Y+1

) =

the

next

fin

anci

al y

ear,

and

Y+2

is th

e ne

xt tw

o ye

ars

Colu

mn

11 t

o 1

4:

M,

P,

R”

Pla

ce a

che

ck m

ark

(tic

k or

X)

in th

e co

lum

ns M

, P, R

as

follo

ws:

M =

MK

UK

UT

A (

if th

e in

dica

tor

is a

n M

KU

KU

TA

indi

cato

r), P

= P

AF

Mat

rix;

R =

Rul

ing

Part

y M

anif

esto

. T

his

wil

l hel

p lin

k th

e in

dica

tor

to o

ther

coo

rdin

atin

g pl

ans

Col

umn

15.

The

sou

rce

is w

here

the

indi

cato

r is

col

lect

ed (

its

data

sou

rce)

whi

le m

eans

of

veri

fica

tion

is th

e su

ppor

ting

evi

denc

e th

at th

e in

dica

tor

may

hav

e •

Colu

mn

16 C

om

men

t: a

ny c

omm

ent d

escr

ibin

g im

plem

enta

tion

98

MEF 7.4 (a)

FO

RM

13A

: Q

UA

RT

ER

LY

CU

MU

LA

TIV

E F

INA

NC

IAL

OV

ER

VIE

W F

OR

M

VO

TE

: ……

……

VO

TE

NA

ME

……

……

……

……

……

……

……

……

……

……

……

……

……

……

…..

PER

IOD

: CU

MU

LA

TIV

E R

ESU

LT

S FO

R T

HE

QU

AR

TE

R E

ND

ING

……

……

…..

IN T

HE

FIN

AN

CIA

L Y

EA

R …

……

……

ITE

M /

CO

MPO

SIT

ION

BU

DG

ET

R

EL

EA

SED

A

CT

UA

L E

XPE

ND

ITU

RE

Am

ount

in

TSh

s.

(Mill

ions

) %

of

Tot

al

Am

ount

in

TSh

s.

(Mill

ions

)

Am

ount

Rel

ease

d as

a %

of

the

Bud

get A

mou

nt

(4 ÷

2)

Am

ount

in

TSh

s (M

illio

ns)

Act

ual V

alue

as

a %

of

the

Bud

get

Am

ount

(

6 ÷

2)

% o

f T

otal

1 2

3 4

5 6

7 8

EX

PEN

DIT

UR

E B

Y B

UD

GE

T

CA

TE

GO

RY

P.E

O.C

Dev

elop

men

t Loc

al F

unds

Dev

elop

men

t For

eign

Fun

ds

Tot

al

10

0

10

0

EX

PEN

DIT

UR

E B

Y M

KU

KU

TA

C

AT

EG

OR

Y (

Exc

lude

s PE

)

MK

UK

UT

A

NO

N-M

KU

KU

TA

Tot

al

10

0

10

0

EX

PEN

DIT

UR

E B

Y M

KU

KU

TA

C

LU

STE

RS

(Exc

lude

s PE

)

Clu

ster

2

Clu

ster

1

Clu

ster

3

Tot

al

10

0

10

0

Not

es

Thi

s re

port

sho

uld

be p

rint

ed f

rom

the

Inte

grat

ed F

inan

cial

Man

agem

ent S

yste

m (

IFM

S)

99

MEF 7.4 (b)

FORM 13B: QUARTERLY CUMULATIVE FINANCIAL DETAILED FORM

VOTE CODE AND NAME: …………………………….. PERIOD: CUMULATIVE RESULTS FOR THE QUARTER ENDING …… IN THE FY…..

Notes This report should be printed from the Integrated Financial Management System (IFMS)

ITEM / COMPOSITION

BUDGET RELEASED

ACTUAL REVENUE/EXPENDITURE

Amount in TShs. (Million

s)

% of Total

Amount in TShs (Million

s)

Amount Released as a

% of the Budget

Amount (4 ÷ 2)

Amount in TShs

(Millions)

Actual Value as a % of the Budget Amount (6 ÷ 2) % of Total

1 2 3 4 5 6 7 8

EXPENDITURE BY SUB-VOTE (Recurrent Only)

Sub-Vote 1001

Sub-Vote 1002

ETC

Total 100%

EXPENDITURE BY SUB-VOTE BY PROJECT (Development funds only)

Sub-Vote 1

Project 1

Project 2

Sub-Vote 2

Project 1

Project 2

Total 100%

REVENUES (NON-TAX) COLLECTION

Revenues Collected N/A N/A

Revenues Retained N/A N/A

SOURCE OF FUNDING (LGAs and Agencies ONLY)

Subvention

Own Sources N/A N/A

Total 100%

100

Internal Form

s

PBF 4.1

FO

RM

14A

: S

UM

MA

RY

OF

TH

E S

TR

AT

EG

IC P

LA

N

VO

TE

: ……

……

VO

TE

NA

ME

……

……

……

……

……

……

……

……

……

……

……

……

……

……

…..

PER

IOD

CO

VE

RE

D:

FR

OM

FIN

AN

CIA

L Y

EA

R …

……

. TO

TH

E F

INA

NC

IAL

YE

AR

……

M

issi

on

……

……

……

……

……

……

……

……

……

……

……

……

……

……

……

……

……

……

V

isio

n

……

……

……

……

……

……

……

……

……

……

……

……

……

……

……

……

……

….

Cor

e V

alue

s …

……

……

……

……

……

……

……

……

……

……

……

……

……

……

……

……

……

……

Ob

ject

ive

Str

ate

gy

Su

b-V

ote

T

arg

et

N

otes

T

his

form

sho

uld

be a

ttach

ed a

s an

ann

ex to

the

stra

tegi

c pl

an (

as p

er th

e m

anua

l).

It li

sts

all e

lem

ents

of

the

stra

tegi

c pl

an.

Eac

h ro

w is

a ta

rget

101

MTEF Presentation Format (For Y0 to Y0+2) Overview and Policy Statements

• Executive Summary • Statement of the Chairperson • Statement by Council Director

Chapter 1: Environmental Scan 1.1. Stakeholder analysis and Profile

1.1.1. Names of key stakeholders 1.1.2. Needs/expectations of stakeholders

1.2. SWOT analysis 1.2.1. Strength and Weaknesses 1.2.2. Opportunities and Threats

1.3. Key Issues Chapter 2: Reviewed Institutional Perspectives

2.1 Vision of the Council 2.2 Mission Statement 2.3 Objectives 2.4 Policies and Strategies.

Chapter 3: Budget Performance Review 3.1 Performance - Y0-2

3.1.1* Annual Approved Revenue Vs Actual 3.1.2 Annual Approved Expenditure Vs Actual 3.1.3 Planned targets Vs Achievements 3.1.4 Problems Experienced and Future Strategies

3.2 Mid Year Review – Y0-1 3.2.1* Annual Approved Revenue Vs Actual 3.2.2 Annual Expenditure Vs Actual 3.2.3 MTEF targets Vs Actual achievement 3.2.4 Problems/Limitations to effective implementation

Chapter 4: Estimâtes for MTEF (Y0 - Y0+2)

4.1 Summary of Annual and Forward Budget Estimate Rec. & Dev. (Form 1) 4.2 Recurrent Expenditure Forward Budget (Form 2) 4.3 3 Year MTEF Target Value Form (Form 3A (R) 4.4 3 Year MTEF Target Value Form (Form 3A (D) 4.5 Activity Costing Sheet (Form 3B) 4.6 Recurrent Expenditure Summary of Draft Estimates (Form 3C) 4.7 Domestic Revenue Forward Budget (Form 4) 4.8 Domestic Revenue (Form 5) 4.9 Development Expenditure Detail of Annual and Forward Budget (Form 6) 4.10 Results Framework (form 7) 4.11 Summary of Personal Emoluments Estimates per Vote (Form 8A) 4.12 Summary of Personal Emoluments Estimates per Sub Vote (Form 8B) 4.13 Item I – Summary of Existing Employees on Payroll (Form 8C) 4.14 Item II – Summary of Existing Employees Not on Payroll (Form 8D) 4.15 Item III – Summary of New Employees to be Recruited (Form 8E) 4.16 Schedule of Personal Emoluments Establishment and Strength (Form 9)

102

4.17 Project Profile Data Form (Form 10A) 4.18 Summary of Project Forward Budget Estimates All Sources (Form 10B)

103

ANNEX

REVIEW OF THE PLAN AND BUDGET IMPLEMENTATION

FOR 2009/10 AND MID YEAR 2010/11

104

TABLE OF CONTENTS

REVIEW OF MACROECONOMIC DEVELOPMENT ........................................................................ 105

RECENT MACRO ECONOMIC PERFORMANCE ................................................................................ 105 GDP GROWTH ................................................................................................................... 105 INFLATION ........................................................................................................................ 109 GOVERNMENT FINANCE ........................................................................................................ 111 Domestic Revenue .......................................................................................................................... 111 External Resources ......................................................................................................................... 112 Expenditure ...................................................................................................................................... 113

MONEY AND CREDIT DEVELOPMENTS ....................................................................................... 114 Interest Rates Developments ........................................................................................................ 115 Foreign Exchange Operations ....................................................................................................... 117 Foreign Reserves ............................................................................................................................. 117

EXTERNAL SECTOR DEVELOPMENTS ......................................................................................... 118 NATIONAL DEBT ................................................................................................................. 121

MKUKUTA PERFORMANCE REVIEW FOR 2009/10 ................................................................... 123

CLUSTER I: GROWTH AND REDUCTION OF INCOME POVERTY ........................................................... 123 CLUSTER II: IMPROVED QUALITY OF LIFE AND SOCIAL WELLBEING .................................................. 135 CLUSTER III: GOVERNANCE AND ACCOUNTABILITY ...................................................................... 139 CROSS CUTTING ISSUES ....................................................................................................... 141 REGIONAL INTEGRATION ....................................................................................................... 150

PERFORMANCE OF RSS AND LGAS ................................................................................................ 152

DECENTRALIZATION BY DEVOLUTION ....................................................................................... 152 PERFORMANCE REVIEW FOR REGIONS AND LGAS ........................................................................ 152 CHALLENGES FACING RSS AND LGAS ....................................................................................... 154

PERFORMANCE REVIEW OF PUBLIC SECTOR REFORMS ....................................................... 157

PUBLIC SERVICE REFORM PROGRAMME II .................................................................................. 157 LOCAL GOVERNMENT REFORM PROGRAMME (LGRP II) ................................................................. 159 LEGAL SECTOR REFORM PROGRAMME (LSRP) ............................................................................ 160 NACSAP II ....................................................................................................................... 161 BUSINESS ENVIRONMENT STRENGTHENING FOR TANZANIA (BEST) ................................................. 162 PUBLIC FINANCIAL MANAGEMENT REFORM PROGRAMME (PFMRP) .................................................. 163 SECOND GENERATION FINANCIAL SECTOR REFORM-FINANCIAL SECTOR SUPPORT PROJECT .................... 164 COORDINATION OF THE REFORMS ........................................................................................... 165

PERFORMANCE OF PUBLIC INVESTMENTS ................................................................................. 167

STRENGTHENING MANAGEMENT OF PUBLIC INVESTMENTS .............................................................. 168 CONTRIBUTION OF PUBLIC INVESTMENTS TO THE GOVERNMENT COFFERS .......................................... 169

REVIEW OF MACROECONOMIC DEVELOPMENT

Recent Macro economic Performance

124. The Tanzanian economy is emerging from a slowdown associated with the

2008 global financial crisis and natural disasters (drought and floods 2008-2009/10).

The macroeconomic policy response, including temporary and targeted fiscal

stimulus measures and supportive monetary policy, helped to mitigate the downturn.

The real GDP growth which slowed down to 6.0 percent in 2009 from 7.4 percent in

2008 has bounced back to 7.0 and 7.1 percent in the first and second quarters of

2010, respectively. It is worth noting that GDP growth were 5.6 and 5.2 percent in

the corresponding quarters in 2009. Inflation remained high throughout 2009, but

has since abated to single digits, reaching 5.6 percent by December 2010 from an

average of 12.1 percent in 2009.

125. The fiscal year 2009/10 experienced shortfall in domestic revenue collections

(excluding revenue from LGAs) against targets. This was partly due to the impact of

the Global Financial Crisis (GFC) that led to a slower growth in production activities

in the economy. Total expenditure for the fiscal year 2009/10 (excluding

expenditures from LGAs own resources) was within available resources. The reserve

position in the Bank of Tanzania at the end of November 2010 was sufficient to

cover about 6.0 months of import of goods and services.

GDP Growth

126. Economic growth during 2010 is expected at 7.0 percent from the real growth

of 6.0 percent attained in 2009. This recovery is partly due to continued recovery in

the world economy particularly during the first half of 2010. Similarly, domestic

economic activities are expected to strengthen and expand further compared to

2009. Preliminary national account statistics indicates that Gross Domestic Product at

market prices in real terms is estimated to have grown at 7.0, 7.1 and 6.2 percent in

the first, second and third quarters of 2010, respectively compared to 5.3, 3.4 and

5.7 percent attained during the same period in 2009. This growth was attributed to

increase in agricultural activities (good harvest of major food crops namely: maize;

paddy; millet/sorghum and cassava) following good weather in the 2009/10

106

agricultural season and government intervention on input subsidy program and

irrigation schemes. Other economic activities which recorded notable growth in the

second quarter of 2010 include: fishing; mining and quarrying; manufacturing;

wholesale and retail trade; electricity and gas; and real estate and business services.

Figure 1 illustrates the trend in GDP at constant market prices on quarterly basis

(Quarter I-III from 2002 – 2010).

0

2

4

6

8

10

12

2002 2003 2004 2005 2006 2007 2008 2009 2010

Pe

rce

nta

ge

Figure 1.1: Quarterly Real GDP Growth; 2002-2010

First quarter Second quarter Third quarter

127. Growth in agricultural and livestock economic activities slowed down to 3.2

percent in 2009 compared to actual growth rate of 4.6 percent recorded in 2008.

This was due to drought during the 2008/09 season, coupled with global financial

crisis which affected the demand and prices of traditional exports. Traditional

exports especially cotton and coffee suffered immensely due to the impact of the

global financial crisis as the prices in the world market declined substantially during

the period under review.

128. Preliminary data in the second and third quarters of 2010 indicates good

performance in agricultural sector. The sector registered a growth rate of 5.6

percent in the third quarter of 2010 compared to 6.4 percent in the third quarter of

2009. Performance of some selected major food crops production revealed that the

107

quantity of maize harvested went up by 20.0 percent from 3,309 thousand tonnes in

the third quarter of 2009 to 3,971 tonnes in the third quarter of 2010. Paddy

harvesting increased from 993 thousand tonnes in the third quarter of 2009 to 1,182

thousand tonnes in the corresponding quarter of 2010. Millet/Sorghum harvests in

the third quarter of 2009 registered 721 thousand tonnes compared to 761 thousand

tonnes in the corresponding quarter of 2010, which is an increase of 6.0 percent. On

the other hand, cassava harvests only increased by 3.0 percent from 2,915 thousand

tonnes in the third quarter of 2009 to 3,003 thousand tonnes in the third quarter of

2010. (Figure 1.2).

0

1000

2000

3000

4000

993721

2915

3971

1182

761

3003

Tonn

es

Figure 1.2: Production of Selected Major Food Crops

for the Third Quarters in 2009 and 2010

2009 2010

129. The growth rate of fishing economic activities declined to 2.7 percent in 2009,

from 5.0 percent in 2008. The decline was due to continued use of poor fishing

gears and illegal methods leading to destruction of fish hatcheries, low production to

meet world market demand as well as increasing competition in the European

countries resulting from increased fish farming in the Asian Countries (China and

Vietnam). However, preliminary data reveals that fishing economic activities grew by

5.5 percent in the third quarter of 2010 compared to negative 3.0 percent attained

in the corresponding quarter in 2009. The growth is mainly attributed to increased

demand for fish and fish products in the domestic and international markets.

108

130. The growth rate of industry and construction economic activities declined to

7.0 percent in 2009 from 8.6 percent in 2008, mainly on account of low performance

in mining and quarrying, manufacturing and construction sub-activities.

Manufacturing sub- activity grew by 9.0 percent in 2009, compared to 9.9 percent in

2008, mainly on account of the decline in demand for manufactured exports, owing

to the impact of the global financial crisis. The decline in the construction sub-

activities was due to unanticipated impact of the global financial crisis. However, the

recovery for the construction sub activity has been observed with a growth rate of

11.2 percent in the third quarter of 2010 compared to a negative growth rate of 5.4

percent in the corresponding quarter of 2009. The good performance of the sub

economic activity was on account of increase in the construction of residential and

non-residential buildings, roads and bridges; and land improvement activities. The

manufacturing activities performed relatively well, growing by 8.3 percent in the

third quarter of 2010 compared to 7.3 percent in the corresponding quarter in 2009.

131. The electricity and gas sub-economic activity recorded an increase in the

growth rate to 8.4 percent in 2009, compared to 5.4 percent recorded in 2008,

following the Government interventions in improving the power infrastructure.

Preliminary data for 2010 indicates slow growth in the first quarter with growth rate

of 5.6 percent compared to 6.9 percent in the corresponding quarter of 2009.

However, the growth rate of this sub activity in the third quarter of 2010 was 16.2

percent compared to 11.2 percent in the corresponding quarter of 2009. The

increase in growth rate in the second quarter is attributed to the increase in both

thermal and gas power generated.

132. In 2009, services economic activities grew by 7.2 percent compared to 8.5

percent recorded in 2008. The slowdown in the growth rate occurred in economic

sub activities such as hotel and restaurants; and trade and repairs; mainly on

account of low inflow of foreign direct investment and tourist arrivals following the

impact of the global financial crisis. However, following the recovery of the world

economy, the sub activity has started to improve. The preliminary data indicate that

sub economic activities of hotel and restaurants; and real estate and business

109

services grew at a higher rate in the second quarter of 2010. The hotel and

restaurants; and real estate and business services grew by 4.1 and 5.6 percent in

the second quarter compared to 3.9 and 2.3 percent during the second quarter in

2009, respectively. This is mainly due to an increase in number of tourist arrivals as

well as increase in business services, rented dwellings and owner occupied

dwellings. In the third quarter, hotel and restaurant slightly went down and grow by

3.1 percent compared to 4.9 percent recorded in the corresponding period in 2009.

Conversely, the real estate and business services performed well whereby the sub

activity grew by 5.2 percent in the third quarter of 2010 compared to 3.3 percent

recorded in the corresponding period in 2009.

2004 2005 2006 2007 2008 2009 2010

Absolute figures

First quarter 2,498,203 2,639,947 2,899,099 3,028,184 3,242,546 3,413,746 3,653,400

Second quarter 2,807,622 3,022,861 3,291,113 3,483,185 3,731,412 3,857,104 4,130,332

Third quarter 3,281,326 3,555,216 3,757,546 4,027,170 4,384,276 4,632,950 4,921,424

Fourth quarter 2,652,584 2,850,066 2,933,406 3,263,381 3,470,112 3,817,501 -

Year 11,239,735 12,068,090 12,881,164 13,801,920 14,828,346 15,721,301 12,705,156

Growth Rates (%)

First quarter 7.8 5.7 9.8 4.5 7.1 5.3 7.0

Second quarter 6.2 7.7 8.9 5.8 7.1 3.4 7.1

Third quarter 7.3 8.3 5.7 7.2 8.9 5.7 6.2

Fourth quarter 10.2 7.4 2.9 11.2 6.3 10.0 -

Year 7.8 7.4 6.7 7.1 7.4 6.0 7*

* Estimates

Table 1. 1: Quarterly Gross Domestic Product - Constant 2001 Prices (Tshs million)

Source: National Bureau of Statistics

Inflation

133. The National Bureau of Statistics (NBS) has rebased National Consumer Price

Index (NCPI) for November, 2010. The NBS has updated the NCPI market basket

weights from 2001 to 2007 using results of the 2007 Household Budget Survey. The

new NCPI weights are based on monetary expenditures relating to consumption for

all types of households in the 21 geographic regions of Tanzania. The new index

weights are based on expenditures of both urban and rural households, while the old

index covered only urban households. The reference period for the NCPI has been

changed from December, 2001=100 to September 2010 =100.

110

134. The rebased NCPI follows the internationally recommended Classification of

Individual Consumption by Purpose (COICOP). The use of COICOP results in a

change in the publication format for the new NCPI. The composition of the 12 major

groups of COICOP is different from the composition of the major groups of the old

NCPI. Because of this difference, the new NCPI will be disseminated with indices for

the 12 major groups of COICOP as well as several additional index aggregations.

These additional indices are; 1) Food and Non-alcoholic Beverages--combining food

consumed at home and food consumed in restaurants; 2) Energy and Fuels—

combining electricity and other fuels for use at home with petrol and diesel; 3) All

Items Less Food; and 4) All Items Less Food and Energy.

135. The new NCPI incorporates a number of methodological improvements

including the use geometric means for compiling elementary index aggregates, the

use of an improved index compilation system, and improved procedures for

collecting and processing prices. The modified Laspeyres index formula continues to

be used for computing higher level aggregates for the NCPI. The sample of goods

and services has been updated to include many new items and to eliminate those

items that have become less representative of current consumption patterns.

136. The economy experienced inflationary pressures in 2009, primarily due to food

supply shortages in some parts of the country due to uneven distribution and a

rebound in world oil prices. However, due to favorable weather conditions in the

2009/10 crop season, food supply improved, leading to a downward trend in

inflation from 12.7 percent in October 2009 to 4.2 percent in October 2010. In

December 2010, inflation rate rose to 5.6 percent and picked up to 6.4 percent in

January 2011 owing to the increase in electricity tariffs and gas. However, inflation

rate for housing, water, electricity, gas and other fuels was 12.1 percent in

December 2010 compared to 14.4 percent in November 2010. Food and non

alcoholic beverages also rose to 7.3 percent in the year ending December 2010 from

7.1 percent in November 2010 (Figure 1.3). The overall annual average has also

slowed down to single digit of 5.5 percent in 2010 from double digit of 12.1 percent

in 2009.

111

0.0

2.0

4.0

6.0

8.0

10.0

12.0P

erc

en

t

Figure 1.3: Trend of Inflation: Jan - Dec. 2010

Headline inflation Food Inflation Non-food inflation

Government Finance

137. The budget performance for the fiscal year 2009/10 experienced a shortfall in

domestic revenue collections against the target of Tshs. 5,234.069 billion but higher

than the amount collected in 2008/09. Domestic revenues reached Tshs.4,645.2

billion in 2009/10 compared to Tshs 4,293.1 billion in 2008/09 and was 15.1 percent

and 16.2 percent of GDP for the two fiscal years, respectively. Total expenditure

reached 26.4 percent of GDP compared to 25.8 percent in 2008/09. Grants

amounted to 4.5 percent of GDP, resulting into the budget deficit after grants of 6.9

percent of GDP.

Domestic Revenue

138. Total domestic revenue collection for 2009/10 was 91.2 percent of budget

estimate of Tshs 5,096 billion. Tax revenue collection was 91.5 percent of estimate,

while non tax revenue was 85.2 percent, partly due to the impact of GFC that led to

a slower growth in production activities in the economy. In addition, the shortfall in

non tax revenue was partly caused by the postponement of the implementation of

some revenue measures that were announced in the budget, including new charges

in residency permits, visas, immigration fees and fire service charges.

Notwithstanding the shortfalls in terms of attaining the estimated target, in absolute

terms domestic revenue collection increased from Tshs. 4,293.1 billion in 2008/09 to

Tshs. 4,645.2 billion in 2009/10, equivalent to 8.2 percent increase.

112

139. During the first half of the fiscal year 2010/11, total domestic revenue

collections amounted to Tshs. 2,778.9 billion, equivalent to 90 percent of estimated

Tshs. 3,079.1 billion. The gross collection for the period was above the collection of

the corresponding period in the year 2009/10 by Tshs. 487.7 billion, reflecting an

increase of 17.6 percent. Total tax revenue collections amounted to Tshs. 2,558.5

billion, equivalent to 91 percent of estimated Tshs. 2,798.7 billion. On the other

hand, non-tax revenue continued to perform below the estimates during this period.

The actual revenue collection from this category was Tshs. 148.5 billion against the

target of Tshs. 194.1 billion, equivalent to 77 percent. Collections from taxes on

imports were Tshs. 226.1 billion, reflecting the performance level of 97 percent of

estimated Tshs. 234.2 billion. The decline in volumes of petroleum imports were

among the causes for fall of collection of these taxes.

External Resources

140. During the fiscal year 2009/10, the cumulative end-year performance showed

that total grants received was Tshs.1,405.3 billion, equivalent to 67 percent of the

total estimate for the period. The shortfall was caused by slow implementation of

projects, mainly emanating from prolonged procurement procedures; failure of some

MDAs, Regions and LGAs to account for D-funds; and circumvention of the

exchequer system by some development partners in disbursing project funds.

141. During the year ending June 2010, total financing was 6.4 percent of GDP, out

of which 4.5 percent was external resources and 1.9 percent domestic. Net foreign

borrowing amounted to Tshs 1,379.6 billion, which is higher than the total estimates

for the period by 33 percent. Domestic borrowing was also higher than budgeted, as

the Government had to borrow 1.6 percent of GDP to compensate for the shortfall in

programme assistance, to meet MKUKUTA expenditure requirements.

142. During the first half of the fiscal year 2010/11, total grants and loans for

financing budget amounted to Tshs. 827.9 billion, equivalent to 101 percent of

estimated Tshs. 821.7 billion. The increase is attributed to exchange rate fluctuation

used to convert Tanzanian shillings against foreign currencies. This performance was

113

higher than the corresponding period in the year 2009/10 by Tshs. 42.6 billion,

reflecting an increase of 51.4 percent. On the other hand, grants and loans for

development expenditure amounted to Tshs 469.6 billion, equivalent to 24 percent

of estimated amount in fiscal year 2010/2011. This performance was less than the

corresponding period in the year 2009/10 by Tshs. 378 billion, reflecting a decrease

of 44.6 percent.

Expenditure

143. Expenditure performance for the fiscal year 2009/10 was broadly in line with

the resources envelope. Total expenditure for the period under review was below

the target, but higher than the amount of the corresponding period in 2008/09.

Total expenditure for 2009/10 was Tshs. 8,173.7 billion, equivalent to 92.0 percent

of the total estimate for the period of Tshs 8,881.3 billion, compared to total

expenditure of Tshs 6,811.8 billion, in 2008/09. Actual development expenditure for

2009/10 was Tshs.2,611.3 billion, which is equivalent to 92 percent of the total

estimates for the period. This performance was mainly due to delay in the

implementation of projects resulting from delay by some MDAs and LGAs to

accomplish procurement procedures and reporting on the use of the funds. Similarly,

overall recurrent expenditure amounted to Tshs. 5,562.4 billion, which was below

the period target by 8 percent, compared to total estimates during the period under

review. Expenditure on wages and salaries was Tshs.1,723.4 billion, equivalent to 98

percent of the period estimates.

144. Total expenditure for the first half of the fiscal year 2010/11 stood at Tshs

5,052.7 billion, equivalent to 83.4 percent of the period estimates of 6,058.0 billion.

Actual development expenditure for the same period was Tshs. 1,255.8 billion which

is equivalent to 81 percent of the period estimates of Tshs 1,550.3 billion, while

overall recurrent expenditure amounted to Tshs 3,796.8 billion which was 84.2

percent of the period estimates of Tshs 4,507.7 billion.

114

Money and Credit Developments

145. During 2010/11, monetary policy was directed towards maintaining an

appropriate level of liquidity in the economy to contain inflation and provide enough

room for recovery of credit to the private sector. The Government maintained

moderate tender sizes of Treasury securities consistent with the monetary policy

stance, complemented with sales of foreign exchange in the inter-bank Foreign

Exchange Market (IFEM).

146. During the first half of 2010/11, broad money supply (M2) grew at an annual

rate of 21.8 percent, slightly higher than the target of 20.7 percent by end-

December 2010, but lower than 26.3 percent recorded at end-June 2010.

Meanwhile, extended broad money supply (M3) grew by 25.4 percent above the

target of 23.5 percent by end-December 2010 and also above the growth rate of

25.1 percent recorded at end-June 2010. These developments in monetary

aggregates were mostly explained by foreign currency deposits (FCD) in the banking

system, coupled with strengthening of the US dollar against the Shilling, consistent

with overall strengthening of US dollar against major currencies. FCD grew by 23.3

percent, from USD 1,657.3 million in December 2009 to USD 2,043.6 million by end-

December 2010. In contrast, FCD grew by 6.6 percent in 2009.

147. Annual growth of credit to the private sector improved to 20.0 percent in

December 2010, from 16.3 percent registered at end-June 2010 and 9.6 percent

recorded in 2009. The improvement reflects a recovery of banks’ confidence in

lending to the private sector after the global financial crisis. Credit to private sector

continues to be channeled to productive sectors that support growth. During the

period under review, personal loans dominated in terms of share of total private

sector credit, accounting for 21.4 percent, followed by trade activities which

accounted for 17.5 percent, manufacturing 11.9 percent, agriculture 12.1 percent,

and transport and communication 9.2percent.

115

Interest Rates Developments

148. Interest rates exhibited positive developments, as reflected in the declining

ratios of lending to deposit rates, as well as interest rates margins (Figure 1.4). The

lending-deposit rate margin has declined from double digits in 2005 to an average of

around 5 percent during the period between 2007 and 2010. Likewise, the

lending/deposit rate ratio has declined from around 3-times in July 2005 to around

1.7 times in December 2010. The encouraging developments in interest rates was

mainly on account of increased competition associated with an increase in the

number of banks and financial institutions, stable interest rates in the financial

market, as well as a decline in the rates at which the Bank of Tanzania lends funds

to commercial banks (Bank rates). The 364-days T-bill rates have declined from 18.4

percent in June 2007 to an average of 6.8 percent during the year 2010, while

during the same period, bank rates declined from more than 16 percent to less than

8 percent.

Figure 1.4: Movements in Short term Lending and Deposit Rates

Source: Bank of Tanzania

116

149. Despite the decline in the spread between lending and deposit rates, and

increased stability in financial markets’ rates, banks’ lending rates remain high,

pointing to continued presence of legal and structural rigidities, high-perceived risk

of doing business and inadequate information on potential borrowers. In 2010, short

term lending rates were on average around 13.88 percent, twice as much as the

rate fetched on the 364-days T-bill (Table 1.2). The Government is working on

strategies and measures to address banks’ lending rates. Some of the measures

currently being pursued include the following:

(i) Fast-tracking the establishment of credit reference bureau, which will provide

reference on creditworthiness of potential borrowers from banks, thus

reducing the risk of default;

(ii) Addressing weaknesses in the legal framework that impede realization of land

based collateral, including title deeds issuance and collateral registration;

(iii) Addressing the high cost of doing business in the country, including high

utility costs (electricity and water) and communication costs;

(iv) Promoting a vibrant primary and secondary markets supported by appropriate

and secure settlement system and robust oversight; and

(v) Sustained prudent fiscal and monetary policies to maintain low and stable

inflation, interest and exchange rates.

Table 1.2: Domestic Interest Rate Structure

Dec-08 Dec-09Jan Feb Mar Apr May Jun Jul Aug Sep Oct Nov Dec

Overall Interbank cash market rate 6.54 1.57 1.80 1.89 1.29 0.92 0.87 0.97 0.92 1.09 1.65 2.29 2.86 5.26 Overnight interbank cash market 6.27 1.46 1.67 1.66 0.98 0.86 0.67 0.86 0.82 0.93 1.68 2.27 2.87 5.19REPO Rate 6.42 1.26 1.22 1.22 1.06 0.79 0.65 0.54 0.58 0.58 0.90 1.53 1.78 3.20Discount Rate 15.99 3.70 7.58 7.58 7.58 7.58 7.58 7.58 7.58 7.58 7.58 7.58 7.58 7.58Overall Treasury bills rate 10.99 6.91 7.20 6.32 4.15 2.70 2.68 3.33 3.89 3.86 5.06 5.68 5.85 6.32 35 days 6.88 3.80 4.57 4.09 1.99 1.26 0.89 0.65 0.78 0.97 1.62 1.84 1.46 1.33 91 days 11.20 6.06 6.35 5.57 3.25 1.77 2.16 2.89 3.22 2.71 3.89 4.76 4.61 5.24 182 days 12.13 6.59 7.20 6.33 4.45 2.58 2.26 2.59 3.91 3.91 4.77 5.67 5.62 6.20 364 days 12.79 8.83 9.06 8.24 6.32 4.86 4.96 6.08 6.26 5.98 6.96 7.85 7.48 7.67Savings Deposit Rate 2.74 2.83 2.84 2.89 2.88 2.83 2.82 2.82 2.69 2.58 2.57 2.56 2.51 2.41Treasury Bonds Rates 2-years 14.35 10.89 10.89 9.40 9.40 9.40 9.40 8.79 8.88 8.88 9.82 9.82 9.67 10.35 5-years 16.39 13.45 13.77 13.77 13.77 13.77 9.52 9.52 9.52 9.70 9.70 10.44 10.44 11.58 7-years 17.04 14.15 14.15 14.15 12.11 12.11 10.38 10.38 10.38 10.85 10.85 11.88 11.88 11.88 10-years 19.47 16.73 16.73 16.73 16.73 11.99 11.99 11.68 11.68 11.68 13.00 13.00 13.59 13.59Overall Time Deposits Rate 6.63 6.36 6.12 5.82 6.11 5.96 5.79 5.88 5.42 5.55 6.03 6.11 5.55 5.11 12 month time deposit rate 8.48 8.99 9.06 8.84 8.78 8.67 8.56 8.43 7.86 7.13 7.15 7.26 6.14 7.09Negotiated Deposit Rate 10.23 9.94 7.44 7.16 9.41 9.63 9.47 9.57 8.76 8.58 9.33 9.60 8.76 8.45Overall Lending rate 16.05 14.38 14.39 14.81 14.80 14.50 14.50 14.67 14.34 14.35 14.47 14.49 12.84 13.45 Short-term lending rate (up to 1year) 13.56 13.96 13.76 14.73 14.61 13.88 14.02 13.92 14.14 14.37 14.29 14.22 12.31 12.37Negotiated Lending Rate 12.05 13.18 13.68 13.79 13.71 13.97 13.80 14.13 13.84 14.00 13.80 13.71 13.65 11.88Margin between short-term lending and one-year time deposit rates 5.07 4.97 4.71 5.89 5.84 5.21 5.47 5.49 6.28 7.24 7.14 6.96 6.17 5.27

2010

Source: Bank of Tanzania

117

Foreign Exchange Operations

150. The value of the shilling against the US dollar remained fairly stable in 2009

and the first half of 2010 largely due to a moderate import bill, coupled with regular

sales of US dollars in the Inter-bank Foreign Exchange Market by the Bank of

Tanzania for liquidity management. However, the value of the Shilling against the US

dollar depreciated sharply from Tshs. 1,394.7 per USD in July 2010 to Tshs 1,494.8

per USD in September 2010 before appreciating to Tshs. 1,463 per USD in

December 2010. The depreciation of the shilling against the US Dollar was on

account of general strengthening of the US Dollar against major currencies. Over the

period, the Bank of Tanzania continued to be the main supplier of foreign exchange

in the Interbank Foreign Exchange Market (IFEM), selling USD 551.1 million out of

the total volume of USD 881.5 million traded. (Figure 1.5).

Figure 1.5: Movements in Weighted Average Exchange rates against the US dollar

0.0

20.0

40.0

60.0

80.0

100.0

120.0

140.0

160.0

1000

1100

1200

1300

1400

1500

1600

Jun

-08

Jul-

08

Au

g-0

8

Se

p-0

8

Oc

t-0

8

No

v-0

8

De

c-0

8

Jan

-09

Fe

b-0

9

Ma

r-0

9

Ap

r-0

9

Ma

y-0

9

Jun

-09

Jul-

09

Au

g-0

9

Se

p-0

9

Oc

t-0

9

No

v-0

9

De

c-0

9

Jan

-10

Fe

b-1

0

Ma

r-1

0

Ap

r-1

0

Ma

y-1

0

Jun

-10

Jul-

10

Au

g-1

0

Se

p-1

0

Oc

t-1

0

No

v-1

0

De

c-1

0

Mill

ion

s o

f U

SD

TZ

S/U

SD

BOT Net Sale (+ve) Weighted Average Exchange Rate (TZS/USD)

Rapid depreciation

emanating mainly from

panic by banks following the

global finanacial crisis

Source: Bank of Tanzania

Foreign Reserves

151. Gross official reserves at the Bank of Tanzania reached USD 3,948.0 million by

the end of December, 2010 from USD 3,482.6 million recorded at the end of June

2010. That level of official reserves was sufficient to cover about 6.3 months of

118

imports, against the target of 5.0 months of import of goods and services for

2010/11.

External Sector Developments

Exports performance 152. In 2010, Tanzania exported goods and services worth USD 5,827.2 million,

which was 21.9 percent higher compared with the level recorded in 2009. The

improvement was largely due to increase in exports of gold, travel and

manufactured goods (Figure 1.6).

Figure 1.6:: Performance of Selected Export of Goods and

Services

788.2

1,198

.8

309.8

319.7

1,083

.5 1,288

.7

661.0

502.2

1,169

.6

1,159

.8

565.6

473.8

1,487

.3

1,302

.6

917.2

532.1

Gold Travel Manufactured Goods Traditional Exports

Year Ending December

2007 2008 2009 2010

Source: Bank of Tanzania

Traditional Exports 153. In 2010, the value of traditional exports went up by 16.5 percent to USD 558.9

million when compared with USD 479.6 recorded in the 2009, following an increase

in both export volumes and unit prices of tobacco and cashew nuts. It is worth

noting that, the increase in the export unit prices of tobacco is largely attributed to

the improved quality of Tanzanian tobacco following proper farming practices

coupled with accessibility of agricultural inputs. Figure 1.7 depicts the composition

of the main traditional exports for the last three years.

119

Figure 1.7: The composition of traditional exports for the last three years

(in percent)

35.9

20.2

23.6

9.0

8.6

2.7

26.6

23.2

23.1

14.3

9.8

3.0

41.6

18.2

15.0

17.3

6.5

1.4

Tobacco Coffee Cotton Cashewnuts Tea Cloves

Year Ending December

2008 2009 2010

Source: Bank of Tanzania

Non - Traditional Exports 154. Meanwhile, non-traditional exports increased to USD 3,128.5 million in 2010

from USD 2,466.1 million recorded in the preceding year. The improved performance

is largely attributed to a substantial increase in the export value of gold and

manufactured goods. During the period, the value of gold exports went up by 19.3

percent to USD 1,467.3 million, largely due to a rise in prices of gold in the world

market. The prices of gold increased to an average of USD 1,224.7 per troy ounce

from USD 972.7 per troy ounce recorded in 2009. The value of manufactured goods

also increased to USD 963.9 million, being 90.3 percent higher than the value

recorded during the preceding year, largely associated with the increased demand in

the neighbouring countries following the global recovery from the financial crisis.

Much of the increase was recorded in the fertilizers, paper and plastic products.

Service Receipts 155. Services receipts amounted to USD 2,139.8 million in 2010, being higher than

USD 1,854.6 million recorded during the year earlier, following an improvement in

travel, transportation and other business receipts. Travel receipts increased by 12.3

percent to USD 1,302.6 million as the global economy begun to recover from the

impact of the financial crisis. Likewise, transportation receipts rose by 33.2 percent

120

to USD 445.5 million, as a result of the increase in transit goods to the neighbouring

countries. This development is largely associated with an improvement in cargo

clearing at the Dar es Salaam Port.

Imports Performance 156. In 2010, import of goods and services amounted to USD 8,963.2 million

compared with USD 7,543.2 million recorded in 2009, largely due to a notable

increase in the value of imported oil and consumer goods. Oil imports increased to

USD 1,983.8 million from USD 1,323.0 million in the preceding year, is mainly

attributed to the increase in both volume and prices. While the volume of oil imports

rose to 3.1 million tons from 2.9 million tons in the year ending December 2009, the

average oil prices (refined products) in the world market also increased by 24.9

percent to USD 691.9 per ton. Meanwhile, import of consumer goods amounted to

USD 1,709.2 million, representing an increase of 21.7 percent, largely comprising

importation of wheat, plastic items, pharmaceutical and paper products.

Goods Imports 157. In 2010, the value of goods imports (fob) went up by 22.1 percent to USD

7,125.1 million from USD 5,834.1 million recorded in 2009, mainly due to the

increase in oil imports and industrial raw materials as well as importation of

consumer goods. During the period, oil imports increased by almost 50 percent to

USD 1,983.8 million from USD 1,323.0 million. The surge in oil imports is mainly

attributed to the increase in both volumes and prices. While the volume of oil

imports rose to 3.1 million tons from 2.9 million tons during the period, the average

oil prices (refined products) in the world market also increased by 25 percent to USD

691.9 per ton from USD 553.7 per ton. Meanwhile, the value of imports of consumer

goods amounted to USD 1,709.2 million, representing an increase of 21.7 percent

from USD 1,404.6 million recorded in 2009. The increase in imports of food stuff is

largely on account of a rise in importation of wheat to 1,037,840 tons from 826,054

tons. Is worth noting that, oil imports continued to dominate goods imports,

followed by imports of machinery and other consumer goods (excluding food and

food staff) such as pharmaceutical products, paper products, plastic items,

optical/photographic materials and textile apparels (Figure 1.8).

121

Figure 1.8: Composition of Goods Imports since 2008 (In Percent)

27.4

19.5

15.8

12.1

10.2

8.2

4.3

2.4

22.7

21.1

18.2

12.8

9.6

8.1

5.9

1.6

27.8

16.9

17.5

12.6

8.6

8.4

6.5

1.6

Oil Machinery Other Consumer

Goods

Transport Equipment

Building and Construction Equipment

Industrial Raw

Materials

Food and Foodstuff

Fertilizers

Year Ending December

2008 2009 2010

Service Payments 158. Service payments decreased by 7.5 percent to USD 1,838.1 million in 2010,

from USD 1,709.9 million registered in 2009, owing to a decrease in Government

and other business services. On the other hand, freight payments went up by 21.7

percent to USD 680.7 million, in line with an increase in importation of goods.

Balance of Payments 159. In 2010, overall balance of payments remained positive at a surplus of USD

369.8 million, slightly above the surplus of USD 366.2 million recorded in 2009. The

surplus was largely attributable to capital inflows in the form of grants and foreign

borrowing.

National Debt

160. The national debt stock as at November, 2010 stood at USD 11,041.8 million

compared to USD 9,330.3 million, at end-November 2009, equivalent to 18.0 percent

increase. The increase is attributed to new external disbursements and relatively

large amounts of domestic debt issuances, compared to maturing obligations. Out of

total debt stock, external debt amounted to USD 8,130.7 million while domestic debt

amounted to USD 2,911.1 million.

122

161. Out of the total external debt as at end of November 2010, USD 6,921.6

million was Disbursed Outstanding Debt (DOD), equivalent to 85.13 percent, while

interest arrears were USD 1,209.1 million. As of end-November 2010, the

Government continued to be the largest borrower, owing USD 5,621.8 million

(including IMF Guaranteed debt) of the total DOD, while private sector owed USD

1,299.8 million. External debt service in the first half of the fiscal year 2010/2011

amounted to Tsh 62,800 million, out of which, Tsh 24,010 million was principal

repayments and Tsh 38,790 million was interest payments.

162. The stock of domestic debt increased to Tshs. 4,314,400 million, from Tshs

2,418,200 million, equivalent to an increase of 56 percent. The increase in domestic

debt stock was mainly due to large issuance of Government bonds compared to

maturing obligations. Out of the total domestic debt, Government securities were

Tshs. 4,306,100 million, equivalent to 99.8 percent, and other debts amounted to

Tshs. 8,300 million. Domestic debt service in the first half of the fiscal year

2010/2011 amounted to Tsh 532,300 million. Whereas there has been an increase in

total public debt since June 2001, debt as a percentage of GDP has been declining

(Figure 1.9) due to strong GDP growth.

Figure No. 1.9: Total debt and ratio to GDP

0

10

20

30

40

50

60

70

0

2000

4000

6000

8000

10000

12000

2000/01 2002/03 2004/05 2006/07 2007/08 2008/09 2009/10

Total Debt Stock Ratio to GDP

USD Mil%

123

MKUKUTA PERFORMANCE REVIEW FOR 2009/10

163. Since 2000, the Government has been implementing the National

Development Vision 2025. The Vision has been implemented through programs and

strategies: Poverty Reduction Strategy (PRS); the first generation of the National

Strategy for Growth and Reduction of Poverty (NSGRP I), and Tanzania Mini-Tiger

2020. The PRS was implemented from 2000-2004 while NSGRP I was implemented

from 2005 to 2010.

164. The Government has approved the second generation of the NSGRP which will

be implemented from 2010 to 2015. Moreover, the Government is in the process of

developing a 15 years National Long Term Plan and a 5 years Medium Term Plan

(MTP), and their implementation are expected to start in July 2011. Both the NSGRP

II and MTP will be rationalized and harmonized for smooth and orderly

implementation of the country’s development agenda.

165. While details of MKUKUTA I performance are contained in the MKUKUTA

Annual Implementation Report (MAIR) 2009/10 and the Mid-term Review of the

Budget implementation 2009/10, this chapter will just present a brief review of the

same.

Cluster I: Growth and reduction of Income poverty

166. As shown in the MAIR 2009/10, Poverty and Human Development Report

(PHDR-2009) and other socio-economic reports, performance of this cluster is as

highlighted below:-

Economic growth

167. Economic growth is expected to recover from 6.0 percent attained in 2009 to

7.0 percent in 2010. Preliminary national accounts statistics indicates that Gross

Domestic Product at market prices in real terms is estimated to have grown at 7.0

and 7.1 percent in the first and second quarters of 2010, respectively, compared to

5.6 and 5.2 percent attained during the same period in 2009.

124

Agriculture

168. In 2009/10, sectoral priorities were on enhancing the implementation of

Agricultural Sector Development Programme (ASDP), particularly, in irrigation

systems development, strengthening research and extension services, and

enhancing productivity. Broad interventions included implementation of: District

Agricultural Development Plans (DADPs); District Agriculture Sector Investment

Project (DASIP) and Agriculture Marketing Systems Development Programme

(AMSDP).

Achievements

(i) Improvement in irrigation infrastructure resulting into an increase of the area

under irrigation from 310,745 hectares in 2009, to 352,740 hectares in

September 2010, out of which 276,420 hectares are for small scale farming

and 55,070 hectares are under large scale farming;

(ii) Increase in farming seasons from one to two or three seasons in a calendar

year resulting into increased cropping intensity from 100 to 300 percent;

(iii) As a result of Government interventions in agro-mechanization together with

the introduction of the inputs subsidy programme, and irrigation interventions

coupled with favourable weather conditions in the major production areas,

food production reached a total of 12.82 million tons in 2010 compared to the

national demand of 11.41 million tons, leading to an increase in Food Self

Sufficiency Ratio (SSR) from 102 percent in 2009, to 112 percent in 2010;

(iv) A total of 2,860 Extension Officers were recruited and deployed in the Local

Government Authorities. In addition, a total of 75 extension workers from the

private sector were trained on contract based extension services in order to

extend services to farmers; and

(v) A total of 2,020 demonstration farms with 52,845 farmers (27,703 men and

25,142 women) were established by some councils with the objective of

educating farmers on principles of modern farming.

125

Challenges

(i) Harnessing new technologies which are cost effective and in conformity with

the natural climatic regime of the country;

(ii) Facilitating private sector participation in the delivery of research and

extension services;

(iii) Sustaining generic improvement for better seeds with high yield;

(iv) Developing efficient and effective agricultural data and management

information systems for better research, better results and sustainable

planning at all levels;

(v) Enhancing efforts to attract innovative commercial agricultural investments;

(vi) Promoting agro - processing capacity, agricultural production incentives and

marketing information; and

(vii) Increasing investment in irrigated agriculture and production of agricultural

inputs.

Livestock

169. The focus in 2009/10 was on enhancing livestock productivity by improving

local breeds through cross breeding, strengthening National Artificial Insemination

Centres (NAIC) and extension services, strengthening pasture seed production and

conducting milk consumption promotion.

Achievements

(i) Production of meat in the country increased due to the increase in the

number of livestock as well as increased meat demand;

(ii) Cattle fattening programme (feedlot) continued in various ranches. These

ranches include Glienshils Ranch and Mtibwa Feedlot (Morogoro),

Sumbawanga Agricultural and Animal Feeds Industries (SAAFI), Manyara and

Mzeri ranches and small livestock keepers in Mara, Mwanza and Shinyanga

regions;

(iii) Egg production increased from 2.81 billion eggs in 2008, to 2.92 billion in

2009;

126

(iv) Milk production increased slightly from 1.604 billion litres in 2008, to 1.649

billion litres in 2009; and

(v) Increase in per capita consumption of milk from 42 litres in 2008, to 43 litres

in 2009.

Challenges

(i) Establishment of livestock processing industries;

(ii) Adopting better animal husbandry in ranches and better pastures;

(iii) Enhancing capacity to control existing and newly emerging livestock diseases;

(iv) Ensuring the availability of water/favourable weather condition for pasture;

(v) Ensuring the availability of drugs and veterinary facilities; and

(vi) Changing livestock farmers’ practices from traditional to commercial livestock

farming.

Fishing

170. The focus was on implementing interventions that will increase contribution of

aquaculture to the improvement of food security, employment and incomes.

Achievements

(i) The National Aquaculture Development Strategy has been launched to guide

aquaculture development in the country;

(ii) Fish catch increased from 325,456.5 metric tons, worth Tshs. 371.4 billion in

2009, to 335,674.3 metric tons, worth Tshs. 401.8 billion in 2010;

(iii) A total of 19 fish landing sites were improved in Lake Victoria to meet the set

fish and fisheries products quality and standards;

(iv) Patrols with a total of 622 man days were conducted in which 33 suspects of

illegal fishing were arrested;

(v) About 15,133 natural ponds were identified and out of which 14,200 fish

ponds were mainly stocked with tilapia and catfish species;

(vi) A total of 132 fishermen and fisheries products processors in Mafia district

were trained on the impact of illegal and unreported fishing; and

127

(vii) A total of 41,148.3 tons of fish and other fisheries products worth of Tshs.

207 billion, were exported in 2010, compared to 51,426.2 tons worth of Tshs.

205 billion exported 2009.

Challenges

(i) Facilitating modernisation of fishing activities;

(ii) Enhancing the knowledge on how to tap the vast potential for aquaculture

development;

(iii) Improving and sustaining quality and sanitary standards;

(iv) Preventing illegal fishing practices, trafficking of fish and fish products across

the borders, and promoting environmental conservation; and

(v) Improving the collection, processing, analysis and dissemination of fisheries

information.

Manufacturing

171. The Government continued to put in place and implement policies that

facilitated faster growth of the manufacturing sector.

Achievements

(i) A Strategy has been prepared to promote, develop and protect domestic

industries;

(ii) The Government, through the Export Processing Zones (EPZ) program,

continued to identify areas for EPZ and promoting investment in those areas.

A total of 67 EPZ licences have been issued, out of which 31 licences are for

infrastructure development and 36 licences for manufacturing. These

industries have invested a total of Tshs. 350 billion, creating 9,300 job

opportunities in 2009, compared to 3,100 jobs created in year 2005;

(iii) The Government, through the National Bureau of Statistics in collaboration

with UNIDO and the Confederation of Tanzania Industries, conducted an

industrial survey for updating performance data of the industries.

(iv) Monitoring and evaluation of privatized state companies and industries was

undertaken;

128

(v) The Government, through TIRDO designed and manufactured a solar

powered cassava drier known as tunnel drier with a size of 14.64 square

meters for commercial uses; and

(vi) The Government, through the National Development Corporation (NDC) has

embarked on establishment of a Biolarvicides Plant for manufacturing malaria

control products.

Challenges

(i) Strengthening the forward and backward linkages between the manufacturing

sector and other sectors;

(ii) Access to capital for investment and trade as well as infrastructure

development, which facilitate and enhance productivity in trade and

marketing; and

(iii) Ensuring that industrial production meets the market demand by producing

goods of quality standards for effective competition in the domestic and

export markets.

Minerals

172. The thrust of Government priority on the mining sector was reviewing the

mining policy and law toward optimizing its contribution to the economy through

linkage with other sectors and ensuring win-win situation in investment and

sustainable development.

Achievements

(i) The Mineral Policy 2009 and the Mining Act 2010 are in place;

(ii) In an effort to develop small scale miners in value addition and acquiring

appropriate equipment for mining, they were granted a total of Tshs 1 billion

for starting up centres for rent of small scale mining equipment in Rwamgasa

– Geita, Londoni – Manyoni and Pongwe – Bagamoyo;

(iii) The Tanzania Mineral Audit Agency was established with the objective of

strengthening, monitoring and auditing of mining operations, in order to

increase Government’s revenue from the mining industry;

129

(iv) The implementation of Sustainable Management of Mineral Resources Project

(SMMRP) started in September, 2009. Under this project, data on small scale

mining were collected and used to gauge benefits emanating from

investments in large scale mining in Geita , Bulyahulu, Buzwagi and Mwadui;

(v) Construction of infrastructure for the Mineral Resources Institute (MRI)

continued; and

(vi) The Geological Survey of Tanzania Infrastructure Development (GST)

conducted Geological and Geochemical mapping of six Quarter Degree Sheets

(QDSs) 58, 74W, 74, 75, 94 and 95 in Kasulu and Kibondo Districts.

Challenges

(i) Preventing the loss of revenue from dishonest miners;

(ii) Increasing the contribution of the sector to overall economic growth and

poverty reduction; and

(iii) Addressing the issue of environmental degradation.

Roads

173. The Government continued to improve roads infrastructure in the country,

specifically focusing on rehabilitation and construction of trunk, regional and rural

roads.

Achievements

(i) A total of 262.3 kms of trunk roads were upgraded to bitumen standards,

against the target of 203 kms;

(ii) A total of 52.5 kms of regional roads were upgraded to bitumen standards;

(iii) A total of 853.5 kms of regional roads were rehabilitated to gravel standards;

(iv) A total of 171.1 kms of trunk roads were rehabilitated to bitumen standards,

against the target of 71.8 kms; and

(v) One bridge was completed on trunk roads and a total of 12 bridges were

completed on regional roads.

130

Table 2.1: Road Network in Tanzania (km)

Road Class Paved Unpaved Total % Paved

Trunk Roads 5,166 7,620 12,786 40

Regional Roads 760 19,466 20,226 4

District, Urban, Feeder Roads

790 55,835 56,625 1

Total 6,716 82,921 89,637 7

Challenges

(i) Enhancing the road network capacity to match with increasing traffic,

particularly in urban areas;

(ii) Improving connectivity countrywide and to landlocked neighbouring countries

(iii) Rising unit cost of construction which has resulted in cost overruns for many

projects including the MCC funded projects; and

(iv) Nurturing the local construction industry to enable it participate optimally in

the construction agenda of the nation.

Energy

174. During the year 2009/10, the energy sector continued with its efforts to

increase access and reliability of electricity supply. This was done through

developing alternative sources of energy to reduce reliance on major hydro-plants.

Achievements

(i) Supplying electricity to Mkinga, Kilindi, Uyui and Bahi district headquarters

was completed;

(ii) The Tegeta 45 MW gas plant and installation of three gas plants with the

capacity of generating 2.7 MW at Somanga Fungu was completed;

(iii) Upgrading and strengthening of electricity systems at Dar es Salaam, Arusha

and Kilimanjaro under the Tanzania Energy Development and Access

Expansion Project (TEDAP) continued;

(iv) Supplying of electricity in Ngage B village in Simanjiro district and Matema

beach in Kyela district was completed. Other electrification projects which

were completed includes:, Mererani (Simanjiro); Konga Village (Morogoro

131

Rural); Mchinga A and B (Lindi); Malya/Sumve (Mwanza); Villages at Mto wa

Mbu (Arusha)

(v) Construction of biogas plants and community training project in Songea and

charcoal briquette machines in Mpwapwa was completed;

(vi) Completion of feasibility studies for mini - hydro at Waterfalls of river Mtambo

and Nzovwe (Rukwa), Pinyinyi (Arusha) and Kwitanda (Ruvuma); and

(vii) Drilling of four exploration wells in Mafia Deep, Muhoro, Minangu and Likonde

was accomplished.

Challenges

(i) Attracting strategic investors in energy sector;

(ii) Increasing accessibility to electricity by the population, from the current 14

percent;

(iii) Improving the generation, transmission and distribution networks;

(iv) Ensuring interconnection with neighboring countries grid systems; and

(v) Promoting alternative sources of energy.

Lands

175. The major focus was on provision of land title deeds, acquiring land for public

interest and promotion of the establishment of district and village land registries.

Achievements

(i) A total of 22,491 Certificates of Title were prepared, against a target of

20,000 certificates;

(ii) Site inspection in Dar es Salaam (Mbezi, Jangwani Beach, Tegeta, Ununio and

Boko) and re-issuance of new 4,098 Certificate of Title;

(iii) A total of 17,390 certificates of titles and 28,169 other legal documents were

registered;

(iv) A total of 7,386 properties were valued against the target of 10,000

properties;

(v) The Kigamboni New City Master Plan was finalized and approval of survey of

37,820 plots and 609 farms was also finalized;

132

(vi) Boundaries disputes between Geita town council & Geita forestry reserve;

Sikonge district & Manyoni district, Shume Magamba village & Shume

Magamba forestry reserves, Serengeti, Selous and Mikumi National parks &

surrounding villages were resolved;

(vii) A total of 1,604 Village boundaries were surveyed in Kilimanjaro (93) Singida

(316) Mara (351) Mwanza (33), Kagera (284), Kigoma (21) Tabora (127)

Shinyanga (243) Dodoma (54) Manyara (5) and Morogoro (87);

(viii) A total of 72 fallow farms were inspected and verified with a view to provide

land for investment;

(ix) A total of 19,876 landed properties in unplanned areas were identified and

their regularization plans prepared;

(x) A total of 128 Village land use plans and 8 district land use plans were

prepared;

(xi) A total of 61 village land registries and 15 district land registries constructed

and rehabilitated; and

(xii) A total of 3,296 village land certificates and 93,400 Certificate of Customary

Rights of Occupancy were issued and also a total of 7,756 lands and housing

disputes resolved.

Challenges

(i) Computerizing land registration system;

(ii) Compensation for acquisition of land for public interests;

(iii) Survey and issuance of rights of occupancy to meet the growing demand for

land development;

(iv) Land use planning;

(v) Land disputes; and

(vi) Improving information management database.

Natural Resources and Tourism

176. The government has continued to implement various interventions to ensure

effective management of natural resources and creating conducive tourist

environment in the country.

133

Achievements

(i) A total of 42,544 patrol man days were conducted in and outside protected

areas and 3,052 suspects of wildlife related offences were arrested in sixteen

districts which were mostly affected;

(ii) A total of 63 tourist hunting blocks were surveyed, digitized and categorized

into 5 groups based on size and quality;

(iii) Forest Surveillance Units (FSU) were established in seven terrestrial zones

and one marine zone to curb illegal forest activities in the country;

(iv) Eviction of encroachers was carried out in forest reserves in Bukombe,

Tabora, Mpanda, Geita, and Kisarawe; and

(v) Bee products for export were increased from 430 tons in 2008 to 620.5 tons

in 2009.

Challenges

(i) Ensuring sustainable management of natural and cultural resources at all

levels;

(ii) Improving tourist and cultural infrastructure;

(iii) Enhancing human capacity to effectively manage and develop natural and

cultural resources; and

(iv) Control of encroachments in forestry and game reserves for the purpose of

agriculture, grazing, settlement, poaching and deforestation activities.

ICT Infrastructure and Services

177. The Government continued to expand access of different groups to modern

information and communication technologies.

Achievements

(i) Completion of the first phase of the National Infrastructure (optic fibre

network) connecting it with the marine cables namely SEACOM and EASSY

reaching five border points;

134

(ii) National Addressing and Postcode System which will put in place a

comprehensive national address system that identifies streets and individual

residence was installed; and

(iii) Centres of excellence in science and technology including the Nelson Mandela

African Institute of Science and Technology (NMAIST) in Arusha, Tanzania

Atomic Energy Commission (TAEC), Institutes of Technology including the

DIT, MIST and Tanzania Institute of Leather Technology, were strengthened.

Challenges

(i) Large number of interventions that need to be done simultaneously to realize

the impact;

(ii) Huge resources required to cover the country with optical fibre network; and

(iii) Enhancing private sector investment for last mile connectivity of Optical Fibre.

Science, Technology and Research

178. Government focused on infrastructure development, building and

strengthening institutional and human capacity to improve the overall application of

science and technology.

Achievements

(i) National Research and Development Policy (NRDP) was formulated;

(ii) Provided support for research activities in agriculture and health sectors;

(iii) Procured bandwidth capacity (STM1) for all academic and research

institutions;

(iv) National Science and Technology Policy of 1996 was reviewed; and

(v) National Biotechnology Policy and Nuclear Science and Technology Policy

were formulated.

Challenges

(i) Increase awareness of science, technology and innovation access the

population and in the different work places;

(ii) Scaling up resources to support research and technology transfer;

135

(iii) Fill the gap existing in the cadre with technical skills for STI development in

the country; and

(iv) Modernizing the STI infrastructure in Research and Development and Higher

Learning Institutions.

Cluster II: Improved Quality of Life and Social Wellbeing

179. The Government in collaboration with stakeholders continued to implement

various programs and reforms across social sectors with the aim of enhancing the

quality of life and social wellbeing to its citizens. The social sectors under this cluster

are education, health and water.

Education

180. During the year ending June 2010, the priorities were on enhancing the

implementation of the major components of the Education Sector Development

Programme (ESDP). These include Primary Education Development Programme

Phase II (PEDP II 2007 – 2011); Teacher Development and Management Strategy

(TDMS); Technical and Higher Education Sub Master Plan 2003 – 2018; and

Preparation of the second phase of Secondary Education Development

Program(SEDP II).

Achievements

(i) Enrolment of pre-primary pupils increased by 3.3 percent in 2010 from

896,146 (450,279 girls) pupils in 2009 to 925,465(463,878 girls) pupils in

2010;

(ii) The Qualified Teacher/Pupil Ratio for primary education has improved from

1:60 in 2009 to 1:54 in 2010, while for secondary education it has improved

from 1:57 in 2009 to 1:51 in 2010;

(iii) Pupil Classroom Ratio has improved from an average of 1:109 in 2009 to 1:73

in 2010 and The Pupil Toilets Ratio for primary schools has also significantly

improved from a total of 1:89 (male 1:92 and female 1:86) in 2009 to a total

of 1: 56 (male 1:57 and female 1:56) in 2010;

136

(iv) Decreased dropout rate in primary education from 3.7% in 2009 to 2.6% in

2010, while that of secondary education decreased from 4.1% in 2009 to

3.4% in 2010;

(v) A total of 510 classrooms, 293 teachers’ houses and 117 pit latrines were

constructed and 6,502 desks were fabricated;

(vi) The enrolment of children with disabilities increased from 27,422 in 2009, of

whom, 14,663 (41.1%) were girls to 29,287 in 2010 of whom 12,353 (42.2%)

were girls;

(vii) The total enrolment (Form 1 – 6) increased from 1,466,402 (653,457 girls) in

2009 to 1,638,699 (728,528 girls) in 2010 which is an increase of 172,297

(11.7%) whereas girls increased by 11.5%;

(viii) Increased GER in all grades (form 1 -6) from 31.3% in 2009 to 34.0%, in

2010 while NER increased from 27.8% in 2009 to 29.9 in 2010;

(ix) Launched the project of e-learning known as Tanzania Beyond Tomorrow

(TBT) which will be piloted in 500 schools in phase I;

(x) The number of registered secondary schools has increased by 4 percent from

4,102 (3,283 Government and 819 Non-Government) in 2009 to 4,266 (3,397

Government and 869 Non-Government schools) in 2010;

(xi) Developed and finalized Secondary Education Development Programme (SEDP

II 2010 – 2015) and Higher Education Development Programme (HEDP 2010

– 2015);

(xii) In-service training on diagnostic teaching was provided to 105 tutors; while

285 tutors were financially supported for up-grading themselves in various

universities in the country (235 undergraduates and 50 Masters). Also

facilitated capacity building for 308 tutors on ICT;

(xiii) Establishment of the Education Sector Management Information System

(ESMIS) to capture necessary information on the number of

school/institutions, enrolments, infrastructure and number of

teachers/educators available at all levels of education and training;

(xiv) Increased enrolment by 25 percent in Universities and University colleges in

2009/10;

137

(xv) A total of 9,960 educational institutions were inspected and provided with

professional support and introduced a system of grouping schools using

School Evaluation Forms (SEF) as a result 14,831 were categorized schools

according to their strengths and weaknesses;

(xvi) Enrolled 924,893 (451,108 male and 473,785 female) adult learners under

ICBAE programme for both functional and post-literacy; and

(xvii) The number of students accessing loans from the HESLB increased from

58,841 in 2008/2009 to 74,498 in 2009/1010 with the granted loans worth

Tshs 140.3 billion and Tshs 197.3 billion respectively.

Challenges

(i) Matching the increased enrolment with demand for teachers and teaching

materials and learning facilities;

(ii) Improving the quality of education at all levels;

(iii) Attracting and retaining of teachers in underserved areas;

(iv) Meeting the educational needs for children with special needs; and

(v) Attracting students to pursue science subjects in secondary and tertiary

education;

(vi) Sustaining Higher education students’ loans; and

(vii) Improving learning and teaching environment at all levels (laboratories,

libraries, etc)

Health

181. The health sector continued to implement the Primary Health Services

Development Programme (PHSDP) and other priority interventions and programmes,

which are geared to improve the quality and access to health services by all

Tanzanians especially those in the rural areas. The focus is on groups at risk with

high burden of disease including people with disability, women who are in the

reproductive age and children.

138

Achievements

(i) According to the Tanzania Demographic and Health Survey 2010: Under five

(U5) mortality rate dropped by 40 percent from 91 per 1000 live birth in

2007/08 to 81 per 1000 live births in 2010; and maternal mortality rate has

decreased from 578 per 100,000 births in 2004/05 to 454 maternal deaths

per 100,000 live births in 2010. The 2009/2010 DHS shows that there has

been a 21 percent reduction in the Maternal Mortality Ratio since 2004/05;

(ii) The number of students enrolled into health training institutions increased

from 4,147, in 2009 to about 5,200 in 2010;

(iii) Health facilities have increased from 5,379 in 2005 to 6,212 in year 2010,

equivalent to an increase of 15.5 percent;

(iv) In 2009/10 a total of 4.7 million people had tested for HIV under campaign on

Voluntary Counselling and Testing (VCT);

(v) Vaccination coverage against measles was high at 91 percent beyond the

national target of 90 percent by 2010;

(vi) About 9,000,000 nets were distributed to children under five years of age free

of charge; and

(vii) A total of 746,823 orphans and most vulnerable children from 86 councils

were identified and given support for basic needs.

Challenges

(i) Deployment and retaining health workers recruited in underserved areas;

(ii) Supply of quality medicines, vaccines, medical supplies, equipment and

technologies;

(iii) The new epidemics fuelled by climate change and poor sanitation;

(iv) Neonatal mortality and newborn deaths account for almost 30% of all deaths

in children younger than five years in Tanzania.

Water and Sanitation

182. The focus was on the implementation of Water Sector Development

Programme (WSDP), which started in July 2007 and it is a 20 years programme.

139

Achievements

(i) Increased water production in 19 Urban Water Supply and Sanitation

Authorities (UWSSAs) to 113.11 million cubic metres in 2009/10 from 110.64

million cubic metres in 2008/09;

(ii) A total of 3,000 water points were constructed out of the planned 5,726

which is equivalent to 52.3 percent;

(iii) Water production in Dar es Salaam increased to 92.7 million cubic metres in

2009/10 compared to 91.7 million cubic metres in 2008/09; and

(iv) Collected and analyzed 3,655 water samples from different water sources in

both urban and rural areas, of which 3,456 (equivalent to 94.6 percent) were

found to be of good quality.

Challenges

(i) Increasing access of clean and safe water supply coverage to majority of the

population;

(ii) Degradation of water source catchments areas;

(iii) Provision and maintenance of sewerage treatment facilities; and

(iv) Increasing capacity to improve water supply and sanitation services across

the water sector.

Cluster III: Governance and Accountability

183. The Government continued to implement core reform programmes related to

governance and accountability.

Achievements

(i) Policy Making Guidelines, action plan and the ethics operational manual were

developed;

(ii) Integration of Public Service Reform Program (PSRP) intervention into 90

implementing institutions in 2009/10: 25 MDAs, 21 regions, 15 independent

departments; 29 executive agencies;

(iii) Establishment of two Executive Agencies, namely Tanzania Mineral Audit

Agency and Water Development Management Agency;

140

(iv) Local Government Finances Act, CAP 280 the Local Authority Financial

Memorandum and the Local Authorities Accounting Manual were reviewed to

ensure they are D by D compliant;

(v) The National Legal Training Curriculum was developed and the Law School of

Tanzania enrolled 1,074 students in 2009/10 for practical legal training;

(vi) Newly employed state attorneys totalling 204 were posted to their respective

regional and district prosecution offices throughout the country; and

(vii) Prevention and Combating Corruption Bureau (PCCB) received and

investigated 2,887 reported corruption related cases and completed the

investigation for 1,009 cases.

Challenges

(i) Spearheading e – government implementation across MDAs, Regions and

Local Government Authorities;

(ii) Attracting and retaining competent staff in public services particularly in

underserved areas;

(iii) Enhancing public service pay in tandem with the expanding scope of public

service demand, coupled with the limited resources;

(iv) Coping with technological advancement in dealing with corruption;

(v) Capacity to effectively operationalize core IFMS modules at Local Government

Authorities;

(vi) Harmonization of systems and the budget tools like SBAS, IFMS, RIMKU, Plan

REP for effective budget management and budget execution reporting;

(vii) Aligning new pluralistic democratic political environment and the movement

toward participatory management of socio- economic development; and

(viii) Ensuring integrity in institutions of justice across the country.

Millennium Development Goals

184. Implementation of the Millennium Development Goals is done through a

number of various supportive policy environments as embodied in MKUKUTA I and

currently in MKUKUTA II. Various reports on MDGs implementation progress have

been prepared, such as MDG progress report and MAIR 2009/10.

141

185. The country has shown some progress as far as the MDGs implementation is

concerned. In some areas, the country has surpassed the target of MDGs. A good

example is the net enrolment rate at primary school. Furthermore, other indicators

are on track while threat of not reaching some of the targets is also vivid since the

current status of indicators is far from the MDG target. Both financial and human

resources are required to address challenges which pose a threat to the

implementation of the internationally agreed development targets as shown in table

2.2.

Table 2.2: Progress in the Implementation of Millennium Development Goals

MDG

1990

(MDG baseline)

2007 2010 2015 (MDG

Target)

Actual Expected* Required*

Actual

Proportion of population below basic needs poverty line

39 33.4 25.7 23.4 -

19.5

Proportion of population below food poverty line

22 16.5 14.5 13.2 -

11

Under-5 Underweight (%) 28.8 21.9 18.7 17.3 21 14.4

Under-5 Stunted (%) 46.6 21.9 30.7 27.9 35 23.3

Primary school net enrolment rate 54.2 97.3 85.4 90.8 95.4 100

Under-five mortality rate (per 1,000 live births)

191 112 104.6 89.4 81 64

Infant mortality rate (per 1,000 live births)

115 68 62.6 53.4 51 38

Maternal Mortality Rate (per 100,000 live

births) 529 578 259.7 212.2 454 133

Births attended by skilled health personnel (%)

43.9 62 75.5 80.8 51 90

Access to potable water :% of rural population

52 55.7 67 69.6 58.7* 74

Access to potable water :% of urban population

68 83 78.9 80.8 84* 84

Note: * Computed as % of passage time from 1990 to 2015 (2007 = 68%; 2010 = 80%) , Data for water are up

to December 2009

Source: URT 2008: MDG Progress Report and MAIR 2009/10

Cross Cutting Issues

HIV and AIDS

186. The Government continued to implement the National HIV and AIDS

Prevention and Control Act of 2008, Health Sector Strategic Plan III which include

strategies on HIV and AIDS, National Health Sector Strategic Intervention Packages

for HIV and AIDS and Health Sector Strategic Plan for HIV and AIDS (2008-2012).

142

During the period, the Government has continued to mobilize the general public to

go for voluntary HIV counseling and testing.

Achievements

(i) A total of 4.7 million people had tested for HIV; and

(ii) A total of 746,823 orphans and most vulnerable children from 86 councils

were identified and given support for basic needs.

Challenges

(i) Coordination among stakeholders involved in HIV and AIDs at district levels;

(ii) Stigma and discrimination to people living with HIV and AIDS;

(iii) Response to voluntary counselling and testing; and

(iv) Sustaining increasing demand for care and treatment services, drugs,

nutrition and related services to people living with HIV and AIDS.

Gender

187. The Government continued to implement interventions addressing the major

objective regarding gender in order to achieve equality of human rights and peace.

Gender Responsive Budget (GRB) has been initiated across MDAs and LGAs which

provides tools to assess the different needs and contributions of men and women,

and boys and girls and calls for adjusting budget policies to benefit all groups. Key

areas for integrating GRB in Planning and Budget system include: identification of

gender articulation gaps in strategic and annual plans, budgeting tools and medium

term frameworks reports; a comprehensive capacity assessment of planning and

budgeting institutions; developing a multi-media and multi-audience communication

strategy to create awareness on GRB; and a review of legal framework which

governs planning and budgeting in Tanzania.

Achievements

(i) Increased number of women who continue to access credits from SACCOS

and other micro-finance institutions;

143

(ii) Women in decision making posts increased gradually from 26 percent in 2005

to 31 percent in 2010; and

(iii) Initiated process to integrate gender dimension in institutions’ planning and

budgeting through application of Gender Responsive Budget (GRB) tool. To

achieve this, the government has earmarked 4 GRB pilot implementing units

and has established a GRB Core Team of at least 25 officials, and provided

training to 120 key staff involved in planning and budgeting for pilot

MDAs/LGAs.

Challenges

(i) Addressing gender imbalances at all levels;

(ii) Strengthening of Tanzania Women Bank; and

(iii) Enhancing capacity for gender analysis, planning and budgeting in key

institutions.

Environment

188. The Government continued to address environmental issues that have

negative impact on land, biodiversity and human conditions.

Achievements

(i) 10 Biosafety Centres of Excellence (CoE) were identified, 9 institutions were

from Mainland and one institution from Zanzibar;

(ii) Environment Management Master Plan (EMMP) for three cities in Mwanza, Dar

es Salaam and Arusha is in place;

(iii) Five Regional Centres established at five Vocational Education Training of Dar

es Salaam, Mwanza, Kigoma, Mbeya, Mkokotoni – Zanzibar for phasing out

Ozone depleting substances;

(iv) 210 technicians were trained on good refrigeration and air conditioning

servicing practices in Mwanza, Kigoma, Tabora, Mara, Shinyanga, Kagera,

Mbeya, Rukwa, Iringa, Katavi, Ruvuma, Dodoma, Unguja, Pemba, and Dar es

Salaam region;

144

(v) Reallocation of invading pastoralists from the Usangu Water Catchment Basin

(Ihefu) to areas with less livestock in Lindi and Mtwara;

(vi) 15 EMA regulations related to Environment Impacts Assessments; Strategic

Environmental Assessment; Waste Management including management of

plastics; environmental quality standards; ozone depleting substances and

environmental inspection were prepared;

(vii) Guidelines on preparation of sector Environmental Action Plans as required by

EMA were prepared;

(viii) 56 sector environmental coordinators in 12 regions were appointed and 20

environmental sections within sectors with their coordinators were put in

place;

(ix) 72 projects were issued with Environmental Impact Assessment (EIA)

Certificates out of over 100 which were reviewed;

(x) 50 experts and 19 Environmental Inspectors were approved and published in

the Government Gazette; and

(xi) Climate change measures and showcasing materials (4 films, fliers and

natural climate change awareness and assessment briefing) were prepared.

Challenges

(i) Participation of the public on efforts to conserve marine and freshwater

bodies and its surroundings;

(ii) Affordability of alternative sources of energy other than fire wood and

charcoal; and

(iii) Coping up with climatic change.

Population and development

189. The Government continued to focus on the preparation for the 2012

Population and Housing Census scheduled for August 2012.

Achievements and challenges

190. The major activity carried out was cartographic work in seven regions of

Tanzania Mainland. The work is still in progress to ensure that the demarcation of

145

enumeration areas in all regions of Tanzania is completed by June 2011. However, a

key challenge is scalling up demarcation of Enumeration Areas.

Social Protection

191. The Government continued to support the interventions to prevent the risks

that are threatening the security and well-being of the citizens.

Achievements

(i) A total of 6,512 elderly people were cared for in 17 homes that are run by the

government and 23 homes run by faith based organizations;

(ii) A total of 135,673 most vulnerable children were identified and supported;

(iii) In order to safeguard child rights, Child Act was enacted in 2009. The aim of

the Act is to protect and maintain the welfare of the child in line with

international and regional conventions;

(iv) A total of 232 assistive devices were provided to persons with disabilities and

seed capital for income generating activities was provided to 173 vulnerable

families;

(v) Vocational training was also conducted for 2,500 persons with disabilities, 980

were females and 1,520 were males. In pre-primary education, total

enrolment of children with disabilities in 2010 was 1,771 out of these, 963

were boys and 808 girls;

(vi) The Persons with Disabilities Act was enacted in May 2010; and

(vii) In order to protect employees, the Government has continued to reform the

Pension Sector. The Office of the Social Security Regulatory Authority (SSRA)

was established in November 2010 which is mandated to promote an efficient

and competitive pension sector supported by appropriate legal and regulatory

structures so as to protect employees. Recommendations on harmonization

of Laws establishing various Social Security Funds have been finalized and will

be submitted in the February 2011 Parliamentary Session.

Challenges

(i) Increasing number of vulnerable children; and

(ii) Coordination among different actors and their related interventions.

146

Employment and Economic Empowerment

192. The Government continued to implement the National Employment Creation

Programme with the aim of creating one million jobs by 2010 outside the agriculture

sector. The Government also through the National Economic Empowerment Council

(NEEC) continued to support small and medium entrepreneurs to improve their

businesses hence improve their living standards.

Achievements

(i) A total of 1,313,561 new job opportunities were created in different sectors of

the economy. The public sector created 128,174 jobs and the private sector

1,185,387 jobs;

(ii) Two zonal offices of Tanzania Employment Services Agency (TaESA) were

opened and operationalized in Arusha and Dodoma;

(iii) National Multi-Sectoral Strategic Framework for Economic Empowerment

(NMSFEE) was prepared and operationalized;

(iv) Public-Private Partnership Policy was developed and Act enacted in 2010; and

(v) A total of 4,437 entrepreneurs received concessionary loans worth TShs 4.2

billion for agriculture projects and small business in Rukwa, Lindi, Singida,

Mtwara and Manyara regions through Mwananchi Empowerment Fund (MEF).

Challenges

(i) Youth employment at all levels;

(ii) Enhancing employment of Tanzanians abroad and attracting Tanzanian

diasporas remittances and their skills;

(iii) Strengthening labour market information;

(iv) Improving labour productivity;

(v) Supporting decent work; and

(vi) Changing people’s mindset on empowerment aspects.

National Identification Project

193. The National Identification Authority (NIDA) as an authority is charged with

the responsibilities of running the National ID Project whose major objective include

147

to register, process and issue National ID cards to Tanzania citizens and eligible

residents who are non-residents.

Achievements

(i) National ID System Contractor Procurement Status: The tender document

was issued on 23 September, 2010 and the proposals for the tender were

submitted and opened on 8 December, 2010. Following the ongoing

evaluation process, the contractor of the National ID system is expected to be

procured by February, 2011, and thereafter start the pilot project;

(ii) Establishment of Technical and Management Infrastructure to support

National ID Operations and web enabled customer service system: NIDA has

secured a plot for the construction of the Data Center. Funding for the

implementation of the National ID Data center has been approved pending a

Feasibility Study for the project;

(iii) Strengthen birth , death and marriage registration system: In order to enable

the data collection for birth, death and marriage registration, specific

milestones have been recorded as follows: NIDA has secured plots for the

construction of the Districts Registration Offices (DRO) which will be used by

both RITA and NIDA in collection of information; NIDA has started the

procurement process for the consultant and contractors for Districts

Registration Offices which is expected to be completed by May 2011; and

NIDA in collaboration with other key stakeholders namely LGA, Immigration

and RITA has started the review of data collection mechanism which intends

on streamlining and harmonization of data collection from individuals;

(iv) Institute ICT Security and maintenance Standards: NIDA has obtained plots

for the construction of the Disaster Recovery Site to safeguard information in

case of disasters; and ICT Security being a cross-cutting issue that needs to

be complimented by policies and standards to work effectively, NIDA is in the

process of developing an ICT security policy, standards and guidelines which

will be geared towards Operationalization of Disaster Recovery Site, DRO and

Data Center;

148

(v) Establish an interfacing among government major systems such as passport,

driving license, visa, taxpayer identification number: In order to implement an

interface with government major systems, NIDA has started developing

business processes which will guide information sharing and exchange and

implementation of the National ID Database;

(vi) NIDA Capacity Building: NIDA currently has 43 employees and expects to

increase the workforce by recruiting another 105 technical staff; and

(vii) Public awareness: NIDA has conducted public awareness on the benefits the

National ID system to the Permanent Secretaries and Regional Administrative

Secretaries, Members of Parliament, Judges, Media, Regional Commissioners,

District Commissioners, and General Public.

Challenges

(i) Timely completion of the tendering process for the contractors on ID system;

(ii) Coordination and interfacing with other identification and registration systems

in the country; and

(iii) Enhancing public awareness on the benefits the National ID system.

Export Processing Zones (EPZ) and Special Economic Zone (SEZ)

194. The Government focused on promoting investments for export-led

industrialization through SEZ.

Achievements

(i) A total of 33 EPZ investments for undertaking manufacturing/processing

operations were registered;

(ii) Realization of capital investments of USD 251 million and total value of

exported goods of USD 289 million;

(iii) About 9,300 employment opportunities were created;

(iv) Survey and valuation of land for EPZ/SEZ for Mara (2316 Ha), Ruvuma (2207

Ha), Tanga (2000Ha), Bagamoyo (9000Ha) and Mererani (530Ha) were

completed;

149

(v) A total of 13 projects for establishing EPZ operations at Benjamin William

Mkapa Zone (BMW-SEZ) were approved; and

(vi) Areas for EPZ/SEZ development in Dodoma, Iringa, Shinyanga, Rukwa,

Tabora and Singida have been acquired.

Challenges

(i) Putting in place physical infrastructure/industrial parks; and

(ii) Ensuring reliable supply of utilities(power and water);

Business and Property Formalization Programme (BPFP)

Achievements

(i) A total of 20,838 farms under district councils were surveyed;

(ii) A total 7,183 Certificates of Customary Right of Occupancy (CCROs) were

prepared in the following Districts: Serengeti (1,386); Mvomero (1,847);

Mpwapwa (1,418); Njombe (818); Nachingwea (2,972); Manyoni (3,623);

Musoma (2,603); Makete (1,274); Bagamoyo (2,432) and Rufiji (2,465); and

(iii) Empowerment and capacity building in 12 new district councils and

continuation of the previous 12 district councils is in progress. Councils in

progress are: Masasi, Mwanga, Moshi Rural, Meru, Geita, Kasulu Rural,

Kahama, Sikonge, Muleba, Mbinga, Sumbawanga, and Mbarali. New district

councils are: Handeni, Bagamoyo, Mpwapwa, Mvomero, Nachingwea, Rufiji,

Musoma, Serengeti, Manyoni, Makete, Njombe, and Wete.

Challenges

(i) Mainstreaming and sustaining of formalization program in the Action Plans

and Budgets of Local Government Authorities; and

(ii) Land and boundary disputes in many districts.

Tanzania Social Action Fund

195. Tanzania Social Action Fund (TASAF) continued to improve access of

beneficiary households to enhance socio-economic services and income generating

opportunities.

150

Achievements

(i) A total of 10,095 projects worth 175.8 billion were funded;

(ii) A total of 4,108 projects worth 35.6 billion to support vulnerable groups were

funded;

(iii) A total of 6,453 subprojects were completed; and

(iv) A total of 2,120 poor households were supported under Community Based

Conditional Cash Transfer (CB-CCT) pilot program in Bagamoyo, Kibaha and

Chamwino.

Challenges

(i) Slow pace in moving community subprojects to completion;

(ii) Limited number of experts at LGAs and ward levels for supervision of the

large number of subprojects; and

(iii) Rising operating and maintenance costs.

Regional Integration

196. In order to scale up efforts for regional integration, the EAC member states

have established Custom Union and Common Market, while SADC member states are

in the process of establishing a Common Market. The EAC is already at a Common

Market following negotiations for establishment of the EAC Common Market Protocol

signed by the Heads of State on 20th November, 2009 in Arusha that allows free

movement of goods and services within the region.

Achievements

(i) Implementation of the EAC Common Market Protocol;

(ii) Preparation of EAC-COMESA-SADC Free Trade Area Road Map and

Institutional Framework;

(iii) Preparation of a National Strategy for Implementing the Common Market

Protocol;

151

(iv) Preparation of a country position and commencement of negotiations on the

establishment of the EAC Monetary Union;

(v) Pilot Manpower Survey for Tanzania was conducted in Dar es Salaam,

Mtwara, Mbeya, Dodoma, Kilimanjaro and Mwanza; and

(vi) The inauguration of the EAC Headquarters by EAC Heads of States in

November, 2010.

Challenges

(i) Effective administration, financing and implementation of the deeper stages of

integration.

(ii) Mainstreaming EAC integration agenda into Government’s policies and

strategies;

(iii) Public awareness on EAC integration is still limited among the various

stakeholders in the country;

(iv) Facilitating free circulation of goods and services in the Community while

safeguarding domestic revenue collection; and

(v) Identifying skills demand in the labour market in EAC-CM.

152

PERFORMANCE OF RSs AND LGAs

197. This section reviews performance and challenges faced by Regional

Secretariats (RSs) and Local Government Authorities (LGAs) during 2009/10 –

2010/11.

Decentralization by Devolution

198. The Government developed the second phase of the Local Government

Reform Programme II (Decentralization by Devolution) – LGRP II (D by D) with the

main focus of further strengthening LGAs and accelerating socio-economic

development, public service delivery and poverty reduction in their areas of

jurisdiction. The thrust of LGRP II is to ensure that the higher level LGAs enable and

support lower level LGAs and communities to more effectively participate in

development initiatives.

Performance Review for Regions and LGAs

Regional Administration

199. During the period under review, RSs continued with coordination and

backstopping of LGAs to attain social and economic development in their areas of

jurisdiction.

Achievements

(i) Improved working environment, through construction and rehabilitation of 17

Regional Administration blocks, three RCs’ residential houses, 26 District office

blocks and 23 DCs’ residential houses;

(ii) Improved infrastructures for provision of health services, whereby three

Regional Hospitals are under construction (Singida, Manyara and Mbeya). This

process also involved rehabilitation of 10 regional Hospitals (Arusha,

Morogoro, Kilimanjaro, Shinyanga, Kigoma, Rukwa, Tabora, Dodoma, Mwanza

and Coast Region);

(iii) Facilitated Regional Consultative Committees (RCCs), District Consultative

Committees (DCCs) and Inter-Council Forums Meetings; and

153

(iv) Coordinated social and economic activities provided by LGAs and other

stakeholders in their areas of jurisdictions;

(v) Prepared investment and land banks.

Local Government Authorities

200. During the period under review, LGAs have realized the following

achievements:-

(i) Integration of 132 District Secondary Education Offices in the LGAs

administrative structures;

(ii) An O & OD approach was rolled out to 13 more LGAs making a total of 105

LGAs using this approach;

(iii) Continued with construction and rehabilitation of classrooms, teachers’ houses

and pit latrines for Primary and Secondary Schools in 132 LGAs;

(iv) Continued with implementation of community projects in 132 LGAs under the

Local Government Transport Programme (LGTP), Agricultural Sector

Development Programme (ASDP), Health Sector Programme Support (HSPS),

Participatory Forest Management (PFM), Rural Water Supply and Sanitation

Programme (RWSSP), and the Local Government Development Programmes

financed by LGDG System;

(v) Construction, rehabilitation and maintenance of road infrastructures in villages

and district levels (i.e. routine maintenance of 21,157 km, spot improvement

of 6,086 km and periodic maintenance of 1,858 km);

(vi) Continued with interventions against HIV and AIDS pandemic through

improved health care, support and treatment for PLWHA, as well as increased

preventive measures, behavioural change initiatives and mobilizing people to

undergo voluntary testing in 132 LGAs;

(vii) Increased availability and use of modern agricultural implements, including

procurement of 65 tractors, 1,972 power tillers and 1,321 ploughs, through

cost sharing arrangements;

(viii) Completion of 26 District Land Use Plans and 702 Village Land Use Plans in 63

Districts. Further, 21 villages upgraded and gazetted into trading centres;

154

(ix) Increased own source revenue collection from TShs. 100.66 billion in 2008/09

to TShs. 117.78 billion in 2009/10;

(x) Construction of 25 offices for Members of Parliament and implementation of

community development projects through the CDCF in 132 LGAs; and

(xi) Continued with construction of 29 Council headquarters and 270 staff

quarters in 48 LGAs.

Challenges Facing RSs and LGAs

201. The following challenges have been facing RSs and LGAs in planning and

budgeting:-

(i) Meeting infrastructure requirements for provision of quality social and

economic development in LGAs;

(ii) Harmonized tools for planning and budgeting between LGAs, PMO-RALG,

MOFEA and other Ministries;

(iii) Attracting and retaining qualified personnel in underserved areas;

(iv) Harmonizing and rationalizing funding modalities from various stakeholders to

LGAs;

(v) Capacity to manage procurement processes in line with the Public

Procurement Act No 21 of 2004 and Regulations;

(vi) Instilling budgetary discipline among RSs and LGAs leaders and staff;

(vii) Accessing timely foreign funds for implementation of development projects in

LGAs;

(viii) Timely and adequate community contributions to development projects;

(ix) Timely and proper accounting for Direct to Project Funds (D-Fund); and

(x) Mobilizing and optimizing available potentials for own sources of revenue.

Resource allocation to Regions and LGAs

202. With regard to implementation of the D by D policy, a number of functions

and responsibilities along with respective budgets have been devolved to LGAs.

Likewise, higher levels of LGAs have been transferring funds allocated internally for

implementation of activities at lower levels (Wards, Villages/Mitaa and Vitongoji), to

enable effective governance and accountability at all levels. Notwithstanding the D

155

by D policy, Government subventions for implementation of activities and projects

under vertical programmes were channeled through respective MDAs.

203. During the period under review, LGAs continued to receive recurrent block

grants for implementing planned activities in all departments as guided by the

resource envelope and as passed by the Full Council meeting and finally approved by

the Parliament. In this context, recurrent block grants were provided to LGAs in the

form of Other Charges (OC). The PE budget was allocated based on approved

establishment, while the OC budget was determined by using the established

formula, whose variables reflect service delivery indicators as shown in Table 3.1.

Table 3.1: Resource Allocation Variables for Recurrent Block Grants

No. Sector Formulae/Variable Applicable

1. Personal Emoluments • Number of existing employees in the payroll

• Number of existing employees not in payroll

• Number of employees to be recruited

• Number of employees to be deleted from the payroll

2. Primary Education • Number of school-age children 100%

3. Secondary Education • Student population (day and boarding) 50%

• Number of students in boarding schools 20%

• Council area 20%

• Distance from Council to Regional Headquarters 10%

4. Health Services • Total population: 70%

• Number of poor residents: 10%

• District Medical Vehicle route: 10%

• Under-five mortality: 10%

5. Agriculture Extension • Number of villages: 80%

• Rural population: 10%

• Rainfall index: 10%

6. Water Services • Number of un-served rural residents: 90%

• Equal shares: 10%

7. Roads services • Road Network length: 75%

• Land area (cropped): 15%

• Number of poor residents: 10%

8. General Purpose Grant • Total Population: 50%

• Total Number of rural residents: 30%

• Fixed Lump Sum: 10%

• Total Number of Villages: 10%

204. With regard to formula allocation system, some LGAs were given ‘earmarked

resources’ based on specific requirements, such as school meals, special schools and

ration allowances (for fire and rescue services). Each LGA prepared the PE and OC

156

budget, as well as the development budget that were timely submitted their annual

budget to MoF for scrutinization, consolidation and approval by the Parliament.

205. Furthermore, underserved LGAs were given additional resources based on

specific problems identified during the period under review. These included LGAs

which do not attract qualified staff due to some inhibitive factors such as lack of

basic facilities.

157

PERFORMANCE REVIEW OF PUBLIC SECTOR REFORMS

206. During the year 2009/10, the Government continued to implement the Public

Sector reforms designed to boost macroeconomic performance in line with

Tanzania’s Development Vision 2025, Millennium Development Goals, and MKUKUTA

I. These programmes include; Public Service Reform Programme II (PSRP), Local

Government Reform Programme II (LGRP), the Legal Sector Reform Programme

(LSRP),National Anti-Corruption Strategy and Action Plan II (NACSAP), Business

Environment Strengthening for Tanzania II (BEST), Public Financial Management

Reform Programme III (PFMRP), and the Second Generation of Financial Sector

Reform programme (SGFSRP). During the period under review the following were

the achievements and challenges:

Public Service Reform Programme II

Achievements

(i) The Public Service Pay and Incentive Policy has been adopted;

(ii) Capacity building in Policy development was undertaken in five MDAs;

(iii) The National e-Government Strategy has been developed;

(iv) The establishment of an e-Government Agency was finalized and approved.

(v) Development of e-government portal has been completed;

(vi) Seven MDAs (PO-PSM, MOFEA, PO-PC, BUNGE DSM, Foreign Affairs, MOHSW,

and TGDLC) have been linked to e-government (WAN) and they are sharing

data freely, and voice services for communication;

(vii) Human Capital Management Information System (HCMIS) using LAWSON

software has been upgraded from version 7 to 9;

(viii) Human Resource Information System (HURIS) which is HCMIS support

system has been developed;

(ix) HURIS has been piloted in three LGAs namely; Kisarawe, Kibaha, and

Bagamoyo;

158

(x) Accountability and integrity in service delivery enhanced and strengthened

through adoption of OPRAS (44 MDAs), Clients Service Charter (29 MDAs),

and Monitoring and Evaluation (28 MDAs);

(xi) A checklist of Management Standards was developed to be used in place of

Management Standards for compliance inspections in MDAs;

(xii) The Public Service Leadership College has been established;

(xiii) Basic training in policy development was provided to the Directors of Policy

and Planning of all Ministries;

(xiv) Rolling out of Key Classification Filling System to 10 District Commissioners’

Offices was accomplished; and

(xv) Non recurrent records for permanent preservations for three Ministries namely

Ministry of Foreign Affairs and International Cooperation (MFAIC), President’s

Office Public Service Management (PO-PSM) and the Ministry of Health and

Social Welfare (MHSW) were identified and appraised.

Challenges

(i) Spearheading e-Government implementation across all levels of the

government.

(ii) Sustaining the capacity of monitoring and backstopping mechanisms for a

large number of implementing agencies.

(iii) Ensuring effectiveness of the demand-led approach in program

implementation.

(iv) Ensuring effective application of the Performance Management System (PMS)

tools such as the Strategic Planning, OPRAS, Client Service Charters, and

Service Delivery Surveys across the Government.

(v) Attracting and retaining competent staff in public services particularly in

underserved areas.

(vi) Enhancing public service pay in tandem with the expanding scope of public

service demand, coupled with the limited resources available.

159

Local Government Reform Programme (LGRP II)

Achievements

(i) Assessment of Local Government Authorities for 2010/11 was conducted,

whereby 128 out of 133 local Authorities qualified to get CDG fund;

(ii) Review of the Local Government Finances Act of 1982, the Local Authority

Financial Memorandum (LAFM) and the Local Authorities Accounting Manual

(LAAM) was undertaken to ensure they are D by D compliant;

(iii) Financial Management training for council planning officers, economists,

engineers, and procurement officers in all 133 LGAs on the new accounting

IPSAS framework was conducted;

(iv) Training of 133 LGAs’ Human Resource Management Officers on their roles

and how to prepare seniority list and, ICT facilities in terms of 139 computers

and printers were procured and distributed to all LGAs. (review this

achievement possibly to delete it);

(v) Sensitization of the public through 106 civil society organisations to demand

accountability from the public sector was conducted;

(vi) A monitoring and evaluation framework with 25 indicators has been

developed for LGAs within Local Government Reform PAF;

(vii) Improvement of working environment by providing various infrastructures and

facilities including 34 Hostels, 36 Houses, 8 Boats, 2 Bridges, 12 Solar

Generators in underserved 36 LGAs; and

(viii) Successful coordination of Grassroots Elections for civic leaders which was

held on 25th October 2009, whereby 17 registered political parties

participated in this election and 284,499 seats were contested.

Challenges

(i) Rolling out and strengthening of Integrated Financial Management System

(IFMS) to all LGAs;

(ii) Ensuring that decisions made by LGAs and their implementation are in

keeping with achievements of value for money; and

(iii) Integrity in revenue collection in the LGAs.

160

Legal Sector Reform Programme (LSRP)

Achievements

(i) Capacity of the Law School of Tanzania has been enhanced in terms of

premises; training programmes, Assessment and Awards, and development of

training manuals;

(ii) Improved access to justice for persons in remand homes and prisons, through

provision of five buses for transportation of inmates to speed up case

hearing;

(iii) Decongestion of retention facilities has been effected through rehabilitation of

prisons and remand homes;

(iv) Police Investigative capacity has been improved through training of 825

investigators in modern investigation skills and procurement of investigation

tools;

(v) Women and children desk have been established in all police stations across

the country, and juvenile detention facilities installed at three police stations;

(vi) A total of 45 officers were trained as trainers among others, on gender based

violence and crimes;

(vii) A total of 195 police officers were trained in human rights observance and

good governance;

(viii) Prosecution services enhanced through expansion of prosecution centers to

Regions and District;

(ix) LSRP strengthened through active involvement of Non-state Actors;

(x) LSRP has been mainstreamed into the national planning and budgeting

framework for timely approval and implementation;

(xi) LSRP Monitoring and Evaluation framework reviewed and strengthen based

on refocused LSRP work plan and priorities; and

(xii) Programme Coordination Office has been strengthened by recruiting technical

advisors in the area of financial management, procurement and gender.

161

Challenges

(i) Coping with the changing social culture of the people triggered by

urbanization, expansion and intensified interaction with other cultures;

(ii) Aligning the new pluralistic democratic political environment, and the

movement towards participatory management of socio-economic

development;

(iii) Timely response to the complexities of market led economy which needs legal

framework to change accordingly;

(iv) Adoption and adaptation of ICT as admissible evidence in the legal sector;

(v) Ensuring availability of adequate Judges and Magistrates across the country;

and

(vi) Ensuring adequate court facilities.

NACSAP II

Achievements

(i) Integrity Committees (ICs) in 25 Ministries, 35 Independent Departments, and

68 Government Agencies were trained on Anti-corruption, Ethics and the

roles and functions of the Committees;

(ii) Adoption and operationalisation of Election Expenses Act, 2010;

(iii) Awareness on the implementation and enforcement of the Election Expenses

Act No. 6 of 2010 was created through training of Police Officers (131),

Council Directors (133) and Media Chief Editors (33);

(iv) Peer Oversight Mechanism was introduced as part of controlling measures for

unethical behaviour to media employees and Integrity Committee in each

media house;

(v) Anti-corruption interventions were mainstreamed in MDA’s and LGA’s plans

and budgets;

(vi) Tanzania Anti-Corruption Network was registered as a coalition of Non-state

Actors to fight and combat corruption;

162

(vii) Improved levels of Good Governance in the country as reflected in the

Transparency International Corruption Perception Index report (2010), and

MO Ibrahim Foundation Report 2010; and

(viii) Monitoring and evaluation mechanism of NACSAP II was reviewed.

Challenges

(i) Strengthening coalition between state and non-state actors in the fight

against corruption;

(ii) Enhancing the capacity and role of Integrity Committee members at all

government levels to enable them implement NACSAP II efficiently; and

(iii) Enhancing capacity of Oversight and Watchdog institutions in the use of ICT

to detect corruption practices.

Business Environment Strengthening For Tanzania (BEST)

Achievements

(i) A total of 62,000 Companies and 115,000 business names together with

taxonomy of acceptable names now available on BRELA’s website

(www.brela.cats-net);

(ii) Land Registration and Land Information has been improved in the Registrar of

Titles and the Zonal Registration offices;

(iii) Identification and sighting of absolute Gravity at three stations (Dar es

Salaam, Mwanza and Mbeya), and relative gravity densification in selected

aerodromes in enhancing the geodetic control and mapping completed;

(iv) Systematic titling in Babati and Bariadi pilot district, including preparation of

village land use plans for 35 villages in Bariadi and 15 villages in Babati

district has been completed;

(v) Adjudication of Land Parcels in 31 villages (30,000 parcels) of Bariadi district

and 15 villages (18,169 parcels) of Babati district has been completed;

(vi) Formalisation of Property in Unplanned Urban Settlements in Dar es Salaam

1,057 plots and Mwanza 20,542 plots have been identified and computerized;

163

(vii) A total of 39 District Land Housing Tribunals (DLHTs) have been

strengthened;

(viii) ICT facilities Including audio recording equipment and video conferencing are

currently in use in selected Courts (Kisutu and High Court); and

(ix) Roadmap on improving Tanzania's performance in doing business has been

developed and quick wins identified.

Challenges

(i) Enhancing the pace of reviewing and implementing legal and regulatory

framework for doing business in Tanzania;

(ii) Enhancing the pace of creating enabling environment for doing business; and

(iii) Wide use of ICT potential to promote good business environment in Tanzania.

Public Financial Management Reform Programme (PFMRP)

Achievements

(i) The Public Finance Act, CAP 348 has been amended to increase the oversight

function of the ACGEN over Local government Finances. The amendment also

establishes the Government Internal Audit Department to strengthen internal

oversight function of the government;

(ii) Budget transparency has been enhanced by developing and disseminating the

Budget Background and Medium Term Framework 2009/10-2011/12;

(iii) The Treasury Registrar (Powers and Functions) Act, CAP 370, the Public

Corporations Act CAP 257, and the National Bank of Commerce

(Reorganisation and Vesting of Assets and Liabilities) Act, CAP 404 were

amended to give more regulatory powers to the Office of the Treasury

Registrar;

(iv) Electronic Fund Transfer which links with IFMS and TISS was adopted by 45

MDAs and Dar es Salaam region;

(v) National Audit Office strengthened through capacity building measures and

retooling;

164

(vi) Strengthening the capacity to procure goods and services through training of

1904 PEs staff by PPRA, making follow up audit to 99 PEs, rolling out

Procurement Management Information System (PMIS) to 69 PEs and

registered 122 new PMIS users into the system, conducting feasibility study

on e-procurement and making weekly publication of the Tanzania

Procurement Journal Supplement; and

(vii) Training Institutions dealing with Public Finance Management (PFM) facilitated

in terms of ICT equipments, training materials, and books. NBAA was

facilitated to review accountants curricular and conduct ToT training on the

reviewed curricula, TIA and IAA capacity was enhanced by supplying them

with books and laptops.

Challenges

(i) Capacity to effectively operationalise and roll out core IFMS modules at LGAs;

(ii) Enhancing domestic revenue collection;

(iii) Enhancing the pace of PFM issues implementation; and

(iv) Harmonization of systems and the budget tools like SBAS, IFMS, RIMKU, Plan

Rep for effective budget management and budget execution reporting.

Second Generation Financial Sector Reform-Financial Sector Support

Project

Achievements

(i) The Credit Reference Bureau Regulations, 2010 were gazetted and became

effective in October 2010;

(ii) Credit Reference Databank (CRD) Regulations, 2010 were gazetted and

became effective in October 2010. The CRD is to be housed in the Bank of

Tanzania. The Bank has prepared a bidding document for supply of hardware

and software, installation, commissioning and training of users of the

databank;

(iii) Regarding the Corporate and Municipal Bonds Markets, a Consultant was

engaged to carry out a feasibility study of establishing Municipal Bonds

165

Market in Tanzania and recommend policy options. The Draft report was

tabled at the Stakeholders workshop in August 2010. The Final report was

submitted in November 2010 and is currently being reviewed by FSP Financial

Markets Technical Team and Capital Market and Securities Authority (CMSA)

Management and Board. It will be forwarded to the FSP Project Coordinating

Committee (PCC) for review in January 2011 and will thereafter be submitted

to the Inter-Institutional Committee (IIC) before adoption by the

Government; and

(iv) Reforming the Pension Sector: following enactment of the Social Security

Regulatory Authority (SSRA) in 2008, the office of the SSRA was established

in November 2010. The SSRA was tasked to promote an efficient and

competitive pension sector supported by appropriate legal and regulatory

structures. Recommendations on harmonization of Laws establishing various

Social Security Funds have been finalized and will be submitted in the

February 2011 Parliamentary Session.

Challenges

(i) Harmonising borrowing and lending interest rate.

(ii) Broadening financial inclusiveness.

(iii) Promotion of a vibrant financial market.

(iv) Harmonising conflicting laws on social security funds.

Coordination of the Reforms

207. The establishment of the Reform Coordination Unit is a strategy through

which the Government is consistently being informed on the progress made in these

reforms. During the period under review several achievements and challenges have

been registered.

Achievements

(i) Mainstreaming of Reform programme interventions in MDAs, Regions, and

LGAs plans and budgets enhanced ownership and accountability;

166

(ii) Increased level of reform coordination, complementarity and implementation

pace as a result of improved synergy of the reform programs;

(iii) Improved quality of plans and enhanced transparency through effective

involvement and participation of key stakeholders in core reform programmes

planning processes; and

(iv) Improved monitoring and evaluation processes of the core reforms.

Challenges

(i) Increasing implementation pace of reform programmes;

(ii) Capacity building for effective change management; and

(iii) Enhancing information sharing, quality dialogue and public awareness about

reforms.

167

PERFORMANCE OF PUBLIC INVESTMENTS

208. This section highlights the management and performance of the public

investments, including their contribution to Government coffers and service delivery

to the public. Achievements, challenges, and their future endeavour are also

covered.

209. The Government has invested in 243 institutions including Joint Ventures in

different sectors of the economy. As of 30th June 2010, the Treasury Registrar

Statement shows that, the total value of the public investments increased to Tshs.

7,882.74 billion from Tshs. 6,284.04 billion in June, 2009. The investments are in

local and foreign, profit and non-profit oriented categories, as follows:-

(i) Local Profit Oriented - 100% Government owned institutions

210. An investment in 192 institutions, where the Government has 100 percent

ownership was worth Tshs. 318.535 billion as of 30th June, 2010, compared to Tshs

234.301 billion as of 30th June 2009. The National Housing Corporation carried a

greater portion of this investment category constituting 68 percent followed by

Tanzania Investment Bank (TIB) with 18 percent.

(ii) Local Profit Oriented - Joint Venture owned investments

211. Investments in 41 local institutions, where the Government has Joint Venture

ownership worth Tshs. 388.144 billion as of 30th of June, 2010, as compared to

Tshs. 483.909 billion as of 30th June 2009. These investments include Tanzania

Zambia Railways Authority (TAZARA) 30 percent, National Microfinance Bank (NMB)

15 percent and National Bank of Commerce (NBC) Ltd 12 percent of the total

investment in this category. The reason for the movement from Tshs 483.909 billion

in the year ending June 2009 to Tshs 388.144 billion in the year 2010, to a greater

extent was attributed by TTCL negative reserve of Tshs 165 billion which was

recognized and recorded in TR investment statement of year ending June 2010.

168

(iii) International Profit Oriented Joint Venture investments

212. Investments in this category are mainly in insurance, banking sector and

other financial institutions at international level. As of 30th June, 2010 the

Government had Joint Venture investments amounting to Tshs. 113.638 billion,

compared to Tshs.140.470 billion by 30th June 2009 in nine international institutions.

African Development Bank (ADB) constituted 74 percent of the total investment. The

drop in such investments is attributed to an increase in IDA negative reserves by

Tshs. 12.8 billion, EADB by Tshs. 3.3 billion while IFC Reserves decreased by about

Tshs. 4 billion in 2010.

(iv) Non Profit Oriented Institutions, Agencies, and Authorities

213. The Government has a total of 150 institutions in this group. Investments in

this category amounted to Tshs. 7,053.514 billion as of 30th June 2010, compared to

Tshs. 5,369.320 billion as at 30th June 2009. The main objective of investment by

Government in this group is not profit earning but rather service delivery and

safeguarding welfare of the public. The leading institutions in this category in terms

of public investments are Tanzania Electric Supply Company (TANESCO) constituting

13 percent and Tanzania Ports Authority (TPA), 5 percent of total investments in this

category.

Strengthening Management of Public Investments

214. There are a number of enactments that govern the management of Public

Investments. These include; The Treasury Registrar Powers and Functions CAP 370

as amended; The Public Corporations Act CAP 257 as amended; The Public Finance

Act CAP 348 as amended; The Public Service Act CAP. 298; and The Executive

Agencies Act, CAP. 245 as amended. The Government’s thrust is to ensure improved

performance and sustainability of the public institutions and strengthening

monitoring and evaluation mechanism to promote accountability.

215. For improved performance, the Government continues to implement

restructuring of public enterprises as part of the wide ranging reforms in the

management of the economy. Models used are privatization through sale of assets

or shares, concession and joint venture, management contracts and liquidation. For

169

commercial loss making enterprises, the models used are asset sale, share sale or

joint venture, while for utilities the option used was through concessions and those

with huge unrecoverable debts were liquidated. The Restructuring aims to increase

revenue, productivity and reduction of financial burden to the Government.

Contribution of Public Investments to the Government Coffers

216. The public investments contribute to the Government coffers through

payment of dividends, corporate tax, other taxes and levies in the case of

commercial enterprises. A summary of revenue collection through the Treasury

Registrar for the past three years is as shown in Table 5.1:-

Table 5.1: Revenue Collection from Public Institutions (Tshs.)

ITEM 2007/08 2008/09 2009/10

Dividends 57,147,501,891 31,323,253,591 15,127,480,388

Principal Loans & Interest

11,503,625,043 6,795,002,070 11,465,621,623

Other Proceeds and Remittances

8,300,000,000 46,001,873,960 14,056,617,906

TOTAL 76,951,126,934 84,120,129,620 40,649,719,917

Source: Treasury Registrar Statements as at 30th June 2010

170

Figure 5.1: Revenue Collection from Public Investments (Tshs million)

217. The amount collected in respect of dividends, loan repayments and other

proceeds by June 2010, by the Treasury Registrar during the year 2009/10 was Tshs

40.65 billion, compared to Tshs 84.12 billion collected during 2008/09. The

decrease in revenue realized in 2009/10 is mainly attributed to a decrease in other

proceeds, remittances and dividends, due to poor performance of investments

during the Global Financial Crisis. Also, stoppage of collections from one time

activities, such as Initial Public Offering (IPO), also contributed in decline of revenue

for the year under review. Nonetheless, collections for the year 2009/10 surpassed

the estimated revenue budget for the period, of Tshs 38.37 billion. As at 30th June,

2010 earnings from the profit-oriented 100 percent Government owned category

was Tshs. 0.188 billion, which is equal to 0.06 percent return on investment.

Earnings from joint venture local category was Tshs. 14.916 billion, which is equal to

3.84 percent return on investment, while earnings from joint venture foreign

category was Tshs. 0.024 billion, which is equal to 0.021 percent return on

investment. Earnings in terms of remittance from non-profit oriented category were

Tshs. 14.057 billion, which is equal to 0.2 percent return on investment.

218. The results above show that return on investment in 100 percent Government

owned enterprises is minimal, compared with returns on investment in joint

ventures. This is mainly due to poor performance of 100 percent Government owned

171

enterprises. Examples are the National Insurance Corporation and the Air Tanzania

Corporation Limited which are still drawing their operational funds from the

Government coffers. Regarding TR Estimates for the year 2010/2011, the estimates

are as follows: Dividends Tshs. 36,747,300,000, Loans Tshs. 13,530,400,000 and

Remittances Tshs. 1,178,600,000.

Achievements

219. During the period under review, notable achievements have been recorded,

including the following:

(i) Increased domestic and foreign private investments;

(ii) Increased productivity and improved performance of enterprises through

improved technologies, whose examples are Tanzania Cigarette Company,

Tanzania Breweries Limited and Aluminium Africa ;

(iii) Improved services delivery and quality products;

(iv) Empowerment of indigenous to own shares in privatized enterprises like the

National Microfinance Bank and Tanzania Breweries Limited;

(v) Increased employment opportunities as a result of privatization;

(vi) Amendments were done to the Acts establishing the Treasury Registrar Office

and a new Organization Structure was developed and approved; and

(vii) Increased financial management accountability on public institutions with

updated accounts.

Challenges 220. Despite the above-mentioned achievements, there are still challenges to be

addressed. These include:

(i) Reducing the budgetary burden to the Government from economically non-

viable institutions;

(ii) Ensuring that public enterprises that have been divested achieve the intended

objectives for which they were established;

(iii) Sustaining the public enterprises divestiture momentum;

(iv) Ensuring effective oversight of parastatals and Government Institutions;

172

(v) Existence of conflicting statutes establishing and governing operations of

Public Institutions; and

(vi) Ensuring good management and capitalization of the public institutions;

particularly ATCL, TRL, TTCL, DAWASCO, and TANESCO:

• TTCL: Government owns 65% of the stake in TTCL and controls

management. The company is making losses and the investor who

owns 35% is not keen to sustain the partnership. Efforts are underway

to find another investor. The company is currently making huge losses

and considerable funds for new investments are needed;

• ATCL: The strategic partner of Air Tanzania Company Limited (ATCL)

which was South Africa Airways (SAA) left in year 2006 after a period

of substantial losses. At the moment, ATCL is 100% Government

owned and efforts are under way to secure a new private sector

strategic investor. The company persistently makes losses;

• TANESCO: Management contract was terminated in year 2005 and

reverted back to public management. TANESCO is de-specified and

efforts are being done to see how it can be separated into three

entities namely generation, transmission and supplies. At the moment

technical and financial performance is deteriorating; and

• TRL: The 25 year lease contract of year 2006 with RITES of India has

shown major weakness in meeting performance targets. The process is

underway to terminate the lease with RITES and seek for a new

strategic investor later on. Losses continue and the financial burden is

big.


Recommended