This PDF is a selection from an out-of-print volume from the National Bureau of Economic Research Volume Title: Trends in the American Economy in the Nineteenth Century Volume Author/Editor: The Conference on Research in Income and Wealth Volume Publisher: Princeton University Press Volume ISBN: 0-870-14180-5 Volume URL: http://www.nber.org/books/unkn60-1 Publication Date: 1960 Chapter Title: The United States Balance of Payments, 1861-1900 Chapter Author: Matthew Simon Chapter URL: http://www.nber.org/chapters/c2492 Chapter pages in book: (p. 629 - 716)
Transcript
This PDF is a selection from an out-of-print volume from the NationalBureau of Economic Research
Volume Title: Trends in the American Economy in the Nineteenth Century
Volume Author/Editor: The Conference on Research in Income and Wealth
Volume Publisher: Princeton University Press
Volume ISBN: 0-870-14180-5
Volume URL: http://www.nber.org/books/unkn60-1
Publication Date: 1960
Chapter Title: The United States Balance of Payments, 1861-1900
Chapter Author: Matthew Simon
Chapter URL: http://www.nber.org/chapters/c2492
Chapter pages in book: (p. 629 - 716)
The United States Balance of Payments,1861—1900
MATFHEW SIMONPACE COLLEGE
THIS paper presents estimates of each of the components of the balanceof international payments of the United States for the period 1861—1900.Annual figures of the net international capital movements were derivedthrough the residual method, a procedure which requires independentestimation of each of the visible and invisible items on current accountand of net gold and silver movements to compute the yearly net flow ofcapital across the nation's boundaries. The estimates, together withNorth's estimates on the balance of international payments for 1790—1860, are the first attempt to employ the residual method in a compre-hensive fashion in this field.'
Two sets of data on the nation's international economic transactionswere available for the late nineteenth century. As part of his investiga-tion of the mechanism of adjustment under an inconvertible paperstandard, Frank D. Graham in 1922 developed independent estimatesfor the following invisible items: freight payable and receivable, netinterest payments, loans floated, and repayments on loans for the fiscalyears 1860_78.2 His data suffer from some important limitations. Noexplicit references were made to the technique of calculation. Moresignificantly, several items on current account were omitted from hisinternational balance sheet, in addition, the volflme of loans floatedand repayment of loans do not represent accurately the annual netinternational capital movements of the United States. No provisionwas made for short term capital movements or for other forms of longterm capital transactions. The fragmentary character of Graham's data
' For recent annual balance of payments estimates for nineteenth-century Great Britaincf. Albert H. Imlah, "British Balance of Payments and the Export of Capital, 1816—1913,"Economic Histoiy Review, 2d series, Vol. 2, 1952, pp. 234—239, and Alexander K. Cairncross,Home and Foreign Investment, 1870—1913, Cambridge University Press, 1953, P. 180.
2 Frank D. Graham, "International Trade Under Depreciated Paper—the UnitedStates, 1862—1879," Quarterly Journal of Economics, November 1922, p. 231.
Note: This paper is a substantial revision of the statistical chapter of my doctoraldissertation "Cyclical Fluctuations and the International Capital Movements of theUnited States, 1866-1897" (Columbia University, 1955). it was prepared at the suggestionof Professor James W. Angell and has benefited from the constructive criticisms of Mr. KarlHansson of the United Nations Secretariat, Dr. Charles Hoffman of Queens College, andDr. Douglass North of the National Bureau of Economic Research and the University ofWashington.
629
BALANCE OF PAYMENTS
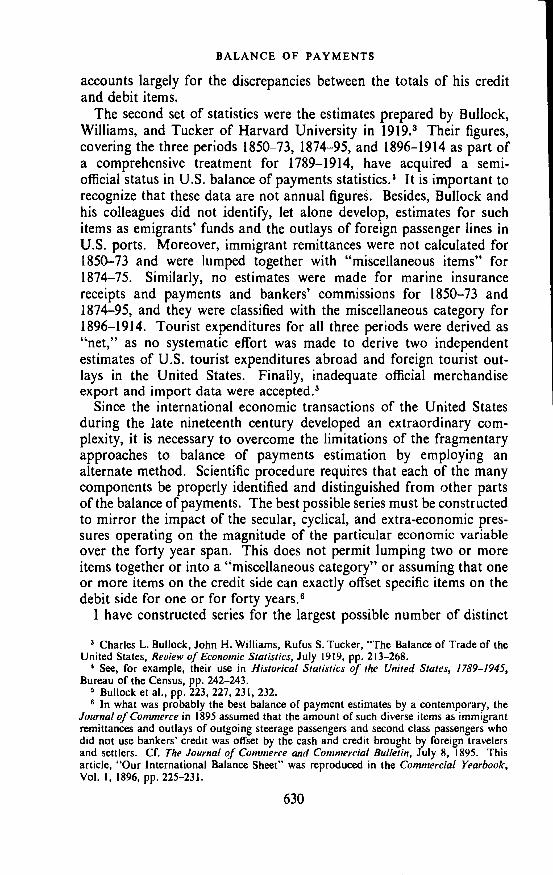
accounts largely for the discrepancies between the totals of his creditand debit items.
The second set of statistics were the estimates prepared by Bullock,Williams, and Tucker of Harvard University in Their figures,covering the three periods 1850—73, 1874—95, and 1896—1914 as part ofa comprehensive treatment for 1789—1914, have acquired a semi-official status in U.S. balance of payments statistics.' It is important torecognize that these data are not annual figures. Besides, Bullock andhis colleagues did not identify, let alone develop, estimates for suchitems as emigrants' funds and the outlays of foreign passenger lines inU.S. ports. Moreover, immigrant remittances were not calculated for1850—73 and were lumped together with "miscellaneous items" for1874—75. Similarly, no estimates were made for marine insurancereceipts and payments and bankers' commissions for 1850—73 and1874—95, and they were classified with the miscellaneous category for1896—1914. Tourist expenditures for all three periods were derived as"net," as no systematic effort was made to derive two independentestimates of U.S. tourist expenditures abroad and foreign tourist out-lays in the United States. Finally, inadequate official merchandiseexport and import data were accepted.5
Since the international economic transactions of the United Statesduring the late nineteenth century developed an extraordinary com-plexity, it is necessary to overcome the limitations of the fragmentaryapproaches to balance of payments estimation by employing analternate method. Scientific procedure requires that each of the manycomponents be properly identified and distinguis.hed from other partsof the balance of The best possible series must be constructedto mirror the impact of the secular, cyclical, and extra-economic pres-sures operating on the magnitude of the particular economic variableover the forty year span. This does not permit lumping two or moreitems together or into a "miscellaneous category" or assuming that oneor more items on the credit side can exactly offset specific items on thedebit side for one or for forty years.6
1 have constructed series for the largest possible number of distinct
Charles L. Bullock, John H. Williams, Rufus S. Tucker, "The Balance of Trade of theUnited States, Review of Economic Statistics, July 1919, pp. 213—268.
See, for example, their use in Historical Statistics of the United States, 1789—1945,Bureau of the Census, pp. 242—243.
Bullock et a!., pp. 223, 227, 23!, 232.6 In what was probably the best balance of payment estimates by a contemporary, the
Journal oJ Commerce in 1895 assumed that the amount of such diverse items as immigrantremittances and outlays of outgoing steerage passengers and second class passengers whodid not use bankers' credit was offset by the cash and credit brought by foreign travelersand settlers. Cf. The Journal of Commerce and Commercial Bulletin, July 8, 1895. Thisarticle, "Our International Balance Sheet" was reproduced in the Commercial Yearbook,Vol. 1, 1896, pp. 225—231.
630
U.S. BALANCE OF PAYMENTS, 1861-1900
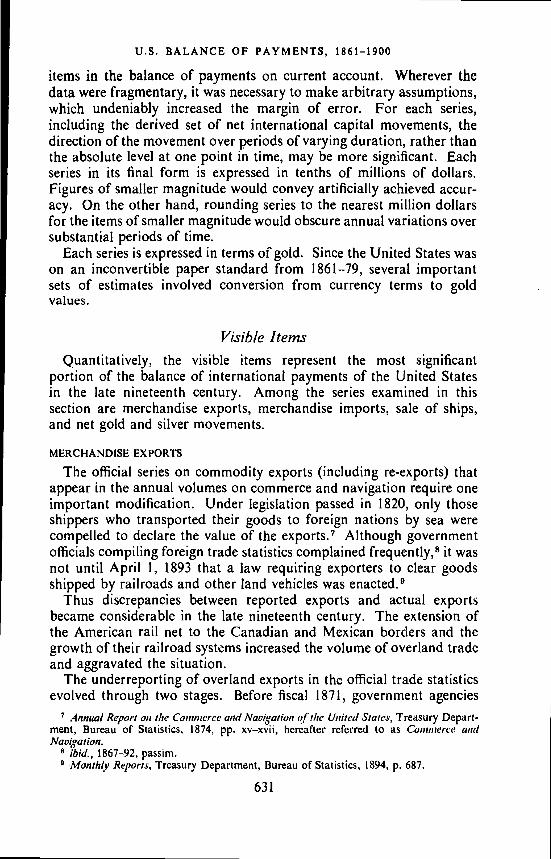
items in the balance of payments on current account. Wherever thedata were fragmentary, it was necessary to make arbitrary assumptions,which undeniably increased the margin of error. For each series,including the derived set of net international capital movements, thedirection of the movement over periods of varying duration, rather thanthe absolute level at one point in time, may be more significant. Eachseries in its final form is expressed in tenths of millions of dollars.Figures of smaller magnitude would convey artificially achieved accur-acy. On the other hand, rounding series to the nearest million dollarsfor the items of smaller magnitude would obscure annual variations oversubstantial periods of time.
Each series is expressed in terms of gold. Since the United States wason an inconvertible paper standard from 1861—79, several importantsets of estimates involved conversion from currency terms to goldvalues.
Visible ItemsQuantitatively, the visible items represent the most significant
portion of the balance of international payments of the United Statesin the late nineteenth century. Among the series examined in thissection are merchandise exports, merchandise imports, sale of ships,and net gold and silver movements.
MERCHANDISE EXPORTS
The official series on commodity exports (including re-exports) thatappear in the annual volumes on commerce and navigation require oneimportant modification. Under legislation passed in 1820, only thoseshippers who transported their goods to foreign nations by sea werecompelled to declare the value of the exports.7 Although governmentofficials compiling foreign trade statistics complained frequently,8 it wasnot until April 1, 1893 that a law requiring exporters to clear goodsshipped by railroads and other land vehicles was enacted.9
Thus discrepancies between reported exports and actual exportsbecame considerable in the late nineteenth century. The extension ofthe American rail net to the Canadian and Mexican borders and thegrowth of their railroad systems increased the volume of overland tradeand aggravated the situation.
The underreporting of overland exports in the official trade statisticsevolved through two stages. Before fiscal 1.871, government agencies
Annual Report ci: the and Navigation of the Vizited States, Treasury Depart-ment, Bureau of Statistics, 1874, pp. xv—xvii, hereafter referred to as and
lion.8 ibid., 1867—92, passim.
Monthly Reports, Treasury Department, Bureau of Statistics, 1894, p. 687.
631
BALANCE OF PAYMENTS
did not collect any data on the shipments of goods by rail or carriage toCanada or Mexico. Despite their relative insignificance, as early as1867, Alexander Delmar, first director of the Treasury Department'sBureau of Statistics, noted discrepancies in the figures on U.S. exportsto Canada ranging between $6 and $11 million between the Americanand Canadian returns for the fiscal years 1 865—67.'° This condition wasprobably one factor in the voluntary partial underreporting thatcharacterized the nation's overland export statistics, 1871—93. Differ-ences of $10 to $15 million between the Canadian and U.S. statistics(about twice the reported overland trade) were noted during the 1870's(see Table 1, cols. 9 and 10). Between 1885 and 1893, the authoritiesestimated that the extent of the underreporting of overland exports wasmore than $20 million or amounts representing the bulk of the reportedstatistics." Accordingly the development of more realistic statisticsrequired the estimation of the values of commodities shipped from theUnited States that had been excluded from the official data. Thisoperation is discussed in the following sections.
The Northern BorderThe Canadian trade statistics of imports from the United States
provided the point of departure for the adjustments performed on theofficial U.S. series. The first stage involved obtaining two sets of figuresas comparable as possible. For fiscal 1861—79, the task required theresolution of two formidable difficulties. Before 1873, the U.S. data,unlike the Canadian series, show exports to British North America andto Canada with no adequate breakdown by provinces, a factor ofconsiderable importance, since the geographic area encompassed by"Canada" evolved before 1867. Until that time, with the establishmentof the Dominion of Canada, the provinces of Quebec and Ontario weredescribed as Canada. The formation of the Dominion involved theaddition of New Brunswick and Nova Scotia. Three years later, in1870, Manitoba joined the Dominion, then British Columbia in 1871,and Prince Edward Island in 1873. if the Canadian figures are used tomeasure the exports of the United States to Canada, no question existsas to the scope of the coverage.
Another problem is involved in the use of the U.S. series for total10 Commerce and Navigation, 1867, pp. xxii—xxiv. Commenting on the 1820 law, Delmar
observed: ". . . when the law was passed, there were no railway carriages in vogue;nevertheless a considerable portion of the foreign trade of the United States (across ourland frontier) was even then transported, as some of it is still, on wagons, sleds and othervehicles; while at the present day our export traffic to British North America by railwayis large." -
The unofficial estimate of the government of the gap in the reported overland trade toCanada in 1885 was between $22 to $25 million; in 1888, $20 million. Finally, the figurefor underreporting to all areas was estimated at $27,433,816 in 1892. Cf. Commerce andNavigation, 1886, p. xii; 1888, p. xii; and 1892, P. xxxi.
632
TAB
LE 1
Uni
ted
Stat
es a
nd C
anad
ian
Serie
s on
Uni
ted
Stat
es M
erch
andi
se E
xpor
ts to
Can
ada,
186
1—19
00(th
ousa
nds o
f dol
lars
, gol
d va
lues
, unl
ess o
ther
wis
e no
ted)
UN
ITED
STA
TES
SER
IES
Dom
estic
Gol
d an
d M
erch
andi
se E
xpor
ts
Mer
chan
dise
Ave
rage
Mer
chan
dise
Exp
orts
DIF
FE
RE
NC
E
Tota
l(c
urre
ncy
Gol
dF
isca
l(m
ixed
valu
es)
Prem
ium
Dom
estic
Tot
alC
AN
AD
IAN
Cal
cula
ted
Yea
rva
lues
)G
old
(I)
—(2
)(8
)(3
) x(4
)F
orei
gn(5
) +
(6)
SE
RIE
S(8
) —(7
)R
epor
ted
(1)
(2)
(3)
(4)
(5)
(6)
(7)
(8)
(9)
(10)
z C)
1861
11,7
50—
11,7
5011
,750
2,22
913
,979
20,2
06+6
,227
1862
11,2
8246
710
,815
102
10,6
032,
061
12,6
6S22
,643
+9,9
7918
6318
,431
3,66
114
,769
137.
110
,773
2,65
213
,425
18,4
58+5
,033
1864
26,2
672,
379
23,8
8815
6.2
15,2
932,
420
17,7
13(7
,952
)
1865
18,3
062,
830
15,4
7720
1.9
7,66
690
68,
572
14,8
21+6
,249
+5,9
9418
6615
,334
4,26
711
,066
140.
47,
882
1,12
39,
004
15,2
43+6
,238
+7,6
43rn
1867
12,4
423,
110
9,33
214
16,
618
510
7,12
814
,061
+6,9
33+1
1,09
318
6814
,816
1,84
112
,975
139.
99,
275
2,03
511
,311
22,6
60+1
1,34
918
6918
,189
610
17,5
7913
7.5
12,7
852,
859
15,6
43+5
,854
1870
19,3
661,
465
17,9
0112
3.3
14,5
183,
952
18,4
7021
,697
+3,2
2818
7126
,528
2,14
424
,384
112.
721
,636
4,48
826
,124
27,1
86+1
,062
1872
24,7
953,
337
21,4
5811
1.8
19,1
934,
838
24,0
3233
,742
+9,7
1018
7332
,358
4,00
728
,350
114.
624
,738
4,18
528
,923
45,1
89+1
6,26
6+1
2,41
1o
1874
40,8
713,
622
37,2
4911
233
,258
4,57
937
,837
51,7
07+1
3,87
0+1
0,20
0
1875
32,6
672,
071
30,5
9611
2.7
27,1
483,
95!
31,0
9948
,930
+17,
831
+15,
660
1876
32,0
032,
057
29,9
4611
3.9
26,2
913,
430
29,7
2144
,100
+14,
379
+10,
508
1877
36,1
951,
453
34,7
4210
7.9
32,1
982,
677
34,8
7549
,376
+14,
501
+13,
052
1878
34,6
1481
133
,802
102.
532
,978
3,34
436
,322
48,0
03+1
1,68
118
7928
,394
1,22
227
,172
100.
427
,064
2,43
229
,496
42,1
70+1
2,67
4+1
3,15
8
cont
inue
d on
nex
t pag
e
TAB
LE 1
con
clud
ed
UN
ITED
ST
AT
ES
SER
IES
Dom
estic
Gol
d an
d M
erch
andi
se E
xpor
ts
Mer
chan
dise
Ave
rage
Mer
chan
dise
Exp
orts
DIF
FE
RE
NC
E
Tot
al(c
urre
ncy
Gol
dF
isca
l(m
ixed
valu
es)
Prem
ium
Dom
estic
Tot
alC
AN
AD
IAN
Cak
ulat
edY
ear
valu
es)
Gol
d(1
)—
(2)
(8)
(3) x
(4)
Fore
ign
(5)
+ (
6)S
ER
IES
(8) —
(7)
Rep
orte
d(1
)(2
)(3
)(4
)(5
)(6
)(7
)(8
)(9
)(1
0)
1880
26,7
572,
703
29,4
6028
,194
—1,
266
+9,9
8118
8134
,200
3,70
437
,903
36,3
39—
1,56
5+9
,630
1882
33,2
353,
266
36,5
0047
,053
+10,
553
+14,
023
1883
40,7
173,
701
44,4
1755
,147
+10,
730
+14,
878
1884
40,4
243,
882
44,3
0649
,786
+5,4
8018
8534
,112
4,13
338
,246
45,5
77+7
,331
1886
30,6
442,
819
33,4
6342
,819
+9,3
3618
8732
,328
2,66
034
,988
44,7
96+9
,808
>18
8833
,074
2,80
935
,882
46,4
40+
10,5
5818
8938
,279
2,32
940
,608
50,0
29+9
,422
1890
37,3
282,
954
40,2
8251
,366
+ 11
,084
1891
36,0
532,
095
38,1
4852
,033
+ 13
,886
1892
41,0
062,
294
43,3
0051
,742
+8,4
4218
9343
,027
3,76
746
,794
52,3
40+5
,545
1894
50,0
416,
623
56,6
6450
,746
—5,
918
1895
47,7
885,
067
52,8
5550
,179
—2,
674
1896
53,0
636,
625
59,6
8853
,529
—6,
158
1897
58,4
656,
464
64,9
2957
,023
—7,
905
1898
77,4
506,
264
83,7
1474
,825
—8,
889
1899
81,0
106,
965
87,9
9588
,467
+472
1900
88,0
307,
290
95,3
2010
2,08
0+6
,760
For c
olum
n no
tes s
ee b
otto
m o
f nex
t pag
e.
U.S. BALANCE OF PAYMENTS, 1861-1900
domestic exports of merchandise and gold to Canada for fiscal 1862—79.With the exception of the Pacific Coast the United States operated onan inconvertible paper standard. It was consequently necessary tosubtract the gold exports from the jotal exports and deflate the residualquantity of merchandise exports (expressed in currency values) by theprevailing average annual gold premium to obtain a series of U.S.merchandise exports to Canada. To these figures were added theforeign exports of the United States to Canada'2 (already expressed ingold values), to obtain a series of total merchandise exports to Canadawhich could be compared with the Canadian returns, and the differencescalculated between them. Since the problems of geographical ambiguityand inconvertible currency did not exist during fiscal 1880—1900, thevariations between the Canadian and U.S. series could be computedwithout further difficulty for those years (see Table 1).
Columns 7 to 9 of that table show that for most years the Canadianseries were substantially larger than the figures of the U.S. government.The Canadian statistics were, however, inadequate for computingaccurately the magnitude of the unreported overland exports. A secondstage of refinement required three distinct types of modifications in theCanadian series.
The first were the most arbitrary changes, introduced primarily toproduce reasonable consistency in the final results. For 186 1—72,$300,000 was added for unreported exports into those parts of BritishNorth America that were not included in Canada. Since the Canadianfigure for 1864 was fragmentary, it was arbitrarily adjusted to producea value $6 million above comparable U.S. statistics. Most serious were
12 One defect in Delmar's procedure of comparing Canadian and U.S. trade statisticswas the failure to include foreign exports.
Col. 1: From Commerce of the United Stales and Europe with American Countries,1851—1895, with trade under Reciprocity Agreement of 1890, United States Treasury,Bureau of Statistics, 1896, p. 55.
Col. 2: 1862 and 1863—From Commerce and Navigation of the United States, U.S.Treasury, 1862 and 1863. 1864—79—From the Statistical Abstract of the United States,1879—1905; passim.
Cot. 4: C. Evans, Exports, Domestic from the United States to All Countries, 1789—1883,48th Cong., 1st sess., H. Misc. Doc. 49, Part 2, Vol. 24, 1884, p. 244.
Cot. 5: 1862—79—Obtained by deflating the data in col. 3 by the data in col. 4. 1880—1900—From the Statistical Abstract of the United States, Vol. 25, 1905, p. 185.
Cot. 6: 1861—72—-From Commerce and Navigation of the United States. 1873—1900—From the Statistical Abstract of the United States, Vol. 25, 1905, p. 185.
Col. 8. 1861—73—-From the Special Report of Trade between Canada and the UnitedSlates for the Use of the International Commission, Dominion of Canada, Dept. of Tradeand Commerce, Quebec, August 1898, Ottawa, Dawson, 1898, pp. 250—259. 1874—1900—Report of the Department of Trade and Commerce, Part 1, Canadian Trade, 1908, Dominionof Canada, Ottawa, 1909, pp. 414—415. 1864 data are fragmentary.
Cot. 10: From U.S. Treasury Department, Bureau of Statistics, Commerceand Naviga-lion of the United States, 1867, 1874—1883, and Monthly Report, April 1874, pp. 427—428.
635
BALANCE OF PAYMENTS
the adjustments of more than $10 million for fiscal 1869—7 1, when theU.S. series on total exports rose more rapidly than the Canadian series.Clearly the Canadian figures are drastically out of line, since in 1869 and1870 the U.S. data did not include any report of overland exports. Thesame conclusion must be reached for 1880 and 1881 where the officialU.S. figures are greater than the Canadian, although partial returns forQuebec, Ontario, Manitoba, and the northern territory produceCanadian figures approximately $10 million greater than the U.S. ones(Table 1, col. 10). The U.S. figures have consequently been employedin the initial adjustments for 1880 and 1881.
in those years where substantial excesses of the Canadian figures overthe comparable U.S. data were recorded, the former series did notadequately reflect the full flow of overland exports. In 1867, Delmarrecognized this deficiency as a basic limitation of the Canadian series.13Column 10 of Table I shows for the years 1874—85 the reported netdifference between the Canadian and U.S. returns. The U.S. figures arehigher for some products and the Canadian data for other products.For example, in 1883 the Canadian net excess of $14,878,000 reflects acombination of Canadian excess reports of $23,919,000 and U.S. excessreports of $9,041,146.14 In 1894—1900, after the U.S. government beganto collect more accurate and complete data on overland exports, theCanadian data constituted in most years less than 90 per cent of thecorresponding U.S. values. Accordingly, I assumed that underreportingby the Canadians increased gradually from 5 per cent in 1860's to10 per cent in 1888—93. The differences between the adjusted Canadianseries and the U.S. series were then calculated (Table 2, col. 7).
A final adjustment of the Canadian series was required. Canadianimport figures exclude the inland freight charges contained in the exportstatistics of the United States. Penelope H. Hartland has computeda series of freight ratios on overland exports to Canada for the calendaryears 1868—1900. 1 applied the ratios, converted to a fiscal year basis, tothe differences between the adjusted Canadian data and the U.S. datato adjust the former series for the absence of overland freight payments(Table 2, col. 9). The values derived were used to adjust for thedeficiency in the reporting of overland exports in the U.S. series.
The Southern Border
Estimating unreported land exports to Mexico required differentprocedures. The statistics compiled by the Mexican government onimports from the United States were inadequate. Goods on shipsstopping at Mexican ports en route to Panama were sometimes classifiedas imports. Additional confusion arose from the assignment of imports
13 Cwnmerce and Navigation, 1867, p. xxii.Commerce and 1883, pp. Ixxvii—Ixxxvi.
636
TAB
LE 2
Adj
ustm
ents
to U
nite
d St
ates
Ser
ies o
n U
nite
d St
ates
Mer
chan
dise
Exp
orts
to C
anad
a,18
61—
1900
(thou
sand
s of d
olla
rs, u
nles
s oth
erw
ise
note
d)
Ave
rage
Adj
ustm
ent
Fre
ight
Rat
eon
U.S
.fo
rO
verla
ndT
otal
Adj
ustm
ents
Fis
cal
Yea
r.
U.S
.S
erie
s
(1)
Can
adia
nS
erie
s
(2)
Initi
alA
djus
tmen
ts(3
)
Can
adia
nU
nder
repo
rtin
g(%
)(a
mou
nt)
(4)
(5)
Adj
uste
dC
anad
ian
Ser
ies
(2)+
(3)+
(5)
(6)
Cal
cula
ted
(6)
—(I
)(7
)
Ove
rland
Exp
orts
(8)
(8)
Fre
ight
Pay
men
ts(7
)x
(8)
(9)
to U
.S.
Ser
ies
(7)
+ (
9)(1
0)
1861
1862
1863
1864
13,979
12,665
13,425
17,713
20,206
22,643
18,458
7,952
300
300
300
300
5 5 5 5
1,025
1,147
1,938
1,201
21,532
24,090
19,396
25,214
7,552
11,425
5,970
7,501
12.16
12.16
12.16
12.16
918
1,389
726
912
8,471
12,815
6,697
8,413
1865
1866
1867
1868
1869
8,572
9,004
7,12
811,311
15,643
14,821
15,243
14,061
22,660
21,497
300
300
300
300
13,8
78
5 5 5 6 6
756
777
718
1,378
833
15,877
16,320
15,079
24,338
7,305
7,316
7,951
13,0
2714,711
12.16
12.16
12.16
12.16
12.16
888
890
967
1,584
1,789
8,193
8,205
8,918
14,611
16,500
1870
1871
1872
1873
1874
18,470
26,124
24,032
28,923
37.837
21,697
27,186
33,742
45,189
51,707
15,598
11,293
300
6 6 6 7 7
935
678
2,043
3,163
3,619
36,085
48,352
55,326
16,513
11,971
12,053
19,429
17,489
11.43
10.27
9.90
9.09 7.82
1,887
1,229
1,192
1,766
1.368
18,4
0013
,200
13,2
4521,195
18.857
1875
1876
1877
1878
31,099
29,721
34,875
36,322
48,930
44,100
49,3
7648,003
7 7 7 8
3,425
3,087
3,456
3,820
52,355
47,187
52,832
51,843
21,256
17,466
17,958
15,521
7.11
5.31
6.30
7.83
1,511
927
1,131
1,215
22,767
18,393
19,089
16,736
17,340
t-. z r-) m 0 rn z cn 00 0
cont
inue
d on
nex
t pag
e
TAB
LE 2
con
clud
ed
> > z C,
tTl C "1 til z '-4 C',
C'
0O
Ave
rage
Fre
ight
Adj
ustm
ent
Rat
efo
rT
otal
Adj
uste
don
U.S
.O
verla
ndA
d/us
imen
isC
anad
ian
Can
adia
nC
alcu
late
dO
verla
ndF
reig
htto
U.S
.F
isca
lU
.S.
Can
adia
nIn
itial
Und
erre
port
ing
Ser
ies
Diff
eren
ceE
xpor
tsP
aym
ents
Ser
ies
Yea
rS
erie
sS
erie
sA
d/us
tmen
ts(%
)(a
mou
nt)
(2)+
(3)+
(5)
(6)
— (
I)(8
)(7
) X
(8)
(7)
+ (
9)(I
)(2
)(3
)(4
)(5
)(6
)(7
)(8
)(9
)(1
0)
1880
29,4
6028
,194
9,98
18
3,55
042,991
13,531
7.61
1,030
14,561
1881
37,9
0336
,339
9,63
08
3,80
351
,336
*3,4
336.43
864
14,296
1882
36,5
0047
,053
83,
764
50,817
14,317
5.15
737
15,054
1883
44,4
1755
,147
94,
963
60,1
1015
,693
5.61
880
16,5
7418
8444
,306
49,7
869
4,481
54,267
9,96
06.
83680
10,6
41
1885
38,246
45,577
94,102
49,678
11,433
6.22
711
12,144
1886
33,463
42,819
93,845
46,672
13,210
6.97
921
14,130
1887
34,988
44,7
969
4,032
48,828
13,839
7.61
1,053
14,893
1888
35,882
46,4
.40
104,
644
51,0
8415
,202
6.47
984
16,1
8618
8940
,608
50,029
10
5,003
55,032
1442
56.25
902
15,326
1890
40,2
8251
,366
10
5,137
56,5
0216,200
6.25
1,01
417
,234
1891
38,1
4852
,033
10
5,203
59,2
3719
,089
6.35
1,212
20,301
1892
43,3
0051
,742
105,
174
56,916
13,6
167.
1397
114
,587
1893
46,7
9452
,340
105,
234
57,5
7410
,779
7.55
8(4
11,593
1894
56,6
6450
,746
1895
52,8
5550
,179
1896
59,6
8853
,529
1897
64,9
2957
,023
1898
83,714
74,825
1899
87,9
9588
,467
1900
95,320
102,080
Cot
. I:
Fro
m T
able
1, c
ol. 7
.C
ol.
2: F
rom
Tabl
e I,
col.
8.C
o/s.
3an
d 4:
Bas
ed o
n pr
oced
ures
des
crib
ed in
text
.C
al.
5:B
ased
on
appl
ying
per
cent
ages
use
d in
cot
. 4 a
gain
stad
just
ed C
anad
ian
data
bas
ed o
n co
ls. 2
and
3.
Cot
. 8:
Obt
aine
d by
ave
ragi
ng th
e ca
lend
ar y
ear d
ata
from
col.
5 of
Tab
le v
iii o
f the
Fre
ight
Sec
tion
of P
enel
ope
Har
tland
'sun
publ
ishe
d m
anus
crip
t, "C
anad
a's B
alan
ce o
f Pay
men
ts 1
868—
1952
." T
he v
alue
for 1
869
was
als
o us
ed fo
r
U.S. BALANCE OF PAYMENTS, 1861-1900
to the country providing shipping facilities rather than to the nation oforigin.'5
The U.S. series on overland exports was used as a point of departure.Before the mid-1880's, overland trade was only a small portion of thetotal exports to Mexico.'° As late as 1883, Joseph F. Nimmo, Jr., Direc-tor of the Bureau of Statistics of the Treasury Department, believed theofficial figures to be reasonably accurate. By 1885, with the opening ofMexican railroads, he believed unreported exports to be worth morethan $1.5 million.'7 In 1885—93, the magnitude of unreported overlandshipments substantially increased. One indication was the wideninggap between the defective Mexican data and the U.S. series.'8
The adjustments made (Table 3, col. 2) reflect these considerations;nominal amounts were assigned before 1885 and larger ones for thelater years. When the figures are added to the estimates of unreportedshipments to Canada (col. 4) and to the reported overland trade (col.6)it is possible to construct new series for total overland exports for186 1—93 (col. 7). The last step involved the addition of the estimates oftotal unreported overland exports (col. 5) to the official data on totalmerchandise exports (col. 8) to derive a revised series of total exportsfor fiscal 1861—93 (col. 9).
MERCHANDISE IMPORTS
The official series on merchandise imports requires two significantadjustments. Both relate to the valuation of imports by the authorities.
The first modification concerns only the figures on general importsfor the period July 1, 1883 to August 1, 1890. As a result of the enact-ment of section 7 of the tariff act of March 3, 1883, which went intoeffect July 1 of that year, the dutiable value of imported goods wascomputed at a level substantially less than their actual cost or value tothe importer. This provision explicitly excluded
The cost of transportation, shipment and trans-shipment, with all theexpenses included, from the place of growth, production or manufacturewhether by land or water, to the vessel in which shipment is made to the
15 Daniel Cosia Villegas, Hisioria Moderna tie Mexico, La Republica Restaurada, Vol. II,La Vida Econoniga por Francisco R. Calderon (Mexico, Editorial Hermes, Buenos Aires,1955), pp. 193—197.
16 ibid.Department of State consular Reports, "Report from the Consuls of the United
States," no. 94, June 1888, "Imports into Mexico," 1888, pp. 417, 420, 429.For example, the Mexican figure for fiscal 1889—90 was 29,080,276 pesos. With the
average exchange rate of 1.27 pesos per dollar, this amount would be equivalent to$22,879,839 or $9,594,552 greater than the U .S. figure of $13,285,287. Cf. "Importaciones,"1889—1890 (Mexico, Topografia de Ia Oflcina Impresora de Estapillia, Palacio Nacional1893), pp. 131—181; Secretariadela Economia Nacional, Direccion General de Estadistica,"Anuario de los Estades Unidos Mexicanos," 1941 (Mexico, 1943), p. 934; and Stai'istiealAbstract the Unived Stares, 1905, p. 190.
and Navigalion, 1886, p. xi.
639
TAB
LE 3
Tota
l Adj
ustm
ents
to T
otal
Ove
rland
and
Tot
al M
erch
andi
se E
xpor
ts o
f the
Uni
ted
Stat
es, 1
861—
1900
(mill
ions
of d
olla
rs)
TOTA
LM
ER
CH
AN
DIS
E
OV
ER
LAN
DE
XP
OR
TS
TO
ME
XIC
OU
NR
EP
OR
TE
DO
VE
RLA
ND
EX
PO
RT
S T
OC
AN
AD
A
OV
E
TO
RLA
ND
EX
PO
RT
SA
LL C
OU
NT
RIE
S
EX
PO
RT
S
Offi
cial
Ser
ies
Adj
uste
dS
erie
s(6
)+
(8)
Fis
cal
Yea
rR
epor
ted
Unr
epor
ted
Toa
l(1
)+
(2)
Rep
orte
dU
nrep
orte
d(2
) + (4
)To
tal
(5) +
(6)
(1)
(2)
(3)
(4)
(5)
(6)
(7)
(8)
(9)
1861
0.5
0.5
8.5
9.0
9.0
219.
622
8.5
1862
0.1
0.1
12.8
12.9
12.9
190.
720
3.6
1863
0.1
0.1
6.7
6.8
6.8
204.
021
0.8
1864
0.1
0.!
8.4
8.5
8.5
158.
816
7.4
1865
0.3
0.3
8.2
8.5
8.5
166.
017
4.5
1866
0.7
0.7
8.2
8.9
8.9
348.
935
7.8
1867
0.8
0.8
8.9
9.7
9.7
294.
530
4.2
1868
0.9
0.9
14.6
15.5
15.5
282.
029
7.5
1869
1.0
1.0
16.5
17.5
17.5
286.
130
3.1
1870
1.1
1.1
18.4
19.5
19.5
392.
841
2.3
1871
0.8
0.3
1.1
13.2
9.3
13.5
22.8
442.
846
4.3
rn
1872
0.7
0.5
1.2
13.2
7.2
13.7
21.0
444.
245
7.9
Z18
730.
50.
91.
421
.29.
822
.131
.952
0.5
544.
618
740.
60.
81.
418
.97.
919
.727
.658
6.3
606.
0
1875
0.8
0.6
1.4
22.8
6.8
23.4
30.1
513.
453
6.8
1876
0.6
0.7
1.3
18.4
5.8
19.1
24.9
540.
455
9.5
1877
0.9
0.7
1.6
19.1
6.4
19.8
26.2
602.
562
2.3
1878
1.0
0.7
1.7
16.7
7.4
17.4
24.8
694.
971
2.3
1879
0.9
0.7
1.6
17.3
7.4
18.0
25.5
710.
472
8.5
1880
1.0
0.9
1.9
14.6
5.8
15.5
21.3
835.
685
1.1
1881
0.9
1.0
1.9
14.3
8.3
15.3
23.6
902.
491
7.7
1882
2.4
1.1
3.5
15.1
12.1
16.2
28.3
750.
576
6.7
1883
4.3
1.3
5.6
16.6
25.1
17.9
43.0
823.
884
1.7
1884
3.6
1.4
5.0
10.6
26.6
12.0
38.6
740.
575
2.6
cont
inue
d on
nex
t pag
e
0\
TAB
LE 3
conc
lude
d
TOTA
LM
ER
CH
AN
DIS
E
EX
PO
RT
S
OV
ERLA
ND
EXPO
RTS
TO
MEX
ICO
UN
REP
OR
TED
OV
ERLA
ND
EXPO
RTS
TO
CA
NA
DA
(4)
TOOV
ERLA
ND
EX
POR
TSA
LL C
OU
NTR
IES
Offi
cial
Ser
ies
(8)
Adj
uste
dS
erie
s(6
) + (8
)(9
)
Fis
cal
Yea
rR
epor
ted
(1)
Unr
epor
ted
(2)
Tot
al(1
)+
(2)
(3)
Rep
orte
d(5
)
Unr
epor
ted
(2) +
(4)
(6)
Tot
al(5
)+
(6)
(7)
.18
852.
01.
63.
612
.124
.213
.737
.974
2.2
755.
969
6.7
1886
1.7
3.0
4.7
14.1
19.1
17.1
36.3
734.
318
872.
03.
25.
214
.921
.418
.139
.571
6.9
1888
2.8
4.8
7.6
16.2
22.1
21.0
43.1
742.
476
2.7
1889
3.9
5.0
8.9
15.3
28.4
20.3
48.8
1890
5.0
6.5
11.5
17.2
33.0
23.7
56.7
857.
888
4.5
881.
690
9.8
1891
7.0
5.0
12.0
20.3
31.9
25.3
57.2
1892
6.6
6.0
12.6
14.6
33.2
20.6
53.8
1,03
0.3
847.
786
2.3
1893
11.8
3.0
14.8
11.6
43.9
14.6
58.5
892.
118
947.
17.
149
.249
.2
1895
8.7
8.7
49.9
49.9
807.
588
2.6
1896
10.6
10.6
61.1
61.1
1897
13.8
13.8
65.1
65.1
1,05
1.0
1,23
1.5
1898
12.0
.12
.073
.373
.31,
227.
018
9983
.983
.9
1900
110.
511
0.5
1,39
4.5
2: rn 0 11 0
Co/
s. 1
and
5:
Obt
aine
dfr
om C
omm
erce
and
Nav
igat
ion
of th
eU
nite
dSt
ates
, U.S
. Tre
asur
y, B
urea
u of
Sta
tistic
s, 18
71—
1900
.C
ol. 2
: Bas
ed o
n pr
oced
ure
desc
ribed
in te
xt.
Col
. 4: F
rom
Tab
le 2
, cot
10.
Co!
.8:
His
toric
al S
tatis
tics
ofD
ept.
of C
omm
erce
, 194
9, p
. 244
.th
eU
nite
d S
tate
s,17
89—
1945
,
BALANCE OF PAYMENTS
United States; the value of the usual and necessary sacks, crates, boxes orcovering of any kind in which such merchandise is contained; commissionat the usual rates, but in no case less than per centum, and brokerage,export duty, and all other actual or usual charges for putting up, preparing,and packing for transportation or shipment.
This method of valuation was abandoned after the passage of section19 of the act of June 10, 1890. Under its provisions, imports wereestimated at the "actual market value or wholesale price" of thesecommodities at the port of export.2°
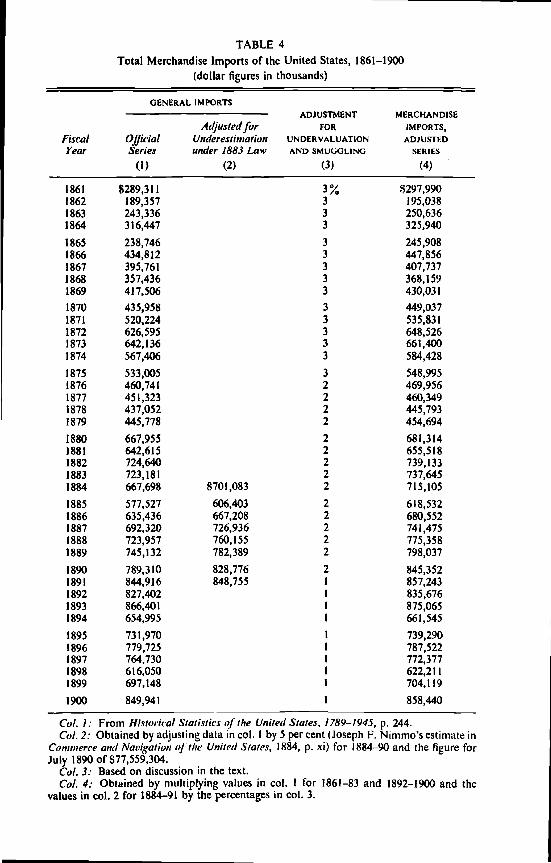
While the 1883 legislation was in effect, it is clear that the value ofimports was substantially understated. Nimmo estimated that thereported imports of $667,697,693 for fiscal 1883—84 should be upgradedby 5 per cent to $700,000,000 to reflect the excluded costs.2' Accord-ingly, without further information on the magnitude of these charges,I adopted this 5 per cent increase for the period July 1, 1883 to August 1,1890 (Table 4, cot. 2).22
The second source of inaccuracy in the official import statisticsrelates to the extent of illegal undervaluation and smuggling. DouglassNorth has indicated the formidable proportions this factor had assumedbetween 1845 and 1860 (see his paper in this volume). The outbreak ofthe Civil War and the adoption of highly protective tariffs in the latenineteenth century did not arrest these illegal operations. On thecontrary, the high duties placed a premium on evasion.
Moreover, it was not until 1874 that the Anti-Moiety Act was passed.Before that time, the proceeds of the fines collected were distributed inthe following manner, 50 per cent to the Treasury, 25 per cent to theinformer, and 25 per cent to the collector, naval officers, and surveyors.The informers, generally Treasury agents, were thus given a vestedinterest in the violation of the law. Edward Young, Chief of the Bureauof Statistics of the Treasury Department, in February 1874 estimatedthat 3 per cent of the value of imports should be allowed for smugglingand undervaluation.23
Still another factor that contributed to undervaluation was therequirement under Section 17 of the Internal Revenue Act of 1862 thatall imports receive consular certification of the accuracy of the invoices.Since the consuls, as agents of the State Department, were intent onencouraging exports, they did not rigorously enforce this provision.
20 Commerce and Navigation, 1891, pp. xi—xii. The act became effective on August 1,1890.
2t Commerce and Navigation, 1884, p. xi.22 The import figure of $77,559,304, for July 1890, has been adjusted. These additions
to imports more than counterbalanced the inadequate reporting of overland exports. Thisunderscores the massiveness of capital imports in 1886—91 (see Table 27 below).
23 Edward Young, "Foreign Indebtedness of the United States," Monthly Report of theChief of the Bureau of Statistics, Treasury Department, 1874, February 1874, pp. 251—252.
642
TABLE 4Total Merchandise Imports of the United States, 1861—1900
('ol. 1: From Historical Statistics of. the United States, 1789—1945, p. 244.('ol. 2: Obtained by adjusting data in col. I by 5 per cent (Joseph F. Nimmo's estimate in
('orninerce and o/ the United S/ales, 1884, p. xi) for 1884—90 and the figure forJuly 1890 of S77,559,304.
Col. 3: Based on discussion in the text.Cot. 4: Obtained by multiplying values in col. I for 1861—83 and 1892—1900 and the
values in col. 2 for 1884—91 by the percentages in cot. 3.
BALANCE OF PAYMENTS
The problem of undervaluation was a source of continuous concernto Congress and the Treasury Department until 1890.24 Finally, theCustoms Administration Act of 1890, providing for penalties for viola-tions on a sliding scale basis, reduced the scale of undervaluation. TheJournal of Commerce in July 1895 estimated from a New York CustomsHouse report that extra duties were imposed on million of im-ports because of attempted undervaluation during fiscal 1 894_95.25 Itassumed that the authorities were able to detect at least one-third of thetotal undervaluation of $5 million. This would represent less than 1 percent of the total merchandise imports.
Given this fragmentary information and recognizing that under-valuation varied from commodity to commodity, I scaled down thepercentage of undervaluation by 1 per cent each fifteen years, from3 per cent for 1861—65 to 1 per cent for 1891—1900 (Table 4).
SALE OF SHIPS
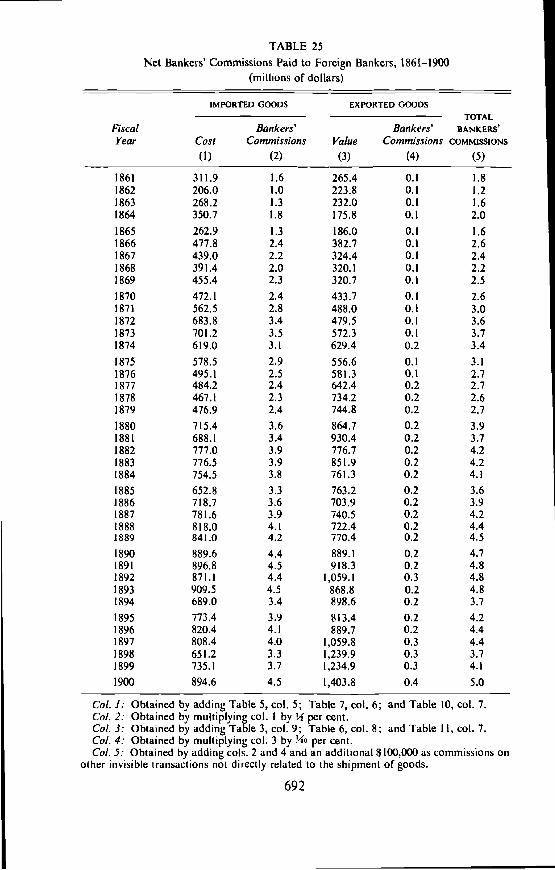
During the Civil War, a substantial portion of the American merchantmarine was sold to foreigners. Official statistics exist on the gross ton-nage sold to aliens,26 and Douglass North has prepared estimates on theprice per ton of ships sold, 1821—1914, which reflect changes in cost ofconstruction. For the crucial period 186 1—65, a figure of $50 a ton wasemployed.27 I have incorporated his series in Table 27, the summarypresentation of all items in the balance of international payments.
NET GOLD AND SILVER MOVEMENTS
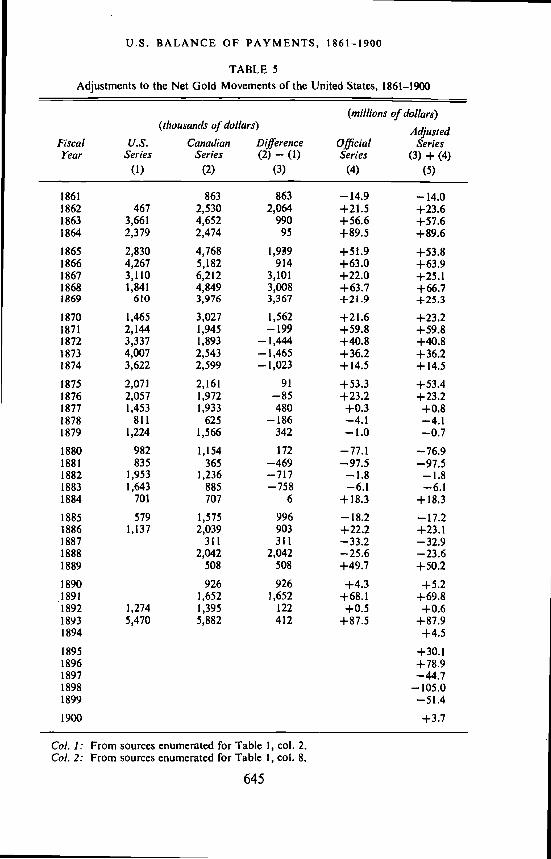
Only one adjustment was made to the official series on net goldmovements. As has been demonstrated, the official statistics failed toreport adequately overland shipments to Canada and Mexico. At thesame time, the Canadian Government compiled data on imports fromthe United States, which provided the basis for the subsequent adjust-ments. This procedure is equally applicable to the gold export statistics.Accordingly, the official series on net gold movements was adjusted onlyfor those years in which the Canadian return exceeded the U.S. figureby the calculated difference (see Table 5).
The official U.S. series on net gold and silver movements were notsubject to further revision despite the fact that significant disparitiesmay exist between the statistics of the U.S. government and other
24 Cf. the appendix to the Report of the Secretary of Treasury 1885, . . . 1886, and R.Elberton Smith, Customs Valuation in the United States: A Study in Tariff Administration,University of Chicago Press, 1948, pp. 102—132.
25 The Cwnnwrtia! Yearbook, Vol. 1, 1896, pp. 225—231.26 Historical Statistics of the United States, 1 789—1945, Dept. of Commerce, 1949, pp.
209—2 10.2? For another set of estimates of ship sales during the Civil War, cf. Graham, p. 231.
644
U.S. BALANCE OF PAYMENTS, 1861-1900
TABLE 5Adjustments to the Net Gold Movements of the United States, 1861—1900
Col. 1: From sources enumerated for Table 1, cot. 2.Ccl. 2: From sources enumerated for Table 1, col. 8.
645
BALANCE OF PAYMENTS
governments in their reports of gold movements between them.28 Inthis form, the two series will be employed to represent balancing itemsin the nation's international economic transactions, since both gold andsilver were used as means of settlement during some or all years of thelast four decades of the nineteenth century (see Table 27, lines 28 and 29).
The Shipping AccountThe late nineteenth century witnessed major transformations in the
movements and the relationships of the components of the shippingaccount. Among the items for which estimates have been computed are(1) freight income on exports carried in U.S. vessels, (2) freight ex-penditures on imports carried in foreign vessels, (3) freight income fromthe foreign carrying trade, (4) port outlays of the U.S. merchant marinein foreign ports, (5) port outlays of the foreign merchant marine inAmerican ports, (6) marine insurance payments to foreign companies,and (7) marine insurance receipts of American companies.
OCEAN FREIGHT RECEIPTS AND PAYMENTS
In this section, an effort is made to construct a series on freightexpenses paid on American imports carried in foreign vessels, a debititem in the US. balance of payments; and in turn a series on freightincome received for American exports transported in American vessels,a credit item in the U.S. balance of payments. Excellent quantitativeinformation is available for the computation of freight estimates. Thefederal government has compiled data, by fiscal years, on the value ofmerchandise imported into the United States in foreign vessels and onthe value of merchandise exported in American vessels. The problemthus reduces itself to obtaining annual average estimates of the ratio offreight charges to the value of merchandise imported and exported.
A number of complicating factors preclude a simple solution toprocuring such a ratio. In the period under consideration, severalestimates were made. David A.Wells, in one of his reports as SpecialCommissioner of the Revenue, estimated it to be 8 per cent in the year1869.29 Financial writers accepted this figure for their calculations.3°In early 1874, Edward Young of the Bureau of Statistics of the Treasury
28 Cf. Oskar Morgenstern, The Validity of international Gold Movement Statistics,Special Papers in International Economics, No. 2, November 1955, International FinanceSection Department of Economics and Sociology, Princeton University Press, 1955,p. 12, passim.
20 Report of the Special Commissioner of the Revenue upon the Industry, Trade,for the Year 1869, 41st Cong., 2d sess., H. Exec. Doc. 27, p. xxx (cited henceforth as theWells Report).
3° The Merchants' Magazine, Vol. LXII, March 1870, pp. 232—233. The British statisticianMuihall used this figure for British foreign trade in this period (see The Commercial Year-book, Vol. 1, 1896, p. 226).
646
U.S. BALANCE OF PAYMENTS, 1861-1900
estimated 8 per cent to be a freight ratio on imports of "approximateaccuracy."3' In early 1891, Secretary of Treasury Windom estimated"the cost of transportation at 10 per cent of the value of the goods."32W. W. Bates, a Commissioner of Navigation, believed this ratio was15 per cent on exports and 10 per cent on imports.33 The Journal ofCommerce's comprehensive survey of 1895 of the import trade in1891—92 yielded a comparatively low ratio of 3.6 per cent.34 Thepicture thus would appear hopelessly confused unless it is possible thatthis ratio fluctuated secularly and cyclically during the entire period.The existence of a flexible and changing percentage is accepted byBullock, Williams, and Tucker as a key to understanding movements infreight charges: "From the evidence given, it is estimated that the rateof freight charges to value of goods carried during the period 1874—95decreased from about 12 per cent to about 5 per cent."35 These authorsare correct about the direction of the trend although their figures maybe subject to question.
The derivation of two freight series requires recognition of the factthat changes in an average freight ratio are the result of changes in theprices of exported and imported commodities and changes in the freightrates. To chart annual movements, it is necessary to obtain reasonablyadequate annual indicators of both component parts.
JNDEXES OF EXPORT AND IMPORT PRICES
With respect to American import and export price data, fortunatelysome useful data are available. Graham, in his treatment of inter-national trade of the United States under a depreciated paper standard,compiled from Wesley C. Mitchell's study of the period data on thewholesale prices of imported, exported, and domestic commodities for1865—78 by quarter. He constructed an index of import prices fromfourteen series and an index of export prices from eighteen series bycomputing the arithmetic mean of each group for the entire period.36
Unfortunately, Graham did not develop indexes for the Civil Waryears. Therefore, it was necessary to utilize the substance of his proced-ure to extend his indexes back to 1860. Fortunately, the series he com-puted were expressed in terms of 1860 as the base year. Accordingly, Ideveloped an export price index from twelve series and an import priceindex from ten series for These figures, both for exports and
Young, pp. 25 1—252.
Eco,w,nist, Vol. XLIX, February 14, 1891, pp. 209—210.William Wallace Bates, The Shipping Question in History and Politics, p. 20, quoted in
Bullock et a!., p. 226.The Commercial Yearbook, Vol. 1, 1896, p. 229.Bullock et a!., p. 227.Graham, pp. 249—257.Export prices were taken from Commerce and Navigation of the U.S. and import
prices from Mitchell, op. cit., pp. 339—367.
647
BALANCE OF PAYMENTS
imports, were then linked to the Graham data to establish continuousseries for 186 1—78. T. J. Kreps, in his investigation of the terms oftrade of the United States, 1880—1914, constructed an index of exportprices based on twenty-eight items and an index of import prices basedon twenty-nine items for fiscal 1879_1914.38 Kreps's indexes wereweighted and more refined than Graham's.
It is necessary to link the two sets of indexes to obtain one continuousseries for import prices and one for export prices for the entire period.Fortunately the two sets overlap slightly. The Graham data terminatewith December 1878. The Kreps figures begin with June 1878. Iarbitrarily assumed that the value in the Graham series for the last sixmonths of 1878 is equal to the first value in the Kreps series for fiscal1878—79. This process of linking two sets of independently derivedseries can be justified if the criteria for the selection of the individualitems in the construction of the index numbers are reasonably com-mensurate. In determining the items to be included in his export priceindex, Graham chose all those commodities exported by the UnitedStates on a scale sufficient to cause their price to be determined in aforeign market. In turn his index of import prices comprises "all thosecommodities, the import of which was great enough to be the determin-ing factor in their prices."39 Kreps was intent on selecting a list ofcommodities "which constituted in value a major proportion of ourexports and imports" and which would give consideration to thechanging composition of American trade. His export index includesitems that constituted between 40 per cent and 45 per cent of the totalvalue of all U.S. exports and his import index includes items between30 and 40 per cent of the total value of all U.S. imports.4°
Constructing continuous series of index numbers of import andexport prices for 1861—1900 with 1860 as a base year involved thefollowing steps. Since Graham's series are expressed in dollar pricesand reflect currency depreciation as well as price movements, theaverage annual premium on gold on a fiscal year basis was computedand used as a deflator. Two series of these prices were thus obtained interms of gold values, which made them more comparable with the Krepsdata of the post-Greenback period. The base years for the Kreps datawere 1903—13. The base was shifted to 1879. The final value in theGraham series for the last six months of 1878 was equated to the fiscal1878—79 value of the Kreps series and the two sets of series were linked(see Tables 6 and 7). In conformance with the general decrease in all
T. J. Kreps, "Import and Export Prices in the United States and the Terms of inter-national Trade, 1880—1914," Quarterly Journal of Economics, August 1926, pp. 708—726.
Graham, pp. 249—257.Kreps, pp. 709—711. The appropriate price index for calculating freight ratios would
weight the price of each commodity by its volume rather than by its value. Graham andKreps did not employ this procedure.
648
U.S. BALANCE OF PAYMENTS, 1861-1900
types of prices in this period, both indexes show a considerable fall.With regard to the average freight ratio, the decline in import and exportmerchandise prices was of sufficient importance to offset, at least in part,the fall in ocean freight rates. Its role must not be neglected or ob-scured.4'
INDEXES OF FREIGHT RATES
The second aspect of the problem involves the use of indexes offreight rates. The charting of movements in ocean freight rates,illustrating annual and long-term movements, 1861—1900, raises someformidable issues. Ocean freight rates for at least four decades afterthe Civil War declined persistently.42 This is generally explained interms of the impact of the technological changes in shipping, includingthe increasing application of steam to marine transportation and theintroduction of improvements in the construction of vessels and ofsuperior techniques of handling ships and their cargoes, especiallysteam-hoisting machines and grain elevators. The decline in oceanfreight rates was accentuated by the reduction in charges levied atvarious ports.43 Accompanying the falling long-term trend wereimportant short-run oscillations induced by wars, varying crop yields,and changes in business conditions.44
A provisional freight rate index of American exports for 1860—1900,which effectively reflects these changes, has been prepared by DouglassNorth as part of his comprehensive research on ocean freight rates for
I employed this series in calculating annual averagefreight ratios on exports. North's index was constructed from sevenseries of freight rates on important commodity exports. Its distinctivefeature is that each series was weighted in ten-year sections by theaverage tonnage of the commodity exported during the particulardecade. In this manner, provision was made for the change in therelative importance of commodities of varying bulk.
Unfortunately, no index has yet been constructed for freight rates onAmerican imports for the last four decades of the nineteenth century.The principal material emanates from two sources, both British. The
41 The neglect of declining prices of merchandise import and exports is a major limitationin the treatment of this problem by Bullock et at., pp. 226-227. It accounts for theirassertion that the average freight ratio declined from 12 per cent to 5 per cent, 1874—95.
42 v• D. Wickiser, "Shipping and Freight Rates in the Overseas Grain Trade," WheatStudies of the Food Research Institute of Stanford University, Vol. xv, October 1938, p. 69.
Frank Andrews, Ocean Freight Rates and the Conditions Affecting Them, Dept. ofAgriculture, Bureau of Statistics Bull. 67, 1907, pp. 5—6. Great stress was placed on theimpact of technological changes in shipping on freight rates as an illustration of innovationtheory by Joseph A. Schumpeter, Business Cycles, McGraw-Hill, 1939, Vol. ii, pp. 534—555and 1059.
Frank Andrews, pp. 6—8, and Wickiser, p. 69.I am especially indebted to Douglass North for making this series available to me as
part of our cooperative effort in developing more accurate estimates of each item.
649
TABLE 6Freight Income Earned by United States Vessels, 1861—1900
British Board of Trade collected figures from a firm maintaining regularservice in the American trade, 1884—1904, on such items as box andbale goods, wool, paper stock, and bricks.40 But this source, sadly,provides too scanty data. In its annual circulars on tramp freight ratesfor leading world trade routes, the shipping firm of E. A.V. Angierpresented discontinuous series on rails from Great Britain, ore andfruit from Mediterranean ports, tea from China, sugar from Cuba, andgeneral goods from Hamburg to the North Atlantic ports of the UnitedStates.47 The fragmentary character of these data militates against theconstruction of a reliable index.
1 have used instead an index of outward freight rates for GreatBritain, the greatest maritime power of the period and the one mostinvolved in the American shipping trade. The most recent effort at theconstruction of British freight rate indexes was made by A. K. Cairn-cross.48 His indexes, on a calendar year basis, are based on the solidfoundation of both the Board of Trade data from regular liners and theAngier data on tramp steamers for all the leading trade routes of theworld.49 He attached double weights to the Board of Trade series ofgoods exported from the United Kingdom to the United States. Theemployment of this index for our problem involves making an arbitraryassumption that changes in British outward freights to all places of theworld, 1870—1900, reflected corresponding movements in freight chargeson U.S. imports. This contention does not appear to be unreasonable
" Second Series of Memoranda, Statistical Tables, and charts Prepared in the Board ofTrade—with Ref èrence to Various Matters Bearing on British and Foreign Trade and IndustrialConditions, Great Britain, Board of Trade, Memorandum viii, "The Course of OceanFreight Rates During the Past Twenty Years," CMD, 2337; Parliamentary Papers, London,H.M. Stationery Office, 1905, Vol. Lxxxiv, p. 263.
E. A.V. Angier, F:jiy Years of Freight, 1869-1919, London: Fairplay, 1920, passim,and L. Isserlis, "Tramp Shipping, Cargoes and Freights," Journal of the Royal StatisticalSociety, Vol. CL, Part I, 1938, pp. 104—121. Isserlis presented the Angler data not inabsolute terms but as percentages of the average freight rate in the preceding year.
A. K. Cairncross, pp. 170—180." See Isserlis, p. 122, and C. K. Hobson, The Export of Capital, London, Constable &Co., Ltd., 1914, pp. 178—184, 247—253.
Cot. 1: 1861—65—From an index constructed from twelve series of export prices fromCommerce and Navigation of the United States, 1886, p. xx. 1866—78 and the first six monthsof fiscal 1879—From Graham, p. 253. 1879—1900—From F. W. Taussig, InternationalTrade, Macmillan, 1927, pp. 418—419 (data for 1879—1900 computed by T. J. Kreps).The figures for 1862—79 were deflated by the average annual premium, based on quarterlydata obtained from Graham, p. 237 and Wesley C. Mitchell, Gold Prices and Wages underthe Greenback Standard, University of California Publications in Economics, Vol. i; TheUniversity Press, 1908, pp. 2—15.
Cal. 2: Obtained from Douglass North as a provisional freight rate index from part ofa forthcoming study on ocean freight rates.
Cal. 4: Obtained by multiplying Douglass North's estimate of 11 per cent as the averagefreight ratio for 1860 on U.S. exports by data in col. 3.
Cc!. 5: From Historical Statistics of the United States, 1789—1 945, p. 217.Cc!. 7: Obtained by multiplying data in cot. 6 by 25 per cent.
651
TABLE 7Freight Payments on Imports, 1861—1900
(dollar figures in millions)
import Freight Average FreightPrice Rate Ratio Freight Imports in Payments
Fiscal Index Index (2) ÷ (I) Ratio on Foreign on ImportsYear (1860
in the light of the world-wide developments affecting ocean freightrates and the vital role of the United Kingdom in U.S. shipping. Tothe degree that the movements in British freight rates are not reflectedin the American freight rates the subsequent calculations contain amargin of error.
Since Cairncross's outward freight rate index begins in 1870, I lackeddata for 1861—70. To remedy the deficiency, Douglass North constructeda provisional freight rate index on U.S. imports, based on six strategicseries. This index was linked at the year 1870 with the Cairncross series.
RESULTS
To obtain two series for freight receipts on American exports andfreight payments on American imports it was necessary to compute theannual ratios of the values in the freight rates indexes to the correspond-ing values in the export and import price indexes. The year 1860 wasused as the base year for all four series, a decision motivated by thedesire to employ North's figure of 11 per cent as the average freightratio on American exports and of 7.6 per cent as the average freightratio for American imports.
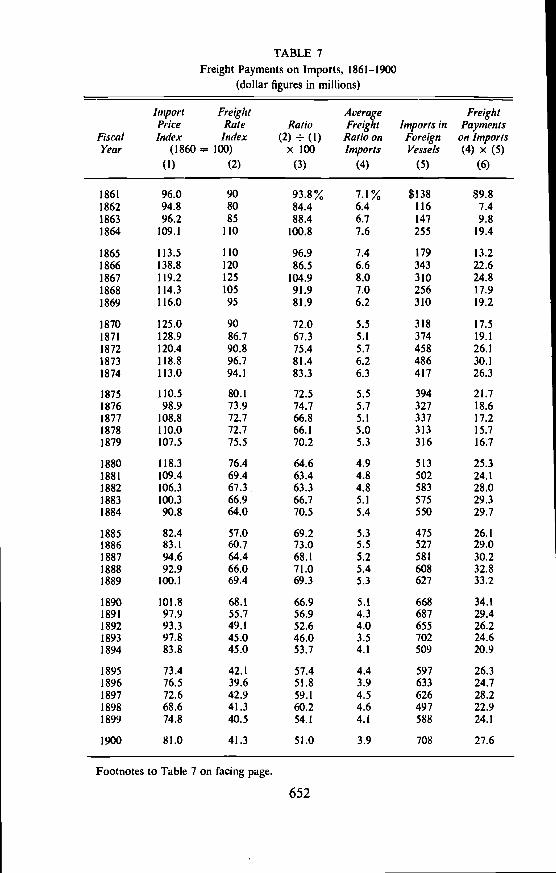
The results are fundamentally satisfactory. The two series of freightpercentages not only mirror effectively the operation of the secular,cyclical and random extra-economic forces characteristic of the period,but also they correspond fairly closely with some of the importantcontemporary estimates. The 7.5 per cent figure for 1869 on exports isclose to Wells's estimate of 8 per cent (Table 6, col. 4). More significantis the fact that the 4 per cent figure on imports, obtained through theuse of a British freight rate index, is close to the Journal of Commerceestimate of 3.6 per cent for 189 1—92 (Table 7, col. 4). The lower ratiosderived for imports reflect the condition that, on the average, lighterweight goods came into the country than were carried out to foreignnations..
The annual freight ratios on exports were then applied to the series ofexports transported in American vessels to obtain estimates of freightincome earned by American vessels in the export trade (Table 6, col. 6).
Col. 1: 1861—65—-From an index constructed from ten series of import prices fromMitchell, pp. 339—367. 1866—78 and the first six months of Jiscal 1879—From Graham,p. 253. 1879—1900—-From F. W. Taussig, pp. 418—419. The figures for 1862—79 weredeflated by the average annual premium, based on quarterly data obtained from Graham,p. 237 and Mitchell, pp. 2—15.
Col. 2. 1861—70—From Douglass North as a provisional freight rate index. 1871—1900—From Cairncross, p. 176.
Col. 4: Obtained by multiplying Douglass North's estimate of 7.6 per cent as the averagefreight ratio for 1860 on U.S. imports by col. 3.
Col. 5. From Historical Statistics of the United States, 1789—1945, p. 217, adjusted forilJegal undervaluation at rates taken from Table 5, col. 4, and for 5 per cent underestimationof U.S. imports under the Tariff Law of 1883 for 1884—90 and July 1890.
653
BALANCE OF PAYMENTS
In a similar manner, the annual freight percentages were applied to theseries on imports carried on foreign vessels, after adjusting the latterboth for undervaluation during 1861—1900 and for failure to reflect thefull value of the commodities placed on ships for fiscal toobtain a set of figures of freight payments on American imports (seeTable 7).
FREIGHT INCOME FROM THE CARRYING TRADE
The calculations of income from ocean freight require the inclusion ofthe receipts earned by the U.S. merchant marine in transporting goodsbetween two foreign ports. I assumed that the income obtained in thisfashion represented 20 per cent of total ocean freight receipts.51 Theseries derived in this manner may be found in column 7 of Table 6.
PORT OUTLAYS OF MERCHANT VESSELS
It is necessary to make provision for the disbursements made byforeign vessels in U.S. ports and by U.S. vessels in foreign ports. Theseincluded payments for harbor dues, loading and unloading expenses,and coal. The caEculations were governed by two considerations. First,sailing vessels generally spent a smaller proportion of their income onthese expenditures than did steam vessels. Second, U.S. ships, morefully loaded on their voyages than foreign ships, made relatively smalleroutlays than vessels sailing under other flags.52
To obtain average annual percentages for the total port outlays bythe foreign ships in American ports, figures of 25 per cent for sailingvessels and per cent for steam vessels were employed.53 Theseratios were then weighted by the proportion of the total tonnage offoreign vessels entering U.S. ports, represented by sailing and steamships to obtain a continuous series of annual percentages. The data wereavailable for 1864—1900. Values were assumed for 1861—63. Finally,these percentages were applied to the estimates of freight expenses paidon U.S. imports öarried in foreign vessels to obtain a series of outlays inU.S. ports made by these vessels (see Table 8).
A similar method was adopted for the port disbursements of U.S.ships overseas. Ratios of 20 per cent for sailing vessels and 30 per centfor steam vessels were employed. The percentages were weighted bythe proportion of the total tonnage of U.S. vessels that cleared from
50 See the previous discussion of adjustments to merchandise imports.This method was employed by Douglass North. See Worthy P. Sterns, "The Foreign
Trade of the United States from 1820 to I 840," Journal u/Political Economy, Vol. viii, p. 53.52 This procedure coincides with the one employed by North for 1821—60.
Cf. the discussion of C. K. Hobson, The Export of Capital, pp. 171—173, 254—261.Edward Young estimated in 1874 port expenses of foreign ships to be approximately one-fourth (op. cit., pp. 25 1—252). The Journal of Commerce's figure for 1894 was betwecn30 and 40 per cent. (Cf. The Commercial Yearbook, Vol. i, 1896, pp. 230—231.
654
TABLE 8Outlays of Foreign Ships in United States Ports, 1861—1900
Co/s. I and 2: The proportions of foreign sailing and steam vessels of all foreign vesselswere obtained from the figures on the tonnage of foreign sailing and steam vessels enteringU.S. seaports for 1864—1900 from the Statisiieal Abstract of the United States, 1887,p. 148; 1898, p. 409; 1902, p. 476. The proportions for the years 1861—63 were assumed.
Cal. 3: Obtained by developing a weighted average through multiplying proportions incot. L by 25 per cent and in cot. 2 by 33% per cent. Co!. 4: From Table 7, cot. 6.
BALANCE OF PAYMENTS
U.S. seaports, represented by sailing and steam ships. The data wereavailable for 1870—1900. The ratios for 1860—69 were assumed to be23 per cent. The percentages derived in this manner were then appliedto the series on total freight income earned by American vessels toobtain estimates of their disbursements in foreign ports (see Table 9).
MARINE INSURANCE
The basic assumption underlying the marine insurance estimates isthat underwriting, by and large, followed the flag; exports in U.S.vessels were generally insured by U.S. companies, imports in foreignships were insured by foreign companies." This assumption was sharedby both contemporaries and subsequent students.
The data employed in the calculations are the rates charged by under-writers on cargo taken by vessels sailing from New York to foreign ports.Throughout the last four decades of the nineteenth century, the figurescompiled by the Atlantic Mutual Insurance Company appeared in theAnnual Reports of the Chamber of Commerce of the State of New York.From 1860 to 1869, the only rates presented were for sailing vessels. Forthe Civil War years, 1861—63, figures on insurance for war risk wereavailable. From 1870 to 1900 rates were given for both sail and steamvessels. The data are presented in the form of a range of rates for thetwo modes of shipping between New York and approximately twenty-six foreign ports. The basic problem was to estimate average marineinsurance rates on commodity exports and imports from these data.For each year the averages of the ranges of rates between New York andeach of twenty-six ports, by sail and steam, were computed, and themeans of the averages calculated.
I assume that the rates charged by American and foreign companieswere the same.55 Allowance had to be made for the shifting proportionsof the traffic carried by sailing and steam vessels. The proportions of thetonnage of foreign vessels entering U.S. ports by sail and steam wereused to weight the two rates to help derive average annual rates chargedby foreign insurance companies on U.S. imports. The series on U.S.imports in foreign vessels was adjusted to make provision for under-valuation. The same percentages were used for the various years aswere applied in modifying total commodity imports. In addition, thefigures for 1884—91 were raised by 5 per cent.56 The average insurancerates were then applied to the adjusted series to determine the totalmarine insurance payments made by U.S. citizens to foreign insurance
Imports in U.S. vessels insured by U.S. companies arid exports in foreign vesselsinsured by foreign companies do not enter the balance of payments of the United States.
Cf. William W. Bates, American Marine: The Shipping Question in history andPolitics, Houghton Muffin, 1893, pp. 38—39. He used the same average insurance rate forforeign and U.S. companies.
See the earlier section on merchandise imports.
656
TABLE 9Outlays of United States Ships in Foreign Ports, 1861—1900
Co/s. I and 2: The proportions of U.S. sailing and steam vessels to all U.S. vesselsobtained from the figures on the tonnage of U.S. sailing and steam vessels cleared from U.S.seaports for 1871—1900, from the Statistical Abstract of the United States, 1887, p. 148;1898, p.410; 1902, p.477. The years 1861—70 were assumed.
Cot. 3: Obtained by developing a weighted average through multiplying proportions inccl. I by 20 per cent and in col. 2 by 30 per cent.
Ccl. 4: From Table 6, col. 8.
7
BALANCE OF PAYMENTS
companies (Table 10). A similar procedure was adopted in the calcula-tion of marine insurance income of U.S. companies (Table 11).
The data show a persistent secular decline in marine insurance ratescharges by U.S. and, especially, by foreign insurance companies. Threefactors account in varying degrees for this trend. Rates charged onsailing vessels generally experienced a moderate fall, although for someroutes the rates remained constant or actually increased. More sig-nificant was the shift from sailing to steam vessels, for which lowerrates were charged. Finally, with increasing competition for businessduring depression years, the rates on steam vessels declined substanti-ally.57 This pronounced fall in average rates retarded the enlargementof the net debtor position of the United States for marine insurance inthe late nineteenth century.
The Passenger AccountDuring the last four decades of the nineteenth century the disposition
of funds associated with the international movement of people acrossthe boundaries of the United States constituted an increasingly signific-ant and complex part of the nation's balance of international payments.These heterogeneous transactions included (1) U.S. tourist expendituresabroad, (2) foreign tourists and transmigrants' disbursements in theUnited States, (3) immigrants' remittances to friends and relativesabroad, (4) immigrant's funds brought into the United States, (5) emig-rants' funds taken out of the country, and (6) outlays by foreign pas-senger ships in U.S. ports. Deriving figures for most of the components
For more data on the secular decline in marine insurance rates, see the rates, bysail and steam, charged by Belgian companies on cargo carried from Antwerp to NewYork in Paul Scholler, "L'évolution séculaire des taux de fret, et d'assurance maritimes,1819—1940," Bulletin de l'fnstitut de Récherches Econoniiques et Soda/es, UniversitéCatholique de Louvain, Vol. xvii, no. 5, August 1951, pp. 519—557, esp. 544 and 555—557.
Col. 1: From Historical Statistics of the United Stares, 1789—1945, p. 217, adjusted forillegal undervaluation at rates taken from Table 5, col. 4, and 5 per cent underestimationunder the Tariff Law of 1883 for 1884—90 and July 1890.
Co/s. 2 and 4: The proportions of foreign sailing and steam vessels of all foreign vesselswere obtained from the figures on the tonnage of foreign sailing and steam vessels enteringU.S. seaports for 1864—1900 from the Statistical Abstract, 1887, p. 148; 1898, p. 409;1902, p. 476. The proportions for 1861—63 were assumed.
Co/s. 3 and 5: 1861—1900—Compiled from the range of rates on goods moving fromNew York to more than twenty foreign ports appearing in the Annual Reports of theChaniber of Commerce of the State of New York. The technique of derivation of thcaverage rates for sailing and steam vessels is described in the text. The average rates onsteam vessels for 1861—70 were unavailable and were assumed to be 1.70. Additionalinsurance for war risk, assumed at per cent in 1861, per cent in 1862, and 3 per cent in1863, are included for these years.
Col. 6: Obtained by developing a weighted average through multiplying proportions ofcol. 2 by the average sailing rates in col. 3, and of col. 4 by the average steam rates incol. 5.
658
TABLE 10Marine Insurance Payments to Foreign Companies, 1861—1900
(dollar figures in millions)
FOREIGN FOREIGN
Fiscal
IMPORTS
INFOREIGN
SAILING VESSELS STEAM VESSELS
AVERAGE
INSURANCE
MARINEINSURANCE
PAYMENTS% of Total Insurance % of Total InsuranceYear VESSELS
entails the estimation of both the number of people annually engagedin the various transactions and the per capita monetary outlays madeby them.
TOURIST EXPENDITURES
The extreme difficulty of estimating annual tourist outlays in the latenineteenth century has been reflected in the development of a primitivetype of "round number" mythology. Wells in 1869 "assumed" theannual average outlay of a U.S. tourist at approximately $1,000.58Later, estimates of total disbursements by U.S. tourists of $40, $50, or$100 million were offered.59 During an important controversy over thesize of the invisible items in 1895, a prominent banker, Alfred Heidel-bach, first gave $100 million and then shifted to $50 million as theaverage annual estimate for the decade Of 1880's.6° The prominenteconomist Edward Atkinson believed $100 million was "consistent withthe common estimate. The question is, are there 100,000 Americansspending $1,000 a year each in Europe on the average or a lesser numberspending a greater average sum?"61
These examples indicate the extent of the confusion over an importantinvisible item in the nation's balance of payments.62 To clear the atmos-phere, the principal elements in total tourist expenditures must beproperly identified.63
Wells Report, pp. xxix—xxx.Banker's Magazine 0/New York, Vol. xxiv, April 1870, p. 844, and Vol. XLIV, August
1889, pp. 85—86.60 Alfred S. Heidelbach, "Why Gold is Exported," Foru,n, Vol. xviii, February 1895,
pp. 647—651; and C'ommercial and Financial chronicle, Vol. LX, April 6, 1895, p. 585.61 Bradsireet's, Vol. xxiii, February 9, 1895, pp. 85—86.62 For an exception see the results of the Journal of survey in the commercial
Yearbook, 1896, pp. 225—231.The following three sections summarize the salient features of a more extensive treat-
ment, which will be published in a separate paper, of the methodology of tourist expenditureestimation in the late nineteenth century.
Col. 1: From Historical Statistics of the United Stales, 1789—1945, p. 217.Co/s. 2 and 4: The proportions of U.S. sailing and steam vessels to all U.S. vessels
were obtained from the figures of the tonnage of all U.S. sailing and steam vessels clearedfrom U.S. seaports for 1871—1900 from the Statistical Abstract of the United States, 1887,p.148; 1898, p.410; 1902, p.477. 1861—l0wereestimated.
Co/s. 3 and 5: 1861—1900—Compiled from the range of rates on goods moving fromNew York to more than twenty foreign ports appearing in the Annual Reports of theChamber of Co,nmerce of the State of New York. The technique of derivation of the averagerates for sailing and steam vessels is described in the text. The average rates on steam vesselsfor 1861—70 were unavailable and were assumed to be 1.70. Additional insurance for warrisk, assumed at per cent in 1861, 34 per cent in 1862, and 3 per cent in 1863, are includedfor those years.
Col. 6: Obtained by developing a weighted average through multiplying proportions ofcol. 2 by the average sailing rates iii cot. 3, and of cot. 4 by the average steam rates in col. 5.
661
TAB
LE 1
2C
ompo
sitio
n of
Alie
n N
onim
mig
rant
Pas
seng
ers,
1861
—19
00(p
erso
ns in
thou
sand
s)
Fiscal
TO
TA
LA
LIE
NN
ON
-
OC
EA
N
FO
RE
IGN
BO
UN
DT
OU
RIS
TS
TR
AN
SM
IGR
AN
TS
CA
NA
DIA
NTO
UR
ISTS
AN
D M
EXIC
AN
AN
D L
AR
OR
ERS
To
Dis
tant
Lan
dsT
o C
anad
a an
dW
estIndies
% o
fTotal
70 o
f Tot
al%
of T
otal
70 o
fTotal
Year
IMMIGRANTS
No.
(2) ÷
(I)
Total
No.
(5)
(1)
No.
(7) ÷
(I)
No.
(9) ÷
(1)
(I)
(2)
(3)
(4)
(5)
(6)
(7)
(8)
(9)
(10)
1861
1862
1863
1864
2.5
2.5
2.3
1.0
0.6
0.6
0.6
0.2
25.0
25.0
25.0
25.0
0.6
0.5
0.5
0.2
0.1
2.0
2.0
2.0
2.0
0.5
0.5
0.5
0.2
20.0
20.0
20.0
20.0
1.3
1.3
1.2
0.5
53.0
53.0
53.0
53.0
1865
1866
1867
1868
1869
0.4
4.5
4.!
5.9
10.3
0.1
1.1 1.0
1.5
2.6
25.0
25.0
25.0
25.0
25.0
0.1 1.0
0.9
1.3
2.3
0.1
0.1
0.1
0.2
2.0
2.0
2.0
2.0
2.0
0.1
0.9
0.8
1.2
2.1
20.0
20.0
20.0
20.0
20.0
0.2 2.4
2.2
3.1
5.5
53.0
53.0
53.0
53.0
53.0
1870
1871
1872
1873
1874
15.7
26.3
18.2
13.3
14.6
3.9
6.6
4.5
3.0
4.0
25.0
25.0
25.0
22.7
27.7
.
3.5
5.8
4.0
3.1
3.5
0.3
0.5
0.4
0.3
0.3
2.0
2.0
1.9
2.0
3.1
5.3
3.6
2.8
3.2
20.0
20.0
20.0
21.2
21.7
8.3
13.9 9.6
7.2
7.1
53.0
53.0
53.0
54.2
48.5
1875
1876
1877
1878
1879
17.1
20.0
23.1
19.3
20.1
4.1
5.8
5.6
5.7
6.3
23.9
29.0
24.2
29.6
31.1
5.6
4.3
4.3
2.2
2.1
0.3
0.4
0.5
0.1
0.6
1.6
2.0
2.0
0.6
2.8
5.3
3.9
3.9
2.1
1.5
30.8
19.7
16.9
11.0 5.4
7.5
9.9
13.2
11.3
11.8
43,7
49.3
57.0
58.8
58.7
z rn 0 I,, z C',
cont
inue
d on
next
page
C > 2 0 11 > rn z -4 0 0
TA
BLE
12 c
oncl
uded
Fiscal
Year
TO
TA
LA
LIE
NN
ON
-IMMIGRANTS
(I)
OC
EAN
BO
UN
DF
OR
EIG
N T
OU
RIS
TS
% o
fTotal
No.
(2) —
(I)
(2)
(3)
TR
AN
SM
IGR
AN
TS
CA
NA
DIA
N A
ND
ME
XIC
AN
TO
UR
IST
S A
ND
LA
BO
RE
RS
Total
(4)
To
Dis
tant
Lan
ds
%of
Total
No.
(5) ± (I)
(5)
(6)
To
Can
ada
and
Wes
t Ind
ies
% o
fTotal
No.
(7) ÷
(I)
(7)
(8)
% of Total
No.
(9) ± (1)
(9)
(10)
1880
1881
1882
1883
1884
26.9
25.7
27.8
41.9
42.0
7.0
25.2
8.4
32.6
9.1
32.7
18.0
42.9
22.2
52.9
2.2
2.8
4.6
7.3
6.2
0.4
1.7
0.5
1.8
0.3
1.0
1.3
3.1
1.8
4.2
1.8
6.7
2.4
9.2
4.3
15.6
6.0
14.2
4.5
10.6
17.7
65.0
15.5
60.0
14.1
50.7
16.7
39.7
13.5
32.2
1885
1886
1887
1888
1889
42.4
23.7
22.9
20.6
20.8
24.5
57.7
17.5
73.9
17.8
77.7
17.2
83.3
17.3
83.1
7.0
6.2
5.1
3.4
3.5
3.3
7.6
4.0
16.8
2.2
9.3
2.3
11.3
2.0
9.6
3.8
8.9
2.2
9.3
3.0
13.1
1.1
5.4
1.5
7.4
10.9
25.7
1890
1891
1892
1893
1894
21.1
18.7
21.3
40.8
33.0
18.1
85.9
13.8
73.8
16.0
75.4
37.9
92.9
30.7
93.1
3.0
4.9
5.2
2.9
2.3
1.7
7.9
2.5
13.5
2.2
10.1
0.9
2.3
0.9
2.7
1.3
6.3
2.4
12.8
3.1
14.5
1.9
4.8
1.4
4.2
1895
1896
1897
1898
1899
21.2
21.2
E21
.lE21
.122
.9
15.6
73.4
16.9
80.0
16.9
80.0
16.8
80.0
18.3
80.0
5.6
4.2
4.2
4.2
4.6
2.0
9.3
1.7
8.0
1.7
8.0
1.7
8.0
1.8
8.0
3.7
17.3
2.5
12.0
2.5
12.0
2.5
12.0
2.7
12.0
1900
25.4
20.3
80.0
5.1
2.0
8.0
3.1
12.0
Col
. 1: F
rom
Stat
istic
alA
bstr
act o
f the
Uni
ted
Sta
les,
189
0,p.
214;
1902
, pp.
433—
434.
Dat
a fo
r the
yea
rs 1
860—
65on
a ca
lend
arba
sis
and
first
hal
f of 1
866
wer
e co
nver
ted
to a
fisc
al y
ear b
asis
:da
ta fo
r the
yea
rs 1
896
and
1897
wer
e un
avai
labl
e an
d w
ere
inte
r-po
late
d be
twee
n th
e 18
95 a
nd 1
898
figur
es.
Co/
s.2,
4, .5,
7, a
nd 9
:1873—95—From
tabl
es o
n nu
mbe
r, se
x,
natio
nalit
y, a
nd d
estin
atio
n of
non
imm
igra
nt p
asse
nger
s fro
mC
omm
erce
and
Nav
igat
ion
of th
e U
nite
d S
tate
s, 1
873—
92, a
nd fr
omIm
mig
ratio
n an
d th
e P
asse
nger
Mov
emen
ts a
t the
Por
ts o
f the
Uni
ted
Sta
tes,
U.S
.Treasury, Bureau of Statistics, 1893—95. 1861—72
and
1896
—19
00—
Est
imat
edas
des
crib
ed in
text
.D
ata
in c
ol. 9
dis
-co
ntin
ued
afte
r 188
5.
BALANCE OF PAYMENTS
PASSENGER MOVEMENTS
During the late nineteenth century federal agencies collected con-siderable data on both the inward and outward passenger movement.People arriving in the United States were classified into three groups:U.S. citizens returning from abroad, alien immigrants, and non-immigrants.
First, through the use of annual tables for fiscal 1873—95 compiled bythe Statistics Bureau of the Treasury Department, entitled "Passengersarrived, Number, Sex, and Countries of Last Permanent Residence andDestination," it was possible to divide the alien nonimmigrant categoryinto four subgroups: ocean-bound foreign tourists, transmigrants tonearby nations (Canada and West Indies), transmigrants to distantlands, and tourists and farm laborers from Mexico and Canada(Table
Next, t.he major components of the outward passenger movementwere analyzed and estimated.65 By eliminating passengers departingfor Canada and Mexico (transmigrants to Canada and the Canadianand Mexican tourists and farm laborers), I estimated the number ofocean-bound passengers leaving the nation after 1868, subdividing theminto U.S. tourists, alien travelers bound for offshore lands, and emig-rants. Of the ocean-bound passengers, I assumed that 2 per centchanged their plans or were unable to leave because of sickness or death.To derive a series on the number of U.S. tourists traveling on the highseas, I used the statistics on the number of U.S. citizens returning fromabroad; I assumed that 3 per cent of the tourists did not return becauseof changes in plans, sickness, or death. The sum of these two groups ofAmerican and alien tourists was then subtracted from the total number
64 Since no data were available for 1861—72, alien nonimmigrants were classified,according to the 1873 and 1874 proportions, as: ocean-bound foreign tourists, 25 per cent;transmigrants to Canada and West Indies, 20 per cent; transmigrants to distant lands,2 per cent; Canadian and Mexican farm laborers and tourists, 53 per cent (through 1885only). Similarly, using the 1893—95 proportions, the category was divided for 1896—1900as: foreign tourists, 93 per cent; transmigrants to Canada and West Indies, 4.5 per cent;and transmigrants to distant lands, 2.5 per cent.
65 These data, provided voluntarily by the steamship lines, were incomplete. See thediscussion below of the adjustment made to the series on total emigrants in the section onemigrants' funds.
Cvi. 1: Based on the figures of total reported outward passenger movement from"Immigration into the United States" Monthly Summary of Commerce and Finance,U.S. Treasury Dept., Bureau of Statistics, June 1903, P. 4364. From these figures weresubtracted the data on the departure of passengers bound for ports of adjacent NorthAmerican countries, obtained from the tables of passenger departures by custom districtsin Commerce and Navigation of the United States for 1868—88.
Col. 2: Obtained by adding 3 per cent to the series on U.S. citizens returning fromabroad from the StatisticalAbstract of the United States, 1890, p.214, and 1890, pp.433—434.
Col. 4: Obtained from material described in the footnote to cois. 2, 4, 5, 7, and 9 inTable 12 and adjusted by a 2 per cent figure.
664
TABLE 13Composition of the Outward Ocean Passenger Movement, 1861—1900
of ocean-bound passengers departing from the United States to obtain,as a residual element, figures for the annual volume of emigration.Since the passenger departure data became available in 1868, thestatistics on U.S. tourists and alien travelers are presented from 1861 to1900, and on emigration from 1868 to 1900 (see Table 13).
The third and final phase in the development of passenger statisticsinvolved the estimation of the size of each of these three ocean-boundgroups, classified by destination and by type of accommodation (i.e.,cabin and noncabin) for the period 1873—94. Through a complexprocess involving both many assumptions and detailed calculations, itwas possible to develop a breakdown of ocean-bound U.S. tourists,classified by destination (see Table 14). These data show that an over-whelming proportion of U.S. travelers went to Europe.
THE AVERAGE ANNUAL MONEY DISBURSEMENT
An effective analysis of tourist expenditures requires estimation of(1) transport charges (i.e., passenger fares), (2) daily living expenses andthe length of stay in foreign countries, and (3) sundries, and purchasesof goods and curiosities.66
Passenger FaresInformation on ocean passenger fares charged by steamship lines for
the trip from New York to the leading ports of Western Europe isavailable from guidebooks and other sources for the last four decadesof the nineteenth century. The data do not show the pronouncedsecular downward drift of ocean freight rates. On the contrary, oneauthority has concluded that ocean passenger fares have fluctuated lessand on the whole have been maintained at a higher level.67This relativestability can be attributed to the development of measures restrictingcompetition in an industry characterized both by large capital outlaysand high operating and maintenance costs and by continuing pressureto provide faster and better passenger service.
The development of more luxurious passenger accommodationsproduced higher first class fares, but with the relative growth of thetourist trade, some steamship lines charged special rates for secondclass, cabin, and other accommodation, or catered specifically tomoderate income groups.68 The ensuing calculations are based on the
66 Cf. F. W. Ogilvie, "Tourist Traffic," Encyclopedia of Social Science, Vol. 14, pp. 661—664, and The Tourist Movement, an Economic Study, London, R. S. King & Son, Ltd., 1933,pp. 5—6, 11—36. See also, for a recent illustration of this approach for a later period,A. R. Prest, Consumer Expenditures in the United Kingd 'i, 1900—1919, Cambridge(England) at the University Press, 1954, pp. 170—174.
61 Grover C. Huebner!, Ocean Steamship Traffic Management, D. Appleton and Co.,1920, pp. 252—253.
From 1860—1900 the ratio of tourists to the total population increased from 0.1 percent to 0.2 per cent.
666
U.S. BALANCE OF PAYMENTS, 1861-1900
TABLE 14Total Ocean-Bound United States Tourists, by Geographic Destination,
1873—1894(thousands)
FiscalYear Total
(1)
Departing•for
Europe(2)
Departingfor LatinAmerica
(3)
Departingfor Asia and
Oceania(4)
18731874
49.249.2
44.038.9
3.37.2
1.83.1
18751876187718781879
51.649.442.742.956.9
42.039.838.238.548.9
8.16.31.95.94.7
1.63.32.64.23.3
18801881188218831884
51.850.054.569.391.6
43.841.045.058.278.0
3.95.26.56.98.8
4.13.74.04.24.8
18851886188718881889
100.289.095.198.483.7
86.375.080.283.263.9
11.510.911.512.913.5
2.43.03.42.46.3
18901891189218931894
90.791.995.193.468.7
73.671.273.665.444.4
13.315.817.418.519.0
3.94.94.09.55.3
Note: The figures in this table are from unrounded data.Col. 1: Obtained by adding 3 per cent to the series on U.S. citizens returning from
abroad from Statistical Abstract of the United States, 1890, p. 214, and 1902, Pp. 433—434.Co/s. 2, 3, and 4: Estimates derived by the author, based on the tables on passenger
departures by custom districts for 1873—94 and by geographic destination for 1888—94 invarious monthly, quarterly, and annual publications of the Bureau of Statistics of the U.S.Treasury.
assumption that the two forces counterbalance one other. For 1873—94,an average of $80 one way, or $150 round trip, plus $20 gratuities to theemployees of the steamship lines, or a total of $170, is a reasonableannual estimate for the ocean transportation expenses of U.S. cabinpassengers to Europe.69 For tourists traveling by steerage, since ratesfluctuated between $25 and $35 for one way, a figure of $70 including
69 The outlays have been adjusted to reflect the fact that children, 10 per cent of cabinpassengers, traveled at half fare.
667
BALANCE OF PAYMENTS
gratuities will be used. These passenger fares data apply only to theoutlays of U.S. tourists, since alien travelers came to the United Stateson foreign lines.
The Length of Stay and Daily Travel ExpensesA distinction must be made between the length of stay and expenses
of wealthy and of moderate income U.S. travelers, although the dataare fragmentary. Despite the prevalent view that most wealthy travelersstayed for long periods, as early as 1866 one observer noted that "themajority of American travellers do not remain over six months on theContinent."70 This condition prevailed when traveling conditions werehazardous and prior to the extensive development of the tourist trade.The notion of a relatively short stay is reinforced by Prest and Ogilvie,who estimated that the average American tourist in the early twentiethcentury spent twenty days in England or on the Continent.
Moreover, the official series is entitled "United States citizens return-ing from abroad." Besides pleasure-seeking tourists, this categoryincluded commercial travelers and naturalized citizens who returned tovisit friends and relatives. The duration of stay of the former and theper capita outlays of the latter were probably less than those of theaverage vacationing tourist. In the ensuing calculations for 1873—94,the average stay of U.S. cabin passengers in Europe and foreign touristsin the United States is set at sixty-five days and of noncabin passengersat fifty days. For the former group, this means a trip of more thanthree months, including the ocean voyage. The average stay of trans-migrants to Canada and the West Indies was placed at five days, withan increasing daily disbursement. 72
For the earlier period, 1861—72. with fragmentary passenger statisticsand cruder estimation, the derived results indicate a somewhat lengthierstay for the average tourist. The figures for 1895—1900 were adjusted toreflect factors other than changes in the duration of the trip.
An analysis of the daily expenditures of U.S. tourists, based on astudy of guidebooks, shows considerable variation between wealthy andpoor travelers, and that expenses were higher in Great Britain than on
70 Pembroke Fetridge, Harper's Handbook for Travellers in Europe and the Far Las!,1866, p.v. One modern study assumed that during the entire period 1870—1900 the averagetime spent abroad was one year (Simon Kuznets and Ernest Rubin, Immigration and theForeign Born, NBER, Occasional Paper 46, 1954, p. 57).This figure implies that a moderate-income traveler would spend $70 on ocean fares plus $5 a day, or $1,825 on living expenses(a total of approximately $1,900). Wealthy travelers would spend $170 on ocean trans-portation, plus $7—$10 a day or $2,555—$3,650 on maintenance expenses (a total rangingbetween $2,725 and $3,820). These, without considering the purchases of sundries, exceedby far the most extravagant contemporary estimates.
71 Prest, pp. 170—174.72 This period coincides with the estimate of the stay in England of transmigrants to
Europe of Ogilvie for the 1920's (ibid.).
668
U.S. RALANCE OF PAYMENTS, 1861-1900
the Continent, and in great cities, such as London, Paris, and Berlin,than in rural areas. Within this pattern, the fundamental trend waspersistently upward throughout the late nineteenth century. After thedepression of the 1870's traveling expenses advanced as railroad faresand the price of hotel coupons were raised. After 1885, prices rose atthe first class hotels frequented by Americans in leading cities.
The calculations for 1873—94 are predicated on the assumption thatdaily expenses experienced the following pattern for travelers inEurope
Cabin Noncabin1860—68 $6 $41868—79 7 51879—85 8 6
1886—96 9 7
1897—1900 10 7
Similar estimates for foreign travelers' outlays in the United Statesare based on the belief that the disbursements of transmigrants roughlycorresponded with those of foreign tourists. Their expenditures in acountry as vast as the United States depended on the areas they visitedand the time spent on long-distance railr.oad travel. New York, thenas now, was the most expensive area. Hotel expenses were considerablyhigher than in Europe, although the differential declined with risingEuropean charges toward the end of the nineteenth century. As lateas 1893, one guide book estimated that the expenses of a trip to theUnited States were "almost inevitably" from one-fourth to one-thirdhigher than for European travel.75
These factors are reflected in my estimates. The percentage distribu-tion of ocean-bound foreign tourists and transmigrants into cabin andnoncabin passengers was used to derive figures for 1873—94. Themaintenance outlays of alien cabin travelers were estimated at one-thirdhigher than U.S. cabin travelers in Europe for 1873—85 and one-fourthhigher for 1886—94.
SundriesAn important limitation of the estimates of tourist expenditures
developed by Wells and other contemporaries is the failure to state howmuch was spent for sundry items and luxury goods. Travelers' credits
In 1876, "the expense of travelling in Europe is unquestionably increasing on accountof the steady rise in the cost of food, fuel, labor and almost anything else." A. Satchel'sGuide for the Vacation Tourist in Europe, Hurd and Houghton, 1876, 5th ed., pp. xxx—xxxi;1878—1879, 7th ed., pp. xxx—xxxii, p. 300; 1890, 19th ed., p. 10; and 1907, 36th ed., p. 10.
The $6 for cabin for 1860—68 is from Fetridge, pp. xx—xxiii." Karl Baedeker, The United States with an Excursion into Mexico, Leipsig, Karl
Baedeker, 1893, p. xvii; 1899, pp. xviii, xix; and 1904, pp. xiii—xiv; and Satchel's, 1872,pp. xii—xiii; and 1907, p. 10.
669
BALANCE OF PAYMENTS
from banks do not provide an accurate measure, since a large portionof expenditures in Europe and other areas was for commodities whichmay have been included in the statistics for merchandise imports.76Ogilvie estimated that in some areas 30 per cent of total tourist expendi-tures was for sundries in the 1920's77 If this was a customary practicefor wealthy U.S. travelers, such expenditures must have represented aconsiderable part of travelers' expenditures in the late nineteenthcentury.78 The series for tourists outlays in this paper explicitly excludedisbursements for these sundry items.
Total Tourist DisbursementIt is now possible to integrate the data and develop a series showing
total tourist outlays in Europe for 1873—94. The results are presentedin Table 15. Provision also was made for the cost of tours to LatinAmerica and Asia. Since most travelers to Latin America went to theWest Indies, a tour of relatively short duration, $500 appeared a reason-able sum for cabin passengers in the 1870's and somewhat larger amountsfor later years. For Asia and Oceania, $1,000 was used as the percapita outlay for cabin passengers, and smaller amounts were assumedfor noncabin tourists. Finally, the figures for all three areas werecombined to determine the outlays of all ocean-bound U.S. tourists for1873—94. To complete the estimates for 1861—72, $600, reflecting longer
The undervaluation of imports, which has been reflected in the adjustments to theimport series, was probably due to the unlimited free importation of personal effects such asprofessional books, implements, instruments, and tools of trade (cf. Annual Report of theSecretary of Treasury, 1885, p. 866)." Ogilvie, "Tourist Traffic," p. 663.
David Wells's "assumption" in 1869 is inaccurate in its statement of a per capitaoutlay of $1,000 and of total United States outlays of $37 million or net tourist outlays of$25 million. First, it neglects the fact that 50 per cent of the outward bound passengers in1868—69, including some U.S. tourists, were noncabin passengers. Second, it neglectsU.S. tourist outlays for sundries. In 1868—69, approximately $75 million of declared U.S.imports consisted of items for which a significant portion could have been obtained bytourists (Commerce and Navigation, 1869, pp. 142—144). Finally, it assumes that thenumber of foreign tourists was equal to the total included in the alien nonimmigrantcategory. In effect, they represent, according to my calculations, approximately 25 per centof this group.
Cv!. 1: From Table 14, col. 2.Co/s. 2 and 8: Obtained as described in footnote to cols. 2, 3, and 4 of Table 14.Cvi. 3: Obtained by multiplying col. 2 by $170 as described in text.Ca!. 4: Obtained by multiplying col. 3 by 90 per cent, based on the number of children
traveling as cabin passengers, from Monthly Summary of Commerce and Finance, June, 1903,p. 4364.
Col. 5: Based on a sixty-five-day stay with a $7 daily expense for 1873—78,18 for 1879—85and $9 for 1886—94, for cabin passengers, as described in text.
Col. 9: Obtained by multiplying data in col. 8 by 170, as described in text.Col. 10: Based on a fifty-day stay with a $5 daily expense for 1873—78, $6 for 1879—85
and $7 for 1886—94.
670
TAB
LE 1
5To
tal O
utla
ys o
f Uni
ted
Stat
es T
ouris
ts in
Eur
ope,
187
3—18
94(p
erso
ns in
thou
sand
s, to
tal o
utla
ys in
mill
ions
)
Not
e: T
he c
alcu
latio
ns in
this
tabl
e w
ere
base
d on
unr
ound
ed d
ata
and
are
pres
ente
d in
roun
ded
form
as a
fina
l ope
ratio
n.Fo
otno
tes t
o Ta
ble
15 o
n pr
evio
us p
age.
e z m 0 11 M z -4 U, = a' -S '0 0 0
Fis
cal
Yea
r
TO
TA
LN
O. O
FT
OU
RIS
TS
CA
BIN
TO
UR
IST
SN
ON
CA
BIN
TO
UR
IST
S
No.
Tra
nspo
rtat
ion
Tot
al O
utla
ysM
aint
enan
ceO
utla
ysT
otal
Out
lays
(4)+
(6)
No.
Tran
spor
-ta
tion
Tot
alO
utla
ys
Mai
nten
ance
Out
lays
Tot
alO
utla
ys(9
)+(1
1)
TOTA
LTO
UR
IST
OU
TLA
YS
(7)+
(12)
Ad/
uste
dU
n-fo
rad
just
edChildren
Per
Tot
alC
apita
(2)x(5)
Per
Tot
alC
apita
(8)x
(tO)
(I)
(2)
(3)
(4)
(5)
(6)
(7)
(8)
(9)
(10)
(II)
(12)
(13)
1873
44.0
21.2
$ 3.
68
3.4
$455
$9.
6$1
3.1
22.9
$1.6
$250
$ 5.
7S
7.3
$20.
418
7438
.931
.15.
35.
0455
14.1
19.2
7.8
0.5
250
2.0
2.5
21.7
1875
42.0
30.7
5.2
5.0
455
13.9
18.9
11.3
0.8
250
2.8
3.6
22.5
1876
39.8
28.3
4.8
4.6
455
12.9
17.5
11.5
0.8
250
2.9
3.7
21.1
1877
38.2
19.9
3.4
3.2
455
9.1
12.3
18.3
1.3
250
4.6
5.9
18.1
1878
38.5
31.5
5.4
5.1
455
14.3
19.4
6.0
0.4
250
1.5
1.9
21.3
1879
48.9
33.7
5.7
5.4
520
17.5
23.0
15.2
1.1
300
4.6
5.7
28.6
1880
43.8
35.5
6.0
5.7
520
18.5
24.2
8.3
0.6
300
2.5
3.1
27.3
1881
41.0
35.9
6.1
5.8
520
18.7
24.5
5.1
0.4
300
1.5
1.9
26.4
1882
45.0
41.6
7.1
6.7
520
21.7
28.4
3.3
0.2
300
1.0
1.2
29.6
1883
58.2
44.3
7.5
7.1
520
23.0
30.2
14.0
1.0
300
4.2
5.2
35.3
1884
78.0
47.4
8.!
7.7
520
24.7
32.3
30.6
2.4
300
9.2
11.6
43.9
1885
86.3
46.7
7.9
7.5
520
24.3
31.8
39.6
2.8
300
11.9
14.6
46.5
1886
75.0
51.1
8.7
8.3
585
29.9
38.1
23.9
1.5
350
8.4
9.8
48.0
1887
80.2
55.4
9.4
9.0
585
32.4
41.4
24.8
1.7
350
8.7
10.4
51.8
1888
83.2
58.3
9.9
9.2
585
34.1
43.3
24.9
1.7
350
8.7
10.4
53.8
1889
63.9
61.9
10.5
10.0
585
36.2
46.2
2.0
0.1
350
0.7
0.9
47.0
1890
73.6
68.0
11.6
11.0
585
39.8
50.8
5.5
0.4
350
1.9
2.3
53.1
1891
71.2
69.0
11.7
I 1.1
585
40.3
51.5
2.2
0.2
350
0.8
0.9
52.4
1892
73.6
65.9
11.2
10.6
585
38.5
49.2
7.7
0.5
350
2.7
3.2
52.4
1893
65.4
47.1
8.0
7.6
585
27.5
35.1
18.3
1.3
350
6.4
7.7
42.8
1894
44.4
28.8
4.9
4.7
585
16.9
21.5
15.5
1.1
350
5.4
6.5
28.0
BALANCE OF PAYMENTS
stays overseas, lower per capita outlays, but more cabin or wealthierpassengers, was selected. Similarly, per capita outlays were assumedfor 1895—1900 that bore a reasonable relation to 1891—94 values andreflected rising passenger fares and daily expenditures characteristic ofthe general upswing following the world-wide depression of 1890—97.Utilizing data developed by Jacob Viner for the years 1900—13 andPenelope H. Hartland for the period before 1900, 1 assumed that U.S.outlays in Canada and Mexico represented 5 per cent of the totalU.S. tourist disbursements.79 The results are shown in Table 16.
Similarly, the total expenditures of alien travelers were calculated for1873—94. For 1861—72, a per capita outlay of $750, one-third greaterthan the U.S. tourist expenditure in Europe, was estimated for ocean-bound foreign tourists and transmigrants. The figures for 1895—1900were adjusted to reflect increases from the 1892—94 levels. To completethe picture, Canadian and Mexican travelers' expenditures in theUnited States were assumed to be 30 per cent of U.S. tourist outlays inthose areas.8° The series for alien travelers in the United States isshown in Table 17.
Immigrants' FundsFunds brought in by newly arrived immigrants were a significant
component of the nation's international economic transactions. Thefederal government has compiled statistics on the number of immigrants,by age and country of origin, for all of the years included in this study.But I needed information on the average amount carried in by eachimmigrant throughout the period 1861—1900, and estimates variedconsiderably.
Before 1873, the average amount brought in was considerably greaterthan after that year.8' in 1880, the Secretary of the British Legation in
Cf. Jacob Viner, Canada's Balance of International Indebtedness, 1900—1913, 1924,pp. 83—87, and Penelope Hartland's paper in this volume.
80 ibid., Viner uses 50 per cent for 1900—13. See Penelope Hartland's paper for the earlierperiods.
81 Edward Young stated (Special Report on Immigration, 1872, p. x): "it should not beforgotten, however, that those immigrants bring with them some money estimated at$100 by Mr. Kapp [a New York State commissioner of emigrationi and at $80 by Mr.Wells, but inasmuch as a careful investigation was made at Castle Garden, New York,which resulted in establishing $68 as the average sum brought by alien passengers, thatamount is assumed as the correct one."
Cot. 1: Obtained by adding 3 per cent to the series on U.S. citizens returning fromabroad from the Statistical Abstract of the United Stares, 1890, p. 214, and 1902, pp. 433.-434.
Cal. 2: Data obtained as described in text and in footnote to cols. 2, 3, and 4 of Table 14.They include estimates of outlays not only in Europe but in other areas.
Cot. 4: Obtained by applying 5 per cent to the data in cot. 3, based on assumption ofViner for the period after 1900 and Penelope Hartland's unpublished manuscript for1868—1900.
672
TABLE 16Total Expenditures of All United States Tourists, 1861—1900
Note: The figures in this table were derived from unrounded data and were rounded forpresentation.
Footnotes to Table 16 on previous page.
TAB
LE 1
7To
tal O
utla
ys o
f Alie
n Tr
avel
ers i
n th
e U
nite
d St
ates
, 186
1—19
00(p
erso
ns in
thou
sand
s, to
tal o
utla
ys in
mill
ions
)
OC
EA
N-B
OU
ND
TRA
NSM
IGR
AN
TS T
OTO
UR
ISTS
AN
DC
AN
AD
A A
ND
Fisc
al
TRA
NSM
IGR
AN
TSTO
DIS
TAN
TLA
ND
S Tot
al
CA
BIN
TR
AV
ELER
SN
ON
CA
BIN
TR
AV
ELER
SW
EST
IND
IES
TOTA
L O
UTL
AY
S
Out
lays
Out
lays
Out
lays
Can
adia
nT
otal
and
A/I
Per
Tot
alO
cean
- M
exic
anA
liens
Per
Tot
alP
erT
otal
Yea
rN
o.O
utla
ysN
o.C
apita
(3)x
(4)
No.
Cap
ita(6
)x(7
)N
o.C
apita
(9)x
(1O
)bo
und
Tour
isis
(12)
+(13
)(1
)(2
)(3
)(4
)(5
)(6
)(7
)(8
)(9
)(1
0)(1
1)(1
2)(1
3)(1
4)
1861
1862
1863
1864
0.7
0.7
0.6
0.3
$0.5 0.5 0.5
0.2
0.5
0.5 0.5
0.2
$50 50 50 50
— — — —
80.5 0.5
0.5
0.2
0.2
0.2
0.2
0.2
$0.7 0.7
0.1
0.4
1865
1866
1867
1868
1869
0.1 1.2
1.1
1.6
2.8
0.1
0.9
0.8
1.2
2.1
0.1
0.9
0.8 1.2
2.1
50 50 50 50 50
— — —50
.1 0.1
0.1 1.0
0.9
1.3
2.2
0.3
0.4
0.4
0.4
0.2
0.4
1.4
1.3
1.7
2.4
1870
1871
1872
1873
1874
4.2
7.1 4.9
3.3
4.3
3.2
5.3
3.7
1.8
2.9
$607 60
781
.1 1.8
1.5
1.5
$350 35
0$0
.5 0.5
3.1
5.3
3.6
2.8
3.2
50 50 50 50 50
0.2
0.3
0.2
0.1
0.2
3.3
5.6
3.9
1.7
2.4
0.3
0.4
0.5
0.4
0.4
3.6
6.0
4.4
2.1
2.8
1875
1876
1877
1878
1879
4.4
6.2
6.1
5.8
6.8
2.7
3.9
3.3
5.1 5.0
607
607
607
607
693
1.6
2.4
2.0
3.1
3.5
1.7
2.3
2.7
0.8
1.8
350
350
350
350
400
0.6
0.8
1.0
0.3
0.7
5.3
3.9
3.9
2.1
1.5
50 50 50 50 55
0.3
1.2
0.2
0.1
0.1
2.5
3.4
2.2
3.5
4.2
0.4
0.4
0.4
0.4
0.5
2.9
3.8
2.6
3.9
4.8
1880
1881
1882
9.2
8.8
9.4
8.4
7.5
8.2
693
693
693
5.9
5.2
5.7
0.8
1.4
1.2
400
400
400
0.3
0.5
0.5
1.8
2.4
4.3
55 55 55
0.1
0.1
0.2
6.3
5.9
6.4
0.5
0.5
0.6
6.8
6.4
7.0
z. Cl 0 z
(9)
(10)
(11)
(12)
(13)
(14)
C)
m 0 z
(1)
(2)
(3)
(4)
(5)
(6)
(7)
(8)
1883
1884
19.3
24.0
15.2
15.9
8693 693
810.
611
.14.
18.
084
00 400
$1.6 3.2
6.0
4.5
855 55
80.3 0.2
812.
514
.5$0
.7 0.8
$13.
215
.3
1885
1886
1887
1888
1889
27.7
21.5
19.9
19.5
19.3
17.7
16.3
13.7
14.2
15.9
693
731
731
731
731
12.3
11.9
10.0
10.4
11.6
10.0 5.2
6.2
5.3 3.4
400
450
450
450
4.0
2.3
2.8
2.4
1.5
3.8
2.2
3.0
1.1
1.5
55 60 60 60 60
0.2
0.1
0.2
0.1
0.1
16.5
14.4
13.0
12.8
13.3
0.8
0.8
0.9
1.0
0.9
17.3
15.2
13.9
13.8
14.2
1890
1891
1892
1893
1894
19.8
16.3
18.2
38.8
31.6
16.7
14.4
14.6
26.1
18.4
731
731
731
731
73!
12.2
10.5
10.6
19.1
13.5
3.1 1.9
3.6
12.7
13.2
450
450
450
450
450
1.4
0.9
1.6
5.7
5.9
1.3
2.4
3.1
1.9 1.4
60 60 60 60 60
0.1
0.1 0.2
0.1 0.1
13.7
11.5
12.5
24.9
19.5
1.0
1.0
1.0
0.9
0.7
14.7
12.5
13.5
25.8
20.2
1895
1896
1897
1898
1899
17.5
18.6
18.6
18.5
20.1
811.
411
.611
.613
.014
.1
3.7
2.5 2.5
2.5
2.7
65 65 65 65 65
0.2
0.2 0.2
0.2
0.2
13.1
13.8
13.8
15.0
16.3
1.1
1.0
1.0
1.1
1.1
14.2
14.8
14.8
16.1
17.4
1900
22.4
15.6
3.1
650.
218
.01.
117
.4
Not
e: T
he c
alcu
latio
ns in
this
tabl
e w
ere
mad
e fr
om u
nrou
nded
data
and
wer
e ad
just
ed fo
r pre
sent
atio
n.
Col
.1:
Fro
mTa
ble
12, c
ols.
I and
5.
Col
.2:
Obt
aine
dby
mul
tiply
ing
data
in c
ol.
1by
$75
0 fo
r18
61—
72 a
nd b
y th
e fo
llow
ing
valu
es $
650,
189
5;86
25, 1
896;
$625
, 189
7; 8
700,
189
8—19
00.
Col
. 7:
Ass
umed
to b
e $1
00 g
reat
er th
an th
e ou
tlays
of U
.S.
nonc
abin
pas
seng
ers i
n Eu
rope
from
Tab
le 1
5, c
ol. 1
0, fo
r 187
3—94
.C
ol.9
:Fr
om T
able
12,
col
. 7.
Col
.10
: Obt
aine
dby
ass
umin
g a
five-
day
stay
incl
udin
g tra
ns-
porta
tion
expe
nses
for t
hese
tran
smig
rant
s.C
ol.
12: O
btai
ned
by a
ddin
g da
ta in
cal
. 11
to d
ata
in c
ol. 8
for 1
861—
72 a
nd 1
895—
1900
and
to th
e da
ta in
col
s. 4
and
7 fo
r
j ;
Co/
s. 3
and
6:
Obt
aine
d as
des
crib
ed in
the
text
and
foot
note
1873
—94
.to
col
s. 2,
3, a
nd 4
of T
able
14.
Col
.4:
Ass
umed
to b
egr
eate
r tha
n U
.S. c
abin
Euro
pe fo
r the
yea
rs 1
886—
94.
pass
enge
r in
Col
. 13:
Est
imat
edto
be
30 p
er c
ent o
f U.S
. exp
endi
ture
s in
Can
ada.
See
Pen
elop
e H
artla
nd's
unpu
blis
hed
man
uscr
ipt.
Co!
.14
: Obt
aine
dby
add
ing
data
in c
ol. 1
2 to
dat
a in
col
. 13.
BALANCE OF PAYMENTS
Washington, citing the Secretary of the Board of Emigration in NewYork, referred to the effect of the cyclical depression after 1873 on thefunds brought in by immigrants. . . . "They bring with them lessready money than formerly. For this he accounts by the great depres-sion prevailing in Europe, owing to which they have been unable torealize as much on their scant property and effects as they used to informer days." The Emigration Board Secretary estimated an averageof at least $60 for the current year.82 The following year, the BritishLegation Secretary placed the figure at $50 per head.83 The Commercialand Financial Chronicle placed the figure at $200 per head in 1881 and$50 in 1895.84 The Chronicle apparently felt that these transactions,although infrequently mentioned, were sufficient to offset the un-favorable tourist balance.
Another factor became important after 1890 when more detailedstatistical information revealed the effect of the level of economicactivity and living standards in the emigrating nations. Immigrantsfrom the "old immigration" areas of northwestern and central Europecame with larger sums than did those from the "new immigration"regions of southern and eastern Europe (see Table 18).
TABLE 18Average Amount of Funds Carried into the United States per capita from
Some Representative European Countries, First Half 1892, and Fiscal Years1895 and 1896
Source: Quarterly Reports No. 2, U.S. Treasury Dept., Bureau of Statistics, p. 8, andAnnual Report of the Superintendent of for the Fiscal Year 1892, pp. 26—27;1895, p. ii; and 1896, p. 6.
82 Great Britain, Foreign Office, Report by His Majesty's Secretaries of Embassies andLegations on the Manufactures, Commerce and of the Countries in which they Reside,Part iii, "Report on the present immigration into the United States," by M. R. Drummond,May 3, 1880, Parliamentary Papers, London, H.M. Stationery Office, 1880, Vol. LXXII,pp. 368—378, esp. 370—372.
83 ibid., Vol. LXXXIX, 1881, pp. 282—284.84 Commercial and Financial Chronicle, Vol. xxxiv, May 6, 1882, p. 500; and Vol. LX,
May 4, 1895, pp. 769—772.
676
U.S. BALANCE OF PAYMENTS, 1861-1900
The data that the immigration authorities collected in 1892 requiretwo adjustments for purposes of deriving balance of payments estimates:(1) only immigrants over the age of twenty were questioned about theirmoney, and (2), under the Act of March 3, 1893, if an immigrant couldexhibit $30, he was not required to specify the precise amount he wasbringing in.85 It was estimated that the amount reported representedbetween 25 and per cent of the actual amount coming into thecountry.86 Consequently, in the calculations of immigrants' fundsbrought into the country that follow, the statistics for the total numberof immigrants over fifteen years of age were used.87
These were divided into two categories: (1) "old immigration" plusthe immigrants arriving from Canada and Newfoundland, and (2) theremainder.88 in the last half of the period under study, 1880—1900, the"remainder" was overwhelmingly represented by the "new immigration"from southern and eastern Europe. It was assumed that the per capitacontribution of all immigrants in (1) was three times as great as theamount for (2) for Within each group, the average sumwas gradually scaled down from the pre-1873 peaks to the low pointsafter 1890.90 The average sums were multiplied by the number ofimmigrants over fifteen in each category. Two annual sets of figureswere derived, as shown in Table 19, for the funds brought in by thesetwo categories.
A final adjustment involved making provision for the funds broughtin by immigrants who arrived Jn the United States over the Canadianborder after 1885. The government's statistics are fragmentary in thisflow of foreign-born to the United States. Kuznets and Rubin estimatedthat 393,000 immigrants arrived via Canada, 1885—90, of whom 368,000survived until 1890. Since they estimated that an additional 675,000immigrants, passing through Canada, 1891—1900, survived until 1900,
Annual Reports of the Superintendent of Immigration, 1897, p. 4.88 ibid., 1895, p. 13, and 1896, p. 10.87 Under fourteen years for 1899 and 1900.88 Most of the immigrants coming from Canada were people originating in northern and
western Europe in the late nineteenth century; only a few were Canadian natives (cf.Industrial Commission Reports, Vol. 15, immigration, 57th Cong., 1st sess., Vol. 78, H. Doc.184, 1900—02, pp. 92—93). This division of the immigrants over fifteen presupposes that thisage group is allocated in the same way among these two categories as all immigrants.
89 The following statement by Jeremiah W. Jenks and W. Jett Lauck (The ImmigrationProblem, 4th ed., Funk & Wagnals, 1916, pp. 195 and 196), relating to a later period, pro.vides support to this contention. "Immigrants from the South and East of Europe haveusually had but a few dollars in their possession when their destination has been reached.During the years 1905—1909 the average amount of money in the possession of eachperson among these immigrants when they reached their port of disembarkation wasabout one-third as much as among immigrants from Northern and Western Europe. Laterfigures bring out the same condition."
90 The per capita figures used for the Canadians, who are included with the "old"immigration, diverge from the $25 employed in the unpublished study of the Canadianbalance of international payments by Penelope Hartland.
677
TAB
LE 1
9To
tal F
unds
Bro
ught
in b
y A
ll Im
mig
rant
s, 18
61—
1900
(per
sons
in th
ousa
nds,
tota
l fun
ds in
mill
ions
)
Fis
cal
Yea
r
TOTA
LN
UM
BER
OV
ER
15
REP
OR
TED
"OLD
" A
ND
CA
NA
DIA
NO
VER
15
"NE
W"
AN
D O
TH
ER
OV
ER
15TO
TAL
FUN
DS
BR
OU
GH
T iN
No.
Fun
dsA
vera
geA
mou
nt
Bro
ught
inT
otal
(2)
x (3
)N
o.
Fun
dsA
vera
geA
mou
nt
Bro
ught
inT
otal
(5)
x(6
)
By
Rep
orte
d(4
)+
(7)
By
Unr
epor
ted
Tot
al(8
)+
(9)
(1)
(2)
(3)
(4)
(5)
(6)
(7)
(8)
(9)
(10)
1861
93.8
83.5
$75
$ 6.
310
.3$2
50.
3S
6.5
$6.
518
6293
.887
.475
6.6
6.4
250.
26.
76.
718
6316
3.3
153.
575
11.5
9.8
250.
211
.811
.818
6417
9.6
173.
275
13.0
6.5
250.
213
.113
.1
1865
240.
722
5.5
7516
.915
.225
0.4
17.3
17.3
1866
158.
915
3.5
7511
.55.
725
0.1
11.7
11.7
1867
276.
826
4.9
7519
.911
.925
0.3
20.2
20.2
0Q18
6822
4.6
212.
075
15.9
12.6
250.
316
.216
.218
6927
3.0
256.
975
19.3
16.1
250.
419
.719
.7
1870
298.
127
6.6
7520
.721
.525
0.5
21.3
21.3
1871
250.
223
5.2
7517
.615
.025
0.4
18.0
18.0
1872
314.
329
4.5
7522
.119
.825
0.5
22.6
22.6
Z18
7335
5.1
318.
975
23.9
36.2
250.
924
.824
.818
7424
9.8
212.
060
12.7
37.7
200.
813
.513
.5
1875
183.
214
8.4
608.
934
.820
0.7
9.6
9.6
1876
142.
110
5.9
606.
436
.220
0.7
7.1
7.1
1877
118.
191
.260
5.5
26.9
200.
56.
06.
018
7811
4.2
92.4
605.
521
.820
0.4
6.0
6.0
1879
143.
311
8.3
607.
124
.920
0.5
7.6
7.6
1880
370.
733
2.5
5418
.838
.218
0.7
11.9
11.9
1881
516.
046
1.3
5424
.954
.718
1.0
25.9
25.9
1882
618.
051
8.5
5428
.099
.518
1.8
29.8
29.8
1883
459.
539
5.6
5421
.463
.918
1.1
22.5
22.5
1884
395.
833
6.9
5418
.259
.018
1.1
19.3
19.3
cont
inue
d on
nex
t pag
e
TAB
LE 1
9 co
nclu
ded
z C) m 0 'U -1
Not
e: T
hefig
ures
inth
is ta
ble
have
bee
nro
unde
daf
ter
calc
ula-
tions
wer
e m
ade
inun
roun
ded
data
imm
igra
ntfu
nds.
Co!
.1:
From
his
toric
al S
tatis
tics o
f the
Uni
ted
Stat
es, 1
789—
Co/
s. 2
and
5.. B
ased
on
prop
ortio
ns o
f tot
al im
mig
ratio
n da
taob
tain
ed fr
om ib
id.,
pp.
33—
36.
Co/
s. 3
and
6: B
ased
on
disc
ussi
on in
the
text
.C
ol. 9
: Bas
ed o
n es
timat
es o
f unr
epor
ted
imm
igra
tion
thro
ugh
Can
ada
from
188
5 to
190
0fr
omK
uzne
ts a
nd R
ubin
, pp.
72—
74
0" —I
Fisc
alY
ear
TO
TA
LN
UM
BE
RO
VE
R IS
RE
PO
RT
ED
"OLD
"A
ND
CA
NA
DIA
NO
VE
R15
"NE
W"
AN
D O
TH
ER
OV
ER
15
TO
TA
LF
UN
DS
BR
OU
GH
T IN
No.
Fun
dsA
vera
geA
mou
nt
Bro
ught
inTo
tal
(2) x
(3)
No.
Fund
sA
vera
geA
mou
nt
Bro
ught
inT
otal
(5) X
(6)
By
Rep
orte
d(4
) + (7
)B
yU
nrep
orte
dTo
tal
(8) +
(9)
(I)
(2)
(3)
(4)
(5)
(6)
(7)
(8)
(9)
(10)
1885
302.5
249.8
54
13.5
52.6
18
0.9
14.4
$2.1
16.5
1886
268.
020
4.8
54
11.1
63.3
18
1.1
12.2
1.8
14.0
1887
395.
828
5.8
5415
.411
0.0
182.
017
.42.
519
.918
8844
9.6
326.
454
17.6
123.
218
2.2
19.8
2.9
22.7
1889
351.
926
3.2
5414
.288
.718
1.6
15.8
2.3
18.1
1890
368.
923
2.0
5412
.513
6.9
l82.
515
.02.
217
.218
9146
4.4
263.8
45
11.9
200.
615
3.0
14.9
2.9
17.8
1892
533.
927
7.1
4512
.525
6.8
153.
916
.33.
219
.518
9344
5.5
237.
545
10.7
208.
115
3.1
13.8
2.7
16.5
1894
272.
714
2.1
456.
413
0.6
152.
08.
41.
610
.0
1895
246.
713
5.2
456.
111
1.5
151.
77.
81.
69.
418
9629
0.5
116.
545
5.2
174.
015
2.6
7.9
1.5
9.4
1897
190.
574
.745
3.4
115.
815
1.7
5.1
1.0
6.1
1898
191.
066
.345
3.0
124.
715
1.9
4.9
0.9
5.8
1899
267.
778
.445
3.5
189.
315
2.8
6.4
1.2
7.6
1900
393.
991
.445
4.1
302.
615
4.5
8.7
1.6
10.3
C,)
both
for i
mm
igra
tion
and
1945
, p. 3
7.an
d di
scus
sion
in te
xt.
00 S
BALANCE OF PAYMENTS
1 used the same proportion as they did for the 1885—90 period to calcu-late an estimated nonreported immigration of The figures of393,000 for 1885—90 and 714,000 for 1891—1900 were distributed amongthe individual years in each period in accordance with the relativeimportance of its reported immigration. After eliminating the groupsunder fifteen, I applied the proportions for "old" and "new" immigra-tion in the reported figures to divide these annual increments into twogroups, each with their respective per capita funds. Estimates for thetotal amount of funds brought by immigrants arriving unreported overthe Canadian border were thus derived for the years 1885—1900 andadded to the funds brought in by the reported immigrants to obtain aseries on total immigrants funds (Table 19).
Immigrants' RemittancesOnly fragmentary data exist on immigrant remittances. The British
Board of Trade compiled a series on the amount of money remitted bysettlers in the United States and Canada from 1848 to 1887 to theirfriends in the United Kingdom.92 The data were collected by banks andmercantile houses. The series was considered incomplete by RobertGiffen and other officials of the Board of Trade, since data were un-obtainable on remittances passing through private hands and frommercantile houses that did not cooperate in providing information.The only other series available are some partial annual estimates ofremittances to Austria-Hungary from the United States for 1892—1902supplied by the Bohemian Union Bank of Prague. In addition, officialAustrian figures were prepared for the total amount of funds sent fromall areas through Austro-Hungarian and other banks forThis material constitutes the available statistics directly relevant to theperiod 1861—1900.
Fortunately, during the peak years of immigration in the first decadeof the twentieth century estimates were prepared of the total immigrantremittances made through banks by various nationality groups for thecalendar years 1907 and 1908 (Table 20). These figures constituted thebasic source for the derivation of the series on immigrant remittances.it was necessary to obtain estimates, by nationality, both of the totalnumber of remitters each year and of per capita remittances.
The basic assumption of the ensuing calculations is that the volume ofrecent immigration is the crucial factor determining the annual number
Kuznets and Rubin, op. cit., pp. 72—74.92 Great Britain, Board of Trade, Copy of Statistical Tables Relating to Emigration
and Immigration from and into the United States in the year 1879 and report to the Boardof Trade thereon, Par lialnenlary Papers, London, H.M. Stationery Office, 1880, Vol. LXXXI,pp. 8 and 16.
Reports of tile inunigrat ion Commission, Vol. 37, Immigrant Banks, 61st Cong. 3dsess., S. Doe. 753, 1911, pp. 272—273.
680
U.S. BALANCE OF PAYMENTS, 1861-1900
TABLE 20Immigrant Remittances through Banks, 1907 and 1908
(dollars)
Country
TOTAL
PerCapita
(3)
1907
(1)(millions)
1908
(2)
Austro-Hungary 55.3 28.0 160Germany 0.9 0.7 20Italy 52.1 23.4 160Balkans 2.7 2.4 115Scandinavia 7.7 6.0 135Other Europe 4.9 3.2 30Other Countries 0.7 1.2 12Russia and Finland 16.6 12.4 80
Total 141.0 77.6
Source: Immigration Commission Reports, Vol. 37, p. 261.
of remitters for each nationality. This assumption is reinforced by anexamination of the varied motives for the remittances, which includedfinancial assistance to relatives and friends both for maintenance in thecountry of origin and for emigration to the United States. Repaymentof debts contracted before or in the process of immigration was also animportant factor. Finally, to many, immigration was temporary—ameans to accumulate funds to live comfortably and finance expenses inthe country of origin.94 It is impossible to determine the relativeimportance of each of these considerations within any period.
For each year, a five-year moving average was employed with themost recent year weighted by two in order to determine the annualnumber of remitters for each nationality. For example, the amount ofAustro-Hungarian remitters in 1907 was obtained by adding the numberof Austro-Hungarian immigrants in 1903, 1904, 1905, 1906, and twicethe figures for 1907, and dividing by The year 1907 was weightedby two to give special emphasis to short-run current variations in thetide of immigration.
The figure derived in this fashion was then divided into the 1907estimate of the dollar remittance through banks to Austria-Hungary toobtain the per capita remittances for 1907. The same procedure wasrepeated for 1908. The two sets of per capita remittances for eachnationality were averaged to obtain arithmetic means for each nationality
ibid.The worksheets underlying this operation can be obtained from the author.
681
TAB
LE 2
1Im
mig
rant
Rem
ittan
ces,
by N
atio
nalit
y, T
hrou
gh B
anks
and
Oth
er In
term
edia
ries,
1860
—19
00(m
illio
ns o
f dol
lars
)
Cal
enda
rA
ustr
ia-
Gre
at B
ritai
nan
dR
ussi
aan
dO
ther
Yea
rH
unga
ry(I
)B
alka
ns(2
)G
erm
any
(3)
Irel
and
(4)
Italy
(5)
Fin
land
(6)
Sca
ndin
avia
(7)
Eur
ope
(8)
Oth
er(9
)T
otal
(10)
1860
1.2
2.6
0.2
0.2
0.2
0.2
4.6
1861
1.0
1.8
0.2
0.2
0.2
0.2
3.6
1862
0.8
1.8
0.1
0.2
0.2
0.1
3.2
1863
0.7
1.9
0.1
0.3
0.1
0.1
3.2
1864
0.9
1.6
0.1
0.3
0.2
0.1
3.2
rn
1865
1.1
2.3
0.1
0.5
0.2
0.2
4.4
o1866
1.4
2.4
0.1
1.0
0.3
0.3
5.5
1867
0.1
1.9
2.6
0.2
0.9
0.3
0.3
6.3
1868
0.1
1.7
2.6
0.2
1.3
0.3
0.3
6.4
1869
0.1
2.2
3.1
0.2
2.9
0.4
0.4
9.3
1870
0.3
2.2
3.5
0.3
3.2
0.4
0.5
10.4
1871
0.4
2.0
3.4
0.3
3.1
0.3
0.5
10.0
1872
0.5
2.2
3.6
0.4
0.1
3.7
0.4
0.5
11.4
1873
0.8
2.3
3.5
0.8
0.1
4.4
0.5
0.7
13.1
1874
1.0
1.9
2.4
0.9
0.2
3.5
0.5
0.7
11.1
1875
1.1
1.9
1.7
0.8
0.3
3.0
0.5
0.6
9.9
1876
1.1
1.6
2.2
0.8
0.3
2.7
0.6
0.6
9.9
1877
1.1
1.3
3.2
0.8
0.4
2.3
0.5
0.6
10.2
1878
1.0
0.8
3.8
0.7
0.4
1.8
0.4
0.5
9.4
1879
1.0
0.8
4.2
0.7
0.4
2.1
0.4
0.5
10.1
cont
inue
d on
nex
t pag
e
C C,) 2 ru 0 ui 'a ru 2 -I (I) 0 C
0\ 00
TAB
LE 2
1 co
nclu
ded
Cal
enda
rY
ear
Aus
tria-
Hun
gary
(1)
Bal
kans
(2)
Ger
man
y(3
)
Gre
at B
ritai
nan
dIr
e/an
d(4
)Ita
ly(5
)
Rus
sia
and
Fin/
and
(6)
Scan
dina
via
(7)
Oth
erEu
rope
(8)
Oth
er(9
)To
/al
(10)
1880
1881
1882
1883
1884
1.5
2.4
3.!
3.6
4.7
0.9
2.0
2.9
3.2
3.7
6.8
7.3
7.7
7.8
7.7
1.1 1.5
2.7
3.4
3.3
0.4
0.4
0.9 0.7
0.8
4.3 6.2
8.8 9.4
9.7
0.5
0.6
0.9
0.8
0.8
0.8
1.0
1.2
1.2
1.2
16.3
21.4
28.2
30.1
31.9
1885
1886
1887
1888
1889
4.7
4.8
5.4
5.7
5.6
0.1
0.1
0.1
0.!
0.1
3.6
2.3
2.6
2.4
2.1
6.0
6.2
8.5
9.0
8.9
3.3
3.6
4.8
5.4
4.9
1.1 1.2
1.6
1.9
2.2
8.8
8.2
7.8
8.4
7.9
0.8 0.7
0.7
0.8
0.8
1.0
0.8
0.4
0.3
0.2
29.4
27.9
31.9
34.0
32.7
1890
1891
1892
1893
1894
7.0
8.5
9.6
9.4
9.0
0.1
0.2
0.1
0.1
0.1
1.6
2.1
2.2
1.9
1.4
8.8
8.8
7.9
5.1
5.4
6.7
8.8
8.7
9.0
9.3
2.5 3.0
4.2
3.8 3.8
8.0
8.5
8.6
7.9
6.8
0.9 1.1
1.5
1.4
1.2
0.1 0.1
0.1
0.1
0.1
35.7
41.1
42.9
38.7
37.1
1895
1896
1897
1898
1899
8.3
9.0
6.9
6.7
7.9
0.1
0.1
0.1
0.1
0.1
1.1
1.2
0.8
0.6
0.4
5.1 4.4
3.6
3.2
3.2
8.6
9.3
9.0
8.6
10.0
3.8
4.0
2.9
2.8 3.5
6.1
5.6
3.9
3.4
2.8
1.0
0.8
0.5
0.4
0.3
0.1 0.1
0.1
0.1
0.2
34.2
34.5
27.8
26.9
28.4
1900
11.2
0.4
0.4
2.9
12.4
4.7
3.5
0.4
0.2
36.1
Sour
ce: D
ata
base
d on
imm
igra
nt st
atis
tics,
by n
atio
nalit
y fr
omH
isto
rical
Sta
tistic
s of t
he U
nite
d St
ates
, pp.
33—
36 c
ombi
ned,
acco
rdin
g to
pro
cedu
re d
escr
ibed
in te
xt, w
ith p
er c
apita
rem
it-ta
nces
, by
natio
nalit
y fr
om T
able
20,
exc
ept f
or c
ol. 4
. The
dat
a in
col.
4 on
rem
ittan
ces t
o G
reat
Brit
ain
and
Irel
and
for 1
860—
87 w
ere
obta
ined
from
Par
liam
enta
ry P
aper
s, G
reat
Brit
ain,
Boa
rd o
fTr
ade,
Lon
don,
H.M
. Sta
tione
ry O
ffic
e, 1
888,
Vol
. cvn
, p. 1
8.
BALANCE OF PAYMENTS
(see Table 20).96 These figures were then multiplied by the numberof remitters to obtain a provisional series, for each nationality, of thetotal immigrant remittances through banks for the calendar years1860—1900 (see Table 21).
For Great Britain and Ireland, the partial statistics of the Board ofTrade on Remittances of the settlers in Canada and the United Statesfor 1860—87 were adopted as representative of the total immigrantremittances to that area. The figures for 1888—1900 were derived byusing the five-year moving average technique for 1887—1900 to calculatethe annual number of remitters to Great Britain and Ireland for thoseyears. The remittances were computed by applying the ratio of thenumber of 1888—1900 remitters to the number of 1887 remitters to theamount of funds sent back in These figures were linked tothe Board of Trade estimates to derive a continuous series for fourdecades.
Funds sent through immigrant banks did not represent all immigrantremittances. It was also customary for immigrants to send passagetickets to friends and relatives. Substantial evidence exists that theratio of prepaid tickets to the volume of ocean-bound immigrationfluctuated between 30 and 50 per cent, rising in periods of prosperity,declining in depressions.98 Variations in steerage fares also occurred.99
These estimates of remittances through banks and of outlays of pre-paid tickets are the two identifiable components of total immigrants'remittances. The calculations are confined to them although the govern-ment figure of $140.9 million of remittances through banks in 1907represented only slightly more than 50 per cent of the total remittancesof $275 million in 1907.100 The figure for total immigrant remittances isprobably too high, however, it contains two spurious elements: (1)funds taken by emigrants out of the coulitry, of considerable importance,1900—10, and (2) remittances used to acquire imported goods in Europe,which would already be included in commodity imports.10'
Two additional adjustments on the series for immigrant remittances96 Per capita remittances were high for the countries of the "new immigration" (Austria-
Hungary and Italy) and low for the "old immigration" (Germany and other Europe).This condition was opposite to that for immigrants' funds.
For "other Europe," in which Great Britain and Ireland were included for 1907—08tabulation, the figure of $30 was employed. "Other Europe" also includes France, Spain,Holland, Poland, Belgium, and Switzerland.
98 Industrial commission Reports, Vol. 15, Immigraf ion, 57th Cong., 1st sess., H. Doc.184, Vol. 78, 1902, Pp. 95, 104, 115, and 118. Prepaid sales are higher "when we haveprosperous times," p. 115.
ibid., pp. 103—104 and 115—117.lmmiçration Commission Reports, Vol. 37, p. 261. For an estimate of $250 million
in 1907 for total immigrant remittances, and $120 million through banks and $20 millionthrough express companies. Cf. Speare, "What did America Pay Europe for ImmigrantLabor," North American Review, Vol. CLXXXVU, January 1908, pp. 106—I 16.
101 Bullock et al., pp. 230—233.
684
U.S. BALANCE OF PAYMENTS, 1861-1900
through banks and other intermediaries were necessary. First the datahad to be converted to a fiscal year basis by averaging the figures of thetwo adjacent calendar years. The material on the proportion of pre-paid passages and the data showing the tremendous variations between1907 and 1908 both attest the highly cyclical character of immigrantremittances—newly arrived immigrants being highly vulnerable asmarginal workers to the vicissitudes of industrial unemployment.'02The figures for remittances through banks and other intermediaries donot make adequate provision for these short-run variations, beingbased on five-year moving averages and constant per capita remittances.Accordingly, the series on immigrant remittances were modified by usingFrickey's series on manufacturing production, adjusted for secular trend,as a cyclical deflator for the depressions of 1873—79, 1882—85 and
The revised figures have been added to the estimates ofprepaid passage outlays to construct a continuous series of totalimmigrant remittances for 1861—1900 (see Table 22).
EMIGRANTS' FUNDS
An often neglected but significant item in the nation's balance ofinternational payments in the late nineteenth century is the moneytaken by people emigrating from the United States. The overwhelmingmajority were recently-arrived immigrants who either were unable tomake a satisfactory economic adjustment in the United States ororiginally intended to stay in this country only until they could makeenough money to return home.'°4
In Table 13, a series on ocean-bound emigrants was derived as theresidual element in the reported outward passenger movement for1868—1900. The data are not complete, but fortunately Kuznets andRubin developed statistics for underestimated emigration for thedecades ending 1880, 1890, and 1900.105 1 distributed these figuresamong each of the years in their decades in accordance with the relativeimportance of the year's reported emigration. For 1868—70, 1 added25,500 for unreported emigration. For the first seven years, 1861—67,total emigration was assumed to be 15 per cent of total immigration.'°6The adjusted figures show clearly the effect of cyclical fluctuations in
102 Cf. Speare, pp. 115—116.103 Edwin Frickey, Prudaction in the United States, Harvard University Press, 1947, p. 60.104 A small number of native-born emigrants, some with considerable wealth, left the
nation to settle in Europe. In addition, some U.S. citizens and returning Canadians leftthe United States for Canada. Penelope Hartland believes that the amount of funds takenby these groups was nominal. See her manuscript on Canadian Balance of Paymentssince 1868, cited above.
105 Kuznets and Rubin, pp. 73—76.106 This relationship appears to be reasonable for the relatively prosperous years in this
period.
685
TAB
LE 2
2To
tal I
mm
igra
nt R
emitt
ance
s, 18
61—
1900
(per
sons
in th
ousa
nds,
dolla
r to
tals
inm
illio
ns)
RE
MIT
I'AN
CE
S T
HR
OU
GH
BA
NK
SA
ND
OT
HE
R IN
TE
RM
ED
IAR
IES
OC
EA
N-R
OU
ND
IMM
IGR
AT
EO
N
No.
Tota
lPr
e-TO
TAL
Adj
uste
dF
isca
lC
yclic
alT
otal
No.
Pre
paid
Ste
erag
epa
ymen
tR
EM
ITrA
NC
ES
Yea
rT
otal
(1)
Def
lato
r(2
)
(1)
x (2
)(3
)
Per
sons
(4)
Pre
paid
(5)
(4)
x (5
)(6
)
Far
es
(7)
(6)
x (7
)(8
)
(3)
+ (
.8)
(9)
1861
8 4.
1$
4.1
89.8
4039
.982
5$1
.0$
5.1
1862
3.4
3.4
88.7
4035
.525
0.9
4.3
1863
3.2
3.2
172.
840
69.1
251.
74.
918
643.
23.
218
9.8
4075
.925
1.9
5.1
1865
3.8
3.8
226.
540
90.6
252.
36.
1
1866
5.0
5.0
286.
445
128.
925
3.2
8.2
m
1867
5.9
5.9
292.
340
116.
925
2.9
8.8
1868
6.4
6.4
136.
140
54.4
251.
47.
818
697.
87.
833
1.6
4514
9.2
253.
711
.5
1870
9.8
9.8
346.
845
156.
125
3.9
13.7
1871
10.2
10.2
274.
245
123.
425
3.0
13.2
1872
10.7
10.7
364.
545
164.
025
4.1
14.8
1873
12.3
12.3
421.
950
211.
025
5.3
17.6
1874
12.1
9311
.328
6.3
4512
8.8
202.
613
.9
1875
10.5
858.
920
3.4
4081
.420
1.6
10.5
1876
9.9
808.
414
7.5
3551
.620
1.1
9.5
1877
10.1
798.
011
9.7
3035
.920
0.7
8.7
1878
9.8
807.
811
3.2
3034
.020
0.7
8.5
1879
9.8
838.
114
6.5
3044
.020
0.8
8.9
1880
13.2
13.2
357.
540
143.
020
2.9
16.1
1881
18.9
18.9
544.
040
217.
620
4.4
23.3
1882
24.8
24.8
690.
645
310.
820
6.2
31.0
1883
29.2
29.2
533.
040
213.
320
4.3
33.5
1884
31.0
9429
.145
8.0
4018
3.2
203.
732
.8
cont
inue
d on
nex
t pag
e
cn r :5,. z C.) m 0 11 :5,. -I
00
TAB
LE 2
2 co
nclu
ded
RE
MIT
TA
NC
ES
TH
RO
UG
H B
AN
KS
AN
D O
TH
ER
INT
ER
ME
DIA
RIE
S
OC
EAN
-BO
UN
D IM
MIG
RA
TIO
N
No.
Tota
lPr
e-T
OT
AL
Adj
uste
dFi
scal
Yea
,C
yclic
alTo
tal
Tota
lDeflator
(I)
x (2
)(1
)(2
)(3
)
No.
Pers
ons
(4)
%P
repa
id(5
)
Prep
aid
(4) x
(5)
(6)
Stee
rage
Fare
s(7)
paym
ent
(6)
x (7)
(8)
REM
ITTA
NC
ES(3
) + (8
)(9
)
1885
30.7
8626
.435
7.0
3010
7.1
202.
128
.518
8628
.790
25.8
334.
240
133.
725
3.3
29.1
1887
29.9
29.9
490.
145
220.
525
5.5
35.4
1888
33.0
33.0
546.
945
246.
125
6.2
39.2
1889
33.4
33.4
444.
440
177.
825
4.4
37.8
1890
34.2
34.2
455.
140
182.
025
4.6
38.8
1891
38.4
38.4
560.
)40
224.
025
5.6
44.0
1892
42.0
42.0
579.
745
260.
825
6.5
48.5
1893
40.8
93.5
38.1
439.
750
2)9.
925
5.5
43.6
1894
37.9
8231
.128
5.4
3085
.625
2.)
33.2
1895
35.7
8530
.325
8.3
3590
.425
2.3
32.6
1896
34.4
8428
.934
3.0
3010
2.9
303.
)32
.018
9731
.280
25.0
230.
530
69.2
302.
)27
.)18
9827
.427
.422
8.9
3580
.)30
2.4
29.8
1899
27.7
27.7
310.
440
124.
230
3.7
31.4
190(
)32
.332
.344
8.2
4520
1.7
306.
138
.4
Not
e: T
he fi
gure
s in
this
tabl
e ha
ve b
een
roun
ded
afte
r cal
cula
-tio
ns w
ere
used
in u
nrou
nded
dat
a fo
r im
mig
ratio
n an
d th
e co
m-
pone
nts o
f im
mig
rant
rem
ittan
ces.
Cal
. I: O
btai
ned
by c
alcu
latin
g th
e m
eans
of t
he c
alen
dar y
ear
data
obt
aine
d fr
om T
able
2),
col.
10.
Col
. 2: O
btai
ned
by c
onve
rting
Fric
key'
s cal
enda
r yea
r ind
ex
C 0nu
mbe
rs o
n m
anuf
actu
ring
prod
uctio
n, a
djus
ted
for s
ecul
ar tr
end,
into
fisc
al y
ear d
ata
for t
he d
epre
ssio
ns o
f 187
3—79
, 188
4—86
, and
1893
—97
, and
usi
ng th
e cy
clic
al p
eak
as th
e ba
se y
ear (
Fric
key,
p. 6
0).
Col
.4: F
rom
His
toric
al S
tatis
tics
of th
e U
nite
d S
late
s, 1
789—
1945
,
pp.
33—
36.
Co/
s. 5
and
7: B
ased
on
disc
ussi
on in
text
and
sour
ces c
ited.
BALANCE OF PAYMENTS
molding short-run variations in emigration.'°7 Depression, whichrestricted opportunities for immigrants, also accentuated the outwardtide of emigration.108
The second and more formidable problem is to ascertain the percapita amount of funds withdrawn by emigrants. A survey by theNew York Herald in 1892 estimated that the average Italian emigratedwith $250 and Britisher with $300. W. H. Allen of the AdvancedLabor Club of Brooklyn in testimony before the Industrial Commissionin 1902 considered this figure "fair" for unskilled laborers who stayedtwo years. For skilled workers, he believed the corresponding figuresto be $350 and $400, with similar amounts for Chinese who stayed tenyears.'°9 Material submitted to the Immigration Commission showsthat some emigrants returning to southern Europe took sizable sumsout of the United States and affected the economies of their nativecountries.'10 F. L. Dingley's estimate that emigrants took $118 millionfrom the country in 1888—89, however, appears highly exaggerated."With a per capita figure of $250, it would imply an exodus of morethan 400,000, almost three times greater than my estimate.
Against these high per estimates, one must evaluate the follow-ing factors. Many emigrants, especially from southern Europe, couldonly save limited amounts since they arrived in the spring and returnedto their native land in the fall."2 The official interrogation of departingaliens by the immigration authorities after 1908 shows that between 70and 80 per cent resided in the United States for less than five years."3It can be argued that the remaining 20 per cent would be more capableof accumulating larger sums over longer periods of time. However, theoutward exodus increased during depressions after many unemployedor bankrupt emigrants had drastically reduced or depleted theirresources. Finally, passenger movement statistics show that the over-whelming number of emigrants traveled as noncabin or steeragepassengers, which does not suggest the possession of great means.
Without further information available, it is necessary to make anarbitrary assumption. In the series on immigrant remittances, the sum
For comparative purposes, cf. the British series for 1870—1900 on the total numberof British and Irish and foreign immigrants arriving from the United States in the BritishIsles (Great Uritain, Board of Trade, Parliamentary Papers, 1888, Vol. cvii, p. 18; 1902,Vol. cvi, pp. 36—37) and the italian series for 1887—1900 on the number of Italians returningfrom the United States (Invnigration Commission Reports, Vol. 4, Emigration C'onditionsin Europe, p. 229.
108 Harry Jerome, Migration and Business Cycles, NBER, 1926, pp. 37, 100, 103, and 149.109 industrial Co,n,nission Reports, Vol. 15, pp. 161—164.
immigration Commission Reports, Vol. 4, pp. 230—234.F. L. Dingley, European Emigration, Special Consular Report of the Bureau of
Statistics, Department of State, Vol. ii, Washington, 1891, p. 249.112 Industrial Co,nnzission Reports, Vol. 15, pp. 52—53.113 Annual Reports of the Superintendent of Immigration, 1908, p. 65; 1909, p. 24;
1910, p. 22; and 19l1, pp. 22—23.
688
U.S. BALANCE OF PAYMENTS, 1861-1900
of $160 was used to represent the per capita remittances for Italians andAustro-Hungarians. Average emigrants could probably take as muchas, if not more than, the highest average per capita remittance andconsiderably more than the per capita funds brought in by newlyarrived immigrants. I selected $160 as the average amount taken byemigrants in prosperous years. In a manner similar to the adjustmentperformed on the series on immigrant remittances, I made provisionfor the impact of depressions on the per capita withdrawals by emigrants.Frickey's series on manufacturing production, adjusted for seculartrend, was selected as a deflator of $160 for the depressions of 1873—79,1882—85, and 1893—97. The per capita series derived in this mannerwas then multiplied by the adjusted data on emigrants to compute theannual amount of emigrants' funds withdrawn from the nation duringthe years 186 1—1900 (see Table 23).
PORT OUTLAYS OF FOREIGN PASSENGER STEAMSHIP LiNES
The outlays made by foreign passenger steamships in U.S. portsreduced the extent of U.S. indebtedness on tourist account.114 Fromthe 1860's, foreign steamships played a dominant role both in the inwardand the outward passenger movement.115 The Journal of Commerceestimated that $6,600,000, or $11,000 per vessel, represented the dis-bursements made by foreign steamships in U.S. ports."6
The data are thus fragmentary. Annual statistics on the number offoreign passenger ships arriving in U.S. ports for many years andadditional information on their monetary outlays are not available.Under the circumstances, I arbitrarily assumed that the magnitude ofthe inward passenger movement is a good indicator of the number offoreign passenger ships in U.S. ports. The Journal of Commerceestimate of $6,600,000, with 1887—94 as the base years, has been used tocompute annual figures. The ratio of the inward passenger movementto that of the base years was applied to the $6,600,000 to obtain acontinuous series of port outlays of foreign passenger lines (see Table 24).
The Financial Account and the Balance of PaymentsAmong the important elements in the current account of the nation's
international economic transactions are bankers' commissions andinterest and divIdend payments, which are calculated on a net basis andappear directly on the debit side of the balance of international pay-ments. Most of the commissions earned by foreign bankers related to
114 See the remarks of F. E. Peabody in the Banker's Magazine of New York, Vol. L,March 1895, pp. 537—546.
See the Annual Reports of the Commissioner of Emigration of New York for partialdata on the number of foreign steamers.
11.6 The Commercial Yearbook, Vol. 1, 1896, pp. 225—231.
689
TABLE 23Total Funds Taken by Departing Emigrants, 1861—1900
Col. I: From Table 13, col. 6.Col. 2: Based on discussion in the text and on figures from Kuznets and Rubin, pp. 73—76.Col. 3: For 1861—67, emigration was assumed to be 15 per cent of immigration.Col. 4: Based on discussion in text and on figures from an index of manufacturing
production adjusted for secular trends (Frickey, p. 60) as a cyclical deflator for 1873—78,1884—86, and 1893—97.
690
TABLE 24Outlays of Foreign Passenger Steamships in United States Ports, 1861—1900
Col. 1: From the Statistical Abstract of the United States, 1890, p. 214, and 1902,pp. 433—434.
Col. 2: Represent the data in col. 1 converted into index numbers with the 1887—94 =100. The data for 1860—65 were on a calendar year basis; with the figure of the first sixmonths $866 they were converted to a fiscal basis.
Col. 3: Obtained by multiplying the Journal aJ Commerce estimate of $6.6 million as theaverage for fiscal 1887—94 by the data in col. 2.
691
TABLE 25Net Bankers' Commissions Paid to Foreign Bankers, 1861—1900
Col. 1: Obtained by adding Table 5, col. 5; Table 7, cot. 6; and Table IC, col. 7.Cal. 2: Obtained by multiplying col. 1 by per cent.Cal. 3: Obtained by adding Table 3, col. 9; Table 6, cal. 8; and Table II, col. 7.Cal. 4: Obtained by multiplying cot. 3 by !4o per cent.Ca!. 5: Obtained by adding cols. 2 and 4 and an additional $100,000 as commissions on
other invisible transactions not directly related to the shipment of goods.
692
U.S. BALANCE OF PAYMENTS, 1861-1900
financing the movements of goods into and out of the United States.The special character of their function in performing these operationsand in handling foreign exchange for invisible transactions justifies theirtreatment in this section rather than under the shipping account.
BANKERS' COMMISSIONS
Commissions charged by foreign (especially London) correspondentbankers to U.S. bankers for the services rendered in handling foreignexchange have received casual attention."7 The failure of a dollarexchange market to develop under the National Banking System pro-duced a situation in which the great bulk of the nation's internationaltransactions were conducted in sterling and other foreign currencies.Most of the commissions earned by British and other foreign bankersrelated to financing the flow of goods into the United States. It wascustomary for British and other foreign exporters to draw sterling billson British banks., which authorized them through the issuance ofcommercial letters of credit. For this accommodation the U.S. importerpaid his own banker a commission. The latter arranged with Britishcorrespondents for the commercial letter of credit, for which, in turn, acommission was paid. In the calculations that follow, I assumed thatthe typical bill of exchange was a bill for ninety days for financing totalshipping costs including goods, ocean freight, and marine insurancecharges, and that the commission for the acceptance of bills drawn undercommercial letters of credit was per cent per month, or a total ofX6 per cent. in addition, the British banks imposed a charge forconfirming the commercial letter of credit. In all, it seems reasonable toassume that the total commission represented per cent of the fullvalue of goods imported."8
The foreign bankers collected compensation for rendering otherservices. Nominal charges, as low as per cent, were imposed forprocessing trade bills and documents issued by U.S. exporters andprocuring the drawee's acceptance. 1 applied this low percentage tothe full value of U.S. exports, including freight and marine insurance
117 Imlah's treatment of British bankers' commissions suffers from several limitations.It is estimated, following Giffen's lead, along with marine insurance as a flat or fluctuatingpercentage of British exports and imports. This procedure presupposes: (1) all Britishimports and exports were insured by British companies, (2) British companies did notinsure goods moving between two foreign nations; (3) bankers' commissions on importsand exports were set at the same rate; (4) no bankers' commissions were imposedon invisible current and capital transactions; (5) in the forty years preceding 1914, nobankers' commissions were earned in financing goods moving between two foreign nations.Cf. lmlah, op. cii., pp. 2 13—214.
On the validity of these assumptions for pre-1914 calculations and alternativearrangements existing between American and foreign bankers, cf. Albert C. Whitaker,Foreign Exchange, D. Appleton and Company, 1922, pp. 134—135, 180—189, and 202—207;Edgar S. Furniss, Foreign Exchange, Houghton, MifThn, 1922, pp. 32 1—324; and AnthonyW. Margraff, International Exchange, 2nd ed., National Life Building, 1904, pp. 109—110.
693
BALANCE OF PAYMENTS
receipts, to calculate such commissions. Finally, moderate fees wereimposed for cashing drafts under traveler's credits, immigrant remit-tances, security purchases, and so forth, for which a minimum of$100,000 a year seems reasonable. The total commissions of foreignbankers were computed by summing these values and a series wasderived for the entire forty years (see Table 25).
NET INTEREST AND DIVIDEND PAYMENTSAND INTERNATIONAL CAPITAL MOVEMENTS
The culminating phase of the residual method of balance of paymentsestimation was the derivation of three series: net interest and dividendpayments, net international capital movements, and the accumulatingbalance of indebtedness of the United States. This required arbitraryassumptions in the solution of formidable statistical and conceptualproblems relating to two types of data.
The first problem entailed the selection of a "stock" estimate thatwould be representative of the nation's accumulating balance of in-debtedness at any point within the period July 1, 1860 to July 1, 1900.Since the United States was a debtor nation, the accumulating balanceof indebtedness can be calculated by subtracting the value of all foreignassets held by U.S. citizens from the value of U.S. assets held by foreign-ers. It must be emphasized that the three series derived in this sectionare net figures. Contemporaries attempted to develop partial or com-plete estimates of the nation's balance of international indebtedness,but aside from other limitations, they reflect the subjective judgments ofinformed observers who were unable to keep under continuous surveyall of the items involved in an accurate assessment of the total inter-national financial position of the United States.
Fortunately, another type of "stock" estimate is now available. Aspart of the cooperative effort involved in the development of a new setof annual balance of payment statistics extending from 1790 to 1900,Douglass North derived through the use of the residual method a finalfigure of $379,200,000 for July 1, 1860 as representative of the accumu-lating balance of indebtedness of the United States. This figure isemployed in the ensuing calculations.
The second step was the determination of the average rate of returnto be applied in the series for net interest and dividend payments. Inview of the preponderance of U.S. government bonds and railroad bondsand shares in the assets held by foreigners, it seemed desirable to calcu-late an annual average rate of return for each category and weight itaccording to its relative importance.119 The weights were developed
110 In these calculations, no direct use was made of rates of return on state and canalsecurities, investments in agricultural property, urban real estate, mining, insurance com-panies, and industrial activities such as breweries, flour mills, and textile mills, and bank
694
U.S. BALANCE OF PAYMENTS, 1861-1900
from direct estimates prepared by contemporaries, including the Britishand American financial press.'2° Although the data are fragmentary, itwas possible for the period before 1880 to chart the decline in therelative importance of U.S. government bonds and the rise of railroadsecurities. After 1880, the estimate of Thomas Skinner of the LondonStock Exchange in early 1888 of the amount and the form of Americanrailroad securities held in Great Britain was used to determine theproportions in the years immediately preceding and following.'2' Dataon the average rates of return on these three components were assembledand weights applied to derive a series of annual average rates of returnas presented in Table 26 (col. I
The series indicates the average yield on the total value of thesesecurities held in the United States and abroad. For a given. year, it doesnot accurately represent the effective rate of return received by foreigninvestors, because the composition of foreign-owned U.S. assets and therates of return at which they were acquired diverged substantially fromprevailing yields. For developing an interest and dividend series, theacquisition rate of return is of crucial significance.'23 Similarly, indepressions, the incidence of defaults on interest payments on bondsmay be spread unevenly between foreign and domestic investors.
I adjusted the series to reflect these considerations. The most seriousdiscrepancies between the calculated and adjusted rates of returnprevailed in 1863—73. When the gold premium soared to great heightsduring the Civil War, European investors were able to purchase largequantities of government and other securities at substantial discounts.124After 1878, it was found that t.he calculation of annual averages wasgenerally too low. The lists of U.S. railroad bonds quoted on the LondonStock Exchange by the Economist and of other sources indicate that theaverage rates of interest on bonds in the portfolios of foreign investorswere appreciably higher than those presented in column 11 of Table 26.Many of the securities were acquired before 1875, when the railroadloans negotiated abroad reflected the higher rates prevailing in Europeanmoney markets. This factor does not apply to stock on which theaverage rate of return was as low, if not lower, t.han the dividend rate on
balances held by foreigners or of the earnings of U.S.-held direct and portfolio foreigninvestments and short-term indebtedness, which rose substantially in the late nineteenthcentury.
120 For a list of these direct estimates, see the Appendix to my disscrtation.Economist, Vol. xivi, January 7, 1888, p. 70.
122 The sources used are indicated at the bottom of Table 26.123 For each year, one must estimate a "marginal acquisition rate" on securities and
assets purchased or sold. This rate, weighted in accordance with the relative importance ofthe transactions, can be used to alter the average prevailing yields on foreign-owned assets.
124 Graham's series on net interest and dividend payments suffers from neglect of thisfactor. His estimates are considerably lower than those of contemporaries as well as thoseof the present series.
695
TAB
LE 2
6A
vera
ge R
ates
of R
etur
n on
Uni
ted
Stat
es P
ortfo
lio In
vest
men
ts H
eld
Abr
oad,
186
1—19
00(p
er c
ent)
GO
VE
RN
ME
NT
BO
ND
SR
AIL
RO
AD
BO
ND
SR
AIL
RO
AD
SH
AR
ESA
VER
AG
E R
ATE
OF
RET
UR
N
Fis
cal
Yea
r%
of
Tota
lA
vera
ge R
ate
ofIn
tere
stTo
tal
(1)
x(3
)%
of
Tota
lA
vera
geD
ivid
end
Tota
l(7
) x (8
)[(
3) +
(6) +
(9)]
4-10
0A
djus
ted
Tota
lA
vera
ge R
ate
ofIn
tere
stTo
tal
(4)
x(5
)(1)
(2)
(3)
(4)
(5)
(6)
(7)
(8)
(9)
(10)
(II)
1861
406
244)
507
350
108
806.
96.
218
6250
630
040
728
010
880
6.7
6.2
1863
606
360
307
210
10
880
6.5
6.4
1864
706
420
20
7140
108
806.
46.
9
1865
80
6480
10
770
10
880
6.3
7.4
1866
80
6480
10
770
10
880
6.3
7.6
z18
6780
6480
10
770
10
880
6.3
7.5
1868
80
6480
10
770
10
880
6.3
7.3
1869
80
6480
10
770
10
880
6.3
7.0
0
°'
1870
756
450
147
9811
888
6.4
6.9
1871
696
414
197
133
128
966.
46.
718
7263
5.9
372
24
7168
13
810
46.
46.
418
7357
5.8
331
29
7203
14
8112
6.5
6.2
1874
50
5.7
285
355.5
193
15
690
5.7
5.7
1875
45
5.6
252
40
4.0
160
155
75
4.9
5.3
1876
40
5.5
220
45
2.5
113
15
460
3.9
4.9
1877
35
5.3
186
50
4.43
222
15
345
4.5
4.4
1878
30
5.1
153
55
4.67
257
15
2.44
374.5
4.0
1879
25
5.0
125
604
240
25
2.48
61
4.3
4.5
1880
15
4.8
72
60
4.37
262
35
2.71
94
4.3
5.0
1881
54.6
23
55
4.37
240
352.90
101
3.6
5.5
1882
65
4.60
299
352.
9310
34.
05.
418
8365
4.74
308
352.
8399
4.1
5.3
1884
65
4.70
306
352.62
92
4.0
5.2
1885
65
4.71
306
352.25
79
3.9
4.7
1886
60
4.76
286
40
2.03
81
3.7
5.0
continued
on n
ext p
age
TAB
LE 2
6co
nclu
ded
Co/
s. 1
, 4, a
nd 7
: Obt
aine
d fr
om d
ata
in th
e ap
pend
ix o
f my
diss
erta
tion
and
from
ass
umpt
ions
mad
eco
ncer
ning
ann
ual c
hang
esba
sed
on a
rea
ding
of t
he c
onte
mpo
rary
fina
ncia
l pre
ss.
Col
. 2: A
rou
gh a
ppro
xim
atio
n ba
sed
on a
stu
dy o
f the
new
issu
esan
d fu
ndin
g op
erat
ions
of t
he U
.S. g
over
nmen
t, 18
61—
80, b
yR
afae
l B. B
ayle
y, th
e N
atio
nal L
oans
of th
e U
nite
d St
ates
from
July
4, 1
876
to J
une
30, 1
880
(Ten
th C
ensu
s of
the
Uni
ted
Sta
tes,
Sta
tistic
s of
Pub
lic In
debt
edne
ss, W
ashi
ngto
n, G
over
nmen
t Prin
t-in
g O
ffic
e,18
82),
pp.
444
-467
, 474
—47
8.C
ol. 5
: 186
1—73
—F
rom
the
Lond
on S
tock
Exc
hang
e Li
sts
in th
eE
cono
mis
t. 18
76—
Fro
m th
e B
anke
r's M
agaz
ine
ofN
ew Y
ork,
Vol
. 31,
Aug
ust,
1876
, pp.
841
—84
6, e
stim
ate
of 6
5 pe
r ce
nt o
f rai
l-ro
ads
in d
efau
lt. 1
874
and
1875
—B
y in
terp
olat
ion.
187
7 an
d 18
78—
The
mea
n of
the
cale
ndar
yea
r da
ta fr
om P
oor's
Man
ual o
fR
ailro
ads
(New
Yor
k, H
. V. a
nd H
. W. P
oor)
189
5,pp.
v, v
ii,18
98, p
. xiii
, 190
2, p
. xvi
.
Col
. 8: 1
861—
73—
Fro
mth
eLo
ndon
Sto
ck E
xcha
nge
List
s of
the
Eco
nom
ist.
1890
, 189
1, a
nd 1
892—
93—
Poo
r's H
andb
ook
of In
vest
-m
ent S
ecur
ities
, pas
sim
. 187
7—87
—F
rom
Poo
r'sM
anua
lof
Rai
l-ro
ads,
189
5, p
p. v
, vii.
1888
—97
—F
rom
the
Inte
rsta
te C
omm
erce
Com
mis
sion
Ann
ual R
epor
ts o
n th
e S
tatis
tics
of R
ailw
ays
in th
eU
nite
d S
tate
s, V
ol. i
x, 1
896,
pp.
49—
52; V
ol. x
, 189
7, p
p. 5
0—53
.18
98—
1900
—F
rom
Poo
r's M
anua
l of R
ailro
ads,
190
2, p
. xvi
.C
ol. 1
2: B
ased
on
disc
ussi
on in
text
and
the
follo
win
g so
urce
s:T
he L
ondo
n S
tock
Exc
hang
e Li
sts
of th
e E
cono
mis
t; F
rede
rick
R.
Mac
Cau
lay,
Som
e T
heor
etic
al P
robl
ems
Sug
gest
ed b
y th
e M
ove-
men
t of I
nter
est R
ates
, Bon
d Y
ield
s an
d S
tock
Pric
es in
the
Uni
ted
Sta
tes
sinc
e 18
56, N
BE
R, 1
938,
Tab
le1,
A5—
A20
; Hen
ry W
.S
wai
n, A
mer
ican
Eco
nom
ic A
ssoc
iatio
n, E
cono
mic
Stu
dies
, Mac
-m
illan
, Apr
il 18
98, p
p. 7
0—71
.
GOVERNMENT BONDS
RAILROAD BONDS
RAILROAD SHARES
AVERAGE RATEOF RETURN
Fis
cal
Yea
r%
of
Total
(I)
Average Rate
of
Inte
rest
(2)
Total
(I)
x (3
)(3
)
Tot
al(4
)
Average Rate
Total
of
Inte
rest
(4)
x (5
)(5
)(6
)
% o
fT
otal
(7)
Ave
rage
Div
iden
d
(8)
Tot
al(7
) x
(8)
(9)
[(3)
+(6
)+(9
))—
100
(10)
Adj
uste
d(1
1)
1887
1888
1889
55 60 62
4.73
4.53
4.38
260
272
272
45 4.0
38
2.11
1.98
1.93
95 79 73
3.6
3.5
3.5
4.9
4.8
4.7
1890
1891
1892
1893
1894
64 68 70 70 70
4.34
4.26
4.25
4.27
4.21
278
281
289
299
295
36 34 32 30 30
1.97
2.05
2.11
2.16
1.98
71 70 68 65 59
3.5
3.5
3.6
3.6
3.5
4.6
4.6
4.7
4.5
3.5
1895
1896
1897
1898
1899
70 70 70 70 70
4.18
4.36
4.36
4.22
4.23
293
305
305
295
296
30 30 30 30 30
1.72
1.68
1.62
1.59
1.79
52 51 49 48 54
3.5
3.6
3.6
3.3
3.5
4.0
3.7
3.8
4.0
4.1
1900
704.
2429
730
2.16
653.
64.
1
\0
r 0 -n -o rn -I Cl) 0 0
BALANCE OF PAYMENTS
all U.S. shares.'25 The latter feature would be more than offset by thehigher average yield prevailing on other forms of investment in industry,mining, real estate, and so forth, before 1893. As late as 1895, theJournal of Commerce selected per cent as the average rate of returnon all foreign-owned U.S. assets for the preceding seven years.'26Bullock and his associates concluded that the average yield varied from6 per cent to 4 per cent with a declining trend, 1874_95.127 Consequentlychanges were made in the computed yield series (see Table 26, col. 12).
This adjusted series was then applied to the accumulating balance ofindebtedness existing a.t the beginning of each fiscal year to obtainannual figures for net interest and dividend payments, internationalcapital movements, and the accumulating balance of indebtedness. Theaverage rate of return prevailing in fiscal 1861 was applied to North'sfigure of $379,200,000 for the nation's net foreign indebtedness as ofJuly 1, 1860. The resulting value for net interest and divident paymentswas added to the other transactions, invisible and visible, on currentaccount, which sum provided an estimate for the balance of paymentson current account (see Table 27, line 27). The net international capitalmovements for fiscal 1861 were then computed as a residual. item andadded to the accumulating balance of indebtedness prevailing at thebeginning of the year to obtain a figure for this category as of June 30,1861 (see Table 27, lines 30 and 31), a process repeated for each lateryear.
The full statement of the U.S. balance of international payments forfiscal 1861—1900 is presented in Table 27.
EvaluationThe annual estimates of the visible and invisible items in the balance
of international payments, 1861—1900, owing to limitations in the dataand the arbitrariness of the assumptions, contain varying margins oferror. Nevertheless, the techniques employed appear superior to thethree alternatives of omitting items, combining heterogeneous items ina miscellaneous category, or of assuming that two or more items offsetone another.
DIRECT ESTIMATES OF NET INDEBTEDNESS
Aside from their fragmentary and subjective character, the use ofdirect estimates of contemporaries in the derivation of balance of pay-ments statistics raises important problems. Considerable fluctuationsoccurred in the market prices of U.S. securities and the value of other
125 See the statement of Mr. Joseph Price of the English Association of American Bondand Shareholders on January 4, 1888, in the Statist, Vol. xxi, January 7, 1888, pp. 12—13.
126 Commercial Yearbook, Vol. (896, p. 226.127 Bullock et al., p. 226.
698
TAB
LE 2
7Th
e B
alan
ceof
Inte
rnat
iona
lPay
men
ts o
f the
Uni
ted
Stat
es, 1
861—
1900
(mill
ions
of d
olla
rs)
1861
1862
1863
1864
1865
1866
1867
1868
1869
1870
1. M
erch
andi
se e
xpor
ts22
8.5
203.
621
0.6
167.
417
4.5
357.
830
4.2
297.
530
3.1
412.
32.
Sal
eof s
hips
1.3
5.8
11.1
15.0
16.7
1.3
0.6
0.9
3.2
3.1
3. M
erch
andi
se im
ports
298.
019
5.0
250.
632
5.9
245.
944
7.9
407.
736
8.2
430.
044
9.0
4. B
alan
ceof
irad
e—
68.2
+14.
4—
28.9
—14
3.5
—64
.7—
88.8
—10
2.9
—69
.8—
125.
7—
35.6
>5.
Oce
anfr
eigh
t inc
ome
25.4
13.0
11.4
4.9
7.6
16.3
13.0
15.1
11.5
13.8
z6.
Car
ryin
g fr
eigh
t inc
ome
6.4
3.3
2.8
1.2
1.9
4.1
3.3
3.8
2.9
3.5
7.Po
rt ou
tlays
of f
orei
gn m
erch
ant
mar
ine
2.7
2.0
2.7
5.3
3.6
6.3
7.0
5.1
5.5
5.0
8. M
arin
e in
sura
nce
inco
me
5.2
3.9
7.0
2.2
2.0
4.6
3.9
3.8
3.2
4.1
9.To
tal s
hipp
ing
inco
me
39.7
22.2
23.9
13.6
15.1
31.3
27.2
27.8
23.1
26.4
10. O
cean
frei
ght p
aym
ents
9.8
7.4
9.8
19.4
13.2
22.6
24.8
17.9
19.2
17.5
-<
11. P
ort o
utla
ys o
f U.S
. mer
chan
tm
arin
e7.
33.
83.
31.
42.
24.
73.
84.
33.
34.
012
. Mar
ine
insu
ranc
e pa
ymen
ts4.
13.
67.
85.
43.
87.
36.
55.
36.
26.
413
.To
tal s
hipp
ing
paym
ents
21.2
14.8
20.9
26.2
19.2
34.6
35.1
27.5
28.8
27.9
14.
Ship
ping
bala
nce
+18
.5+7
.4+
3.0
—12
.6—
4.1
—3.
3—
7.9
+0.3
—5.
7—
1.5
15. F
orei
gn to
uris
t exp
endi
ture
s0.
70.
70.
70.
40.
41.
41.
31.
72.
43.
416
. Im
mig
rant
s' fu
nds
6.5
6.7
11.8
13.1
17.3
11.7
20.2
16.2
19.7
21.3
17. P
ort o
utla
ys o
f for
eign
pas
seng
erst
eam
ship
s1.
61.
21.
72.
32.
82.
63.
73.
64.
24.
818
.To
tal p
asse
nger
rece
ipts
8,8
8.6
14.2
15.8
20.5
15.7
25.2
21.5
26.3
29.5
19. U
.S. t
ouris
t exp
endi
ture
s15
.214
.114
.916
.821
.824
.525
.426
.017
.322
.020
. Im
mig
rant
s' re
mitt
ance
s5.
14.
34.
95.
16.
18.
28.
87.
811
.513
.7
cont
inue
d on
nex
t pag
e
TAB
LE 2
7 co
ntin
ued
1861
1862
1863
1864
1865
1866
1867
1868
1869
1870
21. E
mig
rant
s' fu
nds
2.2
2.2
4.2
4.6
6.0
7.6
7.6
4.5
4.5
7.1
22.
Tota
l pas
seng
er p
aym
ents
22.5
20.6
24.0
26.5
33.9
40.3
41.8
38.3
33.3
42.8
23. P
asse
nger
bala
nce
—13
.7—
12.0
—9.
8—
10.7
—13
.4—
24.6
—16
.6—
16.8
—7.
0—
13.3
24.
Net
ban
kers
' com
mis
sion
s—
1.8
—1.
2—
1.5
—2.
0—
1.5
—2.
6—
2.4
—2.
2—
2.5
—2.
625
..Net
inte
rest
and
div
iden
ds—
23.5
—30
.0—
30.9
—34
.2—
44.8
—51
.3—
57.7
—66
.8—
69.1
—79
.8w
26. F
inan
cial
bal
ance
—25
.3—
31.2
—32
.4—
36.2
—46
.3—
53.9
—60
.1—
69.0
—71
.6—
82.4
>27
. Bal
ance
ofpa
ymen
ts o
n cu
rren
tac
coun
t—
88.7
—21
.4—
68.1
—20
3.0
—12
8.5
—17
0.6
—18
7.5
—15
5.3
—21
0.0
—13
2.8
rn 028
. Net
gol
d m
ovem
ents
—I4
.0+2
3.6
+57.
6+8
9.6
+53.
8+6
3.9
+25.
1+6
6.7
+25.
3+2
3.2
29. N
etsi
lver
mov
emen
ts—
1.7
—1.
1—
2.1
+2.8
+6.0
+12.
3+1
6.8
+15.
9+1
5.5
+10.
230
. Net
inte
rnat
iona
l cap
ital m
ovem
ents
+104
.4—
1.1
+12.
6+1
10.6
+68.
7+9
4.4
+145
.6+7
2.7
+169
.2+9
9.4
31. N
et a
ccum
ulat
ing
bala
nce
ofin
debt
edne
ss48
3.6
482.
549
5.1
605.
767
4.4
768.
891
4.4
987.
11,
156.
3Z
1871
1872
1873
1874
1875
1876
1877
1878
1879
1880
1.M
erch
andi
se e
xpor
ts46
4.3
457.
954
4.6
606.
853
6.8
559.
562
2.3
712.
372
8.5
851.
12.
Sal
e of
ship
s0.
91.
31.
95.
01.
72.
21.
62.
92.
61.
63.
Mer
chan
dise
impo
rts53
5.8
648.
566
1.4
584.
454
9.0
470.
046
0.3
445.
845
4.7
681.
3
4.B
alan
ce o
f tra
de—
70.6
—18
9.3
—11
4.9
+26.
6—
10.5
+91.
7+1
63.6
+269
.4+2
76.4
+ 17
1.4
5. O
cean
frei
ght i
ncom
e15
.814
.419
.315
.813
.314
.613
.415
.011
.1.
9.3
cont
inue
d on
nex
t pag
e
6. C
arry
ing
frei
ght i
ncom
e7.
Por
t out
lays
of f
orei
gn m
erch
ant
8. 9.M
arin
e in
sura
nce
inco
me
Tota
l shi
ppin
g in
com
e
23. P
asse
nger
bal
ance
24. N
et b
anke
rs' c
omm
issi
ons
25. N
et in
tere
st a
nd d
ivid
ends
26. F
inan
cial
bal
ance
3.9
29.1
TAB
LE 2
7 co
ntin
ued
3.5
3.6
29.0
36.4
—18
.3—
18.7
—19
.3—
33.5
—38
.4—
33.6
—30
.6—
33.8
—36
.1
—87
.1
—26
.6
—90
.4—
102.
9—
105.
0—
101.
9—
98.3
—88
.6—
78.4
—80
.7—
82.6
cont
inue
d on
nex
t pag
e
1871
1872
1873
1874
1875
1876
1877
1878
1879
1880
0 —
3.6
4.8
4.0
3.3
3.7
3.3
3.8
2.8
2.3
mar
ine
5.4
4.0
7.5
8.7
7.5
3.6
30.9
6.3
3.2
26.1
5.4
3.5
27.2
4.9 3.4
25.0
4.6
3.1
26.5
4.8
2.4
21.1
7.4
2.0
21.0
10. O
cean
frei
ght p
aym
ents
II. P
orto
utla
ysof
U.S
.mer
chan
tmar
ine
19.1 4.5
26.1 4.2
30.1 5.6
26.3 4.7
21.7 4.0
18.6 4.3
17.2 4.0
15.7 4.4
16.7 3.3
25.1 2.8
12. M
arin
e in
sura
nce
paym
ents
7.6
9.2
9.7
8.3
7.8
6.5
6.7
5.6
5.5
9.0
13.
Tota
l shi
ppin
g pa
ymen
ts31
.239
.545
.439
.333
.529
.427
.925
.725
.536
.9
14. S
hipp
ing
bala
nce
—2.
1—
10.5
—9.
0—
8.4
—7.
4—
2.2
—2.
9+0
.8—
4.4
—15
.9
15. F
orei
gn to
uris
t exp
endi
ture
s6.
04.
42.
12.
82.
93.
82.
63.
94.
86.
816
. Im
mig
rant
s' fu
nds
18.0
22.6
24.8
13.5
9.6
7.1
6.0
6.0
7.6
18.6
17. P
ort o
utla
ys o
f for
eign
pas
seng
erst
eam
ship
s4.
25.
25.
74.
13.
22.
62.
32.
22.
85.
818
.To
tal p
asse
nger
rece
ipts
28.2
32.2
32.6
20.4
15.7
13.5
10.9
12.1
15.2
31.2
19. U
.S. t
ouris
t exp
endi
ture
s28
.431
.825
.029
.530
.228
.722
.828
.536
.035
.120
. Im
mig
rant
s' re
mitt
ance
s13
.214
.817
.613
.910
.59.
58.
78.
58.
916
.121
. Em
igra
nts'
fund
s22
.To
tal p
asse
nger
pay
men
ts4.
946
.54.
350
.99.
351
.910
.553
.913
.454
.18.
947
.110
.041
.58.
945
.96.
451
.36.
657
.8
> > z 0 ni -1
—3.
0—
3.6
—3.
7—
3.4
—3.
1—
2.7
—2.
7—
2.6
—2.
7—
3.9
—84
.1—
86.8
—99
.2—
101.
6—
98.8
—95
.6—
85.9
—75
.8—
78.7
TAB
LE 2
7co
ntin
ued
1871
1872
1873
1874
1875
1876
1877
1878
1879
1880
27. B
alan
ce o
fpay
men
ts o
n cu
rren
tac
coun
t—
178.
1—
308.
9—
246.
1—
120.
3—
158.
2—
42.4
+41
.5+
158.
0+
155.
2+
46.3
28. N
et g
old
mov
emen
ts+
59.8
+40
.8+
36.2
+14
.5+
53.4
+23
.2+
0.8
—4.
1—
0.7
76.9
29. N
et s
ilver
mov
emen
ts+
17.4
+25
.3+
27.0
+23
.6+
17.9
+17
.4+
15.0
+8.
0+
5.7
+1.
230
. Net
inte
rnat
iona
l cap
ital m
ovem
ents
+10
0.9
+24
2.8
+ 1
82.9
+82
.2+
86.9
+1.
8—
57.3
—16
1.9
—16
0.2
+29
.4
31.
Net
acc
umul
atin
g ba
lanc
e of
inde
bted
ness
1,35
6.6
1,59
9.4
1,78
2.3
1,86
4.5
1,95
1.4
1,95
3.2
1,89
5.9
1,73
4.0
1,57
3.8
1,60
3.2
z18
8/18
8218
8318
8418
8518
8618
8718
8818
8918
90
I. M
erch
andi
se e
xpor
ts91
7.7
766.
784
1.7
752.
675
5.9
696.
773
4.3
716.
776
2.7
881.
62.
Sal
e of
shi
ps1.
71.
12.
21.
61.
01.
20.
90.
40.
50.
7
3. M
erch
andi
se im
port
s65
5.5
739.
173
7.6
715.
161
8.5
680.
674
1.5
775.
479
8.0
845.
4
4. B
alan
ce o
f tra
de+
263.
9+
28.7
+10
6.3
+39
.1+
138.
4+
17.3
—6.
3—
58.3
—34
.8+
36.9
z5.
Oce
an fr
eigh
t inc
ome
8.4
6.6
6.7
5.5
4.7
4.6
3.9
3.5
5.1
5.0
—i
6. C
arry
ing
frei
ght i
ncom
e2.
11.
71.
71.
41.
21.
21.
00.
91.
31.
3
7. P
ort o
utla
ys o
f for
eign
mer
chan
tm
arin
e7.
28.
48.
88.
97.
88.
799
.19.
910
.210
.5
8. M
arin
e in
sura
nce
inco
me
2.2
1.7
1.9
1.9
1.5
1.4
1.3
1.1
1,4
1.3
9.T
otal
shi
ppin
g in
com
e19
.918
.419
.117
.715
.215
.915
.315
.418
.018
.1
10. O
cean
frei
ght p
aym
ents
24.1
28.0
29.3
29.7
26.1
29.0
30.2
32.8
33.2
34.1
II. P
ort o
utla
ys o
f U.S
. mer
chan
tm
arin
e2.
52.
02.
01.
71.
41.
41.
21.
11.
61.
6
12. M
arin
e in
sura
nce
paym
ents
8.5
9.9
9.6
9.7
8.2
9.1
9.9
9.8
9.8
10.1
cont
inue
d on
nex
t pag
e
13.
Tot
al s
hipp
ing
paym
ents
14.
Shi
ppin
g ba
lanc
e—
15.2
TAB
LE 2
7co
ntin
ued
—21
.8—
23.4
—20
.5—
23.6
—26
.0—
28.3
—26
.6—
27.7
—3.
7—
4.2
—4.
2—
4.1
—3.
6—
88.2
—84
.4—
88.6
—89
.6—
85.9
—91
.9—
88.6
—92
.8—
93.7
—89
.5—
97.0
—10
2.1
—11
1.3
—12
2.6
—12
9.5
27. B
alan
ce o
f pay
men
ts o
n cu
rren
tac
coun
t+
132.
0—
116.
4—
54.5
—13
5.1
—32
.9—
170.
7—
206.
3—
274.
0—
269.
8—
211.
6
35.1
1881
1882
1883
1884
1885
1886
1887
1888
1889
1890
40.9
41.1
35.7
39.5
41.3
43.7
44.6
45.8
39.9
—21
.5
6.4
7.0
25.9
29.8
8.1
9.5
40.4
46.3
34.4
38.9
23.3
31.0
7.5
11.4
65.2
81.3
—24
.8—
35.0
15. F
orei
gn to
uris
t exp
endi
ture
s16
. Im
mig
rant
s'fu
nds
17. P
ort o
utla
ys o
f for
eign
pas
seng
erst
eam
ship
s18
.T
otal
pas
seng
er r
ecei
pts
19. U
.S. t
ouris
t exp
endi
ture
s20
. Im
mig
rant
s' r
emitt
ance
s21
. Em
igra
nts'
fund
s22
.T
otal
pas
seng
er p
aym
ents
23.
bala
nce
24. N
et b
anke
rs' c
omm
issi
ons
25. N
et in
tere
st a
nd d
ivid
ends
26. F
inan
cial
bal
ance
13.2
22.5 7.8
43.5
45.4
33.5
10.8
89.7
15.3
19.3 7.!
41.7
56.0
32.8
10.0
98.8
17.3
16.5
5.8
39.6
57.6
28.5
14.8
100.
9
15.2
14.0 4.9
34.1
59.5
29.1
12.9
101.
5
—67
.4
—3.
9—
93.1
14.2
18.1 6.0
38.3
61.7
37.8
24.6
124.
1
13.9
19.9
6.6
40.4
64.8
35.4
12.1
112.
3
—71
.9
—4.
2—
97.9
14.7
17.2 6.2
38.1
67.6
38.8
23.0
129.
4
—46
.2—
57.1
—61
.3
13.8
22.7 7.2
43.7
66.7
39.2
13.9
119.
8
—76
.1
—4.
4—
106.
9
cn z rTl 0 rn
—85
.8—
91.3
—4.
5—
118.
1—
4.7
—12
4.8
28. N
et g
old
mov
emen
ts29
. Net
silv
er m
ovem
ents
—97
.5+
6.3
—1.
8+
8.7
—6.
1+
9.5
+ 1
8.3
+11
.5—
17.2
+17
.2+
23.1
+11
.7—
32.9
+9.
0—
23.6
+12
.6+
50.2
+18
.0+
5.2
+13
.830
. Net
inte
rnat
iona
l cap
ital m
ovem
ents
—40
.8+
109.
5+
51.1
+10
5.3
±32
.9+
135.
9+
230.
2+
285.
0+
201.
6+
192.
6
31. N
etac
cum
ulat
ing
bala
nce
ofin
debt
edne
ss1,
562.
41,
671.
91,
723.
01,
828.
31,
861.
21,
997.
12,
227.
32,
512.
32,
713.
92,
906.
5
'0 0 0
cont
inue
d on
nex
t pag
e
TAB
LE 2
7co
ntin
ued
189!
1892
1893
1894
1895
1896
1897
1898
1899
1900
I. M
erch
andi
se e
xpor
ts90
9.8
1,05
0.9
862.
389
2.1
807.
588
2.6
1,05
1.0
1,23
1.5
1,22
7.0
1,39
4.5
2. S
ale
of sh
ips
0.4
0.5
0.5
0.6
0.4
0.7
0.3
1.4
0.9
0.5
3. M
erch
andi
se im
ports
857.
283
5.7
875.
166
1.5
739.
378
7.5
772.
462
2.2
704.
185
8.4
4.B
alan
ce o
f ira
de+
53.0
+21
5.7
—12
.3+
231.
2+
68.6
+95
.8+
278.
9+
610.
7+
523.
8+
536.
6
5. O
cean
frei
ght i
ncom
e5.
85.
54.
34.
34.
04.
96.
26.
05.
56.
56.
Car
ryin
g fr
eigh
t inc
ome
1.4
1.4
1.1
1.I
1.0
1.2
1.5
1.5
1.4
1.6
7.Po
rt ou
tlays
of f
orei
gn m
erch
ant
mar
ine
9.8
8.2
7.7
6.6
8.3
7.8
8.9
7.3
7.7
8.8
8. M
arin
e in
sura
nce
inco
me
1.3
1.3
1.1
1.1
0.9
1.0
1.1
0.9
1.1
1.2
9.To
tal s
hipp
ing
inco
me
17.6
16.4
14.2
13.1
14.2
14.9
17.7
15.7
15.7
18.1
z10
.O
cean
frei
ght p
aym
ents
29.4
26.2
24.6
20.9
26.3
24.7
28.2
22.9
24.1
27.6
11.
Port
outla
ys o
f U.S
. mer
chan
tC
mar
ine
1.9
1.8
1.4
1.4
1.3
1.7
2.1
2.0
1.8
2.2
12.
Mar
ine
insu
ranc
e pa
ymen
ts10
.29.
29.
86.
67.
88.
27.
86.
!6.
98.
313
.To
tal s
hipp
ing
paym
ents
41.5
37.2
35.8
28.9
35.4
34.6
38.1
31.0
32.8
38.1
14. S
hipp
ing
bala
nce
—23
.9—
20.8
—21
.6—
15.8
—21
.2—
19.7
—20
.4—
15.3
—17
.1—
20.0
rn z15
.Fo
reig
n to
uris
t exp
endi
ture
s12
.513
.525
.820
.214
.214
.814
.816
.117
.419
.416
. Im
mig
rant
s' fu
nds
17.8
19.5
16.5
10.0
9.4
9.4
6.1
5.8
7.6
10.3
17. P
ort o
utla
ys o
f for
eign
pas
seng
erst
eam
ship
s7.
38.
06.
94.
54.
44.
24.
03.
84.
76.
518
.To
tal p
asse
nger
rece
ipts
37.6
41.0
49.2
34.7
28.0
28.4
34.9
25.7
29.7
36.2
19. U
.S. t
ouris
t exp
endi
ture
s68
.968
.962
.445
.375
.170
.668
.575
.977
.297
.820
. Im
mig
rant
s' re
mitt
ance
s44
.048
.543
.633
.232
.632
.027
.129
.831
.438
.421
. Em
igra
nts'
fund
s24
.225
.116
.630
.631
.326
.020
.219
.824
.426
.122
.To
tal p
asse
nger
pay
men
ts13
7.1
142.
512
2.6
109.
113
9.0
128.
611
5.8
125.
513
3.0
162.
3
23. P
asse
nger
bala
nce
—99
.5—
101.
5—
73.4
—74
.4—
111.
0—
100.
2—
90.9
—99
.8—
103.
3—
126.
1
cont
inue
d on
next
pag
e
Fro
m T
able
3,co
l. 9.
Fro
m m
ater
ial p
rovi
ded
Fro
m T
able
4, c
ol. 4
.T
he s
um o
f lin
es I
and
2 le
ss li
ne 3
.F
rom
Tab
le 6
, col
. 6.
Fro
m T
able
6, c
ol. 7
.F
rom
Tab
le 7
, col
. 5.
Fro
m T
able
11,
col
. 7.
The
sum
of l
ines
5, 6
, 7, a
nd 8
.F
rom
Tab
le 7
, col
. 6.
Fro
m T
able
9, c
ol. 5
.F
rom
Tab
le 1
0, c
ol. 7
.T
he s
um o
f lin
es lO
, Ii,
and
12.
Line
9 le
ss li
ne 1
3.F
rom
Tab
le 1
7, c
al. 1
4.Li
ne 1
6: F
rom
Tab
le 1
9, c
al. t
O.
Line
17:
Fro
m T
able
24,
cal
. 3.
Line
18: T
hesu
m o
f lin
es 1
5, 1
6, a
nd 1
7.Li
ne 1
9: F
rom
Tab
le 1
6, c
ol. 5
.
Line
20:
Fro
m T
able
22,
col
. 9.
Line
21:
Fro
m T
able
23,
col
. 5.
Line
22:
The
sum
of l
ines
19,
20,
and
21.
Line
23:
Lin
e 18
less
line
22.
Line
24:
Fro
m T
able
25,
col
. 5.
Line
25:
Obt
aine
d by
app
lyin
g ra
tes
of r
etur
n in
col
. 11
of T
able
26 to
Nor
th's
figu
re o
f $37
9 m
illio
n fo
r 18
60 a
nd s
ucce
ssiv
e fig
ures
deriv
ed o
n lin
e 31
.Li
ne 2
6: T
he s
um o
f lin
es 2
4 an
d 25
.Li
ne 2
7: T
he s
um o
f lin
es 4
, 14,
23,
and
26.
Line
28:
Fro
m T
able
5, c
al. 5
.Li
ne 2
9: F
rom
1-li
stor
ical
Sta
tistic
s of
the
Uni
ted
Sla
tes,
178
9—19
45, p
. 244
.Li
ne 3
2: T
he s
um o
f lin
es 2
7, 2
8, a
nd 2
9.Li
ne 3
3: O
btai
ned
by a
ddin
g lin
e 30
eac
h ye
ar to
figu
re in
line
31
exis
ting
at th
e be
ginn
ing
of th
at y
ear
with
Nor
th's
figu
re o
f $37
9.2
mill
ion
as a
poi
nt o
f dep
artu
re. T
his
serie
s on
inde
bted
ness
in-
clud
es c
omm
on s
tock
, the
val
ues
of w
hich
wou
ld r
elat
e to
orig
inal
acqu
isiti
on c
ost r
athe
r th
an c
onte
mpo
rary
mar
ket v
alue
s.
TA
BLE
27
conc
lude
d
1891
1892
1893
1894
1895
1896
1897
1898
1899
1900
24. N
et b
anke
rs' c
omm
issi
ons
25. N
et in
tere
st a
nd d
ivid
ends
—4.
8—
133.
7—
4.8
—14
2.9
—4.
8—
138.
7—
3.7
—11
3.0
—4.
2—
126.
4—
4.4
—12
2.0
—4.
4—
126.
8—
3.7
—13
2.6
—4.
1—
124.
4—
5.0
—11
4.3
26. F
inan
cial
bal
ance
—13
8.5
—l4
7.7
—14
3.5
—ll6
.7—
130.
6—
l26.
4—
131.
2—
136.
3—
128.
5—
119.
3
27. B
alan
ce o
f pay
men
ts o
n cu
rren
tac
coun
t—
208.
9—
54.3
—25
0.8
+24
.3—
194.
2—
150.
5+
36.4
+35
9.3
+27
4.9
+27
1.2
28. N
et g
old
mov
emen
ts29
. Net
silv
er m
ovem
ents
30. N
et in
tern
atio
nal c
apita
lm
ovem
ents
+69
.8+
4.6
+13
4.5
+0.
6+
12.9
+40
.8
+87
.9+
17.5
+14
5.4
+4.
5+
37.2
—66
.0
+30
.1+
27.1
+13
7.0
+78
.9+
31.8
+39
.8
—44
.7+
31.4
—23
.1
—10
5.0
+24.
2
—27
8.5
—51
.4+
25.6
—24
9.1
+3.
7+
21.5
—29
6.4
31N
et a
ccun
tuku
ing
bala
nce
oJin
debt
edne
ss3,
041.
03,
081.
83,
227.
23,
161.
23,
298.
23,
338.
03,
3l4.
93,
036.
42,
787.
32,
490.
9
by D
ougl
ass
Nor
th.
Line
1:
Line
2:
Line
3:
Line
4:
Line
5:
Line
6:
Line
7:
Line
8:
Line
9:
Line
/0:
Line
11:
Line
12:
Line
13:
Line
14:
Line
15:
z C.)
ru C 'TI
ru z -t 00 0 0
BALANCE OF PAYMENTS
U.S. assets held by foreigners (and similarly of U.S.-owned foreignassets) during the cyclical movements of the period. The effect of theseoscillations on the nation's balance of international indebtedness insome portions of the period was of equal if not greater significance thanthe actual international migration of capital. In contrast, annualfigures for the accumulating balance of indebtedness, derived throughthe residual method, only reflect these changes in so far as they affectthe effective yield underlying the estimates of net interest and dividendpayments.
A reasonable correspondence exists, however, between some of thecontemporary estimates and the derived series of the accumulatingbalance of indebtedness. The ensuing analysis will focus on the earlyphase, 1863—73, and the final stage, 1895—99, of the period covered.
A close relationship exists between the derived figure of $495,200,000as of June 30, 1863 and the $500 million estimate of the Secretary of theTreasury for that year.'28 Similarly the figure of $987 million of June 30,1868 is close to the estimate of the Merchant's Magazine of October 1868of $938 million for the total U.S. securities in the portfolios of foreign
Finally, the derived figure of $1,592 million for June 30,1872, is approximately 6 per cent away from the Commercial andFinancial Chronicle's figure in the spring of 1872 of $1,500 million.130
On the other hand, serious discrepancies exist between the derivedseries on the accumulating balance of indebtedness and the 1869 estimateof Wells and Bullock's attempted reconciliation of this figure with theCommercial and Financial Chronicle estimate of 1872. Wells's figure is$1,465 million for the total U.S. claims held by foreigners as of Novem-ber, 1869. This estimate is associated with "a clean national ledger" in1863.131 The latter statistic diverges drastically from my estimate ofabout $500 million, supported by the Secretary of the Treasury. Wells'sdata imply an average annual capital inflow between 1863 and 1869 of$245 million. With the higher figures for 1863, they would imply anannual inflow of $160 million. Although sizable quantities of govern-ment bonds were sold at a discount in European markets, my estimatessuggest that the Wells's 1869 estimate is clearly extravagant.'32
Bullock, accepting Wells's figure, estimated the amount of U.S.assets held abroad on the eve of the panic of 1873 as $1,500But if the Wells estimate of$ 1,465 million was correct in 1869, then with
U.S. Foreign Commerce and Navigation of the United States, 1863, p. 42.120 Merchant's Magazine, Vol. LIX, October 1868, pp. 241—248.130 Commercial and Financial Chronicle, Vol. xiv, March 12, 1872, p. 282; May 18,
1872, p. 653. Given the massive character of capital flow in the peak year 1871—1872, thediscrepancy of $92 million narrowed considerably between March and July
Wells, pp. xxvi—xxix.See the more reasonable estimate of $1,200 million for 1869 in the commercial and
Financial Chronicle, Vol. x, March 5, 1870, p. 294.133 Bullock et al., pp. 223 and 225.
706
U.S. BALANCE OF PAYMENTS, 1861-1900
the vast influx of capital between 1869 and 1872 the Commercial andFinancial Chronicle's estimate of $1,500 million for 1872 was wrong inthe latter year. Moreover, if the latter was correct in the spring of 1872,then given the continued capital inflow ($100 million in the first monthsof 1873, according to Bullock), it could not be valid at the time of thepanic of September, 1873.
For the last five years of the century, three significant estimates weremade of the nation's net capital indebtedness. In mid-1895 the Journalof Commerce's figure ranged between $1,500 and $2,500 million.'34Bullock accepted the $2,500 million.'35 Cleona Lewis's estimate for theend of 1897 was $3,395 million foreign-held U.S. assets and $685million U.S.-held foreign assets, a net indebtedness of $2,710 million.'36Finally, Nathaniel Bacon's survey of the U.S. international financialposition for January 1, 1899 yielded $3,300 million foreign-owned U.S.claims and S500 million of U.S.-owned foreign claims or a net indebted-ness of $2,830 million.'37 Although substantial fluctuations occurred inthe market values of these assets between 1895 and 1899, they cannotentirely account for the discrepancies. The figures are basically in-compatible, since the vast flow of agricultural and manufacturingexports produced a massive outflow of capital during those years. Thatthe nation's indebtedness was substantially reduced is shown clearly inTable 27. For June 30, 1899, 1 estimated it at $2,750 million.
The small discrepancy between this statistic and Bacon's figure forthe beginning of that year is readily explained by the ensuing outflow ofcapital in the six-month interval. Bacon's data were accepted byBullock and his colleagues as the best available for the period.'38 Theclose correspondence between Bacon's figure and the stock estimatederived through the residual method casts doubt on the validity of boththe Journal of Commerce's 1895 and Cleona Lewis's 1897 estimates.At the same time, along with the direct estimates for the earlier period,it supports my methods and results.'39
BULLOCK'S ESTIMATES
I now examine the major invisible and visible items for which Bullockand his colleagues developed independent period estimates.
134 Cwnn:ercial Yearbook, 1896, Vol. i, p. 226.Bullock et al., p. 226.
136 Cleona Lewis, American Stake in International lnuest,nents, publication no. 75 of theof Economics of the Brookings Institution, 1938, Washington, D.C., p. 442.
137 Nathaniel Bacon, "American International Indebtedness," Yale Review, Vol. ix,November 1900, p. 276.
Bullock et a!., p. 230.If the midpoint is taken between the 1898 value for the accumulating balance of
indebtedness of.'43,0l2 million and the corresponding 1899 value of $2,759 million, whencapital exports approximately totaled more than 8249 million, a figure approximately$50 million apart from Bacon's estimate is obtained for January I, 1899.
707
BALANCE OF PAYMENTS
MerchandiseBullock accepted the official merchandise export and import statistics
without revision. No attempt was made to alter the export series forincomplete reporting of overland shipments or the import series forillegal undervaluation and smuggling and the legal underestimation ofimports prevailing under the 1883 tariff law.
FreightBullock's freight estimates deal entirely with ocean transportation.
No provision is made for the income earned by the U.S. merchantmarine in carrying goods between foreign ports. He assumed that theratio of freight charges to merchandise fluctuated between 12 and 5 percent and averaged approximately 8 per cent for 1874—95. Bullockacknowledges that some estimates of port expenses were as high asone-third of freight income, but he employs a figure of one-fifth. Twomajor defects affect the quality of Bullock's freight estimates. Althoughocean freight rates declined, he neglects to consider that the prices ofboth exports and imports decreased simultaneously and partially offsetthe former factor. The most serious limitation of Bullock's approach ishis failure to differentiate between the character of the cargo importedin foreign vessels and that exported in U.S. vessels. Although he refersto the Journal of Commerce survey on imports for 1891—92 with its3.6 per cent estimate, he disregards this clue and assumes that the freightratio is 8 per cent for both exports and imports. Otherwise, he would beforced to conclude that the freight ratio declined from 12 per cent to3.6 per cent, a 70 per cent fall, 1873—92, clearly an exaggeration.
Tourist ExpendituresThe treatment of tourist expenditures contains several limitations.
For 1850—73, Bullock uses Kettell's figure of $15 million in the early1 850's and Wells's estimate of $39 million in the late 1860's to arrive atan annual average of $24 million. This figure is multiplied by twenty-four to obtain a total of $576 million. For 1874—95, a net annualexpenditure of $35 million is multiplied by twenty-two to derive afigure of $770 million. For the next nineteen years, a net annual averageof $170 million, based paradoxically on Paish's 1908 estimate of a percapita outlay of $1,000 with approximately 170,000 tourists, andBradstreet's $500 figure in 1914 with almost 300,000 tourists, is used toderive a total of $3,230 million.
No attempt is made to account for these tremendous shifts in annualexpenditures. Little reference is made to the expenditures of alientravelers in the United States. The overland tourist trade to and fromCanada and Mexico is completely ignored. It must be inferred that the
708
U.S. BALANCE OF PAYMENTS, 1861-1900
per capita outlays of foreign travelers in the United States coincidedwith the per capita outlays of U.S. tourists overseas.
If Kettell's figure of $15 million is employed for the early 1850's whenapproximately 30,000 tourists were overseas, it would imply a per capitaoutlay of about $500. Since Bullock accepts Wells's $1,000 assumptionfor 1869, he leaves unexplained the virtual doubling of per capitaexpenditure in less than two decades.'4° Although Bullock neglectsalien tourists for 1850—73, 1 have assembled the official statistics on U.S.citizens returning abroad and alien non-immigrants to compute the percapita outlay of U.S. tourists implicit in Bullock's estimates for threeperiods. 141
Tourist ExpendituresTourists
Bullock's U.S. Total, U.S. perPeriod U.S. Foreign Total Net Estimated Capita
Total U.S. tourist expenditures were calculated by applying the ratioof all tourists to U.S. tourists to Bullock's figures. The per capita figureof $970 for 1850—73 gibes with Wells's estimate but not with Kettell's.More serious is the implication that per capita tourist outlays declinedalmost 30 per cent, 1874—95, and rose by more than 85 per cent 1896—1914. Since he provides only estimates of total tourist expenditureswithout serious treatment of the factors causing these sharp fluctuationsin per capita outlays, we may doubt the accuracy of his figures.
Emigrant and Immigrant Funds
Bullock ignores the funds taken from the United States by the depart-ing emigrants. His figures on immigrants' funds for 1874—95 are notincluded in his balance sheet summary. For 1850—73, he assumes that6 million immigrants brought an average of $50, or a total of $330million. In the ensuing twenty-two years, approximately 9 millionarrivals brought $20 apiece, or a total of $180 million. No explanationis given for the apparent decline of 60 per cent for per capita fundsbrought in by immigrants in the two periods. The shift in the composi-tion of the immigrants from the "old" northern and western Europeancategory, with relatively high per capita amounts to the newer categoryfrom southern and eastern Europe, was not accomplished until the
140 in fact, the rise in per capita outlays had to take place between 1865 and 1868, since"This increase, however, could not have occurred prior to or during the War." ibid., p. 223.
141 This method, of course, makes no provision for the composition of the alien non-immigrant group, as in my calculations of tourisi expenditures.
709
BALANCE OF PAYMENTS
1890's. Bullock thus underestimates the total amount of immigrants'funds for 1874-95.
Immigrant Remit lances
Although immigrant remittances are lumped together with miscel-laneous items for a total of $440 million for 1874—95—an annual debitof $20 million—Bullock estimated that approximately one-third of thisamount represented funds sent abroad by foreign-born residents. Thevolume of international money orders is cited as "rough guide" to thelimited scale of immigrant remittances.'42 He made no reference to theseries of the British Board of Trade on the remittances of residents ofCanada and the United States to Great Britain and Ireland for 1848—87.In some years, 1874—95, the amount reported in this incomplete seriesalone exceeds $6 to $7 million. Also, beginning in 1880, there weresignificant increases in the arrival of Italians and other national groupsof the "new" immigration, reflected in a substantial increase, in remit-tances in the decade 1885—95 (see Table 21). It thus appears that the$6 to $7 million estimate for the average annual immigrant remittancesfor 1874—95 is inadequate.
Final Evaluation of Bullock's WorkBullock pioneered investigation of the nation's foreign transactions.
The defects in these series nevertheless aggravate the limitations of hisfragmentary approach. For 1874—95, as opposed to his catch-allcategory of "immigrants remittances, and miscellaneous," I havedeveloped independent estimates of emigrant funds, immigrant remit-tances, carrying freight income, marine insurance receipts and pay-ments, net bankers commissions, and port outlays of foreign passengersteamships. The effect is to increase the size of the deficit in the balanceof payments on current account and to raise the values for the accumu-lating balance of indebtedness. This, rather than my average rates ofreturn (which correspond fairly closely with Bullock's), accounts for thefact that my estimates of net interest and dividend payments are morethan $350 million larger. The total disparity between Bullock's esti-mates and mine is about $500 million for According to mycalculations a net capital inflow of approximately $1,500 millionoccurred in that period; Bullock estimated $1,000 million. AcceptingBacon's figure of 1 899 and the fact that the United States exported largeamounts of capital from 1896 to 1899, one must conclude that Bullockseriously underestimated the size of net capital imports between 1874and 1895.114
142 Bullock et a!., p. 227. 143 ibid., pp. 224—227 and my Table 27.In part, this position is due to his uncritical acceptance of the views of the Commercial
and Financial Chronicle that capital was exported in 1882—85 and 1890—96 without interrup-tion and in substantial amounts.
710
U.S. BALANCE OF PAYMENTS, 1861-1900
ConclusionThis study has shown the massiveness of the influx of capital into the
United States during the period of rapid economic growth and intensecyclical fluctuations of the late nineteenth century. Contrary to theopinions of contemporaries, which have been perpetuated in textbooks,no sustained outflow of capital occurred during the Civil War, or duringthe recession of 1882—85 and the depression of 1890—96. Rather, thetremendous agricultural and manufacturing export surpluses in the late1870's and 1890's sparked U.S. economic revival and were related to theensuing waves of capital exports. However, these proved to be briefinterruptions of the almost continuous movement of capital into theUnited States before 1914.
The annual balance of payment statistics presented here provide thebasis for this interpretation. Along with further statistical and historicalresearch and economic analysis, they serve to clarify the complexcharacter of the international economic transactions of the UnitedStates in the late nineteenth century and their relationship to theprocesses of economic growth and cyclical fluctuations.
COMMENTERIC E. LAMPARD, Resources for the Future, Inc.
Standard balance of payments figures for the United States in thenineteenth century have gone unrevised since the estimates by Bullock,Williams, and Tucker in 1919. The studies by North and Simon arethus an invaluable contribution to economic history and should beincorporated, with only minor amendation, in the next editions of thetextbooks.
North's claim that new evidence and improved methods of accountinghave made this revision necessary seems justified. Each of the majorcomponents of the balance is calculated separately, and annual figuresof net international capital movement are derived through the residualmethod.
On the matter of new evidence, however, there seems less cause forcelebration. For the period before 1860 North fails to indicate exactlywhat the new sources are; they look very much like the old ones—theReport of the Secretary of the Treasury, compiled in 1835 on the basisof Pitkin, Seybert, and manuscript notes in the department, and ofcourse the American State Papers: Commerce and Navigation. Somesecondary sources could certainly have been used: the handling of theLouisiana Purchase in the miscellaneous and capital account might beimproved after reference to W. B. Smith, Economic Aspects of theSecond Bank of the United States (1953) and R. W. Hidy, The House ofBaring (1949), a volume which is cited only once and in a different
711
BALANCE OF PAYMENTS
context. The capital account for 1818—21 was undoubtedly affected bythe retirement of the Louisiana Debt. Even Simon has found little newmaterial for his period, if we except the important Canadian sourcesidentified in the notes to his Table 1, and a few secondary items, mostlyBritish. The quality of the new figures resides in the more carefulscrutiny of existing sources and in the manipulation of other fugitivedata to construct activity and freight indexes for shipping. All thesequalifications, however, must be understood in the light of Edgeworth'sdictum that in statistical work beggars cannot be choosers.
Hence the new merchandise trade figures before 1820, especiallyimport values, are still tenuous. Data problems have also complicatedthe task of estimating the invisible items, much the most important ofwhich are shipping earnings. Though North has obtained improvedannual estimates for both imports and exports for 1790—1819, he choosesto rely on five-year moving averages for the half-dozen items whichappear in his final calculation. Even these have technical shortcomings,since a moving average can be ambiguous and its interpretation mostcomplex when the ideally simple cyclical conditions of constant pricesand amplitude do not obtain.
By how much do the new results, 1790—1819, differ from standardfigures given in Historical Statistics? Except for four or five years,exports are unchanged (Table 1): 1796 is raised by more than $8 millionowing to an unexplained difference between the 1835 compilation andthe original Treasury source. Presumably, something like this alsoexplains an increase of well over $4 million in 1797, while minoradjustments in other years are merely corrections of copying errors.Import values (Table 1) are all substantially raised over existing figures,except that for 1815, which is sharply reduced. The original estimateshad failed to allow for duty-free goods in the total import values andNorth has improved on the rather mechanical Treasury adjustment forthis discrepancy. Upward adjustment also stems from North's treat-ment of the valuation problem. Port of entry values, of course, ofteninclude transport costs, the bulk of which were paid to U.S. flag vesselsand should properly be included in freight earnings. North's solution isconservative: he puts the value of specific duty goods between theovervalued port of entry figure and the undervalued point of originfigure. The same procedure is applied on much surer ground to theapproximately equal quantities of ad valorem imports (Table 3). Finalimport values down to about 1804 are moderately increased overexisting figures and the same applies to 1808—12, but the years 1805—1807 are raised from $5 to $7 million. After 1816 they are raised againfrom $2 to $6 million by 1820. North agrees with George Taylor thatthe 1815 figure should be reduced by about $27 million since Pitkin'sfigure for 1815 should have reported the fiscal year rather than the
712
U.S. BALANCE OF PAYMENTS, 1861-1900
calendar year, the last quarter of which was affected by the upsurge inpostwar trade.
We are specially indebted to North for his careful consideration ofshipping earnings in face of many data problems. The significance ofthe carrying trade before 1820 is comparable to that of cotton exportsduring the second quarter of the century: ship earnings made possiblethe high level of imports and thereby contributed to national economicgrowth. Thanks to the long French wars, U.S. shipping became thelargest earner of foreign exchange and shipbuilding provided a majorimpetus to domestic manufactures, trade, and insurance during the firstquarter of the century. After 1815, earnings from the carrier trade fellsharply, not so much because of renewed competition, North argues, asthe decline in freight rates. Surely these two were not independent ofeach other? It was competition from other flags which affected ratesadversely since, although U.S. shipbuilding declined, there was noimmediate shrinking in the size of the fleet. After 1815, again capitalimports assumed unprecedented magnitude and as a consequenceinterest and dividend payments to foreigners formed the largest singledebit item after imports. Taking the period 1790—1820 as a whole, theadverse trade balance was the decisive factor in the balance of payments.Passive in every year but 1811 and 1813, it was, considering the size ofthe economy, proportionately larger than at any other period; the figureof minus $70 million in 1816 was not exceeded before the mid-century.
After 1820 the quality of both data and results is improved. Fairlycomplete figures for merchandise trade are available until about 1846when, with the shift to ad valorem duties under the Walker Tariff, theproblem of import undervaluation again becomes acute. Similarly, thevariety and magnitude of invisible items increase considerably after1850, owing to the size and character of immigration, and, therewith,the possibility of larger error. Until 1831 the North figures for importsand exports do not differ from standard sources, but an adjustment ofimport values is necessary thereafter. Despite the active balance onshipping account, the passive trade balance dominates the paymentsledger down to the Civil War, though specie exports are a mitigatingfactor after the discovery of gold in California. There is likewise asmall balance of funds brought by immigrants over remittances to thehomeland due to the volume of non-Irish immigration, chiefly fromwest and south German states. Perhaps North's outstanding contribu-tion to the revised balance of payments is his painstaking calculation ofshipping earnings. However, in spite of the close relation betweenfreight and passenger rates at this time, should not immigrant outlaysfor the voyage be entered on a separate passenger account? This wouldprovide a more detailed breakdown of shipping activity comparable toSimon's handling of the post-war period.
713
BALANCE OF PAYMENTS
On the debit side, interest and dividend payments to foreigners stillloom largest after imports. They mostly originate in foreign purchasesof state and private securities and stock in the United States Bank but,after 1850, investment in railway bonds increases rapidly. in view ofthe size of the economy in the prewar decade, however, this item exer-cises a slighter influence on the overall balance than in former times.
In twenty-one of the years 1820—60 the net balance of payments ispassive and the course of aggregate indebtedness abroad is, apart fromthe 1840's, mostly upward, reaching $377 million by 1859. North'sindebtedness figure is usually somewhat lower than that of CleonaLewis. Foreign investments in the United States follow movements inthe balance of payments fairly closely. Peaks and troughs in theinvestment cycle correspond with domestic land sales, business incor-porations, and transport developments and, to a lesser extent, withbuilding and immigration. Short-run movements in the balance andits major components, as North shows, bear a close relation to periodsof expansion and contraction in the U.S. economy generally; trade andpayments positions deteriorate in periods of expansion and vice versa.But do not these movements also correspond with fluctuations in theEuropean economy? Phases of U.S. efflorescence coincide nicely withincreases in European activity (e.g. 1825—37 and 1849—57). Herein liesstriking evidence for the larger theme of a developing "Atlanticeconomy." These changes in the arithmetic of the balance do notnecessitate much revision in the interpretation of international develop-ments during the first half of the century.
Simon's figures also represent a real advance over the work of FrankGraham, Bullock, et at., especially the latter's cavalier treatment of theinvisible account. Among visible items, too, we now have an improvedpicture of trade and ship sales, although specie movements are appar-ently unchanged. For invisibles, there is a more detailed breakdown ofthe entire freight and passenger account; also a slightly modifiedfinancial account.
On the export side, Simon's principal adjustment has been the upwardrevision of exports to Canada and Mexico (the overland trade) whichreceived no special consideration in the period before 1860. Here thenew Canadian sources have been helpful. One wonders, though, whetherCanadian totals of imports from the United States exclude re-exports tothe United Kingdom which may have become large with the growth ofthe consignment trade in primary produce after 1870. For example,quantities of dairy produce were shipped via Canada in 1880's and1890's to take advantage of Canada's reputation which was reflected inhigher export prices. U.S. import values are more complicated, owingto the incidence of both illegal and legal undervaluation. Legal under-valuation becomes most critical in the eighties after the Tariff Act of
714
U.S. BALANCE OF PAYMENTS, 1861-1900
1883, while illegal undervaluation and outright smuggling were probablygreatest immediately after the Civil War tariff, which put a premium onevasion. Simon's solution, very reasonably if somewhat arbitrarily, isto scale down the amount of undervaluation as the century progresses—from 3 per cent, 186 1—75; to 2 per cent, 1876—90, to I per cent, 1891—1900. Tables 2 and 3 show both the standard and revised series formerchandise and we note that both import and export series show upwardadjustments ranging from $10 to $20 million per year, except thatimport adjustments do not stop in 1894 but continue to 1900. Othervisible items are not much changed, though additions are made to shipsales and some careful estimates are made for emigrant withdrawals,hitherto neglected. Thus over-all trends in the net balance of indebted-ness arising on visible account are not much affected.
Simon's most ingenious contributions affect the invisible account.His shipping series are not only more accurate but more comprehensivein regard to freight rates, port outlays, marine insurance and, mostinterestingly, the passenger account. These last figures outline a delight-ful new chapter in American social history: where the great and smallbourgeois traveled, how long they stayed, their outlays, and even some-thing about the loot they brought back as earnest of their newly acquiredstatus.
Finally, there is the financial account which has special significancefor a debtor economy—slightly more of a debtor economy in the lightof Simon's researches. Bankers' commissions amount to 0.5 per cent ofthe full value of imported goods, which is not an excessive levy for theprivilege of luxuriating so long without a proper foreign exchangemarket. Interest and dividend payments abroad on government bonds,railroad bonds, and shares, are a large debit item and represent, asBritish sources indicate, a major contribution to the Atlantic econonly,although from the standpoint of an increasingly "self-sufficient" UnitedStates they are less important than during the first half of the century.Taking the balance of payments as a whole after 1861, the pattern ofmovement falls into four familiar phases: 1861—76, the balancefluctuates but always passively; 1877—81, it is uncertainly active, so thatthe net balance of accumulated indebtedness declines for the first timesince the late 1840's; 1882—96, it is markedly passive once more, withthe net balance of indebtedness reaching a peak for the century in themid-nineties; after 1896 it is sharply active and the balance of indebted-ness is reduced by almost a quarter over the last four years of thecentury. Thus we conclude that if the pattern of movements is not muchchanged by Simon's adjustments, the accumulated balance of indebted-ness is greater than the received series indicate. The historian can onlyregret that both these excellent studies are, in their present versions,so long on the arithmetic and so short on the analysis.