1The United States Economy: Why such a Weak Recovery? Martin Neil Baily and Barry Bosworth 1 The Brookings Institution Paper prepared for the Nomura Foundation’s Macro Economy Research Conference Prospects for Growth in the World’s Four Major Economies September 11, 2013 The Brookings Institution Washington D.C. AbstractWedocumentthefailuresoftheU.S.economytogeneratearecoveryfromthefinancialcrisisof2008‐09.Thegrowthofaggregatedemandislargelymovinginparallelwiththeseculargrowthinpotentialoutputwithonlymodestprogressinreducingunemployment.Wetracetheweaknesstoresidentialandnonresidentialconstructionandlimitedprogressinresolvingtheproblemsofwidespreadnegativeequitypositionsinthehousingmarket.Thedeclineinhousingvalueshasalsonegativelyimpactedtherevenuesofstateandlocalgovernmentsandforcedaretrenchmentoftheirexpenditureprograms.Asanaddedcomplication,thebusinesssectorhasreverseditsnormalroleasanetborrowerinfinancialmarkets.Businesseshavehad a depressive effect on economic activity by withdrawing more income as retained earnings–similar to a tax– than they put back in investment spending.Theresponsesofmonetaryandfiscalpolicieshavebeenlimitedandcontroversial.Monetarypolicywasconstrainedbythezeroboundoninterestratesandturnedtounorthodoxformsofdirectmarketpurchasesofsecurities.Fiscalpolicywasinitiallyhighlyexpansionarybutisnowinthemidstofamajorreversal.Theunresolvedproblemssuggestalongperiodofslowgrowthandhigherthannormalunemployment.1 Martin Baily is a senior fellow in the Economic Studies Program and the Bernard L. Schwartz Chair in Economic Policy Development. He is also the director of the Business and Public Policy Initiative Barry Bosworth is a senior fellow and the Robert Roosa Chair in International Economics. We are indebted to Mattan Alalouf for his assistance with the research.
Transcript
1
The United States Economy: Why such a Weak Recovery?
Martin Neil Baily and Barry Bosworth1 The Brookings Institution
Paper prepared for the Nomura Foundation’s Macro Economy Research Conference
Prospects for Growth in the World’s Four Major Economies
September 11, 2013 The Brookings Institution
Washington D.C. Abstract
We document the failures of the U.S. economy to generate a recovery from the financial crisis of 2008‐09. The growth of aggregate demand is largely moving in parallel with the secular growth in potential output with only modest progress in reducing unemployment. We trace the weakness to residential and nonresidential construction and limited progress in resolving the problems of widespread negative equity positions in the housing market. The decline in housing values has also negatively impacted the revenues of state and local governments and forced a retrenchment of their expenditure programs. As an added complication, the business sector has reversed its normal role as a net borrower
in financial markets. Businesses have had a depressive effect on economic activity by withdrawing more income as retained earnings–similar to a tax– than they put back in investment spending. The responses of monetary and fiscal policies have been limited and controversial. Monetary policy was constrained by the zero bound on interest rates and turned to unorthodox forms of direct market purchases of securities. Fiscal policy was initially highly expansionary but is now in the midst of a major reversal. The unresolved problems suggest a long period of slow growth and higher than normal unemployment.
1 Martin Baily is a senior fellow in the Economic Studies Program and the Bernard L. Schwartz Chair in Economic Policy Development. He is also the director of the Business and Public Policy Initiative Barry Bosworth is a senior fellow and the Robert Roosa Chair in International Economics. We are indebted to Mattan Alalouf for his assistance with the research.
2
The U.S. Economy: Why Such a Slow Recovery?
Martin Neil Baily and Barry Bosworth Brookings Institution September 11, 2013
The 2008-09 recession was by a wide margin the deepest economic downturn since the
depression of the 1930s, but it has been made even worse by the failure to generate a strong
recovery. Unemployment shot up during the recession from 4½ to 10 percent of the labor force,
and four years into the recovery, it remains at 7½ percent, far above the historical norm. This
outcome has been a surprise because past US recessions, especially severe recessions, have
shown a pronounced v-shape pattern: a sharp decline followed by an equally quick recovery.
The deep recessions in 1974-75 and in the early 1980s were followed by strong recoveries, with
annual GDP growth around 5 percent in 1976-78 and even higher in 1983-85. Why has this
recession been so different?
Nature of the weak recovery
To understand why this recession is different from the past, it is worth looking at those
prior recessions, what triggered their downturns and what facilitated their recoveries. A paper by
Stock and Watson (2012) made a contribution to this task using time-series analysis of variance
techniques (a dynamic factor model) to compare the 2007-09 recession to prior postwar cycles.
They concluded that the dynamics of the 2007-09 recession were largely similar to prior postwar
recessions, except the shocks were more severe and the financial sector played a larger role. The
authors attribute the slow recovery to sluggish supply growth as opposed to a weak recovery in
aggregate demand. In their words:
”……… although the slow nature of the subsequent recovery is partly due to the
nature and magnitude of the shocks that caused the recession, most of the slow recovery
in employment, and nearly all of that in output, is due to a secular slowdown in trend
labor force growth.” Page 129.
While there has been a substantial slowing of labor force growth, a major portion of that
slowdown is itself a response to the recession and the lack of employment opportunities –
discouraged workers who have left the labor force. Furthermore, the slowing of employment
3
growth is far greater than just the reduced labor force growth. Thus, we do not agree that slow
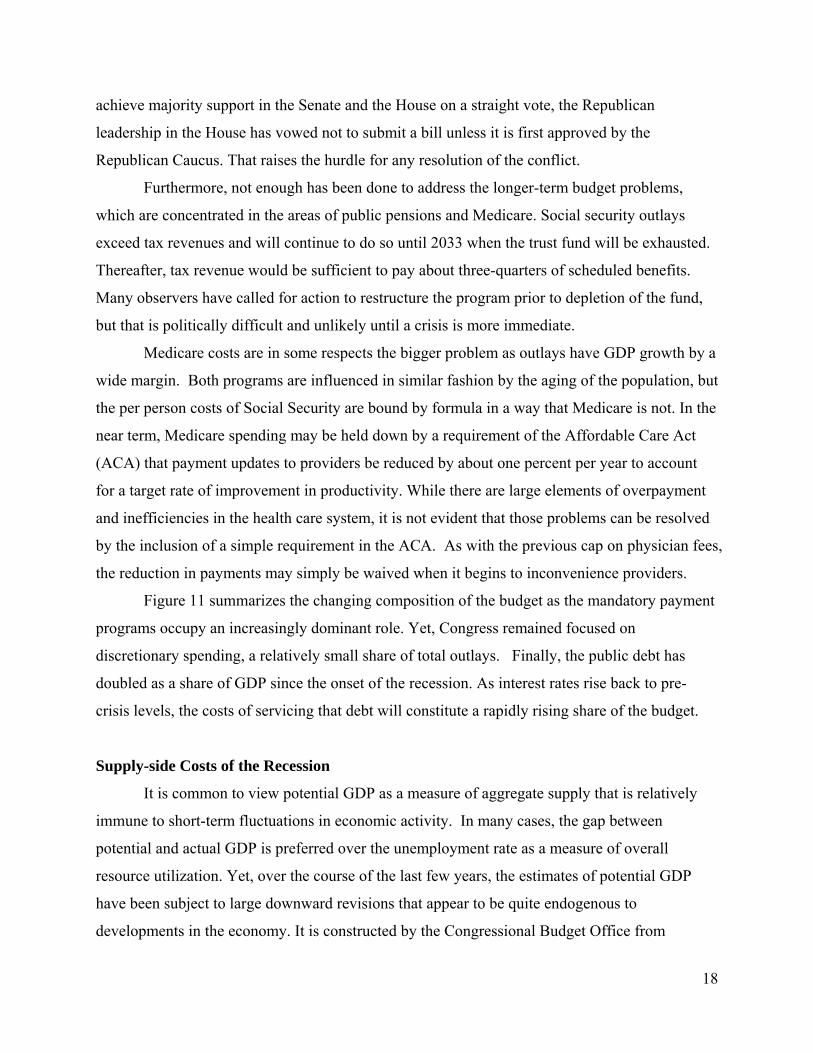
labor supply growth is the whole story of the weak recovery. Figure 1 compares the estimate of
potential output made by the Congressional Budget Office and the path of actual GDP. The
CBO’s estimate of potential output reflects the demographically-induced decline in labor force
growth that Stock and Watson describe, but the recession opened up a gap between actual and
potential GDP of 7½ percent by mid-2009. While the gap narrowed to 5½ percent by the end of
2012, the improvement has been largely due to a 2.0 percent downward revision in the level of
potential GDP since 2009.2 Figure 1 also shows that the rate of recovery has fallen far short of
that in past recessions, which would have had the economy back to full utilization of potential by
early 2012. In our judgment, output and employment in the US economy are demand and not
supply-constrained. The fact that core inflation remains muted, even declining, despite massive
monetary stimulus also reinforces this argument.
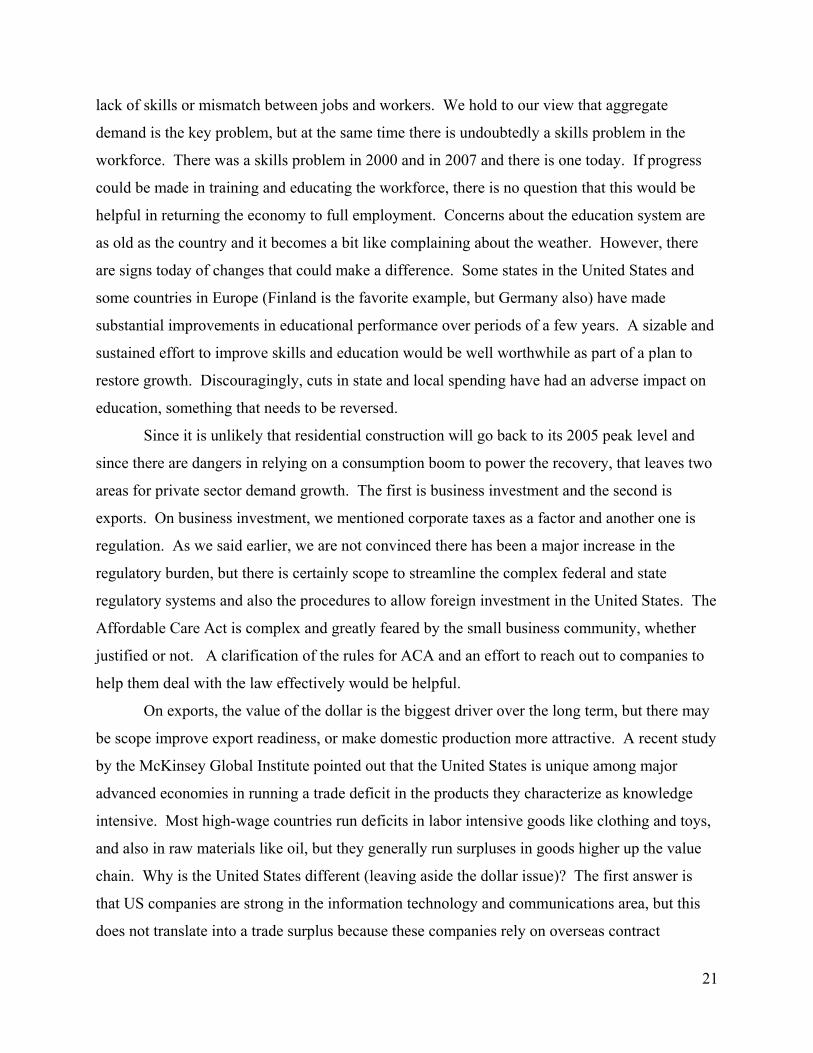
Figure 2 shows the labor market picture that lies behind Figure 1. The employment-to-
population rate plummeted from 63 percent in 2007 to 60 percent in early 2009, and it has
remained at that level for over five years. Stock and Watson refer to the decline in labor force as
being “secular” rather than cyclical and this sentiment is also reflected in growing pressures
among the policy community to accept the depressed conditions as the new normal. While a
large part of the decline in labor force growth is secular, the result of changing demographics as
the baby boom generation retires and the flow of new entrants to the workforce slows, not all of
it is. Some of it is because of the prolonged weakness in the demand for labor. In this recession
the fraction of the unemployed out of work for more than 6 months increased to 45 percent,
compared to a prior postwar peak of 25 percent. A strong boost to aggregate demand could bring
workers back into the labor force and result in upward revisions to the level and growth of
potential output.
There is no shortage of explanations for the continued demand weakness, ranging from
ongoing problems in the financial sector, the past buildup of excessive private debt, a weak
global economy, and inadequate fiscal stimulus. However, after five years of weak recovery in
which employment growth has barely matched the expansion of the working-age population, and
2 As discussed in a later section, the current estimate of potential GDP has been negatively affected by a smaller than anticipated growth in the labor force, a reduced rate of capital accumulation, and a somewhat lower rate of productivity growth.
4
unemployment has declined only because of the exit of discouraged workers from the labor force,
the issue deserves a systematic examination.
Sources of the Weak Recovery
Absent cyclical fluctuations, the composition of GDP changes only slowly over time; so,
we can use the distribution of aggregate demand in the years before the recession relative to
potential GDP as a benchmark to explore the composition of the current shortfall of GDP relative
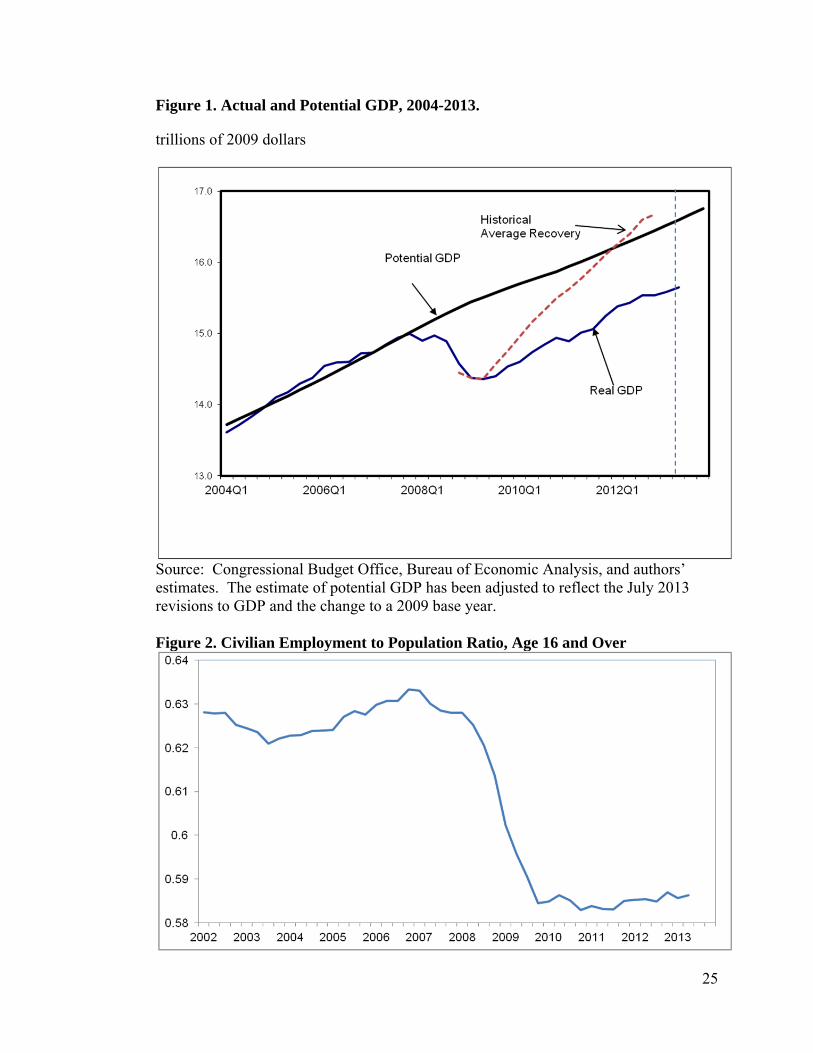
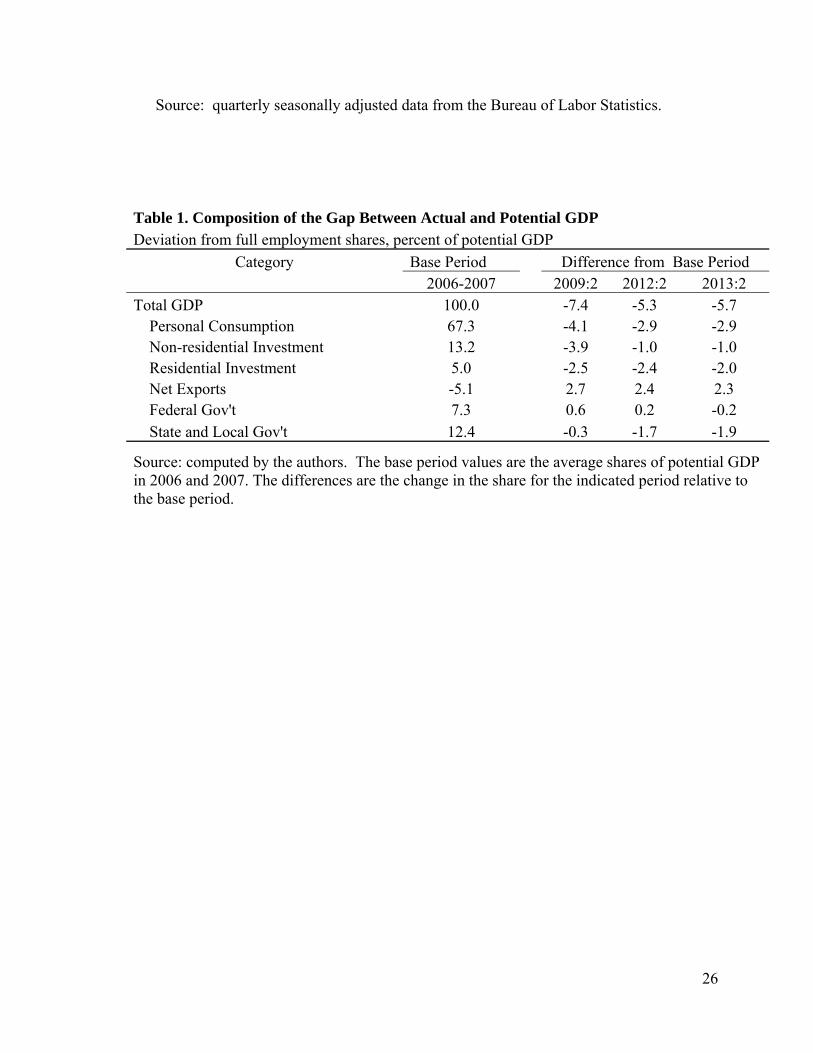
to potential. That comparison is shown in Table 1. During the pre-crisis years of 2006-07, actual
GDP was essentially equal to potential (column 1). Columns 2-4 show the distribution of the
GDP shortfall in the trough of the recession (2009:2) and two more recent quarters. At the level
of total GDP, it shows the same shortfall discussed above with respect to Figure 2, but the table
shows its distribution among the major components of aggregate demand. Because
consumption accounts for a dominant share of GDP (67%), it is the largest single contributor to
the deficit. However, it is also highly endogenous and sensitive to income changes. While the
saving rate did rise in the early stages of the crisis (discussed later) the changes in consumer
spending have largely matched those of household income.
On the other hand, residential construction stands out for contributing a disproportionate
share of the shortfall compared to its relatively small role in the total economy. Similarly, the
falloff in state and local government spending has been substantial; and, while federal spending
was initially an important source of countercyclical stimulus, it has turned slightly negative in
recent quarters. It is interesting to note that the shortfall in state and local (S&L) government
spending seems to be growing as the recession continues, presumably due to the termination of
the financial support that the federal government provided in the first few years of the downturn.
Nonresidential investment was initially a large negative factor in the recession, but it has
recovered significantly in recent years. The external trade balance has been the most important
offset to the general fall in demand, but more than half of its change can be traced to a lower
level of imports, which is in turn a reflection of the weakness of domestic demand.3
3 Historically, countries subject to large financial crises (Sweden, Japan, and Korea in the 1990s, for example) recovered through devaluation and a strong expansion of their trade balance. However, it is a limited option for the United States within the context of a weak global economy in which many other countries seek the same solution to their problems.
5
An alternative approach, shown in Figure 3, is to index each component of real GDP to it
level at the peak of the business cycle in 2007:4, and compare the cumulative change to their
average behavior over past business cycles. The first two panels for GDP and consumption
highlight the weakness of the general recovery. But again, residential investment stands out for
the huge magnitude of its shortfall; and state and local expenditures and nonresidential
investment, which are larger components of GDP, also remain below their pre-recession peaks.
The slow rebound of business investment is concentrated in nonresidential structures (not shown
separately), which was about half the size of residential construction in the years before the
recession and has followed a very similar pattern of collapse and feeble recovery. The depressed
level of S&L spending is a particular surprise because they have not played a significant role in
past business cycles. Federal expenditures were initially highly stimulative compared to past
recessions, but have turned down in recent quarters. Exports and imports were both hit hard by
the disruption of global trade in late 2008;since then, exports have matched their past rates of
cyclical recovery, while imports have remained depressed.
In summary, Table 1 and Figure 3 point to three main areas of difference between the
economy of early 2013 and the full-employment economy of 2007. Residential and non-
residential construction, state and local spending and consumption all remain below their
expected levels. Understanding the overall lack of recovery, therefore, requires explanations of
why these components of demand have not rebounded.
There is then a second question: why have other components of GDP not expanded to
replace the missing demand? Many economists, ourselves included, complained before the
recession that US growth was unbalanced, with too much residential construction and
consumption, too little investment and too large a trade deficit. But we have learned to be
careful what we wish for. Construction and consumption took a big hit in the Great Recession,
but unfortunately investment and exports have not expanded to fill the demand gap.
State and Local Governments. State and local spending has been a surprisingly large
recent source of the weakness in the current recovery. As shown in the sixth panel of Figure 3,
state and local governments have not been major factors in past recessions; and, at least in the
first two years of this recession, they benefited from large fiscal transfers from the federal
economic stimulus program. However, spending has fallen substantially since the federal funds
6
were exhausted in 2010. The decline has been broad-based, extending across a variety of
categories include education and infrastructure spending. The weakness is largely traceable to
very limited growth in local tax revenues, particularly property taxes (Harris and Shadunsky,
2013). In that sense, it is a further reflection of the costs of the collapse of the residential housing
market. In mid-2013, the real value of S&L spending was still not back to the level of 2007:4.
The situation is unlikely to change greatly in the near future. Property values are beginning to
rise, but at a gradual pace, and grants to the states will be slowed by sequestration and other
limitations on federal spending.
Construction. The downturn on the housing market has come to an end, but it appears
that the recovery will be gradual. New single family housing starts reached an inflated peak of
over 2 million units in 2005 and fell to 554 thousand by 2009 with the crisis and recession. By
June of 2013 this figure had risen to around 900 thousand, but the pace of recovery has been
slow and it will take many years to get back even to normal levels of single family construction.
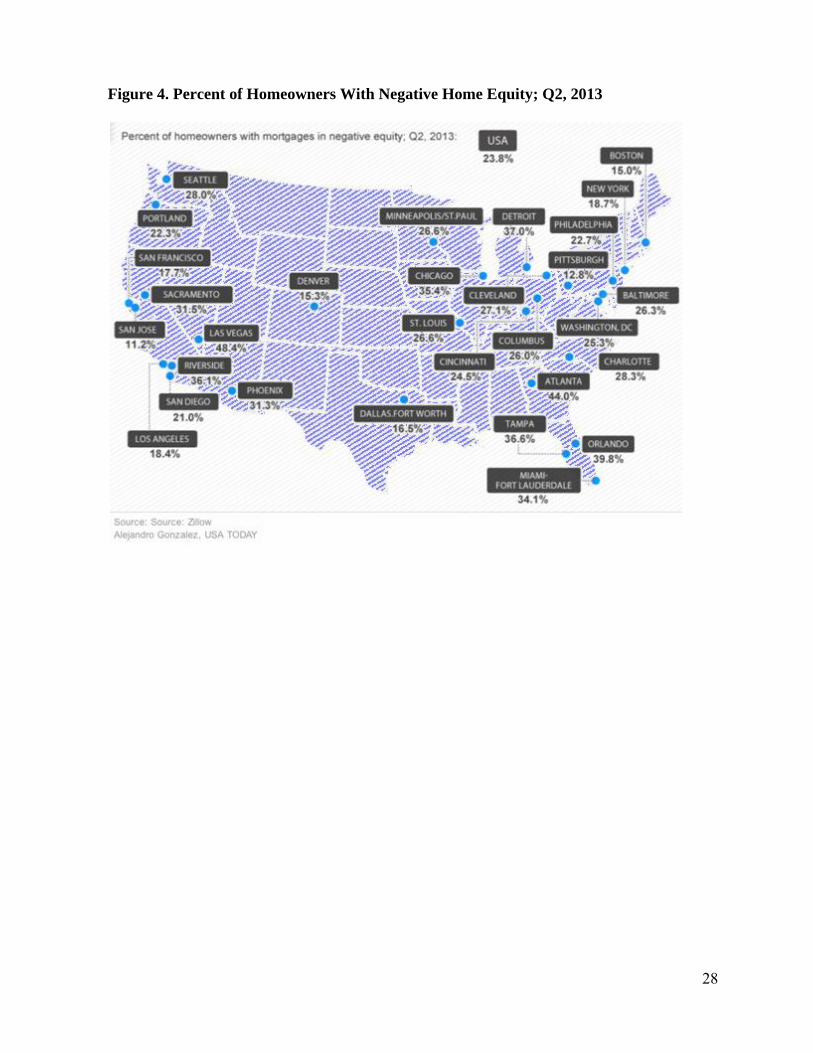
The problems of homeowners whose debt exceeded their home values has been a
dominant part of the failure to generate a recovery in residential construction As demonstrated in
Figure 4, this problem persists to the present, with almost 24 percent of all home mortgages still
underwater as of June 2013 and rates over 40 percent in some metropolitan areas. And, of
course, those homeowners who are not underwater on their mortgages have still experienced a
substantial decline in the value of their wealth held in real estate. The government has not been
able to design a program that would fundamentally alter the financial situation for a large
proportion of those homeowners with negative equity, and the normal legal processes of
foreclosure and bankruptcy have progressed very slowly.4
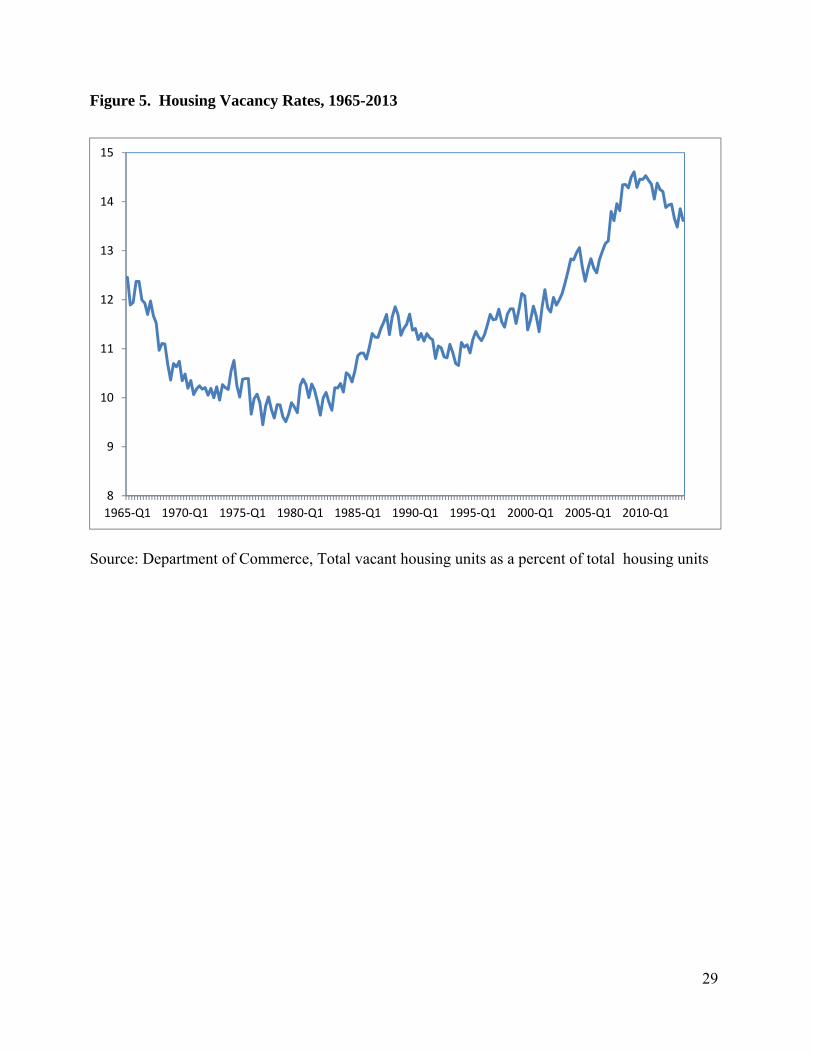
Vacant housing units, while they have come down in recent months, remain at
historically high levels (Figure 5). In past recessions, construction would fall short of the pace of
household formations and a falling vacancy rate would ultimately provide the basis for recovery.
However, in the current cycle the elimination of excess units has been very slow, presumably
because low rates of job creation and distressed housing finance continue to discourage the
formation of new households.
4 The multiple dimensions of the housing crisis created a dynamic with strong negative feedback effects as delinquent mortgages pushed homeowners into foreclosure and distressed sales that added to the downward pressure on home prices, raising the negative equity of others.
7
The collapse of nonresidential construction was concentrated in office buildings, retailing
and lodging. These were areas of significant overbuilding during the years leading up to the
recession, and they are particularly sensitive to the availability of credit. Many shopping centers
have high vacancy rates and some have gone bankrupt or been sold off. Developers are less
likely to build new retail facilities if they can buy up existing ones cheaply. On the credit side,
banks tightened standards on commercial real estate lending throughout 2009 and 2010, delaying
a significant easing of credit until late 2011. An unusually high level of business uncertainty in
the first few years of the recovery also contributed to an aversion to projects whose returns
stretch over multiple years.
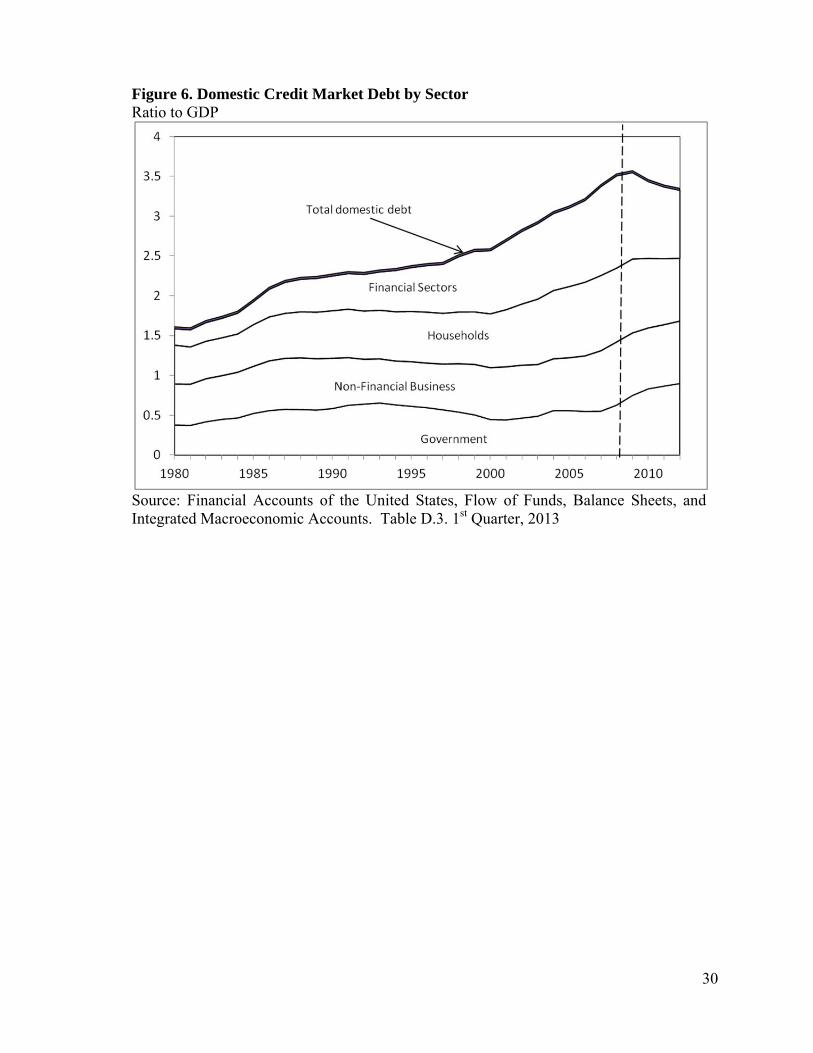
Consumption, Debt, and the Housing Market. Many commentators believe that excessive
debt was a primary cause of the economic crisis and argue that recovery will be dependent on a
long and painful process of deleveraging throughout the economy –in both the private and public
sectors.5 The analysis of international financial crises and their aftermath has generated an
enormous literature, but we propose to focus only on the applicability of some of the arguments
to the situation in the United States, where the issue is largely one of a debt overhang in the
private sector (Figure 6). Government debt to GDP was flat or declining in the decade prior to
the crisis, and political factors rather than increased sovereign risk, have dominated decisions
about its evolution since 2007. Within the private sector, the growth of debt was concentrated in
households (mortgages) and financial institutions. These two sectors have both undergone some
debt reduction since the beginning of the crisis. Nonfinancial business debt rose only modestly
before the crisis, and it has been a stable share of GDP in recent years. Large corporations have
not been seriously impacted and their debt levels have increased slightly, presumably in response
to very attractive financing terms, but smaller non-corporate businesses may have been impacted
by tighter credit conditions and their debt levels are unchanged.
Opinion and evidence on the impact of the continued housing price weakness on
consumption are divided. Economic theorists have argued that declines in housing wealth should
have no impact on consumption because the household sector is both the owner and the user of
the housing stock. It is the flow of housing services, which did not change when housing prices
5 Prominent advocates of this view include: Reinhart and Rogoff (2009, 2011), Mian and Sufi (2010, 2011), Eggertsson and Krugman (2011), McKinsey Global Institute (2011), and Dynan (2012).
8
plummeted, that is of value to consumers. While technically correct, that perspective does not
reflect the way actual families behaved following the unprecedented 30 percent decline in
housing prices in the Great Recession. Quite possibly this is because actual families frequently
deviate from the rational models that economists devise to explain their behavior. However,
there is also a more straightforward explanation. Owning a home and accumulating equity in
that home created substantial option value for households prior to the recession. It allowed them
to borrow larger amounts at a lower rate of interest than would have been possible without the
housing collateral. Accumulated value in a home provided security for older households, giving
them the option, for example, of selling their houses to buy a place in an assisted living facility.
Large numbers of middle and upper middle class families used their home equity to fund college
tuition expenses, new cars, bigger homes and second homes. Thus, the housing boom provided a
boost to aggregate demand prior to the recession that has not returned or been replaced in the
recovery.
During the housing boom some families overused the borrowing power that their
homes provided and by the time the bubble burst were saddled with a level of debt that they
could not manage; this forced these families into extreme adjustments of their normal
consumption Therefore, it may be the case that household debt is having a greater negative
impact than most economists would have thought possible prior to the recession. Most
macroeconomic models of consumption have not typically included a separate explanatory role
for debt; although they have included it indirectly as an element of household net worth, which is
often estimated to be an important determinant of spending. Thus while the traditional models
have performed well in tracking the path of aggregate consumer spending since the recession,
they do not provide clear evidence on the impact of debt.
However, recent microeconomic research has found that highly indebted households have
reduced their consumption by more than others (Dynan, 2012). Mian and Sufi (2011) also find
significant geographical correlation between high debt-to-income levels and subsequent
employment losses, but their findings include effects operating through the collapse of local
construction in addition to reduced consumption.
We began this section by asking why, exactly, consumption has remained weak. The
answer has turned out to be relatively easy to find, if not over-determined. Real disposable
income has grown slowly along with the continued weakness in the labor market. American
9
households are spending around 96 percent of their disposable income, which is down a little
from the 98 percent or so they were spending in the boom, but that can hardly be seen as an over-
reaction to the loss of wealth, the high debt and the job uncertainty many workers face. In this
sense, one can argue that the slow growth of consumption is simply a consequence of the slow
recovery and not a cause of it. That is to say, if income were to rise faster, consumption would
follow.
The problem with this logic and with viewing consumption purely as a passive variable in
the recovery is that it neglects the two-way interaction between consumption and income. As
mentioned above, consumption is two-thirds of GDP and hence two-thirds of aggregate demand.
Getting consumption growth up is an important, if not essential, way to spur income growth and
achieve a stronger recovery.
The interaction of income and consumption (or saving) was part of the view of the Great
Depression developed in the 1930s by John Maynard Keynes. In its modern incarnation, neo-
Keynesianism talks about the possibility of multiple equilibria, which means that the economy
can follow either a high or a low growth path. If consumption grows rapidly then demand
growth is strong, generating more jobs and income and potentially stimulating investment as well
— the dynamic of a boom. If job growth is slow however, this implies that household income
and consumption growth will be slow — the dynamic of a weak economy. In 1982, Nobel Prize
winner Peter Diamond published an article in the Journal of Political Economy modeling the
labor market in these terms with a high-income equilibrium and a low-income equilibrium.6
Expectations play an important role in determining which of the equilibria will hold. If
households and businesses expect slow growth, then their spending, job search and investment
choices will reflect that expectation and help keep the economy in a low income (or low growth)
scenario. If monetary policy has hit the zero interest bound, this removes an important tool for
moving from a low level income position to a higher income position, as Keynes described. In
the current economic situation, several years after the trough of the cycle, the expectation of slow
growth has become entrenched.
This seemingly academic debate has important policy implications. The Federal Reserve
has kept the Federal Funds rate near zero and used quantitative easing in part to raise house
6 In Diamond’s model there is a continuum of equilibria with the outcome for the economy depending on people’s expectations. If households and consumers expect slow growth (a low level of income) then this is what prevails. Including investment decisions in the discussion extrapolates beyond the specifics of the Diamond model.
10
prices and encourage spending. Part of the fiscal stimulus was geared towards providing at least
a temporary boost to disposable income and getting consumers spending again. The goal is to
get the economy out of the low growth trap and onto a stronger growth path. We return to the
policy issue later in the paper.
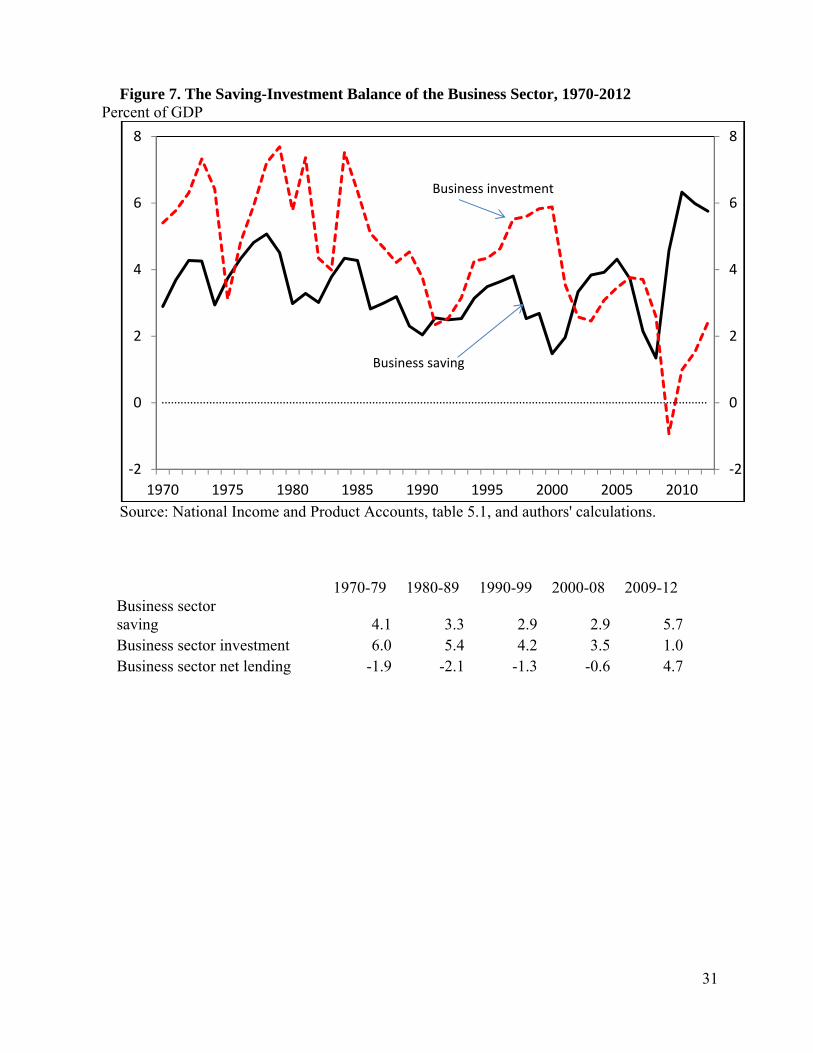
Corporate Finance. There has been a major shift in the financing of business investment.
In the midst of the poor overall growth performance, the corporate profit rate has soared to a
level (17.5%) not matched since the 1960s. Businesses have largely held onto that income as
retained earnings, rather than using it to finance additional investment. In economic terms, the
average return to corporate capital is very high, but the expected return on marginal additions to
capital (investment) is seen as low. As a result, since the recovery began, companies have
become net suppliers of funds to other sectors – a shift in the balance of net lending by more than
five percent of GDP. As evidenced in Figure 7, this is an unprecedented phenomenon;
historically, the business sector has been a net borrower of funds from households in order to
finance its investments. In part, this reversal is a reflection of the weak recovery of investment
mentioned earlier, but the greater surprise lies with the surge of corporate profits in the midst of a
recession and low utilization of existing capacity. This begs the question, why is this pattern, not
seen in previous recoveries, emerging in this recovery?
For Japanese observers the pattern does not seem surprising, since they have been in the
same position themselves In the aftermath of the Japanese financial crisis of the early 1990s,
corporate saving rose far above the rate of investment. In both cases, the business sector has had
a depressive impact on economic activity as it withdraws more income as retained earnings–
similar to a tax– than it puts back in investment spending.
While an explanation of the Japanese case is beyond the scope of this paper, we do offer
some possible reasons for what has happened in the United States. First, it is evident from
Figure 7 that there has been a downward trend in business investment as a percent of GDP dating
back to the 1980s, when both the numerator and the denominator were measured in nominal
dollars. The trend was temporarily reversed by the technology boom of the 1990s, when large
investments were made in information and communications equipment and software. Arguably,
this boost of investment in the 90s was artificial, created by over-optimism about the returns to
tech investments. Regardless, the tech boom faded after 2000 and the level of business
11
investment resumed its downward trend, contributing to the slow recovery from the 2001
recession and the jobless recovery that was a concern after that recession. The Great Recession
knocked investment way down below its historical trend, and the recovery has been very weak
since then, reaching a point that is well below the percent of GDP in the cyclical trough of the
1970s. Some of the weakness in business investment, therefore, reflects longer run forces that are
not attributable to the Great Recession alone. One explanation for the pattern in Figure 7 is that
the price of capital goods has declined relative to the rest of GDP as investment has shifted away
from infrastructure and traditional capital goods and towards computers and telecommunications
equipment. Businesses do not need to spend as much on investment because they are buying
cheaper goods, but, of course, that means business investment is providing a smaller boost to
domestic employment and aggregate demand. Reinforcing this same effect is the shift of the US
economy away from heavy industry and towards less capital intensive services. That shift, in
turn, reflects a shift in US domestic demand towards services as well as a global restructuring of
production, with emerging economies like China seeing their share rise as the U.S. share declines.
The US now imports a lot of the goods it used to make and no longer invests in the production
facilities to produce them.
Another explanation of weak investment demand that is popular among conservatives
makes the case that government policies of various kinds have discouraged businesses from
investing in America. They claim that the growth of entitlement programs and the large budget
deficits of recent years have crowded out private investment. Some positthat an increase in
regulation is also a factor, particularly, the fear by businesses that health care premiums and
carbon and other environmental regulations will raise US production costs.
We do not find these arguments persuasive. Crowding out occurs when high levels of
government spending or deficits cause interest rates to increase and hence discourage private
investment. In this recovery, interest rates have been at record lows even for bonds with some
risk. In fact, one of the reasons for the high level of corporate profits has been low interest costs.
Regulation of carbon emissions has not really progressed very far and the drop in natural gas
prices has made that form of energy very cheap and encouraged some forms of investment.
Although healthcare costs are a serious problem in the United States, premiums and spending on
health care have grown very slowly in recent years. One aspect of the conservative agenda we
do agree with however is the proposition that the high statutory corporate tax rate in the United
12
States, which is much higher than in other advanced economies, is discouraging investment
within the United States.
So why is investment so weak in this recovery? Beyond the longer term trend decline,
the most plausible answer is one that we have already discussed. The US economy is caught in a
low growth trap where income is growing slowly, demand is growing slowly and the need for
investment is weak.
Financial conditions. Given the dominant role of financial problems at the onset of the
recession, the tightening of credit availability as lenders sought to rebuild their capital positions
served as a logical explanation for the initial severity of the recession. But capital positions have
been rebuilt, equity markets have recovered, and market interest rates are extraordinarily low.
Are financial conditions still constraining the recovery?
In the immediate aftermath of the financial crisis a large number of researchers developed
financial conditions indexes (FCIs) aimed at exploring the relationship between financial market
conditions and activity in the broader economy. Initially, various composite indexes seemed to
display a useful link with future economic developments (Hatzius and others, 2010). They were
particularly elevated in the early months of the 2007-09 recession. However, as time went on,
most of those indexes declined back toward their historical means, signaling an easing of credit
conditions, yet the economic recovery has not gained momentum. The latest assessments
(Aramonte and others, 2013) imply only a weak correlation with various macroeconomic
indicators and over only a relatively short forecast horizon.
Most of the FCIs have been constructed by collecting a wide range of financial market
indicators and then using various statistical techniques to construct weighted measures to
represent the principle components of variation within the set. The indicators include rates of
return, measures of market volatility, risk premiums and subjective valuations of market
conditions from surveys. An overview of a large number of such indexes and the factors that go
into them is provided by Kliesen and others (2012). Aramonte and others (2013) construct an
index of the indexes and use it to test for correlation with future economic developments. They
found only a weak correlation with various macroeconomic indicators, and that the correlation is
statistically significant only when the period of evaluation includes the 2007-09 recession,
13
suggesting that the construction of the indexes is dominated by recent developments and that
their predictive power was low.
However, the construction of the FCIs is based on broad cyclical concerns and a proper
discussion of loan availability and credit standards demands a narrower focus on the conditions for
loans to consumers and for mortgages specifically. Originally, that discussion centered on reports by
loan officers of a severe tightening of loan terms in the early years of the recession. But more
recent responses to the FRB survey of loan practices indicate an equally dramatic easing of credit
terms (Figure 8). In addition, the terms for commercial loans and mortgages have moved very
closely together, excepting the 2000-02 recession. While credit rationing may have been
important in the onset of the crisis, there is little evidence that it is relevant in 2013. It is difficult,
however, to interpret the FRB loan survey because it is reported in terms changes – tightening or
loosening –of loan standards. That leaves some uncertainty about the comparison of lending
practices over several years. Thus, while loan standards have clearly eased in recent years, we
cannot be sure that they have returned to the terms of the years before the recession.
Monetary Policy
It is evident from a multitude of policy statements by various monetary officials that they
would have followed an easier monetary policy in the aftermath of the recession if they had not
been constrained by the zero bound on short-term interest rates. In an attempt to overcome that
limitation, they have pursued several rounds of asset purchases and provided forward guidance
about their future intentions as a means of continuing to influence longer-duration interest rates
in spite of the limitation imposed on traditional policies. The first round of direct asset purchases
(QE1), in 2008 and 2009, emphasized the purchase of government bonds and mortgage-backed
securities aimed at restoring liquidity to the markets. The second round (QE2) in 2010-11 was
directed toward lengthening the maturity of the bank’s holdings of longer-term Treasury debt,
and the third round (QE3), initiated in the fall of 2012, expanded the prior program to again
include mortgage-backed securities (MBS) with no predetermined termination date, tying
changes in the policy to future economic conditions. The combined purchases of longer-term
securities have totaled $85 billion per month over the past eight months. The Federal Reserve’s
asset portfolio has now increased from less than $1 trillion prior to the recession to more than
$3.5 trillion today (Figure 9).
14
While there has not been unanimity of opinion, most of the earlier assessments concluded
that the various versions of quantitative easing have had an important impact on long rates and
hence on aggregate demand. Long rates have been lowered by between 65 and 120 bps,
according to Federal Reserve research, resulting in GDP between 1 and 3 percent higher than it
would have been in the absence of quantitative easing (Bernanke, 2012).
Monetary policy has helped modestly in easing the Great Recession and in improving the
recovery incrementally. What it has not done is jumpstart the economy back to a strong recovery
path. Almost all postwar recession in the United States have all followed a similar pattern:
inflation accelerates in the boom, leading the Federal Reserve to raise interest rates and push the
economy into a mild or a deep recession depending on the severity of the monetary policy shock;
then the Fed then eases rates, encouraging interest-sensitive spending categories to increase and
the economy to recover. This recession was different because of the collapse of housing prices
and the financial crisis. The Fed did yeoman work in stabilizing the financial sector but once
short-term interest rates were driven to zero, it lacked the power to get the economy back on
track.
Countercyclical Fiscal Policy
If the economy is stuck in a low income trap and monetary policy cannot do much to help,
the solution proposed by many is to use a fiscal stimulus. With the economy stuck because of
inadequate demand from the private sector, the government should step up and spend itself,
adding to demand and getting growth moving. Of course, fiscal stimulus was an important part
of the package of countercyclical policies introduced by President Obama. Congress passed an
$800 billion fiscal stimulus package. Running government budget deficits is considered
appropriate during periods of economic weakness, in this view, and there certainly were large
deficits. Mostly the deficits were caused by the sharp decline in tax revenues as a result of the
recession itself, but the temporary boost to spending also contributed. In addition, the prior
Administration of George W. Bush had sharply cut taxes, so that there had been budget deficits
even before the recession.
Did the fiscal stimulus work? Economists, not surprisingly, do not agree on the answer
to this question, but the most sensible conclusion is that the recession was less severe than it
would have been without the stimulus and that the stimulus did promote recovery in the short
15
term. Real GDP fell at an 8.3 percent annual rate in the fourth quarter of 2008 and 5.1 percent in
the first quarter of 2009. By end of 2009 the economy was growing at around a 3 percent rate, a
massive reversal.
The problem, of course, is that the recovery was not sustained and growth slid down
again. The theory of fiscal stimulus is that it jumpstarts a recovery and that sustaining the
recovery depends on whether or not there is a change in the expectational equilibrium for private
sector participants. That did not happen after the Great Recession. Japanese observers may again
have a sense of déjà vu because Japan has run large budget deficits ever since its crisis in 1990
and yet economic growth has been sluggish.
What went wrong? There are two clear examples where expansionary fiscal policy has
shifted the US economy back to sustained growth and full employment after a deep recession.
The first was the result of massive spending on war preparations and then World War II itself,
when, the economy finally moved out of the Great Depression and was able to sustain strong
economic growth. The favorable growth pattern continued after the war, even though the
process of demobilization slowed things down for a few years. Second, President Reagan
instituted very large and sustained income tax cuts that contributed to the rapid recovery of the
economy after 1982. These tax cuts were seen as permanent by most people at the time.
A problem with the Obama stimulus, then, was that it was too small and too short-lived to
overcome the severity of the Great Recession. Lawrence Summers warned about the danger of a
stimulus that was too small and too short-run in speeches prior to the start of the Obama
Administration. Others inside and outside the administration pushed for a larger stimulus. In the
event, the actual stimulus package was a product of the political process. The emerging large
budget deficits were troubling to Congress and the American people, which kept the size of the
stimulus package down. And the design of the stimulus spending itself was largely left to
Members of Congress, spreading the money thinly around on a geographic basis. Americans
decided they were not getting value for money from the increased government spending,
something that is unpopular in any case. In addition, the stimulus package came on top of the
very unpopular TARP legislation.
Given the political constraints, it is hard to sort out blame for the problems with the fiscal
stimulus package. Maybe it was the best that could be done under the circumstances or perhaps
a better policy was feasible. What does appear to have been a serious mistake was the excessive
16
optimism about the impact of the stimulus and the ability of the economy to recover quickly after
the trough. Jared Bernstein and Christine Romer co-authored a study that claimed the stimulus
package would create millions of jobs and restore full employment. Summers did not want to
make comments that would unsettle the economy and so he too was overoptimistic about the
recovery. As a result, the stimulus package got a very bad name everywhere and was perceived
as a failure, making it very hard or impossible to enact a second stimulus program, such as an
infrastructure construction plan
Another factor that influenced the US fiscal policy debate was the events in Europe that
spread asthe financial crisis spread, becoming a fully global recession. By late 2009 the
Eurozone crisis was brewing and concerns intensified in 2010. The Eurozone crisis was a
sovereign debt crisis in which several European economies faced sharply higher interest rates on
their government debt issuance and Greek debt became unsellable on the private market. The
Eurozone countries and the UK responded to the crisis by developing plans for fiscal
consolidation. The greatest danger was seen to be the failure of sovereign debt markets and the
solution was to cut spending and raise taxes in order to close budget deficits. Many US
policymakers saw in Europe a lesson for our fiscal policy and the urgency of lowering budget
deficits. Tax increases have never been popular here and so the answer was to propose severe
cuts in government spending. This was true at the federal level but also for states and localities.
The chances of a major second stimulus spending program became vanishingly small.
In his New York Times columns, however, Paul Krugman has railed against what he sees
as the folly of this reaction to Europe’s situation. As he points out correctly, the austerity
programs in Europe have not worked out too well for them. The Eurozone shifted back into a
double-dip second recession, in contrast to the United States that has at least kept growth positive.
Greece and Spain, on the other hand, have been faced with massive unemployment, declining
GDP and budget deficits that come in much worse than forecast as tax revenues decline due to
the weakness in their economies.
Finally, there is a case for a well-planned infrastructure initiative in the United States to
repair the aging transportation system that threatens to adversely impact productivity in the years
to come. Such an initiative would be valuable even in a full employment economy, but seems
especially useful at a time when there is slack capacity in the economy and when interest rates
17
are low, making it cheap to finance long-term investments. The politics of such an initiative are
not good right now, but maybe that will change.
Problems in the Current Budget Debate
The dysfunctional nature of the political battles over the budget has held the U.S.
Congress up to considerable ridicule, but the outcome has been a surprisingly large shift in the
net fiscal position. Taxes have been increased, expenditures cut, and the budget deficit has fallen
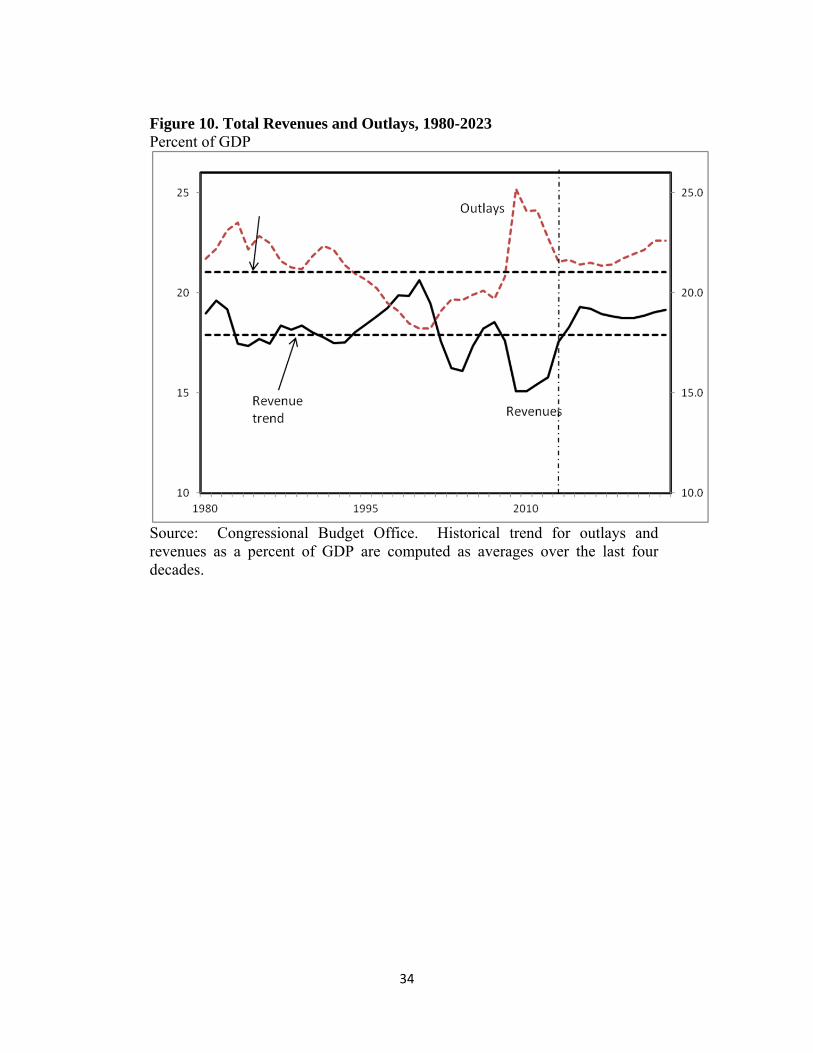
considerably. The overall deficit is now projected to drop from 7 percent of GDP in 2012 to 4
percent in 2013 and a low of 2.1 percent in 2015 (Figure 10). The publically-held debt is
expected to level out at 76 percent of GDP in 2014 and decline thereafter. Despite the
perceptions of congressional stalemate and paralysis, the pace of the deficit reduction has been
extraordinary, given that it peaked at 10 percent of GDP in 2009.7 Numerically, most of the
battle over budget deficits and debt has been resolved.
It is not clear, however, that these fiscal targets are achievable in future years. To begin
with, the discretionary spending caps introduced by the Budget Control Act imply a continuing
reduction in the ratio of discretionary spending to GDP from 8.3 percent in 2012 to 5.5 percent
of GDP by 2023. That is a level of discretionary spending far below that of any period in the last
50 years for which the CBO reports data. Since Congress could not agree on specific program
changes to meet the spending caps in 2013, it resorted to across-the-board percentage reductions,
a policy package known as sequestration. They have not yet agreed to an alternative in 2014.
While both political parties have expressed their dissatisfaction with the rigidity of sequestration,
each prefers it to the proposed substitute of the other. The Democrats have suggested additional
tax increases in place of some of the mandated cuts in spending and the Republicans have
countered with even larger proposed spending reductions.
Two short-term challenges must be resolved in coming months. First, Congress needs to
agree to a budget for fiscal year 2014 in order to avoid a shutdown on October 1st; and second, it
needs to agree to an extension of the debt ceiling by early November to avoid a debt default. It is
possible that Congress will approve a short-term spending bill through to November in order to
consolidate the two issues and raise the political stakes. While various compromises might
7 Recent revisions to the CBO projections have further reduced the magnitude of the projected deficits. They are largely due to unanticipated increases in income taxes from capital gains and the one‐time effects of large payments from the federally‐sponsored mortgage companies.
18
achieve majority support in the Senate and the House on a straight vote, the Republican
leadership in the House has vowed not to submit a bill unless it is first approved by the
Republican Caucus. That raises the hurdle for any resolution of the conflict.
Furthermore, not enough has been done to address the longer-term budget problems,
which are concentrated in the areas of public pensions and Medicare. Social security outlays
exceed tax revenues and will continue to do so until 2033 when the trust fund will be exhausted.
Thereafter, tax revenue would be sufficient to pay about three-quarters of scheduled benefits.
Many observers have called for action to restructure the program prior to depletion of the fund,
but that is politically difficult and unlikely until a crisis is more immediate.
Medicare costs are in some respects the bigger problem as outlays have GDP growth by a
wide margin. Both programs are influenced in similar fashion by the aging of the population, but
the per person costs of Social Security are bound by formula in a way that Medicare is not. In the
near term, Medicare spending may be held down by a requirement of the Affordable Care Act
(ACA) that payment updates to providers be reduced by about one percent per year to account
for a target rate of improvement in productivity. While there are large elements of overpayment
and inefficiencies in the health care system, it is not evident that those problems can be resolved
by the inclusion of a simple requirement in the ACA. As with the previous cap on physician fees,
the reduction in payments may simply be waived when it begins to inconvenience providers.
Figure 11 summarizes the changing composition of the budget as the mandatory payment
programs occupy an increasingly dominant role. Yet, Congress remained focused on
discretionary spending, a relatively small share of total outlays. Finally, the public debt has
doubled as a share of GDP since the onset of the recession. As interest rates rise back to pre-
crisis levels, the costs of servicing that debt will constitute a rapidly rising share of the budget.
Supply-side Costs of the Recession
It is common to view potential GDP as a measure of aggregate supply that is relatively
immune to short-term fluctuations in economic activity. In many cases, the gap between
potential and actual GDP is preferred over the unemployment rate as a measure of overall
resource utilization. Yet, over the course of the last few years, the estimates of potential GDP
have been subject to large downward revisions that appear to be quite endogenous to
developments in the economy. It is constructed by the Congressional Budget Office from
19
underlying trends in the labor force, capital stock and total factor productivity (TFP) growth that
abstract from the short-run fluctuations. Between 2007 and 2013, the estimates of projected
growth in potential GDP have been progressively scaled back to the extent that the level of
potential GDP in 2013 has been lowered by 6 percent relative to the 2007 estimate. Thus,
whereas we indicated a gap of 5.7 percent in Figure 1, the use of a pre-recession measure of
potential GDP would double the size of the gap to nearly 12 percent. The revisions can be
largely traced to the severe fall in investment and consequently smaller volume of capital
services after 2007 (Jacobson and Ochino, 2013). The CBO anticipated the demographic
changes that are slowing the growth of the labor force, but there is an additional impact of higher
than anticipated long-term unemployment on labor force participation. They have also slightly
reduced their estimate of productivity growth. Some of the loss of capital can be made up
through higher investment in future years, but the CBO methodology suggests that the recession
will impose a permanent loss of productive capacity amounting to about 1½ percent of GDP,
split in roughly equal amounts among a smaller labor force, lower capital stock and reduced TFP
(CBO, 2013, p. 45).
As shown in Figure 12, the labor force participation rate has fallen by 3.6 percentage
points between its peak in 2000 and the second quarter of 2013. About two-thirds of the drop
can be attributed to foreseeable changes in the demographic structure of the labor force, but an
additional 1½ percentage points, or about 3½ million workers, reflect unanticipated withdrawals
from the workforce that may or may not be reversible in future years.8 That is on top of the
reported level of unemployment of 11½ million. If we follow the CBO in assuming that a 5.5
percent unemployment rate can be associated with actual GDP equal to potential, the excess
reported unemployment is about 3 million, for a total employment shortfall of 6½ million. The
employment shortfall fades away by 2017, but that simply reflects an assumption that CBO
makes in every year that the economy will return to full employment by the end of its 5-year
projection horizon.
The continuation of high levels of cyclical unemployment is generating growing concerns
that the sustained loss of employment may translate into permanent reductions in labor force
participation as workers lose skills and attachment to the labor force. The probability of re-entry
8 The demographic changes are computed at the level of 5‐year age groups for men and women separately using fixed participation rates for 2000. As can be seen from the chart, the results would be similar if they were computed with the participation rates of 2007 when the recession began.
20
may also be reduced by institutional arrangements, such as disability programs and early
retirement. While the evidence of such effects is limited, some studies have found long-lasting
effects of severe recessions on participation rates of the young and the old in panel studies of
OECD countries (Duval and others, 2010). In addition, a recent analysis by Macroeconomic
Advisors (2013) points to the unusually large rise in long-duration unemployment and its
potential effect on future participation rates
Conclusions: What Can be Done to Stimulate the Recovery?
Monetary policy has been doing all that it can to keep the recovery moving. The key
issue for the Federal Reserve now is whether or not it should scale back its quantitative easing
program and at what time should it start raising the Federal Funds rate. The consensus is that the
easing program will be tapered off in future months with the purchase of securities coming to an
end in mid-2014. When Bernanke first spoke of setting a time for this shift, there was a very
sharp reaction in the markets and long term bond prices moved up 70 to 100 bps, a big move
simply on a tentative announcement. So far there does not seem to have been a big impact of
this move as housing and auto sales are booming. Bernanke has indicated that increases in the
Federal Funds rate will be “data-driven,” meaning that if the economy grows more strongly or if
inflation starts to increase then rates will rise, andif growth remains sluggish, rates will stay low.
That policy makes sense.
As we have seen in this paper, the low rate of business investment is part of the pattern
of slow growth. One item that would be helpful to investment growth and that should be
politically feasible is to reform the corporate income tax. Capital is becoming increasingly
mobile across national borders, and taxes have large implications for the location of production
and jobs. Corporate tax reform is important because both American and foreign multinational
companies say that the high marginal income tax rate is discouraging investment in the United
States. However, it has been very difficult to coordinate a coherent response within the domestic
political arena, and tax competition is an issue of growing concern internationally.
The cause of the slow recovery, we have said, is slow growth of aggregate demand. There
has been disagreement with this view talking about structural or supply-side causes of the slow
growth, notably, the argument that workers lack the skill necessary for the jobs that are available.
Estimates have been made suggesting that upwards of 3 million jobs remain unfilled because of a
21
lack of skills or mismatch between jobs and workers. We hold to our view that aggregate
demand is the key problem, but at the same time there is undoubtedly a skills problem in the
workforce. There was a skills problem in 2000 and in 2007 and there is one today. If progress
could be made in training and educating the workforce, there is no question that this would be
helpful in returning the economy to full employment. Concerns about the education system are
as old as the country and it becomes a bit like complaining about the weather. However, there
are signs today of changes that could make a difference. Some states in the United States and
some countries in Europe (Finland is the favorite example, but Germany also) have made
substantial improvements in educational performance over periods of a few years. A sizable and
sustained effort to improve skills and education would be well worthwhile as part of a plan to
restore growth. Discouragingly, cuts in state and local spending have had an adverse impact on
education, something that needs to be reversed.
Since it is unlikely that residential construction will go back to its 2005 peak level and
since there are dangers in relying on a consumption boom to power the recovery, that leaves two
areas for private sector demand growth. The first is business investment and the second is
exports. On business investment, we mentioned corporate taxes as a factor and another one is
regulation. As we said earlier, we are not convinced there has been a major increase in the
regulatory burden, but there is certainly scope to streamline the complex federal and state
regulatory systems and also the procedures to allow foreign investment in the United States. The
Affordable Care Act is complex and greatly feared by the small business community, whether
justified or not. A clarification of the rules for ACA and an effort to reach out to companies to
help them deal with the law effectively would be helpful.
On exports, the value of the dollar is the biggest driver over the long term, but there may
be scope improve export readiness, or make domestic production more attractive. A recent study
by the McKinsey Global Institute pointed out that the United States is unique among major
advanced economies in running a trade deficit in the products they characterize as knowledge
intensive. Most high-wage countries run deficits in labor intensive goods like clothing and toys,
and also in raw materials like oil, but they generally run surpluses in goods higher up the value
chain. Why is the United States different (leaving aside the dollar issue)? The first answer is
that US companies are strong in the information technology and communications area, but this
does not translate into a trade surplus because these companies rely on overseas contract
22
manufacturing. Apple is an example of a very successful company that outsources its products.
The second answer is somewhat similar. The United State assembles a lot of automobiles on
shore, and in the past, most of the parts going into these cars were also made in the US. Butut
now there is a large trade deficit in auto parts. Partly, this is from moving parts suppliers to
Mexico, and partly, this is from German, Japanese and Korean companies bringing in parts from
their home countries. Changing this trade pattern is difficult, but changes in technology are
making production in the US more attractive. In the case of auto parts, the situation may
improve as foreign owned companies gradually build networks of suppliers in the United States,
as the Japanese have done. Issues such as worker skills and taxes are also relevant to making
domestic production more attractive.
23
References
Aramonte, Sirio, Samuel Rosen, and John W. Schindler. 2013. “Assessing and Combining Financial Conditions Indexes,” Divisions of Research & Statistics and Monetary Affairs Federal Reserve Board, Finance and Economics Discussion Series No. 2013-39.
Campbell, Jeffrey R., Charles L. Evans, Jonas D.M. Fisher and Alejandro Justiniano. 2012 “Macroeconomic Effects of FOMC Forward Guidance,” Brookings Papers on Economic Activity. Spring. 2012;1-54.
Congressional Budget Office (CBO). 2013. The Budget and Fiscal Outlook: Fiscal Years 2013 to 2023, Washington, D.C. (February).
D’Amico, Stefania, William English, David Lopez-Salido, and Edward Nelson, 2012, “The Federal Reserve’s Large-Scale Asset Purchase Programs: Rationale and Effects,” Working paper, Federal Reserve Board.
Duval�, Romain, Mehmet Eris� and Davide Furceri. 2010. “Labour Force Participation Hysteresis in Industrial Countries: Evidence and Causes,” OECD (Paris).
Dynan, Karen. 2012. “Is a Household Debt Overhang Holding Back Consumption?” Brookings Papers on Economic Activity, Spring: 299-344.
Harris, Benjamin, and Yuri Shadunsky. 2013. “State and Local Governments In Economic Recoveries: This Recovery Is Different,” Urban Brookings Tax Policy Center (April).
Hatzius, Jan, Peter Hooper, Frederic Mishkin, Kermit Schoenholtz, and Mark Watson. 2010. “Financial Conditions Indexes: A Fresh Look After the Financial Crisis," NBER Working Paper 16150.
Jacobson, Margaret, and Filippo Occhino. 2013. “Behind the Slowdown of Potential GDP,” Economic Trends, Federal Reserve Bank of Cleveland.
Krishnamurty, Arvind, and Annette Vissing-Jorgenson. 2011. “The Effects of Quantitative Easing on Interest Rates Channels and Implications for Policy,” Brookings Papers on Economic Activity,Fall;215-65.
_____. 2013. “The Ins and Outs of LSAPS,” paper presented at the Kansas City Federal Reserve Symposium at Jackson Hole (August 9).
Kliesen, Kevin, Michael Owyang, and E. Katarina Vermann, 2012, “Disentangling Diverse Measures: a Survey of Financial Stress Indexes," Federal Reserve Bank of St. Louis Review, 94(5): 369-397.
McKinsey Global Institute. 2011. Debt and deleveraging: The global credit bubble and its economic consequences (July).
24
McKinsey Global Institute, 2013. Game Changers: Five Opportunities for US Growth and Renewal (July)
Stock, James, and Mark Watson. 2012. “Disentangling the Channels of the 2007-09 Recession,” Brookings Papers on Economic Activity, Spring, 2012: 81-135.
Reinhart, Carmen M., and Kenneth S. Rogoff. 2009. "The Aftermath of Financial Crises," American
Economic Review, vol. 99(2): 466-72.
_____. 2011. “From Financial Crash to Debt Crisis,” American Economic Review, vol. 101(5): 1676–1706.
25
Figure 1. Actual and Potential GDP, 2004-2013.
trillions of 2009 dollars
Source: Congressional Budget Office, Bureau of Economic Analysis, and authors’ estimates. The estimate of potential GDP has been adjusted to reflect the July 2013 revisions to GDP and the change to a 2009 base year.
Figure 2. Civilian Employment to Population Ratio, Age 16 and Over
26
Source: quarterly seasonally adjusted data from the Bureau of Labor Statistics.
Table 1. Composition of the Gap Between Actual and Potential GDP Deviation from full employment shares, percent of potential GDP
Category Base Period Difference from Base Period 2006-2007 2009:2 2012:2 2013:2 Total GDP 100.0 -7.4 -5.3 -5.7
Personal Consumption 67.3 -4.1 -2.9 -2.9 Non-residential Investment 13.2 -3.9 -1.0 -1.0 Residential Investment 5.0 -2.5 -2.4 -2.0 Net Exports -5.1 2.7 2.4 2.3 Federal Gov't 7.3 0.6 0.2 -0.2 State and Local Gov't 12.4 -0.3 -1.7 -1.9
Source: computed by the authors. The base period values are the average shares of potential GDP in 2006 and 2007. The differences are the change in the share for the indicated period relative to the base period.
27
Figure 3. Indexes of Change Since Business Cycle Peaks, The Current Cycle Compared With the Average of Prior Cycles.
Source: National accounts and authors’ calculation. Each cyclical episode is based on the business cycle dating of the National Bureau of Economic Research and the quarterly values are indexed to the cycle peak.
28
Figure 4. Percent of Homeowners With Negative Home Equity; Q2, 2013
29
Figure 5. Housing Vacancy Rates, 1965-2013
Source: Department of Commerce, Total vacant housing units as a percent of total housing units
Figure 8. Percentage of Bank Respondents Reporting a Tightening of Loan Standards
Source: Federal Reserve Board. 2013. “Senior Loan Officer Opinion Survey on Bank Lending Practices,” available at http://www.federalreserve.gov/boarddocs/snloansurvey/
33
Figure 9. Federal Reserve Bank Assets by Major Category, 2007-2013 Billions of dollars
Source: Cleveland Federal Reserve. http://www.clevelandfed.org/research/data/credit_easing/index.cfm
34
Figure 10. Total Revenues and Outlays, 1980-2023 Percent of GDP
Source: Congressional Budget Office. Historical trend for outlays and revenues as a percent of GDP are computed as averages over the last four decades.
35
Figure 11. Composition of Federal Outlays, 1980—2023 Percent of GDP
Source: Congressional Budget Office. Expenditure shares are based on the old (pre-revision) levels of actual and projected GDP.
Figure 12. Labor Force Participation Rate, 2000-2013 Share of civilian population age 16 and over
Source: Bureau of Labor Statistics. Participation rates are held constant at 2000 (peak year of participation rate) values for 5-year age groups, and the total is reweighted by the age-specific population of each age group.