June 2017 az1740 The University of Arizona Cooperative Extension Nutrition Network’s Contribution to the Arizona Economy in 2014 Ashley Kerna, Dari Duval, Jeffrey Vautour, Linda Houtkooper, Vanessa A. Farrell, Lauren McCullough, Scoie Misner Introduction The Arizona Nutrition Network (AzNN) is a public/ private partnership engaged in a statewide effort to encourage healthy eating, increase physical activity, and achieve appropriate caloric balance for healthy body weights. The AzNN programmatic activities target people in low-income households that receive or are eligible to receive Supplemental Nutrition Assistance Program (SNAP) benefits. An integral partner in this statewide effort is the University of Arizona Cooperative Extension Nutrition Network (UANN), one of several local implementing agencies (LIAs) that conduct Supplemental Nutrition Assistance – Education (SNAP-Ed) programming throughout the state. The UANN receives funding from the AzNN to deliver nutrition and physical activity education programs to Arizona communities and implement policy, systems, and environmental approaches for obesity prevention. Purchases made to conduct this work generate a ripple of economic activity in the state, which support sales, incomes, and jobs in other Arizona industries. Economists call these multiplier effects. This analysis provides an estimate of the total economic contribution, including multiplier effects, from the UANN program implementation to the Arizona economy in fiscal year 2014. Previous analyses were conducted for fiscal years 2011 and 2012 (Kerna et al., 2015a and 2015b). The UANN is one of the principal LIAs acting as a service provider for AzNN programmatic activities and receiving competitive grant funds from the AzNN. In 2014, the UANN received approximately $5.6 million or 41% of all AzNN federally-awarded funds from the United States Department of Agriculture. Figure 1. The AzNN Funding Breakdown in Fiscal Year 2014 AzNN State Office $3.9 million 28% All Local Implementing Agencies $9.8 million 72% UANN $5.6 million 41% Other Local Implementing Agencies $4.2 million 31% Source: AzNN FFY2014 Financial Summary
Transcript
June 2017az1740
The University of Arizona Cooperative Extension Nutrition Network’s Contribution to the
Arizona Economy in 2014Ashley Kerna, Dari Duval, Jeffrey Vautour, Linda Houtkooper,
Vanessa A. Farrell, Lauren McCullough, Scottie Misner
IntroductionThe Arizona Nutrition Network (AzNN) is a public/
private partnership engaged in a statewide effort to encourage healthy eating, increase physical activity, and achieve appropriate caloric balance for healthy body weights. The AzNN programmatic activities target people in low-income households that receive or are eligible to receive Supplemental Nutrition Assistance Program (SNAP) benefits. An integral partner in this statewide effort is the University of Arizona Cooperative Extension Nutrition Network (UANN), one of several local implementing agencies (LIAs) that conduct Supplemental Nutrition Assistance – Education (SNAP-Ed) programming throughout the state. The UANN receives funding from the AzNN to deliver nutrition and physical activity education programs to Arizona communities and implement policy, systems, and environmental approaches for obesity prevention.
Purchases made to conduct this work generate a ripple of economic activity in the state, which support sales, incomes, and jobs in other Arizona industries. Economists call these multiplier effects. This analysis provides an estimate of the total economic contribution, including multiplier effects, from the UANN program implementation to the Arizona economy in fiscal year 2014. Previous analyses were conducted for fiscal years 2011 and 2012 (Kerna et al., 2015a and 2015b).
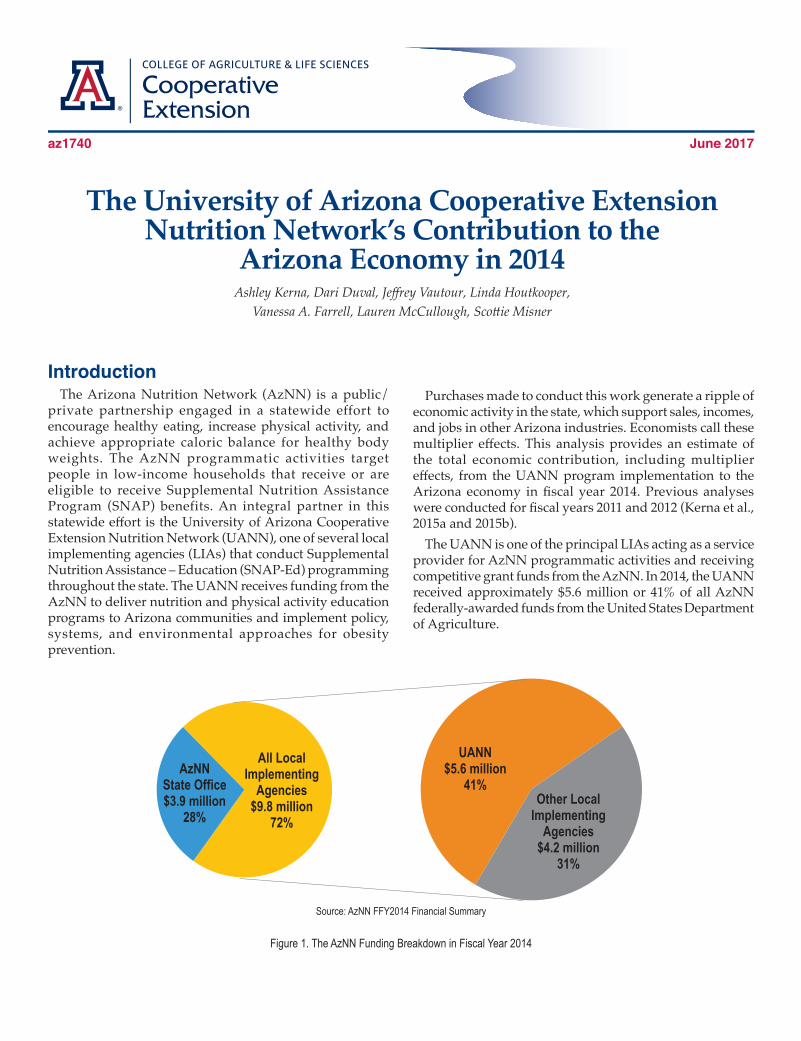
The UANN is one of the principal LIAs acting as a service provider for AzNN programmatic activities and receiving competitive grant funds from the AzNN. In 2014, the UANN received approximately $5.6 million or 41% of all AzNN federally-awarded funds from the United States Department of Agriculture.
Figure 1. The AzNN Funding Breakdown in Fiscal Year 2014
AzNNState Office$3.9 million
28%
All LocalImplementing
Agencies$9.8 million
72%
UANN$5.6 million
41%Other Local
ImplementingAgencies
$4.2 million31%
Source: AzNN FFY2014 Financial Summary
2 The University of Arizona Cooperative Extension
The UANN receives funding from AzNN to conduct outreach programs and to develop policy, systems, and environmental programs that promote healthy nutrition and physically active lifestyles in low-income households throughout the state. The funding received represents a sale of services from the UANN to the AzNN for SNAP-Ed program implementation. This initial sale is considered the direct effect of the UANN program implementation. The funding supports payroll and benefits for the UANN educators, program coordinators, and other staff, as well as an operating budget for program activities.
Purchases made by the UANN for program activities, when spent within state, generate additional rounds of economic activity. These are called indirect and induced multiplier effects. For example, when the UANN purchases educational materials and supplies from Arizona businesses, such as printed workbooks, the suppliers of those items must purchase inputs needed to produce those materials (in this example, paper and ink). The businesses that provide these inputs must also, in turn, source their inputs from other businesses, some of which are also from in-state. These business-to-business transactions are called indirect multiplier effects.
In addition to an increase in economic activity between businesses, there is also an increase in economic activity resulting from the UANN and the UANN-suppliers employing people in Arizona. Employees earn paychecks and spend their earnings to pay for rent, groceries, doctor visits, recreational activities, and many other goods and services. This stimulates economic activity in other Arizona
businesses and adds to state and local tax revenue. These household-to-business transactions are called induced multiplier effects.
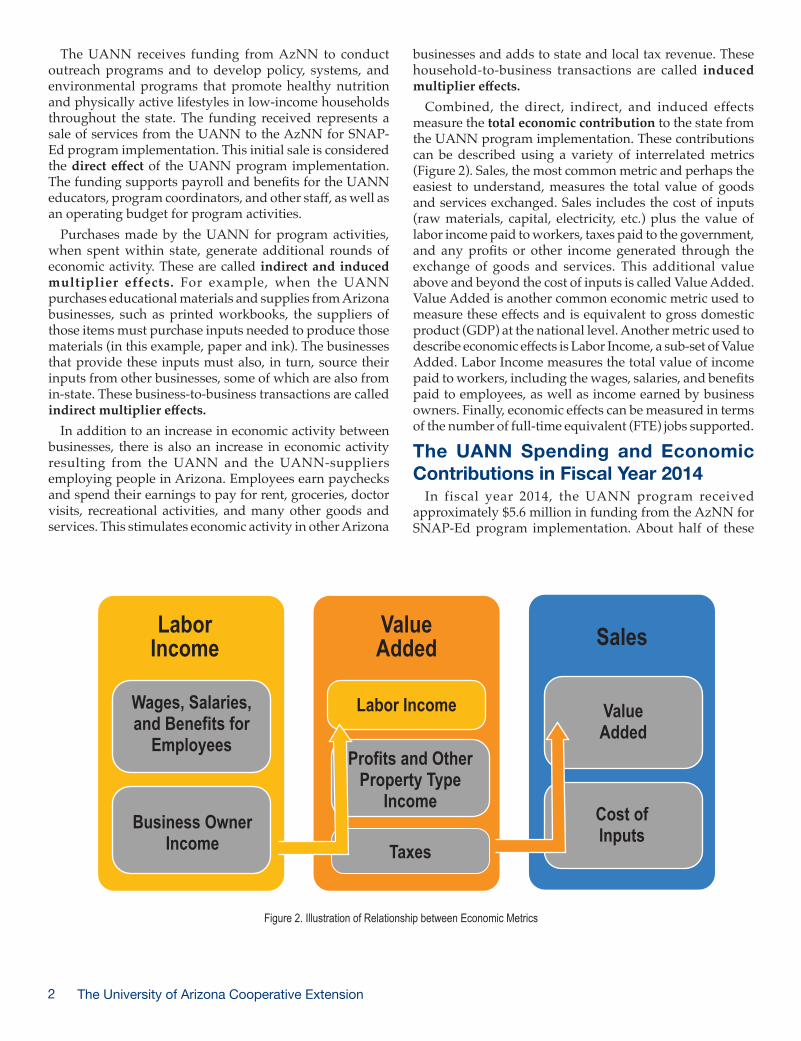
Combined, the direct, indirect, and induced effects measure the total economic contribution to the state from the UANN program implementation. These contributions can be described using a variety of interrelated metrics (Figure 2). Sales, the most common metric and perhaps the easiest to understand, measures the total value of goods and services exchanged. Sales includes the cost of inputs (raw materials, capital, electricity, etc.) plus the value of labor income paid to workers, taxes paid to the government, and any profits or other income generated through the exchange of goods and services. This additional value above and beyond the cost of inputs is called Value Added. Value Added is another common economic metric used to measure these effects and is equivalent to gross domestic product (GDP) at the national level. Another metric used to describe economic effects is Labor Income, a sub-set of Value Added. Labor Income measures the total value of income paid to workers, including the wages, salaries, and benefits paid to employees, as well as income earned by business owners. Finally, economic effects can be measured in terms of the number of full-time equivalent (FTE) jobs supported.
The UANN Spending and Economic Contributions in Fiscal Year 2014
In fiscal year 2014, the UANN program received approximately $5.6 million in funding from the AzNN for SNAP-Ed program implementation. About half of these
LaborIncome
Wages, Salaries, and Benefits for
Employees
Business OwnerIncome
ValueAdded
Labor Income
Profits and OtherProperty Type
Income
Taxes
Sales
ValueAdded
Cost ofInputs
Figure 2. Illustration of Relationship between Economic Metrics
3The University of Arizona Cooperative Extension
funds were used to support operational expenses for programmatic activities ($2.8 million) and the remainder supported educator, program coordinator, and other staff incomes ($2.8 million)1. These constitute the direct effects of the UANN program implementation in fiscal year 2014. Indirect and induced multiplier effects were then estimated using the UANN financial data and the IMPLAN Version 3.1 input-output modeling program. IMPLAN is a widely-used input-output data and modelling system that provides a detailed account of the Arizona economy and the relationships and linkages between industries. The software is used to estimate how economic activity in one industry affects economic activity in other industries through backward linkages with suppliers of inputs to production.
In order to capture indirect effects (the effects from business-to-business transactions), a customized UANN spending pattern was developed using actual expenditure data obtained from the UAccess Analytics and the UANN principal accountant.2 According to these data, in 2014 the UANN’s top three operational expense categories were for
1. Educational and promotional materials,2. Sub-contracts with other nutrition education service
kitchen supplies, and other operating supplies.Purchases of educational and promotional materials
accounted for the largest portion (55%) of operating expenses. Spending in this category, however, did not generate much additional economic activity in Arizona
because the majority of these materials were purchased from out-of-state vendors. Conversely, all expenditures for the second and third highest expenditure categories occurred within the state. Sub-contracts with other nutrition education service providers accounted for 11% of the UANN operational expenses. This group of expenditures reflected partnerships and sub-contracts with organizations, such as the Mariposa Community Health Center in Santa Cruz County and the Apache County Board of Supervisors, which were critical to ensuring that nutrition and physical activity education programs were available in rural areas of the state. Finally, the third highest expenditure category was for food demonstration ingredients, garden and kitchen supplies, and other operating supplies. These supplies accounted for approximately 5% of the UANN operating expenses and occurred within the state, generating additional economic activity for other Arizona businesses.
Induced effects (household-to-business transactions) were captured by applying the UANN payroll expenses ($2.8 million) to income earned by employees, and modeling the economic activity resulting from those employees spending their paychecks at other Arizona businesses.3 Industries affected by induced effects included real estate, retail food market, medical, and hospitality industries.
The total economic contributions of the UANN program implementation for fiscal year 2014 are presented in Table 1 below.
In fiscal year 2014, the UANN received $5.6 million infunding to spend for SNAP-Ed program implementation. Direct effects from this initial sale supported 64 full-time
3 Induced multiplier effects were modeled through a labor income change. 4 DirectFTEemploymentwasreportedbytheAzNNStateOffice.IndirectandinducedemploymenteffectswereestimatedusingtheIMPLANsoftwareandfull-time
equivalent (FTE) UANN employees earning $2.8 million in income. The IMPLAN model estimated that, through indirect and induced multiplier effects, the UANN program spending supported an additional 42 FTE jobs, $2.0 million in income, $3.2 million in value added, and $5.7 million in sales in other Arizona industries. Combining direct and multiplier effects, the total economic contribution of the UANN spending for program implementation in fiscal year 2014 was 106 FTE jobs, $4.8 million in income, $6.0 million in value added, and $11.3 million in total sales.
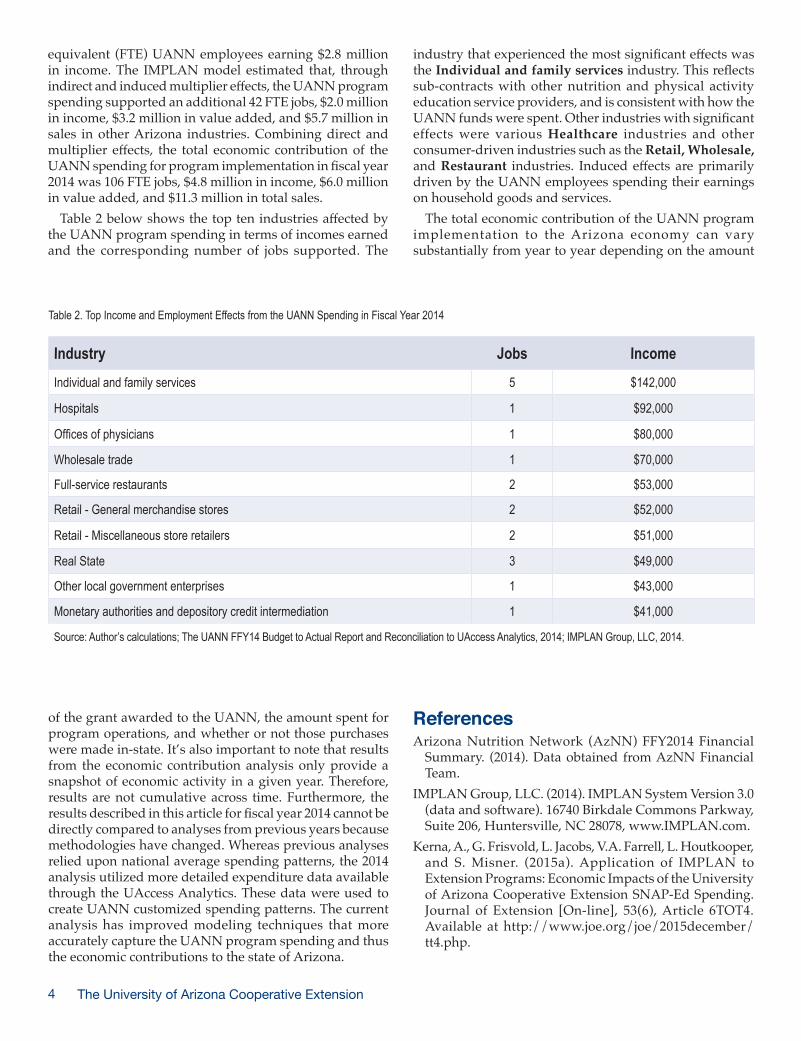
Table 2 below shows the top ten industries affected by the UANN program spending in terms of incomes earned and the corresponding number of jobs supported. The
industry that experienced the most significant effects was the Individual and family services industry. This reflects sub-contracts with other nutrition and physical activity education service providers, and is consistent with how the UANN funds were spent. Other industries with significant effects were various Healthcare industries and other consumer-driven industries such as the Retail, Wholesale, and Restaurant industries. Induced effects are primarily driven by the UANN employees spending their earnings on household goods and services.
The total economic contribution of the UANN program implementation to the Arizona economy can vary substantially from year to year depending on the amount
Industry Jobs IncomeIndividual and family services 5 $142,000
Hospitals 1 $92,000
Officesofphysicians 1 $80,000
Wholesale trade 1 $70,000
Full-servicerestaurants 2 $53,000
Retail-Generalmerchandisestores 2 $52,000
Retail-Miscellaneousstoreretailers 2 $51,000
Real State 3 $49,000
Other local government enterprises 1 $43,000
Monetary authorities and depository credit intermediation 1 $41,000
Table 2. Top Income and Employment Effects from the UANN Spending in Fiscal Year 2014
of the grant awarded to the UANN, the amount spent for program operations, and whether or not those purchases were made in-state. It’s also important to note that results from the economic contribution analysis only provide a snapshot of economic activity in a given year. Therefore, results are not cumulative across time. Furthermore, the results described in this article for fiscal year 2014 cannot be directly compared to analyses from previous years because methodologies have changed. Whereas previous analyses relied upon national average spending patterns, the 2014 analysis utilized more detailed expenditure data available through the UAccess Analytics. These data were used to create UANN customized spending patterns. The current analysis has improved modeling techniques that more accurately capture the UANN program spending and thus the economic contributions to the state of Arizona.
Summary. (2014). Data obtained from AzNN Financial Team.
IMPLAN Group, LLC. (2014). IMPLAN System Version 3.0 (data and software). 16740 Birkdale Commons Parkway, Suite 206, Huntersville, NC 28078, www.IMPLAN.com.
Kerna, A., G. Frisvold, L. Jacobs, V.A. Farrell, L. Houtkooper, and S. Misner. (2015a). Application of IMPLAN to Extension Programs: Economic Impacts of the University of Arizona Cooperative Extension SNAP-Ed Spending. Journal of Extension [On-line], 53(6), Article 6TOT4. Available at http://www.joe.org/joe/2015december/tt4.php.
5The University of Arizona Cooperative Extension
The UniversiTy of ArizonACollege of AgriCUlTUre And life sCienCesTUCson, ArizonA 85721Ashley KernAEconomic Impact Analyst
dAri dUvAlEconomic Impact Analyst
Jeffrey vAUToUrPrincipal Accountant, SNAP-Ed
lindA hoUTKooperExtension Specialist, Nutritional Sciences
vAnessA fArrellAssociate in Extension, Nutritional Sciences/SNAP-Ed
lAUren MCCUlloUghSenior Program Coordinator, SNAP-Ed
sCoTTie MisnerAssociate Specialist, UANN Principal Investigator
This information has been reviewed by University faculty.extension.arizona.edu/pubs/az1740-2017.pdf
Other titles from Arizona Cooperative Extension can be found at:extension.arizona.edu/pubs
Any products, services or organizations that are mentioned, shown or indirectly implied in this publication do not imply endorsement by The University of Arizona.
Issued in furtherance of Cooperative Extension work, acts of May 8 and June 30, 1914, in cooperation with the U.S. Department of Agriculture, Jeffrey C. Silvertooth, Associate Dean & Director, Extension & Economic Development, College of Agriculture Life Sciences, The University of Arizona.
The University of Arizona is an equal opportunity, affirmative action institution. The University does not discriminate on the basis of race, color, religion, sex, national origin, age, disability, veteran status, or sexual orientation in its programs and activities.
Kerna, A., G. Frisvold, L. Jacobs, V.A. Farrell, L. Houtkooper, and S. Misner. (2015b). The Economic Contribution of the University of Arizona Cooperative Extension Supplemental Nutrition Assistance Program Education (SNAP-Ed) Spending to the State of Arizona. University of Arizona College of Agriculture & Life Sciences Cooperative Extension az1662. Available at http://uacals.org/38u.
The UANN FFY14 Budget to Actual Report and Reconciliation to UAccess Analytics. (2014). Data obtained from the Accountant Principal for the University of Arizona Cooperative Extension Nutrition Network (UANN), Department of Nutritional Sciences, University of Arizona.