6
FOR REFERENCE ONLY The University of Sydney rhc &lartin Centre Founding Editor: Professor Emeritus H J Cowan June 2006 IsSN 0003 8628 www.arch.usyd.edu.au

FOR R E F E R E N C E ONLY
The University of Sydney
rhc &lartin Centre
Founding Editor: Professor Emeritus H J Cowan
June 2006 IsSN 0003 8628 www.arch.usyd.edu.au

ARCHITECTURAL SCIENCE REVIEW Volume 49, Number 2, June 2006
Contents
Editorial Gary T. Moore
iii
A Systematic Approach for Fire Safety Audits in Health-Care Facilities Mohammad A. Hassanain and Mohammed Saif
Acceptable Illumination Levels for Office Occupants K. W. Mui and L. T. Wong
Characteristics of the Environmental and Energy Behaviour of Contemporary Urban Buildings in Greece N. Papamanolis
Qualitative and Quantitative Evaluation of Energy Conversation Measures (ECM) Over Baseline as Given by ASHRAE Hatice Sozer and Mahjoub Elnirneiri
Lessons from Managing Design-Build Construction Projects in Hong Kong Edmond W. M. Lam, Albert P. C. Chan, and Daniel W. M. Chan
A Method for the Preservation and Restoration of the Stones Used in Historical Buildings S. Acun and N. Anoglu
Designing Concrete Precast External Wall Components on Multi Storey Steel Stuctures According to Modular Co-ordination
Ozlem Essiz and Ilkay Koman
Determination of Acceptable U-values for Naturally Ventilated Residential Building Faqades in Singapore N.H. Wong and S. Li
Comparison between Three Different Methods for Calculating Average Daylight Factor Values in Atrium Buildings Swinal Samant and Benachir Medjdoub
The Acoustical Performance Analysis of Bilkent Amphitheater: Proposal for Acoustical Renovation Ziihre Sii and Semiha Yhazer
Comfort Temperatures for Naturally Ventilated Buildings in Hong Kong V. Cheng and E. Ng
Relation Between Building Envelope and the Operational Period of Heating Systems Gulten Manioglu and Zerrin Y~lrnaz
Bamers to Applying the Design-build Procurement Method in Hong Kong Edmond W. M. Lam, Albert P. C. Chan, and Daniel W. M. Chan
What Principals of Firms say an Architect Needs to Know: International Comparisons Andrew D. Seidel, Gordon Holden, and Taner R. Ozdil
Book Reviews H. J. Cowan (Book Review Editor)

v -
Keywords Comfon Tempenture, Hong Kong, Natural ArchteCtulal Science Rmew venulauon,Venulated bu~d~ngs Volume 49 2, pp 179-182 8 2006 Unlversrty of Sydney All nghts resewed. www arch.usyd.edu au/asr
I
Comfort Temperatures for Naturally Ventilated Buildings in Hone Kone
V. Chengv and E. Ng* Received 27 April 2005; accepted 7 November 2005
The subtropical dimate of Hong Kong has resulted in asignificant amount of energy use for comfort cooling in summer.The situation is getting even worse because of the widespread use of household air-conditioners in high-rise residential buildings in the last two decades. To improve the situation, it is believed that thermal comfort has to be made an important agenda in building design. This paper discusses the adaptive model in thermal comfort, which has been included in the new revision of ASHRAE Standard 55-2004. Furthermore, it demonstrates the development of a comfort temperature chart for naturally ventilated buildings in Hong Kong. Based on the hdiigs of this study, indoor natural ventilation to airspeed of about 1.0 - 1.5 m/s would likely satisfy the thermal comfort requirements of 80% of occupants during the hot summer period in Hong Kong.
Introduction 2-.
Hong Kong is the most densely populated city in the world. Our cityscape is determined by the high-rise building blocks which are built very closely together with limited space in-between. The compact high- rise enclosures require an enormous amount of energy to nurture, and among all kind of energy end-uses, space cooling is the single largest
consuming item. [I z] Energy use for space conditioning in commercial sector remained at b o u t 50% of total energy consumption of the sector in the last twenty years, whereas cooling energyusedin residentialsector climbed steadily From about one-tenth of total energy consumption of
the sector in 1984 to about a quarter in 2001.[3] The excessive growth of energy use in residential sector was no doubt resulted from the widespread of household air-conditioners in the last two decades and the situation should not be overlooked. It is clear that thermal comfort has to be made an agenda in building design in Hong Kong, especially for high-rise residential buildings.
As thermal comfort is concerned, ASHRAE Standard 55-92: T h m l Envimmental ConditionsforHuman Occupancy is the most frequently cited guidelines in building industries around the world. According to Brager, the standard was origrdy limited to HVAC operation in build- ings with full climatic controls. However, in the absence of any credible alternative, it is applied universally across all building types, climates and
populations. [4 ] Nevertheless, evidences from field-studies of thermal comfort all over the world cast doubt upon the application of the standard to variable environment, and there is a growing controversy as to the influence of human adaptation in our understanding of environmental
perception. [5 ]
'Department of Architecture, The Chinese University of Hong Kong, Shal- ion, New Temtories Hong Kong; presently at Wolfson College, University of Cambridge, Cambridge CB3 9BB, UK t~orrespondence: [email protected]
The adaptive hypothesis, according to de Dear, predicts that contextual factors and past thermal history modii building occupants' thermal ex-
pectations and preferences. [b ] As to examine the adaptive hypothesis and its implications for Standard 55-92, an ASHRAE research project RP-884 on adaptive models of thermal comfort was established. The principal objective of RP-884 was to develop a variable temperature standard based on adaptive approach, which ultimately became the framework of the latest revision to Standard 55. The project assembled a quality-controlled database that contains approximately 21,000 sets of raw thermal comfort datafiom 160 buildingsaroundtheworld, these buildingsincludenaturally ventilated, mechanically controlled and mixed-mode operation. As to facilitate the use of these thermal comfort data for interested research- ers, the entire database has been put in the public domain and is readdy
available on the World Wide Web. [7]
Based on this comprehensive database, Brager and de Dear, the prin- cipal investigators of project RP-884, have developed an adaptive model of thermal comfort and preference for naturally ventilated buildings. [4 ] Figure 1 shows the proposed comfort temperature standard for buildings with natural ventilation. The chart is the regressions of indoor operative temperature based on mean outdoor air temperature. To use this stand- ard, engineers simply calculate the average of the mean minimum and maximum air temperatures for a given month, and then use the chart to determine the acceptable range of indoor operative temperatures.
Adhering to the aforementioned procedure with known outdoor temperature data, a comfort temperature chart, especially for Hong Kong, could be developed. Figure 2 shows thecomfort temperature chart developed. It can be seen from the chart that the comfort temperature of Hong Kong in summer would be up to about 3PC, whereas the lower temperature limit in winter would be about 20°C. Based on this comfort temperature range, one would predict that people generally feel com- fortable in summer whereas too cold in winter. However, this prediction contradicts to our daily experience that people would generally find the indoor too hot in summer whereas acceptable in winter. The discrepancy

180 Architectural Science Review Volume 49, Number 2, June 2006
41F 50F 59F 68F 77F 86F BF
o 5 10 15 20 25 30 35 40
Mean Momhty OvMoor Air Temperature ('C)
regression model between thermal sensations and average indoor air temperature. The neutral temperature is the solution of the linear equa- tion for a mean thermal sensation value of zero, i.e, neutral. The range of indexvalues corresponding with 80% "acceptable" thermal sensations is the distance between solutions of linear equation corresponding with thermal sensations of -0.85 (close to 'slightly cool') to +0.85 (close to 'slightly warm').
Results of Analysis
The Adaptative Model According to statistical analysis, the neutral indoor air temperatures of
all the selected buildings were calculated and were shown in Table 1. The results of RP-884 revealed that indoor neutrality in naturally ventilated
Figure I: Adaptive model fm naturally vm'lated buildings. lk buildings, in certain extent, depends on outdoor temperature. Analysis chart shows the relationship behueen ideal indoor t~mperature ~p-884 shown that the linear correlation between indoor operative
andoutdomtemPeraturq aounfifmallva?iatio~forexamplG temperature and mean outdoor effective temperature is about 0.65. [6] airspeed, clothing and metabolism measured in the field. ASHRAE
Journal, October, '2000, 0 American m e t y of Heat@ Refigerat- Based On the temperatures in and the
ing and Air-Conditioning Engineers, Inc., ~ . a s h r a e . o q . arithmetic average of daily minimum and maximum outdoor air tempera- ture provided by RP-884 database, a linear regression model between indoor neutral air temperature and average outdoor air temperature can
between the prediction and daily experience leads to a hypothesis that be constructed. Figure 3 shows the regression model developed. As can some of the comfort parameters, such as clothing insulation, metabolic be seen from the figure, there is a reasonably strong correlation for this rate, airspeed, and relative humidity, which were incorporated in the relationship, with correlation coefficient of about 0.72. Furthermore, the adaptive model may not appropriately reflect the context of Hong Kong, slope of the model suggested that indoor neutral air temperature would In order to use the adaptive model in Hong Kong, adjustments of comfort i I
parameters have to be addressed. This paper demonstrates the develop- Comfort Tamperz4ura for ~at- Vectilated Buildings m ~ a r g Kong I j
ment of a comfort temperature chart for naturally ventilated buildings in 1 Hong Kong, which was built on the framework of Brager and de Dear's i adaptive mode! and raw data of selected field survey in RP-884 database, 1 supplemented with desktop literature survey of local studies.
Methodology
Data Selection ......... ........... ........ ..............
In view of the characteristic hot and humid climate of Hong Kong, ' - Mm Ouodoor Tur@um~m -Men Ouldoor Temparahn
thermal comfort studies, whichconducted in n a t in summer period, were selected from RP-884 database for this analysis. * MM * *gg OcmM - kmbr
Yanhl I
There are over 7000 field observations from twenty-seven buildings that / 1 fulfilled the requirements. These buildings were comprised of thirteen Figure 2: Comfm temperature range naturally venti(aled build- locations including: Thailand, Singapore, Indonesia, Athens, Australian ings in Hang Kong based on and de Dear's hptive cities Brisbane and Melbourne, UK cities Merseyside and Oxford, Paki- model and meteom~giical hta oftheyears 1997-2003fim Hang stani cities Multan, Peshawar, Quettar and Saidu, and finally US city San Kong Observato?y. Francisco. The mean outdoor temperature of all the selected samples is 23.8 "C with standard deviation 25.2 "C, which are, indeed, very close to our meteorological record in 2002 [8] with mean annual outdoor temperature about 24.3 "C and srandard deviation 25.0 "C.
Statistical Analysis The method of statistical analysis was generally based on Brager and
de Dear's adaptive model as described thoroughly in ASHRAE RP-884
Final Report [9] with some modifications to suit our later application. In order to reduce the individual influence in the adaptive model, a particular building's observations were binning into half-degree TC) increments, and analysis working with the bins' mean response, instead of individual subjects. Neutral temperature, the ambient temperature Figure 3: Linear repsion model showing the correlation found by statistical analysis to most frequently coincide with thescomfort- between indoor neutral air temperature and average outdoor
able" rating in a thermal comfort study, was calculated by fining a linear air temperature
1 "
Cheng & Ng Comfort Temperatures for Namrally Ventilated Bulldings in Hong Kong 181 i
, .
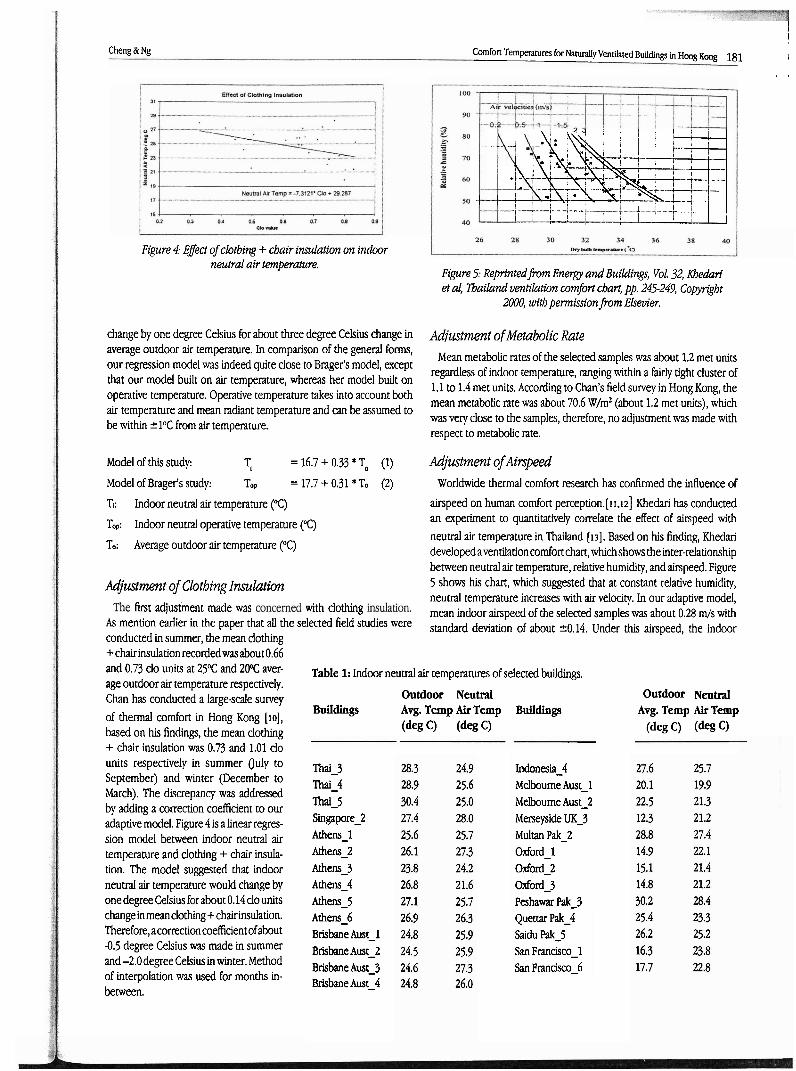
Figure 4: Effect of clothing + chair insulation on indoor neutral air temperature.
\ \>\\( iTl .. . - I . . L.... . . : > - : . . . ' --.i . . . . . . . .
. I * A X ' ..a. :--. . .
b : 1 i ...-- t:.- .i... .... i ...... i.- * -.-. ; . . ...... . . . i .. i 1 L.il:_
. .- . . ;. .- ...,......... . . . ,..a - ....... ..-; i C I . i / . ; ,. - - --L--. - -- . .- ....... 4 s ...- -..-: ......... 1 .llll.li i ............ i ........ ; . . j i i , : . : . . ; 1 - . - i i
Figure 5: Rep'ntedbm Energy and Buildings, Vol. 32, Khedari et al, l3ailand ventilation comfort chart, pp. 245-249, Copyright
2000, with permissionjbm Ek;mevler.
change by one degree Celsius for about three degree Celsius change in A d j u t m t ofMetabolic Rate average outdoor air temperature. In comparison of the general forms,
Mean metabolic rates of the selected samples was about 1.2 met units our regression model was indeed quite close to Brager's model, except that our model built on air temperature, whereas her model built on regardless of indoor temperature, ranging within a fairly tight cluster of
1.1 to 1.4 met units. According to Chan's field survey in Hong Kong, the operative temperature. Operative temperature takes into account both mean metabolic rate was about 70.6 W/m2 (about 1.2 met units), which air temperature and mean radiant temperature and can be assumed to was very close to the samples, therefore, no adjustment was made with be within 21°C from air temperature. respect to metabolic rate.
Model of this study: 'i = 16.7 + 0.33 * To (1) Adjustment of Airspeed
Model of Brager's study: Top = 17.7 + 0.31 * To (2) Worldwide thermal comfort research has confirmed the influence of
Ti: Indoor neutral air temperature ("9 airspeed on human comfort perception.[ii,~z] Khedari has conducted
Top: Indoor neutral operative temperature ("C) an experiment to quantitatively correlate the effect of airspeed with neutral air temperature in Thailand (131. Based on his finding, Khedari
To: Average outdoor air temperature ("C) developed aventilationcomfort chart, which shows the inter-relationship between neutral air temperature, relative humidity, and airspeed. Figure
Adjustment of Clothing Insulation 5 shows his chart, which suggested that at constant relative humidity, neutral temperature increases with air velocity. In our adaptive model,
first adjustment made was with dothing mean indoor airspeed of the selected samples was about 0.28 m/s with As mention earlier in the paper that all the selected field studies were standard deviation of about 20.14. Under this airspeed, the indoor conducted in summer, the mean clothing + chairinsulation recordedwasabout 0.66 and 0.73 units at 250C and aver- Table 1: Indoor neutral air temperatures of selected buildings. age outdoor air temperature respectively. Chan has conducted a large-scale survey Outdoor Neutral Outdoor Neutral
of thermal comfort in Hong Kong [lo], Buildings Avg. Temp Air Temp Buildings Avg. Temp Air Temp
based on his findings, the mean clothing (deg C) (deg C) (deg C) (deg C ) + chair insulation was 0.73 and 1.01 d o units respectively in summer auly to September) and winter (December to March). The discrepancy was addressed by adding a correction coefficient to our adaptive model. Figure 4 is a linearregres- sion model between indoor neutral air temperature and clothing + chair insula- tion. The model suggested that indoor neutral air temperature would change by one degree Celsius for about 0.14 d o units change in mean clothing + chairinsulation. Therefore, acomtion coefficient of about -0.5 degree Celsius was made in summer and-2.0degree Celsius in winter. Method of interpolation was used for months in- between.
Thai-3 Thai-4 Thai-5 Singapore-2 Athens-1 Athens2 Athens-3 Athens-4 Athens-5 Athens-6 Brisbane Aust-1 Brisbane Aust-2 Brisbane Aust-3 Brisbane Aust-4
Indonesia-4 Melbourne Aust-1 Melbourne Aust-2 Merseyside UK_3 Multan Pak-2 oxford-1 Oxford-2 Oxford-3 Pahawar Pak3 Quettar Pak-4 Saidu Pak_S San Francisco-1 San Francisco-6

182 Architectural Science Review Volume 49, Number 2, June 2006
c~mnolt.~anp.n~~ of ~ o t ~ w v d i ~ s d B ~ I ~ W in +long K- I airspeed, and relative humidity. Therefore, it has its own limitations. The 1 I adaptive model developed in this study is all we could obtain on the basis
_<-S==-=E. I
---2-
I 2 .. .-.++--z..r- .- - - ..... -.?-:. I of current available knowledge in the area. To improve the accuracy of
a r c h in thermal comfort in naturally ventilated buildings in Hong Kong is essential.
ctor air conditioning loads and electricity use in Hong Kong", GManugenzent, vol. 41, pp. 1757-1768,2000.
I . . . - I-". .b U .. - II - U L ~ * I O I - - 1 2 Lam JC, Li DHW. and Cheung So. "An analysis of electricity end-use in air-
-ammmrm - ~ l o l c r ~ ~ ~ ~ - ( ~ d m ~ w ~ ~ . B ~ ~ I - I conditioned office buildings in Hong Kong", Building and Environment, - - - 4 4 4 . . - - . ( . . r M M B r r l b l Y b l < C P I W . * 0 1 W - - ~ U l > r l ~ O l ( A I . . d p l . p l . ~
vol. 38, pp. 493498,2003. m-CYw-.~LI..O.z. '
3 Electrical and Mechanical Services Department. HongKong Energy End-we Figure 6: Comfort temperature chart for naturally ventilated buildings Dam (1991-ZOOI), Hong Kong Government, 2003.
in Hong Kong. 4 Brager GS and de Dear RJ. "A standard for natural ventilation", ASHRAE Journal, vol. 42, no. 10, pp. 21-28,2000.
maximum air temperature with 80% acceptability in naturally ventilated buildings was about 29.YC in hot summer. It is expected that the indoor neutral temperature can be raised by providing better ventilation, i.e. higher airspeed. The effect of airspeed is accounted for in our adaptive model by reproducing the air velocity- lines in figure 5 on our comfort temperature chart. Figure 6 is a comfort temperature chart for naturally ventilated buildings in Hong Kong, based on the aforementioned analysis and all adjustments.
Conclusion Based on the comfort temperature chart (Figure 6), under an airspeed
of about 0.3m/s, one would expected that people wiU find the indoor too hot in summer whereas acceptable in winter. However, when airspeed is increased to about 1 m/s, the upper comfort temperature limit increased by about one degree Celsius and the comfort range just cover the maxi- mum outdoor air temperature in hot summer. When airspeed isincreased to about 1.5 m/s, the upper comfort temperature limit further moved up 1.5 degrees to about 33.5 degree Celsius and the predicted comfort range far above the maximum outdoor air temperature. The result of this study suggested that indoor natural ventilation to airspeed of about 1.0 - 1.5 m/s would likely satisfy the thermal comfort requirement of 80%
Humphreys MA. "Field studies and dimate chamber experiments in thermal comfon research", Procedure o~ennalcomfotl:past, present andfuture, Building Research Establishment, Garston, June 1993, pp. 52-72.
deDear RJand Brager GS. "Developing an adaptivemodelofthermal comfort and preference",ASHRAETechnicalDaka Bulletin: F i e l d s t u d i e s o ~ l Comfm and Aahptation, pp. 2749.
de Dear RJ. "Aglobal databaseof thermalcomfort fieldexperiments",ASHRAE TechnicaloataBulletin: F i e l d S t u d i e s o ~ l Co@ortandAdaptatia, pp. 15-25.
8 International Daylight Measuring Station, Depment of Architecture, ?he ChineseUniversityofHongKong.Dayl~htandMeteomlogicalRecord2~ unpublished, 2002.
9 de Dear RJ, Brager G and Cooper D. PSHRAE RPW Final Reporr: Develop ing an adaptive model of t h d comfort andpreference. Sydney: MRL.
10 de Dear et al. 1997. cited by A. Femandez-Gonzdez, Center for Energy Research/Education/Se~ces at Ball State University, Indiana.
11 ChanDW,BurnettJ, de Dear RJandSCHNg. "Alargescalesurveyofthemal comfort in office premises in Hong Kong", AWRAE Transactions, 104 (I), pp. 76-84.
12 Fountain ME and Arens EA. "Air movement and thermal comfort", ASHRAE Jouml, 1193, pp. 26-30.
of occupants under hot summer period in Hong KO&. 13 Tanabe S and Kimura K "Importance of au movement for thermal comfort under hot and humidconditions",~RAEF.E CmJonAC. inbotclimutes,
The adaptive model developed in this study was based on selected o b 1989, pp. 95-103. servations from ASHRAE project RP-884 database. Although the samples
14 Khedari J, Yarnmpat N, Pratintong N and Hirunlabh J. 'Thailand ventilation indude twenty-seven buildings from h e e n ~ocatons, only a limited comfon ch m.., Ernad Building, vol 32, 245.249, 2m,
number of them have the characteristic hot and humid climate like Hong Kong. Furthermore, the model was built on a number of presumed values of comfort parameters, such as clothing insulation, metabolism,


