57


The University of Texas at Tyler
Fact Book
2003-04
Prepared by the Office of Planning and Institutional Research

Table of Contents
IntroductionVision and Mission StatementsAccreditationAdministrative StructureUniversity Performance MeasuresAuthorized Degree Programs
Student InformationTotal Fall HeadcountFull Time EquivalentsGender—All StudentsGender—Undergraduate StudentsGender—Master's StudentsEthnicity—All StudentsEthnicity—Undergraduate StudentsEthnicity—Master's StudentsAge—All StudentsAge—Undergraduate StudentsAge—Master’s StudentsEnrollment by Geographic Source—All StudentsEnrollment by State of Residence—All StudentsEnrollment from Counties in East Texas Planning Region
Enrollment by CollegeUndergraduate Enrollment by College of Declared Major
College of Arts and SciencesCollege of Business and TechnologyCollege of Education and PsychologyCollege of Engineering and Computer ScienceCollege of Nursing and Health Sciences
The University of Texas at Tyler2003-04 Fact Book

Table of Contents
Master's Enrollment by College of Declared MajorCollege of Arts and SciencesCollege of Business and TechnologyCollege of Education and PsychologyCollege of Engineering and Computer ScienceCollege of Nursing and Health Sciences
Degrees Degrees Awarded by LevelDegrees Awarded by GenderUndergraduate Degrees Awarded by GenderMaster's Degrees Awarded by GenderDegrees Awarded by EthnicityUndergraduate Degrees Awarded by EthnicityMaster's Degrees Awarded by EthnicityDegrees AwardedBachelor's Degrees Awarded by DepartmentMaster's Degrees Awarded by DepartmentDegrees Awarded by Major within College
College of Arts and Sciences Degrees by MajorCollege of Business and Technology Degrees by MajorCollege of Education and Psychology Degrees by MajorCollege of Engineering and Computer Science Degrees by MajorCollege of Nursing and Health Sciences Degrees by Major
The University of Texas at Tyler2003-04 Fact Book

Table of Contents
Semester Credit HoursSemester Credit Hour History by CollegeSemester Credit Hours by CollegeSemester Credit Hour History Undergraduate and Graduate
FacultyTotal Faculty Headcount by TenureTotal Faculty Headcount by RankTotal Faculty Headcount by GenderTenured Faculty Headcount by GenderTenured Faculty Headcount by RankAverage Age of Tenured Faculty by GenderAverage Age of Tenured Faculty by RankTenure Track Faculty Headcount by GenderTenure Track Faculty Headcount by RankAverage Age of Tenure Track Faculty by GenderAverage Age of Tenure Track Faculty by Rank
DefinitionsDefinitions of terms and performance measures
The University of Texas at Tyler2003-04 Fact Book

Millennium Vision
Mission Statement
The University is committed to providing a setting for free inquiry and expects excellence in the teaching, research, artistic performances and professional public service provided by its faculty, staff, and students. As a community of scholars, the University develops the individual’s critical thinking skills, appreciation of the arts, humanities and sciences, international understanding for participation in the global society, professional knowledge and skills to enhance economic productivity, and commitment to lifelong learning.
The University of Texas at Tyler is a comprehensive, coeducational institution of higher education offering undergraduate and graduate degree programs as a component of the renowned University of Texas System. The University of Texas at Tyler’s vision is to be nationally recognized for its high quality education in the professions and in the humanities, arts and sciences, and for its distinctive core curriculum. Guided by an outstanding and supportive faculty, its graduates will understand and appreciate human diversity and the global nature of the new millennium. They will think critically, act with honesty and integrity, and demonstrate proficiency in leadership, communication skills, and the use of technology.
U.T. Tyler will be nationally recognized for its excellent programs in the professions and in the humanities, arts, and sciences. Guided by an outstanding and supportive faculty, its graduates will be known for the quality of their knowledge and for their integrity, leadership ability, communication skills, technological competence and global awareness.
Within an environment of academic freedom, students learn from faculty scholars who have nationally recognized expertise in the arts and sciences, and in such professions as engineering, public administration, education, business, health sciences, and technology. The faculty engages in research and creative activity, both to develop and maintain their own scholarly expertise and to extend human knowledge. The results of that research and other creative efforts are made available to students in the classroom and to the general public through publication and public service activities. The institution also seeks to serve individuals who desire to enhance their professional development, broaden their perspectives, or enrich their lives.
The University of Texas at Tyler2003-04 Fact Book

Accreditations
The University of Texas at Tyler is accredited by the following:
AACSB The Association to Advance Collegiate Schools of Business
BNE Board of Nurse Examiners for the State of Texas
CoC SACS Commission on Colleges of the Southern Association of Colleges and Schools (1866 Southern Lane, Decatur, GA 30033, Telephone 404-679-4501)
to award bachelor’s and master’s degrees.
NAIT National Association of Industrial Technology
NLNAC National League for Nursing Accreditation Council
SBEC Texas State Board for Educator Certification
ABET Accreditation Board for Engineering and Technology
Board of Nurse Examiners
The University of Texas at Tyler2003-04 Fact Book

Administrative Structure
June 2003
PresidentExecutive Assistant
to the President
Business Affairs
UniversityAdvancement
Academic Affairs
Student Affairs &External Relations
Athletics
EnrollmentManagement:
· Admissions · Financial Aid · Registrar · Student Recruitment
News & PublicInformation
Student Activities
StudentDevelopment &
Retention
Student Services: · Counseling · Testing · Disability Services
University Police
Colleges: · Arts & Sciences
· Business & Technology · Education & Psychology · Engineering
& Computer Science · Nursing & Health Sciences
Graduate Studies
Library
LongviewUniversity
Center
Palestine Campus
Alumni Relations
Annual Fund
Corporate &FoundationRelations
DevelopmentBoard:
· UT Tyler · Longview University Center · Palestine Campus
Fund Raising &Stewardship
Planned(Deferred) Giving
Special Events
FinancialServices
HumanResources
InstitutionalCompliance
Physical Plant
Cowan Center
EnvironmentalHealth & Safety
Audit Services
Accountability &InformationTechnology
CampusComputingServices
InformationSystems &
Communications
Planning &Institutional
Research
Career Services
AuxiliaryEnterprises:
· Bookstore · Copy Center · Dining · Vending
BudgetEducationalTechnologyServices:
· Audio-Visual Services · Interactive Video Network
The University of Texas at Tyler
The University of Texas at Tyler2003-04 Fact Book

University Performance Measures
Measure 97-98 98-99 99-00 00-01 01-02 02-03 03-04
State Licensure Exam Pass Rate of Engineering Graduates
N/A N/A 100.0 100.0 100.0 100.0 100.0
State Licensure Exam Pass Rate of Nursing Graduates
99.0 100.0 98.5 95.3 80* 85.0 93.0
Pass Rate of State Education ExCET Exam 91.0 82.0 86.0 88.0 82.3 73.7 81.4
Percent of Semester Credit Hour Courses Completed
91.0 91.0 92.0 93.0 92.0 92.0 92.0
Percent of First-time, Degree-seeking Freshmen Who Earn a Baccalaureate Degree Within Six Academic Years**
N/A N/A N/A N/A N/A N/A N/A
Retention Rate of First-time, Full-time, Degree-seeking Freshmen Students After One Academic Year
N/A N/A 61.0 67.0 60.0 59.0 56.0
Retention Rate of First-time, Full-time, Degree-seeking (White; Black; Hispanic; Other) Freshmen Students After One Academic Year
N/A N/A W = 60.0 H = 60.0 B = 71.0 O = 0.0
W = 69.0 H = 100.0
B = 67.0 O = 0.0
W = 58.0 H = 40.0 B = 89.0 O =71.0
W = 60.0 H = 42.0 B = 57.0 O = 67.0
W = 54.0 H = 62.0 B = 74.0 O = 62.0
Retention Rate of TASP Students Requiring Remediation Education After One Academic Year
N/A N/A N/A N/A N/A N/A N/A
**The University of Treporting period of September, 2003.
OUTCOME MEASURES—Indicators Of Actual Impact Or Results
Source: LBB Performance Measure data (ABEST)
*Audit 2002 corrected value
The Univeristy of Texas at Tyler2003-04 Fact Book

University Performance Measures
Measure 97-98 98-99 99-00 00-01 01-02 02-03 03-04
Dollar Amount of External or Sponsored Research Funds (in millions)
0.216 0.0614 0.0713 0.111 0.120 0.140 0.270
External or Sponsored Research Funds as a Percent of State Appropriations
0.001318 3.5 0.477 0.51 0.57 0.53 1.2
Percent of Lower Division Courses Taught by Tenured or Tenure-Track Faculty
N/A 48.0 49.0 61.6 65.0 61.0 64.0
Percent of Full-time, Degree-seeking Transfer Students Who Earn a Baccalaureate Degree Within Four Years (Upper-level Institutions Only)
N/A 65.2 63.1 65.0 64.0 63.0 65.0
Percent of Full-Time, Degree-seeking (White; Black; Hispanic; Other) Transfer Students Who Earn a Baccalaureate Degree Within Four Academic Years (Upper level institutions only)
W = 70.0 H = 50.0 B = 50.0 O = 45.0
W = 68.0 H = 58.3 B = 55.6 O = 40.0
W = 68.0 H = 60.0 B = 45.0 O = 75.0
W = 66.0 H = 60.0 B = 50.0 O = 70.0
W = 65.0 H = 57.0 B = 55.0 O = 77.0
W = 64.0 H = 54.0 B = 55.0 O = 69.0
W = 65.0 H = 73.0 B = 60.0 O = 79.0
Retention Rate of Full-time, Degree-seeking Transfer Students After One Academic Year (Upper level institutions only)
N/A 69.7 74.0 74.0 72.0 74.0 74.0
Retention Rate of Full-time, Degree-seeking (White; Black; Hispanic; Other) Transfer Students After One Academic Year (Upper level institutions only)
W = 63.0 H = 80.0 B = 80.0 O = 54.0
W = 69.2 H = 70.0 B = 80.0 O = 71.4
W = 74.0 H = 80.0 B = 64.0 O = 92.0
W = 75.0 H = 78.0 B = 74.0 O = 63.0
W = 72.0 H = 58.0 B = 82.0 O = 73.0
W = 76.0 H = 57.0 B = 59.0 O = 89.0
W = 78.0 H = 82.0 B = 66.0 O = 81.0
Percent of Baccalaureate Graduates Who are First Generation College Graduates
N/A N/A 36.3 41.0 41.0 47.0 32.0
Amount Expended for Administrative Costs as a Percent of Operating Budget
N/A 14.85 16.93 17.93 12.55 14.31 15.7
Source: LBB Performance Measure data (ABEST)
OUTCOME MEASURES—Indicators Of Actual Impact Or Results
The Univeristy of Texas at Tyler2003-04 Fact Book
University Performance Measures
Measure 97-98 98-99 99-00 00-01 01-02 02-03 03-04
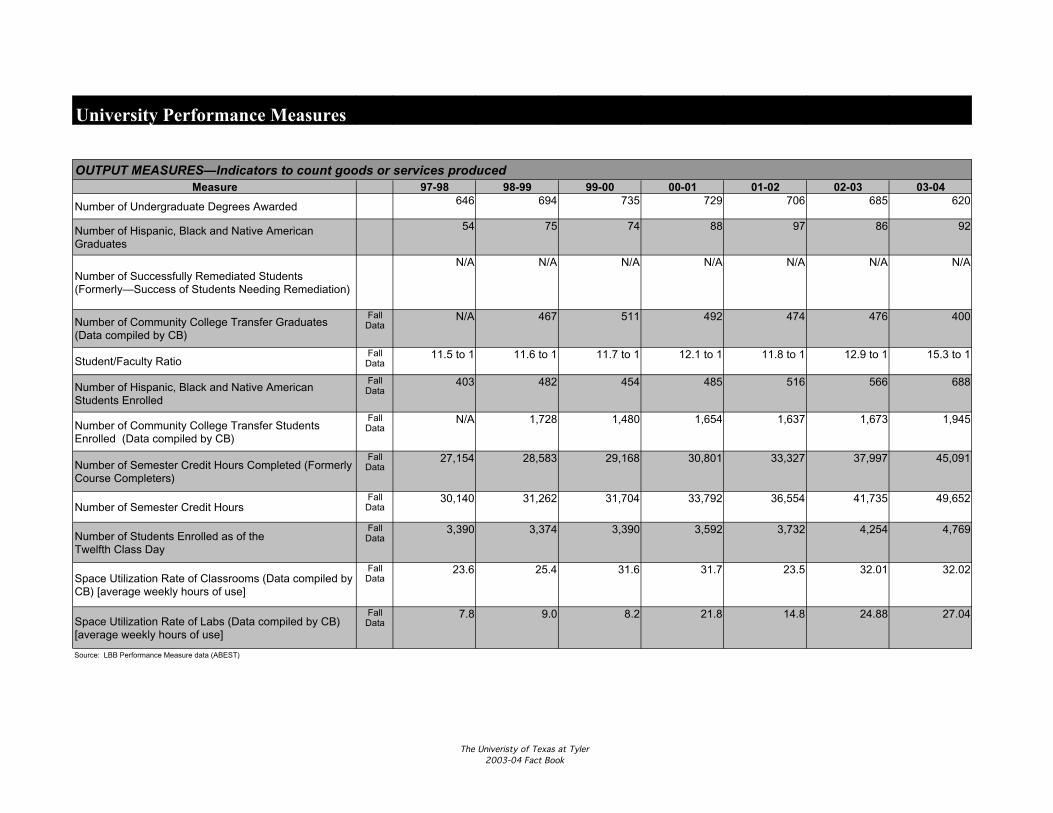
Number of Undergraduate Degrees Awarded 646 694 735 729 706 685 620
Number of Hispanic, Black and Native American Graduates
54 75 74 88 97 86 92
Number of Successfully Remediated Students (Formerly—Success of Students Needing Remediation)
N/A N/A N/A N/A N/A N/A N/A
Number of Community College Transfer Graduates (Data compiled by CB)
Fall Data
N/A 467 511 492 474 476 400
Student/Faculty RatioFall Data
11.5 to 1 11.6 to 1 11.7 to 1 12.1 to 1 11.8 to 1 12.9 to 1 15.3 to 1
Number of Hispanic, Black and Native American Students Enrolled
Fall Data
403 482 454 485 516 566 688
Number of Community College Transfer Students Enrolled (Data compiled by CB)
Fall Data
N/A 1,728 1,480 1,654 1,637 1,673 1,945
Number of Semester Credit Hours Completed (Formerly Course Completers)
Fall Data
27,154 28,583 29,168 30,801 33,327 37,997 45,091
Number of Semester Credit HoursFall Data
30,140 31,262 31,704 33,792 36,554 41,735 49,652
Number of Students Enrolled as of the Twelfth Class Day
Fall Data
3,390 3,374 3,390 3,592 3,732 4,254 4,769
Space Utilization Rate of Classrooms (Data compiled by CB) [average weekly hours of use]
Fall Data
23.6 25.4 31.6 31.7 23.5 32.01 32.02
Space Utilization Rate of Labs (Data compiled by CB) [average weekly hours of use]
Fall Data
7.8 9.0 8.2 21.8 14.8 24.88 27.04
Source: LBB Performance Measure data (ABEST)
OUTPUT MEASURES—Indicators to count goods or services produced
The Univeristy of Texas at Tyler2003-04 Fact Book

Authorized Degree Programs
College/Degree Program
24 11
Art B.A. B.F.A. M.F.A.
Biology B.S. M.S.
Chemistry B.S.
Criminal Justice B.S. M.S.
Economics B.A. B.S.
English B.A. M.A.
General Studies B.G.S.
History B.A. B.S. M.A.
Interdisciplinary Studies M.A. M.S.
Journalism B.A. B.S.
Mathematics B.S. M.S.
Music B.M. B.A.
Political Science B.A. B.S. M.A.
Public Administration M.P.A.
Spanish B.A.
Speech Communication B.A. B.S.
Sociology B.A. B.S. M.S.
Theatre B.A.
8 2
Accounting B.B.A.
Business Administration B.B.A. M.B.A.
Finance B.B.A.
Management B.B.A.
Marketing B.B.A.
Applied Arts and Sciences B.A.A.S.
Technology B.S. M.S.
Training and Development B.S.
Bachelor's Level Degrees
Master's Level Degrees
College of Business and Technology
College of Arts and Sciences
The University of Texas at Tyler2003-04 Fact Book

Authorized Degree Programs
3 12
Curriculum and Instruction M.A.T. M.Ed.
Early Childhood Education M.A. M.Ed.
Interdisciplinary Studies B.S.
Clinical Psychology M.S.
Counseling Psychology M.A.
Psychology B.A. B.S.
School Counseling M.A.
Educational Administration M.Ed.
Reading M.A. M.Ed.
Special Education M.A. M.Ed.
4 2
Engineering M.E.
Electrical Engineering B.S.E.E.
Mechanical Engineering B.S.M.E.
Computer Information Systems B.S.
Computer Science B.S. M.S.
5 4
Nursing B.S.N. M.S.N.
Health and Kinesiology B.A. M.Ed.
Kinesiology B.S. M.S.
Clinical Exercise Physiology M.S.
Health Professions B.S.
Medical Technology B.S.44 31
Source: THECB Program Inventory & UTT 2002-2004 Catalog Total Degree Programs Offered
College of Nursing and Health Sciences
College of Education and Psychology
College of Engineering and Computer Science
The University of Texas at Tyler2003-04 Fact Book

Student Information(Fall Semesters 1999-2003)
EnrollmentTotal Fall Headcount
N % N % N % N % N %
Freshman 104 3.1% 245 6.8% 365 9.8% 478 11.2% 673 14.1%Sophomore 60 1.8% 46 1.3% 56 1.5% 393 9.2% 753 15.8%Junior 1,154 34.0% 1,896 52.8% 1,422 38.1% 1,312 30.8% 1,121 23.5%Senior 870 25.7% 416 11.6% 846 22.7% 858 20.2% 1,057 22.2%Post Baccalaureate 615 18.1% 289 8.0% 315 8.4% 368 8.7% 318 6.7%Master's 587 17.3% 700 19.5% 728 19.5% 845 19.9% 847 17.8%
Total Fall Headcount 3,390 3,592 3,732 4,254 4,769
2002 20031999 2000 2001
Source: CBM001 data
Fall 2003 Headcount
Freshman14.1%
Sophomore15.8%
Senior22.2%
Post Baccalaureate
6.7%
Junior23.5%
Master's17.8%
The University of Texas at Tyler2003-04 Fact Book
Student Information(Fall Semesters 1999-2003)
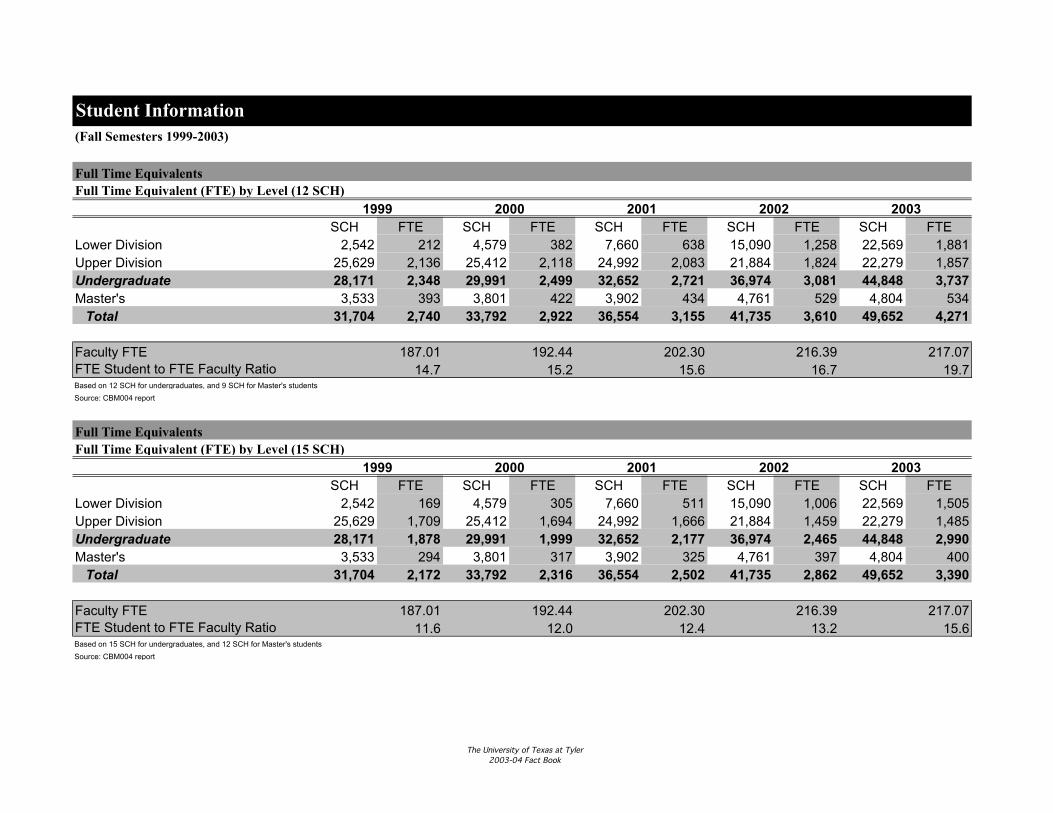
Full Time Equivalents
SCH FTE SCH FTE SCH FTE SCH FTE SCH FTELower Division 2,542 212 4,579 382 7,660 638 15,090 1,258 22,569 1,881Upper Division 25,629 2,136 25,412 2,118 24,992 2,083 21,884 1,824 22,279 1,857Undergraduate 28,171 2,348 29,991 2,499 32,652 2,721 36,974 3,081 44,848 3,737Master's 3,533 393 3,801 422 3,902 434 4,761 529 4,804 534
Total 31,704 2,740 33,792 2,922 36,554 3,155 41,735 3,610 49,652 4,271
Faculty FTE 187.01 192.44 202.30 216.39 217.07FTE Student to FTE Faculty Ratio 14.7 15.2 15.6 16.7 19.7
Full Time Equivalents
SCH FTE SCH FTE SCH FTE SCH FTE SCH FTELower Division 2,542 169 4,579 305 7,660 511 15,090 1,006 22,569 1,505Upper Division 25,629 1,709 25,412 1,694 24,992 1,666 21,884 1,459 22,279 1,485Undergraduate 28,171 1,878 29,991 1,999 32,652 2,177 36,974 2,465 44,848 2,990Master's 3,533 294 3,801 317 3,902 325 4,761 397 4,804 400
Total 31,704 2,172 33,792 2,316 36,554 2,502 41,735 2,862 49,652 3,390
Faculty FTE 187.01 192.44 202.30 216.39 217.07FTE Student to FTE Faculty Ratio 11.6 12.0 12.4 13.2 15.6
Source: CBM004 report
2001
Based on 12 SCH for undergraduates, and 9 SCH for Master's students
Source: CBM004 report
Full Time Equivalent (FTE) by Level (15 SCH)
2002Full Time Equivalent (FTE) by Level (12 SCH)
Based on 15 SCH for undergraduates, and 12 SCH for Master's students
2003
20031999 2000 2002
1999 2000 2001
The University of Texas at Tyler2003-04 Fact Book

Student Information(Fall Semesters 1999-2003)
EnrollmentGender - All Students
N % N % N % N % N %
Male 1,132 33.4% 1,226 34.1% 1,281 34.3% 1,563 36.7% 1,810 38.0%Female 2,258 66.6% 2,366 65.9% 2,451 65.7% 2,691 63.3% 2,959 62.0%
Total 3,390 3,592 3,732 4,254 4,769Source: CBM001 data
2002 20031999 2000 2001
Fall 2003 Enrollment
Female62.0%
Male38.0%
The University of Texas at Tyler2003-04 Fact Book

Student Information(Fall Semesters 1999-2003)
EnrollmentGender - Undergraduate Students (includes postbaccalaureate)
N % N % N % N % N %
Male 926 33.0% 963 33.3% 1,029 34.3% 1,269 37.2% 1,516 38.7%Female 1,877 67.0% 1,929 66.7% 1,975 65.7% 2,140 62.8% 2,406 61.3%
Total 2,803 2,892 3,004 3,409 3,922
Gender - Master's Students
N % N % N % N % N %
Male 206 35.1% 263 37.6% 252 34.6% 294 34.8% 294 34.7%Female 381 64.9% 437 62.4% 476 65.4% 551 65.2% 553 65.3%
Total 587 700 728 845 847Source: CBM001 data
2002
1999 2000 2001 2002
1999 2000 2001 2003
2003
0.0%
10.0%
20.0%
30.0%
40.0%
50.0%
60.0%
70.0%
Undergraduate Male
Undergraduate Female Graduate Male Graduate Female
Fall 2003 Gender
The University of Texas at Tyler2003-04 Fact Book

Student Information(Fall Semesters 1999-2003)
EnrollmentEthnicity-All Students
N % N % N % N % N %
White/Non-Hispanic 2,866 84.5% 3,031 84.4% 3,121 83.6% 3,527 82.9% 3,872 81.3%Black/Non-Hispanic 315 9.3% 332 9.2% 338 9.1% 364 8.6% 442 9.3%Hispanic 98 2.9% 118 3.3% 138 3.7% 167 3.9% 221 4.6%Asian or Pacific Islander 38 1.1% 41 1.1% 45 1.2% 64 1.5% 64 1.3%American Indian or Alaskan Native 41 1.2% 35 1.0% 40 1.1% 35 0.8% 25 0.5%Non-Resident Aliens or Foreign Natl 32 0.9% 35 1.0% 44 1.2% 61 1.4% 72 1.5%Not Reported 0 0.0% 0 0.0% 6 0.2% 36 0.8% 73 1.5%
Total 3,390 3,592 3,732 4,254 4,769Source: CBM001 data
20021999 2000 2001 2003
Fall 2003 Ethnic Origin
1.3%
1.5%
1.5%
0.5%
81.3%
9.3%
4.6%
18.7%
White/Non-Hispanic Black/Non-Hispanic Hispanic
Asian or Pacific Islander American Indian or Alaskan Native Non-Resident Aliens or Foreign Natl
Not Reported
The University of Texas at Tyler2003-04 Fact Book

Student Information(Fall Semesters 1999-2003)
EnrollmentEthnicity - Undergraduate Students (includes postbaccalaureate)
N % N % N % N % N %
White/Non-Hispanic 2,373 84.7% 2,452 84.8% 2,530 84.2% 2,834 83.1% 3,168 80.8%Black/Non-Hispanic 262 9.3% 264 9.1% 268 8.9% 290 8.5% 372 9.5%Hispanic 79 2.8% 95 3.3% 109 3.6% 137 4.0% 189 4.8%Asian or Pacific Islander 33 1.2% 28 1.0% 31 1.0% 49 1.4% 50 1.3%American Indian or Alaskan Native 35 1.2% 32 1.1% 33 1.1% 27 0.8% 24 0.6%Non-Resident Aliens or Foreign Natl 21 0.7% 21 0.7% 28 0.9% 47 1.4% 62 1.6%Not Reported 0 0.0% 0 0.0% 5 0.2% 25 0.7% 57 1.5%
Total 2,803 2,892 3,004 3,409 3,922
Ethnicity - Master's Students
N % N % N % N % N %
White/Non-Hispanic 493 84.0% 579 82.7% 591 81.2% 693 82.0% 704 83.1%Black/Non-Hispanic 53 9.0% 68 9.7% 70 9.6% 74 8.8% 70 8.3%Hispanic 19 3.2% 23 3.3% 29 4.0% 30 3.6% 32 3.8%Asian or Pacific Islander 5 0.9% 13 1.9% 14 1.9% 15 1.8% 14 1.7%American Indian or Alaskan Native 6 1.0% 3 0.4% 7 1.0% 8 0.9% 1 0.1%Non-Resident Aliens or Foreign Natl 11 1.9% 14 2.0% 16 2.2% 14 1.7% 10 1.2%Not Reported 0 0.0% 0 0.0% 1 0.1% 11 1.3% 16 1.9%
Total 587 700 728 845 847Source: CBM001 data
Source: CBM001 data
1999 2000 2001 2002
20021999 2000 2001
2003
2003
The University of Texas at Tyler2003-04 Fact Book

Student Information(Fall Semesters 1999-2003)
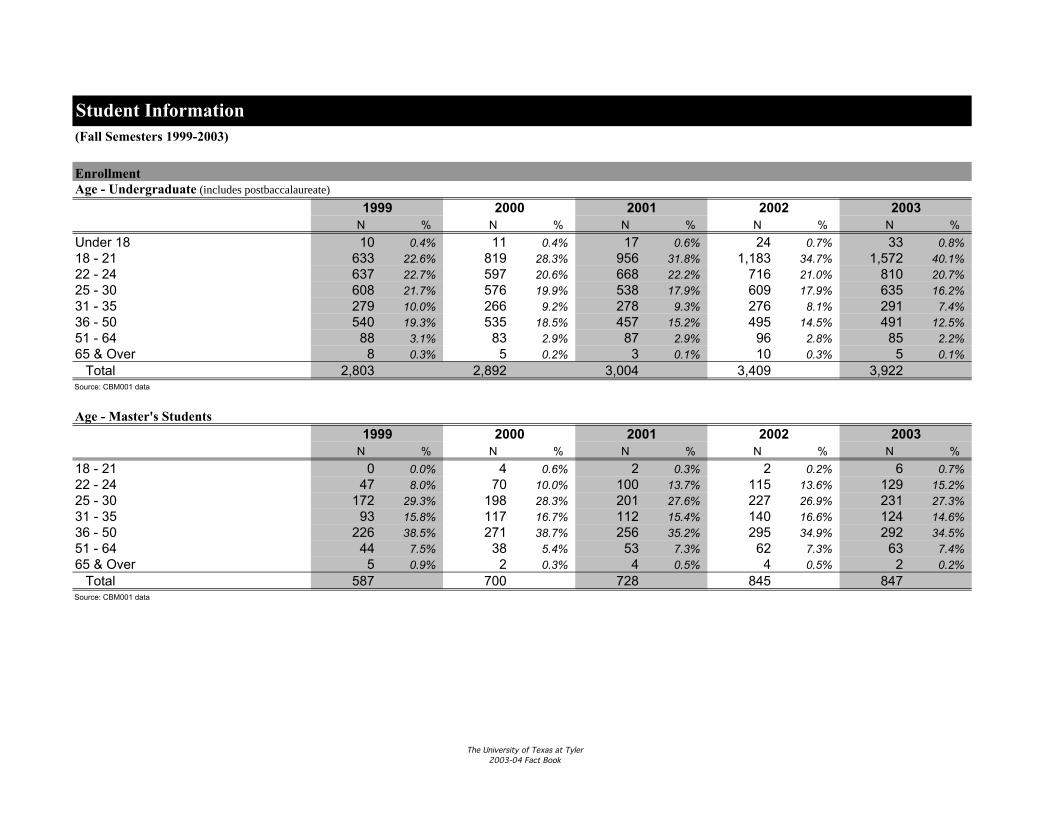
EnrollmentAge - All Students
N % N % N % N % N %
Under 18 10 0.3% 11 0.3% 17 0.5% 24 0.6% 33 0.7%18 - 21 633 18.7% 823 22.9% 958 25.7% 1,185 27.9% 1,578 33.1%22 - 24 684 20.2% 667 18.6% 768 20.6% 831 19.5% 939 19.7%25 - 30 780 23.0% 774 21.5% 739 19.8% 836 19.7% 866 18.2%31 - 35 372 11.0% 383 10.7% 390 10.5% 416 9.8% 415 8.7%36 - 50 766 22.6% 806 22.4% 713 19.1% 790 18.6% 783 16.4%51 - 64 132 3.9% 121 3.4% 140 3.8% 158 3.7% 148 3.1%65 & Over 13 0.4% 7 0.2% 7 0.2% 14 0.3% 7 0.1%
Total 3,390 3,592 3,732 4,254 4,769Source: CBM001 data
1999 2000 2001 2002 2003
Fall 2003 Age of Students
0.0% 5.0% 10.0% 15.0% 20.0% 25.0% 30.0% 35.0%
Under 18
18 - 21
22 - 24
25 - 30
31 - 35
36 - 50
51 - 64
65 & Over
The University of Texas at Tyler2003-04 Fact Book
Student Information(Fall Semesters 1999-2003)
EnrollmentAge - Undergraduate (includes postbaccalaureate)
N % N % N % N % N %
Under 18 10 0.4% 11 0.4% 17 0.6% 24 0.7% 33 0.8%18 - 21 633 22.6% 819 28.3% 956 31.8% 1,183 34.7% 1,572 40.1%22 - 24 637 22.7% 597 20.6% 668 22.2% 716 21.0% 810 20.7%25 - 30 608 21.7% 576 19.9% 538 17.9% 609 17.9% 635 16.2%31 - 35 279 10.0% 266 9.2% 278 9.3% 276 8.1% 291 7.4%36 - 50 540 19.3% 535 18.5% 457 15.2% 495 14.5% 491 12.5%51 - 64 88 3.1% 83 2.9% 87 2.9% 96 2.8% 85 2.2%65 & Over 8 0.3% 5 0.2% 3 0.1% 10 0.3% 5 0.1%
Total 2,803 2,892 3,004 3,409 3,922
Age - Master's Students
N % N % N % N % N %
18 - 21 0 0.0% 4 0.6% 2 0.3% 2 0.2% 6 0.7%22 - 24 47 8.0% 70 10.0% 100 13.7% 115 13.6% 129 15.2%25 - 30 172 29.3% 198 28.3% 201 27.6% 227 26.9% 231 27.3%31 - 35 93 15.8% 117 16.7% 112 15.4% 140 16.6% 124 14.6%36 - 50 226 38.5% 271 38.7% 256 35.2% 295 34.9% 292 34.5%51 - 64 44 7.5% 38 5.4% 53 7.3% 62 7.3% 63 7.4%65 & Over 5 0.9% 2 0.3% 4 0.5% 4 0.5% 2 0.2%
Total 587 700 728 845 847
Source: CBM001 data
Source: CBM001 data
1999 2000
1999 2002
2001 2002
2000 2001 2003
2003
The University of Texas at Tyler2003-04 Fact Book

Student Information(Fall Semesters 1999-2003)
Enrollmentby Geographic Source - All Students
N % N % N % N % N %
In-State 3,276 96.6% 3,459 96.3% 3,600 96.5% 4,085 96.0% 4,545 95.3%Out-of-State 60 1.8% 76 2.1% 64 1.7% 69 1.6% 118 2.5%Foreign 54 1.6% 57 1.6% 68 1.8% 100 2.4% 106 2.2%
Total 3,390 3,592 3,732 4,254 4,769Source: CBM001 data
20021999 2000 2001 2003
95.3%
2.5% 2.2%
0.0%
10.0%
20.0%
30.0%
40.0%
50.0%
60.0%
70.0%
80.0%
90.0%
100.0%
Geographic Source - All Students
In-State Out-of-State Foreign
The University of Texas at Tyler2003-04 Fact Book
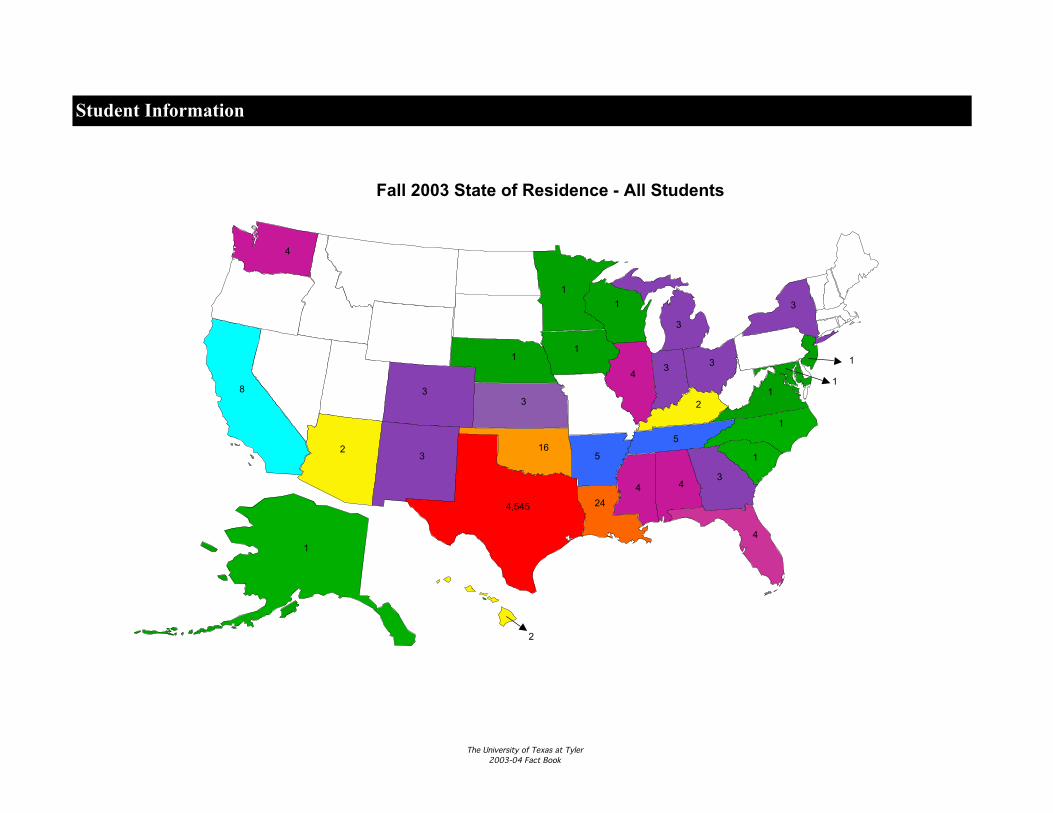
Student Information
Fall 2003 State of Residence - All Students
4,545
4
3
23
1
43
1
1
3
3
24
8
1
3
4
165
4
4
3
2
3
1
2
1
1
1
5
1
1
The University of Texas at Tyler2003-04 Fact Book

Student Information(Fall Semesters 1999-2003)
Enrollmentfrom Counties in East Texas Planning Region--All Students
N N N N N
Anderson 158 4.8% 138 4.0% 151 4.2% 178 4.4% 191 4.2%
Camp 31 0.9% 32 0.9% 21 0.6% 24 0.6% 26 0.6%
Cherokee 150 4.6% 147 4.2% 144 4.0% 157 3.8% 181 4.0%
Gregg 378 11.5% 444 12.8% 450 12.5% 506 12.4% 533 11.7%
Harrison 80 2.4% 91 2.6% 112 3.1% 134 3.3% 146 3.2%
Henderson 241 7.4% 238 6.9% 223 6.2% 261 6.4% 235 5.2%
Marion 6 0.2% 11 0.3% 8 0.2% 10 0.2% 8 0.2%
Panola 39 1.2% 39 1.1% 50 1.4% 52 1.3% 49 1.1%
Rains 4 0.1% 1 0.0% 1 0.0% 0 0.0% 2 0.0%
Rusk 114 3.5% 129 3.7% 130 3.6% 149 3.6% 147 3.2%
Smith 1,282 39.1% 1,298 37.5% 1,345 37.4% 1,522 37.3% 1,622 35.7%
Upshur 112 3.4% 127 3.7% 126 3.5% 144 3.5% 140 3.1%
Van Zandt 116 3.5% 140 4.0% 129 3.6% 136 3.3% 150 3.3%
Wood 89 2.7% 103 3.0% 114 3.2% 124 3.0% 122 2.7%
14-County East Texas 2,800 85.5% 2,938 84.9% 3,004 83.4% 3,397 83.2% 3,552 78.2%State Planning Region
Total In-State Headcount 3,276 3,459 3,600 4,085 4,545Total Headcount 3,390 3,592 3,732 4,254 4,769
Source: CBM001 data
% of Total In-State
Headcount
% of Total In-State
Headcount
% of Total In-State
Headcount
% of Total In-State
Headcount
1999 2000 2001 2002 2003% of Total In-State
Headcount
The University of Texas at Tyler2003-04 Fact Book

Student Information
Fall 2003 Enrollment from East Texas Planning Region
The University of Texas at Tyler2003-04 Fact Book

Enrollment By College
Undergraduate* Enrollment by College of Declared Major(Fall 2003)
All CollegesCollege of Arts and Sciences 948College of Business and Technology 805College of Education and Psychology 677College of Engineering and Computer Science 302College of Nursing and Health Sciences 741Undeclared 449
Total 3,922Source: CBM001 data
* Includes postbaccalaureate
Fall 2003 Undergraduate Enrollmentby Declared Major
Arts and Sciences
24.2%
Undeclared11.4%
Business and
TechnologyEducation and
Psychology
Nursing and Health Sciences
18.9%
Engineering and Computer
Science7.7%
The University of Texas at Tyler2003-04 Fact Book

Enrollment By College
Undergraduate* Enrollment by Declared Major(Fall 2003)
College of Arts and SciencesGeneral Studies 31Art 74Music 44Theatre 16Biology 120Chemistry 33Mathematics 51Criminal Justice 98Economics 14Political Science 74Sociology 50English 99History 109Spanish 23Journalism 62Speech Communication 46Postbaccalaureate** 4
Total 948Source: CBM001 data
* Includes postbaccalaureate
** These postbaccalaureate students have no corresponding undergraduate major
Sociology5.3%
Political Science7.8%
Economics1.5%
Art7.8%
Music4.6%
Spanish2.4%
History11.5%
Journalism6.5%
Chemistry3.5%
Criminal Justice10.3%
Mathematics5.4%
Biology12.7%
Theatre1.7%
General Studies3.3%
Postbaccalaureate
0.4%
Speech Communication
4.9%
English10.4%
The University of Texas at Tyler2003-04 Fact Book

Enrollment By College
Undergraduate* Enrollment by Declared Major(Fall 2003)
College of Business and TechnologyAccounting 198Finance 108General Business 78Management 151Marketing 115Applied Arts and Sciences 65Industrial Distribution 3Industrial Safety 24Industrial Technology 37Technical Professions 2Technology 7Training and Development 17
Total 805Source: CBM001 data
* Includes postbaccalaureate
** These postbaccalaureate students have no corresponding undergraduate degree
College of Education and PsychologyInterdisciplinary Studies 472Psychology 200Postbaccalaureate** 5
Total 677Source: CBM001 data
* Includes postbaccalaureate
** These postbaccalaureate students have no corresponding undergraduate degree
Marketing14.3%
General Business9.7%
Finance13.4%
Accounting24.6%
Technology0.9%
Technical Professions0.2%
Industrial Distribution0.4%
Industrial Safety2.9%
Management18.8%
Industrial Technology4.6%
Applied Arts and Sciences
8.1%
Training and Development
2.1%
Psychology29.6%
Interdisciplinary Studies 69.7%
Postbaccalareate**0.7%
The University of Texas at Tyler2003-04 Fact Book

Enrollment By College
Undergraduate* Enrollment by Declared Major(Fall 2003)
College of Engineering and Computer ScienceElectrical Engineering 56Mechanical Engineering 81Computer Science 116Computer Info Systems 49
Total 302Source: CBM001 data
* Includes postbaccalaureate
College of Nursing and Health SciencesNursing 575Kinesiology 50Health and Kinesiology 63Health Professions 51Medical Technology 2
Total 741Source: CBM001 data
* Includes postbaccalaureate
Computer Science38.4%
Computer Info Systems
16.2%Electrical Engineering
18.6%
Mechanical Engineering
26.8%
Medical Technology0.3%
Health Professions6.9%
Nursing77.6%
Health and Kinesiology
8.5%
Kinesiology6.7%
The University of Texas at Tyler2003-04 Fact Book

Enrollment By College
Master's Enrollment by College of Declared Major(Fall 2003)
All CollegesCollege of Arts and Sciences 154College of Business and Technology 242College of Education and Psychology 268College of Engineering and Computer Science 40College of Nursing and Health Sciences 135Undeclared 9
Total 848Source: CBM001 data
Fall 2003 Master's Enrollmentby Declared Major
Undeclared1.1%
College of Engineering and Computer Science
4.7%
College of Nursing and Health Sciences
15.9%
College of Education
and
College of Business and Technology
28.5%
College of Arts and Sciences
The University of Texas at Tyler2003-04 Fact Book

Enrollment By College
Master's Enrollment by Declared Major(Fall 2003)
College of Arts and SciencesArt 2Biology 10English 16History 15Interdisciplinary Studies 64Mathematics 4Criminal Justice 8Political Science 10Sociology 5Public Administration 19
Total 153Source: CBM001 data
Art1.3% Biology
6.5%
English10.5%
History9.8%
Interdisciplinary Studies41.8%
Public Administration12.4%
Mathematics2.6%
Political Science6.5%
Sociology3.3%
Criminal Justice5.3%
The University of Texas at Tyler2003-04 Fact Book

Enrollment By College
Master's Enrollment by Declared Major(Fall 2003)
College of Business and TechnologyBusiness Administration 186Educational Human Resource Development 5Industrial Distribution 1Industrial Safety 6Industrial Technology 3Instructional Technology 15Technical Professions 25Technical Teacher Educ 1
Total 242Source: CBM001 data
College of Education and PsychologyClinical Psychology 27Counseling Psychology 27School Counseling 23Curriculum and Instruction 21Early Childhood Education 11Educational Administration 100Reading 26Special Education 33
Total 268Source: CBM001 data
Clinical Psychology
10.1%
Counseling Psychology
10.1%
Reading9.7%
Special Education
12.3%
Curriculum and Instruction
7.8%Early Childhood
Education4.1%
Educational Administration
37.3%
School Counseling
8.6%
Industrial Distribution
0.4%
Industrial Technology
1.2%
Technical Professions
10.3%
Instructional
TechnologyIndustrial Safety
2.5%
Educational Human Resource
Development2.1%
Technical Teacher Educ
0.4%
Business Administration
76.9%
The University of Texas at Tyler2003-04 Fact Book

Enrollment By College
Master's Enrollment by Declared Major(Fall 2003)
College of Engineering and Computer ScienceComputer Science 24Engineering 16
Total 40Source: CBM001 data
College of Nursing and Health SciencesClinical Exercise Physiology 5Kinsesiology 6Health and Kinesiology 22Nursing 102
Total 135Source: CBM001 data
Engineering40.0%
Computer Science
60.0%
Health and Kinesiology
16.3%Kinsesiology4.4%
Clinical Exercise
Physiology3.7%
Nursing75.6%
The University of Texas at Tyler2003-04 Fact Book

Degrees
Degrees Awarded during Academic Year (Fall, Spring, Summer)By Level
N % N % N % N % N %
Bachelor's 737 81.7% 731 83.9% 702 81.2% 684 85.0% 619 77.1%Master's 165 18.3% 140 16.1% 163 18.8% 121 15.0% 184 22.9%
Total Degrees 902 871 865 805 803Source: CBM009 data
AY 2001-2002AY 1998-1999 AY 1999-2000 AY 2000-2001 AY 2002-2003
Degrees Awarded 1998-99 to 2002-03
0
100
200
300
400
500
600
700
800
1998-1999 1999-2000 2000-2001 2001-2002 2002-2003
Bachelor's Master's
The University of Texas at Tyler2003-04 Fact Book

Degrees
Degrees Awarded during Academic Year (Fall, Spring, Summer)All Degrees by Gender
N % N % N % N % N %
Male 272 30.2% 274 31.5% 265 30.6% 253 31.4% 265 33.0%Female 630 69.8% 597 68.5% 600 69.4% 552 68.6% 538 67.0%
Total 902 871 865 805 803Source: CBM009 data
Undergraduate Degrees by Gender
N % N % N % N % N %
Male 224 30.4% 217 29.7% 212 30.2% 204 29.8% 207 33.4%Female 513 69.6% 514 70.3% 490 69.8% 480 70.2% 412 66.6%
Total 737 731 702 684 619Source: CBM009 data
Master's Degrees by Gender
N % N % N % N % N %
Male 48 29.1% 57 40.7% 53 32.5% 49 40.5% 58 31.5%Female 117 70.9% 83 59.3% 110 67.5% 72 59.5% 126 68.5%
Total 165 140 163 121 184Source: CBM009 data
AY 1998-1999 AY 1999-2000 AY 2000-2001
AY 1998-1999 AY 1999-2000
AY 1998-1999 AY 2000-2001AY 1999-2000 AY 2001-2002 AY 2002-2003
AY 2002-2003
AY 2002-2003
AY 2001-2002
AY 2000-2001 AY 2000-2001
The University of Texas at Tyler2003-04 Fact Book

Degrees
Degrees Awarded during Academic Year (Fall, Spring, Summer)by Ethnicity
N % N % N % N % N %
White/Non-Hispanic 788 87.4% 745 85.5% 746 86.2% 696 86.5% 685 85.3%Black/Non-Hispanic 54 6.0% 74 8.5% 68 7.9% 59 7.3% 61 7.6%Hispanic 25 2.8% 17 2.0% 19 2.2% 23 2.9% 22 2.7%Asian or Pacific Islander 13 1.4% 13 1.5% 14 1.6% 6 0.7% 11 1.4%American Indian or 10 1.1% 9 1.0% 10 1.2% 11 1.4% 9 1.1% Alaskan Native Non-Resident Aliens or 12 1.3% 13 1.5% 8 0.9% 10 1.2% 14 1.7% Foreign NationalUnknown/Unreported 1 0.1%
Total 902 871 865 805 803Source: CBM009 data
AY 2001-2002AY 1998-1999 AY 1999-2000 AY 2000-2001 AY 2002-2003
1998-2002 Degrees Awarded toMinorities and International Students
0.0%
1.0%
2.0%
3.0%
4.0%
5.0%
6.0%
7.0%
8.0%
9.0%
1997-1998 1998-1999 1999-2000 2000-2001 2001-2002
Black/Non-Hispanic Hispanic Asian or Pacific Islander
American Indian or Alaskan Native Non-Resident Aliens or Foreign National Unknown/Unreported
The University of Texas at Tyler2003-04 Fact Book
Degrees
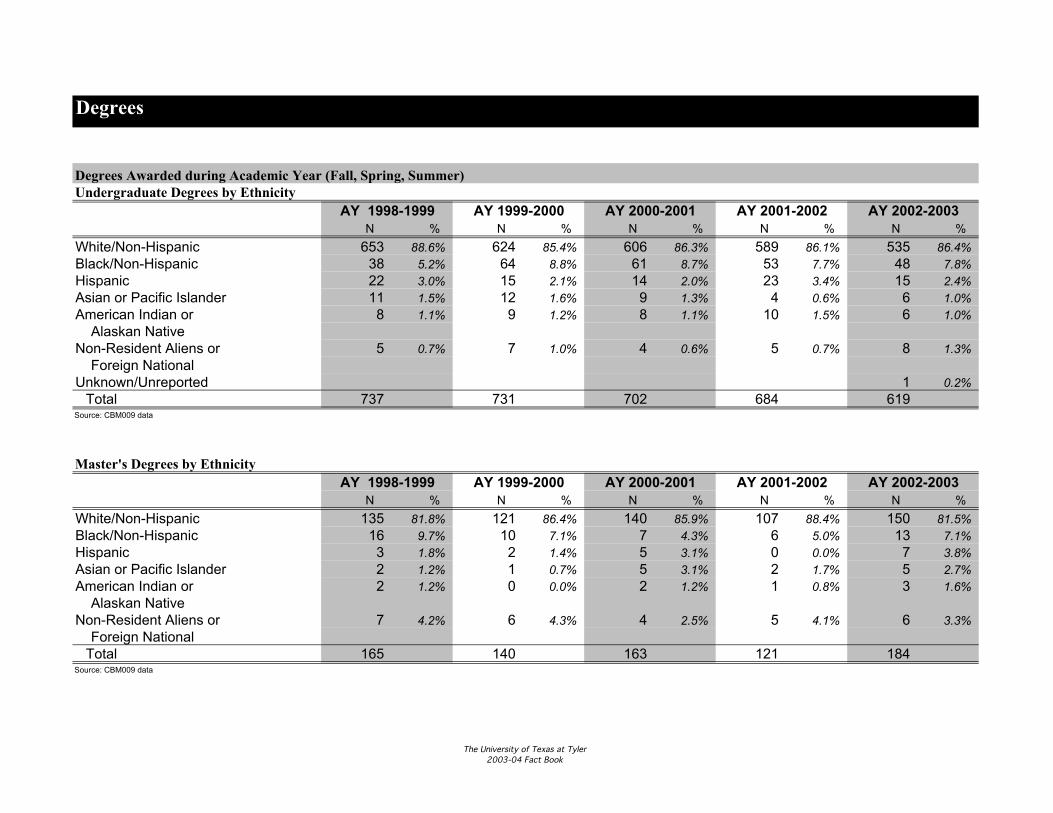
Degrees Awarded during Academic Year (Fall, Spring, Summer)Undergraduate Degrees by Ethnicity
N % N % N % N % N %
White/Non-Hispanic 653 88.6% 624 85.4% 606 86.3% 589 86.1% 535 86.4%Black/Non-Hispanic 38 5.2% 64 8.8% 61 8.7% 53 7.7% 48 7.8%Hispanic 22 3.0% 15 2.1% 14 2.0% 23 3.4% 15 2.4%Asian or Pacific Islander 11 1.5% 12 1.6% 9 1.3% 4 0.6% 6 1.0%American Indian or 8 1.1% 9 1.2% 8 1.1% 10 1.5% 6 1.0% Alaskan NativeNon-Resident Aliens or 5 0.7% 7 1.0% 4 0.6% 5 0.7% 8 1.3% Foreign NationalUnknown/Unreported 1 0.2%
Total 737 731 702 684 619Source: CBM009 data
Master's Degrees by Ethnicity
N % N % N % N % N %
White/Non-Hispanic 135 81.8% 121 86.4% 140 85.9% 107 88.4% 150 81.5%Black/Non-Hispanic 16 9.7% 10 7.1% 7 4.3% 6 5.0% 13 7.1%Hispanic 3 1.8% 2 1.4% 5 3.1% 0 0.0% 7 3.8%Asian or Pacific Islander 2 1.2% 1 0.7% 5 3.1% 2 1.7% 5 2.7%American Indian or 2 1.2% 0 0.0% 2 1.2% 1 0.8% 3 1.6% Alaskan NativeNon-Resident Aliens or 7 4.2% 6 4.3% 4 2.5% 5 4.1% 6 3.3% Foreign National
Total 165 140 163 121 184Source: CBM009 data
AY 1998-1999 AY 1999-2000 AY 2000-2001
AY 1998-1999 AY 1999-2000 AY 2000-2001
AY 2002-2003
AY 2002-2003
AY 2001-2002
AY 2001-2002
The University of Texas at Tyler2003-04 Fact Book

Degrees
Degrees Awarded during Academic Year 2002-2003 (Fall, Spring, Summer)
B.A. 67 M.A. 29
B.A.A.S. 23 M.A.T. 6
B.B.A. 95 M.B.A. 45B.F.A. 7 M.Ed. 50B.G.S. 17 M.Engr. 1B.M. 0 M.P.A. 4B.S. 264 M.S. 41B.S.E.E. 10 M.S.N. 8B.S.M.E. 13 Total 184B.S.N. 123Total 619
Master's DegreesBachelor's Degrees Bachelor's Degrees 2003
0 50 100 150 200 250 300
B.A.
B.A.A.S.
B.B.A.
B.F.A.
B.G.S.
B.M.
B.S.
B.S.E.E.
B.S.M.E.
B.S.N.
Master's Degrees 2003
0 10 20 30 40 50 60
M.A.
M.A.T.
M.B.A.
M.Ed.
M.Engr.
M.P.A.
M.S.
M.S.N.
The University of Texas at Tyler2003-04 Fact Book

Degrees
Bachelor's Degrees Awarded by Department, 2002-2003 (Fall, Spring, Summer)
Bachelor's Degrees Awarded by Department, AY 2002-2003
9
95
1
36
26
79
1017
28
15
25
15 13
124
27
4843
8
0
20
40
60
80
100
120
140
Bi o
log y
Bu s
ine s
s
Ch e
mis
try
Co m
mun
icat
ion
Co m
p ute
r Sci
e nce
Cu r
ricul
um &
I nst
ruct
ion
El e
ctri c
al E
ngi n
eer in
g
Ge n
eral
Stu
die s
He a
lth &
Kin
esio
logy
Hi s
tory
Lit e
rat u
re &
La n
guag
e s
Ma t
hem
atic
s
Me c
hani
cal E
n gin
e erin
g
Nu r
sin g
Ps y
chol
ogy
So c
ial S
cie n
ces
Tech
n olo
g y
Vi s
ual &
Per
form
ing
Arts
The University of Texas at Tyler2003-04 Fact Book

Degrees
Master's Degrees Awarded by Department, 2002-2003 (Fall, Spring, Summer)
Master's Degrees Awarded by Department, AY 2002-2003
4
45
7 8
2219
1
9
2
16
31
8
22
5
12
05
101520253035404550
Bi o
log y
Bu s
ine s
s
Co m
p ute
r Sci
e nce
Cu r
ricul
um &
I nst
ruct
ion
Ea r
ly C
hid h
ood/
Re a
din g
/Spe
c ial
Edu
Ed u
catio
n al L
e ade
rshi
p
En g
ine e
ring
He a
lth &
Kin
esio
logy
Hi s
tory
Int e
rdi s
cip l
inar
y St
udie
s
Lit e
rat u
re &
La n
guag
e s
Ma t
hem
atic
s
Nu r
sin g
Ps y
chol
ogy
So c
ial S
cie n
ces
Tech
n olo
g y
The University of Texas at Tyler2003-04 Fact Book
Degrees
2002-2003A
rt
Bio
logy
Che
mis
try
Crim
inal
Jus
tice
Eco
nom
ics
Eng
lish
Gen
eral
Stu
dies
His
tory
Inte
rdis
cipl
inar
y S
tudi
es
Jour
nalis
m
Mat
hem
atic
s
Mus
ic
Pol
itica
l Sci
ence
Pub
lic A
dmin
Soc
iolo
gy
Spa
nish
Spe
ech
Com
mun
icat
ion
The
atre
Tot
al
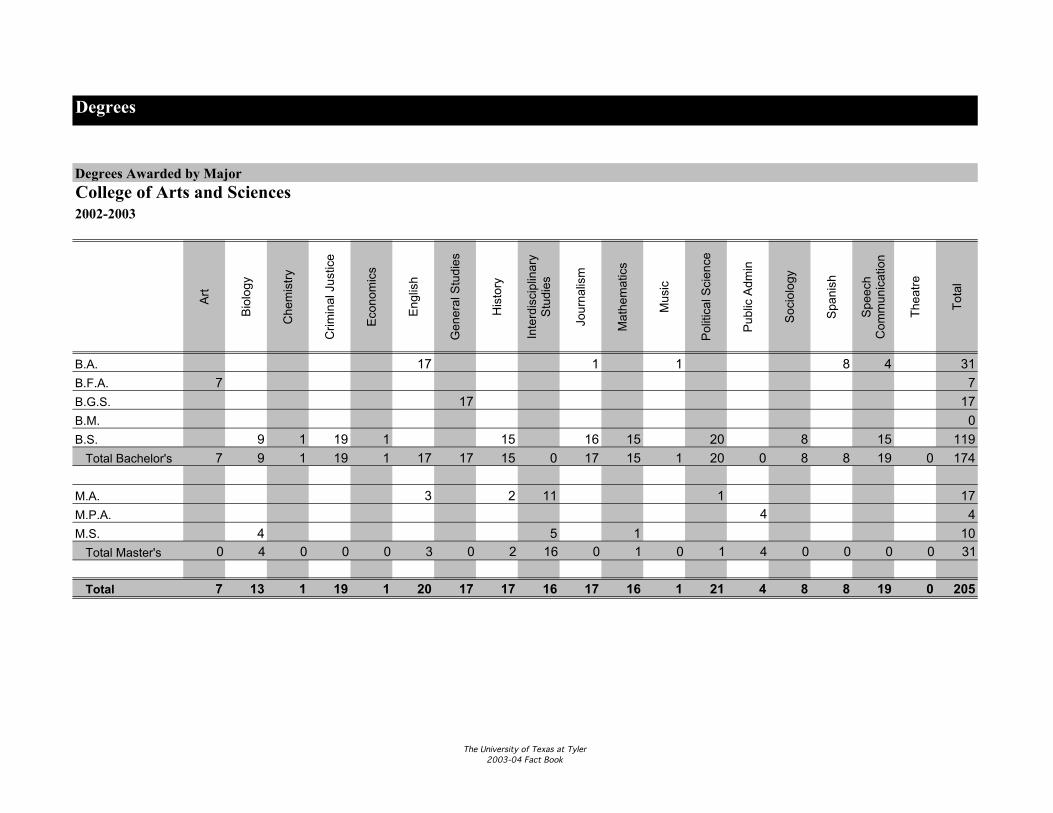
B.A. 17 1 1 8 4 31
B.F.A. 7 7
B.G.S. 17 17
B.M. 0
B.S. 9 1 19 1 15 16 15 20 8 15 119
Total Bachelor's 7 9 1 19 1 17 17 15 0 17 15 1 20 0 8 8 19 0 174
M.A. 3 2 11 1 17
M.P.A. 4 4
M.S. 4 5 1 10
Total Master's 0 4 0 0 0 3 0 2 16 0 1 0 1 4 0 0 0 0 31
Total 7 13 1 19 1 20 17 17 16 17 16 1 21 4 8 8 19 0 205
Degrees Awarded by MajorCollege of Arts and Sciences
The University of Texas at Tyler2003-04 Fact Book

Degrees
2002-2003A
ccou
ntin
g
Bus
ines
s A
dmin
Fin
ance
Gen
eral
Bus
ines
s
Man
agem
ent
Mar
ketin
g
App
lied
Art
s &
S
cien
ces
Edu
catio
nal H
uman
R
esou
rces
Indu
stria
l Art
s E
duca
tion
Indu
stria
l Dis
trib
utio
n
Indu
stria
l Saf
ety
Indu
stria
l T
echn
olog
y
Inst
ruct
iona
l T
echn
olog
y
Tec
hnic
al
Pro
fess
ions
Tec
hnol
ogy
Sys
tem
s
Tra
inin
g &
D
evel
opm
ent
Tot
al
B.A.A.S. 23 23
B.B.A. 28 16 9 22 20 95
B.S. 8 10 1 1 20
Total Bachelor's 28 0 16 9 22 20 23 0 0 0 8 10 0 0 1 1 138
M.B.A. 45 45
M.S. 5 4 1 1 1 12
Total Master's 0 45 0 0 0 0 0 5 0 0 4 1 1 1 0 0 57
Total 28 45 16 9 22 20 23 5 0 0 12 11 1 1 1 1 195
College of Business and TechnologyDegrees Awarded by Major
The University of Texas at Tyler2003-04 Fact Book
Degrees
2002-2003C
linic
al P
sych
olog
y
Cou
nsel
ing
Psy
chol
ogy
Cou
nsel
ing
Psy
chol
ogy-
-Mar
riage
& F
amily
Cur
ricul
um &
In
stru
ctio
n
Ear
ly C
hild
hood
E
duca
tion
Edu
catio
nal
Adm
inis
trat
ion
Inte
rdis
cipl
inar
y S
tudi
es
Psy
chol
ogy
Clin
ical
Psy
chol
ogy-
-N
euro
psyc
holo
gy
Clin
ical
Psy
chol
ogy-
-S
choo
l Psy
chol
ogy
Rea
ding
Edu
catio
n
Sch
ool C
ouns
elin
g
Spe
cial
Edu
catio
n
To
tal
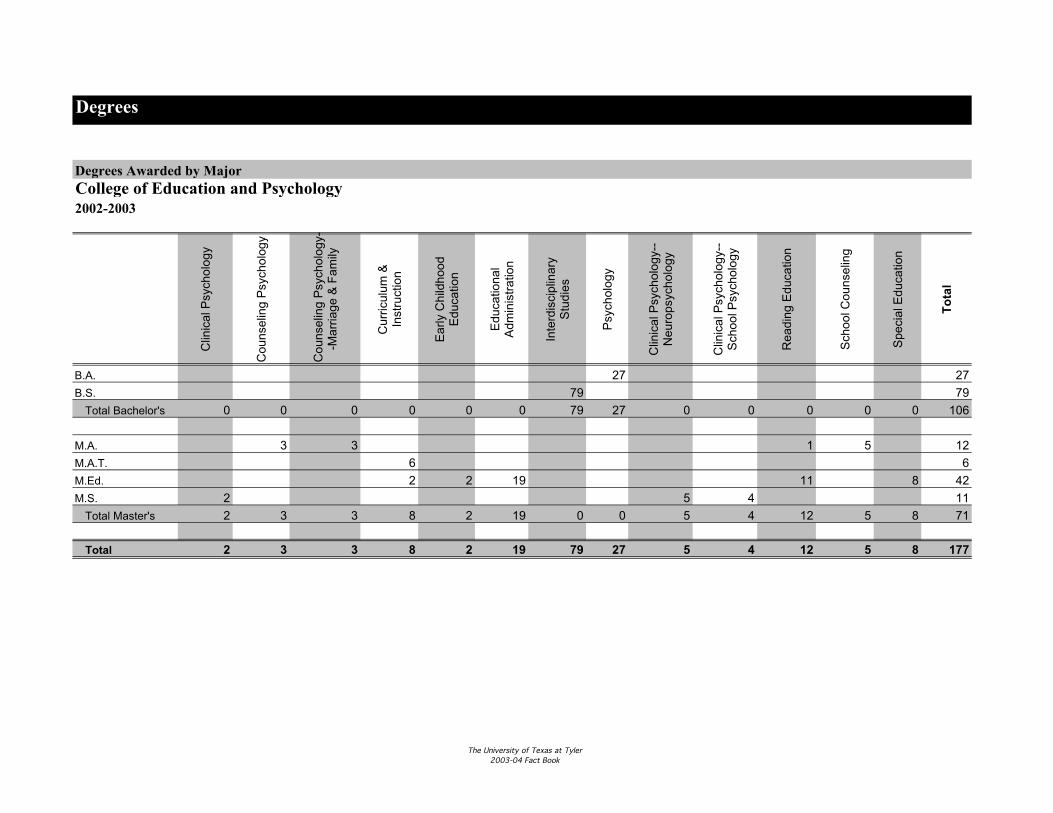
B.A. 27 27
B.S. 79 79
Total Bachelor's 0 0 0 0 0 0 79 27 0 0 0 0 0 106
M.A. 3 3 1 5 12
M.A.T. 6 6
M.Ed. 2 2 19 11 8 42
M.S. 2 5 4 11
Total Master's 2 3 3 8 2 19 0 0 5 4 12 5 8 71
Total 2 3 3 8 2 19 79 27 5 4 12 5 8 177
Degrees Awarded by MajorCollege of Education and Psychology
The University of Texas at Tyler2003-04 Fact Book

Degrees
2002-2003
Com
pute
r S
cien
ce
Com
pute
r In
form
atio
n S
yste
ms
Ele
ctric
al E
ngin
eerin
g
Eng
inee
ring
Mec
hani
cal
Eng
inee
ring
To
tal
B.S. 20 6 26B.S.E.E. 10 10B.S.M.E. 13 13
Total Bachelor's 20 6 10 0 13 49
M.E. 1 1M.S. 7 7
Total Master's 7 0 0 1 0 8
Total 27 6 10 1 13 57
Degrees Awarded by MajorCollege of Engineering and Computer Science
The University of Texas at Tyler2003-04 Fact Book

Degrees
2002-2003
Clin
ical
Exe
rcis
e P
hysi
olog
y
Hea
lth &
K
ines
iolo
gy
Hea
lth P
rofe
ssio
ns
Kin
esio
logy
Med
ical
T
echn
olog
y
Nur
sing
To
tal
B.A. 10 1 11B.S. 10 7 1 18B.S.N. 123 123
Total Bachelor's 0 10 10 8 1 123 152
M.A. 0M.Ed. 8 8M.S. 1 1M.S.N. 8 8
Total Master's 1 8 0 0 0 8 17
Total 1 18 10 8 1 131 169
College of Nursing and Health SciencesDegrees Awarded by Major
The University of Texas at Tyler2003-04 Fact Book

Semester Credit Hours
Semester Credit Hour Historyby College
UG Grad UG Grad UG Grad UG Grad UG Grad4,101 312 4,629 1983,561 528 4,044 6157,460 2,361 7,181 2,3497,783 761 8,662 647
580 9 739 304,026 197 4,520 183
Total Semester
27,511 4168 29,775 4022
Semester Credit Hour Historyby College
UG Grad UG Grad UG Grad UG Grad UG Grad
14,315 898 17,875 1,008 23,263 9824,956 1,023 5,426 1,290 6,693 1,2035,961 1,645 6,568 1,867 6,870 1,7821,829 147 1,679 165 1,889 1775,345 435 5,110 747 6,040 753
Total Semester
32,406 4,148 36,658 5,077 44,755 4,897Source: CBM0004 data
Classification of Undergraduate/Graduate made at the course level.
Sciences and Mathematics
Business
Education and Psychology
Liberal Arts
Engineering
Nursing
Arts and Sciences
Business and Technology
Nursing and Health Sciences
Fall 2002
Fall 2001 Fall 2002Fall 2000
Fall 2003
Fall 2003
Education and Psychology
Engineering and Computer Science
Fall 1999 Fall 2000
Fall 1999
Fall 2001
Due to the reorganization of the Colleges effective Fall 2001, direct comparison is not appropriate.
Due to the reorganization of the Colleges effective Fall 2001, direct comparison is not appropriate.
The University of Texas at Tyler2003-04 Fact Book
Semester Credit Hours
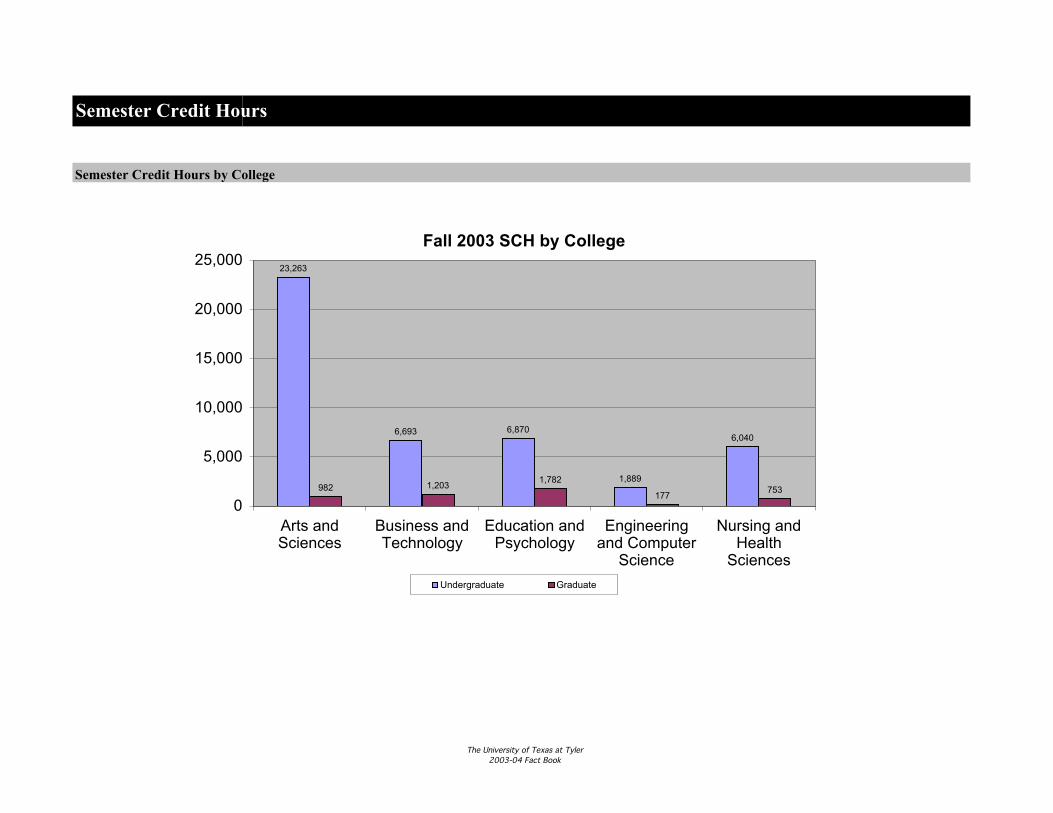
Semester Credit Hours by College
Fall 2003 SCH by College
23,263
6,693 6,870
1,889
6,040
982 1,2031,782
177753
0
5,000
10,000
15,000
20,000
25,000
Arts andSciences
Business andTechnology
Education andPsychology
Engineeringand Computer
Science
Nursing andHealth
Sciences
Undergraduate Graduate
The University of Texas at Tyler2003-04 Fact Book

Semester Credit Hours
Semester Credit Hour History
UG Grad UG Grad UG Grad UG Grad UG Grad27,511 4,168 29,775 4,022 32,406 4,148 36,658 5,077 44,755 4,897
Source: CBM004 data
Classification of Undergraduate/Graduate made at the course level.
Fall 2002 Fall 2003Fall 1999 Fall 2001Fall 2000
27,511 29,77532,406
36,658
44,755
0
5,000
10,000
15,000
20,000
25,000
30,000
35,000
40,000
45,000
Sem
este
r C
red
it
Ho
urs
Fall 1999 Fall 2000 Fall 2001 Fall 2002 Fall 2003
Undergraduate SCH
4,168 4,022 4,148
5,0774,897
0
1,000
2,000
3,000
4,000
5,000
6,000
Sem
este
r C
red
it
Ho
urs
Fall 1999 Fall 2000 Fall 2001 Fall 2002 Fall 2003
Graduate SCH
The University of Texas at Tyler2003-04 Fact Book

Faculty
N % N % N % N % N %
Tenured 84 30.7% 81 31.5% 78 27.4% 87 29.3% 91 31.1%
On Tenure Track 42 15.3% 51 19.8% 61 21.4% 64 21.5% 55 18.8%
Non-Tenured 148 54.0% 125 48.6% 146 51.2% 146 49.2% 147 50.2%
Total 274 257 285 297 293
N % N % N % N % N %
Professor 46 16.8% 44 17.1% 41 14.4% 47 15.8% 43 14.7%
Associate Professor 38 13.9% 38 14.8% 44 15.4% 49 16.5% 55 18.8%
Assistant Professor 41 15.0% 49 19.1% 53 18.6% 61 20.5% 48 16.4%
Lecture/Other Faculty 149 54.4% 126 49.0% 147 51.6% 140 47.1% 147 50.2%
Total 274 257 285 297 293
N % N % N % N % N %
Male 145 52.9% 132 51.4% 143 50.2% 154 51.9% 156 53.2%
Female 129 47.1% 125 48.6% 142 49.8% 143 48.1% 137 46.8%
Total 274 257 285 297 293Source: CBM008 data
Fall 2002 Fall 2003
Total Faculty Headcount by Rank
Total Faculty Headcount by Gender
Fall 2003
Fall 1999 Fall 2000 Fall 2001
Fall 2003
Fall 2000 Fall 2001 Fall 2002
Total Faculty Headcount by TenureFall 1999 Fall 2000
Fall 1999
Fall 2001 Fall 2002
The University of Texas at Tyler2003-04 Fact Book
Faculty
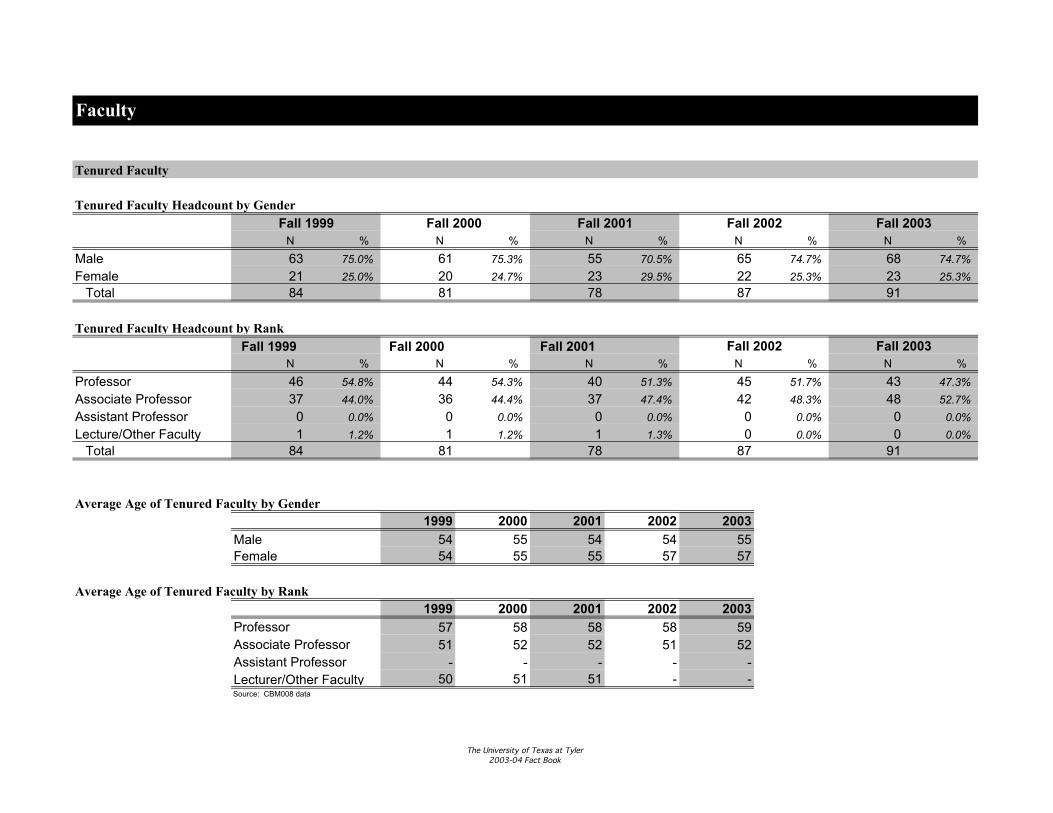
Tenured Faculty Headcount by Gender
N % N % N % N % N %
Male 63 75.0% 61 75.3% 55 70.5% 65 74.7% 68 74.7%
Female 21 25.0% 20 24.7% 23 29.5% 22 25.3% 23 25.3%
Total 84 81 78 87 91
Fall 1999 Fall 2000 Fall 2001N % N % N % N % N %
Professor 46 54.8% 44 54.3% 40 51.3% 45 51.7% 43 47.3%
Associate Professor 37 44.0% 36 44.4% 37 47.4% 42 48.3% 48 52.7%
Assistant Professor 0 0.0% 0 0.0% 0 0.0% 0 0.0% 0 0.0%
Lecture/Other Faculty 1 1.2% 1 1.2% 1 1.3% 0 0.0% 0 0.0%
Total 84 81 78 87 91
Average Age of Tenured Faculty by Gender1999 2000 2001 2002 2003
Male 54 55 54 54 55Female 54 55 55 57 57
Average Age of Tenured Faculty by Rank1999 2000 2001 2002 2003
57 58 58 58 5951 52 52 51 52
- - - - -50 51 51 - -
Source: CBM008 data
Tenured Faculty
Tenured Faculty Headcount by Rank
Fall 2002
Fall 2003
Fall 2003Fall 1999 Fall 2000 Fall 2001
ProfessorAssociate Professor
Fall 2002
Assistant ProfessorLecturer/Other Faculty
The University of Texas at Tyler2003-04 Fact Book

Faculty
N % N % N % N % N %
Male 22 52.4% 26 51.0% 37 60.7% 31 48.4% 28 50.9%
Female 20 47.6% 25 49.0% 24 39.3% 33 51.6% 27 49.1%
Total 42 51 61 64 55
N % N % N % N % N %
Professor 0 0.0% 0 0.0% 1 1.6% 0 0.0% 0 0.0%
Associate Professor 1 2.4% 2 3.9% 7 11.5% 7 10.9% 7 12.7%
Assistant Professor 41 97.6% 49 96.1% 53 86.9% 57 89.1% 48 87.3%
Total 42 51 61 64 55
Average Age of Tenure Track Faculty by Gender1999 2000 2001 2002 2003
Male 39 55 40 40 40Female 48 55 46 47 47
Average Age of Tenure Track Faculty by Rank1999 2000 2001 2002 2003
Professor - - 66 - -58 50 48 49 5043 43 43 43 43
Source: CBM008 data
Tenured Track Faculty Headcount by Gender
Tenured Track Faculty Headcount by Rank
Tenured Track Faculty
Fall 2003
Fall 2003Fall 1999 Fall 2000
Fall 1999 Fall 2000 Fall 2001 Fall 2002
Associate ProfessorAssistant Professor
Fall 2001 Fall 2002
The University of Texas at Tyler2003-04 Fact Book

Definitions
All Texas public higher educational institutions must submit periodic reports to the Texas Higher Education Coordinating Board (THECB) to fulfill provisions of the Higher Education Coordinating Act of 1965 as amended (codified as Subtitle B, Chapter 61, Texas Education Code, 1971). These reports are used to determine each institution’s state reimbursement funding.
Academic Year
Ethnicity or Racial/Ethnic Heritage
Coordinating Board Reports (CBM Reports)
Ethnicity codes are based on federal and state standards. Categories are White/Other (White-Non Hispanic), African-American (Black-Non Hispanic), Hispanic, Asian American (Asian or Pacific Islander), Native American (American Indian or Alaskan Native), and International. The information is self-reported by the student. Missing data are reported in the unknown category. International is defined a non-resident alien, a person who is not a citizen of the U.S. and who is in this country on a temporary basis and does not
The dollar value of funds expended for the conduct of research and development from sources other than appropriated state and local funds. (ABEST short definition).
Defined as the fall, spring, and summer sequence of semesters and identified by the second calendar year in the sequence. For example, the sequence fall 2000, and spring and summer 2001 is AY2001 (or AY 01). Note: an academic year is equivalent to a fiscal year in Texas.
Amount Expended for Administrative Costs as a Percent of Operating Budget
Dollar Amount of External or Sponsored Research Funds (in millions)
The percentage of funds expended for administrative costs as a percent of operating budget. Administrative costs are Institutional Support expenditure items as designated in the institution’s annual financial reports included in the following subcategories: executive management, fiscal operations, general administration and logistical services, administrative computing support, and public relations/development. (ABEST short definition).
It is the policy of the office of Planning and Institutional Research to use these numbers to prepare data requests so that numbers can be tracked back to the THECB submissions.
The University of Texas at Tyler2003-04 Fact Book

Definitions
External or Sponsored Research Funds as a Percent of State Appropriations
Freshman StudentsUndergraduate students who have earned fewer than 30 credits.
Gender
Graduate StudentsA student possessing a baccalaureate degree or the equivalent and admitted to an approved master's degree program at the institution.
Headcount also called ‘Enrollment’
Junior StudentsUndergraduate students who have earned more than 59 but fewer than 90 credits.
This includes those (ranked, unranked, and student faculty) with any type of faculty appointment regardless of their source of funds or their assignment. This includes research faculty, librarians, administrators with faculty titles, and faculty who may be on leave. Faculty also includes adjunct, special, visiting, emeritus, and lecturer.
Female or male, self-reported. Note: per state guidelines, ‘male’ is used as the default code for students who do not report their gender.
A count of students, faculty, and/or staff where each individual is counted once. This is in contrast to the FTE count where an individual may be counted as less than or more than one.
have the right to remain indefinitely. A resident alien, a non-citizen who has been lawfully admitted for permanent residence, is reported in the appropriate racial/ethnic category along with U.S. citizens.
Expenditures of external or sponsored research funds represented as a percent of expenditures of state appropriations. (ABEST short definition).
Faculty
The University of Texas at Tyler2003-04 Fact Book
Definitions
Minority
Represented Minorities includes Asian AmericansUnder-represented Minorities includes African-American, Hispanic, and Native American ethnic categories.
Number of Community College Transfer Students Enrolled
Number of Community College Transfer Graduates
Pass Rate of ExCET Exam
Percent of Baccalaureate Graduates Who Are First Generation College Graduates
Percent of Full-time, Degree-seeking Transfer Students Who Earn a Baccalaureate Degree within Four Years
‘Minority’ represents the sum of four racial/ethnic heritage categories: African-American, Hispanic, Asian American, and Native American. However, in some documents, such as the Legislative Appropriations Request (LAR), Asian Americans are not included in minority figures. There are new terminologies that can be used to determine minority status:
The number of students enrolled in the fall semester who attempted 30 or more semester credit hours in a Texas public community college during the past six years. (ABEST short definition).
The number of baccalaureate level graduates who attempted 30 or more semester credit hours in a Texas public community college during the past six years. (ABEST short definition).
The percentage of the institution’s undergraduate teacher education program graduates attempting the state licensing examination who become certified to teach by the State Board of Educator Certification (SBEC) either before graduation from the program, or within the twelve months immediately following graduation from the program. (ABEST short definition).
Percentage of graduating baccalaureate students whose parents did not graduate from college. Parents are defined only as birth parents, adoptive parents, or legal guardians.
The percent of those students classified as full-time, degree-seeking transfer students who transfer into the institution with at least 60 accepted semester credit hours, and earn a baccalaureate degree within four years of their entrance. Full-time is defined as taking 12 semester credit hours. (ABEST short definition).
The University of Texas at Tyler2003-04 Fact Book

Definitions
Percent of Semester Credit Hour Courses CompletedThe percent of semester credit hours completed. (ABEST short definition).
Post Baccalaureate (or Postbaccalaureate) Students
Retention Rate of First-time, Full-time, Degree-seeking Freshmen Students After One Academic Year
Retention Rate of Full-time, Degree-seeking Transfer Students After One Academic Year
Semester Credit Hour (SCH)
Senior StudentsUndergraduate students who have earned more than 89 credits.
Sophomore StudentsUndergraduate students who have earned more than 29 but fewer than 60 credits.
The semester credit hour is defined as the credit hours assigned to a course. This is generally based on the number of hours the course meets per week. The SCH a course produces is determined by multiplying the enrollment of the course by the credit hours of the course. The SCH of a student is determined by adding the credit hours from all the student’s courses.
Percent of first-time, full-time, degree-seeking freshmen who enter in the fall semester, who are still enrolled after one academic year. (ABEST short definition).
Percent of full-time, degree-seeking transfer students who enter in the fall semester with at least 60 accepted semester credit hours, who are still enrolled after one academic year. Full-time is defined as taking 12 semester credit hours. (ABEST short definition).
Students who have earned an undergraduate degree or higher and (1) are seeking a second baccalaureate degree, (2) are seeking certification, (3) have been conditionally admitted for a graduate degree program pending the successful completion of certain undergraduate prerequisites, or (4) are taking occasional courses with a non-degree objective.
The University of Texas at Tyler2003-04 Fact Book

Definitions
State Licensure Exam Pass Rate of Engineering Graduates
State Licensure Exam Pass Rate of Nursing Graduates
Student Full-Time Equivalency (FTE)
NOTE: Automated Budget Evaluation System of Texas (ABEST) defines Undergraduate FTE using 15 hours as a full time student.
Tenure Track FacultyFaculty without tenure holding an appointment/position eligible for tenure as reported to the Coordinating Board.
Tenured FacultyFaculty who have received tenure as reported to the Coordinating Board.
Texas Higher Education Coordinating Board (THECB or CB)
The percentage of the institution’s undergraduate nursing program graduates attempting the state licensing examination who pass all parts either before graduation from the program, or within the twelve months immediately following graduation from the program. (ABEST short definition).
Student full-time equivalency is calculated by dividing the student/course level SCH generated by the appropriate divisor as shown below per Texas Higher Education Coordinating Board guidelines:
Master’s FTE: master’s student/course level determined SCH divided by 9 (the number of hours considered as a full-time student). NOTE: ABEST defines master’s FTE using 12 hours as a full time student.
In 1965, the 59th Texas Legislature established the Texas Higher Education Coordinating Board and charged it with the responsibility of coordinating and monitoring colleges and universities in the state of Texas. THECB has broad powers and is directly responsible for the formula process used to make appropriation recommendations to the legislature for higher education.
Undergraduate FTE: undergraduate student/course level determined SCH divided by 12 (the number of hours considered as a full-time student).
The percentage of the institution’s undergraduate engineering program graduates attempting the state licensing examination who pass all parts either before graduation from the program, or within the twelve months immediately following graduation or any required internship. (ABEST short definition).
The University of Texas at Tyler2003-04 Fact Book

Definitions
Undergraduate Students
Upper Division Courses
Upper Division Undergraduate StudentsStudents who are classified as juniors or seniors.
Degree seeking students who are classified as freshmen, sophomores, juniors, seniors, or post-baccalaureate. Also the sum of lower and upper division undergraduates.
Courses taught at the junior and senior levels.
The University of Texas at Tyler2003-04 Fact Book


