129
The UPC Holding Group Combined Financial Statements December 31, 2020

The UPC Holding Group
Combined Financial StatementsDecember 31, 2020

The UPC Holding Group
TABLE OF CONTENTS
Page
NumberPART I
Forward-looking Statements............................................................................................................................................ I-1Business............................................................................................................................................................................ I-2Risk Factors...................................................................................................................................................................... I-20
PART IIIndependent Auditors’ Report.......................................................................................................................................... II-1Combined Balance Sheets as of December 31, 2020 and 2019....................................................................................... II-3Combined Statements of Operations for the Years Ended December 31, 2020, 2019 and 2018.................................... II-5Combined Statements of Comprehensive Earnings (Loss) for the Years Ended December 31, 2020, 2019 and 2018... II-6Combined Statements of Equity (Deficit) for the Years Ended December 31, 2020, 2019 and 2018............................. II-7Combined Statements of Cash Flows for the Years Ended December 31, 2020, 2019 and 2018 .................................. II-10Notes to Combined Financial Statements........................................................................................................................ II-12Management’s Discussion and Analysis of Financial Condition and Results of Operations.......................................... II-58
EXHIBITSelected Unaudited Pro Forma Financial Information..................................................................................................... III-1

PART I
FORWARD-LOOKING STATEMENTS
Certain statements in this annual report constitute forward-looking statements. To the extent that statements in this annual report are not recitations of historical fact, such statements constitute forward-looking statements, which, by definition, involve risks and uncertainties that could cause actual results to differ materially from those expressed or implied by such statements. In particular, statements under Item I. Business, Item IA. Risk Factors and Part II. Management’s Discussion and Analysis of Financial Condition and Results of Operations may contain forward-looking statements, including statements regarding our business, product, foreign currency and finance strategies, our property and equipment additions (including any future network extensions), subscriber growth and retention rates, competitive, regulatory and economic factors, the timing and impacts of proposed transactions, the maturity of our markets, the potential impact of the recent outbreak of a novel strain of the coronavirus (COVID-19) on our company, the anticipated impacts of new legislation (or changes to existing rules and regulations), anticipated changes in our revenue, costs or growth rates, our liquidity, credit risks, foreign currency risks, interest rate risks, target leverage levels, debt covenants, our future projected contractual commitments and cash flows and other information and statements that are not historical fact. Where, in any forward-looking statement, we express an expectation or belief as to future results or events, such expectation or belief is expressed in good faith and believed to have a reasonable basis, but there can be no assurance that the expectation or belief will result or be achieved or accomplished. In evaluating these statements, you should consider the risks and uncertainties discussed under Item IA. Risk Factors, as well as the following list and those described herein, as some but not all of the factors that could cause actual results or events to differ materially from anticipated results or events:
• economic and business conditions and industry trends in the countries in which we operate;
• the competitive environment in the industries in the countries in which we operate, including competitor responses to our products and services;
• fluctuations in currency exchange rates and interest rates;
• instability in global financial markets, including sovereign debt issues and related fiscal reforms;
• consumer disposable income and spending levels, including the availability and amount of individual consumer debt;
• changes in consumer television viewing and broadband usage preferences and habits;
• consumer acceptance of our existing service offerings, including our cable television, broadband internet, fixed-line telephony, mobile and business service offerings, and of new technology, programming alternatives and other products and services that we may offer in the future;
• our ability to manage rapid technological changes;
• our ability to maintain or increase the number of subscriptions to our cable television, broadband internet, fixed-line telephony and mobile service offerings and our average revenue per household;
• our ability to provide satisfactory customer service, including support for new and evolving products and services;
• our ability to maintain or increase rates to our subscribers or to pass through increased costs to our subscribers;
• the impact of our future financial performance, or market conditions generally, on the availability, terms and deployment of capital;
• changes in, or failure or inability to comply with, government regulations in the countries in which we operate and adverse outcomes from regulatory proceedings;
• government intervention that requires opening our broadband distribution networks to competitors;
• our ability to obtain regulatory approval and satisfy other conditions necessary to close acquisitions and dispositions and the impact of conditions imposed by competition and other regulatory authorities in connection with acquisitions;
• our ability to successfully acquire new businesses and, if acquired, to integrate, realize anticipated efficiencies from and implement our business plan with respect to the businesses we have acquired or that we expect to acquire;
• changes in laws or treaties relating to taxation, or the interpretation thereof, in countries in which we operate;
• changes in laws and government regulations that may impact the availability and cost of capital and the derivative instruments that hedge certain of our financial risks;
I-1

• the ability of suppliers and vendors (including our third-party wireless network providers under our mobile virtual network operator (MVNO) arrangements) to timely deliver quality products, equipment, software, services and access;
• the availability of attractive programming for our video services and the costs associated with such programming, including retransmission and copyright fees payable to public and private broadcasters;
• uncertainties inherent in the development and integration of new business lines and business strategies;
• our ability to adequately forecast and plan future network requirements, including the costs and benefits associated with any planned network extensions;
• the availability of capital for the acquisition and/or development of telecommunications networks and services;
• problems we may discover post-closing with the operations, including the internal controls and financial reporting process, of businesses we acquire;
• the leakage of sensitive customer data;
• the outcome of any pending or threatened litigation;
• the loss of key employees and the availability of qualified personnel;
• changes in the nature of key strategic relationships with partners and joint venturers; and
• events that are outside of our control, such as political unrest in international markets, terrorist attacks, malicious human acts, natural disasters, epidemics, pandemics (such as COVID-19) and other similar events.
The broadband distribution and mobile service industries are changing rapidly and, therefore, the forward-looking statements of expectations, plans and intent in this annual report are subject to a significant degree of risk. These forward-looking statements and the above-described risks, uncertainties and other factors speak only as of the date of this annual report, and we expressly disclaim any obligation or undertaking to disseminate any updates or revisions to any forward-looking statement contained herein, to reflect any change in our expectations with regard thereto, or any other change in events, conditions or circumstances on which any such statement is based. Readers are cautioned not to place undue reliance on any forward-looking statement.
BUSINESS
In the following text, the terms, “we”, “our”, “our company” and “us” may refer, as the context requires, to UPC Holding, or collectively to the UPC Holding Group, each as defined and described below. Unless otherwise indicated, operational and statistical data, including subscriber statistics and product offerings, are as of December 31, 2020.
Introduction
UPC Holding B.V. (UPC Holding), UPC Slovakia Holding I B.V. (UPC Slovakia) and UPC Poland Holding B.V. (UPC Poland) are wholly-owned subsidiaries of Liberty Global plc (Liberty Global). The accompanying discussion includes the historical financial information of UPC Holding and its subsidiaries, UPC Slovakia and its subsidiaries (Slovakia) and UPC Poland and its subsidiaries (Poland) (collectively, the UPC Holding Group).
The UPC Holding Group is a leading converged video, broadband and communications company operating in Switzerland, Poland and Slovakia, with a commitment to providing our customers the “best in class” communications and entertainment services. These services are delivered to our residential and business customers over our networks and include broadband internet, video, telephony and mobile services. We design our services to enable our customers to access the digital world on their own terms and at their own pace. Offering “best in class” connectivity is at the core of our strategy. Today, our extensive broadband network enables us to deliver ultra-high-speed internet service across our markets, be it through fiber, cable or mobile technology. We are striving to extend our reach and reinforce our speed leadership. In most of our footprint we offer converged fixed and mobile experiences in and out of the home, and it is our ambition to further enhance this proposition and make it available to all our customers. In terms of video subscribers, we operate the largest cable network in each of these countries, except in Poland, where we operate the second largest cable network.
We deliver mobile services to our customers (i) in Switzerland as a mobile network operator, as well as a MVNO through third-party networks pursuant to a legacy contract prior to the Sunrise Acquisition (as defined below) and (ii) in Poland as a MVNO.
I-2

Liberty Global is an international converged broadband internet, video, fixed-line telephony and mobile services company operating under the consumer brands Virgin Media, Telenet, UPC, the combined Sunrise UPC, as described below, as well as VodafoneZiggo, which is owned through a 50/50 joint venture. Liberty Global’s substantial scale and commitment to innovation enable it to invest in the infrastructure and digital platforms that empower its customers to make the most of the digital revolution. Liberty Global delivers market-leading products through next-generation networks that connect customers subscribing to 49 million (at December 31, 2020) broadband internet, video, fixed-line telephony and mobile services across its brands. Liberty Global also has significant investments in ITV, All3Media, CANAL+ Polska, LionsGate, the Formula E racing series and several regional sports networks.
On November 11, 2020, Liberty Global (through a subsidiary within the UPC Holding Group) completed the acquisition of Sunrise Communications Group AG (Sunrise) through the settlement of an all cash public tender offer of the outstanding shares of Sunrise (the “Sunrise Acquisition”). As of December 31, 2020, we hold 98.9% of the share capital of Sunrise and have initiated a statutory “squeeze-out” procedure according to applicable Swiss law pursuant to which we will acquire the remaining Sunrise shares that we do not yet own. This “squeeze-out” procedure is expected to be completed during the first half of 2021.
Our existing operations in Switzerland (UPC Switzerland) and Sunrise are referred to throughout the document as “Sunrise UPC”; however the two entities are currently operating independently until the statutory “squeeze-out” procedure under Swiss law is completed and the entities can fully integrate. For more information, see note 5 to our combined financial statements included in Part II of this annual report.
Operating Statistics
The following table presents certain operating statistics of our combined entities as of December 31, 2020:
Switzerland (9) Poland Slovakia CombinedCABLE
FootprintHomes Passed1........................................................................ 2,406,300 3,635,200 624,300 6,665,800
Fixed-Line Customer Relationships2
Fixed-line Customer Relationships......................................... 1,477,400 1,525,000 190,600 3,193,000 RGUs per Customer Relationship........................................... 2.28 2.14 2.12 2.20
Subscribers (RGUs)3
Internet4................................................................................... 1,135,800 1,289,700 144,000 2,569,500 Video5..................................................................................... 1,235,500 1,334,800 170,900 2,741,200 Telephony6.............................................................................. 996,600 643,000 88,900 1,728,500
Total RGUs......................................................................... 3,367,900 3,267,500 403,800 7,039,200
Customer BundlingFixed-mobile Convergence7................................................... 53.2 % 4.2 % — % 25.6 %
Single-Play................................................................................ 24.7 % 22.2 % 31.6 % 24.0 %Double-Play............................................................................... 22.6 % 41.3 % 24.9 % 31.6 %Triple-Play................................................................................. 52.7 % 36.5 % 43.5 % 44.4 %
MOBILEMobile Subscribers8
Postpaid................................................................................... 1,705,400 62,700 — 1,768,100 Prepaid.................................................................................... 475,900 — — 475,900
Total Mobile subscribers...................................................... 2,181,300 62,700 — 2,244,000 _______________
(1) Homes Passed are homes, residential multiple dwelling units or commercial units that can be connected to our networks without materially extending the distribution plant. Certain of our Homes Passed counts are based on census
I-3

data that can change based on either revisions to the data or from new census results. Due to the fact that we do not own the partner networks (as defined below) used in Switzerland (see note 9 below), we do not report homes passed for Switzerland’s partner networks.
(2) Fixed-Line Customer Relationships are the number of customers who receive at least one of our internet, video or telephony services that we count as Revenue Generating Units (“RGUs”), without regard to which or to how many services they subscribe. Fixed-Line Customer Relationships generally are counted on a unique premises basis. Accordingly, if an individual receives our services in two premises (e.g., a primary home and a vacation home), that individual generally will count as two Fixed-Line Customer Relationships. We exclude mobile-only customers from Fixed-Line Customer Relationships.
(3) RGU is separately a Basic Video Subscriber, Enhanced Video Subscriber, Internet Subscriber or Telephony Subscriber (each as defined and described below). A home, residential multiple dwelling unit, or commercial unit may contain one or more RGUs. For example, if a residential customer subscribed to our enhanced video service, fixed-line telephony service and broadband internet service, the customer would constitute three RGUs. Total RGUs is the sum of Basic Video, Enhanced Video, Internet and Telephony Subscribers. RGUs generally are counted on a unique premises basis such that a given premises does not count as more than one RGU for any given service. On the other hand, if an individual receives one of our services in two premises (e.g., a primary home and a vacation home), that individual will count as two RGUs for that service. Each bundled cable, internet or telephony service is counted as a separate RGU regardless of the nature of any bundling discount or promotion. Non-paying subscribers are counted as subscribers during their free promotional service period. Some of these subscribers may choose to disconnect after their free service period. Services offered without charge on a long-term basis (e.g., VIP subscribers or free service to employees) generally are not counted as RGUs. We do not include subscriptions to mobile services in our externally reported RGU counts. In this regard, our RGU counts exclude our separately reported postpaid and prepaid mobile subscribers.
(4) Internet Subscriber is a home, residential multiple dwelling unit or commercial unit that receives internet services over our networks, or that we service through a partner network. In Switzerland, we offer a 10 Mbps internet service to our Basic and Enhanced Video Subscribers without an incremental recurring fee. Our Internet Subscribers in Switzerland include 51,500 subscribers who have requested and received this service.
(5) Basic Video Subscriber is a home, residential multiple dwelling unit or commercial unit that receives our video service over our broadband network or through a partner network either via an analog video signal or via a digital video signal without subscribing to any recurring monthly service that requires the use of encryption-enabling technology. Encryption-enabling technology includes smart cards, or other integrated or virtual technologies that we use to provide our enhanced service offerings. We count RGUs on a unique premises basis. In other words, a subscriber with multiple outlets in one premises is counted as one RGU and a subscriber with two homes and a subscription to our video service at each home is counted as two RGUs. We have approximately 30,600 “lifeline” customers that are counted on a per connection basis, representing the least expensive regulated tier of video cable service, with only a few channels.
(6) Enhanced Video Subscriber is a home, residential multiple dwelling unit or commercial unit that receives our video service over our broadband network or through a partner network via a digital video signal while subscribing to any recurring monthly service that requires the use of encryption-enabling technology. Enhanced Video Subscribers are counted on a unique premises basis. For example, a subscriber with one or more set-top boxes that receives our video service in one premises is generally counted as just one subscriber. An Enhanced Video Subscriber is not counted as a Basic Video Subscriber. As we migrate customers from basic to enhanced video services, we report a decrease in our Basic Video Subscribers equal to the increase in our Enhanced Video Subscribers. Subscribers to enhanced video services provided by our operations in Switzerland over partner networks largely receive basic video services from the partner networks as opposed to our operations.
(7) Telephony Subscriber is a home, residential multiple dwelling unit or commercial unit that receives voice services over our networks, or that we service through a partner network. Telephony Subscribers exclude mobile telephony subscribers. In Switzerland, we offer a basic phone service to our Basic and Enhanced Video Subscribers without an incremental recurring fee. Our Telephony Subscribers in Switzerland include 202,800 subscribers who have requested and received this service.
(8) Our Mobile Subscriber count represents the number of active subscriber identification module (SIM) cards in service rather than services provided. For example, if a mobile subscriber has both a data and voice plan on a smartphone this would equate to one mobile subscriber. Alternatively, a subscriber who has a voice and data plan for a mobile handset and a data plan for a laptop would be counted as two mobile subscribers. Customers who do not pay a recurring monthly fee are excluded from our mobile subscriber counts after periods of inactivity ranging from 30 to 90 days,
I-4

based on industry standards within the respective country. In Switzerland, our mobile subscribers receive mobile services pursuant to prepaid contracts, which amounted to 475,900 prepaid subscribers as of December 31, 2020.
(9) Pursuant to service agreements, Switzerland offers broadband internet, video and telephony services over networks owned by third-party cable operators (“partner networks”). A partner network RGU is only recognized if there is a direct billing relationship with the customer. At December 31, 2020, Switzerland’s partner networks accounted for 118,100 Fixed-Line Customer Relationships, 300,800 RGUs, which include 110,000 Internet Subscribers, 105,100 Video Subscribers and 85,700 Telephony Subscribers. Subscribers to our enhanced video services provided over partner networks largely receive basic video services from the partner networks as opposed to our operations. Due to the fact that we do not own these partner networks, we do not include the 657,300 homes passed by Switzerland’s partner networks at December 31, 2020. In addition, with the completion of the Sunrise Acquisition, we now service homes through Sunrise's existing agreements with Swisscom AG (Swisscom), Swiss Fibre Net and local utilities, which are not included in Switzerland's homes passed count. Including these arrangements, our operations in Switzerland have the ability to offer fixed services to a national footprint.
Additional General Notes to Table:
Most of our operations provide broadband internet, video, telephony, mobile, data or other business services. Certain of our business service revenue is derived from small or home office (“SOHO”) subscribers that pay a premium price to receive enhanced service levels along with video, internet or telephony services that are the same or similar to the mass marketed products offered to our residential subscribers. All mass marketed products provided to SOHOs, whether or not accompanied by enhanced service levels and/or premium prices, are included in the respective RGU and customer counts of our broadband communications operations, with only those services provided at premium prices considered to be “SOHO RGUs” or “SOHO customers”. To the extent our existing customers upgrade from a residential product offering to a SOHO product offering, the number of SOHO RGUs or SOHO customers will increase, but there is no impact to our total RGU or customer counts. With the exception of our business SOHO subscribers, we generally do not count customers of business services as customers or RGUs for external reporting purposes.
While we take appropriate steps to ensure that subscriber statistics are presented on a consistent and accurate basis at any given balance sheet date, the variability from country to country in (i) the nature and pricing of products and services, (ii) the distribution platform, (iii) billing systems, (iv) bad debt collection experience and (v) other factors add complexity to the subscriber counting process. We periodically review our subscriber counting policies and underlying systems to improve the accuracy and consistency of the data reported on a prospective basis. Accordingly, we may from time to time make appropriate adjustments to our subscriber statistics based on those reviews.
Subscriber information for acquired entities is preliminary and subject to adjustment until we have completed our review of such information and determined that it is presented in accordance with our policies.
Products and Services
Our main products and services are WiFi and internet services, video, mobile, and telephony services.
Intelligent WiFi and Internet Services
Connectivity is a critical building block for vibrant communities. As highlighted by the current COVID-19 pandemic, all aspects of society, including families, businesses, education and healthcare, to name a few, rely heavily on connectivity and the digital services that depend on it. To meet our customers’ expectations of seamless connectivity, we are developing a fully digital, cloud based “Connectivity Ecosystem” built on top of our fiber-rich fixed broadband network and recently expanded mobile network. The Connectivity Ecosystem is orchestrated by a fully cloud-based digital journey, enabling fast and flexible introduction of new hardware and services, as well as cloud to cloud open API integration, simplifying the on-boarding of new services and devices. The devices used within our Connectivity Ecosystem are connected and protected through our security gateway and VPN, both at home and on the go. At home, our customers can benefit from the gigabit speeds enabled by our “Connect Box” (as described below), as well as “Intelligent WiFi”, which has optimization functionalities, such as the ability to adapt to the number of people and devices online at any given time in order to improve and extend wireless connectivity reach and speeds. In addition, we introduced our first “Smart Home” bundles in select markets, enabling those customers to take their smart home ambitions to the next level, including enhanced entertainment, home automation and home security. Finally, our “Connect App” is the digital touchpoint that allows customers to access and manage all of our services. The full suite of the Connectivity Ecosystem is live in our Switzerland market, and we intend to expand availability in other select markets during the first quarter of 2021.
I-5

Our “Connect Box” is our next generation intelligent WiFi and telephony gateway that enables us to maximize the impact of our ultrafast broadband networks by providing reliable wireless connectivity anywhere in the home. This gateway can be self-installed and allows customers to customize their home WiFi service. Our Connect Box is available in all our markets, and as of December 2020, approximately 1.4 million of our customers have a Connect Box. Robust wireless connectivity is increasingly important with our customers spending more and more time using bandwidth-heavy services on multiple devices. In Switzerland, we also offer our Connect App that, among other things, allows our customers to find their best WiFi access. In addition, we provide intelligent WiFi boosters, which increase speed, reliability and coverage by adapting to the environment at home. We also brought to market and are looking to expand the availability of our new Gigabit Connect Box based on DOCSIS 3.1 technology that provides even better in-home WiFi service to customers.
Internet speed is of crucial importance to our customers, as they spend more time streaming video and other bandwidth-heavy services on multiple devices. Our extensive broadband network enables us to deliver ultra-high-speed internet service across our markets. Our residential subscribers access the internet via cable modems connected to their internet capable devices, or wirelessly via a WiFi gateway device. We offer multiple tiers of broadband internet service, up to 1 Gbps. The speed of service depends on the location and the tier of service selected.
We offer value-added broadband services in certain of our markets for an incremental charge. These services include Intelligent WiFi features, security (e.g., anti-virus, anti-spyware, firewall and spam protection), Smart Home services, and online storage solutions and web spaces. Subscribers to our internet service pay a monthly fee based on the tier of service selected. In addition to the monthly fee, customers pay an activation service fee upon subscribing to an internet service. This one-time fee may be waived for promotional reasons. We determine pricing for each different tier of internet service through an analysis of speed, market conditions and other factors.
In all of our markets, we have deployed community WiFi via routers in the home (the “Community WiFi”), which provides secure access to the internet for our customers. Community WiFi is enabled by a cable modem WiFi access point (“WiFi modem”) in a Connect Box of our internet customers. The Community WiFi is created through the sharing of access to the public channel of our customers’ home wireless routers. The public channel is a separate network from the secure private network used by the customer within the home and is automatically enabled when the WiFi modem is installed. Public WiFi access points (covering train stations, hotels, bars, restaurants and other public places) are also available for no additional cost.
We continue to expand our Community WiFi service throughout our markets. In Switzerland and Poland, we are expanding our Community WiFi through access points covering public places. Our Community WiFi is branded as “Wi-Free” in most of our markets. Through an agreement with Comcast Corporation, our internet customers will also have access to millions of WiFi access points across various European countries for no additional cost.
Video Services
Our video service is, and continues to be, one of the foundations of our product offerings in our markets. Our cable operations offer multiple tiers of digital video programming and audio services, starting with a basic video service. Subscribers to our basic video service pay a fixed monthly fee and receive digital or analog video channels (including a limited number of high definition (“HD”) and ultra-high definition 4K resolution (“4K”) channels) and several digital and analog radio channels, as well as an electronic programming guide. In Poland, where our basic digital service is unencrypted, the cost of our digital service is the same cost as the monthly fee of our analog service. In the markets where we encrypt our basic digital service, our digital service is generally offered at an incremental cost equal to or slightly higher than the monthly fee for our basic analog service. We tailor our video services in each country of operation based on programming preferences, culture, demographics and local regulatory requirements.
We also offer a variety of premium channel packages to meet the special interests of our subscribers. For an additional monthly charge, a subscriber may upgrade to one of our extended digital tier services and receive an increased number of video and radio channels, including the channels in the basic tier service and additional HD and 4K channels. Our channel offerings include general entertainment, sports, movies, documentaries, lifestyles, news, adult, children and ethnic and foreign channels. Subscribers to our digital services also receive the channels available through our analog service. We offer limited analog services in Poland and Slovakia, but not in Switzerland. In all of our broadband operations, we continue to upgrade our systems to expand our digital services and encourage our analog subscribers to convert to a digital or premium digital service.
I-6
Discounts to our monthly service fees are available to any subscriber who selects a bundle of two or more of our services (bundled services): video, internet, fixed-line telephony and, in most of our markets, mobile services. Bundled services consist of double-play for two services, triple-play for three services and, where available, quad-play for four services.
To meet customer demands, we have enhanced our video services with additional relevant content services and features, which increase viewing comfort and address individual user needs. Our latest next generation product suite is called “Horizon 4”, a multi-screen entertainment platform that combines linear television (including recording and Replay TV features), premium video-on-demand (“VoD”) offerings, an increasing amount of integrated premium video apps and mobile viewing into one entertainment experience. Horizon 4 comes with a state of the art user interface that is intuitively easy to navigate. Content recommendations and favorite channel settings can be customized to individual user profiles. Video playback control, such as pause and resume, navigation shortcuts and content searches can all be conducted via a voice control button on the remote control, a feature highly appreciated by our customers. Horizon 4 is available in Switzerland and Poland, which have the latest set top boxes capable of delivering 4K video content and achieved significant positive customer feedback, manifesting in high product net promoter score (“NPS”) figures. Horizon 4 is marketed under the name “UPC TV” in Switzerland and “UPC TV 4K Box” in Poland. The predecessor version of Horizon 4, Horizon 3, is deployed on set-top boxes in Switzerland. In Switzerland these set-top boxes will continue to be exchanged for the latest hardware with Horizon 4 over time. In Slovakia, we provide a Horizon 4-like experience through a remote upgrade of the software on the customer’s set-top box. After the upgrade, these boxes offer several features of the Horizon 4 product. We refer to this upgrade as “Horizon Lite”, although it is locally marketed as Horizon 4. Some of the Horizon 4 features are not available on our Horizon Lite systems, such as recommendation-based content and the ability to access video content on other devices in the home. We intend to (i) expand the availability of Horizon 4 to other markets within our footprint and (ii) continue to improve the Horizon 4 user experience with new functionality and software updates.
One of our key video services is “Replay TV”. Through Replay TV, the last seven days of content is made available via the electronic programming guide (“EPG”) for on demand viewing. Customers can simply open the EPG, scroll back and replay linear programming instantly. Replay TV also allows our customers to replay a television program from the start even while the live broadcast is in progress. Additionally, customers have the option of recording TV programs in the cloud. Replay TV is one of the most used and appreciated features on our platforms. Replay TV is accessible in Switzerland, Poland and Slovakia through Horizon 4 or Horizon Lite, and in some of our markets also via Horizon Go (as defined below).
In most of our markets, we offer transactional VoD giving subscribers access to thousands of movies and television series. In several of our markets, our subscription VoD service is included in our enhanced video offerings. This service is tailored to the specific market based on available content, consumer preferences and competitive offers, and includes various programming, such as music, kids, documentaries, adult, sports and TV series. We continue to develop our VoD services to provide a growing collection of programming from local and international suppliers, such as Disney/Fox, NBCU/Universal, CBS/Paramount, Warner and Sony, among others. In addition, in Switzerland we offer premium over the top (“OTT”) services like Netflix via certain of our set-top boxes.
Most of this content is also available via our online mobile app, “Horizon Go”, which is available on mobile devices (iOS, Android and Windows). Thanks to the 360 integration of Horizon 4 across multiple screens, customers can pause a program, series or movie and seamlessly continue watching from where they left off on another device, whether a television, tablet, smart phone or laptop. Additionally, Horizon Go enables customers to remotely schedule the recording of a television program on their Horizon 4 box at home.
In the summer of 2020, we launched our first IP-only streaming device in Poland, which runs the full Horizon 4 product suite and features a small dongle-like form factor that can be tucked away behind a TV screen. This all-IP TV box has extremely low power consumption, and its casing is made from recycled plastic, proudly winning us Digital TV Europe’s Video Tech Innovation Sustainability Award in December 2020. We intend to roll out the all-IP TV box to additional markets in 2021 and beyond.
Mobile Services
Mobile services are another key building block for us to provide customers with seamless connectivity. Sunrise UPC offers mobile services as a mobile network provider and as a MVNO over a third-party network pursuant to a legacy contract with Swisscom prior to the Sunrise Acquisition. UPC Poland also offers mobile services as a MVNO. Where mobile telephony services are provided via MVNOs, the relevant mobile operator leases a third-party’s radio access network and owns the core network, including switching, backbone and interconnections. These arrangements permit us to offer our customers in these markets mobile services without having to build and operate a cellular radio tower network. Our MVNO partners are Swisscom
I-7

in Switzerland and Orange/Play in Poland. Our Switzerland operations completed migration to the Swisscom network in the beginning of 2019 and also have access to the Sunrise network as a mobile network operator.
Where mobile services are available, subscribers pay varying monthly fees depending on whether the mobile service is combined with our cable services or includes mobile data services via mobile phones, tablets or laptops. We offer our customers the option to purchase mobile handsets, in most of our markets, to make such purchase pursuant to a contract independent of their mobile services contract. We refer to these arrangements as split contracts.
Our mobile services typically include voice, short message service (or “SMS”) and internet access. Calls, both within and out of network, incur a charge or are covered under a postpaid monthly service plan. Our mobile services are primarily on a postpaid basis with customers subscribing to services for periods ranging from activation for a SIM-only contract to up to twenty-four months, with the latter often taken with a subsidized mobile handset. In Switzerland, however, our postpaid service is offered without a minimum contract term. In almost all of our markets, subscribers to a double- or triple-play bundle receive a discount on their mobile service fee.
Telephony Services
Multi-feature telephony services are available through voice-over-internet-protocol (“VoIP”) technology in most of our broadband communication markets. We pay interconnect fees to other telephony and internet providers when calls by our subscribers terminate on another network and receive similar fees from providers when calls by their users terminate on our network through interconnection points.
Our telephony service may be selected in several of our markets on a standalone basis and in all of our markets in combination with one or more of our other services. Our telephony service includes a basic fixed-line telephony product for line rental and various calling plans, which may consist of any of the following: unlimited network, national or international calling, unlimited off-peak calling and minute packages, including calls to fixed and mobile phones. We also offer value added services, such as a personal call manager, unified messaging and a second or third phone line at an incremental cost.
Partner Networks
For over 70% of the basic video subscribers of Sunrise UPC, Sunrise UPC maintains billing relationships with landlords or housing associations and provides basic video service to the tenants. The landlord or housing association administers the billing for the basic video service with their tenants and manages service terminations for their rental units. When tenants select triple-play bundles with or without mobile service from Sunrise UPC, they then migrate to a direct billing relationship with us.
Sunrise UPC offers broadband internet, enhanced video and telephony services directly to the video cable subscribers of those partner networks that enter into service operating contracts with Sunrise UPC. Sunrise UPC has the direct customer billing relationship with these subscribers. By permitting Sunrise UPC to offer some or all of its broadband internet, enhanced video and telephony products directly to those partner network subscribers, Sunrise UPC’s service operating contracts have expanded the addressable markets for Sunrise UPC’s digital products. In exchange for the right to provide digital products directly to the partner network subscribers, Sunrise UPC pays to the partner network a share of the revenue generated from those subscribers. Sunrise UPC also provides network maintenance services and engineering and construction services to its partner networks.
Additionally, UPC Poland offers broadband internet and enhanced video services to subscribers via third party fiber optic lines to the home, cabinet or building or to the node networks (referred to herein as “FTTx”). These FTTx networks built by third party network operators are co-funded by the European Union (E.U.) as part of the Operational Programme Digital Poland, known as “POPC”. We expect to add more subscribers through this arrangement in the future.
Business Services
In addition to our residential services, we offer business services in all of our operations. For business and public sector organizations, we provide a range of voice, advanced data, video, wireless and cloud-based services, as well as mobile and converged fixed-mobile services. Our business customers include SOHO (generally up to five employees), small business and medium and large enterprises. We also provide business services on a wholesale basis to other operators.
Our business services are designed to meet the specific demands of our business customers with a wide range of services, including increased data transmission speeds and virtual private networks. These services fall into five broad categories:
I-8

• data services for fixed internet access, with a 4G connectivity backup, IP virtual private networks based on SDWAN solutions, and high capacity point-to-point services, including dedicated cloud connections;
• cloud collaboration VoIP solutions and circuit switch telephony, unified communications and conferencing options;
• wireless services for mobile voice and data, as well as managed WiFi networks;
• video programming packages and select channel lineups for targeted industries; and
• value added services, including managed security systems, cloud enabled business applications, storage and web hosting.
Our intermediate to long-term strategy is to enhance our capabilities and offerings in the business sector so we become a preferred provider in the business market. To execute this strategy, customer experience and strategic marketing play a key role.
Our business services are provided to customers at contractually established prices based on the size of the business, type of services received and the volume and duration of the service agreement. SOHO and small business customers pay business market prices on a monthly subscription basis to receive enhanced service levels and business features that support their needs. For more advanced business services, these customers generally enter into a service agreement. For medium to large business customers, we enter into individual agreements that address their needs. These agreements are generally for a period of at least one year.
Additional Business Information
Our Network
Our broadband internet, video and fixed-line telephony services are primarily transmitted over a hybrid fiber coaxial (“HFC”) cable network. This network is composed primarily of national and regional fiber networks, which are connected to the home over the last few hundred meters by coaxial cable. Alongside our HFC network, we are increasingly rolling out services based on FTTx and leveraging fixed wireless access (“FWA”) technologies to service customers not covered by our fixed networks in areas where it may not be cost effective to deploy fixed networks.
We closely monitor our network capacity and customer usage. Where necessary, we increase our capacity incrementally, for instance by splitting nodes in our cable network. We also continue to explore improvements to our services and new technologies that will enhance our customer’s connected entertainment experience. These actions include:
• recapturing bandwidth and optimizing our networks by:
° increasing the number of optical nodes in our markets;
° increasing the bandwidth of our hybrid fiber coaxial cable network to 1 GHz and further;
° converting analog channels to digital;
° moving video channels to IP delivery;
◦ deploying additional DOCSIS 3.1 capacity;
◦ replacing copper lines with modern optical fibers; and
◦ using video compression technologies.
• freeing spectrum for high-speed internet, VoD and other services by encouraging customers to move from analog to digital services;
• increasing the efficiency of our networks by moving headend functions (encoding, transcoding and multiplexing) to cloud storage systems;
• deploying converged interconnect network allowing for fixed (FTTH and HFC) and mobile business to consumer and business to business services to optimally use our large fiber optic network infrastructure;
• enhancing our network to accommodate additional business services;
• using wireless technologies to extend our services outside of the home;
• offering remote access to our video services through laptops, smart phones and tablets;
I-9

• expanding the availability of Horizon TV, as well as Horizon 4, and related products and developing and introducing online media sharing and streaming or cloud-based video; and
• developing and testing new technologies (such as Low Latency DOCSIS, DOCSIS 4.0, PON on a stick and millimeter wave backhauling).
We are expanding our HFC and FTTH footprint through our network extension program. In addition, we are seeking mobile service opportunities where we have established cable networks and expanding our fixed-line networks where we have a strong mobile offering. This will allow us to offer converged fixed-line and mobile services to our customers.
We deliver high-speed data and fixed-line telephony over our broadband network in our markets. The cable networks of our operations are connected to our “Aorta” backbone. The Aorta backbone is recognized as a Tier 1 Carrier, which permits us to serve our customers through settlement free collaboration with other carriers without the cost of using a third-party network.
In support of our connectivity strategy, we are moving our customers into a gigabit society. All of our broadband networks are already capable of supporting the next generation of ultra-high-speed internet service at gigabit speeds. To provide these speeds to our subscribers, we launched our next generation gateways that will enable DOCSIS 3.1 technology throughout our footprint. The use of DOCSIS 3.1 technology provides us significantly higher efficiencies on our networks and allow us to offer faster speeds, better latency, higher reliability, latest in-home WiFi standards and better services in general. The new gateways and the continued upgrades to our network in the coming years will allow us to maximize high-speed connectivity over our broadband networks and deliver gigabit services in a cost-effective manner. It will also allow us to meet the expectations of our customers for high-speed internet access both in cities and rural areas of our footprint. While DOCSIS 3.1 technology will provide up to 2.5 Gbps, we are looking beyond our currently deployed technologies to DOCSIS 4.0 and FTTH / XGS-PON, which will enable 10 Gbps and beyond. As such, we are actively deploying FTTH using XGS-PON in markets like Switzerland and G-PON in Poland, allowing us to delivery low latency symmetrical services up to 10 Gbps.
Supply Sources
Content. In our markets, entertainment platforms remain a key part of the telecommunication services bundle. Therefore, in addition to providing services that allow our customers to view programming when and where they want, we are investing in content that customers want. Our content strategy is based on:
• proposition (exceeding our customers' entertainment desires and expectations);
• product (delivering the best content available);
• procurement (investment in the best brands, shows and sports); and
• partnering (strategic alignment, acquisitions and growth opportunities).
We license almost all of our programming and on-demand offerings from content providers and third-party rights holders, including broadcasters, collective rights management organizations and cable programming networks. Under our distribution agreements, we generally pay a monthly fee on a per channel or per subscriber basis, with occasional minimum pay guarantees. For on-demand programming, we generally pay a revenue share for transactional VoD (occasionally with minimum guarantees) and a flat fee or a monthly fee per subscriber for subscription VoD. For a majority of our agreements, we seek to include the rights to offer the licensed programming to our customers through multiple delivery platforms and through our apps for smart phones and tablets.
In seeking licenses for content, we partner with leading international and regional pay television providers, such as Disney/Fox, Warner Media (including HBO), AMC, Discovery/TVN, Polsat and CME. We also seek to carry key public and private broadcasters and we acquire premium programming through select relationships with companies such as Sky plc, Canal+ and SPI. For our VoD services, we license a variety of programming, including box sets of television series, movies, music, kids’ programming and documentaries. In addition, we currently have an arrangement with Netflix International B.V. (“Netflix”), pursuant to which the Netflix service is available via certain of our set-top boxes to our video customers in Switzerland as a premium OTT service.
Exclusive content is another element of our content strategy. To support this approach, we are investing in content assets. For example, we launched MySports in Switzerland in 2017, based on exclusive live hockey from the Swiss leagues. Sunrise UPC licenses MySports to other platforms in Switzerland.
I-10

Customer Premises Equipment. We purchase each type of customer premises equipment from a number of different suppliers, with at least two or more suppliers providing our high-volume products. Customer premises equipment includes set-top boxes, modems, WiFi routers and boosters, digital video recorders (“DVRs”), tuners and similar devices. For each type of equipment, we retain specialists to provide customer support. For our broadband services, we use a variety of suppliers for our network equipment and the various services we offer. Similarly, we use a variety of suppliers for mobile handsets to offer our customers mobile services.
Software Licenses. We license software products, including email and security software, and content, such as news feeds, from several suppliers for our internet services. The agreements for these products require us to pay a per subscriber fee for software licenses and a share of advertising revenue for content licenses. For our mobile network operations and our fixed-line telephony services, we license software products, such as voicemail, text messaging and caller ID, from a variety of suppliers. For these licenses we seek to enter into long-term contracts, which generally require us to pay based on usage of the services.
Access Arrangements. For our mobile services provided through MVNO arrangements, we are dependent on third-party wireless network providers. Each of our MVNO operations has an agreement with such a provider to carry the mobile communications traffic of our customers. We seek to enter into medium to long-term arrangements for these services. Any termination of these arrangements could significantly impact our mobile services.
Competition
All of our businesses operate in highly competitive and rapidly evolving markets. The speed of technological advances and product innovations is likely to continue to increase, giving customers many options for telecommunications services. Our customers want access to high quality telecommunication products that provide seamless connectivity and experience. Accordingly, our ability to offer converged services (video, internet, fixed telephony and mobile) is a key component of our strategy. In many of our markets, we compete with companies that provide converged mobile and fixed-line services, as well as companies that are established in one or more communication products. Consequently, our businesses face significant competition. In all markets, we seek to differentiate our offerings by focusing on delivering quality high-speed internet at competitive prices and providing excellent customer service. In this section, we begin with an overview on the competitive nature of the broadband internet, video and mobile and fixed-line telephony services in our markets, and then provide information on key competitors in our more material markets.
We believe that our deep-fiber access provides us with several competitive advantages. For instance, our cable networks enable concurrent delivery of internet access, together with real-time television and VoD content, without impairing our high-speed internet service. In addition, our cable infrastructure allows us to provide triple-play bundled services of broadband internet, television and fixed-line telephony services without relying on a third-party service provider or network. Where mobile is available, our networks, together with our deep fiber access, allow us to provide a comprehensive set of converged mobile and fixed-line services. Our capacity is designed to support peak consumer demand, and our networks have been resilient despite significantly increased demand during the COVID-19 pandemic. In serving the business market, many aspects of the network can be leveraged at very low incremental costs given that business demand peaks at a time when consumer demand is low, and peaks at lower levels than consumer demand.
Overall, we are experiencing increased convergence as customers look to receive all their media and communication services from one provider. Each of our competitors has extensive resources, allowing them to offer competitively priced bundled services. As a result, our ability to offer triple-play or quad-play bundles and fixed-mobile convergence bundles is one of our key strategies to attract and retain customers. We seek to distinguish ourselves through our multimedia gateway services, interactive video products (such as Replay TV and VoD), proprietary sports offerings, expanded content offers (for both in and out of the home) and our high-speed connectivity services backed by intelligent in-home WiFi solutions.
Internet
With respect to broadband internet services and online content, our businesses face competition in a rapidly evolving marketplace from incumbent and non-incumbent telecommunications companies, mobile operators and cable-based internet service providers (“ISPs”), many of which have substantial resources. The internet services offered by these competitors include both fixed-line broadband internet via cable, digital subscriber lines (“DSL”) or FTTx networks and wireless broadband. These competitors have a range of product offerings with varying speeds and pricing, as well as interactive services, data and other non-video services offered to households and businesses. With the demand for mobile internet services increasing, competition from wireless services using various advanced technologies is an important competitive factor. In Switzerland, Sunrise UPC offers 5G to customers without access to a fiber network as a way to provide those customers the highest possible speeds. In this intense competitive environment, internet speed and pricing are the key drivers for customers.
I-11

Our strategy is seamless speed leadership. Our focus is on increasing the maximum speed of our connections while providing a reliable customer experience and offering a variety of service tiers, prices, bundled products and a range of value added services, including smart in-home connectivity solutions. We update our bundles and packages on an ongoing basis to meet the needs of our customers. Our ultra-high download speed of 1 Gbps is available in all of Switzerland, as well as large parts of Poland and Slovakia. We use our competitively priced ultra-high-speed internet services with access to Community WiFi to encourage customers to switch to our services from other providers. Our aim is to safeguard our high-end customer base and enable us to become more aggressive at the low- and medium-end of the internet market. By fully utilizing up to 1 Gbps technical capabilities of DOCSIS 3.1 technology on our cable systems, we can compete with any FTTx, DSL or long-term evolution (“LTE”) players today.
In Switzerland, Swisscom is the largest provider of broadband internet services, and is Sunrise UPC’s primary competitor. It is also continuing to expand its FTTx network and roll out G.fast technology. Swisscom offers download speeds ranging from up to 50 Mbps to up to 10 Gbps, depending on the region. Swisscom continues to expand its FTTx network to Switzerland households in our footprint, as well as in our partner network footprints. It has built its FTTx network in several cities in cooperation with municipality-owned utility companies and, where no cooperation agreement has been reached, Swisscom is building its own FTTx network. Salt, a predominantly mobile player, also competes in this arena, with a focus on fixed-mobile convergence through a combination of FTTx and fixed wireless access technologies offering 10 Gbps internet speeds. In this competitive market, Sunrise UPC increased its introductory speed to 100 Mbps in line with market dynamics, is promoting its broadband services through its bundled offers and introduced a 1 Gbps service across its footprint. Moreover, the recent acquisition of Sunrise opens up vast opportunities to generate market synergies and further enhance Sunrise UPC’s competitive edge.
In Poland and Slovakia, our key competition in this product market is from the offering of broadband internet products using various FTTx and Docsis-based technologies by the incumbent players and third parties. Our principal competitors in Poland are Orange Poland, Vectra Multimedia & Netia, with top download speed offers ranging from 600 Mbps up to to 1 Gbps in parts of UPC Poland’s footprint. In Slovakia, our principal competitors are Slovak Telekom (100% owned by Deutsche Telekom AG), Orange SK and Swan offering speeds up to 1 Gbps. The introduction of cheaper and ever faster fixed-line broadband offerings is further increasing the competitive pressure in this market. A notable emerging factor is an overbuild of our networks with FTTx technology by the incumbent players and other third parties. At the moment, we do not consider our networks to be substantially overbuilt; however certain FTTx providers have announced upgrade plans that might indicate increased competition in the future. It is unclear if announced plans will be realized due to significant operational and financial challenges in rolling out FTTx. We are confident that our hybrid fiber-coaxial networks can be upgraded to higher speeds, to match or exceed potential FTTx based products.
Video Distribution
In the countries in which we operate, our video services compete primarily with traditional free-to-air (“FTA”) broadcast television services, direct-to-home (“DTH”) satellite service providers in Poland and Slovakia, where we compete with long-established satellite platforms, OTT and broadcaster VoD providers, as well as other fixed-line and mobile telecommunications carriers and broadband providers offering a similar range of video services. Many of these competitors have a national footprint and offer features, pricing and video services individually and in bundles comparable to what we offer. In certain markets, we also compete with other cable providers who have overbuilt portions of our systems.
OTT video content providers utilizing our or our competitors' high-speed internet connections are also a significant competitive factor, as are other video service providers that overlap our service areas. The OTT video providers (such as HBO Now, Amazon Prime Video, Netflix, Disney+ and AppleTV+) offer VoD service for television series, movies and programming from broadcasters. Generally, the content libraries of such services are offered for a monthly fee. Typically these services are available on multiple devices in and out of the home. To enhance our competitive position, we provide our subscribers with TV everywhere products and premium OTT video services through our online mobile apps, VoD and Replay TV services or through our arrangements with Netflix and Amazon, as well as YouTube and relevant local OTT VoD services. Our businesses also compete to varying degrees with other sources of information and entertainment, such as online entertainment, newspapers, magazines, books, live entertainment/concerts and sporting events.
Our ability to attract and retain customers depends on our continued ability to acquire appealing content, provide easy to use services on acceptable terms and to deliver content on multiple devices inside and outside the home. Some competitors, such as Swisscom in Switzerland, have obtained long-term exclusive contracts for certain programming, which limits the opportunities for other providers to offer such programs. Other competitors have obtained long-term exclusive contracts for
I-12
programs, but our operations have limited access to certain of such programming through select contracts with these companies. Moreover, telecommunication providers increasingly offer access to OTT platforms through their systems. If exclusive content offerings increase through other providers, programming options could be a deciding factor for subscribers on selecting a video service.
Similar to our technological advances in our video services (such as launches of Horizon 4, apps on third party devices and all-IP TV box), our competitors are also improving their video platforms with next generation set-top boxes, TV everywhere products and other interactive services. Similarly, VDSL technology or enhancements to very high bit rate DSL (“VDSL”) called, for instance, “vectoring”, “paring” or “bonding”, which is either provided directly by the owner of the network or by a third-party, is a significant part of the competitive environment in many of our markets, as are FTTx networks. In all of our markets, competitive video services are offered by the incumbent telecommunications operator, whose strategies include video services over DSL, VDSL and FTTx networks and, in some cases, DTH and digital terrestrial television (“DTT”). The ability of incumbent operators to offer the triple-play of broadband internet, video and fixed-line telephony services and, in most countries, a quad-play with mobile services, is exerting competitive pressure on our operations, including the pricing and bundling of our video products. In order to gain video market share, the incumbent operators and alternative service providers in a number of our larger markets are pricing their DTT, internet protocol television (“IPTV”) or DTH video packages at a discount to the retail price of the comparable digital cable service.
We compete on value by offering advanced digital services with a premier user interface, such as cloud recording and DVR functionality, HD/4K, VoD, voice control, OTT aggregation, Replay TV and multiscreen services via a superior user interface. We also compete by offering attractive content packages, as well as bundled services, at reasonable prices. In each of the countries where we operate, we tailor our packages to include attractive channel offerings and offer recurring discounts for bundled services and loyalty contracts, as well as integrated billing for OTT services. In addition, from time to time, we modify our digital channel offerings to improve the quality of our programming. Where mobile voice and data are available, we focus on our converged service offerings at attractive prices. In our other operations, we use the triple-play bundle as a means of driving video, as well as other products where convenience and price can be leveraged across the portfolio of services. We also continue to enhance our Horizon 4 platform to meet our customers’ desire to view programming anytime and anywhere, such as new applications and expanding its availability in our markets.
Sunrise UPC Competitors. Our main competitor in Switzerland is Swisscom, the incumbent telecommunications operator, which provides IPTV services over DSL, VDSL and FTTx networks. Swisscom offers VoD services, DVR and replay functionality, HD channels and has exclusive rights to distribute certain sports programming. Swisscom launched an advanced set-top box in the market with voice control, Smart Home integration and content aggregation beyond video, such as music streaming and gaming services. Although its presence is limited, Salt focuses on value propositions by including TV within their bundles and providing access to OTT via Apple TV. In this saturated market, price competition and high promotional intensity are significant factors. To compete effectively in Switzerland, Sunrise UPC is promoting Horizon 4 (marketed as “UPC TV”) and related family of products together with Replay TV and VoD, giving subscribers the ability to personalize their programming and viewing preferences while delivering excellent user interface with voice control. Sunrise UPC has its own sports channel, My Sports and aggregates third-party apps (e.g. Netflix and YouTube). Sunrise UPC uses its high-speed internet service with speeds of up to 1 Gbps to promote its extended digital bundles and offer mobile services. The recent acquisition of Sunrise is expected to further strengthen Sunrise UPC’s position in the national video market. For more information on the Sunrise Acquisition, see note 5 to our combined financial statements included in Part II of this annual report.
UPC Poland and UPC Slovakia Competitors. In providing video services, UPC Poland competes primarily with Orange Poland, Vectra Multimedia and Netia that offer triple-play services. Competition with DTH service providers (Cyfrowy Polsat SA and Canal +) are limited as they offer video services largely outside of the UPC footprint. UPC Slovakia competes primarily with quadruple-play convergent players Slovak Telekom (100% owned by Deutsche Telekom AG) and Orange SK, both offering video services through FTTx/xDSL and satellite, as well as with other internet providers such as Swan or Antik offering triple-play services through FTTx.
Mobile and Telephony Services
We substantially expanded our mobile business with the acquisition of Sunrise in Switzerland. In our other European markets, however, we currently have limited mobile presence. In the markets where we are a large mobile provider, we continue to deploy additional bandwidth to deliver our wide range of services to our customers and expand our LTE networks and 5G services. Where we are a small mobile provider, we face significant competition from other mobile telephony providers, many of whom offer LTE and 5G services and are making significant advances acquiring customers. In all of our markets, competition is intense, and in each of our markets, we face competition with a dominant fixed-line telephony provider, most of
I-13

which also have competitive mobile offers based on LTE or 5G services. In Switzerland, the key dominant telephony provider is Swisscom. Swisscom is also the largest mobile operator in Switzerland based on number of SIM cards. Our main competitors include their mobile products in bundles with fixed-line services. Moreover, there is a fundamental shift in customer preference towards mobile. As a result, we expect fixed telephony users to decline in favor of mobile connectivity.
We offer various calling plans, such as unlimited calling, national or international calling, unlimited off-peak calling and minute packages, including calls to fixed and mobile phones. In addition, we use our bundled offers with our video and ultra-high-speed internet services to gain mobile subscribers. Our ability to offer fixed-mobile convergence services is a key driver.
The market for fixed-line telephony services is saturated in almost all of our markets. Changes in market share are driven by the combination of price and quality of services provided and the inclusion of telephony services in bundled offerings. Our fixed-line telephony services compete against the incumbent telecommunications operators. In all of our markets, we also compete with other VoIP operators offering service across broadband lines. OTT telephony is another competitive factor. In addition, our businesses face competition from other cable telephony providers, FTTx-based providers or other indirect access providers.
Competition in both the residential and business fixed-line telephony markets is extremely competitive due to market trends, the offering of carrier pre-select services, number portability, the replacement of fixed-line with mobile telephony and the growth of VoIP services, as well as continued deregulation of telephony markets and general price competition. Our fixed-line telephony strategy is focused around value leadership, and we position our services as “anytime” or “any destination”. Our portfolio of calling plans include a variety of innovative calling options designed to meet the needs of our subscribers. In many of our markets, we provide product innovation, such as telephone apps that allow customers to make and receive calls from their fixed-line call packages and voice over WiFi to allow telephony even with no mobile reception. In addition, we offer varying plans to meet customer needs and, similar to our mobile services, we use our telephony bundle options with our digital video and internet services to help promote our telephony services and flat rate offers are standard.
Regulatory Matters
Overview
Video distribution, broadband internet, fixed-line telephony and mobile businesses are regulated in each of the countries in which we operate. The scope of regulation varies from country to country, although in some significant respects regulation in European markets is harmonized under the regulatory structure of the E.U.
Adverse regulatory developments could subject our businesses to a number of risks. Regulation, including conditions imposed on us by competition or other authorities as a requirement to close acquisitions or dispositions, could limit growth, revenue and the number and type of services offered, leading to increased operating costs and property and equipment additions. Moreover, regulation may restrict our operations and subject them to further competitive pressure, including pricing restrictions, interconnect and other access obligations, and restrictions or controls on content. Failure to comply with current or future regulation could expose our businesses to various penalties.
As of February 1, 2021, the E.U. includes twenty-seven member states (“Member States”); namely, Austria, Belgium, Bulgaria, Croatia, Cyprus, the Czech Republic, Denmark, Estonia, Finland, France, Germany, Greece, Hungary, Ireland, Italy, Latvia, Lithuania, Luxembourg, Malta, the Netherlands, Poland, Portugal, Romania, Slovakia, Slovenia, Spain and Sweden. As such, these countries are required to harmonize certain laws with E.U. rules by transposing directives into their national law. In addition, other types of E.U. rules (or regulations) are directly enforceable in those countries without any implementation at the national level.
Regulation in Switzerland, which is not a Member State of the E.U., is discussed separately below, as well as regulations in certain Member States in which we face regulatory issues that may have a material impact on our business.
E.U. Communications Regulation
The European Electronic Communications Code (the “Code”) is the primary source of communications regulation in the E.U. The Code came into effect on December 20, 2018 and had to be transposed by the Member States into national law by December 21, 2020. Most Member States are reported to be late with the implementation of the changes that were prescribed by the Code.
I-14

The Code primarily seeks to develop open markets for communication services within Europe. It harmonizes the rules within the E.U. for the establishment and operation of electronic communication networks, including cable television and traditional telephony networks, and the offer of electronic communication services, such as telephony (including OTT services), internet and, to some degree, television services.
Set forth below are certain key provisions included in the Code. This description is not intended to be a comprehensive or exhaustive description of all regulation in this area.
• Licensing and Exclusivity. The Code requires Member States to abolish exclusivities on communication networks and services in their territory and allow service providers into their markets based on a simple registration. The Code sets forth an exhaustive list of conditions that may be imposed on communication networks and services. Possible obligations include, among other things, financial charges for universal service or for the costs of regulation, environmental requirements, data privacy and other consumer protection rules, “must carry” obligations, provision of customer information to law enforcement agencies and access obligations.
• Significant Market Power. Specific obligations imposed by National Regulatory Authorities (“NRAs”) in E.U. Member States apply only to service providers deemed to have Significant Market Power (as defined below) in a relevant market. For purposes of the Code, a service provider has “Significant Market Power” where, either individually or jointly with others, it enjoys a position of significant economic strength, affording it the power to behave independently of competitors, customers and consumers to an appreciable extent.
As part of the implementation of certain provisions of the Code, NRAs are required to analyze certain markets predefined by the European Commission to determine if any service provider has Significant Market Power. NRAs may, however, perform analysis of other markets, applying an additional test, called the three criteria test, which looks at the competitiveness of the market during the regulatory period, existence of barriers to market entry and the sufficiency of competition law to deal with market issues.
In the event that a service provider is found to have Significant Market Power in any particular market, single or jointly with another provider, an NRA could impose certain conditions on that service provider. The European Commission has the power to veto a finding by an NRA of Significant Market Power (or the absence thereof), which power also applies with respect to market definition. The European Commission does not, however, have the power to veto any remedies, such as access obligations, imposed as a result of a finding of Significant Market Power. We have been found to have Significant Market Power in certain markets in which we operate and further findings of Significant Market Power are possible.
• Video Services. The regulation of distribution, but not the content of, television services to the public is harmonized by the Code. Member States are allowed to impose on certain service providers under their jurisdiction reasonable “must carry” obligations for the transmission of specified radio and television broadcast channels. Such obligations are required to be based on clearly defined general interest objectives, be proportionate and transparent and are subject to periodic review. We are subject to must carry regulations in all markets in which we operate, which are different among Member States. We do not expect the European Commission or the Member States to curtail such obligations in the foreseeable future.
Net Neutrality, Roaming and Call Termination
In November 2015, the European Parliament adopted the regulation on the first E.U.-wide net neutrality regime. The regulation, which is directly applicable in all Member States, permits the provision of specialized services, optimized for specific content and subjects service providers to reasonable traffic management requirements. The regulation also abolished retail roaming tariffs beginning in June 2017 and introduced wholesale roaming price caps. In 2019, the E.U. also introduced caps on wholesale rates for intra-E.U. calls (i.e. calls from the users’ Member State of residence to another Member State) to bring these in line with the wholesale roaming caps.
Call termination tariffs are set by NRAs following an assessment of the relevant mobile and fixed call termination markets. The Code introduced the system of single maximum E.U.-wide voice termination rates for fixed and mobile. On December 18, 2020, the European Commission adopted a delegated regulation directly applicable in all Member States, which sets the maximum termination rates that service providers are allowed to charge each other for mobile and fixed termination services. By 2022, all fixed service providers will be subject to a maximum fixed termination rate of €0.07 per minute and by 2024 the single maximum rate for mobile termination will be €0.20 per minute.
I-15

E.U. Broadcasting and Content Law
Although the distribution of video channels by a service provider is within the scope of the Code, the activities of a broadcaster are harmonized by other elements of E.U. law, in particular the Audiovisual Media Services Directive (“AVMSD”). The AVMSD was revised and reissued on December 18, 2018. E.U. Member States were required to implement the revised AVMSD into national law by September 19, 2020; however, a number of Member States are reported to be late with implementation.
Generally, broadcasts originating in and intended for reception within an E.U. Member State must respect the laws of that Member State. Pursuant to the AVMSD, however, E.U. Member States are required to allow broadcast signals of broadcasters established in another E.U. Member State to be freely transmitted within their territory, so long as the broadcaster complies with the law of their home state. This is referred to as the country of origin principle and applies to both linear and non-linear services. In addition, when we offer third-party VoD services on our network, it is the business of the third-party provider of the services, and not us as the distributor, that is regulated in respect of these services.
The AVMSD established quotas, applicable to both linear and non-linear services, for the transmission of European-produced programming and programs made by European producers who are independent of broadcasters. Such obligations are applicable to certain of our businesses.
Member States are also allowed to require service providers to contribute financially to the production of European works, including requiring financial contributions from VoD providers established in other territories that target audiences in their jurisdiction. Such obligations are applicable to (or are expected to become applicable to) certain of our businesses.
In addition, according to the regulation of the European Commission addressing the portability of online audiovisual content services, commercial providers of online content services (including OTT service providers) are required to enable subscribers who are temporarily present in any Member State with access and use of online content services in substantially the same manner as in the Member State of residence. Our services comply with these portability requirements.
Copyright Law
In April 2019, the European Commission adopted a new directive relating to satellite and cable retransmissions. The directive introduces a new country of origin principle in relation to online content, extends the existing copyright clearance system to other technologies (such as satellite, mobile and IPTV) and extends a similar rights clearance system to directly injected cable channels. Member States are required to transpose the majority of this directive into national law by June 2021.
Technological Regulation
The European Commission is increasingly imposing additional mandatory requirements and encouraging voluntary solutions regarding energy consumption of the telecommunications equipment we provide our customers. We have been participating in discussions and studies regarding energy consumption with the European Commission and with experts working on their behalf. In addition, we have been working to lower power consumption of our set-top boxes. We have also worked with a large group of companies to create a voluntary agreement on set-top box power consumption as an alternative to regulation, which has been formally recognized by the European Commission. Nevertheless, legislation in this area may be adopted that could adversely affect the cost and/or the functionality of equipment we deploy to customers.
Pursuant to an E.U. Regulation on standby power (the “Standby Regulation”), many devices are required to have either a low power standby mode or off mode, unless such mode is inappropriate for the intended use of the product. In particular, the Standby Regulation sets, among others, the maximum power consumption of networked consumer equipment while in the so-called “Networked Standby” mode. As a result, all of the devices we purchase and/or develop operate under the power management requirements of the Standby Regulation and are subject to audit to ensure compliance.
Also, the Radio Equipment Directive, which has been transposed into national legislation by E.U. Member States, establishes a regulatory framework for placing radio equipment on the market. Its objective is a single market for radio equipment by setting essential requirements for safety and health, electromagnetic compatibility, and the efficient use of the radio spectrum. It also provides the basis for further regulation governing some additional aspects, including technical features for the protection of privacy, personal data and fraud, interoperability, access to emergency services, and compliance regarding the combination of radio equipment and software. It also takes into account the need for improved market surveillance,
I-16
especially for the traceability obligations of manufacturers, importers and distributors. As a result, all of the devices we purchase and/or develop which contain radio interfaces (such as WiFi), must operate under these rules.
There is a Mutual Recognition Agreement established between the E.U. and Switzerland for the purpose of mutual recognition of conformity assessment of regulated products. As a result, the Standby Regulation and the Radio Equipment Directive are also applicable in Switzerland.
As part of the E.U.’s Radio Spectrum Policy Program, spectrum made available through the switch off of analog television has been approved for mobile broadband. This spectrum, known as the “digital dividend”, is in the 700 - 862 MHz band. The terms under which this spectrum becomes available varies among the European countries in which we operate. Certain uses of this spectrum may interfere with services carried on our cable networks. If this occurs, we may need to: (i) avoid using certain frequencies on our cable networks for certain or all of our services, (ii) make some changes to our networks, or (iii) change the equipment that we deploy. In approving mobile broadband, however, the Radio Spectrum Policy Program states that the new mobile services must co-exist with existing services, such as cable and DTT, to avoid harmful interference. As a result, we are in ongoing discussions with relevant Member States and the European Commission to develop mitigation techniques and to engage NRAs to launch regulatory dialog with equipment manufacturers and mobile providers to develop co-existing networks.
Other European Level Regulation
In addition to the industry-specific regimes discussed above, our operating companies must comply with a range of both specific and general legislation concerning data protection, competition, consumer protection and cybersecurity, among other matters.
In May 2018, the General Data Protection Regulation (“GDPR”) with respect to data protection and retention became effective in the E.U. The GDPR sets strict standards regarding the handling, use and retention of personal data. Organizations that fail to comply face stiff penalties. As required, our operations have implemented various measures internally and with third-party vendors to meet these requirements. In addition, in January 2017, the European Commission published a proposal for a new e-Privacy regulation, replacing the current e-Privacy Directive that regulates privacy related issues in the electronic communications sector. Negotiations among E.U. Member States are still in process, and the proposal still needs to go through the legislative process.
With respect to cybersecurity, in 2016, the E.U. adopted a directive on security of network and information systems (“NIS Directive”), which provides legal measures to boost the overall level of cybersecurity in the E.U. In principle, our operations within the E.U. do not fall under the NIS Directive as it exempts providers of Electronic Communications Services, which are governed by the E.U. telecommunications framework. Exceptions to this are some national transpositions of the NIS Directive, for instance in the Netherlands and Ireland, which require our network and communication equipment to be compliant with such obligations. In addition, in December 2020, the European Commission presented a revised version of the current NIS Directive as part of a new cybersecurity strategy. The legislative proposal seeks to expand the scope of the current NIS Directive by adding new sectors based on their criticality for the economy and society, including telecommunication providers, which would imply stricter enforcement regimes in the future. The proposal still needs to go through the legislative process and adoption by E.U. institutions.
In December 2020, the European Commission also published the Digital Services Act (“DSA”) legislative proposal to replace the 2000 E-Commerce Directive. The DSA sets clear responsibilities and accountability for providers of intermediary services, especially improving the mechanisms for the removal of illegal content and for the effective protection of users’ fundamental rights online. The DSA proposal, which complements sector-specific legislation such as the AVMSD, still needs to go through the legislative process and is expected to have limited impact on us.
Additionally, in December 2020, the European Commission published a legislative proposal concerning a new Digital Markets Act (“DMA”). The DMA aims to tackle unfair practices carried out by digital platforms acting as gatekeepers on the market and only applies to major providers of core platform services, such as search engines, social networks and online intermediation services. The DMA requires proactive action and prohibits a number of practices by such digital platforms with respect to interoperability and data sharing. The DMA proposal still needs to go through the legislative process and is expected to have limited impact on us.
Our operating companies are also subject to both national and European level regulations on competition and on consumer protection, which are broadly harmonized at the E.U. level and largely regulated under the Code. For example, while our operating companies may offer their services in bundled packages in European markets, they are sometimes not permitted to
I-17

make a subscription to one service, such as cable television, conditional upon a subscription to another service, such as telephony. They may also face restrictions on the degree to which they may discount certain products included in the bundled packages.
Switzerland
Switzerland has a regulatory system that partially reflects the principles of the E.U., but otherwise is distinct from the European regulatory system of telecommunications. The Telecommunications Act (Fernmeldegesetz) regulates, in general, the transmission of information, including the transmission of radio and television signals. Most aspects of the distribution of radio and television, however, are regulated under the Radio and Television Act (Bundesgesetz über Radio und Fernsehen). In addition, the Competition Act, the Data Protection Act and the Act on the Surveillance of Post and Telecommunications are potentially relevant to our business. With respect to energy consumption of electronic home devices, the Energy Act and the Energy Ordinance are applicable to set-top boxes and modems.
Providers of telecommunication services using resources attributed to Switzerland’s Federal Office of Communications (such as addressing elements and licensed radio frequencies) must register with the Federal Office of Communications. Dominant providers must grant access to their network to third parties, including LLU access; however, it is restricted to the copper wire network of the incumbent, Swisscom. Therefore, such unbundling obligations do not apply to our business in Switzerland and other cable operators. Also, any dominant provider must grant access to its ducts, subject to sufficient capacity being available in the relevant duct. At this time, only Swisscom has been determined to be dominant in this regard. Dominant operators are obliged to provide interconnection and all providers of services forming part of the universal service in Switzerland have to ensure interoperability of services.
In regards to call termination as part of interconnection agreements, Swisscom as market dominant provider, must offer these services at cost-oriented prices and disclose the conditions and prices for their individual access services. In interconnection agreements with Swisscom, reciprocal termination rates are imposed.
The final Telecommunications Act and corresponding ordinances were published in November 2020 and became binding on January 1, 2020, with transition periods for certain obligations (such as call filter and roaming obligations). Changes include more extensive consumer and youth protection measures (such as decreasing roaming fees, measures to prevent spoofing). In terms of net neutrality, it foresees more transparency for the customer—the customer must be informed if peer-to-peer traffic is treated unequally and traffic management measures are only allowed under certain very restrictive circumstances (e.g. to fight exceptional network congestion). In addition, customers must be informed about the quality of the internet service (both fixed and mobile internet), and providers must introduce a call filter blocking unlawful calls. New and stronger obligations were also implemented regarding roaming (such as requiring mobile providers to: offer discounted roaming packages with a validity of 12 months, bill roaming charges by the second or per kilobyte and establish maximum spend limits for all roaming services).
Under the Radio and Television Act and the corresponding ordinance, the Federal Government and the Federal Office of Communications can select up to 25 programs that have to be distributed without the cable operator being entitled to compensation. When a program is not on the mandatory distribution list, network operators must still treat all programs in an equal and non-discriminatory manner.
In September 2016, the Intelligence Agencies Act was approved by the Swiss population and became effective in September 2017. For Telecommunications service providers, the Intelligence Agencies Act set forth new obligations regulating cable traffic.
In September 2020, the Swiss Parliament adopted a revised version of the Swiss Data Protection Act (“DPA”), which provides more transparency regarding the processing of data, strengthens the individual’s information rights (e.g. if his/her data is processed in a foreign country) and follows the developments in the E.U., allowing for the continued flow of personal data from the EEA to Switzerland. The corresponding ordinances to the Swiss DPA are expected to be published for the public consultation phase in the spring of 2021.
In terms of 5G expansion developments, the network rollout is significantly hampered at different levels. On a federal level, signature collection is under way for five different people initiatives, all targeting 5G. On the cantonal level, several cantons have suspended permitting of 5G and several cantonal parliaments are requesting a moratoria for 5G and mast citing. On a communal level, several municipalities have stopped antenna permitting and/or issued planning zones, making it impossible to process permits for new antennas as well as minor changes to existing ones.
I-18

Poland
On December 6, 2018, the Polish Office of Electronic Communications (UKE) commenced proceedings to define the wholesale market for voice call termination at a fixed location. On December 11, 2019, UKE issued a decision designating UPC Poland as an operator with significant market power imposing on UPC Poland to offer call termination services at wholesale termination call rates to be determined by UKE and disclose conditions. In January 2020, UPC Poland filed an appeal; however, UKE has not issued a final decision yet. Regarding the rates, UKE has not yet issued a decision but with the E.U. delegated regulation adopted on December 18, 2020, which sets the maximum termination rates that service providers are allowed to charge each other for mobile and fixed termination services, it is expected UKE will not continue this. For more information regarding the E.U. delegated regulation, see Regulatory Matters - Net Neutrality, Roaming and Call Termination above.
On September 11, 2018, UKE issued a decision setting the conditions for access to the cable and telecommunications duct system located in multi dwelling units. According to the decision, operators, including UPC Poland, are obliged to negotiate new terms for access to ducts with the conditions set by UKE serving as default. UPC Poland appealed the decision on September 28, 2018 and the appeal was dismissed on December 9, 2020 by the Polish Competition and Consumer Protection Court. On February 1, 2021 UPC Poland initiated an appeal at the Court of Appeals. At the moment it is not clear when a ruling can be expected. Pending the appeal, operators must comply with the decision.
Similarly, on January 22, 2020, UKE issued a decision setting the conditions for access to in-building cables located in multi-dwelling units, which apply equally to all operators. Operators, including UPC Poland, are obliged to negotiate new terms for access to ducts with the conditions set by UKE serving as default. UPC Poland appealed the decision on February 26, 2020 and the appeal was dismissed on February 5, 2021 by the Provincial Administrative Court. UPC Poland applied for justification of the judgment and following the receipt of the justification, UPC Poland will consider initiating an appeal at the Supreme Administrative Court. Pending the application, operators must comply with the decision.
Real Property
We lease the facilities necessary for the operation of our business, including office space, technical support and engineering space, customer service space, network center space and other property necessary for our operations. Our combined entities and affiliates own or lease the fixed assets necessary for the operation of their respective businesses, including office space, transponder space, headend facilities, rights of way, cable television and telecommunications distribution equipment, telecommunications switches, base stations, cell towers and customer premises equipment and other property necessary for their operations. The physical components of their broadband networks require maintenance and periodic upgrades to support the new services and products they introduce. Subject to these maintenance and upgrade activities, our management believes that our current facilities are suitable and adequate for our business operations for the foreseeable future.
I-19

RISK FACTORS
In addition to the other information contained in this annual report, you should consider the following risk factors in evaluating our results of operations, financial condition, business and operations. The risk factors described in this section have been separated into four groups:
• risks that relate to the competition we face and the technology used in our businesses;
• risks that relate to operating in our markets and applicable legislative and regulatory matters;
• risks that relate to certain financial matters; and
• other risks, including risks that, among other things, relate to our management, principal shareholder and related parties.
Although we describe below and elsewhere in this annual report the risks we consider to be the most material, there may be other unknown or unpredictable economic, business, competitive, regulatory or other factors that also could have material adverse effects on our results of operations, financial condition, business or operations in the future. In addition, past financial performance may not be a reliable indicator of future performance and historical trends should not be used to anticipate results or trends in future periods.
If any of the events described below, individually or in combination, were to occur, our businesses, prospects, financial condition, results of operations and/or cash flows could be materially adversely affected.
Risks Relating to Competition and Technology
We operate in increasingly competitive markets, and there is a risk that we will not be able to effectively compete with other service providers. The markets for cable television, broadband internet, telephony and mobile services are highly competitive. In the provision of video services, we face competition from FTA broadcasters, video provided via satellite platforms, internet service providers that offer video services, OTT video service providers, and, in some countries where parts of our systems are overbuilt, cable operators, among others. Our operating businesses are facing increasing competition from video services provided by, or over the networks of, incumbent telecommunications operators and other service providers. As the availability and speed of broadband internet increases, we also face competition from OTT video content providers utilizing our or our competitors’ high-speed internet connections. In the provision of telephony and broadband internet services, we are experiencing increasing competition from the incumbent telecommunications operators and other service providers in each country in which we operate, as well as providers of mobile voice and data. The incumbent telecommunications operators typically dominate the market for these services and have the advantage of nationwide networks and greater resources than we have to devote to the provision of these services. Many of the incumbent operators offer double-play, triple-play and quad-play bundles of services. In many countries, we also compete with other operators using local loop unbundling (LLU) to provide these services, other facilities-based operators and wireless providers. Developments in the DSL as well as investments into FTTx technology by the incumbent incumbent telecommunications operators and alternative providers have improved the attractiveness of our competitor’s products and services and strengthened their competitive position. Developments in wireless technology, such as 5G and FWA, might become future competitive challenges.
In some of our markets, national and local government agencies may seek to become involved, either directly or indirectly, in the establishment of FTTx networks or other communications systems. We intend to pursue available options to restrict such involvement or to ensure that such involvement is on commercially reasonable terms. There can be no assurance, however, that we will be successful in these pursuits. As a result, we may face competition from entities not requiring a normal commercial return on their investments. In addition, we may face more vigorous competition than would have been the case if there were no government involvement.
We expect the level and intensity of competition to continue to increase from both existing competitors and the influx of new market entrants as a result of changes in the regulatory framework of the industries in which we operate, as well as strategic alliances and cooperative relationships among industry participants. Increased competition could result in increased customer churn, reductions of customer acquisition rates for some products and services and significant price and promotional competition in our markets. In combination with difficult economic environments, these competitive pressures could adversely impact our ability to increase or, in certain cases, maintain the revenue, average revenue per customer relationship or mobile subscriber, as applicable (ARPU), customers, mobile subscribers, Segment Adjusted EBITDA (as defined in note 17 to our combined financial statements included in Part II of this annual report), Segment Adjusted EBITDA margins (Segment Adjusted EBITDA divided by revenue) and liquidity of our operating segments.
I-20

Changes in technology may limit the competitiveness of and demand for our services. Technology in the video, telecommunications and data services industries is changing rapidly, including advances in current technologies and the emergence of new technologies. New technologies, products and services may impact consumer behavior and therefore demand for our products and services. The ability to anticipate changes in technology and consumer tastes and to develop and introduce new and enhanced products and services on a timely basis will affect our ability to continue to grow, increase our revenue and number of subscribers and remain competitive. New products and services, once marketed, may not meet consumer expectations or demand, can be subject to delays in development and may fail to operate as intended. A lack of market acceptance of new products and services that we may offer, or the development of significant competitive products or services by others, could have a material adverse impact on our revenue and Segment Adjusted EBITDA.
Our property and equipment additions may not generate a positive return. Significant additions to our property and equipment are, or in the future may be, required to add customers to our networks and to upgrade or expand our broadband communications networks and upgrade customer premises equipment to enhance our service offerings and improve the customer experience. Additions to our property and equipment, which are currently underway, including in connection with our network extensions, require significant capital expenditures for equipment and associated labor costs to build out and/or upgrade our networks as well as for related customer premises equipment. Additionally, significant competition, the introduction of new technologies, the expansion of existing technologies, such as FTTx and advanced DSL technologies, the impact of natural disasters, or adverse regulatory developments could cause us to decide to undertake previously unplanned builds or upgrades of our networks and customer premises equipment.
No assurance can be given that any, rebuilds, upgrades or extensions of our network will increase penetration rates, increase ARPU, or otherwise generate positive returns as anticipated, or that we will have adequate capital available to finance such future upgrades or extensions. Additionally, costs related to our network extensions and property and equipment additions could end up being greater than originally anticipated or planned. If this is the case, UPC Holding Group may require additional financing sooner than anticipated or we may have to delay or abandon some or all of our development and expansion plans or otherwise forego market opportunities. Additional financing may not be available on favorable terms, if at all, and our ability to incur additional debt will be limited by our debt agreements. If we are unable to, or elect not to, pay for costs associated with adding new customers, expanding, extending or upgrading our networks or making our other planned or unplanned additions to our property and equipment, or are delayed in making such investments, our growth could be limited and our competitive position could be harmed.
We depend almost exclusively on our relationships with third-party programming providers and broadcasters for programming content, and a failure to acquire a wide selection of popular programming on acceptable terms could adversely affect our business. The success of our video subscription business depends, in large part, on our ability to provide a wide selection of popular programming to our subscribers. We generally do not produce our own content, and we depend on our agreements, relationships and cooperation with public and private broadcasters and collective rights associations to obtain such content. If we fail to obtain a diverse array of popular programming for our pay television services, including a sufficient selection of HD channels as well as non-linear content (such as a selection of attractive VoD) content and rights for ancillary services such as DVR and catch up or “Replay” services), on satisfactory terms, we may not be able to offer a compelling video product to our customers at a price they are willing to pay. Additionally, we are frequently negotiating and renegotiating programming agreements and our annual costs for programming can vary. There can be no assurance that we will be able to renegotiate or renew the terms of our programming agreements on acceptable terms or at all. There has also been a rise in the number of direct-to-consumer offerings from content owners which impacts negotiations and the content, rights and restrictions available. Programming and copyright costs represent a significant portion of our operating costs and are subject to rise in future periods due to various factors, including (i) higher costs associated with the expansion of our digital video content, including rights associated with ancillary product offerings and rights that provide for the broadcast of live sporting events and (ii) rate increases.
If we are unable to obtain or retain attractively priced competitive content, demand for our existing and future television services could decrease, thereby limiting our ability to attract new customers, maintain existing customers and/or migrate customers from lower tier programming to higher tier programming, thereby inhibiting our ability to execute our business plans. Furthermore, we may be placed at a competitive disadvantage if certain of our competitors obtain exclusive programming rights, particularly with respect to popular sports and movie programming, and as certain players in the OTT market, for example, Netflix, increasingly produce their own exclusive content.
I-21

We depend on third-party suppliers and licensors to supply necessary equipment, software and certain services required for our businesses. We rely on third-party vendors for the equipment, software and services that we require in order to provide services to our customers. Our suppliers often conduct business worldwide and their ability to meet our needs are subject to various risks, including political and economic instability, natural calamities, interruptions in transportation systems, terrorism and labor issues. As a result, we may not be able to obtain the equipment, software and services required for our businesses on a timely basis or on satisfactory terms. Any shortfall in customer premises equipment could lead to delays in connecting customers to our services, and accordingly, could adversely impact our ability to maintain or increase our customers, revenue and cash flows. Also, if demand exceeds the suppliers’ and licensors’ capacity or if they experience financial difficulties, the ability of our businesses to provide some services may be materially adversely affected, which in turn could affect our businesses’ ability to attract and retain customers. Although we actively monitors the creditworthiness of our key third-party suppliers and licensors, the financial failure of a key third-party supplier or licensor could disrupt our operations and have an adverse impact on our revenue and cash flows. Additionally, we rely upon our owned or licensed intellectual property to use various technologies, conduct our operations and sell our products and services. Legal challenges could be made against our use of our owned or licensed intellectual property rights (such as trademarks, patents and trade secrets) and we may be required to enter into licensing arrangements on unfavorable terms, incur monetary damages or be enjoined from use of the intellectual property rights in question.
Our businesses that offer mobile telephony and data services rely on the radio access networks of third-party wireless network providers to carry our mobile communications traffic. Our services to mobile customers rely on the use of MVNO arrangements in which we utilize the radio access networks of third-party wireless network providers to carry our mobile communications traffic. If any of our MVNO arrangements are terminated, or if the respective third-party wireless network provider fails to provide the services required under an MVNO arrangement, or if a third-party wireless network provider fails to deploy and maintain our network, and we are unable to find a replacement network operator on a timely and commercial basis or at all, we could be prevented from continuing the mobile services relying on such MVNO arrangement. Additionally, as our MVNO arrangements come to term, we may not be able to renegotiate renewal or replacement MVNO arrangements on the same or more favorable terms.
We may not be successful at entering new businesses or broadening the scope of our existing product and service offerings. From time to time, we enter into new businesses that are adjacent or complementary to existing businesses and that broaden the scope of our existing product and service offerings. We may not achieve our expected growth if we are not successful in these efforts. In addition, entering into new businesses and broadening the scope of our existing product and service offerings may require significant upfront expenditures that we may not be able to recoup in the future. These efforts may also divert management’s attention and expose us to new risks and regulation, which may have a material adverse effect on our business, results of operations and financial condition.
Failure in our or our third-party technology or telecommunications systems, leakage of sensitive customer data, or security breaches could significantly disrupt our operations, reduce our customer base and result in fines, litigation or lost revenue. Our success depends, in part, on the continued and uninterrupted performance of our information technology and network systems, including internet sites, data hosting and processing facilities and other hardware, software and technical applications and platforms, as well as our customer service centers. Some of these are managed, hosted, provided or used by third-party service providers or their vendors to assist in conducting our business. In addition, the hardware supporting a large number of critical systems for our cable network in a particular country is housed in a relatively small number of locations. Our and our third-party service providers’ systems and equipment (including our routers and set-top boxes) are vulnerable to damage or security breach from a variety of sources, including telecommunications failures, power loss, malicious human acts, security flaws, and natural disasters. Moreover, despite security measures, unauthorized parties may gain access to or disrupt our or our third-party service providers’ servers, systems and equipment by, among other things, hacking into our servers, systems and equipment or those of our third-party service providers through fraud, computer viruses, worms, phishing, physical or electronic break-ins or burglaries, or errors by our or our third-party service providers’ employees. We and our third-party service providers may not be able to anticipate or respond in an adequate and timely manner to attempts to obtain authorized access to, disable or degrade our or our third-party service providers’ systems because the techniques for doing so change frequently, are increasingly complex and sophisticated and are difficult to detect for periods of time. In addition, as discussed further below, the security measures and procedures we and our third-party service providers have in place to protect personal data and other information may not be sufficient to counter all data security breaches, cyber-attacks, or system failures. In some cases, mitigation efforts may depend on third parties who may not deliver products or services that meet the required contractual standards or whose hardware, software or network services may be subject to error, defect, delay or outage.
Through our operations, sales and marketing activities, we collect and store certain personal information related to our customers. This may include phone numbers, drivers license numbers, contact preferences, personal information stored on
I-22

electronic devices and payment information, including credit and debit card data. We also gather and retain information about employees in the normal course of business. In certain circumstances, where it is lawful to do so, we may share information about such persons with third-party service providers that assist with certain aspects of our business. Unauthorized parties may attempt to gain access to such data and information using the same methods described above. As a result, data and information we gather could be subject to misappropriation, misuse, leakage, falsification or accidental release or loss of information maintained in our information technology systems and networks and those of our third-party service providers, including customer and personnel data. As a result of the increasing awareness concerning the importance of safeguarding personal information, the potential misuse of such information and legislation that has been adopted or is being considered across all of our markets regarding the protection, privacy and security of personal information, information-related risks are increasing, particularly for businesses like ours that handle a large amount of personal data. Failure to comply with these data protection laws may result in, among other consequences, fines, litigation or regulatory actions by state, federal or non-U.S. authorities.
Despite the precautions we have taken, unanticipated problems affecting our systems and equipment could cause business disruptions such as failures in our information technology systems, disruption in the transmission of signals over our networks, unauthorized access to the data and information we gather or similar problems. Further, although we devote significant resources to our cybersecurity programs and have implemented security measures to protect our systems and data, and to prevent, detect and respond to data security incidents, there can be no assurance that our efforts will prevent these threats. Any disruptive situation that causes loss, misappropriation, misuse or leakage of data could damage our reputation and the credibility of our operations, and could subject us to potential liability, including litigation or other legal actions against us, the imposition of penalties, fines, fees or liabilities, which may not be covered by our insurance policies, and lost customers and revenue. While we maintain cyber liability insurance that provides both third-party liability and first-party liability insurance coverage, such insurance may not be sufficient to protect against all of our businesses’ losses from any future disruptions or breaches of our systems or other events as described above. Also, a cybersecurity breach and the changing cybersecurity landscape could require us to devote significant management resources to address the problems associated with the breach and to expend significant additional resources to further upgrade the security measures we employ to protect customer, employee, or other personal information against cyber-attacks and other wrongful attempts to access such information, which could result in a disruption of our operations. This includes additional infrastructure capacity spending to mitigate any system degradation and the reallocation of resources from development activities. To date we have not been subject to cyberattacks or network disruptions that, individually or in the aggregate, have been material to our operations or financial condition. Although we have not detected another material security breach or cybersecurity incident to date, we have been the target of events of this nature and expect to be subject to similar attacks in the future.
Risks Relating to Legislative, Regulatory and Market Specific Matters
We are exposed to foreign currency exchange rate risk. We are exposed to foreign currency exchange rate risk with respect to our combined debt in situations where our debt is denominated in a currency other than the functional currency of the operations whose cash flows support our ability to repay or refinance such debt. Although we generally seek to match the denomination of our and our combined entities’ borrowings with the functional currency of the operations that are supporting the respective borrowings, market conditions or other factors may cause us to enter into borrowing arrangements that are not denominated in the functional currency of the underlying operations (unmatched debt). In these cases, our policy is to provide for an economic hedge against foreign currency exchange rate movements by using derivative instruments to synthetically convert unmatched debt into the applicable underlying currency. At December 31, 2020, substantially all of our debt was either directly or synthetically matched to the applicable functional currencies of the underlying operations.
In addition to the exposure that results from the mismatch of our borrowings and underlying functional currencies, we are exposed to foreign currency risk to the extent that we enter into transactions denominated in currencies other than our or our combined entities’ respective functional currencies (non-functional currency risk), such as equipment purchases, programming contracts, notes payable and notes receivable (including intercompany amounts). Changes in exchange rates with respect to amounts recorded on our combined balance sheets related to these items will result in unrealized (based upon period-end exchange rates) or realized foreign currency transaction gains and losses upon settlement of such transactions. Moreover, to the extent that our revenue, costs and expenses are denominated in currencies other than our respective functional currencies, we will experience fluctuations in our revenue, costs and expenses solely as a result of changes in foreign currency exchange rates. Generally, we will consider hedging non-functional currency risks when the risks arise from agreements with third parties that involve the future payment or receipt of cash or other monetary items to the extent that we can reasonably predict the timing and amount of such payments or receipts and the payments or receipts are not otherwise hedged. In this regard, we have entered into foreign currency forward contracts to hedge certain of these risks. For additional information concerning our foreign currency forward contracts, see note 6 to our combined financial statements included in Part II of this annual report.
I-23

Our businesses are subject to risks of adverse regulation. Our businesses are subject to the unique regulatory regimes of the countries in which they operate. Video distribution, broadband internet, telephony and mobile businesses are subject to licensing or registration eligibility rules and regulations, which vary by country. Specifically, the E.U. requires Member States to abolish communication network exclusivity in our territory, allowing operators into the E.U. markets based on a simple registration and resulting in greater competition in territories where our businesses may already be active. It is possible that countries in which we operate may adopt laws and regulations regarding electronic commerce, which could dampen the growth of the internet services being offered and developed by these businesses. In a number of countries, our ability to increase the prices we charge for our cable television service or make changes to our services, including the programming packages we offer is limited by regulation or conditions imposed by competition authorities or is subject to review by regulatory authorities or is subject to termination rights of customers. More significantly, regulatory authorities may require us to grant third parties access to our bandwidth, frequency capacity, facilities or services to distribute their own services or resell our services to end customers. Consequently, our businesses must adapt their ownership and organizational structure as well as their pricing and service offerings to satisfy the rules and regulations to which they are subject. A failure to comply with applicable rules and regulations could result in penalties, restrictions on our business or loss of required licenses or other adverse conditions. Adverse changes in rules and regulations could:
• impair our ability to use our bandwidth in ways that would generate maximum revenue and Segment Adjusted EBITDA;
• create a shortage of capacity on our networks, which could limit the types and variety of services we seek to provide our customers;
• impact our ability to access spectrum for our mobile services;
• strengthen our competitors by granting them access and lowering their costs to enter into our markets; and
• have a significant adverse impact on our results of operations.
Businesses, including ours, that offer multiple services, such as video distribution as well as internet, telephony, and/or mobile services, or that are vertically integrated and offer both video distribution and programming content, often face close regulatory scrutiny from competition authorities in several countries in which they operate. This is particularly the case with respect to any proposed business combinations, which will often require clearance from the European Commission or national competition authorities, which can block, impose conditions on or delay an acquisition, thus possibly hampering our opportunities for growth. In the event conditions are imposed and we fail to meet them in a timely manner, the relevant governmental authority may impose fines and, if in connection with a merger transaction, may require restorative measures, such as a mandatory disposition of assets or divestiture of operations.
For information regarding certain other regulatory developments that could adversely impact our results of operations in future periods, see Legal and Regulatory Proceedings and Other Contingencies - Other Regulatory Matters in note 16 to our combined financial statements included in Part II of this annual report.
New legislation may significantly alter the regulatory regime applicable to us, which could adversely affect our competitive position and profitability, and we may become subject to more extensive regulation if we are deemed to possess significant market power in any of the markets in which we operate. Significant changes to the existing regulatory regime applicable to the provision of cable television, telephony and internet services have been and are still being introduced. For example, in the E.U. a large element of regulation affecting our business derives from a number of legal measures, which we refers to as “Directives” and that are the basis of the regulatory regime concerning many of the services we offer across the E.U. The various Directives require Member States to harmonize their laws on communications and cover issues such as access, user rights, privacy and competition. These Directives are reviewed by the E.U. from time to time and any changes to them could lead to substantial changes in the way in which our businesses are regulated and to which they would have to adapt. In addition, we are subject to review by competition or national regulatory authorities in certain countries concerning whether we exhibit significant market power. A finding of significant market power could result in us becoming subject to access and pricing obligations and other requirements that could provide a more favorable operating environment for existing and potential competitors.
We cannot be certain that we will be successful with respect to acquisitions, dispositions, partnerships or other similar transactions, or that we will achieve the anticipated benefits thereof. Historically, our businesses have grown, in part, through selective acquisitions that enabled us to take advantage of existing networks, local service offerings and region-specific management expertise, and we have also taken advantage of attractive opportunities to sell select businesses. We expect to seek to continue improving our company through attractive acquisitions, dispositions, partnerships or other similar transactions in
I-24

selected markets, such as the sale of UPC Austria in July 2018, the sale of UPC DTH in May 2019, the sale of the Vodafone Disposal Group in July 2019 and the Sunrise Acquisition in November 2020 (each as defined and described in note 5 to our combined financial statements included in Part II of this annual report). Our ability to complete any transaction may be limited by many factors, including government regulation, availability of financing, our or our counterparty’s debt covenants, the prevalence of complex ownership structures among potential targets, acquirers, or partners, disapproval by shareholders of potential targets or acquirers, and competition from other potential acquirers, including private equity funds. Even if we are successful in completing such transactions, integration and separation activities may present significant costs and challenges. We cannot be assured that we will be successful with respect to acquisitions, dispositions, partnerships or other similar transactions or realizing the anticipated benefits thereof. In addition, while we intend to conduct appropriate due diligence and to implement appropriate controls and procedures as we integrate acquired companies, we may not be able to certify as to the effectiveness of these companies’ disclosure controls and procedures or internal controls over financial reporting until we have fully integrated them.
We do not have complete control over the prices that we charge. Our business is, in some countries, subject to regulation or review by various regulatory, competition or other government authorities responsible for the regulation or the review of the charges to our subscribers for our services. Such authorities, in certain cases, could potentially require us to repay such fees to the extent they are excessive or discriminatory. We also may not be able to enforce future changes to our subscription prices. Additionally, in certain European markets, our ability to bundle or discount our services may be constrained if we are held to be dominant with respect to any product we offer. This may have an adverse impact on our revenue, profitability of new products and services and our ability to respond to changes in the markets in which we operate.
Strikes, work stoppages and other industrial actions could disrupt our operations or make it more costly to operate our businesses. We are exposed to the risk of strikes, work stoppages and other industrial actions. In the future, we may experience lengthy consultations with labor unions and works councils or strikes, work stoppages or other industrial actions. Strikes and other industrial actions, as well as the negotiation of new collective bargaining agreements or salary increases in the future, could disrupt the our operations and make it more costly to operate our facilities. In addition, strikes called by employees of any of our key providers of materials or services could result in interruptions to the performance of our services. The occurrence of any of the above risks could have a material adverse effect on our business, financial condition and results of operations.
We are subject to tax in more than one tax jurisdiction and our structure poses various tax risks. We are subject to taxation in multiple jurisdictions, including the Netherlands and Switzerland. Our effective tax rate and tax liability will be affected by a number of factors in addition to our operating results, including the amount of taxable income in particular jurisdictions, the tax rates in those jurisdictions, tax treaties between jurisdictions, the manner in which and the extent to which we transfer funds to and repatriate funds from our operating entities, accounting standards and changes in accounting standards and future changes in the law. We may incur losses in one jurisdiction that cannot be offset against income earned in a different jurisdiction and so we may pay income taxes in one jurisdiction for a particular period even though on an overall basis we incur a net loss for that period.
We may have exposure to additional tax liabilities. We are subject to income taxes as well as non-income based taxes, such as value-added taxes (VAT) or similar revenue based taxes. In addition, most tax jurisdictions in which we operate have complex and subjective rules regarding the valuation of intercompany services, cross-border payments between affiliated companies and the related effects on income tax, VAT and transfer tax. Significant judgment is required in determining our worldwide provision for income taxes and other tax liabilities. In the ordinary course of our business, there are many transactions and calculations where the ultimate tax determination is uncertain. We are regularly under audit by tax authorities in many of the jurisdictions in which we operate. Although we believe that our tax estimates are reasonable, any material differences as a result of final determinations of tax audits or tax disputes could have an adverse effect on our financial position and results of operations in the period or periods for which determination is made.
We are subject to changing tax laws, treaties and regulations in and between countries in which we operate. Also, various income tax proposals in the jurisdictions in which we operate could result in changes to the existing laws on which our deferred taxes are calculated. A change in these tax laws, treaties or regulations, or in the interpretation thereof, could result in a materially higher income or non-income tax expense, and any such material changes could cause a material change in our effective tax rate. In this regard, there have been significant changes or proposed changes to the tax laws in numerous jurisdictions in which we operate, the impacts of which have been reflected accordingly in our combined financial statements.
Further changes in the tax laws of the foreign jurisdictions in which we operate could arise as a result of the base erosion and profit shifting project that has been undertaken by the Organisation for Economic Co-operation and Development (OECD) or the European Commission Anti-Tax Avoidance Package. The OECD, which represents a coalition of member countries that
I-25
encompass some of the jurisdictions in which we operate, and the European Commission have undertaken studies and are publishing action plans that include recommendations aimed at addressing what they believe are issues within tax systems that may lead to tax avoidance by companies. It is possible that jurisdictions in which we do business could react to these initiatives or their own concerns by enacting tax legislation that could adversely affect us through increasing our tax liabilities.
Risks Relating to Certain Financial Matters
We have substantial indebtedness that may have a material adverse effect on our available cash flow, our ability to obtain additional financing in the future, if necessary, our flexibility in reacting to competitive technological changes and our operations. We have a substantial amount of indebtedness. At December 31, 2020, the outstanding principal amount of our combined third-party debt, together with our finance lease obligations, aggregated €6,403.1 million, including €315.6 million that is classified as current on our combined balance sheet and €6,076.8 million that is not due until 2026 or thereafter. We believe that we have sufficient resources to repay or refinance the current portion of our debt and finance lease obligations and to fund our foreseeable liquidity requirements during the next 12 months. However, as our maturing debt grows in later years, we anticipate that we will seek to refinance or otherwise extend our debt maturities. In this regard, we completed refinancing transactions during 2020 that, among other things, resulted in the extension of certain of our combined entities’ debt maturities. Our ability to pay principal and interest on or to refinance our outstanding indebtedness depends upon our operating performance, which will be affected by, among other things, general economic, financial, competitive, regulatory and other factors, some of which are beyond our control. Moreover, we may not be able to refinance or redeem such debt on commercially reasonable terms, on terms acceptable to us, or at all.
The level of our indebtedness could have important consequences, including the following:
• a substantial portion of our cash flows from operations will have to be dedicated to the payment of interest and principal on existing indebtedness, thereby reducing the funds available for other purposes;
• our ability to obtain additional financing in the future for working capital, capital expenditures, product development, acquisitions or general corporate purposes may be impaired;
• our flexibility in planning for, or reacting to, changes in our business, the competitive environment and the industry in which we operate, and to technological and other changes may be limited;
• we may be placed at a competitive disadvantage as compared to our competitors that are not as highly leveraged;
• our substantial degree of leverage could make us more vulnerable in the event of a downturn in general economic conditions or adverse developments in our business; and
• we are exposed to risks inherent in interest rate and foreign exchange rate fluctuations.
Any of these or other consequences or events could have a material adverse impact on our ability to satisfy our debt obligations, which could adversely affect our business and operations.
We may not be able to fund our debt service obligations in the future. We have significant outstanding indebtedness that could require a partial or comprehensive refinancing in future periods. Borrowings under our credit facilities are currently due between 2021 and 2029, while the maturities of our outstanding senior notes currently range from 2028 to 2039. For additional information regarding our debt maturities, see note 9 to our combined financial statements included in Part II of this annual report. Our ability to meet our debt service obligations or to refinance our debt depends on our future operating and financial performance, which will be affected by our ability to successfully implement our business strategy as well as general economic, financial, competitive, regulatory and other factors beyond our control. If we cannot generate sufficient cash to meet our debt service requirements, we may be forced to raise cash or reduce expenses by doing one or more of the following:
• raising additional debt;
• restructuring or refinancing our indebtedness prior to maturity and/or on unfavorable terms;
• selling or disposing of some of our assets, possibly on unfavorable terms;
• issuing equity or equity-related instruments that will dilute the equity ownership interest of existing stockholders; or
• foregoing business opportunities, including the introduction of new products and services, acquisitions and joint ventures.
I-26

We cannot be sure that any of, or a combination of, the above actions would be sufficient to fund our debt service obligations, particularly in times of turbulent capital markets. If we are not able to refinance any of our debt, obtain additional financing or sell assets on commercially reasonable terms or at all, we may not be able to satisfy our debt obligations.
The covenants under our debt agreements place certain limitations on our ability to finance future operations and how we manage our business. The agreements that govern our indebtedness contain financial maintenance tests and restrictive covenants that restrict our ability to incur additional debt and limit the discretion of our management over various business matters. For example, the financial maintenance tests include leverage ratios, and the restrictive covenants impact our ability to:
• pay dividends or make other distributions, or redeem or repurchase equity interests or subordinated obligations;
• make investments;
• sell assets, including the capital stock of certain entities;
• enter into certain sale and leaseback transactions and certain vendor financing arrangements;
• create liens;
• enter into agreements that restrict the ability of certain of our entities to pay dividends, transfer assets or make related-party loans;
• merge or consolidate or transfer all or substantially all of our assets; and
• enter into certain transactions with affiliates.
These limitations are subject to significant exceptions and qualifications, including the ability to pay dividends, make investments or make significant prepayments of shareholder debt. However, these covenants could limit our ability to finance our future operations and capital needs and our ability to pursue business opportunities and activities that may be in our interest. In addition, our ability to comply with the provisions of our debt instruments may be affected by events beyond our control.
If we breach any of these covenants, or are unable to comply with the required financial ratios or if the drawings under the revolving credit facility exceed a certain percentage of the commitments under such revolving credit facility, we may be in default under our debt instruments. Upon the occurrence of a default, a significant portion of our indebtedness may then become immediately due and payable and we may not have sufficient assets to repay amounts due thereunder. In addition, any default under any one of our debt facilities or instruments could lead to an event of default and acceleration under other debt instruments that contain cross default or cross acceleration provisions, including the indentures governing the Senior Notes issued by us.
These restrictions could also materially adversely affect our ability to finance future operations or capital needs or to engage in other business activities that may be in our best interest. We may also incur other indebtedness in the future that may contain financial or other covenants more restrictive than those applicable under our current indebtedness.
We are a holding company dependent upon cash flows from our operations to meet our obligations. UPC Holding and a number of our combined entities are holding companies with no independent operations or significant assets other than investments in their subsidiaries. Each of these holding companies depends upon the receipt of sufficient funds from our operating entities to meet its obligations. The terms of our senior credit facility and other indebtedness limit the payment of dividends, loan repayments and other distributions to or from these holding companies under certain circumstances. Various agreements governing our debt may restrict and, in some cases, may also prohibit the ability of these entities to move cash within their restricted group. Applicable tax laws may also subject such payments to further taxation or may limit the amounts that some of our combined entities will be permitted to pay as dividends or distributions on their equity interests or as loans, or even prevent such payments.
We are exposed to interest rate risks. Shifts in such rates may adversely affect our debt service obligations. We are exposed to the risk of fluctuations in interest rates, primarily under the UPC Holding Bank Facility, which are indexed to EURIBOR, LIBOR, or other base rates. Although we enter into various derivative transactions to manage exposure to movements in interest rates, there can be no assurance that we will be able to continue to do so at a reasonable cost or at all. If we are unable to effectively manage our interest rate exposure through derivative transactions, any increase in market interest rates would increase our interest rate exposure and debt service obligations, which would exacerbate the risks associated with our leveraged capital structure.
I-27

In July 2017, the U.K. Financial Conduct Authority (the authority that regulates LIBOR) announced that it intends to stop compelling banks to submit rates for the calculation of LIBOR after 2021. Additionally, the European Money Markets Institute (the authority that administers EURIBOR) has announced that measures will need to be undertaken by the end of 2021 to reform EURIBOR to ensure compliance with E.U. Benchmarks Regulation. In November 2020, ICE Benchmark administration (the entity that administers LIBOR) announced its intention to continue publishing USD LIBOR rates until June 30, 2023, with the exception of the one-week and two-month rates which, along with all GBP LIBOR rates, it intends to cease publishing after December 31, 2021. While this extension allows additional runway on existing contracts using USD LIBOR rates, companies are still encouraged to transition away from using USD LIBOR as soon as practicable and should not enter into new contracts that use USD LIBOR after 2021. The methodology for EURIBOR has been reformed and EURIBOR has been granted regulatory approval to continue to be used. Currently, it is not possible to predict the exact transitional arrangements for calculating applicable reference rates that may be made in the U.K., the U.S., the Eurozone or elsewhere given that a number of outcomes are possible, including the cessation of the publication of one or more reference rates.
In October 2020, the International Swaps and Derivatives Association (the ISDA) launched a new supplement (the Fallback Supplement), which effective January 25, 2021, will amend the standard definitions for interest rate derivatives to incorporate fallbacks for derivatives linked to certain key interbank offered rates (IBORs). The ISDA also launched a new protocol (the Fallback Protocol), also effective January 25, 2021, that will enable market participants to incorporate these revisions into their legacy non-cleared derivatives with other counterparties that choose to adhere to the protocol. The fallbacks for a particular currency will apply following a permanent cessation of the IBOR in that currency and will be adjusted versions of the risk-free rates identified in each currency. Our loan documents contain provisions that contemplate alternative calculations of the base rate applicable to our LIBOR-indexed and EURIBOR-indexed debt to the extent LIBOR or EURIBOR (as applicable) are not available, which alternative calculations we do not anticipate will be materially different from what would have been calculated under LIBOR or EURIBOR (as applicable). Additionally, no mandatory prepayment or redemption provisions would be triggered under our loan documents in the event that either the LIBOR rate or the EURIBOR rate is not available. It is possible, however, that any new reference rate that applies to our LIBOR-indexed or EURIBOR-indexed debt could be different than any new reference rate that applies to our LIBOR-indexed or EURIBOR-indexed derivative instruments. We anticipate managing this difference and any resulting increased variable-rate exposure through modifications to our debt and/or derivative instruments, however future market conditions may not allow immediate implementation of desired modifications and the company may incur significant associated costs.
We are subject to increasing operating costs and inflation risks which may adversely affect our results of operations. While our operations attempt to increase our subscription rates to offset increases in programming and operating costs, there is no assurance that they will be able to do so. In certain countries in which we operate, our ability to increase subscription rates is subject to regulatory controls. Also, our ability to increase subscription rates may be constrained by competitive pressures. Therefore, operating costs may rise faster than associated revenue, resulting in a material negative impact on our cash flows and results of operations. We are also impacted by inflationary increases in salaries, wages, benefits and other administrative costs in certain of our markets.
Continuing uncertainties and challenging conditions in the global economy and in the countries in which we operate may adversely impact our business, financial condition and results of operations. The current macroeconomic environment is highly volatile, and continuing instability in global markets, including ongoing trade negotiations, the risk of deflation and the stability of the euro and the Swiss franc, has contributed to a challenging global economic environment. Future developments are dependent upon a number of political and economic factors, including the effectiveness of measures by the European Commission to address debt burdens of certain countries in Europe and low growth expectations. As a result, we cannot predict how long challenging conditions will exist or the extent to which the markets in which we operate may deteriorate. Additional risks arising from the ongoing economic challenges in Europe are described below under the risk factor titled: We are exposed to sovereign debt and currency instability risks that could have an adverse impact on our liquidity, financial condition and cash flows.
Unfavorable economic conditions may impact a significant number of our subscribers and/or the prices our combined entities are able to charge for their products and services, and, as a result, it may be (i) more difficult for us to attract new subscribers, (ii) more likely that subscribers will downgrade or disconnect their services and (iii) more difficult for us to maintain ARPUs at existing levels. Countries may also seek new or increased revenue sources due to fiscal deficits. Such actions may further adversely affect us. Accordingly, our ability to increase, or, in certain cases, maintain, the revenue, ARPUs, customers, mobile subscribers, Segment Adjusted EBITDA, Segment Adjusted EBITDA margins and liquidity of our operating segments could be adversely affected if the macroeconomic environment remains uncertain or declines further. We are currently unable to predict the extent of any of these potential adverse effects.
I-28

We are exposed to sovereign debt and currency instability risks that could have an adverse impact on our liquidity, financial condition and cash flows. Our operations are subject to macroeconomic and political risks that are outside of our control. For example, high levels of sovereign debt in some countries in which we operate, combined with weak growth and high unemployment, could potentially lead to fiscal reforms (including austerity measures), tax increases, sovereign debt restructurings, currency instability, increased counterparty credit risk, high levels of volatility and disruptions in the credit and equity markets, as well as other outcomes that might adversely impact us. With regard to currency instability issues, concerns exist in the eurozone with respect to individual macro-fundamentals on a country-by-country basis, as well as with respect to the overall stability of the European monetary union and the suitability of a single currency to appropriately deal with specific fiscal management and sovereign debt issues in individual eurozone countries. The realization of these concerns could lead to the exit of one or more countries from the European monetary union and the re-introduction of individual currencies in these countries, or, in more extreme circumstances, the possible dissolution of the European monetary union entirely, which could result in the redenomination of a portion or, in the extreme case, all of our euro-denominated assets, liabilities and cash flows to the new currency of the country in which they originated. This could result in a mismatch in the currencies of our assets, liabilities and cash flows. Any such mismatch, together with the capital market disruption that would likely accompany any such redenomination event, could have a material adverse impact on our liquidity and financial condition. Furthermore, any redenomination event would likely be accompanied by significant economic dislocation, particularly within the eurozone countries, which in turn could have an adverse impact on demand for our products and services, and accordingly, on our revenue and cash flows. Moreover, any changes from euro to non-euro currencies within the European countries in which we operate would require us to modify our billing and other financial systems. No assurance can be given that any required modifications could be made within a time frame that would allow us to timely bill our customers or prepare and file required financial reports. In light of the significant exposure that we have to the euro through our euro-denominated borrowings, derivative instruments, cash balances and cash flows, a redenomination event could have a material adverse impact on us.
We may not freely access the cash of our operating companies. Our operations are conducted through our operating entities. Our current sources of corporate liquidity include (i) our cash and cash equivalents and (ii) interest and dividend income received on our cash and cash equivalents and investments. From time to time, we also receive (a) proceeds in the form of distributions or loan repayments from our operating entities or affiliates, (b) proceeds upon the disposition of investments and other assets and (c) proceeds in connection with the incurrence of debt. The ability of our operating entities to pay dividends or to make other payments or advances to us depends on their individual operating results and any statutory, regulatory or contractual restrictions to which they may be or may become subject and in some cases our receipt of such payments or advances may be limited due to tax considerations or the presence of noncontrolling interests. Most of our operating entities are subject to credit agreements or indentures that restrict sales of assets and prohibit or limit the payment of dividends or the making of distributions, loans or advances to shareholders and partners, including us. In addition, because these operating entities are separate and distinct legal entities they have no obligation to provide us funds for payment obligations, whether by dividends, distributions, loans or other payments.
We are exposed to the risk of default by the counterparties to our cash investments, derivative and other financial instruments, and undrawn debt facilities. Although we seek to manage the credit risks associated with our cash investments, derivative and other financial instruments, and undrawn debt facilities, we are exposed to the risk that our counterparties will default on their obligations to us. While we regularly review our credit exposures and currently have no specific concerns about the creditworthiness of any counterparty for which we have material credit risk exposures, we cannot rule out the possibility that one or more of our counterparties could fail or otherwise be unable to meet its obligations to us. Any such instance of default or failure could have an adverse effect on our cash flows, results of operations, financial condition and/or liquidity. In this regard, (i) we may incur losses to the extent that we are unable to recover debts owed to us, including cash deposited and the value of financial losses, (ii) we may incur significant costs to recover amounts owed to us, and such recovery may take a long period of time or may not be possible at all, (iii) our derivative liabilities may be accelerated by the default of our counterparty, (iv) we may be exposed to financial risks as a result of the termination of affected derivative contracts, and it may be costly or impossible to replace such contracts or otherwise mitigate such risks, (v) amounts available under committed credit facilities may be reduced and (vi) disruption to the credit markets could adversely impact our ability to access debt financing on favorable terms, or at all.
At December 31, 2020, our exposure to counterparty credit risk included (i) derivative assets with an aggregate fair value of €63.3 million, (ii) cash and cash equivalents and restricted cash balances of €26.6 million and (iii) aggregate undrawn debt facilities of €716.6 million. For additional information regarding our derivative instruments, see note 6 to our combined financial statements included in Part II of this annual report.
I-29

We may not report net earnings. We reported net earnings (loss) of (€262.6 million), (€64.2 million) and €18.4 million during the years ended December 31, 2020, 2019 and 2018, respectively. In light of our historical financial performance and the impact of recent transactions, we cannot assure you that we will report net earnings in the near future or ever.
Other Risks
The loss of certain key personnel could harm our business. We have experienced employees at both the corporate and operational levels who possess substantial knowledge of our business and operations. We cannot assure you that we will be successful in retaining their services or that we would be successful in hiring and training suitable replacements without undue costs or delays. As a result, the loss of any of these key employees could cause significant disruptions in our business operations, which could materially adversely affect our results of operations.
The interests of Liberty Global, our indirect parent company or companies, as the case may be, may conflict with our interests and this could adversely affect our business. Liberty Global is our parent, indirectly owning all of the voting interests in the UPC Holding Group. When business opportunities, or risks and risk allocation arise, the interests of Liberty Global (or other Liberty Global controlled entities) may be different from, or in conflict with, our interests on a stand-alone basis. Because we are indirectly controlled by the parent entity, Liberty Global may allocate certain or all of its risks to us and there can be no assurance that Liberty Global will permit us to pursue certain business opportunities.
We are exposed to the risks arising from widespread epidemic diseases in the countries in which we operate, such as the outbreak of COVID-19, which could have a material adverse impact on our business, financial condition and results of operations. In March 2020, the World Health Organization declared the outbreak of COVID-19 to be a global pandemic. In response to the COVID-19 pandemic, emergency measures have been imposed by governments worldwide, including travel restrictions, restrictions on social activity and the shutdown of non-essential businesses. These measures have adversely impacted the global economy, disrupted global supply chains and created significant volatility and disruption of financial markets. While it is not currently possible to estimate the duration and severity of the COVID-19 pandemic or the adverse economic impact resulting from the preventative measures taken to contain or mitigate its outbreak, an extended period of global economic disruption could have a material adverse impact on our business, financial condition and results of operations in future periods, including with respect to, among other items, (i) our ability to access capital necessary to fund property and equipment additions, debt service requirements, acquisitions and other investment opportunities, the repurchase of equity securities or other liquidity needs, (ii) the ability of our customers to pay for our products and services, (iii) our ability to maintain or increase our residential and business subscriber levels, (iv) our ability to offer attractive programming, particularly in consideration of the recent cancellation of numerous worldwide sporting events and (v) the ability of our suppliers and vendors to provide products and services to us. We may also be adversely impacted by any government mandated regulations on our business that could be implemented in response to the COVID-19 pandemic. In addition, countries may seek new or increased revenue sources due to fiscal deficits that result from measures taken to mitigate the adverse economic impacts of COVID-19, such as by imposing new taxes on the products and services we provide. We are currently unable to predict the extent of any of these potential adverse effects.
I-30

KPMG LLPSuite 8001225 17th StreetDenver, CO 80202-5598
Independent Auditors’ Report
The Board of Directors UPC Holding Group:
Report on the Financial Statements
We have audited the accompanying combined financial statements of UPC Holding Group, as defined in note 1 of the combined financial statements, which comprise the combined balance sheets as of December 31, 2020 and 2019, and the related combined statements of operations, comprehensive earnings (loss), equity (deficit), and cash flows for the years then ended, and the related notes to the combined financial statements.
Management’s Responsibility for the Financial Statements
Management is responsible for the preparation and fair presentation of these combined financial statements in accordance with U.S. generally accepted accounting principles; this includes the design, implementation, and maintenance of internal control relevant to the preparation and fair presentation of combined financial statements that are free from material misstatement, whether due to fraud or error.
Auditors’ Responsibility
Our responsibility is to express an opinion on these combined financial statements based on our audits. We conducted our audits in accordance with auditing standards generally accepted in the United States of America. Those standards require that we plan and perform the audit to obtain reasonable assurance about whether the combined financial statements are free from material misstatement.
An audit involves performing procedures to obtain audit evidence about the amounts and disclosures in the combined financial statements. The procedures selected depend on the auditors’ judgment, including the assessment of the risks of material misstatement of the combined financial statements, whether due to fraud or error. In making those risk assessments, the auditor considers internal control relevant to the entity’s preparation and fair presentation of the combined financial statements in order to design audit procedures that are appropriate in the circumstances, but not for the purpose of expressing an opinion on the effectiveness of the entity’s internal control. Accordingly, we express no such opinion. An audit also includes evaluating the appropriateness of accounting policies used and the reasonableness of significant accounting estimates made by management, as well as evaluating the overall presentation of the combined financial statements.
We believe that the audit evidence we have obtained is sufficient and appropriate to provide a basis for our audit opinion.
Opinion
In our opinion, the combined financial statements referred to above present fairly, in all material respects, the financial position of UPC Holding Group, as defined in note 1 of the combined financial statements, as of December 31, 2020 and 2019, and the results of its operations and its cash flows for the years then ended in accordance with U.S. generally accepted accounting principles.
KPMG LLP is a Delaware limited liability partnership and the U.S. member firm of the KPMG network of independent member firms affiliated with KPMG International Cooperative (“KPMG International”), a Swiss entity.
II-1
Other Matter
The accompanying combined financial statements of UPC Holding Group, as defined in note 1 of the combined financial statements, for the year ended December 31, 2018 (“the 2018 combined financial statements”) were audited by other auditors whose report thereon dated March 14, 2019, expressed an unmodified opinion on those financial statements, before the revisions as described in notes 1, 5, and 13 to the combined financial statements.
As part of our audit of the combined financial statements, we audited the adjustments described in notes 1, 5, and 13 that were applied to retrospectively revise the 2018 combined financial statements. In our opinion, such adjustments are appropriate and have been properly applied. We were not engaged to audit, review, or apply any procedures to the 2018 combined financial statements of UPC Holding Group, as defined in note 1 of the combined financial statements, other than with respect to the adjustments and, accordingly, we do not express an opinion or any other form of assurance on the 2018 combined financial statements as a whole.
Denver, Colorado March 16, 2021
II-2

The UPC Holding Group
COMBINED BALANCE SHEETS
December 31,2020 2019
in millionsASSETS
Current assets:Cash and cash equivalents......................................................................................................... € 25.7 € 22.1 Trade receivables, net................................................................................................................ 560.2 195.0 Related-party receivables (note 13)........................................................................................... 19.4 411.8 Derivative instruments (note 6)................................................................................................. 74.7 86.3 Other current assets (note 4)...................................................................................................... 146.5 49.2
Total current assets............................................................................................................... 826.5 764.4
Related-party receivables (note 13)............................................................................................. — 247.7 Property and equipment, net (notes 8 and 10)............................................................................. 2,788.9 1,574.2 Goodwill (note 8)......................................................................................................................... 6,041.6 3,126.3 Intangible assets subject to amortization, net (note 8)................................................................. 2,075.2 28.2 Derivative instruments (note 6)................................................................................................... 283.8 226.6 Operating lease right-of-use (ROU) assets (note 10).................................................................. 1,001.0 120.4 Other assets, net (notes 4, 10, 11 and 13).................................................................................... 286.3 44.6
Total assets............................................................................................................................ € 13,303.3 € 6,132.4
The accompanying notes are an integral part of these combined financial statements.
II-3

The UPC Holding Group
COMBINED BALANCE SHEETS — (Continued)
December 31,2020 2019
in millionsLIABILITIES AND COMBINED EQUITY
Current liabilities:Accounts payable (note 13)....................................................................................................... € 241.4 € 159.5 Deferred revenue (note 4)......................................................................................................... 198.5 191.5 Derivative instruments (note 6)................................................................................................. 76.4 120.3 Current portion of debt and finance lease obligations (notes 9 and 10).................................... 315.6 563.4 Current operating lease liabilities (note 10)............................................................................... 105.3 16.7 Accrued capital expenditures..................................................................................................... 90.4 68.0 Other accrued and current liabilities:Third-party............................................................................................................................... 415.0 197.5 Related-party (note 13)............................................................................................................ 70.6 52.3
Total current liabilities..................................................................................................... 1,513.2 1,369.2 Long-term debt and finance lease obligations (notes 9 and 10):
Third-party................................................................................................................................ 6,006.9 3,224.7 Related-party (note 13).............................................................................................................. 67.6 —
Derivative instruments (note 6)................................................................................................... 605.3 324.6 Long-term operating lease liabilities (note 10)............................................................................ 878.6 106.7 Other long-term liabilities (notes 4, 11, 13 and 14)..................................................................... 557.0 58.7
Total liabilities.................................................................................................................. 9,628.6 5,083.9 Commitments and contingencies (notes 6, 9, 11, 14 and 16)Combined equity (notes 12 and 15):
Parent entities:Contributions and accumulated earnings in excess of distributions..................................... 2,842.5 157.3 Accumulated other comprehensive earnings, net of taxes.................................................... 815.0 872.9
Total combined equity attributable to parent entities....................................................... 3,657.5 1,030.2 Noncontrolling interests............................................................................................................ 17.2 18.3
Total combined equity...................................................................................................... 3,674.7 1,048.5 Total liabilities and combined equity........................................................................ € 13,303.3 € 6,132.4
The accompanying notes are an integral part of these combined financial statements.
II-4
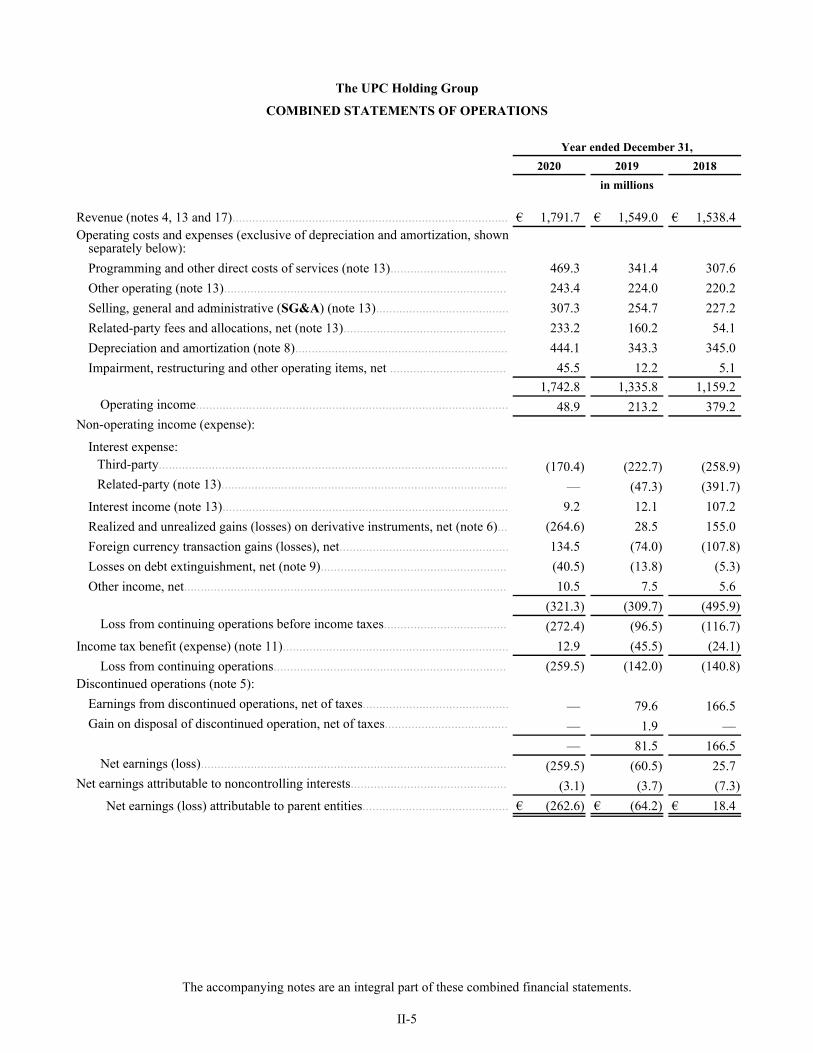
The UPC Holding Group
COMBINED STATEMENTS OF OPERATIONS
Year ended December 31, 2020 2019 2018 in millions
Revenue (notes 4, 13 and 17)................................................................................... € 1,791.7 € 1,549.0 € 1,538.4 Operating costs and expenses (exclusive of depreciation and amortization, shown
separately below):Programming and other direct costs of services (note 13)................................... 469.3 341.4 307.6 Other operating (note 13)..................................................................................... 243.4 224.0 220.2 Selling, general and administrative (SG&A) (note 13)........................................ 307.3 254.7 227.2 Related-party fees and allocations, net (note 13)................................................. 233.2 160.2 54.1 Depreciation and amortization (note 8)................................................................ 444.1 343.3 345.0 Impairment, restructuring and other operating items, net ................................... 45.5 12.2 5.1
1,742.8 1,335.8 1,159.2 Operating income.............................................................................................. 48.9 213.2 379.2
Non-operating income (expense):
Interest expense:Third-party......................................................................................................... (170.4) (222.7) (258.9) Related-party (note 13)...................................................................................... — (47.3) (391.7)
Interest income (note 13)...................................................................................... 9.2 12.1 107.2 Realized and unrealized gains (losses) on derivative instruments, net (note 6)... (264.6) 28.5 155.0 Foreign currency transaction gains (losses), net................................................... 134.5 (74.0) (107.8) Losses on debt extinguishment, net (note 9)........................................................ (40.5) (13.8) (5.3) Other income, net................................................................................................. 10.5 7.5 5.6
(321.3) (309.7) (495.9) Loss from continuing operations before income taxes..................................... (272.4) (96.5) (116.7)
Income tax benefit (expense) (note 11).................................................................... 12.9 (45.5) (24.1) Loss from continuing operations...................................................................... (259.5) (142.0) (140.8)
Discontinued operations (note 5):Earnings from discontinued operations, net of taxes............................................ — 79.6 166.5 Gain on disposal of discontinued operation, net of taxes..................................... — 1.9 —
— 81.5 166.5 Net earnings (loss)............................................................................................ (259.5) (60.5) 25.7
Net earnings attributable to noncontrolling interests............................................... (3.1) (3.7) (7.3) Net earnings (loss) attributable to parent entities............................................ € (262.6) € (64.2) € 18.4
The accompanying notes are an integral part of these combined financial statements.
II-5

The UPC Holding Group
COMBINED STATEMENTS OF COMPREHENSIVE EARNINGS (LOSS)
Year ended December 31, 2020 2019 2018 in millions
Net earnings (loss).................................................................................................... € (259.5) € (60.5) € 25.7 Other comprehensive earnings (loss), net of taxes (note 15):
Continuing operations:Foreign currency translation adjustments............................................................ (40.6) 93.1 82.2 Pension-related adjustments and other................................................................ (17.3) (2.9) (14.7)
Other comprehensive earnings (loss) from continuing operations................... (57.9) 90.2 67.5 Other comprehensive earnings (loss) from discontinued operations (note 5)....... — (0.8) 1.0
Other comprehensive earnings (loss)............................................................. (57.9) 89.4 68.5 Comprehensive earnings (loss).................................................................... (317.4) 28.9 94.2
Comprehensive earnings attributable to noncontrolling interests............................ (3.1) (3.7) (7.3) Comprehensive earnings (loss) attributable to parent entities.......................... € (320.5) € 25.2 € 86.9
The accompanying notes are an integral part of these combined financial statements.
II-6

The UPC Holding Group
COMBINED STATEMENTS OF EQUITY (DEFICIT)
Parent entities
Non-controlling
interests
Totalcombined
deficit
Distributions and
accumulated losses in excess of
contributions
Accumulatedother
comprehensiveearnings,
net of taxes
Total combined
deficit attributable
to parent entities
in millions
Balance at January 1, 2018..................................... € (8,034.2) € 715.0 € (7,319.2) € 20.1 € (7,299.1) Net earnings......................................................... 18.4 — 18.4 7.3 25.7 Other comprehensive earnings, net of taxes (note 15)........................................................... — 68.5 68.5 — 68.5 Conversion of the Shareholder Loan to equity
(note 13)........................................................... 7,240.0 — 7,240.0 — 7,240.0 Distribution to other subsidiaries of Liberty
Global (note 12)............................................... (976.7) — (976.7) — (976.7) Distribution of a related-party receivable (notes 5 and 12)................................................ (933.6) — (933.6) — (933.6) Distribution in connection with the UPC Austria
Distribution (notes 5 and 12)............................ 563.4 — 563.4 (1.2) 562.2 Capital contribution from other Liberty Global
subsidiaries (notes 5 and 12)............................ 350.0 — 350.0 — 350.0 Share-based compensation (note 13)................... 11.8 — 11.8 — 11.8 Deemed contribution from other subsidiaries of
Liberty Global (note 12)................................... 10.6 — 10.6 — 10.6 Deemed contribution of technology-related
services (notes 12 and 13)................................ 9.0 — 9.0 — 9.0 Distributions to noncontrolling interest owners... — — — (8.2) (8.2) Capital charge in connection with the exercise
or vesting of share-based incentive awards (note 13)........................................................... (2.7) — (2.7) — (2.7)
Other, net.............................................................. 3.9 — 3.9 0.6 4.5 Balance at December 31, 2018............................... € (1,740.1) € 783.5 € (956.6) € 18.6 € (938.0)
The accompanying notes are an integral part of these combined financial statements.
II-7

The UPC Holding Group
COMBINED STATEMENTS OF EQUITY (DEFICIT) — (Continued)
Parent entities
Non-controlling
interests
Totalcombined
equity (deficit)
Distributions and
accumulated earnings (loss)
in excess of contributions
Accumulatedother
comprehensiveearnings,
net of taxes
Total combined
equity (deficit)
attributable to parent entities
in millions
Balance at January 1, 2019, before effect of accounting change........................................... € (1,740.1) € 783.5 € (956.6) € 18.6 € (938.0) Impact of ASU No. 2016-02, Leases............... 1.7 — 1.7 — 1.7
Balance at January 1, 2019, as adjusted for accounting change........................................... (1,738.4) 783.5 (954.9) 18.6 (936.3) Net loss............................................................. (64.2) — (64.2) 3.7 (60.5) Other comprehensive earnings, net of taxes (note 15)....................................................... — 89.4 89.4 — 89.4 Distribution in connection with the UPC
Transfers (notes 5 and 12)............................ 1,692.4 — 1,692.4 — 1,692.4 Conversion of the Shareholder Loan to equity
(note 13)........................................................ 1,642.2 — 1,642.2 — 1,642.2 Distribution in connection with the Vodafone
Group Distribution and the UPC DTH Distribution (notes 5 and 12)........................ (1,376.1) — (1,376.1) — (1,376.1)
Share-based compensation (note 13)................ 17.0 — 17.0 — 17.0 Deemed contribution of technology-related
services (notes 12 and 13)............................. 12.6 — 12.6 — 12.6 Capital charge in connection with the exercise
or vesting of share-based incentive awards (note 13)........................................................ (10.9) — (10.9) — (10.9)
Deemed contribution from other subsidiaries of Liberty Global (note 12)........................... 9.8 — 9.8 — 9.8
Other, net.......................................................... (27.1) — (27.1) (4.0) (31.1) Balance at December 31, 2019........................... € 157.3 € 872.9 € 1,030.2 € 18.3 € 1,048.5
The accompanying notes are an integral part of these combined financial statements.
II-8

The UPC Holding Group
COMBINED STATEMENTS OF EQUITY (DEFICIT) — (Continued)
Parent entities
Non-controlling
interests
Totalcombined
equity
Contributions and
accumulated earnings in
excess of distributions
Accumulatedother
comprehensiveearnings,
net of taxes
Total combined
equity attributable
to parent entities
in millions
Balance at January 1, 2020..................................... € 157.3 € 872.9 € 1,030.2 € 18.3 € 1,048.5 Net loss ............................................................... (262.6) — (262.6) 3.1 (259.5) Other comprehensive loss, net of taxes (note 15)........................................................... — (57.9) (57.9) — (57.9) Capital contribution from other Liberty Global
subsidiaries (notes 5 and 12)............................ 3,092.5 — 3,092.5 — 3,092.5 Technology-related transfer pricing transition
fee (note 13)..................................................... (204.6) — (204.6) — (204.6) Deemed contribution of technology-related
services (notes 12 and 13)................................ 46.1 — 46.1 — 46.1 Share-based compensation (note 13)................... 16.8 — 16.8 — 16.8 Deemed contribution from other subsidiaries of
Liberty Global (note 12).................................. 8.3 — 8.3 — 8.3 Capital charge in connection with the exercise
or vesting of share-based incentive awards (note 13)........................................................... (5.4) — (5.4) — (5.4)
Capital charge for technology-related services (note 13)........................................................... (4.3) — (4.3) — (4.3)
Other, net............................................................. (1.6) — (1.6) (4.2) (5.8) Balance at December 31, 2020............................... € 2,842.5 € 815.0 € 3,657.5 € 17.2 € 3,674.7
The accompanying notes are an integral part of these combined financial statements.
II-9

The UPC Holding Group
COMBINED STATEMENTS OF CASH FLOWS
Year ended December 31, 2020 2019 2018 in millions
Cash flows from operating activities:
Net earnings (loss)....................................................................................................... € (259.5) € (60.5) € 25.7 Earnings from discontinued operations....................................................................... — 81.5 166.5 Loss from continuing operations ................................................................................ (259.5) (142.0) (140.8) Adjustments to reconcile loss from continuing operations to net cash provided by
operating activities from continuing operations:Share-based compensation expense........................................................................ 20.0 20.6 12.3 Related-party fees and allocations, net................................................................... 233.2 160.2 54.1 Depreciation and amortization................................................................................ 444.1 343.3 345.0 Impairment, restructuring and other operating items, net....................................... 45.5 12.2 5.1 Non-cash interest on related-party loans................................................................. — 47.3 391.7 Amortization of deferred financing costs and non-cash interest............................. 4.4 5.8 6.7 Realized and unrealized losses (gains) on derivative instruments, net................... 264.6 (28.5) (155.0) Foreign currency transaction losses (gains), net..................................................... (134.5) 74.0 107.8 Losses on debt extinguishment, net........................................................................ 40.5 13.8 5.3 Deferred income tax expense (benefit)................................................................... (31.8) 4.4 1.1 Changes in operating assets and liabilities, net of the effects of acquisitions and
dispositions:Receivables and other operating assets................................................................ 333.5 450.9 369.9 Payables and accruals........................................................................................... (469.0) (366.0) (561.1)
Net cash provided by operating activities of continuing operations................ 491.0 596.0 442.1 Net cash provided by operating activities of discontinued operations............ — 120.3 359.7
Net cash provided by operating activities..................................................... 491.0 716.3 801.8
Cash flows from investing activities:Cash paid in connection with acquisitions, net of cash acquired................................ (4,471.2) (0.4) (4.8) Capital expenditures, net............................................................................................. (206.1) (292.3) (238.2) Repayments from (advances to) related parties, net.................................................... (12.0) (176.5) 628.5 Cash received from the settlement of a related-party receivable................................ — 200.5 — Other investing activities, net...................................................................................... (46.2) (73.8) (24.9)
Net cash provided (used) by investing activities of continuing operations.......... (4,735.5) (342.5) 360.6 Net cash used by investing activities of discontinued operations........................ — (56.3) (183.7)
Net cash provided (used) by investing activities............................................... € (4,735.5) € (398.8) € 176.9
The accompanying notes are an integral part of these combined financial statements.
II-10
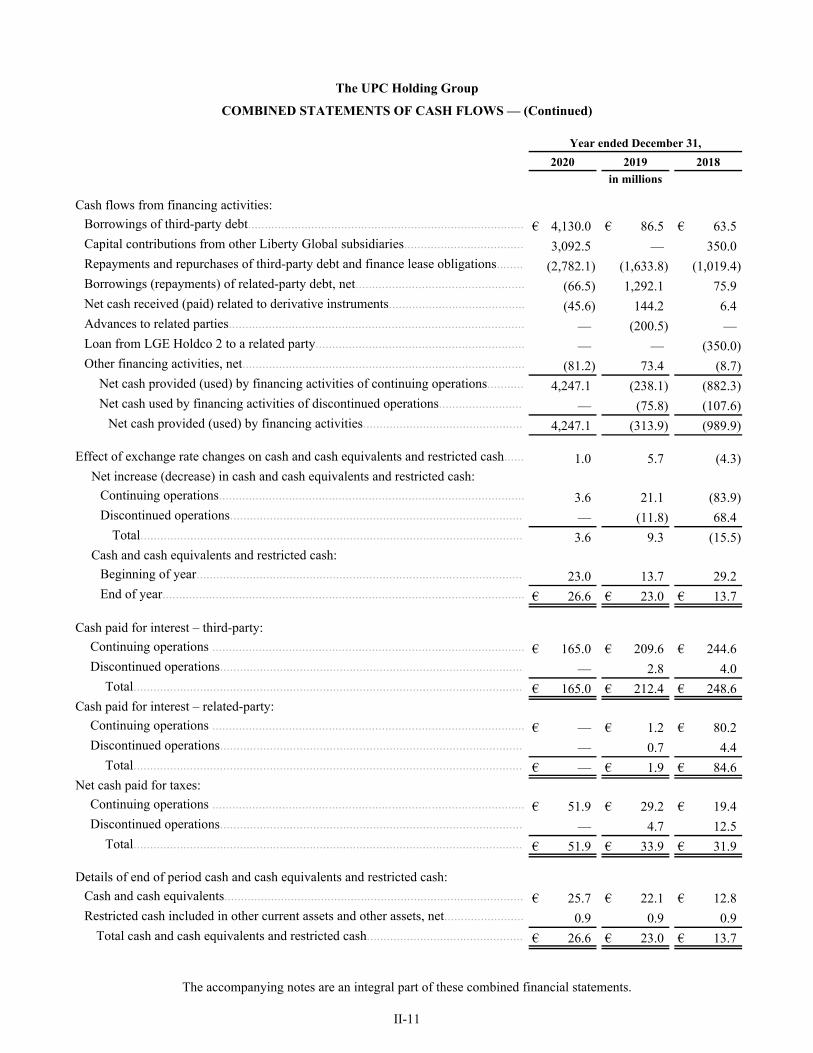
The UPC Holding Group
COMBINED STATEMENTS OF CASH FLOWS — (Continued)
Year ended December 31, 2020 2019 2018 in millions
Cash flows from financing activities:Borrowings of third-party debt................................................................................... € 4,130.0 € 86.5 € 63.5 Capital contributions from other Liberty Global subsidiaries.................................... 3,092.5 — 350.0 Repayments and repurchases of third-party debt and finance lease obligations........ (2,782.1) (1,633.8) (1,019.4) Borrowings (repayments) of related-party debt, net................................................... (66.5) 1,292.1 75.9 Net cash received (paid) related to derivative instruments......................................... (45.6) 144.2 6.4 Advances to related parties......................................................................................... — (200.5) — Loan from LGE Holdco 2 to a related party............................................................... — — (350.0) Other financing activities, net..................................................................................... (81.2) 73.4 (8.7)
Net cash provided (used) by financing activities of continuing operations........... 4,247.1 (238.1) (882.3) Net cash used by financing activities of discontinued operations......................... — (75.8) (107.6)
Net cash provided (used) by financing activities................................................ 4,247.1 (313.9) (989.9)
Effect of exchange rate changes on cash and cash equivalents and restricted cash...... 1.0 5.7 (4.3) Net increase (decrease) in cash and cash equivalents and restricted cash:
Continuing operations............................................................................................ 3.6 21.1 (83.9) Discontinued operations........................................................................................ — (11.8) 68.4
Total................................................................................................................... 3.6 9.3 (15.5) Cash and cash equivalents and restricted cash:
Beginning of year.................................................................................................. 23.0 13.7 29.2 End of year............................................................................................................. € 26.6 € 23.0 € 13.7
Cash paid for interest – third-party:Continuing operations .............................................................................................. € 165.0 € 209.6 € 244.6 Discontinued operations........................................................................................... — 2.8 4.0
Total..................................................................................................................... € 165.0 € 212.4 € 248.6 Cash paid for interest – related-party:
Continuing operations .............................................................................................. € — € 1.2 € 80.2 Discontinued operations........................................................................................... — 0.7 4.4
Total..................................................................................................................... € — € 1.9 € 84.6 Net cash paid for taxes:
Continuing operations .............................................................................................. € 51.9 € 29.2 € 19.4 Discontinued operations........................................................................................... — 4.7 12.5
Total..................................................................................................................... € 51.9 € 33.9 € 31.9
Details of end of period cash and cash equivalents and restricted cash:Cash and cash equivalents.......................................................................................... € 25.7 € 22.1 € 12.8 Restricted cash included in other current assets and other assets, net........................ 0.9 0.9 0.9
Total cash and cash equivalents and restricted cash............................................... € 26.6 € 23.0 € 13.7
The accompanying notes are an integral part of these combined financial statements.
II-11

(1) Basis of Presentation
UPC Holding B.V. (UPC Holding), UPC Slovakia Holding I B.V. (UPC Slovakia) and UPC Poland Holding B.V. (UPC Poland) are wholly-owned subsidiaries of Liberty Global plc (Liberty Global). The accompanying combined financial statements include the historical financial information of UPC Holding and its subsidiaries, UPC Slovakia and its subsidiaries (Slovakia) and UPC Poland and its subsidiaries (Poland) (collectively, the UPC Holding Group).
Prior to certain internal reorganization transactions completed by Liberty Global, Slovakia and Poland were wholly-owned subsidiaries of UPC Holding. In connection with these reorganization transactions, Slovakia and Poland were acquired by other subsidiaries of Liberty Global outside of the UPC Holding Group, herein referred to as “the Slovakia Transaction” and “the Poland Transaction”, respectively. We accounted for the Slovakia Transaction and the Poland Transaction as common control transfers at historical cost. Following these transactions, Slovakia and Poland remain restricted subsidiaries for purposes of the facilities agreement and bond indentures governing the debt of the UPC Holding Group. Accordingly, the accompanying financial statements are prepared in order to comply with the facilities agreement and bond indentures governing the debt of the UPC Holding Group on a combined basis as a result of these changes in reporting entities. In these notes, the terms “we,” “our,” “our company” and “us” may refer, as the context requires, to the UPC Holding Group.
As of December 31, 2020, we provide (i) residential and business-to-business (B2B) communications services in Switzerland, Poland and Slovakia and (ii) mobile services in Switzerland and Poland.
Through July 31, 2019, we provided residential and B2B communication services in Hungary, the Czech Republic and Romania. In addition, (i) through May 2, 2019, we provided direct-to-home satellite (DTH) services to residential customers in Hungary, the Czech Republic, Romania and Slovakia through a Luxembourg-based organization that we refer to as “UPC DTH” and (ii) through July 31, 2018, we provided residential and B2B communication services in Austria. Accordingly, in these combined financial statements, our operations in Austria, Hungary, the Czech Republic and Romania and the operations of UPC DTH are presented as discontinued operations for all applicable periods. For information regarding the disposition of these entities, see note 5.
During the fourth quarter of 2019, we completed (i) the LG Services Transfer and (ii) the UPC France Transfer (each as defined and described in note 5, and together, the UPC Transfers). As the UPC Transfers constitute transactions between entities under common control, we have reflected these transfers at carryover basis and our combined financial statements give effect to these transfers for all periods presented.
These combined financial statements have been prepared in accordance with accounting principles generally accepted in the United States (GAAP).
Unless otherwise indicated, the amounts presented in these notes relate only to our continuing operations, and ownership percentages and convenience translations into euros are calculated as of December 31, 2020.
These combined financial statements reflect our consideration of the accounting and disclosure implications of subsequent events through March 16, 2021, the date of issuance.
The UPC Holding GroupNotes to Combined Financial Statements
December 31, 2020, 2019 and 2018
II-12

(2) Accounting Changes and Recent Accounting Pronouncements
Accounting Changes
ASU 2018-15
In August 2018, the Financial Accounting Standards Board (FASB) issued Accounting Standards Update (ASU) No. 2018-15, Customer’s Accounting for Implementation Costs Incurred in a Cloud Computing Arrangement that is a Service Contract (ASU 2018-15), which requires entities to defer implementation costs incurred that are related to the application development stage in a cloud computing arrangement that is a service contract. ASU 2018-15 requires deferred implementation costs to be amortized over the term of the cloud computing arrangement and presented in the same expense line item as the cloud computing arrangement. All other implementation costs are generally expensed as incurred. We adopted ASU 2018-15 on January 1, 2020 on a prospective basis. As a result of the adoption of ASU 2018-15, (i) certain implementation costs that were previously expensed as incurred are now deferred as prepaid expenses and amortized over the term of the cloud computing arrangement and (ii) certain costs associated with developing interfaces between a cloud computing arrangement and internal-use software that were previously capitalized as property and equipment are now deferred as prepaid expenses and amortized over the term of the cloud computing arrangement. The adoption of ASU 2018-15 did not have a significant impact on our combined financial statements.
ASU 2019-02
In March 2019, the FASB issued ASU No. 2019-02, Improvements to Accounting for Costs of Films and License Agreements for Program Materials (ASU 2019-02), which aligns the accounting for production costs of an episodic television series with the accounting for production costs of films. ASU 2019-02 removes the existing constraint that restricts capitalization of production costs to contracted revenue for episodic television series. The amended guidance also permits entities to test a film or license agreement for impairment at the film group level, addresses cash flow classification and provides new disclosure requirements. We adopted ASU 2019-02 on January 1, 2020 on a prospective basis. The adoption of ASU 2019-02 did not have a significant impact on our combined financial statements.
ASU 2016-13
In June 2016, the FASB issued ASU No. 2016-13, Measurement of Credit Losses on Financial Statements (ASU 2016-13), which changes the recognition model for credit losses related to assets held at amortized cost. ASU 2016-13 eliminates the threshold that a loss must be considered probable to recognize a credit loss and instead requires an entity to reflect its current estimate of lifetime expected credit losses. We adopted ASU 2016-13 on January 1, 2020 on a modified retrospective basis. The adoption of ASU 2016-13 did not have a significant impact on our combined financial statements.
ASU 2016-02
In February 2016, the FASB issued ASU No. 2016-02, Leases (ASU 2016-02), which, for most leases, results in lessees recognizing ROU assets and lease liabilities on the balance sheet. ASU 2016-02, as amended by ASU No. 2018-11, Targeted Improvements, requires lessees and lessors to recognize and measure leases at the beginning of the earliest period presented using one of two modified retrospective approaches. A number of optional practical expedients may be applied in transition. We adopted ASU 2016-02 on January 1, 2019.
The main impact of the adoption of ASU 2016-02 relates to the recognition of ROU assets and lease liabilities on our combined balance sheet for those leases classified as operating leases under previous GAAP. In transition, we have applied the practical expedients that permit us not to reassess (i) whether expired or existing contracts contain a lease under the new standard, (ii) the lease classification for expired or existing leases or (iii) whether previously-capitalized initial direct costs would qualify for capitalization under the new standard. In addition, we have not used hindsight during transition.
We have implemented a new lease accounting system and related internal controls over financial reporting to meet the requirements of ASU 2016-02.
For additional information regarding our leases, see note 10.
The UPC Holding GroupNotes to Combined Financial Statements - (Continued)
December 31, 2020, 2019 and 2018
II-13

Recent Accounting Pronouncements
ASU 2019-12
In December 2019, the FASB issued ASU No. 2019-12, Simplifying the Accounting for Income Taxes (ASU 2019-12), which is intended to improve consistency and simplify several areas of existing guidance. ASU 2019-12 removes certain exceptions to the general principles related to the approach for intraperiod tax allocation, the methodology for calculating income taxes in an interim period and the recognition of deferred tax liabilities for outside basis differences. The new guidance also clarifies the accounting for transactions that result in a step-up in the tax basis of goodwill. ASU 2019-12 is effective for annual reporting periods beginning after December 15, 2020, including interim periods within those fiscal years, with early adoption permitted. We do not expect the adoption of ASU 2019-12 to have a significant impact on our combined financial statements.
(3) Summary of Significant Accounting Policies
Estimates
The preparation of financial statements in conformity with GAAP requires management to make estimates and assumptions that affect the reported amounts of assets and liabilities at the date of the financial statements and the reported amounts of revenue and expenses during the reporting period. Estimates and assumptions are used in accounting for, among other things, the valuation of acquisition-related assets and liabilities, allowances for uncollectible accounts, certain components of revenue, programming and copyright costs, deferred income taxes and related valuation allowances, loss contingencies, fair value measurements, impairment assessments, capitalization of internal costs associated with construction and installation activities, useful lives of long-lived assets, share-based compensation and actuarial liabilities associated with certain benefit plans. Actual results could differ from those estimates.
Principles of Combination
The accompanying combined financial statements include the accounts of the entities described in note 1, all of which are voting interest entities where we or Liberty Global exercise a controlling financial interest through the ownership of a direct or indirect controlling voting interest and variable interest entities for which our company is the primary beneficiary. All significant intercompany accounts and transactions have been eliminated in combination.
Cash and Cash Equivalents and Restricted Cash
Cash equivalents consist of money market funds and other investments that are readily convertible into cash and have maturities of three months or less at the time of acquisition. We record money market funds at the net asset value as there are no restrictions on our ability, contractual or otherwise, to redeem our investments at the stated net asset value.
Restricted cash consists of cash held in restricted accounts, including cash held as collateral for debt and other compensating balances. Restricted cash amounts that are required to be used to purchase long-term assets or repay long-term debt are classified as long-term assets. All other cash that is restricted to a specific use is classified as current or long-term based on the expected timing of the disbursement.
Our significant non-cash investing and financing activities are disclosed in our combined statements of equity (deficit) and in notes 5, 8, 9, 10, 12 and 13.
Cash Flow Statement
For the purpose of determining the classification of cash flows in our combined statements of cash flows, payments on related-party loans are first applied to principal (included as cash flows from financing activities) and then to capitalized interest (included as cash flows from operating activities). Interest-bearing cash advances to related parties and repayments thereof are classified as investing activities. Receipts on related-party receivables are first applied to principal (included as cash flows from investing activities) and then to capitalized interest (included as cash flows from operating activities). All other related-party borrowings, advances and repayments are reflected as financing activities.
The UPC Holding GroupNotes to Combined Financial Statements - (Continued)
December 31, 2020, 2019 and 2018
II-14

For the purpose of our combined statements of cash flows, expenses financed by an intermediary are treated as hypothetical operating cash outflows and hypothetical financing cash inflows when the expenses are incurred. When we pay the financing intermediary, we record financing cash outflows in our combined statements of cash flows.
The capital expenditures that we report in our combined statements of cash flows do not include (i) amounts that are financed under capital-related vendor financing or finance lease arrangements or (ii) purchased assets transferred to our company by another entity under the common control of Liberty Global in exchange for non-cash increases to the Shareholder Loan or non-cash decreases to the LGEF Receivable (each as defined and described in note 13), or non-cash contributions from our parent entities (non-cash related-party capital additions). Instead, these amounts are reflected as non-cash additions to our property and equipment when the underlying assets are delivered, and in the case of capital-related vendor financing and finance lease arrangements and non-cash related-party capital additions that are settled through increases to the Shareholder Loan, as repayments of debt when the principal is repaid.
Trade Receivables
Our trade receivables are reported net of an allowance for doubtful accounts. Such allowance aggregated €24.8 million and €3.7 million at December 31, 2020 and 2019, respectively. The allowance for doubtful accounts is based upon our current estimate of lifetime expected credit losses related to uncollectible accounts receivable. We use a number of factors in determining the allowance, including, among other things, collection trends, prevailing and anticipated economic conditions and specific customer credit risk. The allowance is maintained until either payment is received or the likelihood of collection is considered to be remote.
Concentration of credit risk with respect to trade receivables is limited due to the large number of residential and business customers. We also manage this risk by disconnecting services to customers whose accounts are delinquent.
Financial Instruments
Due to the short maturities of cash and cash equivalents, restricted cash, short-term liquid investments, trade and other receivables, other current assets, accounts payable, accrued liabilities and other accrued and current liabilities, their respective carrying values approximate their respective fair values. For information concerning the fair values of certain of our derivatives and debt, see notes 6 and 9, respectively. For information regarding how we arrive at certain of our fair value measurements, see note 7.
Derivative Instruments
All derivative instruments are recorded on the balance sheet at fair value. As we do not apply hedge accounting to any of our derivative instruments, changes in the fair values of our derivative instruments are recorded in realized and unrealized gains or losses on derivative instruments, net, in our combined statements of operations.
The net cash received or paid related to our derivative instruments is classified as an operating, investing or financing activity in our combined statements of cash flows based on the objective of the derivative instrument and the classification of the applicable underlying cash flows. For derivative contracts that are terminated prior to maturity, the cash paid or received upon termination that relates to future periods is classified as a financing activity in our combined statements of cash flows.
For information regarding our derivative instruments, see note 6.
Property and Equipment
Property and equipment are stated at cost less accumulated depreciation. We capitalize costs associated with the construction of new cable and mobile transmission and distribution facilities and the installation of new cable services. Capitalized construction and installation costs include materials, labor and other directly attributable costs. Installation activities that are capitalized include (i) the initial connection (or drop) from our cable system to a customer location, (ii) the replacement of a drop and (iii) the installation of equipment for additional services, such as digital cable, telephone or broadband internet service. The costs of other customer-facing activities, such as reconnecting and disconnecting customer locations and repairing or maintaining drops, are expensed as incurred. Interest capitalized with respect to construction activities was not material during any of the periods presented.
The UPC Holding GroupNotes to Combined Financial Statements - (Continued)
December 31, 2020, 2019 and 2018
II-15

Capitalized internal-use software is included as a component of property and equipment. We capitalize internal and external costs directly associated with the development of internal-use software. We also capitalize costs associated with the purchase of software licenses. Maintenance and training costs, as well as costs incurred during the preliminary stage of an internal-use software development project, are expensed as incurred.
Depreciation is computed using the straight-line method over the estimated useful life of the underlying asset. Equipment under finance leases is amortized on a straight-line basis over the shorter of the lease term or estimated useful life of the asset. Useful lives used to depreciate our property and equipment are assessed periodically and are adjusted when warranted. The useful lives of cable and mobile distribution systems that are undergoing a rebuild are adjusted such that property and equipment to be retired will be fully depreciated by the time the rebuild is completed. For additional information regarding the useful lives of our property and equipment, see note 8.
Additions, replacements and improvements that extend the asset life are capitalized. Repairs and maintenance are charged to operations.
We recognize a liability for asset retirement obligations in the period in which it is incurred if sufficient information is available to make a reasonable estimate of fair values. Asset retirement obligations may arise from the loss of rights of way that we obtain from local municipalities or other relevant authorities, as well as our obligations under certain lease arrangements to restore the property to its original condition at the end of the lease term. Given the nature of our operations, most of our rights of way and certain leased premises are considered integral to our business. Accordingly, for most of our rights of way and certain lease agreements, the possibility is remote that we will incur significant removal costs in the foreseeable future and, as such, we do not have sufficient information to make a reasonable estimate of fair value for these asset retirement obligations.
As of December 31, 2020 and 2019, the recorded value of our asset retirement obligations was €53.5 million and €2.0 million, respectively.
Intangible Assets
Our primary intangible assets relate to goodwill and customer relationships. Goodwill represents the excess purchase price over the fair value of the identifiable net assets acquired in a business combination. Customer relationships are initially recorded at their fair value in connection with business combinations.
Goodwill is not amortized, but instead is tested for impairment at least annually. Intangible assets with finite lives are amortized on a straight-line basis over their respective estimated useful lives to their estimated residual values and reviewed for impairment.
For additional information regarding the useful lives of our intangible assets, see note 8.
Impairment of Property and Equipment and Intangible Assets
When circumstances warrant, we review the carrying amounts of our property and equipment and our intangible assets (other than goodwill) to determine whether such carrying amounts continue to be recoverable. Such changes in circumstance may include (i) an expectation of a sale or disposal of a long-lived asset or asset group, (ii) adverse changes in market or competitive conditions, (iii) an adverse change in legal factors or business climate in the markets in which we operate and (iv) operating or cash flow losses. For purposes of impairment testing, long-lived assets are grouped at the lowest level for which cash flows are largely independent of other assets and liabilities, generally at or below the reporting unit level (see below). If the carrying amount of the asset or asset group is greater than the expected undiscounted cash flows to be generated by such asset or asset group, an impairment adjustment is recognized. Such adjustment is measured by the amount that the carrying value of such asset or asset group exceeds its fair value. We generally measure fair value by considering (a) sale prices for similar assets, (b) discounted estimated future cash flows using an appropriate discount rate and/or (c) estimated replacement cost. Assets to be disposed of are recorded at the lower of their carrying amount or fair value less costs to sell.
We evaluate goodwill for impairment at least annually on October 1 and whenever facts and circumstances indicate that the carrying amount may not be recoverable. For impairment evaluations, we first make a qualitative assessment to determine if the goodwill may be impaired. If it is more-likely-than-not that a reporting unit’s fair value is less than its carrying value, we then
The UPC Holding GroupNotes to Combined Financial Statements - (Continued)
December 31, 2020, 2019 and 2018
II-16
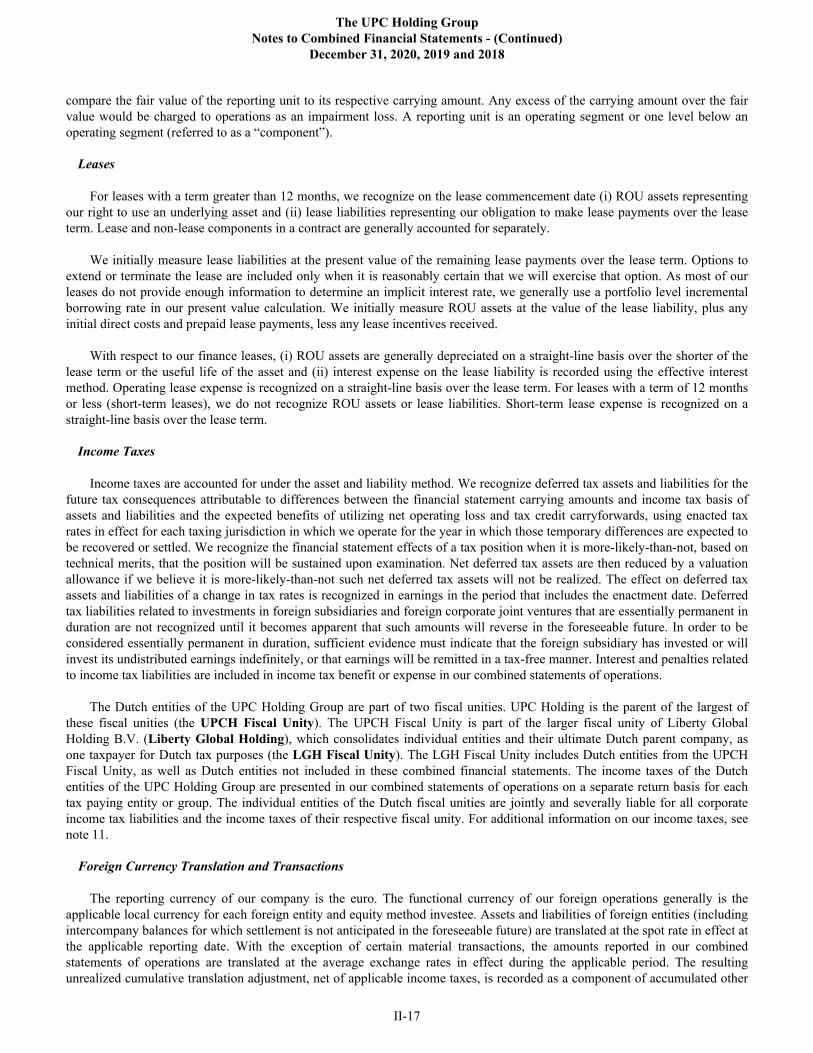
compare the fair value of the reporting unit to its respective carrying amount. Any excess of the carrying amount over the fair value would be charged to operations as an impairment loss. A reporting unit is an operating segment or one level below an operating segment (referred to as a “component”).
Leases
For leases with a term greater than 12 months, we recognize on the lease commencement date (i) ROU assets representing our right to use an underlying asset and (ii) lease liabilities representing our obligation to make lease payments over the lease term. Lease and non-lease components in a contract are generally accounted for separately.
We initially measure lease liabilities at the present value of the remaining lease payments over the lease term. Options to extend or terminate the lease are included only when it is reasonably certain that we will exercise that option. As most of our leases do not provide enough information to determine an implicit interest rate, we generally use a portfolio level incremental borrowing rate in our present value calculation. We initially measure ROU assets at the value of the lease liability, plus any initial direct costs and prepaid lease payments, less any lease incentives received.
With respect to our finance leases, (i) ROU assets are generally depreciated on a straight-line basis over the shorter of the lease term or the useful life of the asset and (ii) interest expense on the lease liability is recorded using the effective interest method. Operating lease expense is recognized on a straight-line basis over the lease term. For leases with a term of 12 months or less (short-term leases), we do not recognize ROU assets or lease liabilities. Short-term lease expense is recognized on a straight-line basis over the lease term.
Income Taxes
Income taxes are accounted for under the asset and liability method. We recognize deferred tax assets and liabilities for the future tax consequences attributable to differences between the financial statement carrying amounts and income tax basis of assets and liabilities and the expected benefits of utilizing net operating loss and tax credit carryforwards, using enacted tax rates in effect for each taxing jurisdiction in which we operate for the year in which those temporary differences are expected to be recovered or settled. We recognize the financial statement effects of a tax position when it is more-likely-than-not, based on technical merits, that the position will be sustained upon examination. Net deferred tax assets are then reduced by a valuation allowance if we believe it is more-likely-than-not such net deferred tax assets will not be realized. The effect on deferred tax assets and liabilities of a change in tax rates is recognized in earnings in the period that includes the enactment date. Deferred tax liabilities related to investments in foreign subsidiaries and foreign corporate joint ventures that are essentially permanent in duration are not recognized until it becomes apparent that such amounts will reverse in the foreseeable future. In order to be considered essentially permanent in duration, sufficient evidence must indicate that the foreign subsidiary has invested or will invest its undistributed earnings indefinitely, or that earnings will be remitted in a tax-free manner. Interest and penalties related to income tax liabilities are included in income tax benefit or expense in our combined statements of operations.
The Dutch entities of the UPC Holding Group are part of two fiscal unities. UPC Holding is the parent of the largest of these fiscal unities (the UPCH Fiscal Unity). The UPCH Fiscal Unity is part of the larger fiscal unity of Liberty Global Holding B.V. (Liberty Global Holding), which consolidates individual entities and their ultimate Dutch parent company, as one taxpayer for Dutch tax purposes (the LGH Fiscal Unity). The LGH Fiscal Unity includes Dutch entities from the UPCH Fiscal Unity, as well as Dutch entities not included in these combined financial statements. The income taxes of the Dutch entities of the UPC Holding Group are presented in our combined statements of operations on a separate return basis for each tax paying entity or group. The individual entities of the Dutch fiscal unities are jointly and severally liable for all corporate income tax liabilities and the income taxes of their respective fiscal unity. For additional information on our income taxes, see note 11.
Foreign Currency Translation and Transactions
The reporting currency of our company is the euro. The functional currency of our foreign operations generally is the applicable local currency for each foreign entity and equity method investee. Assets and liabilities of foreign entities (including intercompany balances for which settlement is not anticipated in the foreseeable future) are translated at the spot rate in effect at the applicable reporting date. With the exception of certain material transactions, the amounts reported in our combined statements of operations are translated at the average exchange rates in effect during the applicable period. The resulting unrealized cumulative translation adjustment, net of applicable income taxes, is recorded as a component of accumulated other
The UPC Holding GroupNotes to Combined Financial Statements - (Continued)
December 31, 2020, 2019 and 2018
II-17

comprehensive earnings or loss in our combined statements of equity (deficit). With the exception of certain material transactions, the cash flows from our operations in foreign countries are translated at the average rate for the applicable period in our combined statements of cash flows. The impacts of material transactions generally are recorded at the applicable spot rates in our combined statements of operations and cash flows. The effect of exchange rates on cash balances held in foreign currencies are separately reported in our combined statements of cash flows.
Transactions denominated in currencies other than our or our combined entities’ functional currencies are recorded based on exchange rates at the time such transactions arise. Changes in exchange rates with respect to amounts recorded on our combined balance sheets related to these non-functional currency transactions result in transaction gains and losses that are reflected in our combined statements of operations as unrealized (based on the applicable period end exchange rates) or realized upon settlement of the transactions.
Revenue Recognition
Service Revenue – Cable Networks. We recognize revenue from the provision of video, broadband internet and fixed-line telephony services over our cable network to customers in the period the related services are provided, with the exception of revenue recognized pursuant to certain contracts that contain promotional discounts, as described below. Installation fees related to services provided over our cable network are generally deferred and recognized as revenue over the contractual period, or longer if the upfront fee results in a material renewal right.
Sale of Multiple Products and Services. We sell video, broadband internet, fixed-line telephony and, in some of our markets, mobile services to our customers in bundled packages at a rate lower than if the customer purchased each product on a standalone basis. Revenue from bundled packages generally is allocated proportionally to the individual products or services based on the relative standalone selling price for each respective product or service.
Mobile Revenue – General. Consideration from mobile contracts is allocated to the airtime service component and the handset component based on the relative standalone selling prices of each component. In markets where we offer handsets and airtime services in separate contracts entered into at the same time, we account for these contracts as a single contract.
Mobile Revenue – Airtime Services. We recognize revenue from mobile services in the period in which the related services are provided. Revenue from prepaid customers is deferred prior to the commencement of services and recognized as the services are rendered or usage rights expire.
Mobile Revenue – Handset Revenue. Revenue from the sale of handsets is recognized at the point in which the goods have been transferred to the customer. Some of our mobile handset contracts that permit the customer to take control of the handset upfront and pay for the handset in installments over a contractual period may contain a significant financing component. For contracts with terms of one year or more, we recognize any significant financing component as revenue over the contractual period using the effective interest method. We do not record the effect of a significant financing component if the contractual period is less than one year.
B2B Revenue. We defer upfront installation and certain nonrecurring fees received on B2B contracts where we maintain ownership of the installed equipment. The deferred fees are amortized into revenue on a straight-line basis, generally over the longer of the term of the arrangement or the expected period of performance.
Contract Costs. Incremental costs to obtain a contract with a customer, such as incremental sales commissions, are generally recognized as assets and amortized to SG&A expenses over the applicable period benefited, which generally is the contract life. If, however, the amortization period is less than one year, we expense such costs in the period incurred.
Promotional Discounts. For subscriber promotions, such as discounted or free services during an introductory period, revenue is recognized uniformly over the contractual period if the contract has substantive termination penalties. If a contract does not have substantive termination penalties, revenue is recognized only to the extent of the discounted monthly fees charged to the subscriber, if any.
Subscriber Advance Payments. Payments received in advance for the services we provide are deferred and recognized as revenue when the associated services are provided.
The UPC Holding GroupNotes to Combined Financial Statements - (Continued)
December 31, 2020, 2019 and 2018
II-18

Sales, Use and Other Value-Added Taxes. Revenue is recorded net of applicable sales, use and other value-added taxes.
For additional information regarding our revenue recognition and related costs, see note 4. For a disaggregation of our revenue by major category and by reportable and geographic segment, see note 17.
Share-based Compensation
We recognize all share-based payments from Liberty Global to employees of our combined entities, including grants of employee share-based incentive awards, based on their grant date fair values and Liberty Global’s estimates of forfeitures. We recognize share-based compensation expense as a charge to operations over the vesting period based on the grant-date fair value of outstanding awards, which may differ from the fair value of such awards on any given date.
We use the straight-line method to recognize share-based compensation expense for Liberty Global’s outstanding share awards to employees of our combined entities that do not contain a performance condition and the accelerated expense attribution method for our outstanding share awards that contain a performance condition and vest on a graded basis.
The grant date fair values for options, share appreciation rights (SARs) and performance-based share appreciation rights (PSARs) are estimated using the Black-Scholes option pricing model, and the grant date fair values for restricted share units (RSUs) and performance-based restricted share units (PSUs) are based upon the closing share price of Liberty Global ordinary shares on the date of grant. Liberty Global considers historical exercise trends in its calculation of the expected life of options and SARs granted by Liberty Global to employees. The expected volatility for options and SARs related to Liberty Global ordinary shares is generally based on a combination of (i) historical volatilities for a period equal to the expected average life of the awards and (ii) volatilities implied from publicly-traded options for Liberty Global ordinary shares.
Litigation Costs
Legal fees and related litigation costs are expensed as incurred.
The UPC Holding GroupNotes to Combined Financial Statements - (Continued)
December 31, 2020, 2019 and 2018
II-19
(4) Revenue Recognition and Related Costs
Contract Balances
If we transfer goods or services to a customer but do not have an unconditional right to payment, we record a contract asset. Contract assets typically arise from the uniform recognition of introductory promotional discounts over the contract period and accrued revenue for handset sales. Our contract assets were €30.4 million and €5.9 million as of December 31, 2020 and 2019, respectively. The current and long-term portions of our contract asset balances are included within other current assets and other assets, net, respectively, on our combined balance sheets.
We record deferred revenue when we receive payment prior to transferring goods or services to a customer. We primarily defer revenue for (i) installation and other upfront services and (ii) other services that are invoiced prior to when services are provided. Our deferred revenue balances were €204.6 million and €193.4 million as of December 31, 2020 and 2019, respectively. The increase in deferred revenue during 2020 is primarily due to the net effect of (a) advanced billings recorded in the period, (b) the recognition of €175.1 million of revenue that was included in our deferred revenue balance at December 31, 2019 and (c) €27.5 million of deferred revenue attributable to the Sunrise Acquisition (as defined and described in note 5). The long-term portions of our deferred revenue balances are included within other long-term liabilities on our combined balance sheets.
Contract Costs
Our aggregate assets associated with incremental costs to obtain our contracts were €35.8 million and €19.4 million at December 31, 2020 and 2019, respectively. The current and long-term portions of our assets related to contract costs are included within other current assets and other assets, net, respectively, on our combined balance sheets. During 2020, 2019 and 2018, we amortized €25.4 million, €21.9 million and €19.0 million, respectively, to operating costs and expenses associated with our assets related to contract costs.
Unsatisfied Performance Obligations
A large portion of our revenue is derived from customers who are not subject to contracts. Revenue from customers who are subject to contracts is generally recognized over the term of such contracts, which is typically 12 months for our residential service contracts, one to three years for our mobile service contracts and one to five years for our B2B service contracts.
The UPC Holding GroupNotes to Combined Financial Statements - (Continued)
December 31, 2020, 2019 and 2018
II-20

(5) Acquisitions, Dispositions and Common Control Transfers
Acquisition
On November 11, 2020, Liberty Global completed the acquisition of Sunrise Communications Group AG (Sunrise) (the Sunrise Acquisition). The Sunrise Acquisition was effected (through a subsidiary of Liberty Global within the UPC Holding Group) through an all cash public tender offer (the Offer) of the outstanding shares of Sunrise (the Sunrise Shares) for CHF 110 per share for a total purchase price of CHF 5.0 billion (€4.6 billion at the transaction date). As of December 31, 2020, we hold 98.9% of the share capital of Sunrise and have initiated a statutory “squeeze-out” procedure according to applicable Swiss law pursuant to which we will acquire the remaining 1.1% of Sunrise Shares that we do not yet own. The “squeeze-out” procedure is expected to be completed during the first half of 2021. As of December 31, 2020, we have recorded a liability of €51.0 million associated with the Sunrise Shares we have not yet acquired.
The Offer was funded through (i) borrowings of CHF 3.2 billion (€3.0 billion at the applicable date) under new term loan facilities and (ii) existing liquidity of Liberty Global received through a €3,092.5 million cash capital contribution from LGE Financing B.V. (LGE Financing). In addition, we used amounts under these term loan facilities to (a) refinance CHF 1.4 billion (€1.3 billion at the applicable date) principal amount of Sunrise’s existing debt and (b) redeem in full CHF 200.0 million (€185.2 million at the applicable date) outstanding principal amount of Sunrise’s senior secured notes. For additional information regarding financing agreements we have entered into in connection with the Sunrise Acquisition, see note 9.
We have accounted for the Sunrise Acquisition using the acquisition method of accounting, whereby the total purchase price (including with respect to the aforementioned squeeze-out procedure) was allocated to the acquired identifiable net assets of Sunrise based on assessments of their respective fair values, and the excess of the purchase price over the fair values of these identifiable net assets was allocated to goodwill. A summary of the preliminary purchase price and the opening balance sheet of Sunrise at the November 11, 2020 acquisition date is presented in the following table. The preliminary opening balance sheet is subject to adjustment based on our final assessment of the fair values of the acquired identifiable assets and liabilities. Although most items in the valuation process remain open, the items with the highest likelihood of changing upon finalization of the valuation process include (i) property and equipment, (ii) goodwill, (iii) intangible assets associated with customer relationships, mobile spectrum assets and trade names and (iv) income taxes (in millions):
Cash and cash equivalents...................................................................................................................................... € 92.2 Trade receivables, net............................................................................................................................................. 415.5 Other current assets................................................................................................................................................ 138.9 Property and equipment, net................................................................................................................................... 1,269.1 Goodwill (a)............................................................................................................................................................ 2,943.7 Intangible assets subject to amortization, net......................................................................................................... 2,111.5 Operating lease ROU assets................................................................................................................................... 889.4 Other assets, net...................................................................................................................................................... 197.3 Current portion of debt and finance lease obligations............................................................................................ (113.1) Current operating lease liabilities........................................................................................................................... (115.9) Other accrued and current liabilities....................................................................................................................... (455.2) Long-term debt and finance lease obligations........................................................................................................ (1,497.1) Long-term operating lease liabilities...................................................................................................................... (745.4) Other long-term liabilities...................................................................................................................................... (520.5)
Total purchase price (b)........................................................................................................................................ € 4,610.4 _______________
(a) The goodwill recognized in connection with the Sunrise Acquisition is primarily attributable to (i) the opportunity to leverage Sunrise’s existing mobile network to gain immediate access to potential customers and (ii) estimated synergy benefits through the integration of Sunrise with our existing operations in Switzerland.
(b) Excludes direct acquisition costs of €23.4 million incurred during 2020.
The UPC Holding GroupNotes to Combined Financial Statements - (Continued)
December 31, 2020, 2019 and 2018
II-21

Unaudited Pro Forma Information
The following unaudited pro forma combined operating results give effect to the Sunrise Acquisition as if it had been completed as of January 1, 2019. These pro forma amounts are not necessarily indicative of the operating results that would have occurred if this transaction had occurred on such date. The pro forma adjustments are based on certain assumptions that we believe are reasonable.
Year ended December 31,2020 2019
in millions
Revenue........................................................................................................................................... € 3,292.9 € 3,257.0 Net loss attributable to parent entities............................................................................................. € (481.1) € (300.8)
Our combined statement of operations for 2020 includes revenue and net loss of €260.9 million and €13.2 million, respectively, attributable to Sunrise.
Dispositions
Vodafone Disposal Group
On July 31, 2019, Liberty Global CEE Group Holding B.V. (LG CEE Group Holding) completed the sale of its operations in Romania, Hungary, and the Czech Republic (collectively referred to herein as the “Vodafone Disposal Group”) to Vodafone Group plc (Vodafone) and certain of its subsidiaries. Just prior to completion of the sale, LG CEE Group Holding and the Vodafone Disposal Group were distributed out of the UPC Holding Group to another subsidiary of Liberty Global (the Vodafone Group Distribution) and therefore are no longer included within the UPC Holding Group. The distribution was accounted for at carryover basis as a transaction under common control. As the Vodafone Disposal Group was already presented as a discontinued operation and LG CEE Group Holding did not have any material activity, other than certain intercompany transactions with other entities of the UPC Holding Group, we did not give retrospective effect to the Vodafone Group Distribution in our combined financial statements. As such, the results and cash flows of the Vodafone Disposal Group (presented as a discontinued operation) and LG CEE Group Holding (presented as a continuing operation) are included in our combined financial statements through July 31, 2019. With the exception of the recognition of a €1.9 million gain related to the sale of shares in UPC Romania SA (UPC Romania) that were owned by UPC Poland, which is still a restricted subsidiary of the UPC Holding Group, the results of the sale of the Vodafone Disposal Group are not reflected in our combined financial statements.
UPC DTH
On May 2, 2019, UPC DTH Holding B.V. (UPC DTH Holding) completed the sale of UPC DTH to M7 Group. Just prior to completion of the sale, UPC DTH Holding and UPC DTH were distributed out of the UPC Holding Group to another subsidiary of Liberty Global (the UPC DTH Distribution) and therefore are no longer included within the UPC Holding Group. As a result of the UPC DTH Distribution, the results of the sale of UPC DTH are not reflected in our combined financial statements. The distribution was accounted for at carryover basis as a transaction under common control. As UPC DTH and UPC DTH Holding were already presented as discontinued operations, we did not give retrospective effect to the UPC DTH Distribution in our combined financial statements.
UPC Austria
On July 31, 2018, Liberty Global Europe Holdco 2 B.V. (LGE Holdco 2) completed the sale of its Austrian operations, “UPC Austria,” to Deutsche Telekom AG (Deutsche Telekom). Just prior to completion of the sale of UPC Austria, UPC Austria and LGE Holdco 2 were distributed out of the UPC Holding Group to another subsidiary of Liberty Global (the UPC Austria Distribution) and therefore are no longer included within the UPC Holding Group. As a result of the UPC Austria Distribution, the results of the sale of UPC Austria are not reflected in our combined financial statements. The distribution was accounted for at carryover basis as a transaction under common control. As UPC Austria was already presented as a discontinued operation and LGE Holdco 2 did not have any material activity, other than certain intercompany transactions with
The UPC Holding GroupNotes to Combined Financial Statements - (Continued)
December 31, 2020, 2019 and 2018
II-22

other entities of the UPC Holding Group, we did not give retrospective effect to the UPC Austria Distribution in our combined financial statements. As such, the results and cash flows of UPC Austria (presented as a discontinued operation) and LGE Holdco 2 (presented as a continuing operation) are included in our combined financial statements through July 31, 2018. In connection with the UPC Austria Distribution we (i) received a capital contribution from LGE Financing of €350.0 million, which was used to fund certain intercompany transactions, including a €350.0 million loan to another subsidiary of Liberty Global by LGE Holdco 2 prior to the UPC Austria Distribution, and (ii) equity-settled a loan receivable of €933.6 million due from LGE Financing, which was established and settled in connection with the UPC Austria Distribution.
Presentation of Discontinued Operations
The operations of the Vodafone Disposal Group, UPC DTH and UPC Austria are presented as discontinued operations in our combined financial statements for 2019 and 2018, as applicable, and are summarized in the following tables. These amounts exclude intercompany revenue and expenses that are eliminated within our combined statements of operations.
Vodafone Disposal
Group (a) UPC DTH (b) Totalin millions
Year ended December 31, 2019Revenue.............................................................................................................. € 331.9 € 32.4 € 364.3 Operating income............................................................................................... € 83.5 € 8.8 € 92.3 Earnings before income taxes............................................................................ 79.7 8.0 87.7 Income tax expense............................................................................................ (8.1) — (8.1) Net earnings attributable to parent entities......................................................... € 71.6 € 8.0 € 79.6
_______________
(a) Includes the operating results of the Vodafone Disposal Group through July 31, 2019, the date the Vodafone Disposal Group was distributed out of the UPC Holding Group.
(b) Includes the operating results of UPC DTH through May 2, 2019, the date UPC DTH was distributed out of the UPC Holding Group.
UPCAustria (a)
Vodafone Disposal Group UPC DTH Total
in millions
Year ended December 31, 2018Revenue................................................................................... € 210.5 € 555.9 € 99.0 € 865.4 Operating income.................................................................... € 85.4 € 122.1 € 8.1 € 215.6 Earnings before income taxes.................................................. 73.6 111.0 6.3 190.9 Income tax benefit (expense)................................................... (19.5) (11.3) 6.4 (24.4) Net earnings............................................................................. 54.1 99.7 12.7 166.5 Net earnings attributable to noncontrolling interests............... 3.5 — — 3.5 Net earnings attributable to parent entities.............................. € 50.6 € 99.7 € 12.7 € 163.0
_______________
(a) Includes the operating results of UPC Austria through July 31, 2018, the date UPC Austria was distributed out of the UPC Holding Group.
The UPC Holding GroupNotes to Combined Financial Statements - (Continued)
December 31, 2020, 2019 and 2018
II-23
Common Control Transfers
During the fourth quarter of 2019, we completed (i) the transfer of Liberty Global Services B.V. (LG Services B.V.) from our company to another subsidiary of Liberty Global outside of the UPC Holding Group (the LG Services Transfer) and (ii) the transfer of UPC France Holding B.V. and its subsidiaries (UPC France) from our company to another subsidiary of Liberty Global outside of the UPC Holding Group (the UPC France Transfer), collectively referred to herein as the “UPC Transfers”. As the UPC Transfers constitute transactions between entities under common control, we have reflected these transfers at carryover basis and our combined financial statements give effect to these transfers for all periods presented.
The UPC Transfers comprised the transfer of (i) 100% of the shares of LG Services B.V. and (ii) 100% of the shares of UPC France for a total distribution of €1,692.4 million, which was settled through a non-cash increase to equity during 2019.
The following table sets forth the retrospective effects of the UPC Transfers on our operating results for the year ended December 31, 2018. These amounts exclude intercompany revenue and expenses that are eliminated within our combined statement of operations.
As previously reported
LG Services Transfer
UPC France Transfer As revised
in millions
Operating income................................................................... € 378.8 € — € 0.4 € 379.2 Non-operating expense, net................................................... € (569.4) € 56.7 € 16.8 € (495.9) Income tax expense................................................................ € (24.5) € — € 0.4 € (24.1) Net earnings (loss)................................................................. € (28.8) € 56.4 € (1.9) € 25.7 Net earnings (loss) attributable to parent entities.................. € (36.1) € 56.4 € (1.9) € 18.4
The UPC Holding GroupNotes to Combined Financial Statements - (Continued)
December 31, 2020, 2019 and 2018
II-24

(6) Derivative Instruments
In general, we enter into derivative instruments to protect against (i) increases in the interest rates on our variable-rate debt and (ii) foreign currency movements, particularly with respect to borrowings that are denominated in a currency other than the functional currency of the borrowing entity. In this regard, through our combined entities, we have entered into various derivative instruments to manage interest rate exposure and foreign currency exposure primarily with respect to the United States (U.S.) dollar ($), the euro (€), the Swiss franc (CHF) and the Polish zloty (PLN). We do not apply hedge accounting to our derivative instruments. Accordingly, changes in the fair values of our derivative instruments are recorded in realized and unrealized gains or losses on derivative instruments, net, in our combined statements of operations.
The following table provides details of the fair values of our derivative instrument assets and liabilities:
December 31, 2020 December 31, 2019
Current Long-term Total Current Long-term Total
in millions
Assets:Cross-currency and interest rate
derivative contracts (a)........................... € 73.8 € 283.7 € 357.5 € 83.1 € 226.2 € 309.3 Foreign currency forward and option
contracts................................................. 0.9 — 0.9 2.7 — 2.7 Other.......................................................... — 0.1 0.1 0.5 0.4 0.9
Total...................................................... € 74.7 € 283.8 € 358.5 € 86.3 € 226.6 € 312.9 Liabilities:
Cross-currency and interest rate derivative contracts (a)........................... € 75.4 € 605.3 € 680.7 € 120.3 € 324.6 € 444.9
Foreign currency forward and option contracts................................................. 1.0 — 1.0 — — — Total...................................................... € 76.4 € 605.3 € 681.7 € 120.3 € 324.6 € 444.9
_______________
(a) We consider credit risk relating to our and our counterparties’ nonperformance in the fair value assessment of our derivative instruments. In all cases, the adjustments take into account offsetting liability or asset positions. The changes in the credit risk valuation adjustments associated with our cross-currency and interest rate derivative contracts resulted in net gains (losses) of €65.0 million, (€21.7 million) and (€11.5 million) during 2020, 2019 and 2018, respectively. These amounts are included in realized and unrealized gains (losses) on derivative instruments, net, in our combined statements of operations. For further information regarding our fair value measurements, see note 7.
The details of our realized and unrealized gains (losses) on derivative instruments, net, are as follows:
Year ended December 31, 2020 2019 2018 in millions
Cross-currency and interest rate derivative contracts.......................................................... € (235.9) € 30.1 € 153.1 Foreign currency forward and option contracts................................................................... (28.2) (2.8) 2.0 Other..................................................................................................................................... (0.5) 1.2 (0.1)
Total................................................................................................................................. € (264.6) € 28.5 € 155.0
The UPC Holding GroupNotes to Combined Financial Statements - (Continued)
December 31, 2020, 2019 and 2018
II-25
The net cash received or paid related to our derivative instruments is classified as an operating, investing or financing activity in our combined statements of cash flows based on the objective of the derivative instrument and the classification of the applicable underlying cash flows. For derivative contracts that are terminated prior to maturity, the cash paid or received upon termination that relates to future periods is classified as a financing activity. The following table sets forth the classification of the net cash inflows (outflows) of our derivative instruments:
Year ended December 31, 2020 2019 2018 in millions
Operating activities.............................................................................................................. € 4.8 € (16.6) € 9.5 Investing activities............................................................................................................... (32.9) — — Financing activities.............................................................................................................. (45.6) 144.2 6.4
Total................................................................................................................................. € (73.7) € 127.6 € 15.9
Counterparty Credit Risk
We are exposed to the risk that the counterparties to our derivative instruments will default on their obligations to us. We manage these credit risks through the evaluation and monitoring of the creditworthiness of, and concentration of risk with, the respective counterparties. In this regard, credit risk associated with our derivative instruments is spread across a relatively broad counterparty base of banks and financial institutions. Collateral is generally not posted by either party under our derivative instruments. At December 31, 2020, our exposure to counterparty credit risk included derivative assets with an aggregate fair value of €63.3 million.
We have entered into derivative instruments under master agreements with each counterparty that contain master netting arrangements that are applicable in the event of early termination by either party to such derivative instrument. The master netting arrangements are limited to the derivative instruments governed by the relevant master agreement and are independent of similar agreements.
Under our derivative contracts, it is generally only the non-defaulting party that has a contractual option to exercise early termination rights upon the default of the other counterparty and to set off other liabilities against sums due upon such termination. However, in an insolvency of a derivative counterparty, under the laws of certain jurisdictions, the defaulting counterparty or its insolvency representatives may be able to compel the termination of one or more derivative contracts and trigger early termination payment liabilities payable by us, reflecting any mark-to-market value of the contracts for the counterparty. Alternatively, or in addition, the insolvency laws of certain jurisdictions may require the mandatory set off of amounts due under such derivative contracts against present and future liabilities owed to us under other contracts between us and the relevant counterparty. Accordingly, it is possible that we may be subject to obligations to make payments, or may have present or future liabilities owed to us partially or fully discharged by set off as a result of such obligations, in the event of the insolvency of a derivative counterparty, even though it is the counterparty that is in default and not us. To the extent that we are required to make such payments, our ability to do so will depend on our liquidity and capital resources at the time. In an insolvency of a defaulting counterparty, we will be an unsecured creditor in respect of any amount owed to us by the defaulting counterparty, except to the extent of the value of any collateral we have obtained from that counterparty.
In addition, where a counterparty is in financial difficulty, under the laws of certain jurisdictions, the relevant regulators may be able to (i) compel the termination of one or more derivative instruments, determine the settlement amount and/or compel, without any payment, the partial or full discharge of liabilities arising from such early termination that are payable by the relevant counterparty or (ii) transfer the derivative instruments to an alternative counterparty.
The UPC Holding GroupNotes to Combined Financial Statements - (Continued)
December 31, 2020, 2019 and 2018
II-26

Details of our Derivative Instruments
In the following tables, we present the details of the various categories of our derivative instruments, the majority of which are held by our subsidiary, UPC Switzerland Holding B.V.
Cross-currency Derivative Contracts
We generally match the denomination of our borrowings with the functional currency of the supporting operations or, when it is more cost effective, we provide for an economic hedge against foreign currency exchange rate movements by using derivative instruments to synthetically convert unmatched debt into the applicable underlying currency. At December 31, 2020, substantially all of our debt was either directly or synthetically matched to the applicable functional currencies of the underlying operations. The following table sets forth the total notional amounts and the related weighted average remaining contractual lives of our cross-currency swap contracts at December 31, 2020:
Notional amount due fromcounterparty
Notional amount due tocounterparty
Weighted averageremaining life
in millions in millions in years
$ 360.0 € 267.9 4.8$ 4,200.0 CHF 3,838.7 (a)(b) 7.0€ 3,418.3 CHF 3,802.7 (a)(b) 4.7€ 707.0 PLN 2,999.5 3.4CHF 740.0 € 701.1 2.0
_______________
(a) Includes certain derivative instruments that are “forward-starting,” such that the initial exchange occurs at a date subsequent to December 31, 2020. These instruments are typically entered into in order to extend existing hedges without the need to amend existing contracts.
(b) Includes amounts subject to a 0.0% floor.
Interest Rate Swap Contracts
The following table sets forth the total euro equivalents of the notional amounts and the related weighted average remaining contractual lives of our interest rate swap contracts at December 31, 2020:
Pay fixed rate Receive fixed rate
Notional amountWeighted average
remaining life Notional amountWeighted average
remaining lifein millions in years in millions in years
€ 9,040.7 (a) 3.5 € 4,065.5 4.9_______________
(a) Includes forward-starting derivative instruments.
Interest Rate Swap Options
From time to time, we enter into interest rate swap options (swaptions), which give us the right, but not the obligation, to enter into certain interest rate swap contracts at set dates in the future. Such contracts typically have a life of no more than three years. At December 31, 2020, the option expiration period on each of our swaptions had expired.
The UPC Holding GroupNotes to Combined Financial Statements - (Continued)
December 31, 2020, 2019 and 2018
II-27

Basis Swaps
Our basis swaps involve the exchange of attributes used to calculate our floating interest rates, including (i) the benchmark rate, (ii) the underlying currency and/or (iii) the borrowing period. We typically enter into these swaps to optimize our interest rate profile based on our current evaluations of yield curves, our risk management policies and other factors. At December 31, 2020, the total euro equivalent of the notional amounts due from the counterparty was €2.7 billion (subject to a 0.0% floor) and the related weighted average remaining contractual life of our basis swap contracts was 0.6 years.
Interest Rate Caps, Floors and Collars
From time to time, we enter into interest rate cap, floor and collar agreements. Purchased interest rate caps and collars lock in a maximum interest rate if variable rates rise, but also allow our company to benefit, to a limited extent in the case of collars, from declines in market rates. Purchased interest rate floors protect us from interest rates falling below a certain level, generally to match a floating rate floor on a debt instrument. At December 31, 2020, we had no interest rate collar agreements, and the total euro equivalents of the notional amounts of our purchased interest rate caps and floors were €400.0 million and €3,499.4 million, respectively.
Impact of Derivative Instruments on Borrowing Costs
Excluding forward-starting instruments, the impact of the derivative instruments that mitigate our foreign currency and interest rate risk, as described above, was an increase of 42 basis points to our borrowing costs as of December 31, 2020.
Foreign Currency Forwards and Options
We enter into foreign currency forward and option contracts with respect to non-functional currency exposure. As of December 31, 2020, the total euro equivalent of the notional amounts of our foreign currency forward and option contracts was €236.6 million.
(7) Fair Value Measurements
We use the fair value method to account for our derivative instruments. The reported fair values of these instruments as of December 31, 2020 are unlikely to represent the value that will be paid or received upon the ultimate settlement or disposition of these assets and liabilities.
GAAP provides for a fair value hierarchy that prioritizes the inputs to valuation techniques used to measure fair value into three broad levels. Level 1 inputs are quoted market prices in active markets for identical assets or liabilities that the reporting entity has the ability to access at the measurement date. Level 2 inputs are inputs other than quoted market prices included within Level 1 that are observable for the asset or liability, either directly or indirectly. Level 3 inputs are unobservable inputs for the asset or liability. We record transfers of assets or liabilities into or out of Levels 1, 2 or 3 at the beginning of the quarter during which the transfer occurred. During the fourth quarter of 2020, certain probability weighted, deal contingent cross-currency, interest rate and foreign currency derivative contracts entered into in connection with the Sunrise Acquisition moved from Level 3 to Level 2 upon the completion of the acquisition.
All of our Level 2 inputs (interest rate futures and swap rates) and certain of our Level 3 inputs (credit spreads) are obtained from pricing services. These inputs, or interpolations or extrapolations thereof, are used in our internal models to calculate, among other items, yield curves, forward interest and currency rates. In the normal course of business, we receive market value assessments from the counterparties to our derivative contracts. Although we compare these assessments to our internal valuations and investigate unexpected differences, we do not otherwise rely on counterparty quotes to determine the fair values of our derivative instruments. The midpoints of applicable bid and ask ranges generally are used as inputs for our internal valuations.
As further described in note 6, we have entered into various derivative instruments to manage our interest rate and foreign
currency exchange risk. The recurring fair value measurements of these instruments are determined using discounted cash flow models. With the exception of the inputs for certain swaptions, most of the inputs to these discounted cash flow models consist of, or are derived from, observable Level 2 data for substantially the full term of these instruments. This observable data mostly includes currency rates, interest rate futures and swap rates, which are retrieved or derived from available market data.
The UPC Holding GroupNotes to Combined Financial Statements - (Continued)
December 31, 2020, 2019 and 2018
II-28

Although we may extrapolate or interpolate this data, we do not otherwise alter this data in performing our valuations. We use a Monte Carlo based approach to incorporate a credit risk valuation adjustment in our fair value measurements to estimate the impact of both our own nonperformance risk and the nonperformance risk of our counterparties. The inputs used for our credit risk valuations, including our and our counterparties’ credit spreads, represent our most significant Level 3 inputs, and these inputs are used to derive the credit risk valuation adjustments with respect to these instruments. As we would not expect these parameters to have a significant impact on the valuations of these instruments, we have determined that these valuations (other than the valuations of the aforementioned swaptions) fall under Level 2 of the fair value hierarchy. Due to the lack of Level 2 inputs for the swaption valuations, we believe these valuations fall under Level 3 of the fair value hierarchy. Our credit risk valuation adjustments with respect to our cross-currency and interest rate swaps are quantified and further explained in note 6.
Fair value measurements are also used in connection with nonrecurring valuations performed in connection with impairment assessments and acquisition accounting. The nonrecurring valuations associated with acquisition accounting primarily include the valuation of reporting units, customer relationship and other intangible assets and property and equipment. Unless a reporting unit has a readily determinable fair value, the valuation of reporting units is based at least in part on discounted cash flow analyses. With the exception of certain inputs for our weighted average cost of capital and discount rate calculations that are derived from pricing services, the inputs used in our discounted cash flow analyses, such as forecasts of future cash flows, are based on our assumptions. The valuation of customer relationships is primarily based on an excess earnings methodology, which is a form of a discounted cash flow analysis. The excess earnings methodology requires us to estimate the specific cash flows expected from the customer relationship, considering such factors as estimated customer life, the revenue expected to be generated over the life of the customer relationship, contributory asset charges and other factors. Tangible assets are typically valued using a replacement or reproduction cost approach, considering factors such as current prices of the same or similar equipment, the age of the equipment and economic obsolescence. All of our nonrecurring valuations use significant unobservable inputs and therefore fall under Level 3 of the fair value hierarchy. During 2020, we performed a nonrecurring fair value measurement associated with the Sunrise Acquisition. The weighted average discount rate used in the preliminary valuation of the customer relationships acquired in connection with the Sunrise Acquisition was 6.75%. We did not perform any significant nonrecurring fair value measurements during 2019. For information regarding the Sunrise Acquisition, see note 5.
At December 31, 2020 and December 31, 2019, all of our derivative instruments fell under Level 2 of the fair value hierarchy, as all of our Level 3 swaptions had expired.
The UPC Holding GroupNotes to Combined Financial Statements - (Continued)
December 31, 2020, 2019 and 2018
II-29

(8) Long-lived Assets
Property and Equipment, Net The details of our property and equipment and the related accumulated depreciation are set forth below:
Estimated useful life at
December 31, 2020December 31,
2020 2019 in millions
Distribution systems...................................................................................... 3 to 30 years € 4,094.8 € 3,125.5 Customer premises equipment...................................................................... 3 to 7 years 702.0 598.1 Support equipment, buildings and land......................................................... 2 to 40 years 779.2 372.3
Total property and equipment, gross.......................................................................................... 5,576.0 4,095.9 Accumulated depreciation............................................................................................................ (2,787.1) (2,521.7)
Total property and equipment, net........................................................................................... € 2,788.9 € 1,574.2
Depreciation expense related to our property and equipment was €382.4 million, €333.7 million and €318.0 million during 2020, 2019 and 2018, respectively.
During 2020, 2019 and 2018, we recorded non-cash increases to our property and equipment related to certain vendor financing arrangements of €309.4 million, €405.4 million and €364.3 million, respectively, which exclude related value-added taxes (VAT) of €43.9 million, €55.3 million and €47.5 million, respectively, that were also financed under these arrangements.
Goodwill
Changes in the carrying amount of our goodwill during 2020 are set forth below:
January 1, 2020
Acquisitionsand relatedadjustments
Foreigncurrency
translationadjustments
December 31,2020
in millions
Switzerland................................................................................... € 2,629.9 € 2,943.7 € 1.6 € 5,575.2 Central and Eastern Europe.......................................................... 496.4 — (30.0) 466.4
Total......................................................................................... € 3,126.3 € 2,943.7 € (28.4) € 6,041.6
If, among other factors, (i) our enterprise value or Liberty Global’s equity value were to decline or (ii) the adverse impacts of economic, competitive, regulatory or other factors were to cause our results of operations or cash flows to be worse than anticipated, we could conclude in future periods that impairment charges are required in order to reduce the carrying values of our goodwill and, to a lesser extent, other long-lived assets. Any such impairment charges could be significant.
Changes in the carrying amount of our goodwill during 2019 are set forth below:
January 1, 2019
Foreigncurrency
translationadjustments
December 31,2019
in millions
Switzerland............................................................................................................ € 2,535.8 € 94.1 € 2,629.9 Central and Eastern Europe................................................................................... 493.0 3.4 496.4
Total.................................................................................................................. € 3,028.8 € 97.5 € 3,126.3
The UPC Holding GroupNotes to Combined Financial Statements - (Continued)
December 31, 2020, 2019 and 2018
II-30

Intangible Assets Subject to Amortization, Net
The details of our intangible assets subject to amortization are set forth below:
Estimated useful life at
December 31, 2020
December 31, 2020 December 31, 2019Gross
carrying amount
Accumulated amortization
Net carrying amount
Gross carrying amount
Accumulated amortization
Net carrying amount
in millions
Customer relationships.... 5 to 11 years € 1,800.9 € (83.9) € 1,717.0 € 65.2 € (37.0) € 28.2 Other............................................................... 372.3 (14.1) 358.2 — — —
Total............................................................. € 2,173.2 € (98.0) € 2,075.2 € 65.2 € (37.0) € 28.2
Amortization expense related to intangible assets with finite useful lives was €61.7 million, €9.6 million and €27.0 million during 2020, 2019 and 2018, respectively. Based on our amortizable intangible asset balances at December 31, 2020, we expect that amortization expense will be as follows for the next five years and thereafter (in millions):
2021........................................................................................................................................................................... € 327.9 2022........................................................................................................................................................................... 322.9 2023........................................................................................................................................................................... 318.4 2024........................................................................................................................................................................... 309.2 2025........................................................................................................................................................................... 305.1 Thereafter................................................................................................................................................................... 491.7
Total....................................................................................................................................................................... € 2,075.2
The UPC Holding GroupNotes to Combined Financial Statements - (Continued)
December 31, 2020, 2019 and 2018
II-31

(9) Debt
The euro equivalents of the components of our combined third-party debt are as follows:
December 31, 2020Principal amountWeighted
average interestrate (a)
Unused borrowing
capacity (b)December 31,
2020 2019 in millions
Parent entities – UPC Holding Senior Notes................................... 4.56 % € — € 1,031.9 € 1,070.7 Combined entities:
UPC Holding Bank Facility (c).................................................... 3.32 % 716.6 3,899.3 — UPCB SPE Notes.......................................................................... 3.80 % — 1,140.0 2,155.2 Vendor financing (d)..................................................................... 1.69 % — 311.0 560.1
Total third-party debt before deferred financing costs and discounts (e)............................................................................. 3.53 % € 716.6 € 6,382.2 € 3,786.0
The following table provides a reconciliation of total third-party debt before deferred financing costs and discounts to total debt and finance lease obligations:
December 31,
2020 2019
in millions
Total third-party debt before deferred financing costs and discounts.............................................. € 6,382.2 € 3,786.0 Deferred financing costs and discounts, net..................................................................................... (80.6) (18.2)
Total carrying amount of third-party debt..................................................................................... 6,301.6 3,767.8 Finance lease obligations (note 10).................................................................................................. 20.9 20.3
Total third-party debt and finance lease obligations.................................................................... 6,322.5 3,788.1 Related-party debt (note 13)............................................................................................................. 67.6 —
Total debt and finance lease obligations................................................................................... 6,390.1 3,788.1 Current maturities of debt and finance lease obligations................................................................. (315.6) (563.4) Long-term debt and finance lease obligations................................................................................. € 6,074.5 € 3,224.7
_______________
(a) Represents the weighted average interest rate in effect at December 31, 2020 for all borrowings outstanding pursuant to each debt instrument, including any applicable margin. The interest rates presented represent stated rates and do not include the impact of derivative instruments, deferred financing costs, original issue premiums or discounts and commitment fees, all of which affect our overall cost of borrowing. Including the effects of derivative instruments, original issue premiums or discounts and commitment fees, but excluding the impact of deferred financing costs, the weighted average interest rate on our aggregate third-party variable- and fixed-rate indebtedness was 4.03% at December 31, 2020. For information regarding our derivative instruments, see note 6.
(b) Unused borrowing capacity represents the maximum availability under the UPC Holding Bank Facility (as defined and described below) at December 31, 2020 without regard to covenant compliance calculations or other conditions precedent to borrowing. At December 31, 2020, based on the most restrictive applicable leverage covenants and leverage-based restricted payment tests, the full €716.6 million of unused borrowing capacity was available to be borrowed and there were no additional restrictions on our ability to make loans or distributions from this availability. Upon completion of the relevant December 31, 2020 compliance reporting requirements, and based on the most restrictive applicable leverage covenants and leverage-based restricted payment tests, we expect the full amount of unused borrowing capacity will continue to be available, with no additional restriction to loan or distribute. Our above
The UPC Holding GroupNotes to Combined Financial Statements - (Continued)
December 31, 2020, 2019 and 2018
II-32
expectations do not consider any actual or potential changes to our borrowing levels or any amounts loaned or distributed subsequent to December 31, 2020, or the impact of additional amounts that may be available to borrow, loan, or distribute under certain defined baskets within the UPC Holding Bank Facility.
(c) Unused borrowing capacity under the UPC Holding Bank Facility comprises (i) €500.0 million under the UPC Revolving Facility (as defined below) and (ii) €216.6 million under the Revolving Facility (as defined within Financing Transactions below), each of which were undrawn at December 31, 2020. During 2020, as a result of the sale of certain entities within the UPC Holding Group in prior years, and an associated reduction in the outstanding debt and Covenant EBITDA (as defined and described in note 13) of the remaining UPC Holding Group, UPC Facility AM was cancelled in full and replaced with a new revolving facility, which bears interest at a rate of EURIBOR + 2.50% and has a final maturity date of May 31, 2026 (the UPC Revolving Facility).
(d) Represents amounts owed to various creditors pursuant to interest-bearing vendor financing arrangements that are used to finance certain of our property and equipment additions and operating expenses. These arrangements extend our repayment terms beyond a vendor’s original due dates (e.g. extension beyond a vendor’s customary payment terms, which are generally 90 days or less) and as such are classified outside of accounts payable on our combined balance sheets. These obligations are generally due within one year and include VAT that was also financed under these arrangements. At December 31, 2020 and 2019, the amounts owed pursuant to these arrangements include €4.9 million and €388.0 million, respectively, related to third-party capital and operating-related vendor financing obligations for which we and LG Services B.V. are co-obligors. LG Services B.V., which is outside of the UPC Holding Group, centrally procures and subsequently transfers property and equipment to other Liberty Global subsidiaries, including those within the UPC Holding Group. For property and equipment transferred to subsidiaries within the UPC Holding Group, we expect to cash settle the related co-obligor amounts with LG Services B.V. in advance of when we and LG Services B.V. are required to settle the obligations with the applicable third parties. Cash payments to LG Services B.V. are reflected as capital expenditures in our combined statements of cash flows, and any cash payments made prior to the settlement of the related third-party obligation are reflected as related-party accounts receivable from LG Services B.V. on our combined balance sheets until the time of settlement. Alternatively, those co-obligor obligations that relate to property and equipment transferred to subsidiaries outside of the UPC Holding Group are reflected on our combined balance sheets as vendor financing obligations and related-party accounts receivable from LG Services B.V. until settlement of the related third-party obligation. Repayments of vendor financing obligations, other than the co-obligor obligations, are included in repayments and repurchases of third-party debt and finance lease obligations in our combined statements of cash flows.
(e) As of December 31, 2020 and 2019, our debt had an estimated fair value of €6,466.5 million and €3,924.8 million, respectively. The estimated fair values of our debt instruments are generally determined using the average of applicable bid and ask prices (mostly Level 1 of the fair value hierarchy). For additional information regarding fair value hierarchies, see note 7.
General Information
Credit Facility. We have entered into a senior secured credit facility agreement with certain financial institutions (the “credit facility”). Our credit facility contains certain covenants, the more notable of which are as follows:
• Our credit facility contains certain net leverage ratios which are required to be complied with (i) on an incurrence basis and/or (ii) when the associated revolving credit facility has been drawn, on a net basis, beyond a specified percentage of the total available revolving credit commitments, on a maintenance basis;
• Subject to certain customary and agreed exceptions, our credit facility contains certain restrictions which, among other things, restrict our ability to (i) incur or guarantee certain financial indebtedness, (ii) make certain disposals and acquisitions, (iii) create certain security interests over our assets and (iv) make certain restricted payments to our direct and/or indirect parent companies through dividends, loans or other distributions;
• Our credit facility requires that we (i) guarantee the payment of all sums payable under the credit facility and (ii) grant first-ranking security over substantially all of our assets to secure the payment of all sums payable thereunder;
The UPC Holding GroupNotes to Combined Financial Statements - (Continued)
December 31, 2020, 2019 and 2018
II-33

• In addition to certain mandatory prepayment events, our credit facility provides that the instructing group of lenders, under certain circumstances, may cancel the group’s commitments thereunder and declare the loan(s) thereunder due and payable at par after the applicable notice period following the occurrence of a change of control (as specified in our credit facility);
• Our credit facility contains certain customary events of default, the occurrence of which, subject to certain exceptions, materiality qualifications and cure rights, would allow the instructing group of lenders to (i) cancel the total commitments, (ii) declare that all or part of the loans be payable on demand and/or (iii) accelerate all outstanding loans and terminate their commitments thereunder;
• Our credit facility requires that we observe certain affirmative and negative undertakings and covenants, which are subject to certain materiality qualifications and other customary and agreed exceptions; and
• In addition to customary default provisions, our credit facility includes certain cross-default provisions with respect to our other indebtedness, subject to agreed minimum thresholds and other customary and agreed exceptions.
Senior Notes. We have issued certain senior notes. In general, our senior notes (i) are senior obligations of the issuer of
such notes that rank equally with all of the existing and future senior debt of such issuer and are senior to all existing and future subordinated debt of such issuer and (ii) are secured by a pledge over the shares of UPC Holding. In addition, the indentures governing our senior notes contain certain covenants, the more notable of which are as follows:
• Subject to certain materiality qualifications and other customary and agreed exceptions, our notes contain (i) certain customary incurrence-based restrictions and (ii) certain restrictions that, among other things, restrict our ability to (a) incur or guarantee certain financial indebtedness, (b) make certain disposals and acquisitions, (c) create certain security interests over our assets and (d) make certain restricted payments to our direct and/or indirect parent companies through dividends, loans or other distributions;
• Our notes provide that any failure to pay principal at its stated maturity (after the expiration of any applicable grace period) of, or any acceleration with respect to, other indebtedness of the issuer or certain subsidiaries over agreed minimum thresholds (as specified under the applicable indenture), is an event of default under the respective notes; and
• If we or certain of our combined entities (as specified in the applicable indenture) sell certain assets, we must, subject to certain materiality qualifications and other customary and agreed exceptions, offer to repurchase the applicable notes at par, or if a change of control (as specified in the applicable indenture) occurs, we must offer to repurchase all of the relevant notes at a redemption price of 101%.
SPE Notes. From time to time, we create special purpose financing entities, which are 100% owned by third parties, for the primary purpose of facilitating the offering of senior secured notes, which we collectively refer to as the “UPCB SPE Notes.” In this regard, UPCB SPE Notes have been issued, and are outstanding at December 31, 2020, by UPCB Finance IV Limited (UPCB Finance IV) and UPCB Finance VII Limited (UPCB Finance VII), collectively the “UPCB SPEs”.
As further described below, the UPCB SPEs used the proceeds from the issuance of UPCB SPE Notes to fund term loan facilities to UPC Financing Partnership (UPC Financing) under the UPC Holding Bank Facility, each a “UPC Funded Facility” and collectively the “UPC Funded Facilities.” Each UPCB SPE is dependent on payments from UPC Financing under the applicable UPC Funded Facility in order to service its payment obligations under each respective UPCB SPE Note. The term loan under each of the UPC Funded Facilities creates a variable interest in the UPCB SPEs for which UPC Financing is the primary beneficiary and is required to consolidate the UPCB SPEs. As a result, the amounts outstanding under the UPC Funded Facilities are eliminated in the UPC Holding Group’s combined financial statements.
Pursuant to the respective indentures for the UPCB SPE Notes (the UPCB SPE Indentures) and the respective accession agreements for the UPC Funded Facilities, the call provisions, maturity and applicable interest rate for each UPC Funded Facility are the same as those of the related UPCB SPE Notes. Each UPCB SPE, as the lender under the UPC Funded Facility, is treated the same as the other lenders under the UPC Holding Bank Facility, with benefits, rights and protections similar to those afforded to the other lenders. Through the covenants in the applicable UPCB SPE Indentures and the applicable security interests over the applicable UPCB SPE’s rights under the relevant UPC Funded Facility granted to secure the UPCB SPE’s
The UPC Holding GroupNotes to Combined Financial Statements - (Continued)
December 31, 2020, 2019 and 2018
II-34

obligations under the relevant UPCB SPE Notes, the holders of the UPCB SPE Notes are provided indirectly with the benefits, rights, protections and covenants granted to the applicable UPCB SPE as lender under the relevant UPC Funded Facility. The UPCB SPEs are prohibited from incurring any additional indebtedness, subject to certain exceptions under the UPCB SPE Indentures.
UPC Holding Senior Notes
The details of the UPC Holding Senior Notes as of December 31, 2020 are summarized in the following table:
Outstanding principal
amount
UPC Holding Senior Notes MaturityInterest
rate
Original issue
amountBorrowing currency
Euroequivalent
Carryingvalue (a)
in millions
UPC Holding 3.875% Senior Notes....... June 15, 2029 3.875% € 635.0 € 594.3 € 594.3 € 591.2 UPC Holding 5.50% Senior Notes......... January 15, 2028 5.500% $ 550.0 $ 535.0 437.6 435.0
Total.................................................................................................................................................... € 1,031.9 € 1,026.2 _______________
(a) Amounts are net of deferred financing costs and discounts, where applicable.
Subject to the circumstances described below, the UPC Holding 3.875% Senior Notes are non-callable prior to June 15, 2022 and the UPC Holding 5.50% Senior Notes are non-callable prior to October 15, 2022. At any time prior to June 15, 2022, in the case of the UPC Holding 3.875% Senior Notes, and October 15, 2022, in the case of the UPC Holding 5.50% Senior Notes, the UPC Holding Group may redeem some or all of such UPC Holding Senior Notes by paying a “make-whole” premium, which is the present value of all remaining scheduled interest payments to June 15, 2022 or October 15, 2022 (as applicable) using the discount rate (as specified in the applicable indenture) as of the redemption date plus 50 basis points.
We may redeem some or all of the UPC Holding Senior Notes at the following redemption prices (expressed as a percentage of the principal amount), plus accrued and unpaid interest and additional amounts (as specified in the applicable indenture), if any, to the applicable redemption date, as set forth below:
Redemption priceUPC Holding
3.875%Senior Notes
UPC Holding 5.50%
Senior Notes
12-month period commencing................................................................................................... June 15 October 15
2022............................................................................................................................................ 101.938% 102.750%2023............................................................................................................................................ 100.969% 101.375%2024............................................................................................................................................ 100.484% 100.688%2025 and thereafter..................................................................................................................... 100.000% 100.000%
The UPC Holding GroupNotes to Combined Financial Statements - (Continued)
December 31, 2020, 2019 and 2018
II-35

UPCB SPE Notes
The details of the UPCB SPE Notes as of December 31, 2020 are summarized in the following table:
Outstanding principal
amount
UPCB SPE Notes MaturityInterest
rate
Original issue
amountBorrowingcurrency
Euroequivalent
Carryingvalue (a)
in millions
UPCB Finance IV Euro Notes................ January 15, 2027 4.000% € 600.0 € 540.0 € 540.0 € 537.4 UPCB Finance VII Euro Notes............... June 15, 2029 3.625% € 600.0 € 600.0 600.0 596.2
Total..................................................................................................................................................... € 1,140.0 € 1,133.6 _______________
(a) Amounts are net of deferred financing costs and discounts, where applicable.
Subject to the circumstances described below, the UPCB Finance IV Euro Notes are non-callable prior to January 15, 2021 and the UPCB Finance VII Euro Notes are non-callable prior to June 15, 2022 (each a UPCB SPE Notes Call Date). If, however, at any time prior to the applicable UPCB SPE Notes Call Date, all or a portion of the loans under the related UPC Funded Facility are voluntarily prepaid (an Early Redemption Event), then the relevant UPCB SPE will be required to redeem an aggregate principal amount of its UPCB SPE Notes equal to the aggregate principal amount of the loans prepaid under the relevant UPC Funded Facility. In general, the redemption price payable will equal 100% of the principal amount of the UPCB SPE Note to be redeemed and a “make-whole” premium, which is the present value of all remaining scheduled interest payments to the applicable UPCB SPE Notes Call Date using the discount rate (as specified in the applicable UPCB SPE Indenture) as of the redemption date plus 50 basis points.
Upon the occurrence of an Early Redemption Event on or after the UPCB SPE Notes Call Date, the relevant UPCB SPE will redeem an aggregate principal amount of its UPCB SPE Notes equal to the principal amount of the related UPC Funded Facility prepaid at the following redemption prices (expressed as a percentage of the principal amount), plus accrued and unpaid interest and additional amounts (as specified in the applicable UPCB SPE Indenture), if any, to the applicable redemption date, as set forth below:
UPCB Finance IV Euro Notes
UPCB Finance VII Euro Notes
12-month period commencing........................................................................................ January 15 June 15
2021................................................................................................................................. 102.000% N.A.2022................................................................................................................................. 101.000% 101.813%2023................................................................................................................................. 100.500% 100.906%2024................................................................................................................................. 100.000% 100.453%2025 and thereafter.......................................................................................................... 100.000% 100.000%
The UPC Holding GroupNotes to Combined Financial Statements - (Continued)
December 31, 2020, 2019 and 2018
II-36
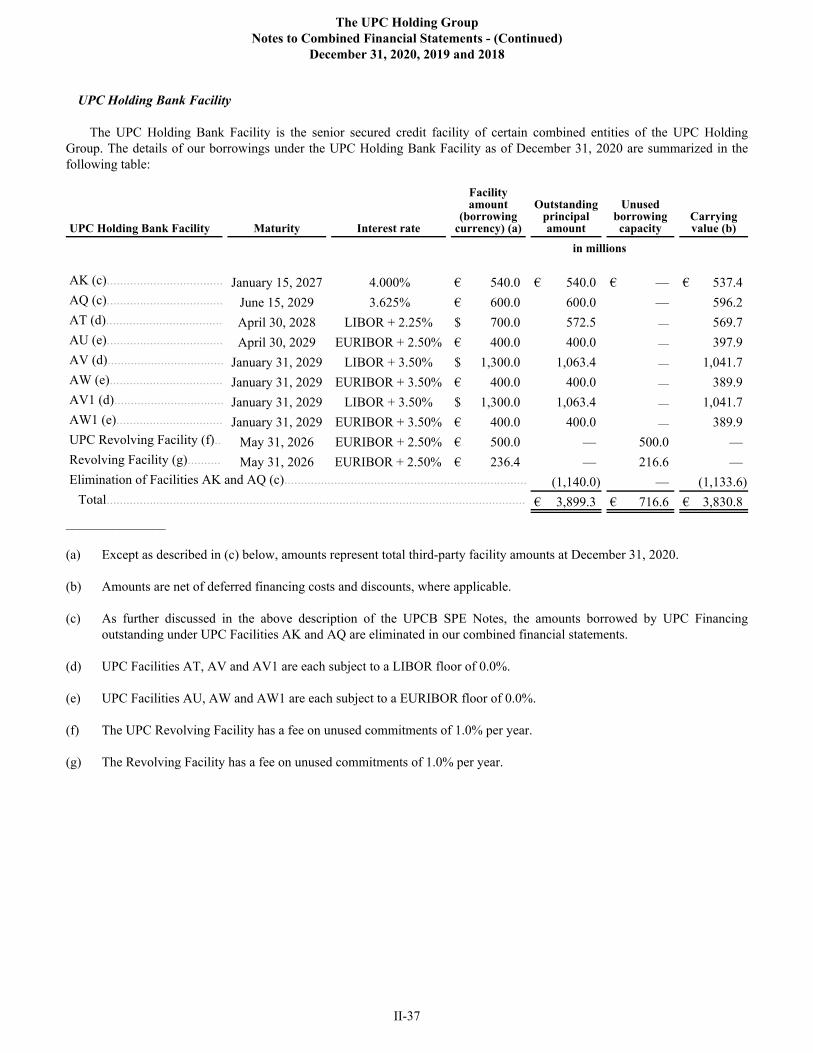
UPC Holding Bank Facility
The UPC Holding Bank Facility is the senior secured credit facility of certain combined entities of the UPC Holding Group. The details of our borrowings under the UPC Holding Bank Facility as of December 31, 2020 are summarized in the following table:
UPC Holding Bank Facility Maturity Interest rate
Facility amount
(borrowing currency) (a)
Outstanding principal amount
Unusedborrowingcapacity
Carryingvalue (b)
in millions
AK (c)................................... January 15, 2027 4.000% € 540.0 € 540.0 € — € 537.4 AQ (c)................................... June 15, 2029 3.625% € 600.0 600.0 — 596.2 AT (d)................................... April 30, 2028 LIBOR + 2.25% $ 700.0 572.5 — 569.7 AU (e)................................... April 30, 2029 EURIBOR + 2.50% € 400.0 400.0 — 397.9 AV (d)................................... January 31, 2029 LIBOR + 3.50% $ 1,300.0 1,063.4 — 1,041.7 AW (e).................................. January 31, 2029 EURIBOR + 3.50% € 400.0 400.0 — 389.9 AV1 (d)................................. January 31, 2029 LIBOR + 3.50% $ 1,300.0 1,063.4 — 1,041.7 AW1 (e)................................ January 31, 2029 EURIBOR + 3.50% € 400.0 400.0 — 389.9 UPC Revolving Facility (f).. May 31, 2026 EURIBOR + 2.50% € 500.0 — 500.0 — Revolving Facility (g).......... May 31, 2026 EURIBOR + 2.50% € 236.4 — 216.6 — Elimination of Facilities AK and AQ (c)......................................................................... (1,140.0) — (1,133.6)
Total.............................................................................................................................. € 3,899.3 € 716.6 € 3,830.8 _______________
(a) Except as described in (c) below, amounts represent total third-party facility amounts at December 31, 2020.
(b) Amounts are net of deferred financing costs and discounts, where applicable.
(c) As further discussed in the above description of the UPCB SPE Notes, the amounts borrowed by UPC Financing outstanding under UPC Facilities AK and AQ are eliminated in our combined financial statements.
(d) UPC Facilities AT, AV and AV1 are each subject to a LIBOR floor of 0.0%.
(e) UPC Facilities AU, AW and AW1 are each subject to a EURIBOR floor of 0.0%.
(f) The UPC Revolving Facility has a fee on unused commitments of 1.0% per year.
(g) The Revolving Facility has a fee on unused commitments of 1.0% per year.
The UPC Holding GroupNotes to Combined Financial Statements - (Continued)
December 31, 2020, 2019 and 2018
II-37

Financing Transactions
Below we provide summary descriptions of certain financing transactions completed during 2020, 2019 and 2018. Certain of our financing transactions may include non-cash borrowings and repayments. During 2020, 2019 and 2018 there were no non-cash borrowings and repayments of debt.
2020 Financing Transactions
In January 2020, we entered into (i) a $700.0 million (€572.6 million) term loan facility (UPC Facility AT) and (ii) a €400.0 million term loan facility (UPC Facility AU). UPC Facility AT was issued at 99.75% of par, matures on April 30, 2028 and bears interest at a rate of LIBOR + 2.25%, subject to a LIBOR floor of 0.0%. UPC Facility AU was issued at 99.875% of par, matures on April 30, 2029 and bears interest at a rate of EURIBOR + 2.50%, subject to a EURIBOR floor of 0.0%. The net proceeds from these facilities were used to prepay in full the $1,140.0 million (€932.5 million) outstanding principal amount under UPC Facility AL, together with accrued and unpaid interest and the related prepayment premiums, which was owed to UPCB Finance IV and, in turn, UPCB Finance IV used such proceeds to redeem in full the $1,140.0 million outstanding principal amount of UPCB Finance IV Dollar Notes. In connection with this transaction, we recognized a loss on debt extinguishment of €32.5 million related to (a) the payment of €28.1 million of redemption premiums and (b) the write-off of €4.4 million of unamortized deferred financing costs and discounts.
In August 2020, in connection with the Sunrise Acquisition, we entered into (i) a $1,300.0 million (€1,063.4 million) term loan facility (UPC Facility AV), (ii) a €400.0 million term loan facility (UPC Facility AW), (iii) a $1,300.0 million term loan facility (UPC Facility AV1), (iv) a €400.0 million term loan facility (UPC Facility AW1) and (v) a €236.4 million equivalent multi-currency revolving facility, part of which has been made available as an ancillary facility (the Revolving Facility, and together with UPC Facility AV, UPC Facility AW, UPC Facility AV1 and UPC Facility AW1, the UPC Sunrise Facilities). UPC Facility AV and UPC Facility AV1 were each issued at 99.0% of par, mature on January 31, 2029 and bear interest at a rate of LIBOR + 3.50%, subject to a LIBOR floor of 0.0%. UPC Facility AW and UPC Facility AW1 were each issued at 98.5% of par, mature on January 31, 2029 and bear interest at a rate of EURIBOR + 3.50%, subject to a EURIBOR floor of 0.0%. The Revolving Facility matures on May 31, 2026 and bears interest at a rate of EURIBOR + 2.50%. The Revolving Facility, which is only available to be utilized by the borrowers under UPC Facility AV1 and UPC Facility AW1 and the entities acquired in the Sunrise Acquisition, can be used for ongoing working capital requirements and general corporate purposes.
In November 2020, upon completion of the Sunrise Acquisition, the proceeds from (i) UPC Facility AV and UPC Facility AW, together with existing liquidity of Liberty Global, were used to fund the Offer and (ii) UPC Facility AV1 and UPC Facility AW1 were used to refinance the existing debt of Sunrise, as further described in note 5. In connection with these transactions, we recognized a net loss on debt extinguishment of €7.1 million primarily related to (a) the payment of €11.0 million of redemption premiums and (b) the write-off of €4.3 million of unamortized deferred financing costs, discounts and premiums.
2019 and 2018 Financing Transactions
During 2019 and 2018, we completed a number of financing transactions that generally resulted in lower interest rates and extended maturities. In connection with these transactions, we recognized losses on debt extinguishment of €13.8 million and €5.3 million during 2019 and 2018, respectively. These losses include (i) the write-off of unamortized deferred financing costs and discounts of €13.8 million and €5.9 million, respectively, and (ii) during 2018, the payment of €1.8 million of redemption premiums.
The UPC Holding GroupNotes to Combined Financial Statements - (Continued)
December 31, 2020, 2019 and 2018
II-38

Maturities of Debt
Maturities of our debt as of December 31, 2020 are presented below and represent euro equivalents based on December 31, 2020 exchange rates:
Third-party debt
Related-party debt Total
in millions
Year ending December 31:2021 (a)............................................................................................................... € 311.0 € — € 311.0 2022..................................................................................................................... — — — 2023..................................................................................................................... — — — 2024..................................................................................................................... — — — 2025..................................................................................................................... — — — Thereafter............................................................................................................ 6,071.2 67.6 6,138.8 Total debt maturities (b).................................................................................... 6,382.2 67.6 6,449.8
Deferred financing costs and discounts, net........................................................... (80.6) — (80.6) Total debt.......................................................................................................... € 6,301.6 € 67.6 € 6,369.2
Current portion....................................................................................................... € 311.0 € — € 311.0 Noncurrent portion................................................................................................. € 5,990.6 € 67.6 € 6,058.2
_______________
(a) Maturities in year 2021 represent amounts related to vendor financing obligations.
(b) Amounts include the UPCB SPE Notes issued by the UPCB SPEs. As described above, the UPCB SPEs are included in our combined financial statements.
The UPC Holding GroupNotes to Combined Financial Statements - (Continued)
December 31, 2020, 2019 and 2018
II-39

(10) Leases
General
We enter into operating and finance leases for network equipment, real estate and vehicles. We provide residual value guarantees on certain of our vehicle leases.
Lease Balances
A summary of our ROU assets and lease liabilities is set forth below:
December 31,2020 2019
in millions
ROU assets:Operating leases (a)....................................................................................................................... € 1,001.0 € 120.4 Finance leases (b).......................................................................................................................... 15.3 16.7
Total ROU assets........................................................................................................................ € 1,016.3 € 137.1
Lease liabilities:Operating leases............................................................................................................................ € 983.9 € 123.4 Finance leases (c).......................................................................................................................... 20.9 20.3
Total lease liabilities................................................................................................................... € 1,004.8 € 143.7 _______________
(a) At December 31, 2020, the weighted average remaining lease term for operating leases was 14.1 years and the weighted average discount rate was 6.1%. During 2020 and 2019, we recorded non-cash additions to our operating lease ROU assets of €18.3 million and €12.8 million, respectively.
(b) Our finance lease ROU assets are included in property and equipment, net, on our combined balance sheets. At December 31, 2020, the weighted average remaining lease term for finance leases was 6.3 years and the weighted average discount rate was 6.3%. During 2020, 2019 and 2018, we recorded non-cash additions to our finance lease ROU assets of €2.1 million, €3.3 million and €1.9 million, respectively.
(c) The current and long-term portions of our finance lease obligations are included within current portion of debt and finance lease obligations and long-term debt and finance lease obligations, respectively, on our combined balance sheets.
A summary of our aggregate lease expense is set forth below:
Year ended December 31,
2020 2019in millions
Finance lease expense:Depreciation and amortization...................................................................................................... € 2.9 € 2.4 Interest expense............................................................................................................................. 1.1 1.2
Total finance lease expense........................................................................................................ 4.0 3.6 Operating lease expense (a)............................................................................................................. 39.5 29.7 Short-term lease expense (a)........................................................................................................... 5.6 4.8 Variable lease expense (b)............................................................................................................... 2.8 3.1
Total lease expense.................................................................................................................. € 51.9 € 41.2
The UPC Holding GroupNotes to Combined Financial Statements - (Continued)
December 31, 2020, 2019 and 2018
II-40

_______________
(a) Operating lease expense and short-term lease expense are included in other operating expenses, SG&A expenses and impairment, restructuring and other operating items, net in our combined statements of operations.
(b) Variable lease expense represents payments made to a lessor during the lease term that vary because of a change in circumstance that occurred after the lease commencement date. Variable lease payments are expensed as incurred and are included in other operating expenses in our combined statements of operations.
A summary of our cash outflows from operating and finance leases is set forth below:
Year ended December 31,
2020 2019in millions
Cash paid for amounts included in the measurement of lease liabilities:Operating cash outflows from operating leases............................................................................. € 27.0 € 31.2 Operating cash outflows from finance leases................................................................................ 1.1 1.2 Financing cash outflows from finance leases................................................................................ 3.5 3.4 Total cash outflows from operating and finance leases............................................................... € 31.6 € 35.8
Maturities of our operating and finance lease obligations as of December 31, 2020 are presented below and represent euro equivalents based on December 31, 2020 exchange rates:
Operating leases
Finance leases
in millions
Year ending December 31:2021............................................................................................................................................... € 128.3 € 5.9 2022............................................................................................................................................... 122.2 3.9 2023............................................................................................................................................... 116.8 4.0 2024............................................................................................................................................... 110.5 2.9 2025............................................................................................................................................... 104.6 2.7 Thereafter...................................................................................................................................... 921.7 6.2 Total payments............................................................................................................................ 1,504.1 25.6
Less: present value discount............................................................................................................. (520.2) (4.7) Present value of lease payments.................................................................................................. € 983.9 € 20.9
Current portion................................................................................................................................. € 105.3 € 4.6 Noncurrent portion........................................................................................................................... € 878.6 € 16.3
The UPC Holding GroupNotes to Combined Financial Statements - (Continued)
December 31, 2020, 2019 and 2018
II-41

(11) Income Taxes
The Dutch entities of the UPC Holding Group are part of two fiscal unities. UPC Holding is the parent of the UPCH Fiscal Unity. The UPCH Fiscal Unity is part of LGH Fiscal Unity, which consolidates individual entities and their ultimate Dutch parent company as one taxpayer for Dutch tax purposes. The LGH Fiscal Unity includes Dutch entities from the UPCH Fiscal Unity, as well as Dutch entities not included in these combined financial statements. Tax amounts allocated between members of the LGH Fiscal Unity are not subject to tax-sharing agreements and no cash payments are made between the companies related to the Dutch tax attributes. Accordingly, any related-party tax allocations are reflected as an adjustment to parent entities in our combined statements of equity (deficit). During the periods presented in these combined financial statements, the majority of the related-party tax allocations represented tax benefits generated by Dutch entities that were recorded net of applicable valuation allowances. Therefore, these related-party tax allocations resulted in no net tax allocations. The income taxes of entities that are not included within the UPCH Fiscal Unity are included in our combined financial statements on a separate return basis for each tax-paying entity or group based on the local tax law.
For tax purposes, the net operating losses generated in the year by Dutch entities of the UPCH Fiscal Unity can be offset with taxable income of non-UPC Holding Group subsidiaries within the LGH Fiscal Unity. The UPCH Fiscal Unity and LGH Fiscal Unity do not operate under a tax sharing agreement and no cash payments are made between the companies related to Dutch tax liabilities.
The domestic Dutch fiscal unities and foreign components of our loss from continuing operations before income taxes are as follows:
Year ended December 31,
2020 2019 2018 in millions
The Netherlands............................................................................................................ € (261.5) € (268.2) € (251.9) Switzerland................................................................................................................... (11.2) 159.0 262.9 Intercompany activity with discontinued operations.................................................... — (31.5) (66.0) Other............................................................................................................................. 0.3 44.2 (61.7)
Total.......................................................................................................................... € (272.4) € (96.5) € (116.7)
Income tax benefit (expense) consists of:
Current Deferred Total in millions
Year ended December 31, 2020 :Switzerland............................................................................................................... € (3.4) € 34.2 € 30.8 Other......................................................................................................................... (15.5) (2.4) (17.9)
Total...................................................................................................................... € (18.9) € 31.8 € 12.9 Year ended December 31, 2019:
Switzerland............................................................................................................... € (24.8) € (0.9) € (25.7) Other......................................................................................................................... (16.3) (3.5) (19.8)
Total...................................................................................................................... € (41.1) € (4.4) € (45.5) Year ended December 31, 2018:
Switzerland............................................................................................................... € (13.1) € 6.3 € (6.8) Other......................................................................................................................... (9.9) (7.4) (17.3)
Total...................................................................................................................... € (23.0) € (1.1) € (24.1)
The UPC Holding GroupNotes to Combined Financial Statements - (Continued)
December 31, 2020, 2019 and 2018
II-42

Income tax benefit (expense) attributable to our loss from continuing operations before income taxes differs from the amounts computed using the Dutch income tax rate of 25.0% as a result of the following factors:
Year ended December 31,
2020 2019 2018
in millions
Computed “expected” tax benefit.................................................................................. € 68.1 € 24.1 € 29.2 Change in valuation allowances..................................................................................... (64.3) (70.1) (50.5) Non-deductible or non-taxable interest and other expenses.......................................... 12.7 (9.9) (55.2) Basis and other differences in the treatment of items associated with investments in
the UPC Holding Group entities................................................................................. (2.1) (1.4) 45.5 International rate differences.......................................................................................... 0.3 8.7 5.8 Recognition of previously unrecognized tax benefits.................................................... — 1.9 1.0 Other, net........................................................................................................................ (1.8) 1.2 0.1
Total income tax benefit (expense)............................................................................ € 12.9 € (45.5) € (24.1)
On December 23, 2020, legislation was enacted in the Netherlands to eliminate the corporate income tax rate reduction that had previously been enacted in December 2019. As a result, the corporate income tax rate remains at 25.0% in 2021 instead of reducing to 21.7%. Substantially all of the impacts of this new rate change on our deferred tax balances were recorded during the fourth quarter of 2020, modifying the impacts of the 2019 rate change that were previously recorded during the fourth quarter of 2019. The net impact of these income tax rate changes is not significant due to the valuation allowance recorded against these net assets.
The components of our net deferred tax liabilities are as follows:
December 31, 2020 2019 in millions
Deferred tax assets (a)............................................................................................................................. € 16.9 € 0.7 Deferred tax liabilities (a)........................................................................................................................ (410.6) (33.3)
Net deferred tax liability..................................................................................................................... € (393.7) € (32.6) _______________
(a) Our deferred tax assets and liabilities are included in other assets, net, and other long-term liabilities, respectively, on our combined balance sheets.
The UPC Holding GroupNotes to Combined Financial Statements - (Continued)
December 31, 2020, 2019 and 2018
II-43

The tax effects of temporary differences that give rise to a significant portion of our deferred tax assets and deferred tax liabilities are presented below:
December 31, 2020 2019 in millions
Deferred tax assets:Net operating loss and other carryforwards...................................................................................... € 1,542.7 € 1,249.8 Leases............................................................................................................................................... 116.9 4.4 Derivative instruments..................................................................................................................... 95.1 30.4 Debt.................................................................................................................................................. 81.4 38.0 Other future deductible amounts...................................................................................................... 43.1 10.9 Deferred tax assets.......................................................................................................................... 1,879.2 1,333.5
Valuation allowance......................................................................................................................... (1,677.1) (1,315.6) Deferred tax assets, net of valuation allowance........................................................................... 202.1 17.9
Deferred tax liabilities:Intangible assets............................................................................................................................... (351.3) (4.2) ROU assets....................................................................................................................................... (119.1) (3.2) Property and equipment, net............................................................................................................. (80.1) (33.0) Debt.................................................................................................................................................. (37.3) (3.7) Other future taxable amounts........................................................................................................... (8.0) (6.4) Deferred tax liabilities.................................................................................................................... (595.8) (50.5)
Net deferred tax liability.............................................................................................................. € (393.7) € (32.6)
Our deferred income tax valuation allowance, including equity items, increased €361.5 million during 2020. This increase reflects the net effect of (i) an increase in deferred tax assets due to changes in enacted corporate income tax rates, (ii) the inclusion of opening balance sheet positions following the completion of the Sunrise Acquisition, (iii) net tax expense of €64.3 million and (iv) other individually insignificant items.
The significant components of our tax loss carryforwards and related tax assets at December 31, 2020 are as follows:
CountryTax loss
carryforwardRelated tax
assetExpiration
date in millions
The Netherlands..................................................................................................... € 5,760.7 € 1,440.2 2021-2027Luxembourg........................................................................................................... 387.0 96.5 VariousSwitzerland............................................................................................................. 23.3 4.1 2027Slovakia.................................................................................................................. 9.0 1.9 2021-2025
Total................................................................................................................... € 6,180.0 € 1,542.7
Our tax loss carryforwards within each jurisdiction combine all companies’ tax losses (both capital and ordinary losses) in that jurisdiction, however, certain tax jurisdictions limit the ability to offset taxable income of a separate company or different tax group with the tax losses associated with another separate company or group. Most of the tax losses shown in the above table are not expected to be realized, including certain losses that are limited in use due to change in control or same business tests. In addition, the pre-fiscal unity losses in the Netherlands of the UPCH Fiscal Unity can only be offset with profits that occur within these groups. Losses that relate to the UPCH Fiscal Unity can also be offset against profits of other entities within the LGH Fiscal Unity.
The UPC Holding GroupNotes to Combined Financial Statements - (Continued)
December 31, 2020, 2019 and 2018
II-44

We and our combined entities file combined and standalone income tax returns in various jurisdictions. In the normal course of business, our income tax filings are subject to review by various taxing authorities. In connection with such reviews, disputes could arise with the taxing authorities over the interpretation or application of certain income tax rules related to our business in that tax jurisdiction. Such disputes may result in future tax and interest and penalty assessments by these taxing authorities. The ultimate resolution of tax contingencies will take place upon the earlier of (i) the settlement date with the applicable taxing authorities in either cash or agreement of income tax positions or (ii) the date when the tax authorities are statutorily prohibited from adjusting the company’s tax computations.
In general, tax returns filed by our company or our combined entities for years prior to 2012 are no longer subject to examination by tax authorities. Certain of our subsidiaries are currently involved in income tax examinations in various jurisdictions in which we operate, including the Netherlands. Any adjustments that might arise from these examinations are not expected to have a material impact on our combined financial position or results of operations.
The changes in our unrecognized tax benefits are summarized below:
2020 2019 2018 in millions
Balance at January 1.......................................................................................................... € 2.5 € 3.6 € 4.8 Additions based on tax positions related to the current year.......................................... 0.6 0.7 0.4 Increases (reductions) for tax positions of prior years.................................................... 0.2 (1.1) (1.6) Lapse of statute of limitations......................................................................................... (0.2) (0.8) — Foreign currency translation........................................................................................... (0.1) 0.1 —
Balance at December 31.................................................................................................... € 3.0 € 2.5 € 3.6
No assurance can be given that any of these tax benefits will be recognized or realized.
As of December 31, 2020, 2019 and 2018, our unrecognized tax benefits included €3.0 million, €2.5 million and €3.6 million, respectively, of tax benefits that would have a favorable impact on our effective income tax rate if ultimately recognized, after considering amounts that we would expect to be offset by valuation allowances and other factors.
Other than the potential impacts of these on-going examinations and the expected expiration of certain statutes of limitation, we do not expect any material changes to our unrecognized tax benefits during 2021. No assurance can be given as to the nature or impact of any changes in our unrecognized tax positions during 2021.
The UPC Holding GroupNotes to Combined Financial Statements - (Continued)
December 31, 2020, 2019 and 2018
II-45

(12) Combined Equity (Deficit)
Distributions
During 2019, we made non-cash capital distributions resulting in (i) a €1,376.1 million decrease to equity related to the Vodafone Group Distribution and the UPC DTH Distribution and (ii) a €1,692.4 million increase to equity related to the net negative carrying value of our investment in the entities that comprise the UPC Transfers. During 2018, in connection with the UPC Austria Distribution described in note 5, we (a) converted a related-party receivable to equity resulting in a non-cash capital distribution of €933.6 million and (b) made a non-cash capital distribution resulting in a €562.2 million increase to equity related to the net negative carrying value of our investment in UPC Austria. In addition, during 2018, we made a non-cash capital distribution of €976.7 million to other subsidiaries of Liberty Global in connection with the UPC Transfers.
Contributions
During 2020 and 2018, we received capital contributions from LGE Financing of €3,092.5 million in connection with the Sunrise Acquisition and €350.0 million in connection with the UPC Austria Distribution, respectively. In addition, we recorded deemed contributions from LG Services B.V. during 2020, 2019 and 2018 of €8.3 million, €9.8 million and €10.6 million, respectively, related to interest accrued in connection with our vendor financing co-obligor relationship, as described in note 9.
As further described in note 13, we recorded charges from another subsidiary of Liberty Global during 2020, 2019 and 2018 of €46.1 million, €12.6 million and €9.0 million, respectively, related to the contribution of technology-related services, which are reflected as deemed contributions in our combined statements of equity (deficit).
The UPC Holding GroupNotes to Combined Financial Statements - (Continued)
December 31, 2020, 2019 and 2018
II-46
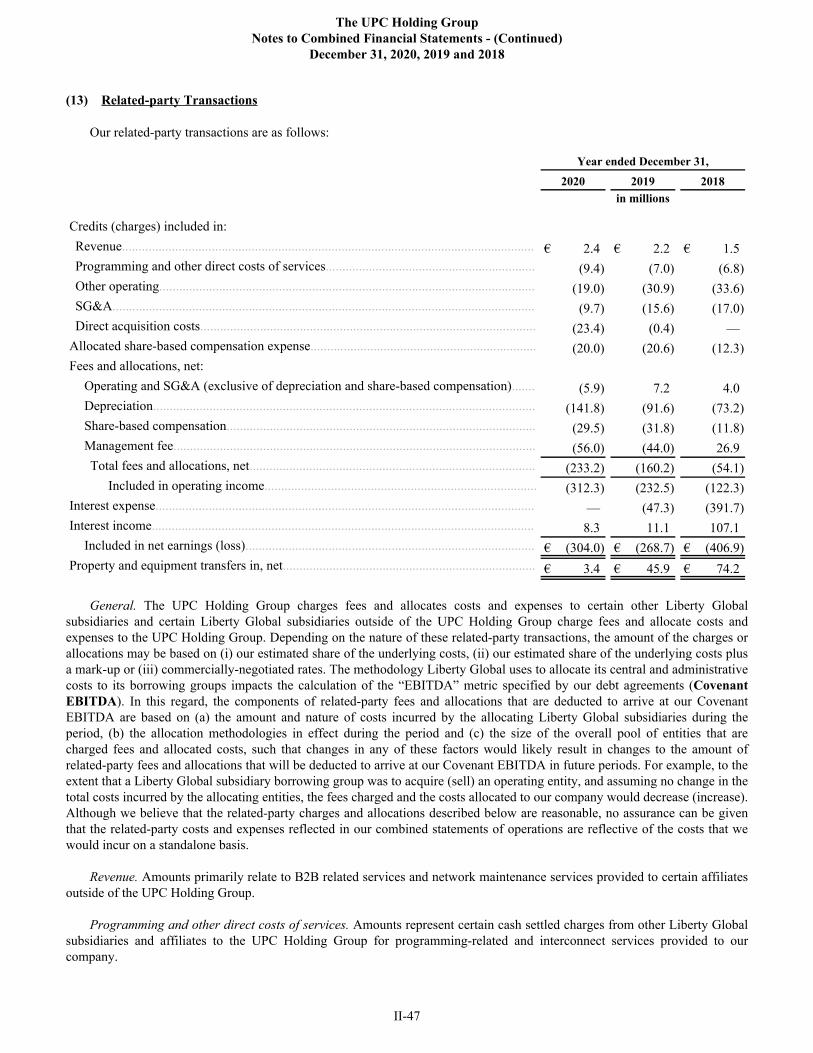
(13) Related-party Transactions
Our related-party transactions are as follows:
Year ended December 31,
2020 2019 2018 in millions
Credits (charges) included in:Revenue............................................................................................................................ € 2.4 € 2.2 € 1.5 Programming and other direct costs of services............................................................... (9.4) (7.0) (6.8) Other operating................................................................................................................. (19.0) (30.9) (33.6) SG&A............................................................................................................................... (9.7) (15.6) (17.0) Direct acquisition costs..................................................................................................... (23.4) (0.4) —
Allocated share-based compensation expense.................................................................... (20.0) (20.6) (12.3) Fees and allocations, net:
Operating and SG&A (exclusive of depreciation and share-based compensation)....... (5.9) 7.2 4.0 Depreciation................................................................................................................... (141.8) (91.6) (73.2) Share-based compensation............................................................................................. (29.5) (31.8) (11.8) Management fee............................................................................................................. (56.0) (44.0) 26.9 Total fees and allocations, net...................................................................................... (233.2) (160.2) (54.1)
Included in operating income.................................................................................. (312.3) (232.5) (122.3) Interest expense.................................................................................................................. — (47.3) (391.7) Interest income................................................................................................................... 8.3 11.1 107.1
Included in net earnings (loss)....................................................................................... € (304.0) € (268.7) € (406.9) Property and equipment transfers in, net............................................................................ € 3.4 € 45.9 € 74.2
General. The UPC Holding Group charges fees and allocates costs and expenses to certain other Liberty Global subsidiaries and certain Liberty Global subsidiaries outside of the UPC Holding Group charge fees and allocate costs and expenses to the UPC Holding Group. Depending on the nature of these related-party transactions, the amount of the charges or allocations may be based on (i) our estimated share of the underlying costs, (ii) our estimated share of the underlying costs plus a mark-up or (iii) commercially-negotiated rates. The methodology Liberty Global uses to allocate its central and administrative costs to its borrowing groups impacts the calculation of the “EBITDA” metric specified by our debt agreements (Covenant EBITDA). In this regard, the components of related-party fees and allocations that are deducted to arrive at our Covenant EBITDA are based on (a) the amount and nature of costs incurred by the allocating Liberty Global subsidiaries during the period, (b) the allocation methodologies in effect during the period and (c) the size of the overall pool of entities that are charged fees and allocated costs, such that changes in any of these factors would likely result in changes to the amount of related-party fees and allocations that will be deducted to arrive at our Covenant EBITDA in future periods. For example, to the extent that a Liberty Global subsidiary borrowing group was to acquire (sell) an operating entity, and assuming no change in the total costs incurred by the allocating entities, the fees charged and the costs allocated to our company would decrease (increase). Although we believe that the related-party charges and allocations described below are reasonable, no assurance can be given that the related-party costs and expenses reflected in our combined statements of operations are reflective of the costs that we would incur on a standalone basis.
Revenue. Amounts primarily relate to B2B related services and network maintenance services provided to certain affiliates outside of the UPC Holding Group.
Programming and other direct costs of services. Amounts represent certain cash settled charges from other Liberty Global subsidiaries and affiliates to the UPC Holding Group for programming-related and interconnect services provided to our company.
The UPC Holding GroupNotes to Combined Financial Statements - (Continued)
December 31, 2020, 2019 and 2018
II-47
Other operating expenses. Amounts include certain charges, which may be cash or loan settled, between Liberty Global subsidiaries and the UPC Holding Group, primarily for network-related services and other items.
SG&A expenses. Amounts represent certain charges, which may be cash or loan settled, between Liberty Global subsidiaries and the UPC Holding Group, primarily for information technology-related services and software maintenance services.
Allocated share-based compensation expense. Amounts are allocated to our company by Liberty Global subsidiaries and represent share-based compensation expense associated with the Liberty Global share-based incentive awards held by certain employees of our combined entities. Share-based compensation expense is included in SG&A expenses in our combined statements of operations.
Fees and allocations, net. These amounts, which are based on our company’s estimated share of the applicable costs (including personnel-related and other costs associated with the services provided) incurred by Liberty Global subsidiaries, represent the aggregate net effect of charges between our company and various Liberty Global subsidiaries that are outside of our company. These charges generally relate to management, finance, legal, technology and other services that support our company’s operations. The categories of our fees and allocations, net, are as follows:
• Operating and SG&A (exclusive of depreciation and share-based compensation). The amounts included in this category, which may be cash or loan settled, represent charges between our company and other Liberty Global subsidiaries for certain technology, management, marketing, finance and other operating and SG&A expenses incurred by our company and other Liberty Global subsidiaries, whose activities benefit multiple operations, including operations within and outside of the UPC Holding Group. Amounts represent the charge to or from our company based on our estimated share of the actual costs incurred by our company or other Liberty Global subsidiaries, without a mark-up. Amounts in this category are generally deducted to arrive at our Covenant EBITDA.
• Depreciation. The amounts included in this category, which may be cash or loan settled, represent our estimated share of depreciation of assets not owned by our company. The amounts allocated represent our estimated share of the actual costs incurred by Liberty Global subsidiaries, without a mark-up.
• Share-based compensation. The amounts included in this category, which may be cash or loan settled, represent our estimated share of share-based compensation associated with Liberty Global employees who are not employees of our company. The amounts allocated represent our estimated share of the actual costs incurred by Liberty Global subsidiaries, without a mark-up.
• Management fee. The amounts included in this category, which may be cash or loan settled, represent our estimated allocable share of (i) operating and SG&A expenses related to stewardship services provided by certain Liberty Global subsidiaries and (ii) the mark-up, if any, applicable to each category of the related-party fees and allocations charged to our company.
Liberty Global charges technology-based fees to our company. Prior to July 1, 2020 such charges were calculated using a royalty-based method (the Royalty-based Method). To the extent that our proportional share of the technology-based costs was more than the actual amount charged under the Royalty-based Method, such excess amounts were reflected as deemed contributions of technology-related services in our combined statements of equity (deficit). During the six months ended June 30, 2020 and years ended 2019 and 2018, our proportional share of the technology-based costs was €22.8 million, €5.0 million and €2.9 million more than the actual amount charged under the Royalty-based Method, respectively. During the third and fourth quarters of 2020, we recorded a €23.3 million adjustment to the excess amounts that were reflected as deemed contributions of technology-related services in our combined statement of equity (deficit) related to the first six months of 2020.
Under the Royalty-based Method, any excess amounts we were charged that exceeded our proportional share of the technology-based costs were classified as management fees and were added back to arrive at Covenant EBITDA.
Effective July 1, 2020, the Royalty-based Method was terminated and replaced with a new method whereby the technology-based fees charged by Liberty Global to our company are now based on our estimated share of the underlying costs plus a mark-up (the Cost Plus Method). The portion of the charge representing the mark-up is reflected as a capital charge for technology-related services in our combined statements of equity (deficit). For the period July 1, 2020 through December 31,
The UPC Holding GroupNotes to Combined Financial Statements - (Continued)
December 31, 2020, 2019 and 2018
II-48

2020, our estimated share of the technology-based costs resulted in a capital charge of €4.3 million related to the associated mark-up. In addition, in connection with the July 1, 2020 change to the Cost Plus Method, we were charged a one-time transfer pricing transition fee of €204.6 million, which is reflected in our combined statement of equity (deficit) for the year ended December 31, 2020.
The technology fee charged to our company during the third quarter of 2018 includes an €83.8 million credit that arose from the acceptance of a Bilateral Advance Pricing Arrangement (BAPA) with the Swiss authorities by a subsidiary of Liberty Global, which is reflected as a reduction to management fees. The BAPA reduced prior year technology fees charged to our Switzerland operations, primarily during the years ended December 31, 2017 and 2016, and accordingly resulted in the issuance of a credit note from a subsidiary of Liberty Global to our Switzerland operations in the amount of such reductions.
Interest expense. Amounts primarily relate to interest accrued on amounts owed to LG Services B.V. and UPC France that, prior to the UPC Transfers, were eliminated in combination.
Interest income. Amounts primarily include interest accrued on the LGEF Receivable (as defined and described below). Interest income is accrued and included in long-term interest receivable during the year, and then added to the LGEF Receivable balance at the beginning of the following year. In addition, the 2019 amount includes interest income related to receivables from LG Services B.V. and UPC France that, prior to the UPC Transfers, were eliminated in combination.
Property and equipment transfers, net. These amounts, which are generally cash settled, include the net carrying values of (i) construction in progress, including certain capitalized labor, transferred to or acquired from other Liberty Global subsidiaries, (ii) customer premises equipment acquired from other Liberty Global subsidiaries outside of the UPC Holding Group, which centrally procure equipment on behalf of our company and various other Liberty Global subsidiaries and (iii) used customer premises and network-related equipment acquired from or transferred to other Liberty Global subsidiaries outside of the UPC Holding Group.
The following table provides details of our related-party balances:
December 31,
2020 2019
in millions
Assets:Current receivables (a)..................................................................................................................... € 19.4 € 411.8 LGEF Receivable (b)........................................................................................................................ — 247.7
Total............................................................................................................................................. € 19.4 € 659.5
Liabilities:Accounts payable............................................................................................................................. € 63.5 € 70.4 Accrued liabilities............................................................................................................................. 70.6 52.3 Shareholder Loan (c)........................................................................................................................ 67.6 — Other long-term liabilities................................................................................................................ 0.3 9.0
Total............................................................................................................................................. € 202.0 € 131.7 _______________
(a) Amounts primarily include (i) €4.9 million and €388.0 million, respectively, of receivables due from LG Services B.V. related to certain operating expenses and centrally-procured property and equipment vendor financed by LG Services B.V. on behalf of other Liberty Global subsidiaries for which we and LG Services B.V. are co-obligors and (ii) €11.6 million and €18.9 million, respectively, of receivables due from LG B.V. These receivables are non-interest bearing and may be cash or loan settled.
(b) UPC Holding signed a related-party agreement effective January 1, 2019 related to the €173.4 million receivable (the LGEF Receivable) due from LGE Financing at December 31, 2018. The LGEF Receivable bears interest at a rate of 5.96% and matures on January 1, 2029. Accrued interest on the LGEF Receivable is transferred to the receivable balance
The UPC Holding GroupNotes to Combined Financial Statements - (Continued)
December 31, 2020, 2019 and 2018
II-49

at the beginning of each year. During the 2020 period ended December 23, 2020, changes in the LGEF Receivable balance included (i) cash repayments of €1,777.1 million, (ii) cash advances of €1,749.6 million, (iii) a €362.9 million non-cash decrease related to the settlement of certain related-party amounts, (iv) additions of €8.6 million in non-cash accrued interest and (v) a €134.1 million increase related to the December 23, 2020 non-cash transfer of the net liability balance to the Shareholder Loan. At December 31, 2020 there was no outstanding balance on the LGEF Receivable. The net increase in the LGEF Receivable balance during 2019 includes (a) cash repayments of €1,822.3 million, (b) cash advances of €1,599.3 million, (c) a €292.0 million non-cash increase related to the settlement of certain related-party amounts and (d) additions of €5.3 million in non-cash accrued interest.
(c) UPC Holding has an unsecured shareholder loan (the Shareholder Loan) with LGE Financing, which, as amended, matures in 2030 and is subordinated in right of payment to the prior payment in full of the UPC Holding Senior Notes in the event of (i) a total or partial liquidation, dissolution or winding up of UPC Holding, (ii) a bankruptcy, reorganization, insolvency, receivership or similar proceeding relating to UPC Holding or its property, (iii) an assignment for the benefit of creditors or (iv) any marshaling of UPC Holding’s assets or liabilities. The interest rate on the Shareholder Loan is a fixed rate of 9.79% and accrued interest is included in other long-term liabilities until it is transferred to the loan balance at the end of each year. The net increase in the Shareholder Loan during 2020 included (a) a €134.1 million increase related to the December 23, 2020 non-cash transfer of the net liability balance from the LGEF Receivable, (b) cash payments of €72.6 million and (c) cash advances of €6.1 million. During the 2019 period ended October 21, 2019, changes in the Shareholder Loan included (1) cash advances of €1,791.6 million, (2) cash payments of €267.0 million and (3) a €92.5 million non-cash increase related to the settlement of certain related-party amounts. On October 21, 2019, we non-cash settled €1,617.1 million of the Shareholder Loan and €25.1 million of outstanding accrued interest by converting these amounts to equity. During the remaining 2019 period, there were no changes in the Shareholder Loan, and as of December 31, 2019, there was no outstanding balance on the Shareholder Loan. During the 2018 period ended June 15, 2018, changes in the Shareholder Loan included (A) cash advances of €1,244.1 million, (B) cash payments of €1,043.8 million, (C) additions of €285.8 million in non-cash accrued interest and (D) a €21.0 million non-cash decrease related to the settlement of certain related-party amounts. On June 15, 2018, we non-cash settled €7,240.0 million of the Shareholder Loan by converting this amount to equity. During the remaining 2018 period ended December 31, 2018, changes in the Shareholder Loan included (I) cash advances of €3,129.4 million, (II) cash payments of €2,543.6 million, (III) a €767.6 million non-cash decrease related to the settlement of certain related-party amounts, (IV) additions of €34.5 million in non-cash accrued interest and (V) a €173.4 million non-cash transfer of the net asset balance outstanding to the LGEF Receivable. During 2020, 2019 and 2018 none of our Shareholder Loan repayments represented payments of interest.
During 2020, 2019 and 2018, we recorded aggregate capital charges of €5.4 million, €8.6 million and €1.9 million, respectively, in our combined statements of equity (deficit) in connection with the exercise of Liberty Global share appreciation rights and the vesting of Liberty Global restricted share awards and performance-based restricted share units held by employees of our combined entities. We and Liberty Global have agreed that these capital charges will be based on the fair value of the underlying Liberty Global shares associated with share-based incentive awards that vest or are exercised during the period, subject to any reduction that is necessary to ensure that the capital charge does not exceed the amount of share-based compensation expense recorded by our company with respect to Liberty Global share-based incentive awards.
The UPC Holding GroupNotes to Combined Financial Statements - (Continued)
December 31, 2020, 2019 and 2018
II-50
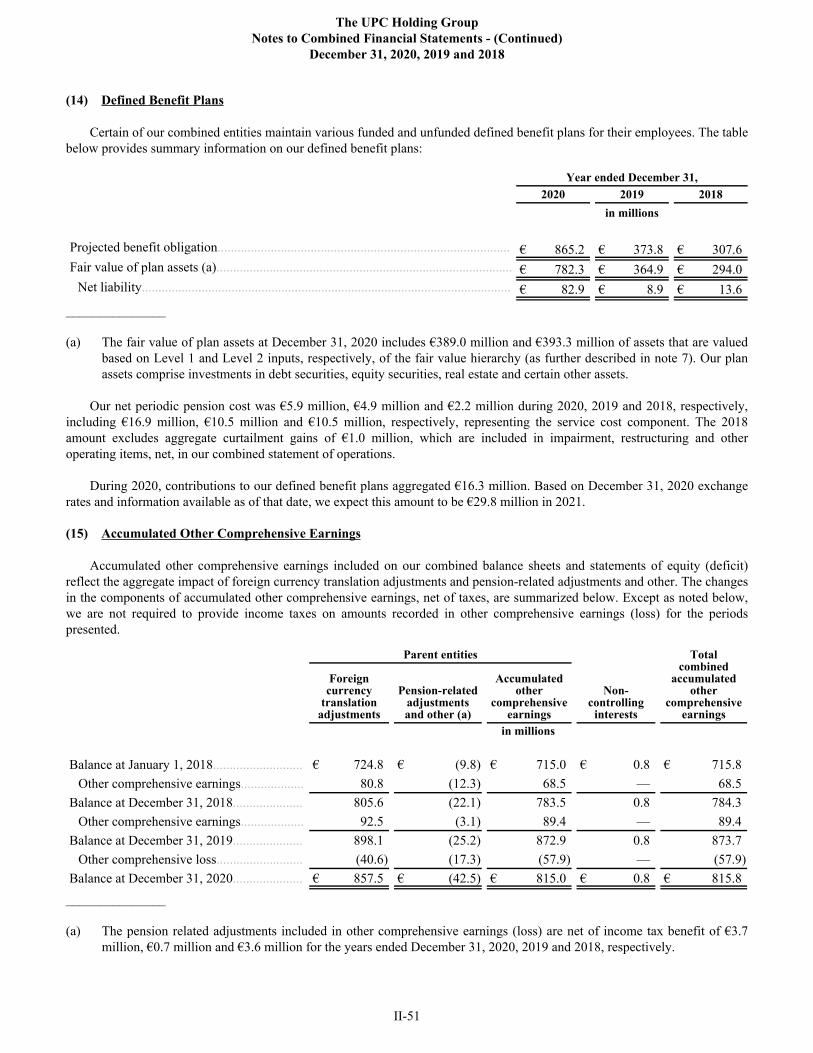
(14) Defined Benefit Plans
Certain of our combined entities maintain various funded and unfunded defined benefit plans for their employees. The table below provides summary information on our defined benefit plans:
Year ended December 31,2020 2019 2018
in millions
Projected benefit obligation........................................................................................ € 865.2 € 373.8 € 307.6 Fair value of plan assets (a)......................................................................................... € 782.3 € 364.9 € 294.0
Net liability............................................................................................................... € 82.9 € 8.9 € 13.6 _______________
(a) The fair value of plan assets at December 31, 2020 includes €389.0 million and €393.3 million of assets that are valued based on Level 1 and Level 2 inputs, respectively, of the fair value hierarchy (as further described in note 7). Our plan assets comprise investments in debt securities, equity securities, real estate and certain other assets.
Our net periodic pension cost was €5.9 million, €4.9 million and €2.2 million during 2020, 2019 and 2018, respectively, including €16.9 million, €10.5 million and €10.5 million, respectively, representing the service cost component. The 2018 amount excludes aggregate curtailment gains of €1.0 million, which are included in impairment, restructuring and other operating items, net, in our combined statement of operations.
During 2020, contributions to our defined benefit plans aggregated €16.3 million. Based on December 31, 2020 exchange rates and information available as of that date, we expect this amount to be €29.8 million in 2021.
(15) Accumulated Other Comprehensive Earnings
Accumulated other comprehensive earnings included on our combined balance sheets and statements of equity (deficit) reflect the aggregate impact of foreign currency translation adjustments and pension-related adjustments and other. The changes in the components of accumulated other comprehensive earnings, net of taxes, are summarized below. Except as noted below, we are not required to provide income taxes on amounts recorded in other comprehensive earnings (loss) for the periods presented.
Parent entities Total combined
accumulated other
comprehensive earnings
Foreign currency
translation adjustments
Pension-related adjustments and other (a)
Accumulated other
comprehensive earnings
Non-controlling
interests in millions
Balance at January 1, 2018........................... € 724.8 € (9.8) € 715.0 € 0.8 € 715.8 Other comprehensive earnings................... 80.8 (12.3) 68.5 — 68.5
Balance at December 31, 2018..................... 805.6 (22.1) 783.5 0.8 784.3 Other comprehensive earnings................... 92.5 (3.1) 89.4 — 89.4
Balance at December 31, 2019..................... 898.1 (25.2) 872.9 0.8 873.7 Other comprehensive loss.......................... (40.6) (17.3) (57.9) — (57.9)
Balance at December 31, 2020..................... € 857.5 € (42.5) € 815.0 € 0.8 € 815.8 _______________
(a) The pension related adjustments included in other comprehensive earnings (loss) are net of income tax benefit of €3.7 million, €0.7 million and €3.6 million for the years ended December 31, 2020, 2019 and 2018, respectively.
The UPC Holding GroupNotes to Combined Financial Statements - (Continued)
December 31, 2020, 2019 and 2018
II-51

(16) Commitments and Contingencies
Commitments
In the normal course of business, we have entered into agreements that commit our company to make cash payments in future periods with respect to network and connectivity commitments, programming contracts and purchases of customer premises and other equipment and services. The following table sets forth the euro equivalents of such commitments as of December 31, 2020. The commitments included in this table do not reflect any liabilities that are included on our December 31, 2020 combined balance sheet:
Payments due during:
2021 2022 2023 2024 2025 Thereafter Total
in millions
Network and connectivity commitments..... € 144.2 € 35.8 € 6.1 € 1.7 € 1.3 € 12.2 € 201.3 Programming commitments........................ 75.0 35.2 5.8 — — — 116.0 Purchase commitments................................ 85.1 9.3 2.7 1.1 — — 98.2
Total........................................................ € 304.3 € 80.3 € 14.6 € 2.8 € 1.3 € 12.2 € 415.5
Network and connectivity commitments include commitments associated with (i) fiber leasing agreements, (ii) network maintenance commitments and (iii) commitments associated with our mobile virtual network operator (MVNO) agreements. The amounts reflected in the above table with respect to certain of our MVNO commitments represent fixed minimum amounts payable under these agreements and, therefore, may be significantly less than the actual amounts we ultimately pay in these periods.
Programming commitments consist of obligations associated with certain of our programming and sports rights contracts that are enforceable and legally binding on us as we have agreed to pay minimum fees without regard to (i) the actual number of subscribers to the programming services, (ii) whether we terminate service to a portion of our subscribers or dispose of a portion of our distribution systems or (iii) whether we discontinue our premium sports services. Programming commitments do not include increases in future periods associated with contractual inflation or other price adjustments that are not fixed. Accordingly, the amounts reflected in the above table with respect to these contracts are significantly less than the amounts we expect to pay in these periods under these contracts. Historically, payments to programming vendors have represented a significant portion of our operating costs, and we expect this will continue to be the case in future periods. In this regard, our total programming and copyright costs aggregated €141.4 million, €141.8 million and €137.1 million during 2020, 2019 and 2018, respectively.
Programming costs include (i) agreements to distribute channels to our customers, (ii) exhibition rights of programming content and (iii) sports rights.
Channel Distribution Agreements. Our channel distribution agreements are generally multi-year contracts for which we are charged either (i) variable rates based upon the number of subscribers or (ii) on a flat fee basis. Certain of our variable rate contracts require minimum guarantees. Programming costs under such arrangements are recorded in operating costs and expenses in our combined statement of operations when the programming is available for viewing.
Exhibition Rights. Our agreements for exhibition rights are generally multi-year license agreements for which we are typically charged a percentage of the revenue earned per program. The current and long-term portions of our exhibition rights acquired under licenses are recorded as other current assets and other assets, net, respectively, on our combined balance sheet when the license period begins and the program is available for its first showing. Capitalized exhibition rights are amortized based on the projected future showings of the content using a straight-line or accelerated method of amortization, as appropriate. Exhibition rights are regularly reviewed for impairment and held at the lower of unamortized cost or estimated net realizable value.
Sports Rights. Our sports rights agreements are generally multi-year contracts for which we are typically charged a flat fee per season. We typically pay for sports rights in advance of the respective season. The current and long-term portions of any
The UPC Holding GroupNotes to Combined Financial Statements - (Continued)
December 31, 2020, 2019 and 2018
II-52

payments made in advance of the respective season are recorded as other current assets and other assets, net, respectively, on our combined balance sheet and are amortized on a straight-line basis over the respective sporting season. Sports rights are regularly reviewed for impairment and held at the lower of unamortized cost or estimated net realizable value.
Purchase commitments include unconditional and legally binding obligations related to (i) the purchase of customer premises and other equipment and (ii) certain service-related commitments, including information technology and maintenance services, including €9.3 million associated with related-party purchase obligations.
In addition to the commitments set forth in the table above, we have significant commitments under (i) derivative instruments and (ii) defined benefit plans and similar agreements, pursuant to which we expect to make payments in future periods. For information regarding our derivative instruments, including the net cash paid or received in connection with these instruments during 2020, 2019 and 2018, see note 6. For information regarding our defined benefit plans, see note 14.
We also have commitments pursuant to agreements with, and obligations imposed by, franchise authorities and municipalities, which may include obligations in certain markets to move aerial cable to underground ducts or to upgrade, rebuild or extend portions of our broadband communication systems. Such amounts are not included in the above table because they are not fixed or determinable.
Rental expense under non-cancellable operating lease arrangements amounted to €41.9 million during 2018. It is expected
that in the normal course of business, operating leases that expire generally will be renewed or replaced by similar leases. For information regarding our operating lease arrangements for 2020 and 2019 following the adoption of ASU No. 2016-02, Leases, see note 10.
Guarantees and Other Credit Enhancements
In the ordinary course of business, we may provide (i) indemnifications to our lenders, our vendors and certain other parties and (ii) performance and/or financial guarantees to local municipalities, our customers and vendors. Historically, these arrangements have not resulted in our company making any material payments and we do not believe that they will result in material payments in the future.
Other Regulatory Matters. Video distribution, broadband internet, fixed-line telephony, mobile and content businesses are regulated in each of the countries in which we operate. The scope of regulation varies from country to country, although in some significant respects regulation in European markets is harmonized under the regulatory structure of the E.U.. Adverse regulatory developments could subject our businesses to a number of risks. Regulation, including conditions imposed on us by competition or other authorities as a requirement to close acquisitions or dispositions, could limit growth, revenue and the number and types of services offered and could lead to increased operating costs and property and equipment additions. Regulation may also restrict our operations and subject them to further competitive pressure, including pricing restrictions, interconnect and other access obligations, and restrictions or controls on content, including content provided by third parties. Failure to comply with current or future regulation could expose our businesses to various penalties.
In addition to the foregoing items, we have contingent liabilities related to matters arising in the ordinary course of business including (i) legal proceedings, (ii) issues involving VAT and wage, property, withholding and other tax issues and (iii) disputes over interconnection, programming, copyright and channel carriage fees. While we generally expect that the amounts required to satisfy these contingencies will not materially differ from any estimated amounts we have accrued, no assurance can be given that the resolution of one or more of these contingencies will not result in a material impact on our results of operations, cash flows or financial position in any given period. Due, in general, to the complexity of the issues involved and, in certain cases, the lack of a clear basis for predicting outcomes, we cannot provide a meaningful range of potential losses or cash outflows that might result from any unfavorable outcomes.
The UPC Holding GroupNotes to Combined Financial Statements - (Continued)
December 31, 2020, 2019 and 2018
II-53
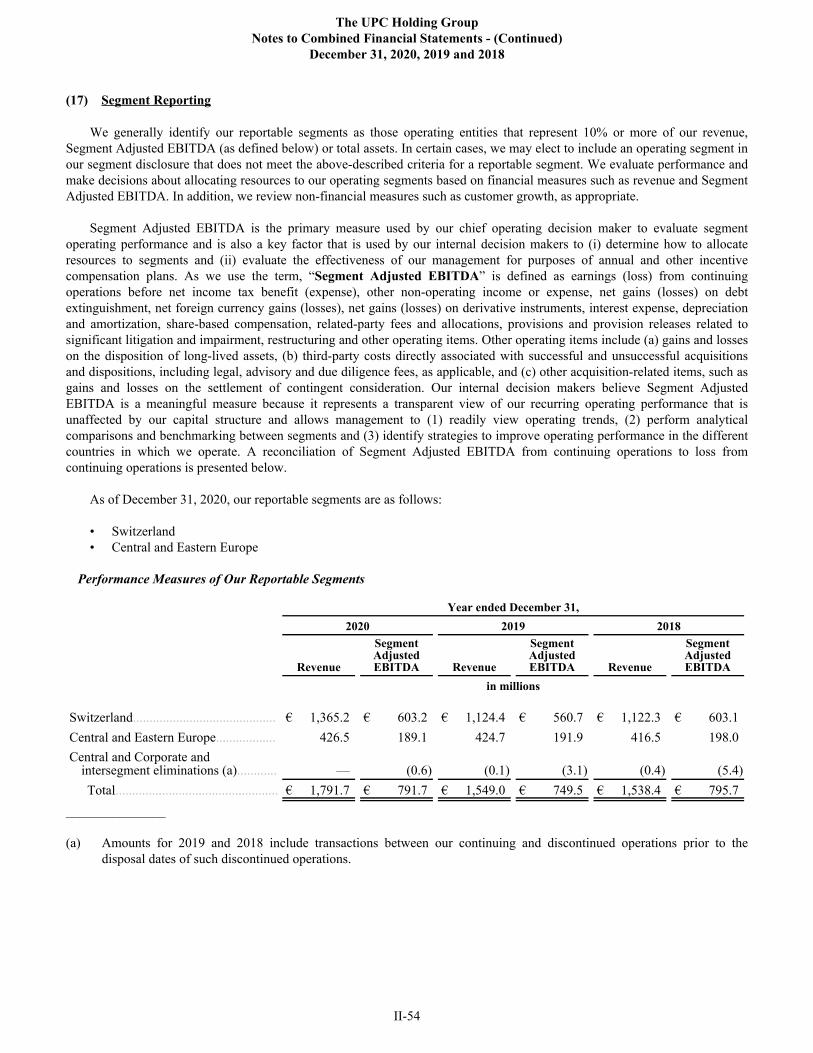
(17) Segment Reporting
We generally identify our reportable segments as those operating entities that represent 10% or more of our revenue, Segment Adjusted EBITDA (as defined below) or total assets. In certain cases, we may elect to include an operating segment in our segment disclosure that does not meet the above-described criteria for a reportable segment. We evaluate performance and make decisions about allocating resources to our operating segments based on financial measures such as revenue and Segment Adjusted EBITDA. In addition, we review non-financial measures such as customer growth, as appropriate.
Segment Adjusted EBITDA is the primary measure used by our chief operating decision maker to evaluate segment operating performance and is also a key factor that is used by our internal decision makers to (i) determine how to allocate resources to segments and (ii) evaluate the effectiveness of our management for purposes of annual and other incentive compensation plans. As we use the term, “Segment Adjusted EBITDA” is defined as earnings (loss) from continuing operations before net income tax benefit (expense), other non-operating income or expense, net gains (losses) on debt extinguishment, net foreign currency gains (losses), net gains (losses) on derivative instruments, interest expense, depreciation and amortization, share-based compensation, related-party fees and allocations, provisions and provision releases related to significant litigation and impairment, restructuring and other operating items. Other operating items include (a) gains and losses on the disposition of long-lived assets, (b) third-party costs directly associated with successful and unsuccessful acquisitions and dispositions, including legal, advisory and due diligence fees, as applicable, and (c) other acquisition-related items, such as gains and losses on the settlement of contingent consideration. Our internal decision makers believe Segment Adjusted EBITDA is a meaningful measure because it represents a transparent view of our recurring operating performance that is unaffected by our capital structure and allows management to (1) readily view operating trends, (2) perform analytical comparisons and benchmarking between segments and (3) identify strategies to improve operating performance in the different countries in which we operate. A reconciliation of Segment Adjusted EBITDA from continuing operations to loss from continuing operations is presented below.
As of December 31, 2020, our reportable segments are as follows:
• Switzerland• Central and Eastern Europe
Performance Measures of Our Reportable Segments
Year ended December 31, 2020 2019 2018
Revenue
Segment Adjusted EBITDA Revenue
Segment Adjusted EBITDA Revenue
Segment Adjusted EBITDA
in millions
Switzerland........................................... € 1,365.2 € 603.2 € 1,124.4 € 560.7 € 1,122.3 € 603.1 Central and Eastern Europe.................. 426.5 189.1 424.7 191.9 416.5 198.0 Central and Corporate and
intersegment eliminations (a)............ — (0.6) (0.1) (3.1) (0.4) (5.4) Total................................................. € 1,791.7 € 791.7 € 1,549.0 € 749.5 € 1,538.4 € 795.7
_______________
(a) Amounts for 2019 and 2018 include transactions between our continuing and discontinued operations prior to the disposal dates of such discontinued operations.
The UPC Holding GroupNotes to Combined Financial Statements - (Continued)
December 31, 2020, 2019 and 2018
II-54

The following table provides a reconciliation of loss from continuing operations to Segment Adjusted EBITDA:
Year ended December 31,
2020 2019 2018 in millions
Loss from continuing operations................................................................................. € (259.5) € (142.0) € (140.8) Income tax expense (benefit)..................................................................................... (12.9) 45.5 24.1 Other income, net....................................................................................................... (10.5) (7.5) (5.6) Losses on debt extinguishment, net........................................................................... 40.5 13.8 5.3 Foreign currency transaction losses (gains), net........................................................ (134.5) 74.0 107.8 Realized and unrealized losses (gains) on derivative instruments, net...................... 264.6 (28.5) (155.0) Interest income........................................................................................................... (9.2) (12.1) (107.2) Interest expense:Third-party............................................................................................................... 170.4 222.7 258.9 Related-party............................................................................................................ — 47.3 391.7 Operating income................................................................................................... 48.9 213.2 379.2
Impairment, restructuring and other operating items, net.......................................... 45.5 12.2 5.1 Depreciation and amortization................................................................................... 444.1 343.3 345.0 Related-party fees and allocations, net...................................................................... 233.2 160.2 54.1 Share-based compensation expense........................................................................... 20.0 20.6 12.3
Segment Adjusted EBITDA................................................................................... € 791.7 € 749.5 € 795.7
Balance Sheet Data of our Reportable Segments
Selected balance sheet data of our reportable segments is set forth below:
Long-lived assets Total assets
December 31, December 31,
2020 2019 2020 2019
in millions
Switzerland........................................................................................... € 10,027.2 € 3,782.8 € 11,993.0 € 4,152.6 Central and Eastern Europe.................................................................. 878.5 945.9 929.8 1,015.1 Central and Corporate.......................................................................... — — 380.5 964.7
Total................................................................................................ € 10,905.7 € 4,728.7 € 13,303.3 € 6,132.4
The UPC Holding GroupNotes to Combined Financial Statements - (Continued)
December 31, 2020, 2019 and 2018
II-55

Property and Equipment Additions of our Reportable Segments
The property and equipment additions of our reportable segments (including capital additions financed under vendor financing or finance lease arrangements) are presented below and reconciled to the capital expenditure amounts included in our combined statements of cash flows. For additional information concerning capital additions financed under vendor financing and finance lease arrangements, see notes 8 and 10, respectively.
Year ended December 31, 2020 2019 2018 in millions
Switzerland................................................................................................................ € 263.0 € 248.3 € 212.5 Central and Eastern Europe....................................................................................... 91.6 95.8 129.9
Total segment property and equipment additions................................................... 354.6 344.1 342.4 Assets acquired under capital-related vendor financing arrangements..................... (309.4) (405.4) (364.3) Assets acquired under finance leases........................................................................ (2.1) (3.3) (1.9) Changes in current liabilities related to capital expenditures (including related-
party amounts)....................................................................................................... 163.0 356.9 262.0 Total capital expenditures, net........................................................................... € 206.1 € 292.3 € 238.2
Revenue by Major Category
Our revenue by major category is set forth below:
Year ended December 31, 2020 2019 2018 in millionsResidential revenue:
Residential cable revenue (a):Subscription revenue (b):
Video...................................................................................................................... € 660.2 € 673.6 € 702.7 Broadband internet................................................................................................. 408.9 391.4 391.3 Fixed-line telephony............................................................................................... 110.6 105.3 113.5
Total subscription revenue................................................................................... 1,179.7 1,170.3 1,207.5 Non-subscription revenue......................................................................................... 92.1 79.0 77.5
Total residential cable revenue............................................................................ 1,271.8 1,249.3 1,285.0 Residential mobile revenue (c):
Subscription revenue (b) .......................................................................................... 179.6 58.9 44.1 Non-subscription revenue......................................................................................... 70.7 27.3 14.1
Total residential mobile revenue............................................................................ 250.3 86.2 58.2 Total residential revenue...................................................................................... 1,522.1 1,335.5 1,343.2
B2B revenue (d):Subscription revenue................................................................................................... 49.0 46.5 42.5 Non-subscription revenue........................................................................................... 212.9 164.3 149.1 Total B2B revenue.................................................................................................... 261.9 210.8 191.6
Other revenue................................................................................................................. 7.7 2.7 3.6 Total..................................................................................................................... € 1,791.7 € 1,549.0 € 1,538.4
The UPC Holding GroupNotes to Combined Financial Statements - (Continued)
December 31, 2020, 2019 and 2018
II-56
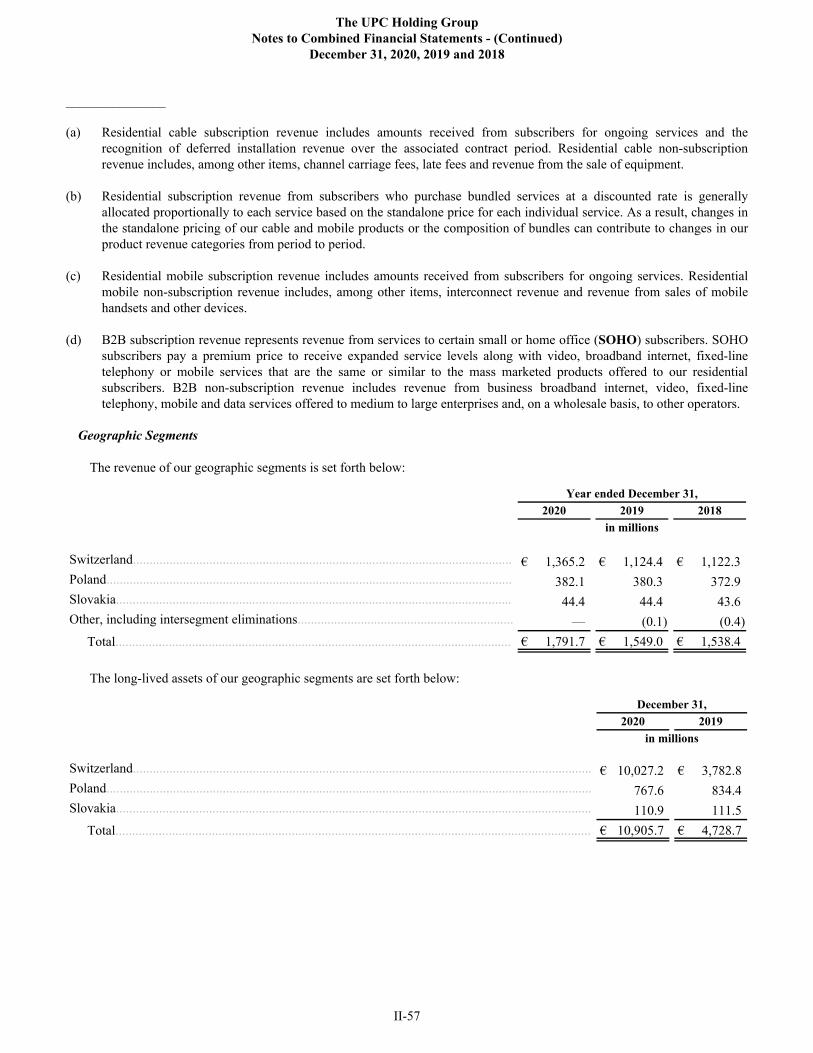
_______________
(a) Residential cable subscription revenue includes amounts received from subscribers for ongoing services and the recognition of deferred installation revenue over the associated contract period. Residential cable non-subscription revenue includes, among other items, channel carriage fees, late fees and revenue from the sale of equipment.
(b) Residential subscription revenue from subscribers who purchase bundled services at a discounted rate is generally allocated proportionally to each service based on the standalone price for each individual service. As a result, changes in the standalone pricing of our cable and mobile products or the composition of bundles can contribute to changes in our product revenue categories from period to period.
(c) Residential mobile subscription revenue includes amounts received from subscribers for ongoing services. Residential mobile non-subscription revenue includes, among other items, interconnect revenue and revenue from sales of mobile handsets and other devices.
(d) B2B subscription revenue represents revenue from services to certain small or home office (SOHO) subscribers. SOHO subscribers pay a premium price to receive expanded service levels along with video, broadband internet, fixed-line telephony or mobile services that are the same or similar to the mass marketed products offered to our residential subscribers. B2B non-subscription revenue includes revenue from business broadband internet, video, fixed-line telephony, mobile and data services offered to medium to large enterprises and, on a wholesale basis, to other operators.
Geographic Segments
The revenue of our geographic segments is set forth below:
Year ended December 31, 2020 2019 2018 in millions
Switzerland.................................................................................................................. € 1,365.2 € 1,124.4 € 1,122.3 Poland.......................................................................................................................... 382.1 380.3 372.9 Slovakia....................................................................................................................... 44.4 44.4 43.6 Other, including intersegment eliminations................................................................. — (0.1) (0.4)
Total....................................................................................................................... € 1,791.7 € 1,549.0 € 1,538.4
The long-lived assets of our geographic segments are set forth below:
December 31, 2020 2019 in millions
Switzerland.......................................................................................................................................... € 10,027.2 € 3,782.8 Poland.................................................................................................................................................. 767.6 834.4 Slovakia............................................................................................................................................... 110.9 111.5
Total............................................................................................................................................... € 10,905.7 € 4,728.7
The UPC Holding GroupNotes to Combined Financial Statements - (Continued)
December 31, 2020, 2019 and 2018
II-57

MANAGEMENT’S DISCUSSION AND ANALYSIS OF FINANCIAL CONDITION AND RESULTS OF OPERATIONS
The following discussion and analysis, which should be read in conjunction with our combined financial statements, is intended to assist in providing an understanding of our results of operations and financial condition and is organized as follows:
• Forward-looking Statements. This section provides a description of certain factors that could cause actual results or events to differ materially from anticipated results or events.
• Overview. This section provides a general description of our business and recent events.
• Results of Operations. This section provides an analysis of our results of operations for the years ended December 31, 2020, 2019, and 2018.
• Liquidity and Capital Resources. This section provides an analysis of our liquidity, combined statements of cash flows.
• Critical Accounting Policies, Judgments and Estimates. This section discusses those material accounting policies that involve uncertainties and require significant judgment in their application.
The capitalized terms used below have been defined in the notes to our combined financial statements. In the following text, the terms, “we,” “our,” “our company” and “us” may refer, as the context requires, to UPC Holding or the UPC Holding Group.
Unless otherwise indicated, convenience translations into euros are calculated, and operational data are presented, as of December 31, 2020.
Overview
General
We are an international provider of video, broadband internet, fixed-line telephony and mobile communications services to residential customers and businesses in Europe. Our continuing operations comprise businesses that provide residential and B2B communications services in Switzerland, Poland and Slovakia.
As further described in note 5 to our combined financial statements, Liberty Global (i) completed the sale of our operations in Romania, Hungary and the Czech Republic (exclusive of our UPC DTH operations) on July 31, 2019, (ii) completed the sale of the operations of UPC DTH on May 2, 2019 and (iii) completed the sale of our operations in Austria on July 31, 2018. Accordingly, our operations in Austria, Romania, Hungary, the Czech Republic and the operations of UPC DTH are presented as discontinued operations for all applicable periods. In the following discussion and analysis, the operating statistics, results of operations, cash flows and financial condition that we present and discuss are those of our continuing operations unless otherwise indicated. In addition, during the fourth quarter of 2019, we completed the UPC Transfers, as described in note 5. We have accounted for the UPC Transfers as common control transfers at carryover basis and our combined financial statements give effect to these transactions for all periods presented.
Operations
Our company delivers market-leading products through next-generation networks that connect our customers to broadband, internet, video, fixed-line telephony and mobile services. At December 31, 2020, our combined businesses owned and operated networks that passed 6,665,800 homes and served 3,193,000 fixed-line customers and 2,244,000 mobile subscribers.
Video services. We provide video services, including various enhanced products that enable our customers to control when they watch their programming. These products range from digital video recorders to multimedia home gateway systems capable of distributing video, voice and data content throughout the home and to multiple devices.
Broadband internet services. We offer multiple tiers of broadband internet service up to Gigabit speeds depending on location. We continue to invest in new technologies that allow us to increase the internet speeds we offer to our customers.
Fixed-line telephony services. We offer fixed-line telephony services via either voice-over-internet-protocol or “VoIP” technology or circuit-switched telephony, depending on location.
II-58

Mobile services. We deliver mobile services to our customers (i) in Switzerland as a mobile network operator, as well as through third-party MVNO networks pursuant to a legacy contract prior to the Sunrise Acquisition and (ii) in Poland as a MVNO. In addition, we generate revenue from the sale of mobile handsets.
B2B services. Our B2B services include voice, broadband internet, data, video, wireless and cloud services.
For additional information regarding the details of our products and services, see Business included in Part I of this annual report.
Impact of COVID-19
In March 2020, the World Health Organization declared the outbreak of COVID-19 to be a global pandemic. In response, emergency measures were imposed by governments worldwide, including travel restrictions, restrictions on social activity and the shutdown of non-essential businesses. These measures have adversely impacted the global economy, disrupted global supply chains and created significant volatility and disruption of financial markets. While it is not currently possible to estimate the duration and severity of the COVID-19 pandemic or the adverse economic impact resulting from the preventative measures taken to contain or mitigate its outbreak, an extended period of global economic disruption could have a material adverse impact on our business, financial condition and results of operations in future periods, including with respect to, among other items, (i) our ability to access capital necessary to fund property and equipment additions, debt service requirements, acquisitions and other investment opportunities or other liquidity needs, (ii) the ability of our customers to pay for our products and services, (iii) our ability to maintain or increase our residential and business subscriber levels, (iv) our ability to offer attractive programming, particularly in consideration of the recent cancellation of numerous worldwide sporting events, and (v) the ability of our suppliers and vendors to provide products and services to us. We may also be adversely impacted by any government mandated regulations on our business that could be implemented in response to the COVID-19 pandemic. In addition, the countries in which we operate may seek new or increased revenue sources due to fiscal deficits that result from measures taken to mitigate the adverse economic impacts of COVID-19, such as by imposing new taxes on the products and services we provide. We estimate that the total overall adverse impact of the COVID-19 pandemic on our Segment Adjusted EBITDA during 2020 was relatively minimal. For additional information regarding the impact of COVID-19 on our results of operations for the year ended December 31, 2020, see Discussion and Analysis of our Reportable Segments below.
Strategy and Management Focus
We strive to achieve organic revenue and customer growth in our operations by developing and marketing bundled entertainment and information and communications services, and extending and upgrading the quality of our networks where appropriate. As we use the term, organic growth excludes foreign currency translation effects (FX) and the estimated impact of acquisitions and dispositions. While we seek to increase our customer base, we also seek to maximize the average revenue we receive from each household by increasing the penetration of our digital video, broadband internet, fixed-line telephony and mobile services with existing customers through product bundling and upselling.
Competition and Other External Factors
We are experiencing competition in all of the markets in which we operate. This competition, together with macroeconomic and regulatory factors, has adversely impacted our revenue, number of customers and/or average monthly subscription revenue per average cable fixed-line customer or mobile subscriber, as applicable (ARPU). For additional information regarding the competition we face, see Business - Competition and Regulatory Matters included in Part I of this annual report. For additional information regarding the revenue impact of changes in the fixed-line customers and ARPU of our reportable segments, see Discussion and Analysis of our Reportable Segments below.
In addition to competition, our operations are subject to macroeconomic, political and other risks that are outside of our control. For example, on June 23, 2016, the U.K. held a referendum in which voters approved, on an advisory basis, an exit from the E.U., commonly referred to as “Brexit.” The U.K. formally exited the E.U. on January 31, 2020, and in December 2020, the U.K. and the E.U. announced a deal for a “Trade and Cooperation” agreement. The effects of Brexit could adversely impact our business, results of operations and financial condition.
II-59

Results of Operations
The comparability of our operating results is affected by acquisitions. In the following discussion, we quantify the estimated impact of acquisitions (the Acquisition Impact) on our operating results. The Acquisition Impact represents our estimate of the difference between the operating results of the periods under comparison that is attributable to an acquisition. In general, we base our estimate of the Acquisition Impact on an acquired entity’s operating results during the first three to twelve months following the acquisition date, as adjusted to remove integration costs and any other material unusual or nonoperational items, such that changes from those operating results in subsequent periods are considered to be organic changes. Accordingly, in the following discussion, (i) organic variances attributed to an acquired entity during the first 12 months following the acquisition date represent differences between the Acquisition Impact and the actual results and (ii) the calculation of our organic change percentages includes the organic activity of an acquired entity relative to the Acquisition Impact of such entity.
Changes in foreign currency exchange rates have a significant impact on our reported operating results as most of our operating segments have functional currencies other than the euro. Our primary exposure to foreign exchange (FX) risk during the three months ended December 31, 2020 was to the Swiss franc and other local currencies in Europe as 98.3% of our euro revenue during the period was derived from our combined entities whose functional currencies are those other than the euro. The portions of the changes in the various components of our results of operations that are attributable to changes in FX are highlighted under Discussion and Analysis of our Reportable Segments and Discussion and Analysis of our Combined Operating Results below.
Discussion and Analysis of our Reportable Segments
General
Our reportable segments derive their revenue primarily from residential and B2B communications services, including video, broadband internet, fixed-line telephony and mobile services. For detailed information regarding the composition of our reportable segments and how we define and categorize our revenue components, see note 17 to our combined financial statements.
The tables presented below in this section provide the details of the revenue and Segment Adjusted EBITDA of our combined reportable segments for (i) 2020, as compared to 2019, and (ii) 2019, as compared to 2018. These tables present (a) the amounts reported for the current and comparative periods, (b) the reported euro and percentage change from period to period and (c) the organic percentage change from period to period. The comparisons that exclude FX assume that exchange rates remained constant at the prior-year rate during the comparative periods that are included in each table. We also provide a table showing the Segment Adjusted EBITDA margins of our combined reportable segments for 2020, 2019 and 2018 at the end of this section.
All of our revenue is derived from jurisdictions that administer VAT or similar revenue-based taxes. Any increases in these taxes could have an adverse impact on our ability to maintain or increase our revenue to the extent that we are unable to pass such tax increases on to our customers. In the case of revenue-based taxes for which we are the ultimate taxpayer, we will also experience increases in our operating costs and expenses and corresponding declines in our Segment Adjusted EBITDA and Segment Adjusted EBITDA margins to the extent of any such tax increases.
We pay interconnection fees to other telephony providers when calls or text messages from our subscribers terminate on another network, and we receive similar fees from such providers when calls or text messages from their customers terminate on our networks or networks that we access through MVNO or other arrangements. The amounts we charge and incur with respect to fixed-line telephony and mobile interconnection fees are subject to regulatory oversight. To the extent that regulatory authorities introduce fixed-line or mobile termination rate changes, we would experience prospective changes and, in very limited cases, we could experience retroactive changes in our interconnect revenue and/or costs. The ultimate impact of any such changes in termination rates on our Segment Adjusted EBITDA would be dependent on the call or text messaging patterns that are subject to the changed termination rates.
We are subject to inflationary pressures with respect to certain costs and foreign currency exchange risk with respect to costs and expenses that are denominated in currencies other than the respective functional currencies of our combined reportable segments (non-functional currency expenses). Any cost increases that we are not able to pass on to our subscribers through rate increases would result in increased pressure on our operating margins.
II-60

Combined Segment Adjusted EBITDA is a non-GAAP measure, which we believe is a meaningful measure because it represents a transparent view of our recurring operating performance that is unaffected by our capital structure and allows management to readily view operating trends from a combined view. Readers should view combined Segment Adjusted EBITDA as a supplement to, and not a substitute for, GAAP measures of performance included in our combined statements of operations.
The following table provides a reconciliation of loss from continuing operations to Segment Adjusted EBITDA:
Year ended December 31, 2020 2019 2018 in millions
Loss from continuing operations................................................................................. € (259.5) € (142.0) € (140.8) Income tax expense (benefit)..................................................................................... (12.9) 45.5 24.1 Other income, net....................................................................................................... (10.5) (7.5) (5.6) Losses on debt extinguishment, net........................................................................... 40.5 13.8 5.3 Foreign currency transaction losses (gains), net........................................................ (134.5) 74.0 107.8 Realized and unrealized losses (gains) on derivative instruments, net...................... 264.6 (28.5) (155.0) Interest income........................................................................................................... (9.2) (12.1) (107.2) Interest expense:Third-party............................................................................................................... 170.4 222.7 258.9 Related-party............................................................................................................ — 47.3 391.7 Operating income................................................................................................... 48.9 213.2 379.2
Impairment, restructuring and other operating items, net.......................................... 45.5 12.2 5.1 Depreciation and amortization................................................................................... 444.1 343.3 345.0 Related-party fees and allocations, net...................................................................... 233.2 160.2 54.1 Share-based compensation expense........................................................................... 20.0 20.6 12.3
Segment Adjusted EBITDA................................................................................... € 791.7 € 749.5 € 795.7
II-61
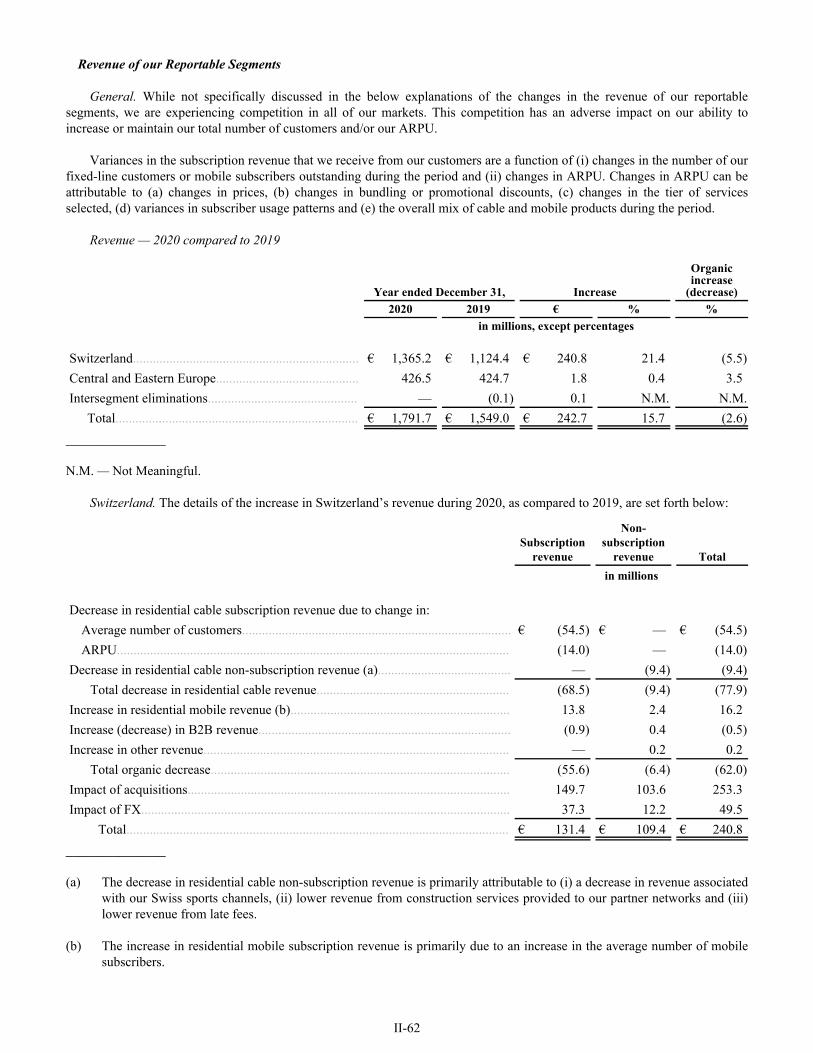
Revenue of our Reportable Segments
General. While not specifically discussed in the below explanations of the changes in the revenue of our reportable segments, we are experiencing competition in all of our markets. This competition has an adverse impact on our ability to increase or maintain our total number of customers and/or our ARPU.
Variances in the subscription revenue that we receive from our customers are a function of (i) changes in the number of our fixed-line customers or mobile subscribers outstanding during the period and (ii) changes in ARPU. Changes in ARPU can be attributable to (a) changes in prices, (b) changes in bundling or promotional discounts, (c) changes in the tier of services selected, (d) variances in subscriber usage patterns and (e) the overall mix of cable and mobile products during the period.
Revenue — 2020 compared to 2019
Year ended December 31, Increase
Organic increase
(decrease) 2020 2019 € % % in millions, except percentages
Switzerland.................................................................... € 1,365.2 € 1,124.4 € 240.8 21.4 (5.5) Central and Eastern Europe........................................... 426.5 424.7 1.8 0.4 3.5 Intersegment eliminations............................................. — (0.1) 0.1 N.M. N.M.
Total......................................................................... € 1,791.7 € 1,549.0 € 242.7 15.7 (2.6) _______________
N.M. — Not Meaningful.
Switzerland. The details of the increase in Switzerland’s revenue during 2020, as compared to 2019, are set forth below:
Subscription revenue
Non-subscription
revenue Totalin millions
Decrease in residential cable subscription revenue due to change in:Average number of customers................................................................................. € (54.5) € — € (54.5) ARPU...................................................................................................................... (14.0) — (14.0)
Decrease in residential cable non-subscription revenue (a)........................................ — (9.4) (9.4) Total decrease in residential cable revenue.......................................................... (68.5) (9.4) (77.9)
Increase in residential mobile revenue (b).................................................................. 13.8 2.4 16.2 Increase (decrease) in B2B revenue............................................................................ (0.9) 0.4 (0.5) Increase in other revenue............................................................................................ — 0.2 0.2
Total organic decrease.......................................................................................... (55.6) (6.4) (62.0) Impact of acquisitions................................................................................................. 149.7 103.6 253.3 Impact of FX............................................................................................................... 37.3 12.2 49.5
Total................................................................................................................... € 131.4 € 109.4 € 240.8 _______________
(a) The decrease in residential cable non-subscription revenue is primarily attributable to (i) a decrease in revenue associated with our Swiss sports channels, (ii) lower revenue from construction services provided to our partner networks and (iii) lower revenue from late fees.
(b) The increase in residential mobile subscription revenue is primarily due to an increase in the average number of mobile subscribers.
II-62

Central and Eastern Europe. The details of the increase in Central and Eastern Europe’s revenue during 2020, as compared to 2019, are set forth below:
Subscription revenue
Non-subscription
revenue Totalin millions
Increase in residential cable subscription revenue due to change in:Average number of customers................................................................................ € 5.4 € — € 5.4 ARPU...................................................................................................................... 3.9 — 3.9
Decrease in residential cable non-subscription revenue............................................. — (0.2) (0.2) Total increase (decrease) in residential cable revenue......................................... 9.3 (0.2) 9.1
Increase in residential mobile revenue....................................................................... 1.2 0.4 1.6 Increase in B2B revenue............................................................................................. 2.5 0.9 3.4 Increase in other revenue............................................................................................ — 0.7 0.7
Total organic increase.......................................................................................... 13.0 1.8 14.8 Impact of FX............................................................................................................... (11.8) (1.2) (13.0)
Total................................................................................................................... € 1.2 € 0.6 € 1.8
Revenue — 2019 compared to 2018
Year ended December 31, Increase
Organic increase
(decrease) 2019 2018 € % % in millions, except percentages
Switzerland.................................................................... € 1,124.4 € 1,122.3 € 2.1 0.2 (3.6) Central and Eastern Europe........................................... 424.7 416.5 8.2 2.0 2.7 Intersegment eliminations............................................. (0.1) (0.4) 0.3 N.M. N.M.
Total......................................................................... € 1,549.0 € 1,538.4 € 10.6 0.7 (1.8) _______________
N.M. — Not Meaningful.
II-63

Switzerland. The details of the increase in Switzerland’s revenue during 2019, as compared to 2018, are set forth below:
Subscription revenue
Non-subscription
revenue Totalin millions
Decrease in residential cable subscription revenue due to change in:Average number of customers................................................................................. € (74.2) € — € (74.2) ARPU...................................................................................................................... 3.5 — 3.5
Decrease in residential cable non-subscription revenue............................................. — (0.2) (0.2) Total decrease in residential cable revenue.......................................................... (70.7) (0.2) (70.9)
Increase in residential mobile revenue (a).................................................................. 12.6 11.9 24.5 Increase in B2B revenue (b)....................................................................................... 1.1 6.6 7.7 Decrease in other revenue........................................................................................... — (1.4) (1.4)
Total organic increase (decrease)......................................................................... (57.0) 16.9 (40.1) Impact of acquisitions................................................................................................. 0.9 — 0.9 Impact of FX............................................................................................................... 32.2 9.1 41.3
Total...................................................................................................................... € (23.9) € 26.0 € 2.1 _______________
(a) The increase in residential mobile subscription revenue is primarily due to an increase in the average number of mobile subscribers. The increase in residential mobile non-subscription revenue is primarily attributable to an increase in revenue from mobile handset sales.
(b) The increase in B2B non-subscription revenue is primarily due to higher revenue from wholesale fixed-line telephony services.
Central and Eastern Europe. The details of the increase in Central and Eastern Europe’s revenue during 2019, as compared to 2018, are set forth below:
Subscription revenue
Non-subscription
revenue Totalin millions
Increase in residential cable subscription revenue due to change in:Average number of customers................................................................................ € 5.6 € — € 5.6 ARPU...................................................................................................................... 0.7 — 0.7
Decrease in residential cable non-subscription revenue............................................. — (1.1) (1.1) Total increase (decrease) in residential cable revenue......................................... 6.3 (1.1) 5.2
Increase in residential mobile revenue....................................................................... — 0.1 0.1 Increase in B2B revenue............................................................................................. 2.5 3.0 5.5 Increase in other revenue............................................................................................ — 0.6 0.6
Total organic increase.......................................................................................... 8.8 2.6 11.4 Impact of FX............................................................................................................... (3.3) 0.1 (3.2)
Total..................................................................................................................... € 5.5 € 2.7 € 8.2
II-64

Programming and Other Direct Costs of Services of our Reportable Segments
Programming and other direct costs of services include programming and copyright costs, interconnect and access costs, costs of mobile handsets and other devices and other direct costs related to our operations. Programming and copyright costs represent a significant portion of our operating costs and are subject to rise in future periods due to various factors, including (i) higher costs associated with the expansion of our digital video content, including rights associated with ancillary product offerings and rights that provide for the broadcast of live sporting events and (ii) rate increases.
Programming and other direct costs of services — 2020 compared to 2019
Year ended December 31, IncreaseOrganic increase
2020 2019 € % % in millions, except percentages
Switzerland............................................................................... € 360.0 € 237.7 € 122.3 51.5 1.1 Central and Eastern Europe...................................................... 109.3 103.7 5.6 5.4 8.8
Total..................................................................................... € 469.3 € 341.4 € 127.9 37.5 2.6
Our programming and other direct costs of services increased €127.9 million or 37.5% during 2020, as compared to 2019. This increase includes an increase of €107.3 million attributable to the impact of the Sunrise Acquisition. On an organic basis, our programming and other direct costs of services increased €11.6 million or 2.6%. This increase includes the following factors:
• An increase in interconnect and access costs of €12.8 million or 14.0%, primarily attributable to (i) an increase in MVNO costs in Switzerland and (ii) higher interconnect and mobile roaming costs, primarily in Poland and Switzerland. Across all of our markets, interconnect and mobile roaming costs have been impacted by changes in usage per mobile subscriber associated with factors such as lower travel and the use of WiFi alternatives during stay-at-home mandates or recommendations as a result of the COVID-19 pandemic; and
• A decrease in programming and copyright costs of €11.3 million or 6.1%, primarily due to the net effect of a decrease in Switzerland and an increase Poland attributable to certain premium and/or basic content.
Programming and other direct costs of services — 2019 compared to 2018
Year ended December 31, IncreaseOrganic increase
2019 2018 € % % in millions, except percentages
Switzerland................................................................................ € 237.7 € 213.9 € 23.8 11.1 7.1 Central and Eastern Europe....................................................... 103.7 94.1 9.6 10.2 11.2 Central and Corporate and intersegment eliminations............... — (0.4) 0.4 N.M. N.M.
Total...................................................................................... € 341.4 € 307.6 € 33.8 11.0 8.5 _______________
N.M. — Not Meaningful.
Our programming and other direct costs of services increased €33.8 million or 11.0% during 2019, as compared to 2018. On an organic basis, our programming and other direct costs of services increased €26.0 million or 8.5%. This increase includes the following factors:
• An increase in mobile handset and other device costs of €10.0 million or 99.5%, primarily due to higher sales volumes in Switzerland; and
• An increase in interconnect and access costs of €9.5 million or 12.1%, primarily due to increases in Switzerland related to (i) higher interconnect and roaming costs, (ii) higher lease and B2B data costs and (iii) higher MVNO costs.
II-65

Other Operating Expenses of our Reportable Segments
Other operating expenses include network operations, customer operations, customer care and other costs related to our operations.
Other operating expenses — 2020 compared to 2019
Year ended December 31, Increase (decrease)Organic decrease
2020 2019 € % % in millions, except percentages
Switzerland................................................................................. € 183.4 € 159.8 € 23.6 14.8 (3.4) Central and Eastern Europe........................................................ 60.0 63.4 (3.4) (5.4) (2.7) Central and Corporate and intersegment eliminations................ — 0.8 (0.8) N.M. N.M.
Total...................................................................................... € 243.4 € 224.0 € 19.4 8.7 (3.2) _______________
N.M. — Not Meaningful.
Our other operating expenses increased €19.4 million or 8.7% during 2020, as compared to 2019. This increase includes an increase of €22.5 million attributable to the impact of the Sunrise Acquisition. On an organic basis, our other operating expenses decreased €7.9 million or 3.2%.
Other operating expenses — 2019 compared to 2018
Year ended December 31, Increase (decrease)
Organic increase
(decrease) 2019 2018 € % % in millions, except percentages
Switzerland.................................................................................. € 159.8 € 157.5 € 2.3 1.5 (3.0) Central and Eastern Europe......................................................... 63.4 61.5 1.9 3.1 4.0 Central and Corporate and intersegment eliminations................ 0.8 1.2 (0.4) N.M. N.M.
Total....................................................................................... € 224.0 € 220.2 € 3.8 1.7 (1.3) _______________
N.M. — Not Meaningful.
Our other operating expenses increased €3.8 million or 1.7% during 2019, as compared to 2018. On an organic basis, our other operating expenses decreased €2.8 million or 1.3%.
II-66
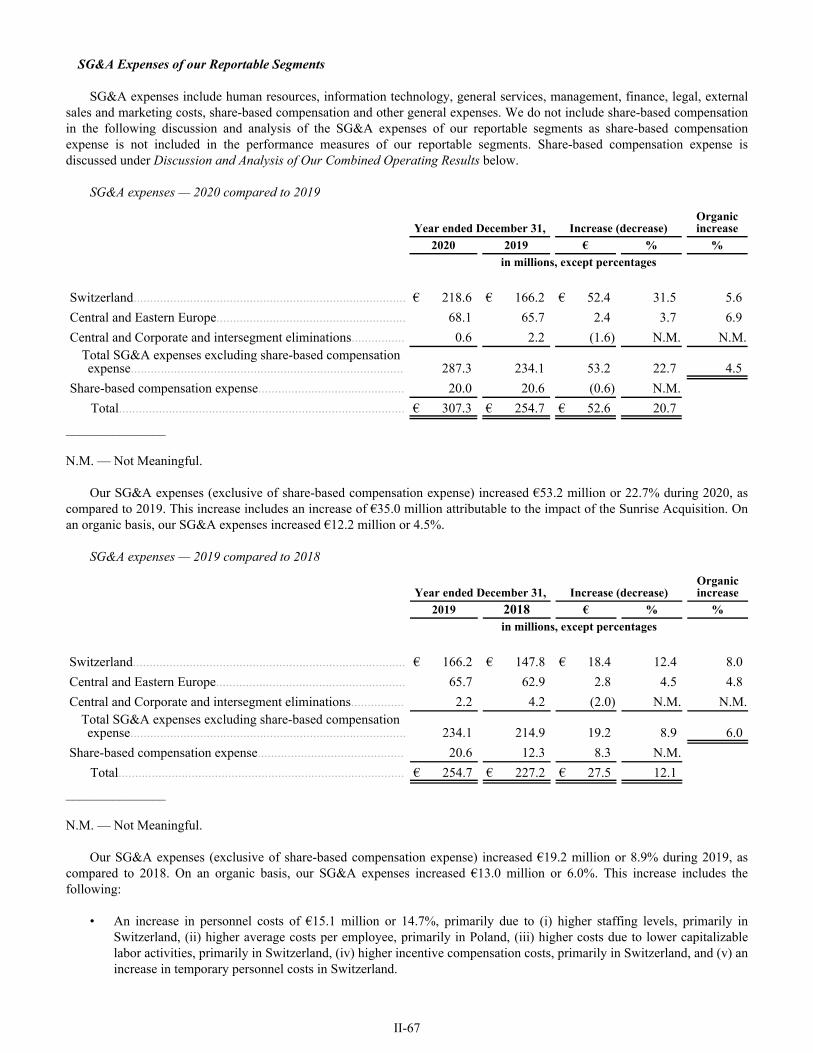
SG&A Expenses of our Reportable Segments
SG&A expenses include human resources, information technology, general services, management, finance, legal, external sales and marketing costs, share-based compensation and other general expenses. We do not include share-based compensation in the following discussion and analysis of the SG&A expenses of our reportable segments as share-based compensation expense is not included in the performance measures of our reportable segments. Share-based compensation expense is discussed under Discussion and Analysis of Our Combined Operating Results below.
SG&A expenses — 2020 compared to 2019
Year ended December 31, Increase (decrease)Organic increase
2020 2019 € % % in millions, except percentages
Switzerland.................................................................................. € 218.6 € 166.2 € 52.4 31.5 5.6 Central and Eastern Europe......................................................... 68.1 65.7 2.4 3.7 6.9 Central and Corporate and intersegment eliminations................ 0.6 2.2 (1.6) N.M. N.M.
Total SG&A expenses excluding share-based compensation expense.................................................................................. 287.3 234.1 53.2 22.7 4.5
Share-based compensation expense............................................ 20.0 20.6 (0.6) N.M.Total...................................................................................... € 307.3 € 254.7 € 52.6 20.7
_______________
N.M. — Not Meaningful.
Our SG&A expenses (exclusive of share-based compensation expense) increased €53.2 million or 22.7% during 2020, as compared to 2019. This increase includes an increase of €35.0 million attributable to the impact of the Sunrise Acquisition. On an organic basis, our SG&A expenses increased €12.2 million or 4.5%.
SG&A expenses — 2019 compared to 2018
Year ended December 31, Increase (decrease)Organic increase
2019 2018 € % % in millions, except percentages
Switzerland.................................................................................. € 166.2 € 147.8 € 18.4 12.4 8.0 Central and Eastern Europe......................................................... 65.7 62.9 2.8 4.5 4.8 Central and Corporate and intersegment eliminations................ 2.2 4.2 (2.0) N.M. N.M.
Total SG&A expenses excluding share-based compensation expense................................................................................... 234.1 214.9 19.2 8.9 6.0
Share-based compensation expense............................................ 20.6 12.3 8.3 N.M.Total...................................................................................... € 254.7 € 227.2 € 27.5 12.1
_______________
N.M. — Not Meaningful.
Our SG&A expenses (exclusive of share-based compensation expense) increased €19.2 million or 8.9% during 2019, as compared to 2018. On an organic basis, our SG&A expenses increased €13.0 million or 6.0%. This increase includes the following:
• An increase in personnel costs of €15.1 million or 14.7%, primarily due to (i) higher staffing levels, primarily in Switzerland, (ii) higher average costs per employee, primarily in Poland, (iii) higher costs due to lower capitalizable labor activities, primarily in Switzerland, (iv) higher incentive compensation costs, primarily in Switzerland, and (v) an increase in temporary personnel costs in Switzerland.
II-67

Segment Adjusted EBITDA of our Reportable Segments
Segment Adjusted EBITDA is the primary measure used by our chief operating decision maker to evaluate segment operating performance. As presented below, combined Segment Adjusted EBITDA is a non-GAAP measure, which readers should view as a supplement to, and not a substitute for, GAAP measures of performance included in our combined statements of operations. The following tables set forth the Segment Adjusted EBITDA of our reportable segments.
Segment Adjusted EBITDA — 2020 compared to 2019
Year ended December 31, Increase (decrease)
Organic increase
(decrease) 2020 2019 € % % in millions, except percentages
Switzerland......................................................................... € 603.2 € 560.7 € 42.5 7.6 (12.2) Central and Eastern Europe................................................ 189.1 191.9 (2.8) (1.5) 1.5 Central and Corporate and intersegment eliminations....... (0.6) (3.1) 2.5 N.M. N.M.
Total.............................................................................. € 791.7 € 749.5 € 42.2 5.6 (7.5) _______________
N.M. — Not Meaningful.
Segment Adjusted EBITDA — 2019 compared to 2018
Year ended December 31, Increase (decrease)Organic decrease
2019 2018 € % % in millions, except percentages
Switzerland........................................................................ € 560.7 € 603.1 € (42.4) (7.0) (10.4) Central and Eastern Europe............................................... 191.9 198.0 (6.1) (3.1) (2.3) Central and Corporate and intersegment eliminations...... (3.1) (5.4) 2.3 N.M. N.M.
Total............................................................................. € 749.5 € 795.7 € (46.2) (5.8) (8.1) _______________
N.M. — Not Meaningful.
Segment Adjusted EBITDA Margin — 2020, 2019 and 2018
The following table sets forth the Segment Adjusted EBITDA margins (Segment Adjusted EBITDA divided by revenue) of each of our reportable segments: Year ended December 31, 2020 2019 2018 %
Switzerland................................................................................................................. 44.1 49.9 53.7 Central and Eastern Europe........................................................................................ 44.3 45.2 47.5
Total, including other............................................................................................ 44.2 48.4 51.7
In addition to organic changes in the revenue, operating and SG&A expenses of our reportable segments, the Segment Adjusted EBITDA margins presented above include the impact of acquisitions. For discussion of the factors contributing to the changes in the Segment Adjusted EBITDA margins of our reportable segments, see the above analyses of the revenue and expenses of our reportable segments.
II-68
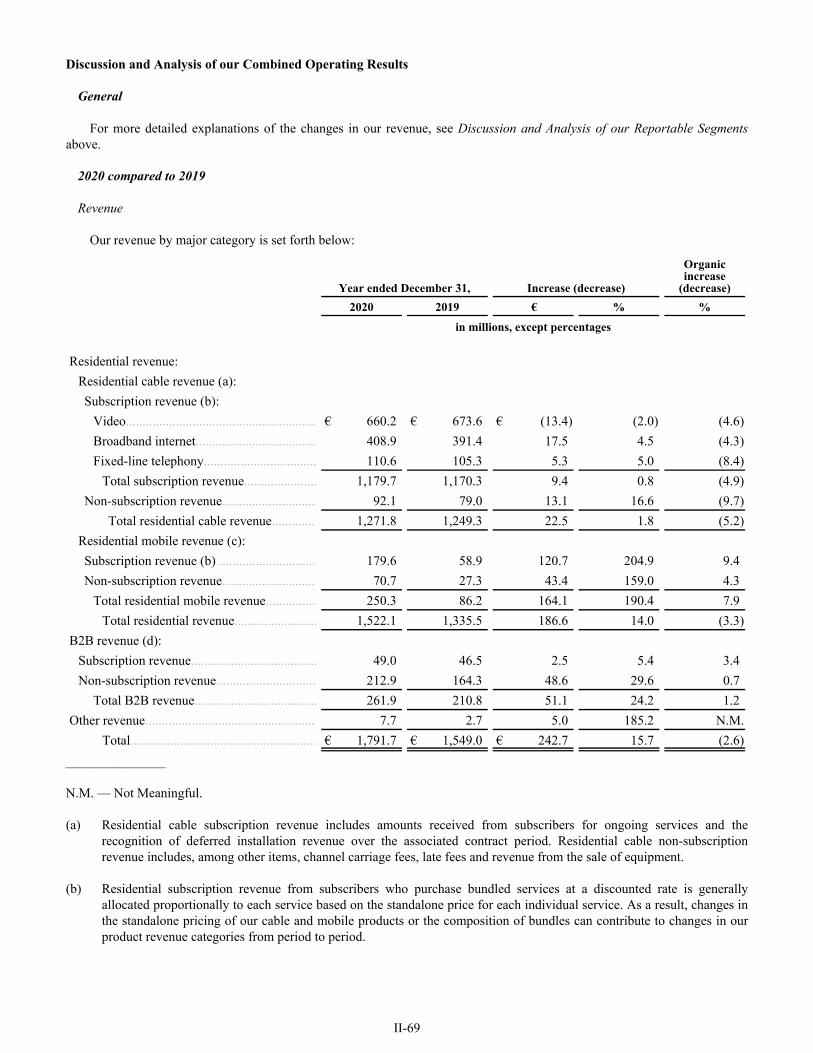
Discussion and Analysis of our Combined Operating Results
General
For more detailed explanations of the changes in our revenue, see Discussion and Analysis of our Reportable Segments above.
2020 compared to 2019
Revenue
Our revenue by major category is set forth below:
Year ended December 31, Increase (decrease)
Organic increase
(decrease) 2020 2019 € % % in millions, except percentages
Residential revenue:Residential cable revenue (a):Subscription revenue (b):
Video......................................................... € 660.2 € 673.6 € (13.4) (2.0) (4.6) Broadband internet.................................... 408.9 391.4 17.5 4.5 (4.3) Fixed-line telephony.................................. 110.6 105.3 5.3 5.0 (8.4)
Total subscription revenue...................... 1,179.7 1,170.3 9.4 0.8 (4.9) Non-subscription revenue............................ 92.1 79.0 13.1 16.6 (9.7)
Total residential cable revenue............. 1,271.8 1,249.3 22.5 1.8 (5.2) Residential mobile revenue (c):Subscription revenue (b) ............................. 179.6 58.9 120.7 204.9 9.4 Non-subscription revenue............................ 70.7 27.3 43.4 159.0 4.3
Total residential mobile revenue............... 250.3 86.2 164.1 190.4 7.9 Total residential revenue......................... 1,522.1 1,335.5 186.6 14.0 (3.3)
B2B revenue (d):Subscription revenue...................................... 49.0 46.5 2.5 5.4 3.4 Non-subscription revenue.............................. 212.9 164.3 48.6 29.6 0.7
Total B2B revenue..................................... 261.9 210.8 51.1 24.2 1.2 Other revenue................................................... 7.7 2.7 5.0 185.2 N.M.
Total........................................................ € 1,791.7 € 1,549.0 € 242.7 15.7 (2.6) _______________
N.M. — Not Meaningful.
(a) Residential cable subscription revenue includes amounts received from subscribers for ongoing services and the recognition of deferred installation revenue over the associated contract period. Residential cable non-subscription revenue includes, among other items, channel carriage fees, late fees and revenue from the sale of equipment.
(b) Residential subscription revenue from subscribers who purchase bundled services at a discounted rate is generally allocated proportionally to each service based on the standalone price for each individual service. As a result, changes in the standalone pricing of our cable and mobile products or the composition of bundles can contribute to changes in our product revenue categories from period to period.
II-69

(c) Residential mobile subscription revenue includes amounts received from subscribers for ongoing services. Residential mobile non-subscription revenue includes, among other items, interconnect revenue and revenue from sales of mobile handsets and other devices. Residential mobile interconnect revenue was €9.0 million and €6.6 million during 2020 and 2019, respectively.
(d) B2B subscription revenue represents revenue from SOHO subscribers. SOHO subscribers pay a premium price to receive expanded service levels along with video, broadband internet, fixed-line telephony or mobile services that are the same or similar to the mass marketed products offered to our residential subscribers. A portion of the increase in our B2B subscription revenue is attributable to the conversion of certain residential subscribers to SOHO subscribers. B2B non-subscription revenue includes revenue from business broadband internet, video, fixed-line telephony, mobile and data services offered to medium to large enterprises and, on a wholesale basis, to other operators.
Total revenue. Our combined revenue increased €242.7 million or 15.7% during 2020, as compared to 2019. This increase includes an increase of €253.3 million attributable to the impact of the Sunrise Acquisition. On an organic basis, our combined revenue decreased €47.1 million or 2.6%.
Residential revenue. The details of the increase in our combined residential revenue during 2020, as compared to 2019, are as follows (in millions):
Decrease in residential cable subscription revenue due to change in:Average number of customers............................................................................................................................. € (21.8) ARPU................................................................................................................................................................... (37.4)
Decrease in residential cable non-subscription revenue......................................................................................... (9.6) Total decrease in residential cable revenue....................................................................................................... (68.8)
Increase in residential mobile subscription revenue............................................................................................... 15.0 Increase in residential mobile non-subscription revenue....................................................................................... 2.8
Total organic decrease in residential revenue................................................................................................... (51.0) Impact of acquisitions............................................................................................................................................ 206.7 Impact of FX.......................................................................................................................................................... 30.9
Total increase in residential revenue............................................................................................................... € 186.6
On an organic basis, our combined residential cable subscription revenue decreased €59.2 million or 4.9% during 2020, as compared to 2019, primarily attributable to a decrease in Switzerland, partially offset by an increase in Poland.
On an organic basis, our combined residential cable non-subscription revenue decreased €9.6 million or 9.7% during 2020, as compared to 2019, primarily due to a decrease in Switzerland.
On an organic basis, our combined residential mobile subscription revenue increased €15.0 million or 9.4% during 2020, as compared to 2019, primarily due to an increase in Switzerland.
On an organic basis, our combined residential mobile non-subscription revenue increased €2.8 million or 4.3% during 2020, as compared to 2019, primarily attributable to an increase in Switzerland.
B2B revenue. On an organic basis, our combined B2B subscription revenue increased €1.6 million or 3.4% during 2020, as compared to 2019, primarily due to an increase in Poland.
On an organic basis, our combined B2B non-subscription revenue increased €1.4 million or 0.7% during 2020, as compared to 2019, primarily attributable to an increase in Switzerland.
For additional information concerning the changes in our residential and B2B revenue, see Discussion and Analysis of our Reportable Segments — Revenue — 2020 compared to 2019 above. For information regarding the competitive environment in certain of our markets, see Overview above.
II-70

Programming and other direct costs of services
Our programming and other direct costs of services increased €127.9 million or 37.5% during 2020, as compared to 2019. On an organic basis, our programming and other direct costs of services increased €11.6 million or 2.6%. For additional information regarding the changes in our programming and other direct costs of services, see Discussion and Analysis of our Reportable Segments — Programming and Other Direct Costs of Services of our Reportable Segments — 2020 compared to 2019 above.
Other operating expenses
Our other operating expenses increased €19.4 million or 8.7% during 2020, as compared to 2019. On an organic basis, our other operating expenses decreased €7.9 million or 3.2%. For additional information regarding the changes in our other operating expenses, see Discussion and Analysis of our Reportable Segments — Other Operating Expenses of our Reportable Segments — 2020 compared to 2019 above.
SG&A expenses
Our SG&A expenses increased €52.6 million or 20.7% during 2020, as compared to 2019. Our SG&A expenses include share-based compensation expense, which decreased €0.6 million during 2020, as compared to 2019. For additional information, see the discussion in the following paragraph. Excluding share-based compensation expense, on an organic basis our SG&A expenses increased €12.2 million or 4.5%. For additional information regarding the changes in our SG&A expenses, see Discussion and Analysis of our Reportable Segments — SG&A Expenses of our Reportable Segments — 2020 compared to 2019 above.
Share-based compensation expense
The amounts allocated by Liberty Global to our company represent the share-based compensation associated with the Liberty Global share-based incentive awards held by certain employees of our combined entities. A summary of the aggregate share-based compensation expense that is included in our SG&A expenses is set forth below:
Year ended December 31, 2020 2019 in millions
Performance-based incentive awards................................................................................................. € 11.4 € 12.8 Other share-based incentive awards................................................................................................... 8.6 13,100,000 7.8
Total.............................................................................................................................................. € 20.0 € 20.6
Related-party fees and allocations, net
We recorded related-party fees and allocations, net, related to our estimated share of the applicable costs incurred by Liberty Global subsidiaries of €233.2 million during 2020, as compared to €160.2 million during 2019. These charges generally relate to management, finance, legal, technology and other corporate and administrative services provided to or by our combined entities. For additional information, see note 13 to our combined financial statements.
Depreciation and amortization expense
Our depreciation and amortization expense was €444.1 million and €343.3 million during 2020 and 2019, respectively. Excluding the effects of FX, depreciation and amortization expense increased €91.7 million or 26.7%, primarily due to the net effect of (i) an increase in Switzerland of €87.2 million as a result of the Sunrise Acquisition, (ii) an increase associated with property and equipment additions related to the installation of customer premises equipment, the expansion and upgrade of our networks and other capital initiatives, primarily in Switzerland and Poland, and (iii) a decrease associated with certain assets becoming fully depreciated, primarily in Switzerland and Poland.
II-71

Impairment, restructuring and other operating items, net
We recognized impairment, restructuring and other operating items, net, of €45.5 million during 2020, as compared to €12.2 million during 2019. These amounts are primarily related to employee severance and termination costs related to certain reorganization activities in Switzerland.
If, among other factors, (i) our enterprise value or Liberty Global’s equity value were to decline or (ii) the adverse impacts of economic, competitive, regulatory or other factors were to cause our results of operations or cash flows to be worse than anticipated, we could conclude in future periods that impairment charges are required in order to reduce the carrying values of our goodwill and, to a lesser extent, other long-lived assets. Any such impairment charges could be significant. For additional information, see Critical Accounting Policies, Judgments and Estimates — Impairment of Property and Equipment and Intangible Assets below.
Interest expense – third-party
Our third-party interest expense decreased €52.3 million during 2020, as compared to 2019. This decrease is primarily attributable to (i) a lower weighted average interest rate and (ii) a lower average outstanding third-party debt balance. For additional information regarding our outstanding indebtedness, see note 9 to our combined financial statements.
It is possible that the interest rates on (i) any new borrowings could be higher than the current interest rates on our existing indebtedness and (ii) our variable-rate indebtedness could increase in future periods. As further discussed in note 6 to our combined financial statements, we use derivative instruments to manage our interest rate risks.
In July 2017, the U.K. Financial Conduct Authority (the authority that regulates LIBOR) announced that it intends to stop compelling banks to submit rates for the calculation of LIBOR after 2021. Additionally, the European Money Markets Institute (the authority that administers EURIBOR) has announced that measures will need to be undertaken by the end of 2021 to reform EURIBOR to ensure compliance with E.U. Benchmarks Regulation. In November 2020, ICE Benchmark administration (the entity that administers LIBOR) announced its intention to continue publishing USD LIBOR rates until June 30, 2023, with the exception of the one-week and two-month rates which, along with all GBP LIBOR rates, it intends to cease publishing after December 31, 2021. While this extension allows additional runway on existing contracts using USD LIBOR rates, companies are still encouraged to transition away from using USD LIBOR as soon as practicable and should not enter into new contracts that use USD LIBOR after 2021. The methodology for EURIBOR has been reformed and EURIBOR has been granted regulatory approval to continue to be used. Currently, it is not possible to predict the exact transitional arrangements for calculating applicable reference rates that may be made in the U.K., the U.S., the Eurozone or elsewhere given that a number of outcomes are possible, including the cessation of the publication of one or more reference rates.
In October 2020, the International Swaps and Derivatives Association (the ISDA) launched a new supplement (the Fallback Supplement), which effective January 25, 2021, will amend the standard definitions for interest rate derivatives to incorporate fallbacks for derivatives linked to certain key interbank offered rates (IBORs). The ISDA also launched a new protocol (the Fallback Protocol), also effective January 25, 2021, that will enable market participants to incorporate these revisions into their legacy non-cleared derivatives with other counterparties that choose to adhere to the protocol. The fallbacks for a particular currency will apply following a permanent cessation of the IBOR in that currency and will be adjusted versions of the risk-free rates identified in each currency. Our loan documents contain provisions that contemplate alternative calculations of the base rate applicable to our LIBOR-indexed and EURIBOR-indexed debt to the extent LIBOR or EURIBOR (as applicable) are not available, which alternative calculations we do not anticipate will be materially different from what would have been calculated under LIBOR or EURIBOR (as applicable). Additionally, no mandatory prepayment or redemption provisions would be triggered under our loan documents in the event that either the LIBOR rate or the EURIBOR rate is not available. It is possible, however, that any new reference rate that applies to our LIBOR-indexed or EURIBOR-indexed debt could be different than any new reference rate that applies to our LIBOR-indexed or EURIBOR-indexed derivative instruments. We anticipate managing this difference and any resulting increased variable-rate exposure through modifications to our debt and/or derivative instruments, however future market conditions may not allow immediate implementation of desired modifications and the company may incur significant associated costs.
II-72

Interest expense – related-party
Our related-party interest expense primarily relates to interest expense on the Shareholder Loan. Our related-party interest expense decreased €47.3 million during 2020, as compared to 2019. This decrease is primarily due to a higher average outstanding balance on the Shareholder Loan during 2019. For additional information regarding the Shareholder Loan, see note 13 to our combined financial statements.
Realized and unrealized gains (losses) on derivative instruments, net
Our realized and unrealized gains or losses on derivative instruments include (i) unrealized changes in the fair values of our derivative instruments that are non-cash in nature until such time as the derivative contracts are fully or partially settled and (ii) realized gains or losses upon the full or partial settlement of the derivative contracts. The details of our realized and unrealized gains (losses) on derivative instruments, net, are as follows:
Year ended December 31, 2020 2019 in millions
Cross-currency and interest rate derivative contracts (a)................................................................... € (235.9) € 30.1 Foreign currency forward and option contracts................................................................................. (28.2) (2.8) Other.................................................................................................................................................. (0.5) 1.2
Total.............................................................................................................................................. € (264.6) € 28.5 _______________
(a) The loss during 2020 is primarily attributable to the net effect of (i) a net loss associated with changes in the relative value of certain currencies and (ii) a net gain associated with changes in certain market interest rates. In addition, the loss during 2020 includes a net gain of €65.0 million resulting from changes in our credit risk valuation adjustments. The gain during 2019 is primarily attributable the net effect of (a) a net gain associated with changes in certain market interest rates and (b) a net loss associated with changes in the relative value of certain currencies. In addition, the gain during 2019 includes a net loss of €21.7 million resulting from changes in our credit risk valuation adjustments.
For additional information regarding our derivative instruments, see notes 6 and 7 to our combined financial statements.
Foreign currency transaction gains (losses), net
Our foreign currency transaction gains or losses primarily result from the remeasurement of monetary assets and liabilities that are denominated in currencies other than the underlying functional currency of the applicable entity. Unrealized foreign currency transaction gains or losses are computed based on period-end exchange rates and are non-cash in nature until such time as the amounts are settled. The details of our foreign currency transaction gains (losses), net, are as follows:
Year ended December 31, 2020 2019 in millions
U.S. dollar denominated debt issued by euro functional currency entities........................................ € 97.7 € (47.7) Intercompany payables and receivables denominated in a currency other than the entity’s
functional currency (a)................................................................................................................... 36.6 (29.0) Cash and restricted cash denominated in a currency other than the entity’s functional currency..... 0.8 5.0 Other.................................................................................................................................................. (0.6) (2.3)
Total.............................................................................................................................................. € 134.5 € (74.0) _______________
(a) Amounts primarily relate to (i) loans between certain of our non-operating and operating entities, which generally are denominated in the currency of the applicable operating entity, and (ii) loans between certain of our non-operating entities.
II-73

Losses on debt extinguishment, net
We recognized net losses on debt extinguishment of €40.5 million and €13.8 million during 2020 and 2019, respectively. The loss during 2020 is primarily attributable to (i) the payment of €39.1 million of redemption premiums and (ii) the write-off of €8.7 million of net unamortized deferred financing costs, discounts and premiums. The loss during 2019 is attributable to the write-off of unamortized deferred financing costs and discounts. For additional information concerning our losses on debt extinguishment, net, see note 9 to our combined financial statements.
Income tax benefit (expense)
We recognized income tax benefit (expense) of €12.9 million and (€45.5 million) during 2020 and 2019, respectively.
The income tax benefit during 2020 differs from the expected income tax benefit of €68.1 million (based on the Dutch 25.0% income tax rate) primarily due to the net negative impact of an increase in valuation allowances, partially offset by the positive impact of certain permanent differences between the financial and tax accounting treatment of interest and other items.
The income tax expense during 2019 differs from the expected income tax benefit of €24.1 million (based on the Dutch 25.0% income tax rate) primarily due to the net negative impact of (i) an increase in valuation allowances and (ii) certain permanent differences between the financial and tax accounting treatment of interest and other items.
For additional information concerning our income taxes, see note 11 to our combined financial statements.
Loss from continuing operations
During 2020 and 2019, we reported losses from continuing operations of €259.5 million and €142.0 million, respectively, consisting of (i) operating income of €48.9 million and €213.2 million, respectively, (ii) net non-operating expense of €321.3 million and €309.7 million, respectively, and (iii) income tax benefit (expense) of €12.9 million and (€45.5 million), respectively.
Gains or losses associated with (i) changes in the fair values of derivative instruments and (ii) movements in foreign currency exchange rates are subject to a high degree of volatility and, as such, any gains from these sources do not represent a reliable source of income. In the absence of significant gains in the future from these sources or from other non-operating items, our ability to achieve earnings from operations is largely dependent on our ability to increase our aggregate operating income to a level that more than offsets the aggregate amount of our (a) interest expense, (b) other non-operating expenses and (c) income tax expense.
Subject to the limitations included in our various debt instruments, we expect that Liberty Global will cause our company to maintain our debt at current levels relative to our Covenant EBITDA. As a result, we expect that we will continue to report significant levels of interest expense for the foreseeable future. For information concerning our expectations with respect to trends that may affect certain aspects of our operating results in future periods, see the discussion under Overview above. For information concerning the reasons for changes in specific line items in our combined statements of operations, see the discussion under Discussion and Analysis of our Reportable Segments and Discussion and Analysis of our Combined Operating Results above.
II-74

2019 compared to 2018
Revenue
Our revenue by major category is set forth below:
Year ended December 31, Increase (decrease)
Organic increase
(decrease) 2019 2018 € % % in millions, except percentages
Residential revenue:Residential cable revenue (a):Subscription revenue (b):
Video.......................................................... € 673.6 € 702.7 € (29.1) (4.1) (6.2) Broadband internet..................................... 391.4 391.3 0.1 — (2.5) Fixed-line telephony................................... 105.3 113.5 (8.2) (7.2) (10.0)
Total subscription revenue....................... 1,170.3 1,207.5 (37.2) (3.1) (5.3) Non-subscription revenue............................. 79.0 77.5 1.5 1.9 (1.5)
Total residential cable revenue.............. 1,249.3 1,285.0 (35.7) (2.8) (5.1) Residential mobile revenue (c):Subscription revenue (b) .............................. 58.9 44.1 14.8 33.6 28.6 Non-subscription revenue............................. 27.3 14.1 13.2 93.6 85.8
Total residential mobile revenue................ 86.2 58.2 28.0 48.1 42.4 Total residential revenue......................... 1,335.5 1,343.2 (7.7) (0.6) (3.0)
B2B revenue (d):Subscription revenue....................................... 46.5 42.5 4.0 9.4 8.5 Non-subscription revenue............................... 164.3 149.1 15.2 10.2 6.6
Total B2B revenue..................................... 210.8 191.6 19.2 10.0 7.0 Other revenue.................................................... 2.7 3.6 (0.9) (25.0) N.M.
Total......................................................... € 1,549.0 € 1,538.4 € 10.6 0.7 (1.8) _______________
N.M. — Not Meaningful.
(a) Residential cable subscription revenue includes amounts received from subscribers for ongoing services and the recognition of deferred installation revenue over the associated contract period. Residential cable non-subscription revenue includes, among other items, channel carriage fees, late fees and revenue from the sale of equipment.
(b) Residential subscription revenue from subscribers who purchase bundled services at a discounted rate is generally allocated proportionally to each service based on the standalone price for each individual service. As a result, changes in the standalone pricing of our cable and mobile products or the composition of bundles can contribute to changes in our product revenue categories from period to period.
(c) Residential mobile subscription revenue includes amounts received from subscribers for ongoing services. Residential mobile non-subscription revenue includes, among other items, interconnect revenue and revenue from sales of mobile handsets and other devices. Residential mobile interconnect revenue was €6.6 million and €4.8 million during 2019 and 2018, respectively.
II-75
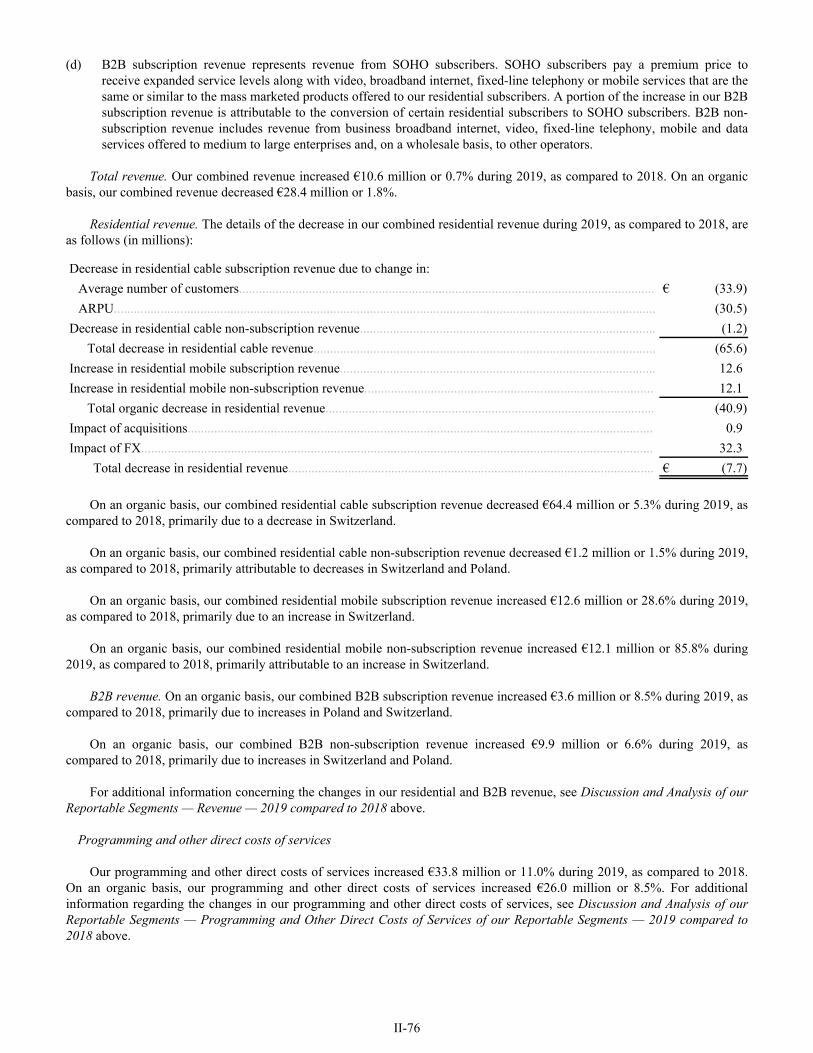
(d) B2B subscription revenue represents revenue from SOHO subscribers. SOHO subscribers pay a premium price to receive expanded service levels along with video, broadband internet, fixed-line telephony or mobile services that are the same or similar to the mass marketed products offered to our residential subscribers. A portion of the increase in our B2B subscription revenue is attributable to the conversion of certain residential subscribers to SOHO subscribers. B2B non-subscription revenue includes revenue from business broadband internet, video, fixed-line telephony, mobile and data services offered to medium to large enterprises and, on a wholesale basis, to other operators.
Total revenue. Our combined revenue increased €10.6 million or 0.7% during 2019, as compared to 2018. On an organic basis, our combined revenue decreased €28.4 million or 1.8%.
Residential revenue. The details of the decrease in our combined residential revenue during 2019, as compared to 2018, are as follows (in millions):
Decrease in residential cable subscription revenue due to change in:Average number of customers............................................................................................................................. € (33.9) ARPU................................................................................................................................................................... (30.5)
Decrease in residential cable non-subscription revenue......................................................................................... (1.2) Total decrease in residential cable revenue....................................................................................................... (65.6)
Increase in residential mobile subscription revenue............................................................................................... 12.6 Increase in residential mobile non-subscription revenue....................................................................................... 12.1
Total organic decrease in residential revenue................................................................................................... (40.9) Impact of acquisitions............................................................................................................................................ 0.9 Impact of FX.......................................................................................................................................................... 32.3
Total decrease in residential revenue.............................................................................................................. € (7.7)
On an organic basis, our combined residential cable subscription revenue decreased €64.4 million or 5.3% during 2019, as compared to 2018, primarily due to a decrease in Switzerland.
On an organic basis, our combined residential cable non-subscription revenue decreased €1.2 million or 1.5% during 2019, as compared to 2018, primarily attributable to decreases in Switzerland and Poland.
On an organic basis, our combined residential mobile subscription revenue increased €12.6 million or 28.6% during 2019, as compared to 2018, primarily due to an increase in Switzerland.
On an organic basis, our combined residential mobile non-subscription revenue increased €12.1 million or 85.8% during 2019, as compared to 2018, primarily attributable to an increase in Switzerland.
B2B revenue. On an organic basis, our combined B2B subscription revenue increased €3.6 million or 8.5% during 2019, as compared to 2018, primarily due to increases in Poland and Switzerland.
On an organic basis, our combined B2B non-subscription revenue increased €9.9 million or 6.6% during 2019, as compared to 2018, primarily due to increases in Switzerland and Poland.
For additional information concerning the changes in our residential and B2B revenue, see Discussion and Analysis of our Reportable Segments — Revenue — 2019 compared to 2018 above.
Programming and other direct costs of services
Our programming and other direct costs of services increased €33.8 million or 11.0% during 2019, as compared to 2018. On an organic basis, our programming and other direct costs of services increased €26.0 million or 8.5%. For additional information regarding the changes in our programming and other direct costs of services, see Discussion and Analysis of our Reportable Segments — Programming and Other Direct Costs of Services of our Reportable Segments — 2019 compared to 2018 above.
II-76

Other operating expenses
Our other operating expenses increased €3.8 million or 1.7% during 2019, as compared to 2018. On an organic basis, our other operating expenses decreased €2.80 million or 1.3%. For additional information regarding the changes in our other operating expenses, see Discussion and Analysis of our Reportable Segments — Other Operating Expenses of our Reportable Segments — 2019 compared to 2018 above.
SG&A expenses
Our SG&A expenses increased €27.5 million or 12.1% during 2019, as compared to 2018. Our SG&A expenses include share-based compensation expense, which increased €8.3 million during 2019, as compared to 2018. For additional information, see the discussion in the following paragraph. Excluding share-based compensation expense, on an organic basis our SG&A expenses increased €13.0 million or 6.0%. For additional information regarding the changes in our SG&A expenses, see Discussion and Analysis of our Reportable Segments — SG&A Expenses of our Reportable Segments — 2019 compared to 2018 above.
Share-based compensation expense
The amounts allocated by Liberty Global to our company represent the share-based compensation associated with the Liberty Global share-based incentive awards held by certain employees of our combined entities. A summary of the aggregate share-based compensation expense that is included in our SG&A expenses is set forth below:
Year ended December 31, 2019 2018 in millions
Performance-based incentive awards................................................................................................. € 12.8 € 3.3 Other share-based incentive awards................................................................................................... 7.8 13.1 9.0
Total.............................................................................................................................................. € 20.6 € 12.3
Related-party fees and allocations, net
We recorded related-party fees and allocations, net, related to our estimated share of the applicable costs incurred by Liberty Global subsidiaries of €160.2 million during 2019, as compared to €54.1 million during 2018. These charges generally relate to management, finance, legal, technology and other corporate and administrative services provided to or by our combined entities. For additional information, see note 13 to our combined financial statements.
Depreciation and amortization expense
Our depreciation and amortization expense was €343.3 million and €345.0 million during 2019 and 2018, respectively. Excluding the effects of FX, depreciation and amortization expense decreased €9.2 million or 2.7%, primarily due to the net effect of (i) an increase associated with property and equipment additions related to the installation of customer premises equipment, the expansion and upgrade of our networks and other capital initiatives, primarily in Poland and Switzerland, (ii) a decrease associated with certain assets becoming fully depreciated, primarily in Poland, and (iii) a decrease associated with certain intangibles becoming fully amortized in Poland.
Impairment, restructuring and other operating items, net
We recognized impairment, restructuring and other operating items, net, of €12.2 million during 2019, as compared to €5.1 million during 2018. The 2019 amount is primarily related to employee severance and termination costs related to certain reorganization activities in Switzerland. The 2018 amount is primarily related to (i) employee severance and termination costs related to certain reorganization activities in Poland, Switzerland and Slovakia and (ii) office closures in Switzerland.
II-77

Interest expense – third-party
Our third-party interest expense decreased €36.2 million during 2019, as compared to 2018. This decrease is primarily attributable to the net effect of (i) a lower average outstanding third-party debt balance and (ii) a higher weighted average interest rate. For additional information regarding our outstanding indebtedness, see note 9 to our combined financial statements.
Interest expense – related-party
Our related-party interest expense primarily relates to interest expense on the Shareholder Loan. Our related-party interest expense decreased €344.4 million during 2019, as compared to 2018. This decrease is primarily due to the non-cash settlement of the Shareholder Loan during the second quarter of 2018. For additional information regarding the Shareholder Loan, see note 13 to our combined financial statements.
Realized and unrealized gains (losses) on derivative instruments, net
The details of our realized and unrealized gains on derivative instruments, net, for the indicated periods are as follows:
Year ended December 31, 2019 2018 in millions
Cross-currency and interest rate derivative contracts (a)................................................................... € 30.1 € 153.1 Foreign currency forward and option contracts................................................................................. (2.8) 2.0 Other.................................................................................................................................................. 1.2 (0.1)
Total.............................................................................................................................................. € 28.5 € 155.0 _______________
(a) The gain during 2019 is primarily attributable to the net effect of (i) a net gain associated with changes in certain market interest rates and (ii) a net loss associated with changes in the relative value of certain currencies. In addition, the gain during 2019 includes a net loss of €21.7 million resulting from changes in our credit risk valuation adjustments. The gain during 2018 is primarily attributable the net effect of (a) a net gain associated with changes in the relative value of certain currencies and (b) a net loss associated with changes in certain market interest rates. In addition, the gain during 2018 includes a net loss of €11.5 million resulting from changes in our credit risk valuation adjustments.
For additional information regarding our derivative instruments, see notes 6 and 7 to our combined financial statements.
Foreign currency transaction gains (losses), net
The details of our foreign currency transaction losses, net, for the indicated periods are as follows:
Year ended December 31, 2019 2018 in millions
U.S. dollar denominated debt issued by euro functional currency entities........................................ € (47.7) € (69.7) Intercompany payables and receivables denominated in a currency other than the entity’s
functional currency (a)................................................................................................................... (29.0) (33.8) Cash and restricted cash denominated in a currency other than the entity’s functional currency..... 5.0 (4.3) Other.................................................................................................................................................. (2.3) —
Total.............................................................................................................................................. € (74.0) € (107.8) _______________
(a) Amounts primarily relate to (i) loans between certain of our non-operating and operating entities, which generally are denominated in the currency of the applicable operating entity, and (ii) loans between certain of our non-operating entities.
II-78

Losses on debt extinguishment, net
We recognized net losses on debt extinguishment of €13.8 million and €5.3 million during 2019 and 2018, respectively. The loss during 2019 is attributable to the write-off of unamortized deferred financing costs and discounts. The loss during 2018 is primarily attributable to (i) the write-off of €5.9 million of unamortized deferred financing costs and discounts and (ii) the payment of €1.8 million of redemption premiums. For additional information concerning our losses on debt extinguishment, net, see note 9 to our combined financial statements.
Income tax benefit (expense)
We recognized income tax expense of €45.5 million and €24.1 million during 2019 and 2018, respectively.
The income tax expense during 2019 and 2018 differs from the expected income tax benefit of €24.1 million and €29.2 million, respectively, (based on the Dutch 25.0% income tax rate) primarily due to the net negative impact of (i) an increase in valuation allowances and (ii) certain permanent differences between the financial and tax accounting treatment of interest and other items.
For additional information concerning our income taxes, see note 11 to our combined financial statements.
Loss from continuing operations
During 2019 and 2018, we reported losses from continuing operations of €142.0 million and €140.8 million, respectively, consisting of (i) operating income of €213.2 million and €379.2 million, respectively, (ii) net non-operating expense of €309.7 million and €495.9 million, respectively, and (iii) income tax expense of €45.5 million and €24.1 million, respectively.
Earnings from discontinued operations
We reported earnings from discontinued operations, net of taxes, of €79.6 million and €166.5 million during 2019 and 2018, respectively, related to the operations of the Vodafone Disposal Group, UPC DTH and, for 2018, UPC Austria. For additional information, see note 5 to our combined financial statements.
Net earnings attributable to noncontrolling interests
Net earnings attributable to noncontrolling interests includes the noncontrolling interest’ share of the results of our continuing and discontinued operations. Net earnings attributable to noncontrolling interests decreased €3.6 million during 2019, as compared to 2018. This decrease is primarily attributable to the UPC Austria Distribution, which occurred during 2018. For additional information, see note 5 to our combined financial statements.
II-79

Liquidity and Capital Resources
Sources and Uses of Cash
The UPC Holding Group’s primary assets are its investments in its combined entities, and the majority of our operating entities are owned by UPC Broadband Holding B.V. (UPC Broadband Holding). Although our combined operating entities generate cash from operating activities, the terms of the instruments governing the indebtedness of UPC Broadband Holding may restrict our ability to access the liquidity of these entities. These entities accounted for substantially all of our €25.7 million of combined cash and cash equivalents at December 31, 2020. In addition, our ability to access the liquidity of these and other combined entities may be limited by tax and legal considerations, the presence of noncontrolling interests and other factors.
Corporate Liquidity of the UPC Holding Group
As the UPC Holding Group typically does not hold significant amounts of cash and cash equivalents at the corporate level, the UPC Holding Group’s primary source of corporate liquidity is proceeds received from UPC Broadband Holding (and indirectly from UPC Broadband Holding’s combined entities) in the form of loans or distributions. As noted above, various factors may limit the ability of the UPC Holding Group’s combined entities to loan or distribute cash. From time to time, the UPC Holding Group may also supplement its sources of corporate liquidity with net proceeds received in connection with the issuance of debt instruments and/or loans or contributions from LGE Financing (and ultimately Liberty Global and other Liberty Global subsidiaries). No assurance can be given that any external funding would be available on favorable terms, or at all.
The UPC Holding Group’s corporate liquidity requirements include (i) corporate general and administrative expenses and (ii) interest payments on the UPC Holding Senior Notes. From time to time, UPC Holding may also require cash in connection with (a) the repayment of third-party and related-party debt (including the repurchase or exchange of outstanding debt securities in the open market or privately-negotiated transactions and net repayments to LGE Financing pursuant to the Shareholder Loan, as described in note 13 to our combined financial statements), (b) the funding of loans or distributions to LGE Financing (and ultimately Liberty Global and other Liberty Global subsidiaries), (c) the satisfaction of contingent liabilities, (d) acquisitions, (e) other investment opportunities or (f) income tax payments.
For information regarding the liquidity impacts of the Sunrise Acquisition, see note 5 to our combined financial statements.
Liquidity of Combined Operating Entities
In addition to cash and cash equivalents, the primary source of liquidity of our combined operating entities is cash provided by operations and, in the case of UPC Broadband Holding, borrowing availability under the UPC Holding Bank Facility. For the details of the borrowing availability under the UPC Holding Bank Facility at December 31, 2020, see note 9 to our combined financial statements. Our combined operating entities’ liquidity is generally used to fund (i) property and equipment additions, (ii) debt service requirements and (iii) payments required by the UPC Holding Group’s derivative instruments, as well as to settle certain obligations that are not included on our December 31, 2020 combined balance sheet. In this regard, we have significant commitments related to (a) programming studio output and sports rights contracts, (b) certain operating costs associated with our networks and (c) purchase obligations associated with customer premises equipment and certain service-related commitments. These obligations are expected to represent a significant liquidity requirement of our combined operating entities, the majority of which is due over the next 12 to 24 months. For additional information regarding our commitments, see note 16 to our combined financial statements.
From time to time, our combined operating entities may also require liquidity in connection with (i) acquisitions and other investment opportunities, (ii) loans to UPC Holding or other Liberty Global subsidiaries, (iii) capital distributions to UPC Holding or (iv) the satisfaction of contingent liabilities. No assurance can be given that any external funding would be available to our combined operating entities on favorable terms, or at all.
For additional information regarding our combined cash flows, see the discussion under Combined Statements of Cash Flows below.
II-80

Capitalization
At December 31, 2020, the outstanding principal amount of our combined third-party debt, together with our finance lease obligations, aggregated €6,403.1 million, including €315.6 million that is classified as current on our combined balance sheet and €6,076.8 million that is not due until 2026 or thereafter. For additional information regarding our current debt maturities, see note 9 to our combined financial statements.
Our ability to service or refinance our debt and to maintain compliance with the leverage covenants in the credit agreements and indentures of the UPC Holding Group is dependent primarily on our ability to maintain or increase the Covenant EBITDA of our operating entities and to achieve adequate returns on our property and equipment additions and acquisitions. In addition, our ability to obtain additional debt financing is limited by the incurrence-based leverage covenants contained in the UPC Holding Group’s debt instruments. For example, if our Covenant EBITDA were to decline, our ability to obtain additional debt could be limited.
At December 31, 2020, the UPC Holding Group was in compliance with its respective debt covenants. In addition, we do not anticipate any instances of non-compliance with respect to any of our debt covenants that would have a material adverse impact on our liquidity during the next 12 months.
Notwithstanding our negative working capital position at December 31, 2020, we believe we have sufficient resources to repay or refinance the current portion of our debt and finance lease obligations and to fund our foreseeable liquidity requirements during the next 12 months. However, as our maturing debt grows in later years, we anticipate we will seek to refinance or otherwise extend our debt maturities. No assurance can be given that we will be able to complete these refinancing transactions or otherwise extend our debt maturities. In this regard, it is not possible to predict how political and economic conditions (including with respect to the COVID-19 pandemic), sovereign debt concerns or any adverse regulatory developments could impact the credit markets we access and, accordingly, our future liquidity and financial position. Our ability to access debt financing on favorable terms, or at all, could be adversely impacted by (i) the financial failure of any of our counterparties, which could (a) reduce amounts available under committed credit facilities and (b) adversely impact our ability to access cash deposited with any failed financial institution and (ii) tightening of the credit markets. In addition, sustained or increased competition, particularly in combination with adverse economic or regulatory developments, could have an unfavorable impact on our cash flows and liquidity.
With the exception of the UPC Holding Senior Notes, all of our combined third-party debt and finance lease obligations had been borrowed or incurred by our combined entities at December 31, 2020.
For information regarding the potential impact of the COVID-19 pandemic on our company’s liquidity, see the discussion included above in Overview. For additional information regarding our debt and finance lease obligations, see notes 9 and 10, respectively, to our combined financial statements.
II-81

Combined Statements of Cash Flows
General. Our cash flows are subject to significant variations due to FX.
Combined Statements of Cash Flows — 2020 compared to 2019
Summary. Our combined statements of cash flows of our continuing operations for 2020 and 2019 are summarized as follows:
Year ended December 31, 2020 2019 Change in millions
Net cash provided by operating activities...................................................................... € 491.0 € 596.0 € (105.0) Net cash used by investing activities............................................................................. (4,735.5) (342.5) (4,393.0) Net cash provided (used) by financing activities........................................................... 4,247.1 (238.1) 4,485.2 Effect of exchange rate changes on cash and cash equivalents and restricted cash....... 1.0 5.7 (4.7)
Net increase in cash and cash equivalents and restricted cash.................................. € 3.6 € 21.1 € (17.5)
Operating Activities. The decrease in net cash provided by our operating activities is primarily attributable to the net effect of (i) a decrease in cash provided by our Segment Adjusted EBITDA and related working capital items, (ii) an increase in cash provided due to lower payments for third-party interest, (iii) a decrease in cash provided due to higher payments for taxes and (iv) an increase in cash provided due to higher cash receipts related to derivative instruments. Combined Segment Adjusted EBITDA is a non-GAAP measure which readers should view as a supplement to, and not a substitute for, GAAP measures of performance included in our combined statements of operations.
Investing Activities. The increase in net cash used by our investing activities is primarily attributable to the net effect of (i) an increase in cash used of €4,470.8 million related to the Sunrise Acquisition, (ii) an increase in cash used of €200.5 million associated with the the settlement of a related-party receivable, (iii) a decrease in cash used of €164.5 million due to lower advances to related parties and (iv) a decrease in cash used of €86.2 million due to lower capital expenditures.
The capital expenditures we report in our combined statements of cash flows do not include (i) amounts that are financed under capital-related vendor financing or finance lease arrangements or (ii) purchased assets transferred to our company by another entity under the common control of Liberty Global in exchange for non-cash increases to the Shareholder Loan or non-cash decreases to the LGEF Receivable or non-cash contributions from our parent entities (non-cash related-party capital additions). Instead, these amounts are reflected as non-cash additions to our property and equipment when the underlying assets are delivered, and in the case of capital-related vendor financing and finance lease arrangements and non-cash related-party capital additions that are settled through increases to the Shareholder Loan, as repayments of debt when the principal is repaid. In this discussion, we refer to (a) our capital expenditures as reported in our combined statements of cash flows, which exclude non-cash related-party capital additions and amounts financed under capital-related vendor financing or finance lease arrangements, and (b) our total property and equipment additions, which include our capital expenditures on an accrual basis, non-cash related-party capital additions and amounts financed under capital-related vendor financing or finance lease arrangements. For additional information, see notes 8, 9 and 10 to our combined financial statements. For further details on property and equipment additions, see note 17 to our combined financial statements.
II-82

A reconciliation of our combined property and equipment additions to our combined capital expenditures as reported in our combined statements of cash flows is set forth below:
Year ended December 31, 2020 2019
in millions
Property and equipment additions (a)................................................................................................ € 354.6 € 344.1 Assets acquired under capital-related vendor financing arrangements.............................................. (309.4) (405.4) Assets acquired under finance leases................................................................................................. (2.1) (3.3) Changes in current liabilities related to capital expenditures (including related-party amounts)...... 163.0 356.9
Total capital expenditures, net....................................................................................................... € 206.1 € 292.3
_______________
(a) The increase in our property and equipment additions during 2020, as compared to 2019, is primarily due to the net effect of (i) an increase due to FX and (ii) a decrease in local currency expenditures of our combined entities, primarily due to decreases in (a) expenditures for the purchase and installation of customer premises equipment, (b) expenditures for new build and upgrade projects and (c) expenditures to support new customer products and operational efficiency initiatives. During 2020 and 2019, our segment property and equipment additions represented 19.8% and 22.2% of our revenue, respectively.
Financing Activities. The change in net cash provided (used) by our financing activities is primarily attributable to the net effect of (i) an increase in cash of €3,092.5 million due to a capital contribution related to the Sunrise Acquisition, (ii) an increase in cash of €2,895.2 million due to higher net borrowings of third-party debt and finance lease obligations and (iii) a decrease in cash of €1,358.6 million due to net higher repayments of related-party debt.
Combined Statements of Cash Flows — 2019 compared to 2018
Summary. Our combined statements of cash flows of our continuing operations for 2019 and 2018 are summarized as follows:
Year ended December 31, 2019 2018 Change in millions
Net cash provided by operating activities...................................................................... € 596.0 € 442.1 € 153.9 Net cash provided (used) by investing activities............................................................ (342.5) 360.6 (703.1) Net cash used by financing activities............................................................................. (238.1) (882.3) 644.2 Effect of exchange rate changes on cash and cash equivalents and restricted cash....... 5.7 (4.3) 10.0
Net increase (decrease) in cash and cash equivalents and restricted cash................. € 21.1 € (83.9) € 105.0
Operating Activities. The increase in net cash provided by our operating activities is primarily attributable to the net effect of (i) an increase in cash provided due to lower cash payments for third-party interest, (ii) a decrease in cash provided due to lower receipts of related-party interest income, (iii) an increase in cash provided by our Segment Adjusted EBITDA and related working capital changes and (iv) a decrease in cash provided due to lower cash receipts related to derivative instruments.
Investing Activities. The change in net cash provided (used) by our investing activities is primarily attributable to the net effect of (i) a decrease in cash of €805.0 million associated with higher advances to related parties, (ii) an increase in cash of €200.5 million due to the settlement of a related-party receivable and (iii) a decrease in cash of €54.1 million associated with higher capital expenditures.
II-83

A reconciliation of our combined property and equipment additions to our combined capital expenditures as reported in our combined statements of cash flows is set forth below:
Year ended December 31, 2019 2018
in millions
Property and equipment additions (a)................................................................................................ € 344.1 € 342.4 Assets acquired under capital-related vendor financing arrangements.............................................. (405.4) (364.3) Assets acquired under finance leases................................................................................................. (3.3) (1.9) Changes in current liabilities related to capital expenditures (including related-party amounts)...... 356.9 262.0
Total capital expenditures, net....................................................................................................... € 292.3 € 238.2
_______________
(a) The increase in our property and equipment additions during 2019, as compared to 2018, is primarily due to the net effect of (i) an increase due to FX and (ii) a decrease in local currency expenditures of our combined entities, primarily due to the net effect of (a) an increase in expenditures related to products and enablers, (b) a decrease in expenditures for new build and upgrade projects, (c) a decrease in baseline expenditures, including network improvements and expenditures for property and facilities and information technology systems, and (d) an increase in expenditures for the purchase and installation of customer premises equipment. During 2019 and 2018, our segment property and equipment additions represented 22.2% and 22.3% of our revenue, respectively.
Financing Activities. The decrease in net cash used by our financing activities is primarily attributable to the net effect of (i) a decrease in cash used of €1,216.2 million due to higher net borrowings of related-party debt, (ii) an increase in cash used of €591.4 million due to higher net repayments of third-party debt and finance lease obligations, (iii) an increase in cash used of €200.5 million associated with advances to related parties and (iv) a decrease in cash used of €137.8 million due to higher receipts related to derivative instruments.
Projected Cash Flows Associated with Derivative Instruments
The following table provides information regarding the projected cash flows associated with our derivative instruments at December 31, 2020. The euro equivalents presented below are based on interest rate projections and exchange rates as of December 31, 2020. These amounts are presented for illustrative purposes only and will likely differ from the actual cash payments or receipts required in future periods. For additional information regarding our derivative instruments, including our counterparty credit risk, see note 6 to our combined financial statements.
Payments (receipts) due during:
Total 2021 2022 2023 2024 2025 Thereafter
in millions
Projected derivative cash payments (receipts), net:
Interest-related (a)............................... € 14.4 € 29.3 € 14.4 € (2.4) € (18.7) € (93.7) € (56.7) Principal-related (b)............................. (10.0) — 56.9 (35.1) 21.5 78.2 111.5 Other.................................................... — — 0.2 — — — 0.2
Total................................................. € 4.4 € 29.3 € 71.5 € (37.5) € 2.8 € (15.5) € 55.0 _______________
(a) Includes (i) the cash flows of our interest rate cap, floor and swap contracts and (ii) the interest-related cash flows of our cross-currency and interest rate swap contracts.
(b) Includes the principal-related cash flows of our cross-currency swap contracts.
II-84

Foreign Currency Risk
We are exposed to foreign currency exchange rate risk with respect to our combined debt in situations where our debt is denominated in U.S. dollars. Although we generally match the denomination of our borrowings with our functional currency, market conditions or other factors may cause us to enter into borrowing arrangements that are not denominated in our functional currency (unmatched debt). In these cases, our policy is to provide for an economic hedge against foreign currency exchange rate movements by using derivative instruments to synthetically convert unmatched debt into the applicable underlying currency. At December 31, 2020, substantially all of our debt was either directly or synthetically matched to our functional currency. For additional information concerning the terms of our derivative instruments, see note 6 to our combined financial statements.
In addition to the exposure that results from the mismatch of our borrowings and our functional currency, we are exposed to foreign currency risk to the extent that we enter into transactions denominated in currencies other than our functional currency (non-functional currency risk), such as equipment purchases, programming contracts, notes payable and notes receivable (including intercompany amounts). Changes in exchange rates with respect to amounts recorded on our combined balance sheets related to these items will result in unrealized (based upon period-end exchange rates) or realized foreign currency transaction gains and losses upon settlement of the transactions. Moreover, to the extent that our revenue, costs and expenses are denominated in currencies other than our functional currency, we will experience fluctuations in our revenue, costs and expenses solely as a result of changes in foreign currency exchange rates. Generally, we will consider hedging non-functional currency risks when the risks arise from agreements with third parties that involve the future payment or receipt of cash or other monetary items to the extent that we can reasonably predict the timing and amount of such payments or receipts and the payments or receipts are not otherwise hedged. In this regard, we have entered into foreign currency forward and option contracts to hedge certain of these risks. For additional information concerning our foreign currency forward and option contracts, see note 6 to our combined financial statements.
The relationships between the primary currencies of the countries in which we operate and the euro, which is our reporting currency, are shown below, per one euro:
As of December 31,
2020 2019Spot rates:
Swiss franc......................................................................................................................................... 1.0821 1.0852 Polish zloty......................................................................................................................................... 4.5678 4.2565
Year ended December 31,
2020 2019 2018Average rates:
Swiss franc.................................................................................................................... 1.0703 1.1126 1.1549 Polish zloty.................................................................................................................... 4.4431 4.2971 4.2603
II-85
Critical Accounting Policies, Judgments and Estimates
In connection with the preparation of our combined financial statements, we make estimates and assumptions that affect the reported amounts of assets and liabilities, revenue and expenses and related disclosure of contingent assets and liabilities. Critical accounting policies are defined as those policies that are reflective of significant judgments, estimates and uncertainties, which would potentially result in materially different results under different assumptions and conditions. We believe the following accounting policies are critical in the preparation of our combined financial statements because of the judgment necessary to account for these matters and the significant estimates involved, which are susceptible to change:
• Impairment of property and equipment and intangible assets (including goodwill);
• Costs associated with construction and installation activities;
• Fair value measurements; and
• Income tax accounting.
For additional information concerning our significant accounting policies, see note 3 to our combined financial statements.
Impairment of Property and Equipment and Intangible Assets
Carrying Value. The aggregate carrying value of our property and equipment and intangible assets (including goodwill) that was held for use comprised 82% of our total assets at December 31, 2020.
When circumstances warrant, we review the carrying amounts of our property and equipment and our intangible assets (other than goodwill) to determine whether such carrying amounts continue to be recoverable. Such changes in circumstance may include (i) an expectation of a sale or disposal of a long-lived asset or asset group, (ii) adverse changes in market or competitive conditions, (iii) an adverse change in legal factors or business climate in the markets in which we operate and (iv) operating or cash flow losses. For purposes of impairment testing, long-lived assets are grouped at the lowest level for which cash flows are largely independent of other assets and liabilities, generally at or below the reporting unit level (see below). If the carrying amount of the asset or asset group is greater than the expected undiscounted cash flows to be generated by such asset or asset group, an impairment adjustment is recognized. Such adjustment is measured by the amount that the carrying value of such asset or asset group exceeds its fair value. We generally measure fair value by considering (a) sale prices for similar assets, (b) discounted estimated future cash flows using an appropriate discount rate and/or (c) estimated replacement cost. Assets to be disposed of are recorded at the lower of their carrying amount or fair value less costs to sell.
We evaluate goodwill for impairment at least annually on October 1 and whenever facts and circumstances indicate that the carrying amount of goodwill may not be recoverable. For impairment evaluations, we first make a qualitative assessment to determine if the goodwill may be impaired. If it is more-likely-than-not that a reporting unit’s fair value is less than its carrying value, we then compare the fair value of the reporting unit to its respective carrying amount. Any excess of the carrying amount over the fair value would be charged to operations as an impairment loss. A reporting unit is an operating segment or one level below an operating segment (referred to as a “component”). If the carrying value of a reporting unit were to exceed its fair value, we would then compare the implied fair value of the reporting unit’s goodwill to its carrying amount, and any excess of the carrying amount over the fair value would be charged to operations as an impairment loss.
When required, considerable management judgment is necessary to estimate the fair value of reporting units and underlying long-lived assets. We typically determine fair value using an income-based approach (discounted cash flows) based on assumptions in our long-range business plans and, in some cases, a combination of an income-based approach and a market-based approach. With respect to our discounted cash flow analysis used in the income-based approach, the timing and amount of future cash flows under these business plans require estimates of, among other items, subscriber growth and retention rates, rates charged per product, expected gross margins and Segment Adjusted EBITDA margins and expected property and equipment additions. The development of these cash flows, and the discount rate applied to the cash flows, is subject to inherent uncertainties, and actual results could vary significantly from such estimates. Our determination of the discount rate is based on a weighted average cost of capital approach, which uses a market participant’s cost of equity and after-tax cost of debt and reflects the risks inherent in the cash flows. Based on the results of our 2020 qualitative assessment of our reporting unit carrying values, we determined that it was more-likely-than-not that fair value exceeded carrying value for all of our reporting units.
II-86

During the three years ended December 31, 2020, we did not record any significant impairment charges with respect to our property and equipment and intangible assets. For additional information regarding our long-lived assets, see note 8 to our combined financial statements.
If, among other factors, (i) our enterprise value or Liberty Global’s equity values were to decline or (ii) the adverse impacts of economic, competitive, regulatory or other factors were to cause our results of operations or cash flows to be worse than anticipated, we could conclude in future periods that impairment charges are required in order to reduce the carrying values of our goodwill and, to a lesser extent, other long-lived assets. Any such impairment charges could be significant.
Costs Associated with Construction and Installation Activities
We capitalize costs associated with the construction of new cable and mobile transmission and distribution facilities and the installation of new cable services. Installation activities that are capitalized include (i) the initial connection (or drop) from our cable system to a customer location, (ii) the replacement of a drop and (iii) the installation of equipment for additional services, such as digital cable, telephone or broadband internet service. The costs of other customer-facing activities, such as reconnecting customer locations where a drop already exists, disconnecting customer locations and repairing or maintaining drops, are expensed as incurred.
The nature and amount of labor and other costs to be capitalized with respect to construction and installation activities involves significant judgment. In addition to direct external and internal labor and materials, we also capitalize other costs directly attributable to our construction and installation activities, including dispatch costs, quality-control costs, vehicle-related costs and certain warehouse-related costs. The capitalization of these costs is based on time sheets, time studies, standard costs, call tracking systems and other verifiable means that directly link the costs incurred with the applicable capitalizable activity. We continuously monitor the appropriateness of our capitalization policies and update the policies when necessary to respond to changes in facts and circumstances, such as the development of new products and services and changes in the manner that installations or construction activities are performed.
Fair Value Measurements
GAAP provides guidance with respect to the recurring and nonrecurring fair value measurements and for a fair value hierarchy that prioritizes the inputs to valuation techniques used to measure fair value into three broad levels. Level 1 inputs are quoted market prices in active markets for identical assets or liabilities that the reporting entity has the ability to access at the measurement date. Level 2 inputs are inputs other than quoted market prices included within Level 1 that are observable for the asset or liability, either directly or indirectly. Level 3 inputs are unobservable inputs for the asset or liability.
Recurring Valuations. We perform recurring fair value measurements with respect to our derivative instruments. We use cash flow valuation models to determine the fair values of our interest rate and foreign currency derivative instruments. For a detailed discussion of the inputs we use to determine the fair value of our derivative instruments, see note 7 to our combined financial statements. See also note 6 to our combined financial statements for information concerning our derivative instruments.
Changes in the fair values of our derivative instruments have had, and we believe will continue to have, a significant and volatile impact on our results of operations. During 2020, 2019 and 2018, we recognized net gains (losses) of (€264.6 million), €28.5 million and €155.0 million, respectively, attributable to changes in the fair values of our derivative instruments.
As further described in note 7 to our combined financial statements, actual amounts received or paid upon the settlement or
disposition of our derivative instruments may differ materially from the recorded fair values at December 31, 2020.
Nonrecurring Valuations. Our nonrecurring valuations are primarily associated with (i) the application of acquisition accounting and (ii) impairment assessments, both of which require that we make fair value determinations as of the applicable valuation date. In making these determinations, we are required to make estimates and assumptions that affect the recorded amounts, including, but not limited to, expected future cash flows, market comparables and discount rates, remaining useful lives of long-lived assets, replacement or reproduction costs of property and equipment and the amounts to be recovered in future periods from acquired net operating losses and other deferred tax assets. To assist us in making these fair value determinations, we may engage third-party valuation specialists. Our estimates in this area impact, among other items, the amount of depreciation and amortization, impairment charges and income tax expense or benefit that we report. Our estimates of fair value are based upon assumptions we believe to be reasonable, but which are inherently uncertain. A significant portion
II-87

of our long-lived assets were initially recorded through the application of acquisition accounting and all of our long-lived assets are subject to impairment assessments. For additional information, see notes 5, 7 and 8 to our combined financial statements.
Income Tax Accounting
We are required to estimate the amount of tax payable or refundable for the current year and the deferred tax assets and liabilities for the future tax consequences attributable to differences between the financial statement carrying amounts and income tax basis of assets and liabilities and the expected benefits of utilizing net operating loss and tax credit carryforwards, using enacted tax rates in effect for each taxing jurisdiction in which we operate for the year in which those temporary differences are expected to be recovered or settled. This process requires our management to make assessments regarding the timing and probability of the ultimate tax impact of such items.
Net deferred tax assets are reduced by a valuation allowance if we believe that it is more-likely-than-not such net deferred tax assets will not be realized. Establishing or reducing a tax valuation allowance requires us to make assessments about the timing of future events, including the probability of expected future taxable income and available tax planning strategies. At December 31, 2020, the aggregate valuation allowance provided against deferred tax assets was €1,677.1 million. The actual amount of deferred income tax benefits realized in future periods will likely differ from the net deferred tax assets reflected in our December 31, 2020 combined balance sheet due to, among other factors, possible future changes in income tax law or interpretations thereof in the jurisdictions in which we operate and differences between estimated and actual future taxable income. Any such factors could have a material effect on our current and deferred tax positions as reported in our combined financial statements. A high degree of judgment is required to assess the impact of possible future outcomes on our current and deferred tax positions.
Tax laws in jurisdictions in which we have a presence are subject to varied interpretation, and many tax positions we take are subject to significant uncertainty regarding whether the position will be ultimately sustained after review by the relevant tax authority. We recognize the financial statement effects of a tax position when it is more-likely-than-not, based on technical merits, that the position will be sustained upon examination. The determination of whether the tax position meets the more-likely-than-not threshold requires a facts-based judgment using all information available. In a number of cases, we have concluded that the more-likely-than-not threshold is not met, and accordingly, the amount of tax benefit recognized in our combined financial statements is different than the amount taken or expected to be taken in our tax returns. As of December 31, 2020, the amount of unrecognized tax benefits for financial reporting purposes, but taken or expected to be taken in our tax returns, was €3.0 million, all of which would have a favorable impact on our effective income tax rate if ultimately recognized, after considering amounts that we would expect to be offset by valuation allowances.
We are required to continually assess our tax positions, and the results of tax examinations or changes in judgment can result in substantial changes to our unrecognized tax benefits.
For additional information concerning our income taxes, see note 11 to our combined financial statements. Management and Principal Shareholder
The managing director of the UPC Holding Group is Liberty Global Europe Management B.V., which is also an indirect subsidiary of Liberty Global. The managing director is authorized to conduct the day to day business of the relevant entities within the governance of Liberty Global and its subsidiaries.
II-88

SELECTED UNAUDITED PRO FORMAFINANCIAL INFORMATION

SELECTED UNAUDITED PRO FORMA FINANCIAL INFORMATION
The following selected unaudited pro forma financial information for the years ended December 31, 2020 and 2019 give effect to the Sunrise Acquisition as if it had occurred on January 1, 2019. These pro forma amounts are not necessarily indicative of the operating results that would have occurred if this transaction had occurred on such date. The pro forma adjustments made are based upon currently available information and certain assumptions that we believe are reasonable, but may differ from actual amounts. For additional information regarding the Sunrise Acquisition, see Notes to Combined Financial Statements — Acquisitions, Dispositions and Common Control Transfers included in Part II of our 2020 annual report.
Year ended December 31,2020 2019
pro formain millions
Revenue........................................................................................................................................... € 3,292.9 € 3,257.0 Operating costs and expenses (exclusive of depreciation and amortization):
Programming and other direct costs of services.......................................................................... 1,048.7 1,016.0 Other operating............................................................................................................................ 409.0 382.2 Selling, general and administrative.............................................................................................. 595.1 575.0 Related-party fees and allocations, net........................................................................................ 233.2 160.2 Depreciation and amortization..................................................................................................... 1,084.4 1,050.6 Impairment, restructuring and other operating items, net............................................................ 47.6 46.7
3,418.0 3,230.7 Operating income (loss)........................................................................................................... (125.1) 26.3
Non-operating income (expense):Interest expense:
Third-party................................................................................................................................. (255.3) (323.8) Related-party............................................................................................................................. — (47.3)
Interest income............................................................................................................................. 9.3 12.3 Realized and unrealized gains (losses) on derivative instruments, net........................................ (264.6) 28.5 Foreign currency transaction gains (losses), net.......................................................................... 134.5 (74.0) Losses on debt extinguishment, net............................................................................................. (40.5) (13.8) Other income, net......................................................................................................................... 10.5 7.5
(406.1) (410.6) Loss from continuing operations before income taxes.............................................................. (531.2) (384.3)
Income tax benefit........................................................................................................................... 53.2 5.7 Loss from continuing operations............................................................................................... (478.0) (378.6)
Discontinued operations:Earnings from discontinued operations, net of taxes................................................................... — 79.6 Gain on disposal of discontinued operation, net of taxes............................................................ — 1.9
— 81.5 Net loss.................................................................................................................................... (478.0) (297.1)
Net earnings attributable to noncontrolling interests....................................................................... (3.1) (3.7) Net loss attributable to parent entities.................................................................................. € (481.1) € (300.8)
III-1

Results of Operations
Included below is an analysis of selected unaudited pro forma financial information for the years ended December 31, 2020 and 2019. The aforementioned pro forma financial information gives effect to the Sunrise Acquisition as if it had occurred on January 1, 2019. In our historical combined statements of operations, the operating results of Sunrise are not included prior to November 11, 2020. For additional information regarding the Sunrise Acquisition, see Notes to Combined Financial Statements — Acquisitions, Dispositions and Common Control Transfers included in Part II of our 2020 annual report.
Discussion and Analysis of our Reportable Segments
General
The tables presented below provide the details of the selected unaudited pro forma financial information of our combined reportable segments for 2020, as compared to 2019. These tables present (i) the pro forma amounts for the current and comparative periods, (i) the euro and percentage change from period to period and (ii) the organic percentage change from period to period. The comparisons that exclude FX assume that exchange rates remained constant at the prior-year rate during the comparative periods that are included in each table. We also provide a table showing the Segment Adjusted EBITDA margins of our combined reportable segments for 2020 and 2019.
Combined Segment Adjusted EBITDA is a non-GAAP measure, which we believe is a meaningful measure because it represents a transparent view of our recurring operating performance that is unaffected by our capital structure and allows management to readily view operating trends from a combined view. Readers should view combined Segment Adjusted EBITDA as a supplement to, and not a substitute for, GAAP measures of performance. The following table provides a reconciliation of pro forma loss from continuing operations to Segment Adjusted EBITDA:
Year ended December 31, 2020 2019
pro forma in millions
Loss from continuing operations........................................................................................................ € (478.0) € (378.6) Income tax benefit............................................................................................................................ (53.2) (5.7) Other income, net.............................................................................................................................. (10.5) (7.5) Losses on debt extinguishment, net.................................................................................................. 40.5 13.8 Foreign currency transaction losses (gains), net............................................................................... (134.5) 74.0 Realized and unrealized losses (gains) on derivative instruments, net............................................. 264.6 (28.5) Interest income.................................................................................................................................. (9.3) (12.3) Interest expense:Third-party...................................................................................................................................... 255.3 323.8 Related-party................................................................................................................................... — 47.3 Operating income (loss)................................................................................................................ (125.1) 26.3
Impairment, restructuring and other operating items, net................................................................. 47.6 46.7 Depreciation and amortization.......................................................................................................... 1,084.4 1,050.6 Related-party fees and allocations, net............................................................................................. 233.2 160.2 Share-based compensation expense.................................................................................................. 29.5 22.0
Segment Adjusted EBITDA.......................................................................................................... € 1,269.6 € 1,305.8
III-2

Revenue of our Reportable Segments
Year ended December 31, Increase
Organic increase
(decrease) 2020 2019 € % %
pro forma in millions, except percentages
Switzerland............................................................................. € 2,866.4 € 2,832.4 € 34.0 1.2 (2.6) Central and Eastern Europe.................................................... 426.5 424.7 1.8 0.4 3.5 Intersegment eliminations...................................................... — (0.1) 0.1 N.M. N.M.
Total.................................................................................. € 3,292.9 € 3,257.0 € 35.9 1.1 (1.8) _______________
N.M. — Not Meaningful.
Our pro forma revenue increased €35.9 million or 1.1% during 2020, as compared to 2019. On an organic basis, our pro forma revenue decreased €59.4 million or 1.8%. This decrease is primarily attributable to the net effect of (i) lower residential cable subscription revenue, as a decrease in Switzerland was only partially offset by an increase in Poland, (ii) a decrease in residential mobile non-subscription revenue in Switzerland, (iii) an increase in residential mobile subscription revenue, primarily in Switzerland, and (iii) lower B2B non-subscription revenue in Switzerland.
Programming and Other Direct Costs of Services of our Reportable Segments
Programming and other direct costs of services include programming and copyright costs, interconnect and access costs, costs of mobile handsets and other devices and other direct costs related to our operations. Programming and copyright costs represent a significant portion of our operating costs and are subject to rise in future periods due to various factors, including (i) higher costs associated with the expansion of our digital video content, including rights associated with ancillary product offerings and rights that provide for the broadcast of live sporting events and (ii) rate increases.
Year ended December 31, Increase
Organic increase
(decrease) 2020 2019 € % %
pro forma in millions, except percentages
Switzerland............................................................................. € 939.4 € 912.3 € 27.1 3.0 (0.9) Central and Eastern Europe.................................................... 109.3 103.7 5.6 5.4 8.8
Total.................................................................................. € 1,048.7 € 1,016.0 € 32.7 3.2 0.1
Our pro forma programming and other direct costs of services increased €32.7 million or 3.2% during 2020, as compared to 2019. On an organic basis, our pro forma programming and other direct costs of services increased €0.7 million or 0.1%. This increase is primarily attributable to the net effect of (i) lower programming and copyright costs due to a decrease in Switzerland and an increase in Poland and (ii) an increase in interconnect and access costs, primarily in Switzerland.
III-3

Other Operating Expenses of our Reportable Segments
Other operating expenses include network operations, customer operations, customer care and other costs related to our operations.
Year ended December 31, Increase (decrease)
Organic increase
(decrease) 2020 2019 € % %
pro forma in millions, except percentages
Switzerland............................................................................. € 349.0 € 318.0 € 31.0 9.7 5.6 Central and Eastern Europe.................................................... 60.0 63.4 (3.4) (5.4) (2.7) Central and Corporate and intersegment eliminations........... — 0.8 (0.8) N.M. N.M.
Total.................................................................................. € 409.0 € 382.2 € 26.8 7.0 4.0 _______________
N.M. — Not Meaningful.
Our pro forma other operating expenses increased €26.8 million or 7.0% during 2020, as compared to 2019. On an organic basis, our pro forma other operating expenses increased €15.3 million or 4.0%. This increase is primarily attributable to our operations in Switzerland, including (i) higher business service costs and (ii) an increase in core network and information technology-related costs.
SG&A Expenses of our Reportable Segments
SG&A expenses include human resources, information technology, general services, management, finance, legal, external sales and marketing costs, share-based compensation and other general expenses. We do not include share-based compensation in the following discussion and analysis of the pro forma SG&A expenses of our reportable segments as share-based compensation expense is not included in the performance measures of our reportable segments.
Year ended December 31, Increase (decrease)
Organic increase
(decrease) 2020 2019 € % %
pro forma in millions, except percentages
Switzerland............................................................................. € 496.9 € 485.1 € 11.8 2.4 (1.4) Central and Eastern Europe.................................................... 68.1 65.7 2.4 3.7 6.9 Central and Corporate and intersegment eliminations........... 0.6 2.2 (1.6) N.M. N.M.
Total SG&A expenses excluding share-based compensation expense...................................................... 565.6 553.0 12.6 2.3 (0.7)
Share-based compensation expense....................................... 29.5 22.0 7.5 N.M.Total................................................................................. € 595.1 € 575.0 € 20.1 3.5
_______________
N.M. — Not Meaningful.
Our pro forma SG&A expenses (exclusive of share-based compensation expense) increased €12.6 million or 2.3% during 2020, as compared to 2019. On an organic basis, our pro forma SG&A expenses decreased €4.0 million or 0.7%. This decrease is primarily attributable to the net effect of (i) a decrease in external sales and marketing costs, primarily in Switzerland, and (ii) an increase in personnel costs.
III-4

Segment Adjusted EBITDA of our Reportable Segments
Segment Adjusted EBITDA is the primary measure used by our chief operating decision maker to evaluate segment operating performance. As presented below, combined Segment Adjusted EBITDA is a non-GAAP measure, which readers should view as a supplement to, and not a substitute for, GAAP measures of performance included in our combined statements of operations. The following tables set forth the pro forma Segment Adjusted EBITDA of our reportable segments.
Year ended December 31, Increase (decrease)
Organic increase
(decrease) 2020 2019 € % %
pro forma in millions, except percentages
Switzerland........................................................................ € 1,081.1 € 1,117.0 € (35.9) (3.2) (6.9) Central and Eastern Europe............................................... 189.1 191.9 (2.8) (1.5) 1.5 Central and Corporate and intersegment eliminations...... (0.6) (3.1) 2.5 N.M. N.M.
Total............................................................................. € 1,269.6 € 1,305.8 € (36.2) (2.8) (5.5) _______________
N.M. — Not Meaningful.
Segment Adjusted EBITDA Margin
The following table sets forth the pro forma Segment Adjusted EBITDA margins (Segment Adjusted EBITDA divided by revenue) of each of our reportable segments:
Year ended December 31, 2020 2019
pro forma %
Switzerland.......................................................................................................................................... 37.7 39.4 Central and Eastern Europe................................................................................................................. 44.3 45.2
Total, including other..................................................................................................................... 38.6 40.1
For discussion of the factors contributing to the changes in the Segment Adjusted EBITDA margins of our reportable segments, see the above analyses of the pro forma revenue and expenses of our reportable segments.
III-5

Discussion and Analysis of our Combined Operating Results
Share-based compensation expense
The amounts allocated by Liberty Global to our company represent the share-based compensation associated with the Liberty Global share-based incentive awards held by certain employees of our combined entities. In addition, amounts include expense related to certain performance-based and share-based incentive awards at Sunrise. A summary of the aggregate pro forma share-based compensation expense that is included in our pro forma SG&A expenses is set forth below:
Year ended December 31, 2020 2019
pro forma in millions
Performance-based incentive awards................................................................................................. € 20.1 € 14.2 Other share-based incentive awards................................................................................................... 9.4 7.8
Total.............................................................................................................................................. € 29.5 € 22.0
Related-party fees and allocations, net
On a pro forma basis, we recorded related-party fees and allocations, net, related to our estimated share of the applicable costs incurred by Liberty Global subsidiaries of €233.2 million during 2020, as compared to €160.2 million during 2019. These charges generally relate to management, finance, legal, technology and other corporate and administrative services provided to or by our combined entities.
Depreciation and amortization expense
On a pro forma basis, our depreciation and amortization expense increased €33.8 million during 2020, as compared to 2019. This increase is primarily attributable to the net effect of (i) an increase associated with property and equipment additions related to the installation of customer premises equipment, the expansion and upgrade of our networks and other capital initiatives, primarily in Switzerland and Poland, and (ii) a decrease associated with certain assets becoming fully depreciated, primarily in Switzerland and Poland.
Impairment, restructuring and other operating items, net
On a pro forma basis, we recognized impairment, restructuring and other operating items, net, of €47.6 million during 2020, as compared to €46.7 million during 2019. These amounts are primarily related to (i) employee severance and termination costs related to certain reorganization activities in Switzerland and (ii) for 2019, €45.0 million of direct acquisition costs associated with Sunrise's unsuccessful attempt to acquire our UPC Switzerland operations.
Interest expense – third-party
On a pro forma basis, our third-party interest expense decreased €68.5 million during 2020, as compared to 2019. This decrease is primarily attributable to (i) a lower weighted average interest rate and (ii) a lower average outstanding third-party debt balance.
Interest expense – related-party
Our related-party interest expense primarily relates to interest expense on the Shareholder Loan. On a pro forma basis, our related-party interest expense decreased €47.3 million during 2020, as compared to 2019. This decrease is primarily due to a higher average outstanding balance on the Shareholder Loan during 2019.
III-6

Realized and unrealized gains (losses) on derivative instruments, net
Our realized and unrealized gains or losses on derivative instruments include (i) unrealized changes in the fair values of our derivative instruments that are non-cash in nature until such time as the derivative contracts are fully or partially settled and (ii) realized gains or losses upon the full or partial settlement of the derivative contracts. The details of our pro forma realized and unrealized gains (losses) on derivative instruments, net, are as follows:
Year ended December 31, 2020 2019
pro forma in millions
Cross-currency and interest rate derivative contracts (a)................................................................... € (235.9) € 30.1 Foreign currency forward and option contracts................................................................................. (28.2) (2.8) Other.................................................................................................................................................. (0.5) 1.2
Total.............................................................................................................................................. € (264.6) € 28.5 _______________
(a) The loss during 2020 is primarily attributable to the net effect of (i) a net loss associated with changes in the relative value of certain currencies and (ii) a net gain associated with changes in certain market interest rates. In addition, the loss during 2020 includes a net gain of €65.0 million resulting from changes in our credit risk valuation adjustments. The gain during 2019 is primarily attributable the net effect of (a) a net gain associated with changes in certain market interest rates and (b) a net loss associated with changes in the relative value of certain currencies. In addition, the gain during 2019 includes a net loss of €21.7 million resulting from changes in our credit risk valuation adjustments.
Foreign currency transaction gains (losses), net
Our foreign currency transaction gains or losses primarily result from the remeasurement of monetary assets and liabilities that are denominated in currencies other than the underlying functional currency of the applicable entity. Unrealized foreign currency transaction gains or losses are computed based on period-end exchange rates and are non-cash in nature until such time as the amounts are settled. The details of our pro forma foreign currency transaction gains (losses), net, are as follows:
Year ended December 31, 2020 2019
pro forma in millions
U.S. dollar denominated debt issued by euro functional currency entities........................................ € 97.7 € (47.7) Intercompany payables and receivables denominated in a currency other than the entity’s
functional currency (a)................................................................................................................... 36.6 (29.0) Cash and restricted cash denominated in a currency other than the entity’s functional currency..... 0.8 5.0 Other.................................................................................................................................................. (0.6) (2.3)
Total.............................................................................................................................................. € 134.5 € (74.0) _______________
(a) Amounts primarily relate to (i) loans between certain of our non-operating and operating entities, which generally are denominated in the currency of the applicable operating entity, and (ii) loans between certain of our non-operating entities.
Losses on debt extinguishment, net
On a pro forma basis, we recognized net losses on debt extinguishment of €40.5 million and €13.8 million during 2020 and 2019, respectively. The loss during 2020 is primarily attributable to (i) the payment of €39.1 million of redemption premiums and (ii) the write-off of €8.7 million of net unamortized deferred financing costs, discounts and premiums. The loss during 2019 is attributable to the write-off of unamortized deferred financing costs and discounts.
III-7

Income tax benefit
On a pro forma basis, we recognized income tax benefit of €53.2 million and €5.7 million during 2020 and 2019, respectively.
The pro forma income tax benefit during 2020 differs from the expected income tax benefit of €132.8 million (based on the Dutch 25.0% income tax rate) primarily due to the net negative impact of (i) an increase in valuation allowances and (ii) statutory tax rates in certain jurisdictions in which we operate that are different than the Dutch statutory income tax rate.
The pro forma income tax benefit during 2019 differs from the expected income tax benefit of €96.1 million (based on the Dutch 25.0% income tax rate) primarily due to the net negative impact of (i) an increase in valuation allowances, (ii) statutory tax rates in certain jurisdictions in which we operate that are different than the Dutch statutory income tax rate and (iii) certain permanent differences between the financial and tax accounting treatment of interest and other items. The negative impact of these items was partially offset by the net positive impact of a reduction in deferred tax liabilities in Switzerland due to an enacted decrease in income tax rates.
Loss from continuing operations
On a pro forma basis, we reported losses from continuing operations of €478.0 million and €378.6 million during 2020 and 2019, respectively, consisting of (i) operating income (loss) of (€125.1 million) and €26.3 million, respectively, (ii) net non-operating expense of €406.1 million and €410.6 million, respectively, and (iii) income tax benefit of €53.2 million and €5.7 million, respectively.
Additional Selected Pro Forma Information
Property and Equipment Additions of our Reportable Segments
The details of the pro forma property and equipment additions of our reportable segments are as follows:
Year ended December 31, 2020 2019
pro forma in millions
Switzerland...................................................................................................................................... € 519.6 € 502.8 Central and Eastern Europe............................................................................................................. 91.6 95.8
Total property and equipment additions..................................................................................... € 611.2 € 598.6
Operating Free Cash Flow
The details of our pro forma operating free cash flow are as follows:
Year ended December 31, 2020 2019
pro forma in millions
Segment Adjusted EBITDA............................................................................................................ € 1,269.6 € 1,305.8 Property and equipment additions................................................................................................... (611.2) (598.6)
Operating free cash flow............................................................................................................. € 658.4 € 707.2
III-8


